
SECURITIES AND EXCHANGE COMMISSION · P I O N E E R C O R M A D I S O N S T R E E T S , M A ......
93
G L O B E T E L E C O M , I N C . 5 / F G L O B E T E L E C O M P L A Z A P I O N E E R C O R M A D I S O N S T R E E T S , M A N D A L U Y O N G C I T Y 1 2 3 1 1 7 Q 0 4 1 2 Dept. Requiring this Doc. Total No. Of Stockholders Remarks = pls. Use black ink for scanning purposes Document I.D. Cashie S T A M P S 730-2742 To be accomplished by SEC Personnel concerned LC File Amended Articles Number/Section Total Amount of Borrowings Domesti Foreig Fiscal Year Annual Meeting Secondary License Type, if Applicable Month Day Day Month FORM (Business Address: No. Street City / Town / Province) Contact Person Company Telephone Number COVER SHEET (Company's Full Name) ALBERTO M. DE LARRAZABAL P W 0 0 0 0 1 1 7 7
Transcript of SECURITIES AND EXCHANGE COMMISSION · P I O N E E R C O R M A D I S O N S T R E E T S , M A ......

G L
MA. CARIDAD D. GONZALES
O B E T E L E C O M , I N C .
5 / F G L O B E T E L E C O M P L A Z A
P I O N E E R C O R M A D I S O N S T R E E T S ,
M A N D A L U Y O N G C I T Y
1 2 3 1 1 7 Q 0 4 1 2
Dept. Requiring this Doc.
Total No. Of Stockholders
Remarks = pls. Use black ink for scanning purposes
Document I.D. Cashie
S T A M P S
730-2742
To be accomplished by SEC Personnel concerned
LCFile
Amended Articles Number/Section
Total Amount of Borrowings
Domesti Foreig
Fiscal Year Annual Meeting
Secondary License Type, if Applicable
Month Day DayMonth FORM
(Business Address: No. Street City / Town / Province)
Contact Person Company Telephone Number
COVER SHEET
(Company's Full Name)
ALBERTO M. DE LARRAZABAL
P W 0 0 0 0 1 1 7 7

SEC Number 1177 File Number ____
GLOBE TELECOM, INC. (Company’s Full Name)
5th Floor Globe Telecom Plaza (Pioneer Highlands) Pioneer corner Madison Streets, 1552 Mandaluyong City
(Company’s Address)
(632) 730-2000 (Telephone Numbers)
31 March 2011 (Quarter Ending)
SEC FORM 17-Q (Form Type)

SECURITIES AND EXCHANGE COMMISSION
SEC FORM 17-Q
QUARTERLY REPORT PURSUANT TO SECTION 17 OF THE SECURITIES REGULATION CODE AND SRC RULE 17(2)(b) THEREUNDER
1. For the three months ended 31 March 2011 2. Commission identification number: 1177 3. BIR Tax Identification No. 000-768-480-000 4. Exact name of registrant as specified in its charter: GLOBE TELECOM, INC. 5. Province, country or other jurisdiction of incorporation or organization: PHILIPPINES 6. Industry Classification Code: (SEC Use Only) 7. Address of registrant’s principal office: 5th Floor, Globe Telecom Plaza (Pioneer Highlands) Pioneer corner Madison Streets 1552 Mandaluyong City 8. Registrant’s telephone number, including area code: (632) 730-2000 9. Former name, former address and former fiscal year, if changed since last report: N / A 10. Securities registered pursuant to Sections in Securities Regulation Code Number of shares of stock Title of each class outstanding Common Stock, P50.00 par value 132,348,473 Preferred Stock, P5.00 par value 158,515,021 11. Are any or all of the Securities listed on the Philippine Stock Exchange? Yes 12. Indicate whether the registrant:
a) Has filed all reports required to be filed by Section 17 of the Code and SRC Rule 17 thereunder or Sections 11 of the SRC and SRC Rule 11(a)-1 thereunder, and Sections 26 and 141 of the Corporation Code of the Philippines, during the preceding 12 months (or for such shorter period the registrant was required to file such reports). Yes
b) Has been subject to such filing requirements for the past 90 days. Yes
SEC Form 17Q – 1Q 2011 2
SEC Form 17Q – 1Q 2011 3
GLOBE TELECOM, INC. AND SUBSIDIARIES
MANAGEMENT’S DISCUSSION AND ANALYSIS
OF
FINANCIAL CONDITION AND RESULTS OF OPERATIONS
FOR THE THREE MONTHS ENDED
31 MARCH 2011

SEC Form 17Q – 1Q 2011 4
PART I FINANCIAL INFORMATION ITEM 1. FINANCIAL STATEMENTS Our unaudited condensed consolidated financial statements include the accounts of Globe Telecom, Inc. and its wholly owned subsidiaries, Innove Communications, Inc.(Innove), G-Xchange, Inc. (GXI), Entertainment Gateway Group (EGG Group) and GTI Business Holdings, Inc. (GTI BH), collectively referred to as the “Globe Group” in this report. The unaudited condensed consolidated financial statements for the three months ended 31 March 2011 (filed as Annex 1 of this report) have been prepared in accordance with Philippine Accounting Standard 34, Interim Financial Reporting, hence, do not include all of the information required in the December 31, 2011 annual audited financial statements. ITEM 2. MANAGEMENT’S DISCUSSION AND ANALYSIS (MD&A) OF FINANCIAL
CONDITION AND RESULTS OF OPERATIONS The following is a discussion and analysis of Globe Group’s financial performance for the three months ended 31 March 2011. The prime objective of this MD&A is to help the readers understand the dynamics of the Company’s business and the key factors underlying its financial results. Hence, Globe’s MD&A is comprised of a discussion of its core business, and analysis of the results of operations for each business segment. This section also focuses on key statistics from the audited consolidated financial statements and pertains to known risks and uncertainties relating to the telecommunications industry in the Philippines where we operate up to the stated reporting period. However, Globe’s MD&A should not be considered all inclusive, as it excludes unknown risks, uncertainties and changes that may occur in the general economic, political and environmental condition after the stated reporting period. The Globe Group has adopted an expanded corporate governance approach in managing its business risks. An Enterprise Risk Management Policy was developed to systematically view the risks and to manage these risks in the context of the normal business processes such as strategic planning, business planning, operational and support processes. The Company’s MD&A should be read in conjunction with its unaudited consolidated financial statements and the accompanying notes. All financial information is reported in Philippine Pesos (Php) unless otherwise stated. Any references in this MD&A to “we”, “us”, “our”, “Company” means the Globe Group and references to “Globe” mean Globe Telecom, Inc., not including its wholly-owned subsidiaries. Additional information about the Company, including annual and quarterly reports, can be found on our corporate website www.globe.com.ph.

SEC Form 17Q – 1Q 2011 5
The following is a summary of the key sections of this MD&A:
OVERVIEW OF OUR BUSINESS_________________________________________ 6
FINANCIAL AND OPERATIONAL RESULTS _____________________________ 14 GROUP FINANCIAL SUMMARY ___________________________________________ 14 GROUP OPERATING REVENUES __________________________________________ 16 GROUP OPERATING EXPENSES ___________________________________________ 29 LIQUIDITY AND CAPITAL RESOURCES____________________________________ 32 FINANCIAL RISK MANAGEMENT _________________________________________ 36
LEGAL, REGULATORY AND CORPORATE DEVELOPMENTS______________ 40

SEC Form 17Q – 1Q 2011 6
OVERVIEW OF OUR BUSINESS Globe Telecom, Inc. is a major provider of telecommunications services in the Philippines, supported by over 5,700 employees and over 760,000 retailers, distributors, suppliers, and business partners nationwide. The Company operates one of the largest and most technologically-advanced mobile, fixed line and broadband networks in the country, providing reliable, superior communications services to individual customers, small and medium-sized businesses, and corporate and enterprise clients. Globe currently has over 27 million mobile subscribers, over 1,180,000 broadband customers, and over 600,000 landline subscribers. Globe is also one of the largest and most profitable companies in the country, and has been consistently recognized both locally and internationally for its corporate governance practices. It is listed on the Philippine Stock Exchange under the ticker symbol GLO and had a market capitalization of US$2.7 billion as of the end of March 2011. The Company’s principal shareholders are Ayala Corporation and Singapore Telecom, both industry leaders in their respective countries. Aside from providing financial support, this partnership has created various synergies and has enabled the sharing of best practices in the areas of purchasing, technical operations, and marketing, among others. Globe is committed to being a responsible corporate citizen. Globe BridgeCom, the company’s umbrella corporate social responsibility program, leads and supports various initiatives that (1) promote education and raise the level of computer literacy in the country, (2) support entrepreneurship and micro-enterprise development particularly in the countryside, and (3) ensures sustainable development through protection of the environment and excellence in operations. Since its inception in 2003, Globe BridgeCom has made a positive impact on the lives of thousands of public elementary and high school students, teachers, community leaders, and micro-entrepreneurs throughout the country. For its efforts, Globe BridgeCom has been recognized and conferred several awards and citations by various Philippine and international organizations.

SEC Form 17Q – 1Q 2011 7
The Globe Group is composed of the following companies:
• Globe Telecom, Inc. (Globe) provides mobile telecommunications services;
• Innove Communications Inc. (Innove), a wholly-owned subsidiary, provides fixed line telecommunications and broadband services, high-speed internet and private data networks for enterprise clients, services for internal applications, internet protocol-based solutions and multimedia content delivery;
• G-Xchange, Inc. (GXI), a wholly-owned subsidiary, provides mobile commerce
services under the GCash brand;
• Entertainment Gateway Group Corp. and EGGstreme (Hong Kong) Limited (EHL) (collectively referred here as EGG Group), provide digital media content and applications; and
• GTI Business Holdings, Inc. (GTI), a wholly-owned subsidiary, is an investment
company with authority to provide VOIP services. The Company is a grantee of various authorizations and licenses from the National Telecommunications Commission (NTC) as follows: (1) license to offer and operate facsimile, other traditional voice and data services and domestic line service using Very Small Aperture Terminal (VSAT) technology; (2) license for inter-exchange services; and (3) Certificate of Public Convenience and Necessity (CPCN) for: (a) international digital gateway facility (IGF) in Metro Manila, (b) nationwide digital cellular mobile telephone system under the GSM standard (CMTS-GSM), (c) nationwide local exchange carrier (LEC) services after being granted a provisional authority in June 2005, and (d) international cable landing stations located in Nasugbu, Batangas and Ballesteros, Cagayan. Business Segments Mobile Business Globe provides digital mobile communication services nationwide using a fully digital network based on the Global System for Mobile Communication (GSM) technology. It provides voice, data and value-added services to its mobile subscribers through three major brands: Globe Postpaid, Globe Prepaid and TM. Globe Postpaid includes all postpaid plans such as regular G-Plans, consumable G-Flex Plans, Load Allowance Plans, Load Tipid, Apple TM iPhone 3G plans and high-end Platinum Plans. In 2010, the Company further expanded its postpaid offerings to include MY SUPERPLAN and MY FULLY LOADED PLAN which allow subscribers to personalize their plans, choose and combine various unlimited call, text and web browsing service options. , In addition to these personalized plans, Globe has made available a various add-on roaming and mobile browsing plans to cater to the needs of its subscribers. Globe Prepaid and TM are the prepaid brands of Globe. Globe Prepaid is targeted towards the adult, mainstream market. Its unique brand proposition revolves around its innovative product

SEC Form 17Q – 1Q 2011 8
and service offerings, superior customer service, and Globe’s “worldwidest” services and global network reach. TM, on the other hand, caters to the value-conscious segment of the market. In addition to digital wireless communications, Globe also offers mobile payments and remittance services under the GCash brand. GCash is an internationally acclaimed micro payment service that transforms a mobile phone into a virtual wallet, enabling secure, fast, and convenient money transfers at the speed and cost of a text message. Since the launch of GCash, wholly-owned subsidiary GXI has established a wide network of local and international partners that includes government agencies, utility companies, cooperatives, insurance companies, remittance companies, universities, and commercial establishments which have agreed to accept GCash as a means of payment for products and services. Globe offers various top-up or reloading options and facilities for prepaid subscribers including prepaid call and text cards, bank channels such as ATMs, credit cards, and through internet banking. Subscribers can also top-up at over 760,000 AutoLoad Max retailers nationwide, all at affordable denominations and increments. A consumer-to-consumer top-up facility, Share-A-Load, is also available to enable subscribers to share prepaid load credits via SMS. Globe’s AutoLoad Max and Share-A-Load services are also available in selected OFW hubs all over the world. In 2010, the Company launched a loyalty and rewards program called My Rewards, My Globe for Globe Prepaid subscribers and TM Astig Rewards for TM subscribers. Under the program, and based on a defined scoring system, prepaid subscribers earn points based on tenure and reload. Subscribers can use their points to redeem rewards including Globe and TM products, travel mileage, and gift certificates from leading retail establishments. Globe Postpaid subscribers outside the lock-up period can also earn points based on their monthly billed amounts and length of stay with Globe. Rewards also include Globe products, as well as bill rebates, gadgets, gift certificates, and travel mileage. Subscribers have the option to redeem rewards instantly, or accumulate points to avail of higher-value rewards. Redeemed points in a form of telecom services is netted out against revenues whereas points redeemed in a form of non-telco services such as gift certificates and other products are reflected as marketing expense. At the end of each period, Globe estimates and records the amount of probable future liability for unredeemed points.
1. Mobile Voice
Globe’s voice services include local, national and international long distance call services. It has one of the most extensive local calling options designed for multiple calling profiles. In addition to its standard, pay-per-use rates, subscribers can choose from bulk and unlimited voice offerings for all-day or off-peak use, and in several denominations to suit different budgets.
Globe pioneered international roaming in 1995 and now has one of the widest networks with over 600 roaming partners in more than 200 calling destinations worldwide. Globe also offers roaming coverage on-board selected shipping lines, airlines and via satellite. Through its Globe Kababayan program, Globe provides an extensive range of international call and text services to allow OFWs (Overseas Filipino Workers) to stay connected with their friends and families in the Philippines. This includes prepaid and

SEC Form 17Q – 1Q 2011 9
reloadable call cards and electronic PINs available in popular OFW destinations worldwide.
2. Mobile Data and Value-Added Services
Globe’s data services include local and international SMS offerings, mobile browsing and content downloads. Globe also offers various bucket and unlimited SMS packages to cater to the different needs and lifestyles of its postpaid and prepaid subscribers. Additionally, Globe subscribers can send and receive Multimedia Messaging Service (MMS) pictures and video, or do local and international 3G video calling. Globe’s mobile browsing services allow subscribers to access the internet using their internet-capable handsets or laptops with USB modems. Data access can be made using various technologies including HSPA, 3G with HSDPA, EDGE and GPRS. Browsing subscribers also have multiple charging options available with Globe’s Flexible Mobile Internet Browsing rates which allow subscribers to choose between time or usage-based rates. They can also choose between daily or monthly browsing plans. The Company offers a full range of downloadable content covering multiple topics including news, information, and entertainment through its web portal. Subscribers can purchase or download music, movie pictures and wallpapers, games, mobile advertising, applications or watch clips of popular TV shows and documentaries as well as participate in interactive TV, mobile chat and play games, among others. Through Globe’s partnership with major banks and remittance companies, and using Globe’s pioneering GCash platform, subscribers can perform mobile banking and mobile commerce transactions. Globe subscribers can complete international and domestic remittance transactions, pay fees, utility bills and income taxes, avail of micro-finance transactions, donate to charitable institutions, and buy Globe prepaid load credits using its GCash-activated SIM.
Fixed Line and Broadband Business
Globe offers a full range of fixed line communications services, wired and wireless broadband access, and end-to-end connectivity solutions customized for consumers, SMEs (Small & Medium Enterprises), large corporations and businesses. To better serve the various needs of its customers, Globe organized dedicated customer facing units (CFUs) within the Company to focus on the integrated mobile and fixed line needs of specific market segments. The Company has a Consumer Business unit with dedicated marketing and sales groups to address the needs of retail customers, and a Business CFU (Globe Business) focused on the needs of big and small businesses. Globe Business provides end-to-end mobile and fixed line solutions and is equipped with its own technical and customer relationship teams to serve the requirements of its client base.

SEC Form 17Q – 1Q 2011 10
1. Fixed Line Voice
Globe’s fixed line voice services include local, national and international long distance calling services in postpaid and prepaid packages through its Globelines brand. Subscribers get to enjoy toll-free rates for national long distance calls with other Globelines subscribers nationwide. Additionally, postpaid fixed line voice consumers enjoy free unlimited dial-up internet from their Globelines subscriptions. Low-MSF (monthly service fee) and fixed lines bundled with internet plans are available nationwide and can be customized with value-added services including multi-calling, call waiting and forwarding, special numbers and voice mail. For corporate and enterprise customers, Globe offers voice solutions that include regular and premium conferencing, enhanced voice mail, IP-PBX solutions and domestic or international toll free services.
2. Fixed Line Data
Fixed line data services include end-to-end data solutions customized according to the needs of businesses. Globe’s product offerings include international and domestic data services, wholesale and corporate internet access, data center services and segment-specific solutions tailored to the needs of specific industries. Globe’s international data services provide its corporate and enterprise customers with the most diverse international connectivity solutions. Globe’s extensive data network allow customers to manage their own virtual private networks (VPN), subscribe to wholesale internet access via managed international private leased lines (IPL), run various applications, and access other networks with integrated voice services over high-speed, redundant and reliable connections. In addition to bandwidth access from multiple international submarine cable operators, Globe also has two international cable landing stations situated in different locales to ensure redundancy and network resiliency.
The Company’s domestic data services include data center solutions such as business continuity and data recovery services, 24x7 monitoring and management, dedicated server hosting, maintenance for application-hosting, managed space and carrier-class facilities for co-location requirements and dedicated hardware from leading partner vendors for off-site deployment. Other fixed line data services include access services that deliver premium-grade access solutions combining voice, broadband and video offerings designed to address specific connectivity requirements. These include Broadband Internet Zones (BIZ) for broadband-to-room internet access for hotels, and Internet Exchange (GiX) services for bandwidth-on-demand access packages based on average usage.
3. Broadband
Globe offers wired, fixed wireless, and fully mobile internet-on-the-go services across various technologies and connectivity speeds for its residential and business customers. Wired or DSL broadband packages bundled with voice, or broadband data-only services are available at download speeds ranging from 256 kbps up to 3 mbps. In selected areas where DSL is not yet available, Globe offers a fixed wireless broadband service using its WiMAX network. Meanwhile, for consumers who require a fully mobile, internet-on-the-go broadband connection, Globe Broadband Tattoo allows subscribers to access the

SEC Form 17Q – 1Q 2011 11
internet at speeds of up to 2 mbps using 3G with HSDPA, EDGE, GPRS or Wi-Fi at various hotspots nationwide using a plug-and-play USB modem. This service is available in both postpaid and prepaid packages. In addition, consumers in selected urban areas who require faster connections have the option to subscribe to Globe’s Hyper Speed broadband plans using leading edge GPON (Gigabit Passive Optical Network) technology with speeds of up to 100 mbps.

SEC Form 17Q – 1Q 2011 12
KEY PERFORMANCE INDICATORS Globe is committed to enhancing shareholder value and to efficiently manage the Company’s resources. The Company regularly reviews its performance against its operating and financial plans and strategies, and use key performance indicators to monitor its progress. Some of its key performance indicators are set out below. Except for Net Income, these key performance indicators are not measurements in accordance with Philippine Financial Reporting Standards (PFRS) and should not be considered as an alternative to net income or any other measure of performance which are in accordance with PFRS. GROSS AVERAGE REVENUE PER UNIT (GROSS ARPU) Gross ARPU measures the average monthly gross revenue generated for each subscriber. This is computed by dividing recurring gross service revenues for a business segment for the period by the average number of the segment’s subscribers and then dividing the quotient by the number of months in the period. NET AVERAGE REVENUE PER UNIT (NET ARPU) Net ARPU measures the average monthly net revenue generated for each subscriber. This is computed by dividing recurring net service revenues of the segment for the period (net of discounts and interconnection charges to external carriers and content provider revenue share) by the average number of the segment’s subscribers and then dividing the quotient by the number of months in the period. SUBSCRIBER ACQUISITION COST (SAC) SAC is computed by totaling marketing costs (including commissions and handset/SIM subsidies1 ) related to the acquisition programs for the segment for the period divided by the gross incremental subscribers. AVERAGE MONTHLY CHURN RATE The average monthly churn rate is computed by dividing total disconnections (net of reconnections) for the segment by the average number of the segment’s subscribers, and then divided by the number of months in the period. This is a measure of the average number of customers who leave/switch/change to another type of service or to another service provider and is usually stated as a percentage. EBITDA EBITDA (Earnings before Interest, Taxes, Depreciation and Amortization) is calculated as service revenues less subsidy1, operating expenses and other income and expenses2. This measure provides useful information regarding a company’s ability to generate cash flows, incur and service debt, finance capital expenditures and working capital changes. As the Company’s method of calculating EBITDA may differ from other companies, it may not be comparable to similarly titled measures presented by other companies.
1 Computed as non-service revenues less cost of sales, mostly on sale of handsets/SIM packs, accessories & gadgets 2 Operating expenses do not include any property and equipment-related gains and losses and financing costs

SEC Form 17Q – 1Q 2011 13
EBITDA MARGIN EBITDA margin is calculated as EBITDA divided by total service revenues. Total service revenue is equal to total net operating revenue less non-service revenue. This is useful in measuring the extent to which subsidies and operating expenses (excluding property and equipment-related gains and losses and financing costs), use up revenue. EBIT and EBIT MARGIN EBIT is defined as earnings before interest, property and equipment-related gains and losses and income taxes. This measure is calculated by deducting depreciation and amortization from EBITDA. Globe Group’s method of calculating EBIT may differ from other companies, hence, may not be comparable to similar measures presented by other companies. EBIT margin is calculated as EBIT divided by total service revenues. NET INCOME As presented in the unaudited condensed consolidated financial statements for applicable periods, net income provides an indication of how well the Company performed after all costs of the business have been factored in.

SEC Form 17Q – 1Q 2011 14
FINANCIAL AND OPERATIONAL RESULTS GROUP FINANCIAL SUMMARY
Globe Group
Quarter on Quarter Year on Year 1Q 4Q* QoQ 1Q 1Q YoY
Change Change Results of Operations (Php Mn)
2011 2010 (%)
2011 2010 (%)
Net Operating Revenues ………………. 17,469 17,106 2% 17,469 15,841 10% Service Revenues...……………........ 16,452 16,214 1% 16,452 15,231 8% Non-Service Revenues……………... 1,017 892 14% 1,017 610 67%
Costs and Expenses ……………………. 8,378 8,882 -6% 8,378 7,190 17% Cost of Sales……………………….. 1,460 1,291 13% 1,460 869 68% Operating Expenses ……………….. 6,918 7,591 -9% 6,918 6,321 9%
EBITDA………………………………… 9,091 8,224 11% 9,091 8,651 5% EBITDA Margin……………………….. 55% 51% 55% 57%
Depreciation and Amortization…...... 4,347 4,836 -10% 4,347 4,238 3% EBIT……………………………………... 4,744 3,388 40% 4,744 4,413 8% EBIT Margin…………………………… 29% 21% 29% 29% Non-Operating Charges……………….. (463) (578) -20% (463) (220) 110% Net Income After Tax (NIAT)………… 2,991 2,297 30% 2,991 2,947 1% Core Net Income ** ……………………. 2,961 1,944 52% 2,961 2,795 6%
* 4Q 2010 service revenues, EBITDA and EBIT have been normalized to exclude the impact of a one-time upward adjustment, recorded in the same period, amounting to P526 million representing prepaid load credits that have either expired or have already been used up. ** Core net income excludes all foreign exchange and mark-to-market gains and losses, as well as all non-recurring items such as the P526 million adjustment discussed above. • Consolidated service revenues in the first quarter grew 8% from P15.2 billion last year to
P16.5 billion. On a normalized basis, excluding last quarter’s P526 million upward adjustment from prepaid load credits, this quarter’s revenues represent an all-time high for the Company. Mobile revenues were up 4% despite intense competition and dilutive effect of lower yield unlimited and bucket promo offerings. The fixed line and broadband business, on the other hand, registered 26% revenue growth anchored on the 40% expansion of the broadband subscriber base and sustained strong demand for data services from the corporate sector.
• Against the last quarter, consolidated service revenues were P238 million or 1% higher than
normalized 4Q 2010 numbers. Revenues from the fixed line data and broadband segments grew 7% and 9%, respectively, and supported the steady performance of the mobile business which was boosted by the strong take-up of new and affordable postpaid plans as well as increased revenues from the prepaid segment.
• Operating expenses and subsidy increased by 12% from P6.6 billion a year ago to P7.4 billion
mainly on higher marketing and subsidy costs, and increased outsourced services and utilities. Network-related costs such as electricity, fuel, licenses and contracted services grew as a result of an expanded 2G, 3G and broadband networks, and to support the increased

SEC Form 17Q – 1Q 2011 15
growth in voice and data traffic. Similarly, subsidy and marketing expenses increased by 48% against last year following an aggressive promotional campaign across all business segments. As a percentage of total service revenues, subsidy and marketing costs were at 9% this period against 6% last year. Compared to the previous quarter, however, operating expenses and subsidy declined by 8% with reductions in subsidy & marketing, as well as network-related expenses.
• Consolidated EBITDA rose 5% from P8.7 billion a year ago to P9.1 billion this period as
revenue growth outpaced the increase in operating expenses. Consolidated EBITDA margin was at 55% from 57% last year. EBITDA growth helped offset the 3% year-on-year increase in depreciation charges which were driven by continued investments in the broadband and mobile networks. As a result, EBIT rose 8% from P4.4 billion last year to P4.7 billion this quarter, while EBIT margin remained at 29%. Compared to the previous quarter, the growth in service revenues complemented by an 8% decline in operating expenses and subsidy raised consolidated EBITDA this period by 11% from the normalized EBITDA in 4Q 2010. As a result, consolidated EBITDA margin improved from 51% to 55%.
• At the end of the first period, consolidated net income after tax of P3.0 billion was about P44
million or 1% better than last year’s level. Excluding foreign exchange and mark-to-market gains and losses as well non-recurring items, core net income after tax stood at P3.0 billion, 6% higher than last year’s P2.8 billion. Compared to last quarter, net income and core net income was higher by 30% and 52% respectively, driven by higher EBITDA, lower depreciation, and lower non-operating charges.
• Total capital expenditures as of the first quarter amounted to P5.5 billion (or about US$125
million) driven by the continued upgrade and expansion of the Company’s broadband and mobile networks. This amount is in line with last year’s spending of about P5.6 billion. The Company recently announced a major expansion of its current 4G footprint by becoming the country’s first carrier to commercially roll out its 4G mobile technology, which Globe has deployed in various part of Metro Manila including Marikina, Quezon City, Makati, Pasay, Las Pinas, Taguig, and Manila. As of end-March, Globe has a total of 11,733 base stations and 6,755 cell sites to support its 2G, 3G and WiMAX services.

SEC Form 17Q – 1Q 2011 16
GROUP OPERATING REVENUES
Globe Group Quarter on Quarter Year on Year
1Q 4Q QoQ 1Q 1Q YoY Change Change
Operating Revenues By Businesses (Php Mn)
2011 2010 (%)
2011 2010 (%)
Mobile 13,868 13,652 2% 13,868 13,047 6% Service Revenues *…………………. 13,060 13,006 - 13,060 12,530 4% Non-Service Revenues……………… 808 646 25% 808 517 56% Fixed Line and Broadband 3,601 3,454 4% 3,601 2,794 29% Service Revenues…………………… 3,392 3,208 6% 3,392 2,701 26% Non-Service Revenues…………….... 209 246 -15% 209 93 125% Total Net Operating Revenues………. 17,469 17,106 2% 17,469 15,841 10%
* 4Q 2010 service revenues have been normalized to exclude the impact of a one-time upward adjustment, recorded in the same period, amounting to P526 million representing prepaid load credits that have either expired or have already been used up.
The Globe Group closed the first quarter with total net operating revenues of P17.5 billion, 10% higher than last year and 2% above previous quarter’s level. The mobile business, which comprised 79% of consolidated service revenues at the end of the first quarter, closed the period with revenues of P13.1 billion, 4% above last year’s P12.5 billion. The mobile industry remained highly competitive, characterized by slowing revenue growth, high penetration levels, continued multi-SIM usage, aggressive pricing, and declining yields resulting from the prevalence of value offers. However, the programs initiated by the Company from earlier periods have gained traction which consequently translated to revenue improvement. Even when compared against seasonally strong 4Q 2010 revenues, revenues from the mobile business were steady with revenues supported by above average daily top-ups from the prepaid brands and the continued strong showing from the postpaid segment. The fixed line and broadband business accounted for 21% of consolidated service revenues, up from 18% a year ago. Revenues from this segment surpassed last year’s level by 26% from P2.7 billion to P3.4 billion lifted by the robust performance of the broadband and fixed line data segments. In relation to the previous quarter, the fixed line and broadband business sustained its growth momentum as well with a 6% increase in revenues. Demand for internet connectivity, being an effective means of communication coupled with the popularity of social networking sites and the introduction of new technology which enables faster browsing speeds, continued to drive the growth of the retail business. Meanwhile, for the corporate sector, the sustained expansion of the country’s offshoring and outsourcing industry contributed to the growth of the fixed line data business. Mobile non-service revenues meanwhile increased by 56% against last year driven largely by handset sales mostly for the postpaid segment. The same trend was observed against last quarter with non-service revenues growing by 25%. For the fixed line and broadband business, on the other hand, non-service revenues were more than double last year’s level of P93 million resulting from the higher dongle prices of Globe Broadband Tattoo. Against last quarter, however, fixed line and broadband non-service revenues declined by 15% to P209 million.

SEC Form 17Q – 1Q 2011 17
MOBILE BUSINESS
Quarter on Quarter Year on Year 1Q 4Q** QoQ 1Q 1Q** YoY
Change Change Mobile Net Service Revenues (Php Mn)
2011 2010 (%)
2011 2010 (%)
Service Voice 1 ….………………………………. 6,112 6,304 -3% 6,112 6,024 1% Data 2..…………………………………... 6,948 6,702 4% 6,948 6,506 7%
Mobile Net Service Revenues *………...... 13,060 13,006 - 13,060 12,530 4% * 4Q 2010 service revenues have been normalized to exclude the impact of a one-time upward adjustment, recorded in the same period, amounting to P526 million representing prepaid load credits that have either expired or have already been used up. ** 2010 revenue split between mobile voice and data has been restated for better comparability. 1 Mobile voice net service revenues include the following:
a) Prorated monthly service fees on consumable minutes of postpaid plans; b) Subscription fees on unlimited and bucket voice promotions including the expiration of the unused value of
denomination loaded; c) Charges for intra-network and outbound calls in excess of the consumable minutes for various Globe Postpaid
plans, including currency exchange rate adjustments (CERA) net of loyalty discounts credited to subscriber billings; and
d) Airtime fees for intra network and outbound calls recognized upon the earlier of actual usage of the airtime value or expiration of the unused value of the prepaid load credit denomination (for Globe Prepaid and TM SIMs) which occurs between 3 and 120 days after activation depending on the prepaid value reloaded by the subscriber, net of (i) bonus credits and (ii) prepaid load credit discounts; and revenues generated from inbound international and national long distance calls and international roaming calls.
Revenues from (a) to (d) are reduced by any interconnection or settlement payouts to international and local carriers and content providers.
2 Mobile data net service revenues consist of prorated monthly service fees on free text allocation of postpaid plans,
revenues from value-added services such as inbound and outbound SMS and MMS, content downloading, mobile data browsing and infotext, international VAS and related services, subscription fees on unlimited and bucket prepaid SMS and add-on VAS services, net of any interconnection or settlement payouts to international and local carriers and content providers.
Mobile Voice Mobile voice revenues accounted for 47% of total mobile service revenues in the first quarter to close at P6.1 billion, up 1% from last year. Revenues from unlimited and bulk voice subscriptions as well as roaming services increased from last year. Growth, however, was partly offset by the year-on-year decline in regular voice and IDD services. Globe sustained its suite of innovative and affordable mobile voice offers during the period. This includes its pioneering per-second charging offer, Super Sakto Calls, as well as its bulk voice services such as Tawag 236 for 20-minutes of intra-network calls for only P20, and its P10 for 3-minute calls to Globe Postpaid and Globe Prepaid subscribers. It also maintained its unlimited and hybrid voice packages such as SuperUnli which provides unlimited calls and texts within the Globe and TM networks, as well as its breakthrough 2-in-1 mobile and landline service, SuperDuo.
SEC Form 17Q – 1Q 2011 18
Similarly for TM, the Company sustained its per-second charging offer, Sulit Segundo Calls, and its bulk voice call promotions such as TodoTawag P15 for 15-minute intra-network calls, AstigTawag20 for consumable 15-minute calls to all networks, and TM SuliTawag for 3-minute intra-network calls. For value-seekers, meanwhile, the Company sustained its low-denomination bulk voice service TM DAGDAGCALL, an add-on service to TM’s text promotions which provides 3 consumable minutes of voice calls to any Globe or TM subscriber for only P5. TM UNLICOMBO, on the other hand, provides unlimited intra-network calls from 10 PM to 5 PM the following day coupled with unlimited SMS for 24 hours. For Filipinos who wish to stay connected with their loved ones abroad, Globe continued to offer its pioneering IDD Sakto Calls and Super Sulit Tipid IDD services. Globe similarly expanded its all-you-can offerings to include international voice calls with SuperIDD which supports unlimited IDD service to US and Canada from 11:00 PM to 5:59 AM (Philippine Time) for only P99 a day. Globe also introduced IDD Tingi, a bucket IDD service to popular and selected overseas destinations, while continuing to offer its TipIDD card at various Globe distribution channels. Mobile Data Mobile data revenues accounted for 53% of total mobile service revenues, and increased by 7% from P6.5 billion last year to P6.9 billion this period. Revenues from mobile browsing were significantly higher than last year driven by the popularity of social networking sites, affordable data plans, and pervasiveness of mobile phones and access devices. These were supported as well by the growth in regular and bucket SMS revenues. In the first quarter, Globe continued to offer its unlimited text services such as UnliTxt and SuperTxt, alongside TM’s AstigTxt10. Globe also maintained its bucket SMS services such as SuliTxt, EverybodyTxt, and SuperAll Txt together with TM’s AstigTxtAll and SuliTxt. The Company also sustained its bundled voice and text services such as (a) Globe’s Super One for unlimited calls and text messages to a frequently called Globe or TM number, (b) TM’s ASTIGCOMBO10 which provides 50 text messages to all networks plus 10 consumable voice minutes to other Globe and TM subscribers, and (c) ASTIGCOMBO20 for 24 hours of unlimited SMS plus 100 consumable voice minutes within the Globe and TM networks. Globe similarly continued to offer SUPERCOMBO20 which is primarily an unlimited text service which comes with 50 minutes worth of voice calls to any Globe or TM subscriber. With the prevalence of smartphones and the increasing demand for mobile internet service driven by the popularity of social networking sites, Globe continued to provide an affordable add-on data plan, Super Surf, which allows unlimited chatting, downloading, emailing and browsing for its Globe Postpaid and Globe Prepaid subscribers. Globe similarly sustained its Power Surf offering to allow Globe Prepaid subscribers to purchase mobile internet hours by bulk in either of the two denominations: 3 hours for P30 valid for a day, or 5 hours for P50 valid for 3 days. For BlackBerry® users, on the other hand, Globe sustained its attractive and affordable data services such as the following: unlimited BlackBerry® service for Globe Prepaid subscribers, Super Surf for BlackBerry® for unlimited BlackBerry® services using the BlackBerry® APN and Super Surf for BlackBerry® Max for unlimited BlackBerry® services using both mobile internet service and BlackBerry® APN for its Globe Postpaid subscribers. Globe likewise maintained its two add-on data plans to its Globe Postpaid and Globe Prepaid subscribers: BlackBerry® Messaging and BlackBerry® Social.

SEC Form 17Q – 1Q 2011 19
The key drivers for the mobile business are as follows:
Quarter on Quarter Year on Year 1Q 4Q QoQ 1Q 1Q YoY
Change Change 2011 2010
(%) 2011 2010
(%)
Cumulative Subscribers (or SIMs) – Net 27,319,553 26,470,859 3% 27,319,553 23,889,706 14% Globe Postpaid 1………………………………. 1,146,738 1,066,137 8% 1,146,738 880,491 30% Prepaid .…………………………………… 26,172,815 25,404,722 3% 26,172,815 23,009,215 14% Globe Prepaid …………………………… 14,211,548 13,834,716 3% 14,211,548 13,041,308 9% TM .………………………………………… 11,961,267 11,570,006 3% 11,961,267 9,967,907 20% Net Subscriber (or SIM) Additions 848,694 1,067,857 -21% 848,694 644,700 32% Globe Postpaid ..…………………………...…. 80,601 83,259 -3% 80,601 29,123 177% Prepaid .…………………………………… 768,093 984,598 -22% 768,093 615,577 25% Globe Prepaid …………………………… 376,832 483,473 -22% 376,832 (7,553) 5089% TM .………………………………………… 391,261 501,125 -22% 391,261 623,130 -37% Average Revenue Per Subscriber (ARPU) Gross ARPU Globe Postpaid………………………………... 1,402 1,580 -11% 1,402 1,723 -19% Prepaid 2 Globe Prepaid ………………………….... 199 207 -4% 199 219 -9% TM ………………………………………… 115 121 -5% 115 120 -4% Net ARPU Globe Postpaid..………………………………. 1,090 1,176 -7% 1,090 1,268 -14% Prepaid 2 Globe Prepaid ……………………………. 152 155 -2% 152 167 -9% TM .………………………………………… 86 92 -7% 86 92 -7% Subscriber Acquisition Cost (SAC) Globe Postpaid………………………………... 4,238 3,959 7% 4,238 3,837 10% Prepaid Globe Prepaid ……………………………. 22 28 -21% 22 10 120% TM .………………………………………… 24 27 -11% 24 32 -25% Average Monthly Churn Rate (%) Globe Postpaid ....…………………………….. 1.41% 1.32% 1.41% 2.07% Prepaid Globe Prepaid ……………………………. 5.52% 5.65% 5.52% 6.71% TM .……………………………………….... 6.47% 6.41% 6.47% 6.76%
1 As of 1Q 2011, Globe had a total of 1.44 million wireless postpaid subscribers which includes 1.15 million mobile telephony and 0.29 million wireless broadband customers. This is higher compared to the 1.33 million wireless postpaid subscribers as of 4Q 2010 which is comprised of 1.07 million mobile telephony subscribers and 0.26 million wireless broadband customers. Mobile telephony revenues are reflected under “Mobile Service Revenues” while wireless broadband revenues are included under “Broadband.” 2 4Q 2010 ARPUs have been normalized to exclude the impact of a one-time upward adjustment, recorded in the same period, amounting to P526 million representing prepaid load credits that have either expired or have already been used up.
SEC Form 17Q – 1Q 2011 20
At the end of the first quarter, Globe had a total subscriber base of 27.3 million, 14% and 3% above last year and previous quarter, respectively. Strong subscriber acquisitions were sustained with 5.5 million SIM additions in the first quarter, 4% higher than last year’s 5.3 million. With churn rate significantly improving from last year’s 6.56% to this period’s 5.77%, net additions as of end-March increased from last year’s 644,700 to 848,694 SIMs. Compared to the previous quarter, gross additions were about 84,000 SIMs below the 5.6 million recorded earlier. With churn rate almost at par with prior quarter’s 5.81%, net additions declined by 21% from 1,067,857 recorded in fourth quarter of 2010. The succeeding sections cover the key brands of the mobile business – Globe Postpaid, Globe Prepaid and TM. Globe Postpaid The postpaid segment comprises 4% of Globe’s total mobile subscriber base. The Company’s successful launch of its personalized subscription plans drew great response from new and old customers alike bringing this quarter’s gross acquisitions to a record-high of nearly 121,000 from only about 80,000 in the same period last year. With churn rate significantly improving from 2.07% to 1.41% year-on-year, net additions increased from 29,123 to 80,601. Against previous quarter, however, net additions were slightly below the 83,259 recorded earlier. As a result, postpaid subscribers stood at 1,146,738 as of the first quarter, 30% higher than year ago level of 880,491 subscribers, and 8% higher than last quarter’s 1,066,137 subscribers Anchoring on the recent success of its My Super Plan and My Fully Loaded Plan offerings, Globe further intensified its efforts in customizing and personalizing subscriber plans with the launch of the ALL NEW My Super Plan. Under the new plans, subscribers are given the flexibility to determine the monthly service fee suited to their budget by choosing between an All-Unlimited Plan and an All-Consumable Plan. Subscribers then pick a monthly add-on unlimited service such as calls, texts, or mobile surfing to boost their plans. On top of these, subscribers select freebies such as bulk voice, bucket text and mobile surfing hours to complete the services available to their chosen subscription plan. Finally, with the ALL NEW My Super Plan, customers also pick a handset or a device bundle that comes with their plan either for free or at a discount. When subscribed to the ALL NEW My Super Plan, postpaid subscribers are also allowed to change their add-on service and freebies as often as monthly. Alternatively, Globe launched MY SUPERTXT ALL, the first-ever unlimited text offer to all networks for mobile postpaid subscribers. This latest service from Globe is available to postpaid subscribers for a fixed monthly fee of P599, or effectively for as low as P20 a day. Recognizing the demand for mobile internet service, Globe likewise launched exciting promotional gadget deals during the period. Globe brought in a number of smartphones and tablet devices from Samsung, Huawei, and HTC to come with its new postpaid subscription plans. To complement this, the Company held a one-day sale in February for its BlackBerry® handsets which allowed subscribers to purchase a pair of BlackBerry® units for a monthly fee of as low as P2,098. Postpaid gross and net ARPUs of P1,402 and P1,090 were lower than last year’s P1,723 and P1,268, respectively, given the strong subscriber take-up of more affordable postpaid subscription plans. Growth in mobile browsing, domestic voice and local SMS revenues were offset by lower

SEC Form 17Q – 1Q 2011 21
revenues from international services. Postpaid subscriber acquisition costs (SAC) increased by 10% from previous year’s P3,837 to P4,238 due largely to advertising and promotion charges related to the launch of new postpaid plans. Costs, however, remained recoverable within the 24-month contract period for postpaid subscribers. Prepaid Globe’s prepaid segment, which includes the Globe Prepaid and TM brands, comprises 96% of its total subscriber base. As of end-March 2011, cumulative prepaid subscribers of 26.2 million were 14% above last year’s 23.0 million, and 3% higher than last quarter’s 25.4 million. A prepaid subscriber is recognized upon the activation and use of a new SIM card. The subscriber is provided with 60 days (first expiry) to utilize the preloaded SMS value. If the subscriber does not reload prepaid credits within the first expiry period, the subscriber retains the use of the mobile number but is only entitled to receive incoming voice calls and text messages for another 120 days (second expiry). The second expiry is 120 days from the date of the first expiry. However, if the subscriber does not reload prepaid credits within the second expiry period, the account is permanently disconnected and considered part of churn. The first expiry periods of reloads vary depending on the denominations, ranging from 1 day for P10 to 60 days for P300 to P500 reloads. The first expiry is reset based on the longest expiry period among current and previous reloads. Under this policy, subscribers are included in the subscriber count until churned. In 2009, the National Telecommunications Commission (NTC) published Memorandum Circular 03-07-2009 which promulgates the extension of the validity periods of prepaid reloads effective July 19, 2009. Under the new pronouncement, the first expiry periods now range from 3 days for P10 or below to 120 days for reloads amounting to P300 and above. The second expiry remains at 120 days from the date of the new first expiry periods. The succeeding sections discuss the performance of the Globe Prepaid and TM brands in more detail.
Globe Prepaid Globe Prepaid accounts for 52% of the total mobile subscriber base. Gross additions in the first quarter rose by 3% from last year’s 2.6 million to 2.7 million. Churn rate similarly improved from last year’s 6.71% to 5.52% resulting to subscriber net additions of 376,832 against last year’s net reduction of 7,553. Against the previous quarter, however, gross additions slightly declined from about 2.8 million to 2.7 million SIMs this period. Churn rate, likewise, declined from 5.65% to 5.52%, bringing net additions down by 22% quarter-on-quarter. Cumulative Globe Prepaid subscribers stood at 14.2 million, 9% higher than last year’s 13.0 million and 3% above previous quarter’s 13.8 million. In the first quarter, Globe enhanced its bucket text service SuperAll Txt 20 which now provides 250 all-network text messages, up from just 200 messages from the time of its inception in the third quarter of 2010. The service remains affordable for the same fee of P20 for 1 day subscription. Meanwhile, in an effort to stimulate usage and encourage retention among its subscribers, Globe had a soft launch of its first-ever all-in-one offer, SuperLahat20, to Globe

SEC Form 17Q – 1Q 2011 22
Prepaid subscribers in Davao. The promo provides unlimited intra-network text messages and 100 intra-network consumable call minutes, 60 consumable minutes of mobile internet surfing, and 5 international text messages to 190 destinations. Globe Prepaid subscribers in Davao can avail of the promo for only P20 for a day’s use. Capitalizing on its strong partnership with Puregold, Globe launched a special promotional offer for shoppers who top-up their prepaid load credits at any check-out lane of Puregold branches nationwide. For every P50 purchase of prepaid load credits, the subscriber gets an additional P5 load. The promo was offered daily from March 11 to April 10, 2011, and was made available during weekends beginning April 15 up to June 30, 2011. During the period, Globe also enhanced its mobile data offerings to its Globe Prepaid subscribers. The Company launched Super Facebook, which allows subscribers to surf on Facebook on their mobile phones for 5 straight hours for only P10. Alternatively, users who browse the internet from time to time can subscribe to PowerSurf15 for 1 hour consumable mobile internet access for just P15 and valid for 1 day. Finally, for prepaid subscribers with BlackBerry® units, Globe launched Super Surf for BlackBerry® Max Prepaid which provides unlimited chatting, downloading, emailing via push email service and video streaming using both the internet and the BlackBerry® APN. The service, which used to be offered only to postpaid subscribers, is available in three variants: P60 for 24 hours, P300 for 5 days, and P1,500 for 30 days access. Despite an overall increase in voice and SMS traffic, Globe Prepaid gross and net ARPUs declined by 9% from last year. Subscribers’ continued preference for lower yield unlimited and bucket promos was the key driver behind the decline. Revenue growth from mobile browsing, domestic voice and SMS was offset by lower revenues from international services. Subscriber acquisition costs, on the other hand, grew more than twice last year’s P10 to P22 mainly on higher advertising and promo expenses. SAC, however, remained recoverable within a month’s net ARPU. TM TM comprises 44% of the total mobile subscriber base. Gross additions in the first quarter stood at about 2.7 million, slightly above last year’s level of 2.6 million, while churn rate improved year-on-year from 6.76% to 6.47%. Net additions for the period, however, declined by 37% from 623,130 last year to 391,261. As a result, cumulative TM subscribers closed at nearly 12.0 million at the end of the first quarter, 20% above last year’s level of about 10.0 million SIMs. Compared to last quarter, TM subscribers were 3% higher. During the period, the Company further enhanced TM’s service offerings with ASTIGCOMBOALL for TM subscribers in Davao. For only P10 a day, subscribers are entitled to 100 texts to all networks and 100 consumable call minutes to any Globe or TM number. Similar to Globe Prepaid and as a way of thanking Puregold shoppers for staying Globe-connected, TM subscribers who purchase prepaid load credits at any of Puregold’s point-of-sale and check-out counters nationwide are also entitled to get an additional P5 load for every P50 load top-up. The Super Reload Deal complemented the earlier campaign by Globe and Puregold that rewarded loyal customers with the Aling Puring Super Suki SIM, a special multi-function SIM card which allows Puregold to text blast announcements and reminders to “Aling Puring”

SEC Form 17Q – 1Q 2011 23
members in an easy, reliable and personal way. Globe provided Aling Puring Super Suki SIM card holders with discounted call and text rates to any Globe or TM subscribers. Similar to the trends in Globe Prepaid, TM gross and net ARPUs declined from last year by 4% and 7%, respectively. Subscriber acquisition costs (SAC), likewise, declined by 25% year-on-year on lower advertising and promotion charges and handset subsidy. TM SAC remained recoverable within a month’s net ARPU.

SEC Form 17Q – 1Q 2011 24
GCash GCash continues to establish its presence in the mobile commerce industry. GCash’s initial thrust towards money-transfers, purchase of goods and services from retail outlets, and sending and receiving domestic and international remittances has spurred alliances in the field of mobile commerce. Today, GCash allows Globe and TM subscribers to pay or transact for the following using their mobile phone:
• domestic and international remittances • utility bills • interest and amortization of loans • insurance premiums • donations to various institutions and organizations • sales commissions and payroll disbursements • school tuition fees • micro tax payments and business registration • electronic loads and pins • online purchases • airline tickets
In addition to the above transactions, GCash is also used as a wholesale payment facility. On October 9, 2009, the Company announced that the Bangko Sentral ng Pilipinas (BSP) has approved the sale and transfer by Bank of the Philippine Islands (BPI) of its shares of stock in Pilipinas Savings Bank, Inc. (PSBI) that will result in the ownership of PSBI as follows: 40 % each for BPI and Globe Telecom and 20 % for Ayala Corporation (AC). BPI, Globe and AC plan to transform PSBI into the country’s first mobile microfinance bank. On October 23, 2009 the official name of PSBI was changed to BPI GLOBE BANKO, INC. after getting the approval of both the BSP and the Securities and Exchange Commission (SEC). BPI Globe BanKo Inc. opened its first branch last February 2010, and added 5 more branches as of 31 March 2011 in Dipolog, Dumaguete, Lucena, Naga and Tacloban. While the bank’s initial focus is on wholesale lending to other microfinance institutions, it is now expanding into retail banking products and services to include micro-savings, micro-lending, and insurance. Globe also launched its GCash Remit Service, providing mobile subscribers a quick, affordable and convenient way to send and receive domestic and international remittances. With BSP’s recent approval to use its sub-distributors as cash-in and cash-out outlets, GCash now has the largest remittance network in the country with its 18,000 GCash outlets. On October 14, 2010, Globe also achieved a milestone with the launch of the GCash Card, the country’s first customizable ATM card linked to a mobile wallet. This gives subscribers 24/7 access to GCash and allows them to withdraw funds in their GCash via any of the 9,000 Bancnet, Megalink, ExpressNet or Encash Automated Teller Machines (ATMs) nationwide. In addition, the GCash Card is the only customizable ATM Card in the country where subscribers can make their own personalized ATM card design or choose from a variety of design templates.
SEC Form 17Q – 1Q 2011 25
FIXED LINE AND BROADBAND BUSINESS
Quarter on Quarter Year on Year 1Q 4Q QoQ 1Q 1Q YoY Net Service Revenues
(Php Mn) 2011 2010 Change
(%) 2011 2010 Change (%)
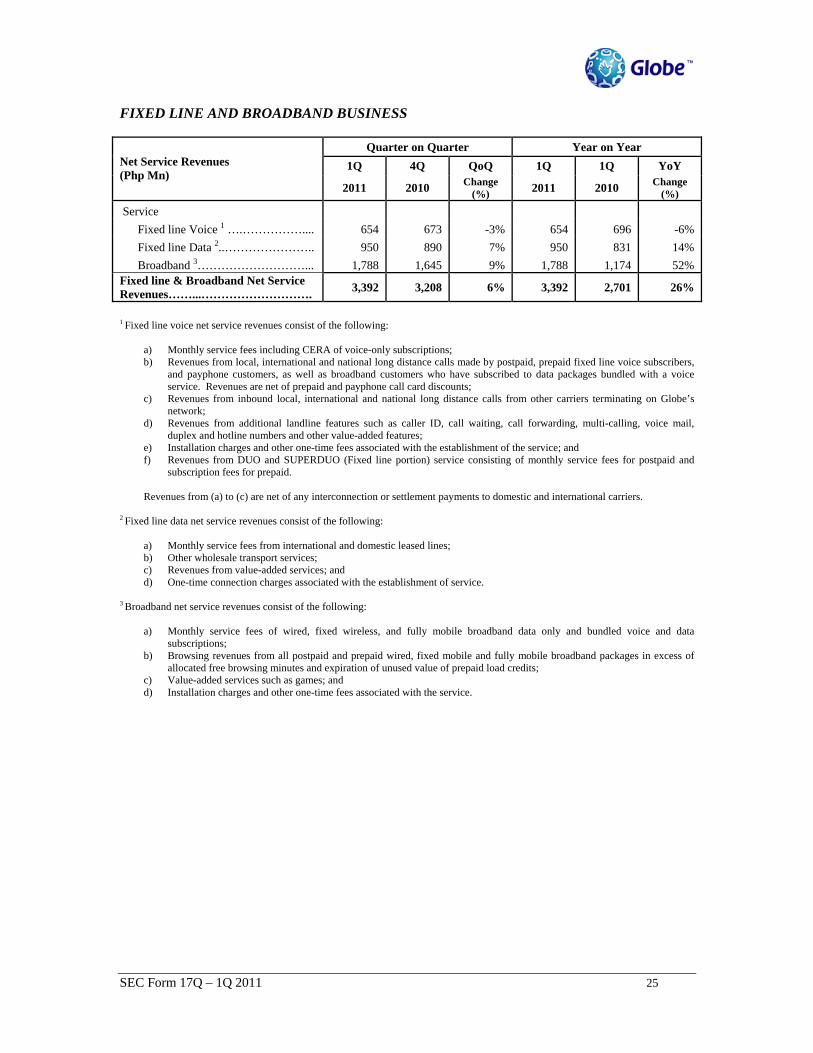
Service Fixed line Voice 1 ….…………….... 654 673 -3% 654 696 -6% Fixed line Data 2..………………….. 950 890 7% 950 831 14% Broadband 3………………………... 1,788 1,645 9% 1,788 1,174 52% Fixed line & Broadband Net Service Revenues……...………………………. 3,392 3,208 6% 3,392 2,701 26% 1 Fixed line voice net service revenues consist of the following:
a) Monthly service fees including CERA of voice-only subscriptions; b) Revenues from local, international and national long distance calls made by postpaid, prepaid fixed line voice subscribers,
and payphone customers, as well as broadband customers who have subscribed to data packages bundled with a voice service. Revenues are net of prepaid and payphone call card discounts;
c) Revenues from inbound local, international and national long distance calls from other carriers terminating on Globe’s network;
d) Revenues from additional landline features such as caller ID, call waiting, call forwarding, multi-calling, voice mail, duplex and hotline numbers and other value-added features;
e) Installation charges and other one-time fees associated with the establishment of the service; and f) Revenues from DUO and SUPERDUO (Fixed line portion) service consisting of monthly service fees for postpaid and
subscription fees for prepaid. Revenues from (a) to (c) are net of any interconnection or settlement payments to domestic and international carriers.
2 Fixed line data net service revenues consist of the following:
a) Monthly service fees from international and domestic leased lines; b) Other wholesale transport services; c) Revenues from value-added services; and d) One-time connection charges associated with the establishment of service.
3 Broadband net service revenues consist of the following:
a) Monthly service fees of wired, fixed wireless, and fully mobile broadband data only and bundled voice and data subscriptions;
b) Browsing revenues from all postpaid and prepaid wired, fixed mobile and fully mobile broadband packages in excess of allocated free browsing minutes and expiration of unused value of prepaid load credits;
c) Value-added services such as games; and d) Installation charges and other one-time fees associated with the service.

SEC Form 17Q – 1Q 2011 26
Fixed line Voice
Quarter on Quarter Year on Year 1Q 4Q QoQ 1Q 1Q YoY
2011 2010 Change (%) 2011 2010 Change
(%) Cumulative Voice Subscribers -
Net (End of period)1…………............................ 631,200 618,606
2% 631,200 583,149 8% Average Revenue Per Subscriber (ARPU) ...... Gross ARPU………………………………… 417 437 -5% 417 480 -13% Net ARPU…………………………………… 349 369 -5% 349 402 -13% Average Monthly Churn Rate ..…………….... 2.92% 2.68% 2.92% 5.93%
1 Includes DUO and SuperDUO subscribers Total fixed line voice revenues decreased by 6% to P654 million from P696 million last year mainly due to the continued shift in traffic from fixed line voice to mobile services and the resulting weaker demand for voice-only, fixed line products. This decline was partially offset by the continued strong performance of Globe’s DUO and SUPERDUO service, which led to the growth in cumulative fixed line voice subscribers of 8% year-on-year to over 631,000. On a sequential basis, cumulative voice subscribers increased by 2% due to the increase in both postpaid and prepaid subscriptions to the DUO and SUPERDUO service. Fixed line Data
Quarter on Quarter Year on Year 1Q 4Q QoQ 1Q 1Q YoY Net Service Revenues (Php Mn)
2011 20102 Change (%) 2011 20102 Change
(%) Fixed line Data International …..………………………... 257 258 - 257 243 6% Domestic….… …………………............. 422 395 7% 422 379 11% Others 1 ………………………………… 271 237 14% 271 209 30% Total Fixed line Data Service Revenues….. 950 890 7% 950 831 14% 1 Includes revenues from value-added services such as internet, data centers and bundled services. 2 2010 revenues have been restated for comparability The fixed line data segment sustained its strong growth and ended the first quarter of 2011 with P950 million in revenues, an increase of 14% over the same period last year following gains across all product segments. Growth has continued to be fueled by the Company’s expansion of its network of high-speed data nodes, transmission links, and international bandwidth capacity to serve the requirements of business and enterprise clients, including those in the financial services, retail, offshoring and outsourcing industries.

SEC Form 17Q – 1Q 2011 27
Broadband
Quarter on Quarter Year on Year 1Q 4Q QoQ 1Q 1Q YoY
2011 2010 Change (%) 2011 2010 Change
(%) Cumulative Broadband Subscribers Wireless 1 ……………………………… 915,148 819,276 12% 915,148 606,344 51% Wired………………………………….. 265,251 255,077 4% 265,251 234,253 13% Total (end of period)…………………….. 1,180,399 1,074,353 10% 1,180,399 840,597 40% 1 Includes fixed wireless and fully mobile broadband subscribers. Globe’s broadband business ended the first quarter of the year with over 1,180,000 subscribers, 40% higher than the prior year’s level of 841,000. This was driven by the significant subscriber gains in Globe Broadband Tattoo, the Company’s nomadic broadband service, and in Globe WiMAX, Globe’s fixed wireless service for at-home use. Wireless broadband subscribers now account for 78% of total broadband customers, up from 72% last year. The robust subscriber pick-up translated to sustained revenue gains, with broadband service revenues up 52% to close the quarter at P1.8 billion compared to P1.2 billion in the same period in 2010. The broadband business now comprises 11% of consolidated service revenues compared to 8% last year. In an effort to sustain the strong growth in the segment, Globe launched the all-new Tattoo Broadband: No Limits campaign, with an edgier and more vibrant look and feel. Along with this, Globe also launched the new barkada-friendly Buy 3, Get 1 Free promo that offers a free Tattoo stick for every three sticks purchased. For only P3,735, the promotion offers 4 Tattoo sticks at an effective price of P933.75 per stick versus the regular price of P1,245, providing savings of up to 25%. Globe also introduced Tattoo SURFTXT 60, the first-ever surf and text combo offer available to prepaid broadband dongles. The combined promotion provides Globe Tattoo Prepaid Broadband subscribers access to an entire day of surfing and texting for only P60. In the last quarter of 2010, Globe launched the Tattoo SuperStick, Globe Tattoo’s most powerful mobile broadband, capable of speeds of up to 3 mbps, and with sharable Globe-powered WIFI connection for only P1,299 per month. In the first quarter of 2011, Globe also announced the expansion of its 4G footprint by becoming the first carrier in the Philippines to commercially roll-out its 4G mobile technology, complementing the company’s existing 4G WiMAX network. Globe’s 4G mobile network (HSPA+ technology or Evolved High-Speed Packet Access, a 4G wireless, mobile and high speed broadband technology) has been deployed in different cities across Metro Manila, providing customers with an improvement in their call and text services as well as an enhancement in their data experience, providing consistent browsing speeds of 4-6 Mbps with even faster peak speeds.
SEC Form 17Q – 1Q 2011 28
OTHER GLOBE GROUP REVENUES
International Long Distance (ILD) Services
Globe Group
Quarter on Quarter Year on Year 1Q 4Q QoQ 1Q 1Q1 YoY
2011 2010 Change (%) 2011 2010 Change
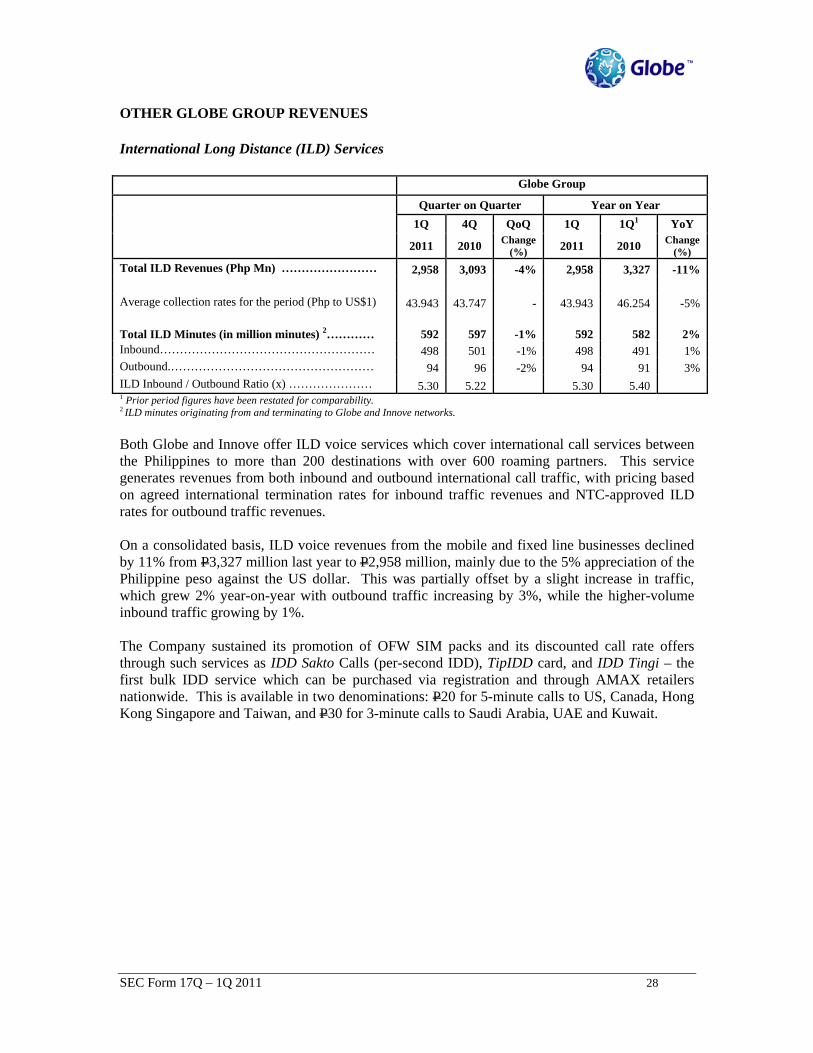
(%) Total ILD Revenues (Php Mn) …………………… 2,958 3,093 -4% 2,958 3,327 -11% Average collection rates for the period (Php to US$1) 43.943 43.747 - 43.943 46.254 -5% Total ILD Minutes (in million minutes) 2………… 592 597 -1% 592 582 2% Inbound……………………………………………… 498 501 -1% 498 491 1% Outbound.…………………………………………… 94 96 -2% 94 91 3% ILD Inbound / Outbound Ratio (x) ………………… 5.30 5.22 5.30 5.40 1 Prior period figures have been restated for comparability. 2 ILD minutes originating from and terminating to Globe and Innove networks. Both Globe and Innove offer ILD voice services which cover international call services between the Philippines to more than 200 destinations with over 600 roaming partners. This service generates revenues from both inbound and outbound international call traffic, with pricing based on agreed international termination rates for inbound traffic revenues and NTC-approved ILD rates for outbound traffic revenues. On a consolidated basis, ILD voice revenues from the mobile and fixed line businesses declined by 11% from P3,327 million last year to P2,958 million, mainly due to the 5% appreciation of the Philippine peso against the US dollar. This was partially offset by a slight increase in traffic, which grew 2% year-on-year with outbound traffic increasing by 3%, while the higher-volume inbound traffic growing by 1%. The Company sustained its promotion of OFW SIM packs and its discounted call rate offers through such services as IDD Sakto Calls (per-second IDD), TipIDD card, and IDD Tingi – the first bulk IDD service which can be purchased via registration and through AMAX retailers nationwide. This is available in two denominations: P20 for 5-minute calls to US, Canada, Hong Kong Singapore and Taiwan, and P30 for 3-minute calls to Saudi Arabia, UAE and Kuwait.

SEC Form 17Q – 1Q 2011 29
GROUP OPERATING EXPENSES For the first three months of the year, the Globe Group’s total costs and expenses, including depreciation, grew by 8% to P=11,708 million from P=10,818 million in the same period in 2010, mainly driven by higher marketing and subsidy spend and service costs. Compared to last quarter, total costs and expenses, including depreciation, were lower by 9%.
Globe Group Quarter on Quarter Year on Year
1Q 4Q QoQ 1Q 1Q YoY (Php Mn)
2011 2010 Change (%) 2011 2010 Change
(%) Cost of sales…………………………………………. 1,460 1,291 13% 1,460 869 68% Less: Non-service revenues………………………….. 1,017 892 14% 1,017 610 67% Subsidy………………………………………………. 443 399 11% 443 259 71% Selling, Advertising and Promotions ………………. 1,001 1,268 -21% 1,001 715 40% Staff Costs …………………………………………… 1,412 1,281 10% 1,412 1,337 6% Utilities, Supplies & Other Administrative Expenses... 866 924 -6% 866 725 19% Rent…………………………………………………… 628 762 -18% 628 715 -12% Repairs and Maintenance…………………………….. 721 913 -21% 721 742 -3% Provisions ………………… ……………………………. 370 350 6% 370 364 2% Services and Others…………………………………... 1,920 2,093 -8% 1,920 1,723 11% Operating Expenses…………………………………. 6,918 7,591 -9% 6,918 6,321 9% Depreciation and Amortization ……………….…… 4,347 4,836 -10% 4,347 4,238 3% Costs and Expenses…………………………………. 11,708 12,826 -9% 11,708 10,818 8% Subsidy and Marketing Total subsidy and selling, advertising and promotions was higher at P1,444 million against last year’s P974 million. Against the prior quarter, subsidy and selling, advertising and promotions expenses were lower by 13% mainly due to the seasonally high marketing spend in the previous quarter. Total subsidies increased 71% or by P184 million mainly from higher gross acquisitions in the mobile business partially offset by the decrease in subsidies in broadband following the price increase of Globe Broadband Tattoo Prepaid kits in May 2010. Selling, advertising and promotion, which comprised 14% of total subsidy and operating expenses, were higher by P286 million or 40%. Against last quarter, first quarter spend was P267 million or 21% lower. As a percentage of total service revenues, total marketing expenses and subsidy increased to 9% from last year’s 6%. Staff Costs Staff costs, which accounted for 19% of total subsidy and operating expenses, increased by 6% to end the period at P1,412 million from P1,337 million last year mainly due to the higher headcount

SEC Form 17Q – 1Q 2011 30
for the period, coupled with increases in other incentives. Total headcount increased 5% compared to last year, from 5,433 to 5,710. On a quarter on quarter basis, staff costs increased 10% due to higher variable pay during the period. Utilities, Supplies and Other Administrative Expenses Utilities, Supplies and Other Administrative expenses accounted for 12% of total subsidy and operating expenses. Costs rose by 19% year on year due mainly to higher electricity, fuel expenses coming from the continued expansion of Globe’s cellular and broadband network. Rent Rent expenses, which accounted for 9% of total subsidy and operating expenses, decreased by P87 million or 12% year on year due mainly to lower leases on international cable facilities. On a quarter on quarter basis, rental expenses decreased 18% or P134 million. Provisions This account includes provisions related to trade, non-trade and traffic receivables and inventory. Overall, provisions posted a net increase of P6 million or 2% from P364 million to P370 million this year driven by higher traffic and inventory provisions. As a percentage of service revenues, provisions remained within the 2% level. Repairs and Maintenance Repairs and Maintenance expenses, which include fees for technical and service providers as well as maintenance costs for hardware, software and network facilities, accounted for 10% of total subsidy and operating expenses and decreased by P21 million or 3% from last year. Services and Others Services and Others, which accounted for 26% of total subsidy and operating expenses, increased by P197 million or 11% from P1,723 million to P1,920 million. This increase is mainly attributable to higher charges related to various outsourced functions such as call centers, technical helpdesk, and subscriber line installation charges for broadband and fixed line voice services, coupled with higher professional and consulting fees. These were partially offset by lower security costs for the period. Depreciation and Amortization Depreciation and amortization expenses increased by 3% year on year to P4,347 million from P4,238 million due to additional investments resulting from the continued expansion of the Company’s networks. Compared to last quarter, depreciation expense was lower by P489 million or 10%. Depreciation is computed using the straight line method over the estimated useful life (EUL) of the assets, where the weighted EUL of all depreciable assets as of March 31, 2011 is 10.11 years.

SEC Form 17Q – 1Q 2011 31
Other income statement items
Other income statement items include net financing costs, net foreign exchange gain (loss), interest income and net property and equipment related income (charges) as shown below:
Globe Group
Quarter on Quarter Year on Year
1Q 4Q QoQ 1Q 1Q YoY (Php Mn)
2011 2010 Change (%) 2011 2010 Change
(%)
Financing Costs – net
Interest Expense…………………………... (522) (534) -2% (522) (458) 14% (Loss) on derivative instruments – net……. 10 (4) -350% 10 (9) -211% Swap costs and other financing costs……... (51) (25) 104% (51) (12) 325% Foreign Exchange (loss) / gain - net.…..…. 32 (13) -346% 32 224 -86% (531) (576) -8% (531) (255) 108% Interest Income ……………………………... 85 57 49% 85 54 57% Others – net…………………………………. (17) (59) -71% (17) (19) -11% Total Other (Expenses) Income……………. (463) (578) -20% (463) (220) 110% As of the end of March 2011, the Globe Group’s non-operating charges posted a year on year increase of 110% or P243 million to close at P463 million. With the Philippine peso registering only a slight 1% appreciation from January to March 2011, the Company recorded lower foreign exchange gains of P32 million in contrast to the P224 million gains booked in the same period last year, when the currency had appreciated by 2% (See related discussion on derivative instruments and swap costs in the Foreign Exchange and Interest Rate Exposure section). Meanwhile, interest expense increased by 14% from P458 million last year to P522 million due to increased borrowings this period despite the decline in average local and foreign interest rates. On the other hand, interest income increased by P31 million or 57% against last year.

SEC Form 17Q – 1Q 2011 32
LIQUIDITY AND CAPITAL RESOURCES
Globe Group
31 Mar 2011
31 Mar 2010
YoY change (%)
Balance Sheet Data (Php Mn) Total Assets …………………………………………………… 133,682 127,491 5% Total Debt …………………………………………………….. 50,524 47,991 5% Total Stockholders’ Equity …………………………………… 45,953 45,427 1% Financial Ratios (x) Total Debt to EBITDA ………………………………………... 1.39 1.39 Debt Service Coverage………………………………………… 2.24 2.33 Interest Cover (Gross) ………………………………………… 13.04 11.80 Debt to Equity (Gross) ………………………………………... 1.10 1.06 Debt to Equity (Net) 1…………………………………………. 0.94 0.97 Total Debt to Total Capitalization (Book) ……………………. 0.52 0.51 Total Debt to Total Capitalization (Market) ...………………... 0.30 0.27
1 Net debt is calculated by subtracting cash, cash equivalents and short term investments from total debt. Globe’s balance sheet and cash flows remain strong with ample liquidity and gearing within optimum level. Globe Group’s consolidated assets as of 31 March 2011 amounted to P=133,682 million compared to P=127,491 million for the same period in 2010. Consolidated cash, cash equivalents and short term investments (including investments in assets available for sale and held to maturity investments) was at P=7,279 million at the end of the period compared to last year’s P3,944 million. The Company’s gearing levels have been increasingly optimized over the past few years with the raised dividend payouts and higher proportion of debt to total capitalization. Globe ended the quarter with gross debt to equity ratio of 1.1:1 on a consolidated basis which is well within the 2:1 debt to equity limit dictated by its debt covenants. Meanwhile, net debt to equity ratio was at 0.94:1 compared to 0.97:1 for the same period last year. The financial tests under Globe’s loan agreements include compliance with the following ratios:
• Total debt to equity not exceeding 2:1; • Total debt to EBITDA not exceeding 3:1; • Debt service coverage 1 exceeding 1.3 times; and • Secured debt ratio 2 not exceeding 0.2 times.
As of 31 March 2011, Globe is well within the ratios prescribed under its loan agreements. 1 Debt service coverage ratio is defined as the ratio of EBITDA to required debt service, where debt service includes subordinated debt but excludes shareholder loans.
2 Secured debt ratio is defined as the ratio of the total amount for the period of all present consolidated obligations for payment, whether actual or contingent which are secured by Permitted Security Interest as defined in the loan agreement to the total amount of consolidated debt. Globe has no secured debt as of 31 March 2011.
SEC Form 17Q – 1Q 2011 33
Consolidated Net Cash Flows
Globe Group
(Php Mn) 31 Mar 2011
31 Mar 2010
YoY change (%)
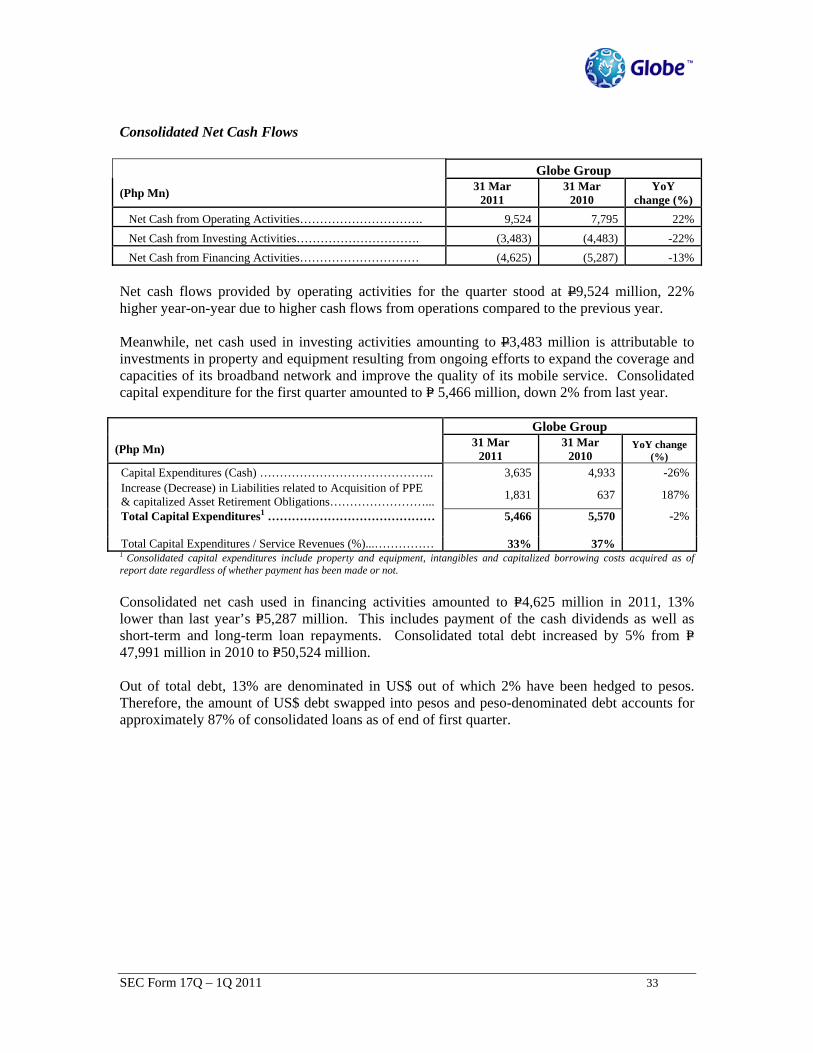
Net Cash from Operating Activities…………………………. 9,524 7,795 22% Net Cash from Investing Activities…………………………. (3,483) (4,483) -22% Net Cash from Financing Activities………………………… (4,625) (5,287) -13% Net cash flows provided by operating activities for the quarter stood at P9,524 million, 22% higher year-on-year due to higher cash flows from operations compared to the previous year. Meanwhile, net cash used in investing activities amounting to P3,483 million is attributable to investments in property and equipment resulting from ongoing efforts to expand the coverage and capacities of its broadband network and improve the quality of its mobile service. Consolidated capital expenditure for the first quarter amounted to P= 5,466 million, down 2% from last year.
Globe Group
(Php Mn) 31 Mar 2011
31 Mar 2010
YoY change (%)
Capital Expenditures (Cash) …………………………………….. 3,635 4,933 -26% Increase (Decrease) in Liabilities related to Acquisition of PPE & capitalized Asset Retirement Obligations……………………... 1,831 637 187%
Total Capital Expenditures1 …………………………………… 5,466 5,570 -2% Total Capital Expenditures / Service Revenues (%)...…………… 33% 37%
1 Consolidated capital expenditures include property and equipment, intangibles and capitalized borrowing costs acquired as of report date regardless of whether payment has been made or not.
Consolidated net cash used in financing activities amounted to P=4,625 million in 2011, 13% lower than last year’s P=5,287 million. This includes payment of the cash dividends as well as short-term and long-term loan repayments. Consolidated total debt increased by 5% from P=47,991 million in 2010 to P=50,524 million. Out of total debt, 13% are denominated in US$ out of which 2% have been hedged to pesos. Therefore, the amount of US$ debt swapped into pesos and peso-denominated debt accounts for approximately 87% of consolidated loans as of end of first quarter.

SEC Form 17Q – 1Q 2011 34
Below is the schedule of debt maturities for Globe for the years stated below based on total outstanding debt as of 31 March 2011: Year Due Principal *
(US$ Mn) 2011………….…………………………………………………………………………... 1822012.……………………………………………………………………………………... 2212013……………………………………………………………………………………… 2252014 through 2018 ……………………………………………………………………… 542Total 1,170* Principal amount before debt issuance costs. In February 2011, Globe Telecom, Inc. signed a seven-year, P7.0 billion term loan facility with BDO Unibank, Inc. as lender. The proceeds of the loan will be used to finance the company’s capital expenditures and / or refinance existing debts. As of 31 March 2011, stockholders’ equity stood at P45,953 million, a 1% increase from P45,427 million in the same period last year. Globe’s capital stock consists of the following:
Preferred Shares Preferred stock Series “A” at a par value of P5 per share of which 158 million shares are outstanding out of a total authorized of 250 million shares. Preferred stock “Series A” has the following features: a. Convertible to one common share after 10 years from issue date on June 29, 2001 at not
less than the prevailing market price of the common stock less the par value of the preferred shares;
b. Cumulative and non-participating; c. Floating rate dividend; d. Issued at P5 par; e. With voting rights; f. Globe has the right to redeem the preferred shares at par plus accrued dividends at any
time after 5 years from date of issuance; and g. Preferences as to dividend in the event of liquidation. The dividends for preferred shares are declared upon the sole discretion of the Board of Directors (BOD) of Globe Telecom. Common Shares Common shares at par value of P50 per share of which 132 million are issued and outstanding out of a total authorized of 180 million shares.
Cash Dividends The dividend policy of Globe Telecom as approved by the Board of Directors is to declare cash dividends to its common stockholders on a regular basis as may be determined by the Board. The dividend payout rate starting 2006 is approximately 75% of prior year’s net income payable semi-annually in March and September of each year. This is reviewed annually, taking into account

SEC Form 17Q – 1Q 2011 35
Globe Telecom’s operating results, cash flows, debt covenants, capital expenditure levels and liquidity. On November 6, 2009, the Board of Directors amended the dividend payment rate from 75% to a range of 75% - 90% of prior year’s net income. On February 8, 2011, the Board of Directors approved the declaration of the first semi-annual cash dividend of P31.00 per common share, payable to shareholders on record as of February 22, 2011. Total dividends of P4.1 billion were paid on March 18, 2011. Consolidated Return on Average Equity (ROE) registered at the 26% level in the end of the first quarter of 2011, compared to the 25% in the same period in 2010 using net income and based on average equity balances for the period ended. Accordingly, consolidated basic earnings per common share were P22.54 and P22.17 while consolidated diluted earnings per common share were P22.43 and P22.11 for the first quarter ending 2011 and 2010, respectively.

SEC Form 17Q – 1Q 2011 36
FINANCIAL RISK MANAGEMENT FOREIGN EXCHANGE EXPOSURE Foreign exchange risks are managed such that USD inflows from operations (transaction exposures) are balanced or offset by the net USD liability position of the company (translation exposures). Globe Group’s objective is to maintain a position which results in, as close as possible, a neutral effect to the P&L relative to movements in the foreign exchange market.
Transaction exposures
Globe has natural net US$ inflows arising from its operations. Consolidated foreign currency-linked revenues 1 were at 25% and 29% of total service revenues for the periods ended 31 March 2011 and 2010, respectively. In contrast, our foreign-currency linked expenses were at 7% and 10% of total operating expenses and subsidy for the periods ended 31 March 2011 and 2010, respectively. The US$ flows for the first quarter of 2011 are as follows: US$ and US$ Linked Revenues P4.0 billion US$ Operating Expenses P0.5 billion US$ Net Interest Expense P0.05 billion
Due to these net US$ inflows, an appreciation of the Peso has a negative impact on Globe’s Peso EBITDA. Globe occasionally enters into forward contracts to hedge against a peso appreciation. A total of US$36 million of contracts remain outstanding as of the end of March 2011. The MTM of the outstanding forwards stood at a gain of P11 million as of end March 2011.
Realized gains from forward contracts that matured in 2011 amounted to P0.78 million.
1Includes the following revenues: (a) billed in foreign currency and settled in foreign currency, and (b) billed in Pesos at rates linked to a foreign currency tariff and settled in Pesos

SEC Form 17Q – 1Q 2011 37
Translation Exposures
Globe also has US$ assets and liabilities which are revalued at market rates every period. These are as follows: March 2011 US$ Assets US$90 million US$ Liabilities US$384 million Net US$ Liability Position US$294 million
For accounting purposes, the foreign currency assets and liabilities are revalued at the current exchange rate at the end of each reporting period. Given the net US$ liability position, a depreciation of the peso results in a revaluation or forex loss in our P&L. As of March 2011, the Philippine Peso stood at P43.408 to the US dollar, a 1% appreciation versus the yearend rate of P43.811. Due to the strengthening of the Peso, the Globe Group charged a total of P33 million in net foreign exchange gains to current operations for the quarter ended March 2011. Prior to 2004, the Company entered into long term currency swap agreements to hedge the currency exposure on its liabilities. As of end-March 2011, the Company has only one such remaining agreement, with a notional amount of US$2.5 million. The MTM of this swap contract stood at a loss of P35 million as of end March 2011. The Company also has US$0.62 million in forward US$ purchase contracts to cover US$ obligations, with maturities up to April 2011. The average rate of the forward contract is P43.99. The MTM of the outstanding forwards amounts to a gain of P0.01 million as of March 31, 2011. The swap and forward contracts are not designated as hedges for accounting purposes (please refer to Notes 12.3 and 12.6 of the attached Notes to Financial Statements). As such, the MTM of the contracts have flowed through the P&L, and future changes to the MTM of the contracts will also be charged to P&L every period.

SEC Form 17Q – 1Q 2011 38
INTEREST RATE EXPOSURE Interest rate exposures are managed via targeted levels of fixed versus floating rate debt that are meant to achieve a balance between cost and volatility. Globe’s policy is to maintain between 44-88% of our peso debt in fixed rate, and between 31-62% of our US$ debt in fixed rate. As of end-March 2011, Globe has a total of US$79 million and P7 billion in interest rate swap contracts that were entered into to achieve these targets. US$74 million of the total interest rate swaps are US$ swaps under which the Company effectively swapped some of its floating US$ denominated loans into fixed rate, with quarterly or semi-annual payment intervals up to July 2013. Globe also has US$5 million in notional amount of US$ swaps under which the Company receives a fixed rate of 9.75% and pays a floating rate based on LIBOR, subject to a cap. The payments on the swap are subject to the performance of 10 and 30 year US$ interest rates. Lastly, the company has P7 billion in interest rate swap contracts, under which the company effectively fixed the rate on outstanding floating rate debts. As of end of March 2011, 68% of peso debt is fixed, while 45% of USD debt is fixed after swaps. The MTM of the interest rate swap contracts stood at a gain of P154 million as of end-March 2011. CREDIT EXPOSURES FROM FINANCIAL INSTRUMENTS Outstanding credit exposures from financial instruments are monitored daily and allowable exposures are reviewed quarterly. For investments, the Globe Group does not have investments in foreign securities (bonds, collateralized debt obligations (CDO), collateralized mortgage obligations (CMO), or any instruments linked to the mortgage market in the US). Globe’s excess cash is invested in short term bank and SDA deposits. The Globe Group also does not have any investments or hedging transactions with investment banks. Derivative transactions as of the end of the period are with large foreign and local banks. Furthermore, the Globe Group does not have instruments in its portfolio which became inactive in the market nor does the company have any structured notes which require use of judgment for valuation purposes. (Please refer to Note 12.2.2 of attached Notes to the Financial Statements for additional information on active and inactive markets) VALUATION OF DERIVATIVE TRANSACTIONS The company uses valuation techniques that are commonly used by market participants and that have been demonstrated to provide reliable estimates of prices obtained in actual market transactions. The company uses readily observable market yield curves to discount future receipts and payments on the transactions. The net present value of receipts and payments are translated into Peso using the foreign exchange rate at time of valuation to arrive at the mark to market value. For derivative instruments with optionality, the company relies on valuation reports of its counterparty banks, which are the company’s best estimates of the close-out value of the transactions.

SEC Form 17Q – 1Q 2011 39
Gains (losses) on derivative instruments represent the net mark-to-market (MTM) gains (losses) on derivative instruments. As of 31 March 2011, the MTM value of the derivatives of the Globe Group amounted to a gain of P106 million while loss on derivative instruments arising from changes in MTM reflected in the consolidated income statements amounted to P51 million. (Please refer to Note 12.8 of the attached Notes to Financial Statements for gains/losses of preceding periods). To measure riskiness, the company provides a sensitivity analysis of its profit and loss from financial instruments resulting from movements in foreign exchange and interest rates. (Please refer to attached Notes 12.2.1 of the Financial Statements for the sensitivity analysis results.) The interest rate sensitivity estimates the changes to the following P&L items, given an indicated movement in interest rates: (1) interest income, (2) interest expense, (3) mark to market of derivative instruments. The foreign exchange sensitivity estimates the P&L impact of a change in the USD/PHP rate as it specifically pertains to the revaluation of the net unhedged liability position of the company, and foreign exchange derivatives.

SEC Form 17Q – 1Q 2011 40
LEGAL, REGULATORY AND CORPORATE DEVELOPMENTS On 23 July 2009, the NTC issued NTC Memorandum Circular (MC) No. 05-07-2009 (Guidelines on Unit of Billing of Mobile Voice Service). The MC provides that the maximum unit of billing for the cellular mobile telephone service (CMTS) whether postpaid or prepaid shall be six (6) seconds per pulse. The rate for the first two (2) pulses, or equivalent if lower period per pulse is used, may be higher than the succeeding pulses to recover the cost of the call set-up. Subscribers may still opt to be billed on a one (1) minute per pulse basis or to subscribe to unlimited service offerings or any service offerings if they actively and knowingly enroll in the scheme. In compliance with NTC MC 05-07-2009, Globe refreshed and offered to the general public its existing per-second rates that, it bears emphasizing, comply with the NTC Memorandum Circular. Globe made per second charging for Globe-Globe/TM-TM/Globe available for Globe Subscribers dialing prefix 232 (GLOBE) OR 803 plus 10-digit TM or Globe number for TM subscribers. The NTC, however, contends that Globe’s offering does not comply with the circular and with the NTC’s Order of 7 December 2009 which imposed a three-tiered rate structure with a mandated flag-down of P3.00, a rate of P0.4375 for the 13th to the 160th second of the first minute and P0.65 for every 6-second pulse thereafter. On 9 December 2009, the NTC issued a Cease and Desist Order requiring the carriers to refrain from charging under the previous billing system or regime and refund consumers.
Globe maintains that the Order of the NTC of 7 December 2009 and the Cease and Desist Order are void as being without basis in fact and law and in violation of Globe’s rights to due process. Globe, Smart, Sun and CURE all filed petitions before the Court of Appeals seeking the nullification of the questioned orders of the NTC. On 18 February 2010, the Court of Appeals issued a Temporary Restraining Order preventing the NTC from enforcing the disputed Order.
On 25 May 2010, the CA issued a writ of preliminary injunction directing the NTC to cease and desist from enforcing their assailed Order/s. On 28 December 2010, the CA rendered a Decision declaring the questioned decisions invalid for being violative of the Petitioners’ right to due process,among others. The Petitioners and the NTC filed their respective Motions for Partial Reconsideration.
Globe believes that its legal position is strong and that its offering is compliant with the NTC’s Memorandum Circular 05-07-2009, and therefore believes that it would not be obligated to make a refund to its subscribers. If, however, Globe would be held as not being in compliance with the circular, Globe may be contingently liable to refund to any complaining subscribers any charges it may have collected in excess of what it could have charged under the NTC’s disputed Order of 7 December 2009, if indeed it is proven by any complaining party that Globe charged more with its per second scheme than it could have under the NTC’s 6-second pulse billing scheme stated in the disputed Order. Management has no estimate of what amount this could be at this time.
On 22 May 2006, Innove received a copy of the Complaint of Subic Telecom Company (“Subictel”), Inc., a subsidiary of PLDT, seeking an injunction to stop the Subic Bay Metropolitan Authority and Innove from taking any actions to implement the Certificate of Public Convenience and Necessity granted by SBMA to Innove. Subictel claimed that the grant of a CPCN allowing Innove to offer certain telecommunications services within the Subic Bay Freeport Zone would violate the Joint Venture Agreement (“JVA”) between PLDT and SBMA. The Court of Appeals ordered the reinstatement of the case and has forwarded it to the NTC-Olongapo for trial.

SEC Form 17Q – 1Q 2011 41
PLDT and its affiliate, Bonifacio Communications Corporation (BCC) and Innove and Globe are in litigation over the right of Innove to render services and build telecommunications infrastructure in the Bonifacio Global City. In the case filed by Innove before the NTC against BCC, PLDT and the Fort Bonifacio Development Corporation (FBDC), the NTC has issued a Cease and Desist Order preventing BCC from performing further acts to interfere with Innove’s installations in the Bonifacio Global City.
In the case filed by PLDT against the NTC in Branch 96 of the Regional Trial Court (RTC) of Quezon City, where PLDT sought to obtain an injunction to prevent the NTC from hearing the case filed by Innove, the RTC denied the prayer for a preliminary injunction and the case has been set for further hearings. PLDT has filed a Motion for Reconsideration and Globe has intervened in this case. In a resolution dated 28 October 2008, the RTC QC denied BCC’s motion for the issuance of a temporary restraining order (TRO). The case is still pending with the QC RTC.
In the case filed by BCC against FBDC, Globe Telecom and Innove, Bonifacio Communications Corp. before the Regional Trial Court of Pasig, which case sought to enjoin Innove from making any further installations in the BGC and claimed damages from all the parties for the breach of the exclusivity of BCC in the area, the court did not issue a Temporary Restraining Order and has instead scheduled several hearings on the case. In a resolution dated 28 October 2008, the RTC QC denied BCC’s motion for the issuance of a temporary restraining order (TRO). The case is still pending with the RTC Pasig.
On 11 November 2008, Bonifacio Communications Corp. (BCC) filed a criminal complaint against the officers of Innove Communications Inc., the Fort Bonifacio Development Corporation (FBDC) and Innove contractor Avecs Corporation for malicious mischief and theft arising out of Innove’s disconnection of BCC’s duct at the Net Square buildings. The accused officers filed their counter-affidavits and are currently pending before the Prosecutor’s Office of Pasig. The case is still pending resolution with the Office of the City Prosecutor.
On 21 January 2011, BCC and PLDT filed a Petition for Certiorari and Prohibition against NTC, et al. seeking to annul the Orders of the NTC dated 28 October 2008 directing BCC, PLDT and FBDC to comply with the provisions of NTC MC 05-05-02 and the CEASE AND DESIST from performing further acts that will prevent Innove from implementing and providing telecommunications services in the Fort Bonifacio Global City pursuant to the authorization granted by the NTC. BCC and PLDT anchor their petition on the grounds that: 1) the NTC has no jurisdiction over BCC it being a non telecommunications entity; 2) the NTC violated BCC and PLDT’s right to due process; and 3) there was no urgency or emergency for the issuance of the cease and desist order. The case is pending with the court of appeals.

SEC Form 17Q – 1Q 2011 42
OTHER RELEVANT INFORMATION MAJOR STOCKHOLDERS The following are the major stockholders of Globe Telecom as of 31 March 2011:
Stockholders Common Shares
% of Common
Preferred Shares
% of Preferred
shares Total % of
Total
Ayala Corp. 40,319,263 30.5% - - 40,319,262 13.9% SingTel 62,646,486 47.3% - - 62,646,486 21.5% Asiacom - - 158,515,021 100% 158,515,021 54.5% Public 29,382,724 22.2% - - 29,382,724 10.1% Total 132,348,473 100% 158,515,021 100% 290,863,494 100% BOARD OF DIRECTORS (BOD) As of 12 April 2011 Annual Meeting of the stockholders of Globe Telecom, Inc., the members of the BOD are:
Name Position Jaime Augusto Zobel de Ayala Chairman Gerardo C. Ablaza, Jr. Co-Vice Chairman Hui Weng Cheong Co-Vice Chairman Romeo L. Bernardo Director Ernest L. Cu Director Delfin L Lazaro Director Xavier P. Loinaz* Director Guillermo D. Luchangco* Director Manuel A. Pacis* Director Tay Soo Meng Director Fernando Zobel de Ayala Director
* Independent Director Key Officers - Globe
Name Position Ernest L. Cu President and Chief Executive Officer Alberto M. de Larrazabal Chief Financial Officer and Treasurer Catherine Hufana-Ang Head – Internal Audit Vicente Froilan M. Castelo Head – Corporate & Legal Services Group Marisalve Ciocson-Co Assistant Corporate Secretary & Compliance Officer
Ferdinand M. de la Cruz Head – Consumer Sales Rebecca V. Eclipse Head – Office of Strategy Management Rodell A. Garcia Head – Network and IT Transformation and Head – Information Systems
Group Gil B. Genio Head – Business Customer Facing Unit & President – Innove
Communications, Inc. Renato M. Jiao Head – Human Resources Carmencita T. Orlina Head – Consumer Marketing
Solomon M. Hermosura Corporate Secretary
Consultants
Name Position Peter Bithos Advisor for the Consumer Customer Facing Unit Lee Han Kheng Chief Operating Adviser Rodolfo A. Salalima Chief Legal Counsel and Senior Advisor Robert Tan Chief Technical Adviser


Globe Telecom, Inc. and Subsidiaries
Condensed Consolidated Financial Statements March 31, 2011 and 2010 (Unaudited) and December 31, 2010 (Audited) SyCip Gorres Velayo & Co.

GLOBE TELECOM, INC. AND SUBSIDIARIES CONDENSED CONSOLIDATED STATEMENTS OF FINANCIAL POSITION March 31 December 31
Notes 2011
(Unaudited) 2010
(Unaudited) 2010
(Audited) (In Thousand Pesos) ASSETS Current Assets Cash and cash equivalents 12 P=7,278,785 P=3,940,847 P=5,868,986 Short-term investments 12 – 2,799 – Receivables - net 12 8,035,441 6,541,735 8,374,123 Inventories and supplies 1,906,070 1,604,634 1,839,333 Derivative assets 12 26,039 98,851 19,888 Prepayments and other current assets - net 12 5,088,784 4,909,585 4,704,198 Total Current Assets 22,335,119 17,098,451 20,806,528 Assets classified as held for sale 11 778,321 – 778,321 23,113,440 17,098,451 21,584,849 Noncurrent Assets Property and equipment - net 3 102,533,054 102,957,018 101,837,254 Investment property 208,556 231,102 214,192 Intangible assets and goodwill - net 4 3,620,828 3,018,026 3,248,376 Investments in joint ventures 198,020 229,449 197,016 Deferred income tax - net 691,228 741,479 670,594 Derivative assets 12 295,172 – – Other noncurrent assets - net 3,021,592 3,215,960 2,875,686 Total Noncurrent Assets 110,568,450 110,393,034 109,043,118 P=133,681,890 P=127,491,485 P=130,627,967 LIABILITIES AND EQUITY Current Liabilities Accounts payable and accrued expenses 12 P=24,808,074 P=21,256,865 P=22,115,203 Provisions 222,885 150,369 224,388 Derivative liabilities 12 215,224 125,318 93,336 Income tax payable 2,427,059 2,212,324 1,098,492 Unearned revenues 2,159,908 2,915,650 2,402,749 Notes payable 5, 12 – 2,500,415 – Current portion of: Long-term debt 5, 12 15,184,339 3,748,871 8,677,209 Other long-term liabilities 12 – 778,381 – Total Current Liabilities 45,017,489 33,688,193 34,611,377 Liabilities directly associated with the assets
classified as held for sale 11 670,485 – 697,729 45,687,974 33,688,193 35,309,106 Noncurrent Liabilities Deferred income tax - net 4,679,261 4,656,449 4,620,490 Long-term debt - net of current portion 5, 12 35,339,332 41,741,724 41,694,261 Derivative liabilities 12 159 2,033 152,529 Other long-term liabilities - net of current portion 12 2,021,709 1,976,407 1,982,453 Total Noncurrent Liabilities 42,040,461 48,376,613 48,449,733 Total Liabilities 87,728,435 82,064,806 83,758,839 Equity Paid-up capital 33,950,802 33,927,594 33,946,004 Cost of share-based payments 555,314 487,327 544,794 Other reserves 6 137,487 49,309 (88,310) Retained earnings 6 11,309,852 10,962,449 12,466,640 Total Equity 45,953,455 45,426,679 46,869,128 P=133,681,890 P=127,491,485 P=130,627,967 See accompanying Notes to Condensed Consolidated Financial Statements.

GLOBE TELECOM, INC. AND SUBSIDIARIES CONDENSED CONSOLIDATED STATEMENTS OF COMPREHENSIVE INCOME (UNAUDITED)
Three Months Ended
March 31 Notes 2011 2010 (In Thousand Pesos)
INCOME Service revenues P=16,451,841 P=15,230,949 Nonservice revenues 1,017,478 610,591 Interest income 84,851 53,890 Equity in net income of a joint venture 1,592 – Others – net 7 178,346 321,087 17,734,108 16,216,517
COSTS AND EXPENSES General, selling and administrative 7 6,635,218 6,035,896 Depreciation and amortization 3,4 4,347,338 4,238,241 Cost of sales 1,460,500 868,941 Financing costs 7 562,745 478,326 Impairment losses and others 7 446,916 400,312 Equity in net losses of a joint venture – 2,159 13,452,717 12,023,875
INCOME BEFORE INCOME TAX 4,281,391 4,192,642
PROVISION FOR (BENEFIT FROM) INCOME TAX Current 1,349,896 1,225,970 Deferred (59,918) 20,168 1,289,978 1,246,138
NET INCOME 2,991,413 2,946,504
OTHER COMPREHENSIVE INCOME 6 Transactions on cash flow hedges - net 321,524 36,203 Changes in fair value of available-for-sale investment in equity
securities
1,342 7,845 Exchange differences arising from translations of foreign
investments
(611) (2,396) Tax effect relating to components of other comprehensive income (96,458) (10,861) 225,797 30,791
TOTAL COMPREHENSIVE INCOME P=3,217,210 P=2,977,295
Earnings Per Share 10 Basic P=22.54 P=22.17
Diluted P=22.43 P=22.11
Cash dividends declared per common share 6 P=31.00 P=40.00 See accompanying Notes to Condensed Consolidated Financial Statements.

GLOBE TELECOM, INC. AND SUBSIDIARIES CONDENSED CONSOLIDATED STATEMENTS OF CHANGES IN EQUITY
Notes
Capital Stock
Additional Paid-in Capital
Cost of Share-Based
Payments
Other Reserves
(Note 6) Retained Earnings Total
For the Period Ended March 31, 2011 (Unaudited and In Thousand Pesos)
As of January 1, 2011 P=7,409,223 P=26,536,781 P=544,794 (P=88,310) P=12,466,640 P=46,869,128 Total comprehensive income for
the period – – – 225,797 2,991,413 3,217,210 Dividends on: 6
Common stock – – – – (4,102,802) (4,102,802)Preferred stock – – – – (45,399) (45,399)
Cost of share-based payments – – 15,318 – – 15,318 Forfeited stock options – 4,798 (4,798) – – – As of March 31, 2011 P=7,409,223 P=26,541,579 P=555,314 P=137,487 P=11,309,852 P=45,953,455
For the Period Ended March 31,2010 (Unaudited and In Thousand Pesos)
As of January 1, 2010 P=7,409,079 P=26,503,079 P=468,367 P=18,518 P=13,309,871 P=47,708,914 Total comprehensive income for
the period – – – 30,791 2,946,504 2,977,295 Dividends on common stock 6 – – – – (5,293,926) (5,293,926) Cost of share-based payments – – 30,577 – – 30,577 Exercise of stock options 136 15,300 (11,617) – – 3,819 As of March 31, 2010 P=7,409,215 P=26,518,379 P=487,327 P=49,309 P=10,962,449 P=45,426,679
For the Year Ended December 31, 2010 (Audited and In Thousand Pesos)
As of January 1, 2010 P=7,409,079 P=26,503,079 P=468,367 P=18,518 P=13,309,871 P=47,708,914 Total comprehensive income (loss)
for the year – – – (106,828) 9,744,634 9,637,806 Dividends on common stock 6 – – – – (10,587,865) (10,587,865) Cost of share-based payments – – 104,788 – – 104,788 Exercise of stock options 144 33,702 (28,361) – – 5,485 As of December 31, 2010 P=7,409,223 P=26,536,781 P=544,794 (P=88,310) P=12,466,640 P=46,869,128
See accompanying Notes to Condensed Consolidated Financial Statements.

GLOBE TELECOM, INC. AND SUBSIDIARIES CONDENSED CONSOLIDATED STATEMENTS OF CASH FLOWS (UNAUDITED)
Three Months Ended
March 31 Notes 2011 2010 (In Thousand Pesos)
CASH FLOWS FROM OPERATING ACTIVITIES Income before income tax P=4,281,391 P=4,192,642 Adjustments for: Depreciation and amortization 3, 4 4,347,338 4,238,241 Interest expense 7 522,205 458,045 Foreign exchange gains - net (41,791) (223,698) Provisions for other probable losses 7 2,096 60,965 Cost of share-based payments 15,318 30,577 Impairment losses on property and equipment 7 77,301 36,337 Equity in net (gain) losses of joint ventures (1,592) 2,159 Interest income (84,851) (53,890) Gain on disposal of property and equipment - net 3 (60,193) (16,938) Loss (gain) on derivative instruments - net 7 (10,280) 8,553 Dividend income (16) – Operating income before working capital changes 9,046,926 8,732,993 Changes in operating assets and liabilities: Decrease (increase) in: Receivables 339,249 82,082 Inventories and supplies (66,737) 49,116 Prepayments and other current assets (407,327) (699,390) Increase (decrease) in: Accounts payable and accrued expenses 896,461 (211,422) Unearned revenues (242,841) (66,230) Other long-term liabilities (31,859) 17,531 Net cash generated from operations 9,533,872 7,904,680 Income taxes paid (9,724) (110,009) Net cash flows provided by operating activities 9,524,148 7,794,671
CASH FLOWS FROM INVESTING ACTIVITIES Additions to: Property and equipment 3, 14 (3,445,657) (4,598,589) Intangible assets 4, 14 (14,218) (59,170) Proceeds from sale of property and equipment 27,207 19,295 Decrease (increase) in: Short-term investments – (15) Other noncurrent assets (146,179) 123,745 Interest received 96,003 31,658 Dividends received 16 – Net cash flows used in investing activities (3,482,828) (4,483,076)
(Forward)

- 2 -
Three Months Ended
March 31 Notes 2011 2010 (In Thousand Pesos)
CASH FLOWS FROM FINANCING ACTIVITIES Proceeds from borrowings: 5 Long-term P=3,800,000 P=2,822,042 Short-term – 1,000,000 Repayments of borrowings: 5 Long-term (3,623,809) (2,664,450) Short-term – (500,415) Payments of dividends to stockholders: 6 Common (4,102,802) (5,293,926) Preferred (45,399) (50,492) Collection of subscriptions receivable and exercise of
stock options – 3,819 Interest paid (653,170) (603,460) Net cash flows used in financing activities (4,625,180) (5,286,882)
NET INCREASE (DECREASE) IN CASH AND CASH EQUIVALENTS
1,416,140 (1,975,287)
NET FOREIGN EXCHANGE DIFFERENCE
(6,341) (23,793)
CASH AND CASH EQUIVALENTS AT BEGINNING OF THE PERIOD
5,868,986 5,939,927
CASH AND CASH EQUIVALENTS AT END OF THE PERIOD P=7,278,785 P=3,940,847
See accompanying Notes to Condensed Consolidated Financial Statements.

GLOBE TELECOM, INC. AND SUBSIDIARIES NOTES TO CONDENSED CONSOLIDATED FINANCIAL STATEMENTS 1. Basis of Financial Statement Preparation
The accompanying condensed consolidated financial statements have been prepared in accordance with Philippine Accounting Standard (PAS) 34, Interim Financial Reporting. Accordingly, the condensed consolidated financial statements do not include all of the information required in the December 31, 2011 annual audited financial statements.
The preparation of the financial statements in compliance with Philippine Financial Reporting Standards (PFRS) requires management to make estimates and assumptions that affect the amounts reported in the financial statements and accompanying notes. The estimates and assumptions used in the accompanying condensed consolidated financial statements are based upon management’s evaluation of relevant facts and circumstances as of the date of the condensed consolidated financial statements. Actual results could differ from such estimates.
The condensed consolidated financial statements include the accounts of Globe Telecom, Inc. (herein referred to as “Globe Telecom” or “Globe”) and its wholly owned subsidiaries Innove Communications, Inc. (herein referred to as “Innove”), G-Xchange, Inc. (herein referred to as “GXI”), Entertainment Gateway Group Corp. (EGGC) and EGGstreme (Hong Kong) Limited (EHL) (collectively referred here as “EGG Group”) and GTI Business Holdings, Inc. (GTI), collectively referred to as “Globe Group”. In July 2009, GTI incorporated its wholly owned subsidiary, GTI Corporation (GTIC), a company organized under the General Corporation Law of the State of Delaware for the purpose of engaging in any lawful act or activity for which corporations may be organized under the Delaware General Corporation Law. GTIC has started commercial operations on April 1, 2011.
The condensed consolidated financial statements are presented in Philippine Peso (PHP), the Group’s functional currency, and rounded to the nearest thousands except when otherwise indicated.
On May 10, 2011, the Board of Directors (BOD) approved and authorized the release of the condensed consolidated financial statements of Globe Telecom, Inc. and Subsidiaries as of March 31, 2011 and 2010 (unaudited) and December 31, 2010 (audited).
2. Accounting Policies
2.1 Changes in Accounting Policies The accounting policies adopted are consistent with those of the previous financial year except for the adoption of the following new and amended PFRS and Philippine Interpretations of International Financial Reporting Interpretations Committee (IFRIC) which became effective January 1, 2011. Except as otherwise indicated, the adoption of the new and amended Standards and Interpretations did not have significant impact on the condensed consolidated financial statements.

- 2 -
• Amendment to PAS 24, Related Party Disclosures This Amendment is effective for annual periods beginning on or after January 1, 2011.
It clarifies the definition of a related party to simplify the identification of such relationships and to eliminate inconsistencies in its application. The revised standard introduces a partial exemption of disclosure requirements for government-related entities. Early adoption is permitted for either the partial exemption for government-related entities or for the entire standard.
• Amendment to PAS 32, Financial Instruments: Presentation - Classification of Rights
Issues This Amendment is effective for annual periods beginning on or after February 1, 2010. It amended the definition of a financial liability in order to classify rights issues (and certain options or warrants) as equity instruments in cases where such rights are given pro rata to all of the existing owners of the same class of an entity’s non-derivative equity instruments, or to acquire a fixed number of the entity’s own equity instruments for a fixed amount in any currency.
• Amendments to Philippine Interpretation IFRIC 14, Prepayments of a Minimum Funding Requirement This Amendment is effective for annual periods beginning on or after January 1, 2011, with retrospective application. It provides guidance on assessing the recoverable amount of a net pension asset. The Amendment permits an entity to treat the prepayment of a minimum funding requirement as an asset.
• Philippine Interpretation IFRIC 19, Extinguishing Financial Liabilities with Equity
Instruments This Interpretation is effective for annual periods beginning on or after July 1, 2010. It clarified that equity instruments issued to a creditor to extinguish a financial liability qualify as consideration paid. The equity instruments issued are measured at their fair value. In case that this cannot be reliably measured, the instruments are measured at the fair value of the liability extinguished. Any gain or loss is recognized immediately in profit or loss.
2.2 Improvements to PFRSs
The omnibus amendments to PFRSs issued in May 2010 were issued primarily with a view to removing inconsistencies and clarifying wordings. There were separate transitional provisions for each standard and became effective January 1, 2011. Except as otherwise stated, the adoption of these new and amended standards did not have significant impact on the condensed consolidated financial statements.
• PFRS 3, Business Combinations (Revised)
This Amendment clarifies that the Amendments to PFRS 7, Financial Instruments: Disclosures, PAS 32 and PAS 39 that eliminate the exemption for contingent consideration, do not apply to contingent consideration that arose from business combinations whose acquisition dates precede the application of PFRS 3 (as revised in 2008).

- 3 -
It also limits the scope of the measurement choices that only the components of NCI that are present ownership interests that entitle their holders to a proportionate share of the entity’s net assets, in the event of liquidation, shall be measured either at fair value or at the present ownership instruments’ proportionate share of the acquiree’s identifiable net assets. Other components of NCI are measured at their acquisition date fair value, unless another measurement basis is required by another PFRS.
The Amendment also requires an entity (in a business combination) to account for the replacement of the acquiree’s share-based payment transactions (whether obliged or voluntarily), i.e., split between consideration and post combination expenses. However, if the entity replaces the acquiree’s awards that expire as a consequence of the business combination, these are recognized as post-combination expenses. It further specifies the accounting for share-based payment transactions that the acquirer does not exchange for its own awards: if vested - they are part of NCI and measured at their marked-based measure; if unvested - they are measured at market-based value as if granted at acquisition date, and allocated between NCI and post-combination expense.
• PFRS 7, Financial Instruments: Disclosures This Amendment emphasizes the interaction between quantitative and qualitative disclosures and the nature and extent of risks associated with financial instruments.
The Amendments to quantitative and credit risk disclosures are as follows: a) Clarify those only financial assets whose carrying amount does not reflect the
maximum exposure to credit risk need to provide further disclosure of the amount that represents the maximum exposure to such risk.
b) Requires, for all financial assets, disclosure of the financial effect of collateral held as security and other credit enhancements regarding the amount that best represents the maximum exposure to credit risk (e.g., a description of the extent to which collateral mitigates credit risk).
c) Remove disclosure of the collateral held as security, other credit enhancements and an estimate of their fair value for financial assets that are past due but not impaired, and financial assets that are individually determined to be impaired.
d) Remove the requirement to specifically disclose financial assets renegotiated to avoid becoming past due or impaired.
e) Clarify that the additional disclosure required for financial assets obtained by taking possession of collateral or other credit enhancements are only applicable to assets still held at the reporting date.
• PAS 1, Presentation of Financial Statements
This Amendment clarifies that an entity will present an analysis of other comprehensive income for each component of equity, either in the statement of changes in equity or in the notes to the financial statements.
• PAS 27, Consolidated and Separate Financial Statements
This Amendment clarifies that the consequential amendments from PAS 27 made to PAS 21, The Effect of Changes in Foreign Exchange Rates, PAS 28, Investments in Associates and PAS 31, Interests in Joint Ventures, apply prospectively for annual periods beginning on or after July 1, 2009 or earlier when PAS 27 is applied earlier.

- 4 -
• PAS 34, Interim Financial Reporting This Amendment provides guidance to illustrate how to apply disclosure principles in PAS 34 and add disclosure requirements around: a) The circumstances likely to affect fair values of financial instruments and their
classification; b) Transfers of financial instruments between different levels of the fair value hierarchy; c) Changes in classification of financial assets; d) Changes in contingent liabilities and assets.
• Philippine Interpretation IFRIC 13, Customer Loyalty Programmes This Amendment clarifies that when the fair value of award credits is measured based on the value of the awards for which they could be redeemed, the amount of discounts or incentives otherwise granted to customers not participating in the award credit scheme, is to be taken into account.
3. Property and Equipment
In the first quarter of 2011, the Globe Group changed the Estimated Useful Life (EUL) of certain wireless and wireline telecommunications equipment resulting from new information affecting the expected utilization of these assets. The net effect of the change in EUL resulted in higher depreciation and amortization expense of P=99.77 million for the period ended March 31, 2011.
The rollforward analysis of property and equipment follows:
March 31, 2011
Telecommunications
Equipment
Buildings and Leasehold
Improvements Investments in Cable Systems
Office Equipment
Transportation Equipment Land
Assets Under Construction Total
(Unaudited and In Thousand Pesos) Cost At January 1 P=174,098,824 P=25,544,667 P=13,028,303 P=6,388,566 P=2,153,222 P=1,514,332 P=16,427,560 P=239,155,474 Additions 1,053,583 18,735 – 43,472 69,794 9,031 4,256,753 5,451,368 Retirements/disposals (126,227) (122) (13,886) (33,701) (24,514) – (309) (198,759) Reclassifications/adjustments 4,897,825 914,353 (34,986) 250,129 3,769 – (6,677,071) (645,981) At March 31 179,924,005 26,477,633 12,979,431 6,648,466 2,202,271 1,523,363 14,006,933 243,762,102 Accumulated Depreciation,
Amortization and Impairment Losses
At January 1 113,486,718 11,955,511 4,736,035 5,642,866 1,497,090 – – 137,318,220 Depreciation and amortization 3,433,774 271,459 208,020 126,728 61,982 – – 4,101,963 Retirements/disposals (124,662) (116) (13,886) (33,698) (18,773) – – (191,135) At March 31 116,795,830 12,226,854 4,930,169 5,735,896 1,540,299 – – 141,229,048 Net Book Value at March 31 P=63,128,175 P=14,250,779 P=8,049,262 P=912,570 P=661,972 P=1,523,363 P=14,006,933 P=102,533,054
March 31, 2010
Telecommunications
Equipment
Buildings and Leasehold
Improvements Investments in Cable Systems Office Equipment
Transportation Equipment Land
Assets Under Construction Total
(Unaudited and In Thousand Pesos) Cost At January 1 P=161,393,653 P=24,088,931 P=14,444,009 P=6,049,431 P=2,074,149 P=1,551,558 P=14,025,661 P=223,627,392 Additions 615,664 168,739 – 61,498 67,795 – 4,596,752 5,510,448 Retirements/disposals (32,188) (14,234) – (4,269) (39,425) – (1,818) (91,934) Reclassifications/adjustments 3,243,034 208,049 110,003 15,675 (3,321) 63 (4,036,638) (463,135) At March 31 165,220,163 24,451,485 14,554,012 6,122,335 2,099,198 1,551,621 14,583,957 228,582,771 Accumulated Depreciation,
Amortization and Impairment Losses
At January 1 99,668,498 11,009,763 4,758,210 5,065,820 1,431,233 – – 121,933,524 Depreciation and amortization 3,443,162 253,610 185,054 118,248 60,771 – – 4,060,845 Retirements/disposals (23,938) (13,416) – (4,181) (36,141) – – (77,676) Reclassifications/adjustments (215,417) (74,998) – (525) – – – (290,940) At March 31 102,872,305 11,174,959 4,943,264 5,179,362 1,455,863 – – 125,625,753 Net Book Value at March 31 P=62,347,858 P=13,276,526 P=9,610,748 P=942,973 P=643,335 P=1,551,621 P=14,583,957 P=102,957,018

- 5 -
December 31, 2010
Telecommunications
Equipment
Buildings and Leasehold
Improvements Investments in Cable Systems
Office Equipment
Transportation Equipment Land
Assets Under Construction Total
(Audited and In Thousand Pesos) Cost At January 1 P=161,393,653 P=24,088,931 P=14,444,009 P=6,049,431 P=2,074,149 P=1,551,558 P=14,025,661 P=223,627,392 Additions 1,071,562 185,264 – 228,646 305,186 504 17,506,382 19,297,544 Retirements/disposals (408,040) (29,092) – (87,113) (237,996) (14,025) (4,162) (780,428) Reclassifications/adjustments 12,041,649 1,299,564 (1,415,706) 197,602 11,883 (23,705) (15,100,321) (2,989,034) At December 31 174,098,824 25,544,667 13,028,303 6,388,566 2,153,222 1,514,332 16,427,560 239,155,474 Accumulated Depreciation,
Amortization and Impairment Losses
At January 1 99,668,498 11,009,763 4,758,210 5,065,820 1,431,233 – – 121,933,524 Depreciation and amortization 14,403,724 1,054,839 899,440 693,641 265,153 – – 17,316,797 Retirements/disposals (585,504) (109,091) (921,615) (116,595) (199,296) – – (1,932,101) At December 31 113,486,718 11,955,511 4,736,035 5,642,866 1,497,090 – – 137,318,220 Net Book Value at December 31 P=60,612,106 P=13,589,156 P=8,292,268 P=745,700 P=656,132 P=1,514,332 P=16,427,560 P=101,837,254
Assets under construction include intangible components of a network system which are reclassified to depreciable intangible assets only when assets become available for use (see Note 4).
The Globe Group uses its borrowed funds to finance the acquisition of property and equipment and bring it to its intended location and working condition. Borrowing costs incurred relating to these acquisitions were included in the cost of property and equipment using 3.21%, 4.94% and 5.61% capitalization rates for the periods ended March 31, 2011 and 2010 and for the year ended December 31, 2010, respectively. The Globe Group’s total capitalized borrowing costs are P=175.36 million, P=275.00 million and P=1,091.21 million as of March 31, 2011 and 2010, and December 31, 2010, respectively.
4. Intangible Assets and Goodwill
The rollforward analysis of intangible assets and goodwill follows:
March 31, 2011
Licenses and Application
Software Customer Contracts
Total Intangible
Assets Goodwill
Total Intangible Assets and
Goodwill (Unaudited and In Thousand Pesos) Cost At January 1 P=8,356,789 P=28,381 P=8,385,170 P=327,125 P=8,712,295 Additions 14,218 – 14,218 – 14,218 Reclassifications/
adjustments (Note 3) 597,972
–
597,972
– 597,972 At March 31 8,968,979 28,381 8,997,360 327,125 9,324,485 Amortization and Impairment Losses
January 1 5,449,729 14,190 5,463,919 – 5,463,919 Amortization 238,319 1,419 239,738 – 239,738 At March 31 5,688,048 15,609 5,703,657 – 5,703,657 Net Book Value at March 31 P=3,280,931 P=12,772 P=3,293,703 P=327,125 P=3,620,828

- 6 -
March 31, 2010
Licenses and Application
Software Customer Contracts
Total Intangible
Assets Goodwill
Total Intangible
Assets and Goodwill
(Unaudited and In Thousand Pesos) Cost At January 1 P=7,431,159 P=28,381 P=7,459,540 P=327,125 P=7,786,665Additions 59,170 – 59,170 – 59,170Retirements/disposals (21,209) – (21,209) – (21,209)Reclassifications/
adjustments (Note 3) 147,740 – 147,740 – 147,740At March 31 7,616,860 28,381 7,645,241 327,125 7,972,366Amortization and Impairment Losses
At January 1 4,795,295 8,514 4,803,809 – 4,803,809Amortization 170,341 1,419 171,760 – 171,760Retirements/disposals (21,209) – (21,209) – (21,209)Reclassifications/adjustments (20) – (20) – (20)At March 31 4,944,407 9,933 4,954,340 – 4,954,340Net Book Value at March 31 P=2,672,453 P=18,448 P=2,690,901 P=327,125 P=3,018,026
December 31, 2010
Licenses and Application
Software Customer Contracts
Total Intangible
Assets Goodwill
Total Intangible
Assets and Goodwill
(Audited and In Thousand Pesos) Cost At January 1 P=7,431,159 P=28,381 P=7,459,540 P=327,125 P=7,786,665Additions 169,329 – 169,329 – 169,329Retirements/disposals (128,606) – (128,606) – (128,606)Reclassifications/
adjustments (Note 3) 884,907 – 884,907 – 884,907At December 31 8,356,789 28,381 8,385,170 327,125 8,712,295Amortization and Impairment Losses
At January 1 4,795,295 8,514 4,803,809 – 4,803,809Amortization 740,819 5,676 746,495 – 746,495Retirements/disposals (120,561) – (120,561) – (120,561)Reclassifications/adjustments 34,176 – 34,176 – 34,176At December 31 5,449,729 14,190 5,463,919 – 5,463,919Net Book Value at December 31 P=2,907,060 P=14,191 P=2,921,251 P=327,125 P=3,248,376
Intangible assets pertain to 1) telecommunications equipment software licenses, corporate application software and licenses and other VAS software applications that are not integral to the hardware or equipment; and 2) intangible assets identified to exist during acquisition of EGG Group for its existing customer contracts.

- 7 -
5. Notes Payable and Long-term Debt
Notes payable consist of short-term promissory notes from local banks for working capital requirement amounting to P=2,500.42 million as of March 31, 2010. These notes bear interest ranging from 4.10% to 10.00% per annum in 2010. There are no notes payables outstanding as of March 31, 2011 and December 31, 2010. Long-term debt consists of:
March 31 December 31
2011
(Unaudited) 2010
(Unaudited) 2010
(Audited) (In Thousand Pesos) Banks: Local P=24,054,259 P=15,827,018 P=20,352,194 Foreign 6,558,945 6,961,505 7,317,483 Corporate notes 14,935,177 17,741,731 17,729,939 Retail bonds 4,975,290 4,960,341 4,971,854 50,523,671 45,490,595 50,371,470 Less current portion 15,184,339 3,748,871 8,677,209 P=35,339,332 P=41,741,724 P=41,694,261
The maturities of long-term debt at nominal values including unamortized debt issuance costs as of March 31, 2011 follow (in thousand pesos):
Due in: 2011 P=7,897,719 2012 9,598,806 2013 9,764,334 2014 9,754,448 2015 and thereafter 13,774,334 P=50,789,641
Unamortized debt issuance costs included in the above long-term debt as of March 31, 2011 and 2010, and December 31, 2010 amounted to P=265.97 million, P=203.21 million, and P=279.24 million, respectively.
The interest rates and maturities of the above loans are as follows:
Maturities Interest Rates Banks: Local 2011-2018 1.90% to 7.03% in 2011
2.26% to 7.03% in 2010
Foreign 2011-2016 0.74% to 3.86% in 2011
0.74% to 4.13% in 2010
(Forward)

- 8 -
Maturities Interest Rates Corporate notes 2011-2016 2.67% to 8.38% in 2011
2.67% to 8.38% in 2010
Retail bonds 2012-2014 7.50% to 8.00% in 2011
7.50% to 8.00% in 2010
5.1 Bank Loans and Corporate Notes Globe Telecom’s unsecured bank loans and corporate notes, which consist of fixed and floating rate notes and peso-denominated bank loans, bear interest at stipulated and prevailing market rates.
The loan agreements with banks and other financial institutions provide for certain restrictions and requirements with respect to, among others, maintenance of financial ratios and percentage of ownership of specific shareholders, incurrence of additional long-term indebtedness or guarantees and creation of property encumbrances.
As of May 10, 2011, the Globe Group is not in breach of any loan covenants.
5.2 Retail Bonds
On February 25, 2009, Globe Group issued P=5,000.00 million fixed rate bonds. This amount comprises P=1,974.00 million and P=3,026.00 million fixed rate bonds due in 2012 and 2014, respectively, with interest rate of 7.50% and 8.00%, respectively. The proceeds of the retail bonds were used to fund Globe Group’s various capital expenditures. The five-year retail bonds may be redeemed in whole, but not in part, on the twelfth (12th) interest payment date at a price equal to 102.00% of the principal amount of the bonds and all accrued interest to the date of redemption. Globe Group may not redeem the retail bonds unless allowed under conditions specified in the agreements with respect to redemption for tax reasons, purchase and cancellation and change in law or circumstance.
The Globe Group has to meet certain bond covenants including a maximum debt-to-equity ratio of 2 to 1. As of May 10, 2011, the Globe Group is not in breach of any bond covenants.
6. Equity and Other Comprehensive Income
6.1 Cash Dividends Information on Globe Group’s BOD declaration of cash dividends follows:
Date Per share Amount Record Payable (In Thousand Pesos, Except Per Share Figures) Preferred stock dividends declared on:
February 8, 2011 00.29 P=45,399 February 22, 2011 March 18, 2011 Common stock dividends declared on:
February 4, 2010 40.00 P=5,293,926 February 19, 2010 March 15, 2010 August 3, 2010 40.00 5,293,939 August 17, 2010 September 13, 2010 February 8, 2011 31.00 4,102,802 February 22, 2011 March 18, 2011

- 9 -
6.2 Retained Earnings Available for Dividend Declaration The retained earnings include the undistributed net earnings of consolidated subsidiaries and the accumulated equity in net earnings of joint ventures accounted for under the equity method totaling P=6,967.46 million as of March 31, 2011. This amount is not available for dividend declaration until received in the form of dividends from subsidiaries and joint ventures. The Globe Group is also subject to loan covenants that restrict its ability to pay dividends.
6.3 Other Comprehensive Income
Other Reserves
Cash flow hedges
Available-for- sale financial
assets
Exchange differences arising
from translations of foreign investments Total
For the Period Ended March 31, 2011 (Unaudited and In Thousand Pesos) As of January 1 (P=115,834) P=35,032 (P=7,508) (P=88,310)Fair value changes 269,055 1,342 – 270,397Transferred to income and
expenses 52,469 – – 52,469Tax effect of items taken directly
to or transferred from equity (96,458) – – (96,458)Exchange differences – – (611) (611)As of March 31, 2011 P=109,232 P=36,374 (P=8,119) P=137,487
Cash flow hedges
Available-for- sale financial
assets
Exchange differences arising
from translations of foreign investments Total
For the Period Ended March 31, 2010 (Unaudited and In Thousand Pesos)
As of January 1 (P=22,554) P=14,882 P=26,190 P=18,518Fair value changes 28,095 7,845 – 35,940Transferred to income and
expenses 8,108 – – 8,108Tax effect of items taken directly
to or transferred from equity (10,861) – – (10,861)Exchange differences – – (2,396) (2,396)As of March 31, 2010 P=2,788 P=22,727 P=23,794 P=49,309
For the Year Ended December 31, 2010 (Audited and In Thousand Pesos)
As of January 1 (P=22,554) P=14,882 P=26,190 P=18,518Fair value changes (116,679) 20,150 – (96,529)Transferred to income and
expenses (16,578) – – (16,578)Tax effect of items taken directly
to or transferred from equity 39,977 – – 39,977Exchange differences – – (33,698) (33,698)As of December 31, 2010 (P=115,834) P=35,032 (P=7,508) (P=88,310)

- 10 -
7. Costs and Expenses
7.1. General, selling and administrative expenses consist of:
Three Months Ended March 31 2011 2010
(Unaudited and In Thousand Pesos) Staff costs P=1,411,482 P=1,336,630 Selling, advertising and promotions 1,001,436 715,356 Professional and other contracted services 882,748 727,678 Utilities, supplies and other administrative
expenses
866,366 725,406 Repairs and maintenance 721,162 742,752 Rent 627,510 715,239 Taxes and licenses 382,141 251,832 Insurance and security services 361,393 422,891 Others 380,980 398,112 P=6,635,218 P=6,035,896
The “Others” account includes miscellaneous expenses, delivery charges and various other items that are individually immaterial.
7.2 Impairment losses and others consist of:
Three Months Ended March 31 2011 2010
(Unaudited and In Thousand Pesos) Impairment loss on: Receivables P=298,683 P=282,181 Property and equipment 77,301 36,337 Provisions for: Inventory obsolescence and market decline
68,836 20,829
Other probable losses 2,096 60,965 P=446,916 P=400,312
7.3 Financing costs consist of:
Three Months Ended March 31 2011 2010
(Unaudited and In Thousand Pesos)Interest expense* P=522,205 P=458,045 Swap and other financing costs - net 50,820 11,728 Loss (gain) on derivative instruments (10,280) 8,553 P=562,745 P=478,326
*This account is net of capitalized expense and inclusive of amortization of debt issuance costs.
In 2011, the net foreign exchange gain amounting to P=32.61 million was presented as part of the “Others - net” account in the condensed consolidated statements of comprehensive income.

- 11 -
Interest expense is incurred on the following:
Three Months Ended March 31 2011 2010
(Unaudited and In Thousand Pesos)Long-term debt P=478,409 P=388,571 Accretion expense 43,796 45,761 Short-term payable – 23,713 P=522,205 P=458,045
8. Contingencies
The Globe Group is contingently liable for various claims arising in the ordinary conduct of business and certain tax assessments which are either pending decision by the courts or are being contested, the outcome of which are not presently determinable. In the opinion of management and legal counsel, the eventual liability under these claims, if any, will not have a material or adverse effect on the Globe Group’s financial position and results of operations.
9. Agreements and Commitments
9.1 Construction Maintenance Agreement for South-East Asia Japan Cable System (SJC)
On April 12, 2011, the Global consortium of telecommunication companies formed to build and operate the South-East Asia Japan Cable (SJC) system officially start the construction of the project that will link Brunei, China Mainland, Hong Kong, Philippines, Japan, and Singapore with options to extend to Indonesia and Thailand. The SJC consortium composed of Globe Telecom and 10 other international carriers to construct the SJC system. Globe Telecom’s estimated investment for this project amounts to USD60.00 million as of March 31, 2011.
9.2 Capital Infusion to GTI
In March 2011, following the approval of the BOD, Globe Telecom made the additional capital infusion to GTI (this is GTI Business Holdings) through transfer of assets and GTI recorded the assets at its fair value amount of P=387.32 million increasing its total paid-up capital to P=412.32 million as of March 31, 2011. This has no impact on the consolidated financial statements.
9.3 Agreement with Singapore Telecom, Inc.
In 2009, Singapore Telecom, Inc. (STI) agreed to sell to Globe Telecom its own capacity in a certain cable system. In 2009 also, Globe Telecom agreed to sell to STI capacities that it owns in a certain cable system. In March 2011, the final agreements were executed between Globe Telecom and Singapore Telecom, Inc. (STI) whereby Globe Telecom conveyed and transferred ownership of certain Indefeasible Rights of Use (IRU) of certain international cables systems in exchange for IRUs of certain cables systems of STI. The exchange assets recorded at its fair value amounting to P=120.19 million.

- 12 -
10. Earnings Per Share Globe Group’s earnings per share amounts were computed as follows:
Three Months Ended March 31 2011 2010
(Unaudited and In Thousand Pesos)Net income attributable to common shareholders for basic earnings per share P=2,982,949 P=2,934,578 Add dividends on preferred shares 8,464 11,926 Net income attributable to common shareholders for diluted earnings per share 2,991,413 2,946,504 Weighted average number of shares for basic earnings per share 132,348 132,343Dilutive shares arising from: Convertible preferred shares 1,002 824 Stock options 16 82 Adjusted weighted average number of common stock for diluted earnings per share 133,366 133,249Basic earnings per share P=22.54 P=22.17Diluted earnings per share P=22.43 P=22.11
11. Assets Classified as Held for Sale and Liabilities Directly Associated with the Assets
Classified as Held for Sale
On November 17, 2009, Globe Telecom and Pacnet Cable Ltd. (Pacnet), formerly C2C, signed a memorandum of agreement (MOA) to terminate and unwind their Landing Party Agreement dated August 15, 2000 (LPA). The MOA further requires Globe Telecom, being duly licensed and authorized by the NTC to land the C2C Cable Network in the Philippines and operate the C2C Cable Landing Station (CLS) in Nasugbu, Batangas, Philippines, to transfer to Pacnet’s designated qualified partner, the license of the C2C CLS, the CLS, a portion of the property on which the CLS is situated, certain equipment and associated facilities thereof.
In return, Pacnet will compensate Globe Telecom in cash and by way of C2C cable capacities deliverable upon completion of certain closing conditions. The MOA also provided for novation of above mentioned equipment supply and lease agreements and reciprocal options for Globe Telecom to purchase future capacities from Pacnet and Pacnet to purchase backhaul and ducts from Globe Telecom at agreed prices.
In the second quarter of 2010, the specific equipment, portion of the property and facilities and the liabilities associated with the transfer were identified and were classified as current and shown separately in the consolidated statement of financial position as “Assets classified as held for sale” and “Liabilities directly associated with the assets classified as held for sale”.
As of March 31, 2011, assets classified as held for sale amounted to P=778.32 million. Liabilities directly associated with assets classified as held for sale amounted to P=670.49 million. The closing documents are expected to be fully executed within the year 2011.

- 13 -
12. Capital and Risk Management and Financial Instruments
12.1 General The Globe Group adopts an expanded corporate governance approach in managing its business risks. An Enterprise Risk Management Policy was developed to systematically view the risks and to provide a better understanding of the different risks that could threaten the achievement of the Globe Group’s mission, vision, strategies, and goals, and to provide emphasis on how management and employees play a vital role in achieving the Globe Group’s mission of transforming and enriching lives through communications.
The policies are not intended to eliminate risk but to manage it in such a way that opportunities to create value for the stakeholders are achieved. Globe Group risk management takes place in the context of the normal business processes such as strategic planning, business planning, operational and support processes.
The application of these policies is the responsibility of the BOD through the Chief Executive Officer. The Chief Financial Officer and concurrent Chief Risk Officer champions and oversees the entire risk management function. Risk owners have been identified for each risk and they are responsible for coordinating and continuously improving risk strategies, processes and measures on an enterprise-wide basis in accordance with established business objectives.
The risks are managed through the delegation of management and financial authority and individual accountability as documented in employment contracts, consultancy contracts, letters of authority, letters of appointment, performance planning and evaluation forms, key result areas, terms of reference and other policies that provide guidelines for managing specific risks arising from the Globe Group’s business operations and environment.
The Globe Group continues to monitor and manage its financial risk exposures according to its BOD approved policies.
The succeeding discussion focuses on Globe Group’s capital and financial risk management.
12.2 Capital and Financial Risk Management Objectives and Policies The primary objective of the Globe Group’s capital management is to ensure that it maintains a strong credit rating and healthy capital ratios in order to support its business and maximize shareholder value.
The Globe Group monitors its use of capital using leverage ratios, such as debt to total capitalization and makes adjustments to it in light of changes in economic conditions and its financial position.
The Globe Group is not subject to externally imposed capital requirements. The ratio of debt to total capitalization as of March 31, 2011 and 2010, and December 31, 2010 was at 52%, 51% and 52%, respectively.
The main purpose of the Globe Group’s financial risk management is to fund its operations and capital expenditures. The risks arising from the use of financial instruments are market risk, credit risk and liquidity risk. Globe Telecom also enters into derivative transactions, the purpose of which is to manage the currency and interest rate risk arising from its financial instruments.

- 14 -
Globe Telecom’s BOD reviews and approves the policies for managing each of these risks. The Globe Group monitors market price risk arising from all financial instruments and regularly reports financial management activities and the results of these activities to the BOD.
The Globe Group’s risk management policies are summarized below:
12.2.1 Market Risk
Market risk is the risk that the fair value of future cash flows of a financial instrument will fluctuate because of changes in market prices. Globe Group is mainly exposed to two types of market risk: interest rate risk and currency risk. Financial instruments affected by market risk include loans and borrowings, AFS investments, and derivative financial instruments.
The sensitivity analyses in the following sections relate to the position as of March 31, 2011 and 2010, and December 31, 2010. The analyses exclude the impact of movements in market variables on the carrying value of pension, provisions and on the non-financial assets and liabilities of foreign operations.
The following assumptions have been made in calculating the sensitivity analyses:
• The statement of financial position sensitivity relates to derivatives. • The sensitivity of the relevant income statement item is the effect of the assumed
changes in respective market risks. This is based on the financial assets and financial liabilities held as at March 31, 2011 and 2010, and December 31, 2010 including the effect of hedge accounting.
• The sensitivity of equity is calculated by considering the effect of any associated cash flow hedges for the effects of the assumed changes in the underlying.
12.2.1.1 Interest Rate Risk
The Globe Group’s exposure to market risk from changes in interest rates relates primarily to the Globe Group’s long-term debt obligations. Please refer to table presented under 12.2.3 Liquidity Risk.
Globe Group’s policy is to manage its interest cost using a mix of fixed and variable rate debt, targeting a ratio of between 31-62% fixed rate USD debt to total USD debt, and between 44-88% fixed rate PHP debt to total PHP debt. To manage this mix in a cost-efficient manner, Globe Group enters into interest rate swaps, in which Globe Group agrees to exchange, at specified intervals, the difference between fixed and variable interest amounts calculated by reference to an agreed-upon notional principal amount.
After taking into account the effect of currency and interest rate swaps, 45% and 68%, 32% and 56%, and 32% and 65% of the Globe Group’s USD and PHP borrowings as of March 31, 2011 and 2010, and December 31, 2010, respectively, are at a fixed rate of interest.
The following tables demonstrate the sensitivity of income before tax to a reasonably possible change in interest rates after the impact of hedge accounting, with all other variables held constant.

- 15 -
March 31, 2011
Increase/decrease
in basis points
Effect on income before income tax
Increase (decrease) Effect on equity
Increase (decrease) (Unaudited and In Thousand Pesos) USD +35bps (P=4,602) P=11,316 -35bps 4,606 (11,304) PHP +100bps (33,931) 175,142 -100bps 33,903 (182,171)
March 31, 2010
Increase/decrease
in basis points
Effect on income before income tax Increase (decrease)
Effect on equity Increase (decrease)
(Unaudited and In Thousand Pesos) USD +200bps (P=28,363) P=45,205 -200bps 22,739 (16,615) PHP +100bps (30,062) (4,453) -100bps 30,002 4,453
December 31, 2010
Increase/decrease
in basis points
Effect on income before income tax Increase (decrease)
Effect on equity Increase (decrease)
(Audited and In Thousand Pesos) USD +35bps (P=14,607) P=7,086 -35bps 14,622 (7,009) PHP +100bps (134,008) 153,121 -100bps 133,980 (160,664)
The reason for the decrease in the basis points for USD sensitivity is due to the continued decrease in LIBOR rate. The basis used is the difference between the current short term USD rates and the projected USD rates at year end using the forward curve.
12.2.1.2 Foreign Exchange Risk
The Globe Group’s foreign exchange risk results primarily from movements of the PHP against the USD with respect to USD-denominated financial assets, USD-denominated financial liabilities and certain USD-denominated revenues. Majority of revenues are generated in PHP, while substantially all of capital expenditures are in USD. In addition, 13%, 15% and 15%, of debt as of March 31, 2011 and 2010, and December 31, 2010, respectively, are denominated in USD before taking into account any swap and hedges.

- 16 -
Information on the Globe Group’s foreign currency-denominated monetary assets and liabilities and their PHP equivalents are as follows:
March 31 December 31
2011
(Unaudited) 2010
(Unaudited) 2010
(Audited)
US
Dollar Peso
Equivalent US
Dollar Peso
Equivalent US
Dollar Peso
Equivalent (In Thousands) Assets Cash and cash equivalents $31,960 P=1,386,813 $23,137 P=1,047,915 $41,573 P=1,821,337 Receivables 58,101 2,522,055 53,506 2,423,354 58,257 2,552,308 90,061 3,908,868 76,643 3,471,269 99,830 4,373,645 Liabilities Accounts payable and accrued
expenses 230,299 9,996,802 173,614 7,863,173 197,586 8,656,460 Long-term debt 153,798 6,676,042 155,022 7,021,111 170,011 7,448,357 384,097 16,672,844 328,636 14,884,284 367,597 16,104,817 Net foreign currency-
denominated liabilities $294,036 P=12,763,976 $251,993 P=11,413,015 $267,767 P=11,731,172 *This table excludes derivative transactions disclosed in Note 12.3
The following tables demonstrate the sensitivity to a reasonably possible change in the PHP to USD exchange rate, with all other variables held constant, of the Globe Group’s income before tax (due to changes in the fair value of financial assets and liabilities).
March 31, 2011
Increase/decrease
in Peso to US Dollar exchange rate
Effect on income before income tax
Increase (decrease) Effect on equity
Increase (decrease) (Unaudited and In Thousand Pesos)
+.40 (P=116,323) (P=14,480) -.40 116,323 14,480
March 31, 2010
Increase/decrease
in Peso to US Dollar exchange rate
Effect on income before income tax
Increase (decrease) Effect on equity
Increase (decrease) (Unaudited and In Thousand Pesos)
+.40 (P=99,759) (P=9,738) -.40 99,759 9,738
December 31, 2010
Increase/decrease in Peso to
US Dollar exchange rate
Effect on income before income tax
Increase (decrease) Effect on equity
Increase (decrease) (Audited and In Thousand Pesos)
+.40 (P=106,051) (P=14,181) -.40 106,051 14,181
The movement on the post-tax effect is a result of a change in the fair value of derivative financial instruments not designated in a hedging relationship and monetary assets and liabilities denominated in US dollars, where the functional currency of the Group is Philippine Peso. Although the derivatives have not been designated in a hedge

- 17 -
relationship, they act as a commercial hedge and will offset the underlying transactions when they occur.
The movement on equity arises from changes in the fair value of derivative financial instruments designated as cash flow hedges.
In addition, the consolidated expected future payments on foreign currency-denominated purchase orders related to capital projects amounted to USD263.69 million, USD280.02 million and USD274.51 million as of March 31, 2011 and 2010, and December 31, 2010, respectively. The settlement of these liabilities is dependent on the achievement of project milestones and payment terms agreed with the suppliers and contractors. On March 31, 2011 and 2010, and December 31, 2010, foreign exchange exposure assuming a +/-40 centavos, +/- 40 centavos and +/- 40 centavos movement in PHP to USD rate on commitments amounted to P=105.47 million, P=112.00 million and P=109.80 million gain or loss, respectively.
The Globe Group’s foreign exchange risk management policy is to maintain a hedged financial position, after taking into account expected USD flows from operations and financing transactions. Globe Telecom enters into short-term foreign currency forwards and long-term foreign currency swap contracts in order to achieve this target.
12.2.2 Credit Risk
Applications for postpaid service are subjected to standard credit evaluation and verification procedures. The Globe Group continuously reviews credit policies and processes and implements various credit actions, depending on assessed risks, to minimize credit exposure. Receivable balances of postpaid subscribers are being monitored on a regular basis and appropriate credit treatments are applied at various stages of delinquency. Likewise, net receivable balances from carriers of traffic are also being monitored and subjected to appropriate actions to manage credit risk. The maximum credit exposure relates to receivables net of any allowances provided. With respect to credit risk arising from other financial assets of the Globe Group, which comprise cash and cash equivalents, short-term investments, AFS financial investments, HTM investments, and certain derivative instruments, the Globe Group’s exposure to credit risk arises from the default of the counterparty, with a maximum exposure equal to the carrying amount of these instruments. The Globe Group’s investments comprise short-term bank deposits and government securities. Credit risk from these investments is managed on a Globe Group basis. For its investments with banks, the Globe Group has a counterparty risk management policy which allocates investment limits based on counterparty credit rating and credit risk profile. The Globe Group makes a quarterly assessment of the credit standing of its investment counterparties, and allocates investment limits based on size, liquidity, profitability, and asset quality. For investments in government securities, these are denominated in local currency and are considered to be relatively risk-free. The usage of limits is regularly monitored. For its derivative counterparties, the Globe Group deals only with counterparty banks with investment grade ratings and large local banks. Credit ratings of derivative counterparties are reviewed quarterly.

- 18 -
Following are the Globe Group exposures with its investment counterparties for cash and cash equivalents:
March 31 December 31
2011
(Unaudited) 2010
(Unaudited) 2010
(Audited)Local bank deposits 28% 51% 52%Onshore foreign bank 25% 32% 16%Offshore bank deposit – – 3%Special deposit account 47% 17% 29%
The Globe Group has not executed any credit guarantees in favor of other parties. There is also minimal concentration of credit risk within the Globe Group. Credit exposures from subscribers and carrier partners continue to be managed closely for possible deterioration. When necessary, credit management measures are proactively implemented and identified collection risks are being provided for accordingly. Outstanding credit exposures from financial instruments are monitored daily and allowable exposures are reviewed quarterly.
The Globe Group’s credit exposures and related allowances for impairment follow:
March 31 December 31
2011
(Unaudited) 2010
(Unaudited) 2010
(Audited) (In Thousand Pesos) Subscribers P=8,297,038 P=5,179,130 P=8,038,451Traffic settlements - net 2,068,946 2,444,936 2,130,238Others 308,702 491,895 658,878 10,674,686 8,115,961 10,827,567Less allowance for impairment losses Subscribers 2,323,711 1,387,404 2,173,912 Traffic settlements and others 315,534 186,822 279,532 2,639,245 1,574,226 2,453,444 P=8,035,441 P=6,541,735 P=8,374,123

- 19 -
The tables below show the aging analysis of the Globe Group’s receivables:
March 31, 2011 Neither Past
Due Nor Impaired
Past Due But Not Impaired Impaired Financial
Assets
Less than
30 days 31 to 60
days 61 to 90
days More than
90 days Total (Unaudited and In Thousand Pesos) Wireless receivables:
Consumer P=394,251 P=510,424 P=211,509 P=99,977 P=308,726 P=423,553 P=1,948,440 Key corporate accounts 76,764 233,309 101,731 126,803 316,877 71,829 927,313
Other corporations and Small and Medium Enterprises (SME) 296,619 295,949 104,492 89,592 362,476 103,096 1,252,224
767,634 1,039,682 417,732 316,372 988,079 598,478 4,127,977Wireline receivables:
Consumer 227,860 277,251 155,062 78,184 84,000 1,358,640 2,180,997 Key corporate accounts 84,635 160,119 221,611 186,860 739,736 202,880 1,595,841
Other corporations and SME 67,194 67,799 33,978 17,951 27,565 158,302 372,789
379,689 505,169 410,651 282,995 851,301 1,719,822 4,149,627Other trade receivables – 3,623 11,001 – 4,810 – 19,434Traffic receivables:
Foreign 1,671,745 – – – – 199,601 1,871,346 Local 95,655 – – – – 101,945 197,600
1,767,400 – – – – 301,546 2,068,946Other receivables 297,776 – – – – 10,926 308,702Total P=3,212,499 P=1,548,474 P=839,384 P=599,367 P=1,844,190 P=2,630,772 P=10,674,686
March 31, 2010
Neither Past
Due Nor Impaired
Past Due But Not Impaired Impaired Financial
Assets
Less than
30 days 31 to 60
days 61 to 90
days More than
90 days Total (Unaudited and In Thousand Pesos) Wireless receivables:
Consumer P=226,864 P=444,520 P=168,984 P=83,432 P=248,591 P=159,692 P=1,332,083 Key corporate accounts 4,012 223,775 59,633 55,577 70,745 48,431 462,173
Other corporations and Small and Medium Enterprises (SME) 92,477 86,270 43,136 26,178 65,067 44,608 357,736
323,353 754,565 271,753 165,187 384,403 252,731 2,151,992 Wireline receivables:
Consumer 171,199 156,803 87,420 53,500 97,531 756,952 1,323,405 Key corporate accounts 6,705 48,190 29,650 19,988 775,898 90,253 970,684
Other corporations and SME 47,268 115,639 225,929 165,301 48,116 105,427 707,680
225,172 320,632 342,999 238,789 921,545 952,632 3,001,769 Other trade receivables – 16,104 5,357 39 1,189 2,680 25,369 Traffic receivables:
Foreign 1,917,620 – – – – 96,528 2,014,148 Local 350,811 – – – – 79,977 430,788
2,268,431 – – – – 176,505 2,444,936 Other receivables 484,258 – – – – 7,637 491,895 Total P=3,301,214 P=1,091,301 P=620,109 P=404,015 P=1,307,137 P=1,392,185 P=8,115,961

- 20 -
December 31, 2010 Neither Past
Due Nor Impaired
Past Due But Not Impaired Impaired Financial
Assets
Less than
30 days 31 to 60
days 61 to 90
days More than
90 days Total (Audited and In Thousand Pesos) Wireless receivables:
Consumer P=521,771 P=739,554 P=311,860 P=139,330 P=744,827 P=346,499 P=2,803,841 Key corporate accounts 19,975 103,032 150,689 127,929 201,733 74,131 677,489
Other corporations and SME 129,570 152,544 76,092 18,802 175,710 83,920 636,638
671,316 995,130 538,641 286,061 1,122,270 504,550 4,117,968Wireline receivables:
Consumer 235,480 215,510 111,297 66,806 76,989 1,252,527 1,958,609 Key corporate accounts 3,066 182,566 165,621 216,576 823,085 179,015 1,569,929
Other corporations and SME 86,869 50,922 30,474 16,125 49,166 140,542 374,098
325,415 448,998 307,392 299,507 949,240 1,572,084 3,902,636Other trade receivables – – 8,447 5,186 4,214 – 17,847Traffic receivables:
Foreign 1,731,708 – – – – 175,241 1,906,949 Local 133,474 – – – – 89,815 223,289
1,865,182 – – – – 265,056 2,130,238Other receivables 647,464 – – – – 11,414 658,878Total P=3,509,377 P=1,444,128 P=854,480 P=590,754 P=2,075,724 P=2,353,104 P=10,827,567
Total allowance for impairment losses amounting to P=2,639.24 million, P=1,574.23 million and P=2,453.44 million includes allowance for impairment arising from collective assessment amounting to P=374.57 million, P=361.24 million and P=328.72 million as of March 31, 2011 and 2010, and December 31, 2010, respectively. The table below provides information regarding the credit risk exposure of the Globe Group by classifying assets according to the Globe Group’s credit ratings of receivables. The Globe Group’s credit rating is based on individual borrower characteristics and their relationship to credit event experiences.
March 31, 2011 Neither past-due nor impaired High Quality Medium Quality Low Quality Total (Unaudited and In Thousand Pesos) Wireless receivables: Consumer P=249,358 P=80,396 P=64,497 P=394,251 Key corporate accounts 63,427 10,311 3,026 76,764 Other corporations and SME 121,276 42,245 133,098 296,619 434,061 132,952 200,621 767,634 Wireline receivables: Consumer 196,896 30,964 – 227,860 Key corporate accounts 80,083 4,541 11 84,635 Other corporations and SME 60,084 6,803 307 67,194 337,063 42,308 318 379,689 Total P=771,124 P=175,260 P=200,939 P=1,147,323

- 21 -
March 31, 2010 Neither past-due nor impaired High Quality Medium Quality Low Quality Total (Unaudited and In Thousand Pesos) Wireless receivables: Consumer P=169,383 P=30,833 P=26,648 P=226,864 Key corporate accounts 3,558 330 124 4,012 Other corporations and SME 64,426 1,965 26,086 92,477 237,367 33,128 52,858 323,353 Wireline receivables: Consumer 141,058 30,141 – 171,199 Key corporate accounts 6,350 355 – 6,705 Other corporations and SME 38,545 8,583 140 47,268 185,953 39,079 140 225,172 Total P=423,320 P=72,207 P=52,998 P=548,525
December 31, 2010 Neither past-due nor impaired High Quality Medium Quality Low Quality Total (Audited and In Thousand Pesos) Wireless receivables: Consumer P=280,831 P=64,889 P=176,051 P=521,771 Key corporate accounts 9,817 1,183 8,975 19,975 Other corporations and SME 60,842 4,358 64,370 129,570 351,490 70,430 249,396 671,316 Wireline receivables: Consumer 196,067 39,413 – 235,480 Key corporate accounts 2,912 154 – 3,066 Other corporations and SME 79,049 7,512 308 86,869 278,028 47,079 308 325,415 Total P=629,518 P=117,509 P=249,704 P=996,731
High quality accounts are accounts considered to be high value and have consistently exhibited good paying habits. Medium quality accounts are active accounts with propensity of deteriorating to mid-range age buckets. These accounts do not flow through to permanent disconnection status as they generally respond to credit actions and update their payments accordingly. Low quality accounts are accounts which have probability of impairment based on historical trend. These accounts show propensity to default in payment despite regular follow-up actions and extended payment terms. Impairment losses are also provided for these accounts based on net flow rate.
Traffic receivables that are neither past due nor impaired are considered to be high quality given the reciprocal nature of the Globe Group’s interconnect and roaming partner agreements with the carriers and the Globe Group’s historical collection experience.
Other receivables are considered high quality accounts as these are substantially from credit card companies and Globe dealers.

- 22 -
The following is a reconciliation of the changes in the allowance for impairment losses:
March 31, 2011
Subscribers
Consumer Key corporate
accounts
Other corporations
and SME
Traffic Settlements and Others Non-trade Total
(Unaudited and In Thousand Pesos) At beginning of year P=1,677,691 P=245,622 P=250,599 P=279,532 P=21,045 P=2,474,489 Charges for the period 225,051 10,338 26,311 36,002 981 298,683 Reversals/write offs/
adjustments (81,616) (22,255) (8,030) – – (111,901) At end of period P=1,821,126 P=233,705 P=268,880 P=315,534 P=22,026 P=2,661,271
March 31, 2010
Subscribers
Consumer Key corporate
accounts
Other corporations
and SME
Traffic Settlements and Others Non-trade Total
(Unaudited and In Thousand Pesos) At beginning of period P=820,403 P=176,973 P=165,416 P=188,199 P=34,776 P=1,385,767 Charges for the year 257,228 12,153 14,177 (1,377) – 282,181 Reversals/write offs/
adjustments (34,995) (6,167) (17,784) – (13,871) (72,817) At end of period P=1,042,636 P=182,959 P=161,809 P=186,822 P=20,905 P=1,595,131
December 31, 2010
Subscribers
Consumer Key corporate
accounts
Other corporations
and SME
Traffic Settlements and Others Non-trade Total
(Audited and In Thousand Pesos) At beginning of year P=820,403 P=176,973 P=165,416 P=188,199 P=34,776 P=1,385,767 Charges for the year 987,636 81,395 124,549 91,333 620 1,285,533 Reversals/write offs/
adjustments (130,348) (12,746) (39,366) – (14,351) (196,811) At end of year P=1,677,691 P=245,622 P=250,599 P=279,532 P=21,045 P=2,474,489
12.2.3 Liquidity Risk
The Globe Group seeks to manage its liquidity profile to be able to finance capital expenditures and service maturing debts. As of March 31, 2011, Globe Group has available uncommitted short-term credit facilities of USD59.00 million and P=9,066.60 million. As of March 31, 2011, the Globe Group also has P=4,200 million in committed long-term facilities and none for USD, which remain undrawn. As part of its liquidity risk management, the Globe Group regularly evaluates its projected and actual cash flows. It also continuously assesses conditions in the financial markets for opportunities to pursue fund raising activities, in case any requirements arise. Fund raising activities may include bank loans, export credit agency facilities and capital market issues.

- 23 -
The following tables show comparative information about the Globe Group’s financial instruments that are exposed to liquidity risk and interest rate risk and presented by maturity profile including forecasted interest payments for the next five years: Long-term Liabilities: March 31, 2011
2011 2012 2013 2014 2015 and
thereafterTotal
(in USD)Total
(in PHP)
DebtIssuance
CostsCarrying Value
(in PHP) Fair Value
(in PHP) (Unaudited and In Thousands) Liabilities: Long-term debt Fixed rate
Philippine peso P=4,112,450 P=7,033,150 P=3,397,450 P=4,381,850 P=4,008,900 $– P=22,933,800 P=62,780 P=22,871,020 P=24,192,369
Interest rate 5.97%, 6.68%,
7.4% 5.97%, 7.03%,
7.4%, 7.5% 5.97%, 7.03%,
7.4%, 7.03%, 7.4%,
8%, 8.36% 7.03%, 8.36% Floating rate USD notes $71,508 $28,642 $14,273 $17,710 $21,665 153,798 – 117,096 6,558,945 6,665,367 Interest rate 6-mo. LIBOR+ 3.4%
margin; 6-mo. LIBOR+2.65%
margin; 3mo or 6mo LIBOR +.43% margin
(rounded to 1/16%); 6mo LIBOR +3%
margin; 1mo or 3mo or 6mo LIBOR+2%
margin
6-mo. LIBOR+3.4% margin; 6-mo. LIBOR+ 2.65% margin; 3mo or
6mo LIBOR +.43% margin (rounded to
1/16%); 6mo LIBOR +3% margin
6-mo. LIBOR+3.4% margin; 6-mo.
LIBOR+2.65% margin
6-mo. LIBOR+3.4% margin; 6-mo.
LIBOR+2.65% margin
6-mo. LIBOR+ 3.4% margin
Philippine peso P=681,271 P=1,322,343 P=5,747,343 P=4,603,843 P=8,825,000 – 21,179,800 86,094 21,093,706 21,109,923 Interest rate PDSTF 3mo + 0.75%
margin; PDSTF3mo + 1.25% margin;
PDSTF3mo + 1% margin; PDSTF6mo +
1.25% margin
PDSTF 3mo + 0.75% margin; PDSTF3mo +
1.25% margin; PDSTF3mo + 1% margin;
PDSTF6mo + 1.25% margin
PDSTF 3mo + 0.75% margin; PDSTF3mo +
1.25% margin; PDSTF3mo + 1%
margin; PDSTF6mo + 1.25% margin
PDSTF 3mo + 0.75% margin; PDSTF3mo
+ 1.25% margin; PDSTF3mo + 1
margin %; PDSTF6mo + 1.25%
margin
PDSTF 3mo + 0.75% margin; PDSTF3mo + .35% marginPDSTF3mo+
0.65% margin
$153,798 P=44,113,600 P=265,970 P=50,523,671 P=51,967,659 Interest payable*
PHP debt P=1,515,455 P=1,535,563 P=1,207,534 P=670,692 P=594,700 P=– P=5,523,944 P=– P=– P=– USD debt $2,739 $2,608 $1,920 $1,356 $1,062 $9,685 $– $– $– $–
*Used month-end USD LIBOR and Philippine Dealing and Exchange Corporation (PDEX) rates. *Using P=43.408 - USD exchange rate as of March 31, 2011.

- 24 -
March 31, 2010
2010 2011 2012 2013 2014 and thereafterTotal
(in USD) Total
(in PHP) Debt
Issuance CostsCarrying Value
(in PHP)Fair Value
(in PHP) (Unaudited and In Thousands)
Liabilities: Long-term debt Fixed rate
Philippine peso P=19,950 P=4,138,700 P= 7,033,150 P=3,397,450 P=8,390,750 $– P=22,980,000 P=100,811 P=22,879,189 P=24,156,283 Interest rate 7.24%, 8.36% 5.97%, 6.68% ,
7.03, 7.4%, 8.36% 5.97%, 6.68%, 7.03%,
7.4%, 7.5%, 8.36% 5.97%, 6.68%,
7.03%, 7.4%,8.36%
7.03%, 7.4%, 8%, 8.36%
– – – – –
Floating rate USD notes $60,011 $77,511 $17,500 $– $– $155,022 – 59,607 6,961,505 5,649,190 Interest rate 1mo or 3mo or 6mo
LIBOR+ 2% margin; 6mo LIBOR+ .85%; 6mo
LIBOR + 3% margin; 3mo or 6mo LIBOR + .43%
margin (rounded to 1/16%)
1mo or 3mo or 6mo LIBOR+ 2% margin; 6mo LIBOR+ .85%;
6mo LIBOR + 3% margin;
3mo or 6mo LIBOR + .43% margin
(rounded to 1/16%)
6mo LIBOR + 3% margin; 3mo or 6mo LIBOR +
.43% margin (rounded to 1/16%)
– – – – – – –
Philippine peso P=450,392 P=693,771 P=6,922,343 P=5,122,343 P=2,503,843 – P=15,692,692 42,791 15,649,901 15,646,819 Interest rate PDSTF3mo + 1% margin;
PDSTF3mo + 1.25% margin
PDSTF3mo + 1% margin; PDSTF3mo +
1.25% margin
PDSTF3mo + 1% margin; PDSTF3mo+ 1.30% , PDSTF3mo + 1.10%
margin, PDSTF3mo + 1% margin; PDSTF3mo +
1.25% margin; PDSTF3mo + 1.50% margin
PDSTF3mo + 1% margin;
PDSTF3mo + 1.25% margin
PDSTF3mo + 1% margin; PDSTF3mo
+ 1.25% margin
– – – – –
$155,022 P=38,672,692 P=203,209 P=45,490,595 P=45,452,292 Interest payable*
PHP debt P=1,864,978 P=2,296,143 P=1,612,036 P=1,155,189 P=840,480 P=– P=7,768,826 P=– P=– P=– USD debt $2,466 $1,715 $237 $– $– $4,418 $– $– $– $–
*Used month-end Libor and Philippine Dealing and Exchange Corporation (PDEX) rates. *Using P=45.291 - USD exchange rate as of March 31, 2010.

- 25 -
December 31, 2010
2011 2012 2013 2014 2015 and thereafter
Total (in USD)
Total (in PHP)
Debt Issuance Costs
Carrying Value(in PHP)
Fair Value (in PHP)
(Audited and In Thousands) Liabilities: Long-term debt Fixed rate
Philippine peso P=4,138,700 P=7,033,150 P=3,397,450 P=4,381,850 P=4,008,900 $– P=22,960,050 P=71,638 P=22,888,412 P=24,816,963
Interest rate 5.97%, 6.68%, 7.03%,
7.4% 5.97%, 6.68%, 7.03%,
7.4%, 7.5% 5.97%, 6.68%, 7.03%,
7.4% 7.03%, 7.4%, 8%,
8.36% 7.03%, 8.36% Floating rate USD notes $87,721 $28,642 $14,273 $17,710 $21,665 170,011 – 130,874 7,317,483 7,410,651 Interest rate 6mo LIBOR+3.4%
;6mo LIBOR+2.65% margin; 3mo or 6mo
LIBOR+.43% margin; (rounded to
1/16%)6mo LIBOR +3% margin; 1mo or
3mo or 6mo LIBOR+2% margin; 6mo LIBOR+ .85%
6-mo. LIBOR+3.4% margin; 6-mo. LIBOR+ 2.65% margin; 3mo or
6mo LIBOR +.43% margin (rounded to
1/16%); 6mo LIBOR +3% margin
6-mo. LIBOR+3.4% margin; 6-mo.
LIBOR+2.65% margin
6-mo. LIBOR+3.4% margin; 6-mo.
LIBOR+2.65% margin
6-mo. LIBOR+ 3.4% margin
Philippine peso P=743,771 P=4,122,343 P=5,747,343 P=4,603,843 P=5,025,000 – 20,242,300 76,725 20,165,575 20,136,024 Interest rate PDSTF 3mo + 0.75%
margin; PDSTF3mo + 1.25% margin;
PDSTF3mo + 1% margin; PDSTF6mo +
1.25% margin
PDSTF 3mo + 0.75% margin; PDSTF3mo +
1.25% margin; PDSTF3mo + 1%
margin; PDSTF6mo + 1.25% margin; PDSTF 3
mo + 1.50% margin
PDSTF 3mo + 0.75% margin; PDSTF3mo +
1.25% margin; PDSTF3mo + 1%
margin; PDSTF6mo + 1.25% margin
PDSTF 3mo + 0.75% margin; PDSTF3mo +
1.25% margin; PDSTF3mo + 1
margin %; PDSTF6mo + 1.25% margin
PDSTF 3mo + 0.75% margin;PDSTF 3mo + 0.65% margin
$170,011 P=43,202,350 P=279,237 P=50,371,470 P=52,363,638 Interest payable* PHP debt P=2,023,562 P=1,494,852 P=1,152,815 P=606,723 P=416,655 P=– P=5,694,607 P=– P=– P=– USD debt $4,578 $2,605 $1,918 $1,355 $1,061 $11,517 $– $– $– $–
*Used month-end USD LIBOR and Philippine Dealing and Exchange Corporation (PDEX) rates. *Using P=43.81- USD exchange rate as of December 31, 2010

- 26 -
The following tables present the maturity profile of the Globe Group’s other liabilities and derivative instruments (undiscounted cash flows including swap costs payments/receipts except for other long-term liabilities): March 31, 2011 Other Financial Liabilities:
On demand Less than
1 year 1 to 2 years 2 to 3 years 3 to 4 years 4 to 5 years Over 5 years Total (Unaudited and In Thousand Pesos) Accounts payable and accrued expenses* P=440,464 P=22,131,389 P=– P=– P=– P=– P=– P=22,571,853 Other long-term liabilities – – – – – – 653,337 653,337 P=440,464 P=22,131,389 P=– P=– P=– P=– P=653,337 P=23,225,190
*Excludes taxes payable which is not a financial instrument. Derivative Instruments: 2011 2012 2013 2014 2015 and beyond Receive Pay Receive Pay Receive Pay Receive Pay Receive Pay (Unaudited and In Thousand Pesos) Projected Swap Coupons*: Principal Only Swaps P=– P=2,757 P=– P=2,549 P=– P=– P=– P=– P=– P=– Interest Rate Swaps 308 128,725 37,629 – 144,098 – 101,688 – 28,811 – *Projected USD swap coupons were converted to PHP at the closing rate. Further, it was assumed that 3m Libor, 3m PDSTF, and 6m PDSTF would stay at March 31, 2011 levels. 2011 2012 2013 2014 2015 and beyond Receive Pay Receive Pay Receive Pay Receive Pay Receive Pay (Unaudited and In Thousand Pesos) Projected Principal Exchanges*: Principal Only Swaps $– P=– $2,500 P=140,825 $– P=– $– P=– $– P=–
Forward Purchase of USD $619 P=26,921 – – – – – – – – Forward Sale of USD P=1,583,694 $36,000 – – – – – – – – *Projected principal exchanges represent commitments to purchase USD for payment of USD debts with the same maturities.

- 27 -
March 31, 2010 Other Financial Liabilities:
On demand Less than
1 year 1 to 2 years 2 to 3 years 3 to 4 years 4 to 5 years Over 5 years Total (Unaudited and In Thousand Pesos) Accounts payable and accrued expenses* P=1,201,322 P=18,053,353 P=– P=– P=– P=– P=– P=19,254,675 Notes payable – 2,500,415 – – – – – 2,500,415 Other long-term liabilities – 713,773 – – – – 680,081 1,393,854 P=1,201,322 P=21,267,541 P=– P=– P=– P=– P=680,081 P=23,148,944
*Excludes taxes payable Derivative Instruments: 2010 2011 2012 2013 2014 and beyond Receive Pay Receive Pay Receive Pay Receive Pay Receive Pay
(Unaudited and In Thousand Pesos) Projected Swap Coupons*: Principal Only Swaps P=– P=2,877 P=– P=5,304 P=– P=2,659 P=– P=– P=– P=– Interest Rate Swaps – 11,711 – 1,400 4,670 – – – – – *Projected USD swap coupons were converted to PHP at the balance sheet rate. Further, it was assumed that 3m Libor, 3m PDSTF, and 6m PDSTF would stay at March 31, 2010 levels. 2010 2011 2012 2013 2014 and beyond Receive Pay Receive Pay Receive Pay Receive Pay Receive Pay
(Unaudited and In Thousand Pesos) Projected Principal Exchanges*:
Principal Only Swaps $– P=– $– P=– $2,500 P=140,825 $– P=– $– P=– Forward Purchase of USD /Sell PHP $20,000 P=959,500 – – – – – – – – Forward Sale of USD /Purchase P=964,150 $20,000 – – – – – – – – Forward Sale of USD $– $23,400 – – – – – – – –
*Projected principal exchanges represent commitments to purchase USD for payment of USD debts with the same maturities.

- 28 -
December 31, 2010 Other Financial Liabilities:
On demand Less than
1 year 1 to 2 years 2 to 3 years 3 to 4 years 4 to 5 years Over 5 years Total (Audited and In Thousand Pesos) Accounts payable and accrued expenses* P=426,696 P=19,906,644 P=– P=– P=– P=– P=– P=20,333,340 Other long-term liabilities – – – – – – 640,927 640,927 P=426,696 P=19,906,644 P=– P=– P=– P=– P=640,927 P=20,974,267
*Excludes taxes payable which is not a financial instrument. Derivative Instruments: 2011 2012 2013 2014 2015and beyond Receive Pay Receive Pay Receive Pay Receive Pay Receive Pay (Audited and In Thousand Pesos) Projected Swap Coupons*: Principal Only Swaps P=– P=4,048 P=– P=2,572 P=– P=– P=– P=– P=– P=– Interest Rate Swaps – 146,821 4,065 51,911 16,745 – 19,889 – 11,388 – *Projected USD swap coupons were converted to PHP at the closing rate. Further, it was assumed that 3m Libor, 3m PDSTF, and 6m PDSTF would stay at December 31, 2010 levels. 2011 2012 2013 2014 2015and beyond Receive Pay Receive Pay Receive Pay Receive Pay Receive Pay (Audited and In Thousand Pesos) Projected Principal Exchanges*: Principal Only Swaps $– P=– $2,500 P=140,825 $– P=– $– P=– $– P=– Forward Sale of USD P=1,539,082 $35,000 – – – – – – – – *Projected principal exchanges represent commitments to purchase USD for payment of USD debts with the same maturities.

- 29 -
12.2.4 Hedging Objectives and Policies The Globe Group uses a combination of natural hedges and derivative hedging to manage its foreign exchange exposure. It uses interest rate derivatives to reduce earnings volatility related to interest rate movements.
It is the Globe Group’s policy to ensure that capabilities exist for active but conservative management of its foreign exchange and interest rate risks. The Globe Group does not engage in any speculative derivative transactions. Authorized derivative instruments include currency forward contracts (freestanding and embedded), currency swap contracts, interest rate swap contracts and currency option contracts (freestanding and embedded). Certain currency swaps are entered with option combination or structured provisions.
12.3 Derivative Financial Instruments The Globe Group’s freestanding and embedded derivative financial instruments are accounted for as hedges or transactions not designated as hedges. The table below sets out information about the Globe Group’s derivative financial instruments and the related fair values:
March 31, 2011 Notional
Amount Notional Amount
Derivative Asset
Derivative Liability
(Unaudited and In Thousands) Derivative instruments designated as hedges: Cash flow hedges: Interest rate swaps $73,543 P=6,875,000 P=295,172 P=150,620 Nondeliverable forwards* 36,000 − 14,435 2,941 Derivative instruments not designated as hedges:
Freestanding: Nondeliverable forwards** 619 − 8 − Interest rate swaps 5,000 − 9,952 − Principal only currency swaps 2,500 − − 35,017 Embedded Currency forwards*** 12,802 − 1,644 26,805 Net P=321,211 P=215,383 * Sell position ** Buy position ** *The embedded currency forwards are at a net sell position.
March 31, 2010 Notional
Amount Notional Amount
Derivative Asset
Derivative Liability
(Unaudited and In Thousands) Derivative instruments designated as hedges: Cash flow hedges: Interest rate swaps $54,000 P=– P=– P=26,404 Nondeliverable forwards* 23,400 − 30,386 − Derivative instruments not designated as hedges:
Freestanding: Nondeliverable forwards** 40,000 – 47,562 42,912 Interest rate swaps 8,333 – 17,689 3,523 Principal only currency swaps 2,500 – – 29,260 Embedded Currency forwards*** 10,016 – 3,214 25,252 Net P=98,851 P=127,351 * Sell position ** Buy position: USD20,000; Sell position: USD20,000.
** *The embedded currency forwards are at a net sell position

- 30 -
December 31, 2010 Notional
Amount Notional Amount
Derivative Asset
Derivative Liability
(Audited and In Thousands) Derivative instruments designated as hedges:
Cash flow hedges: Interest rate swaps $57,000 P=5,000,000 P=– P=163,448 Nondeliverable forwards* 35,000 – 6,255 8,285 Derivative instruments not designated as hedges:
Freestanding: Interest rate swaps 6,667 – 11,743 210 Principal only currency swaps 2,500 – – 35,519 Embedded Currency forwards** 14,651 – 1,890 38,403 Net P=19,888 P=245,865
* All in sell position. ** The embedded currency forwards are at a net sell position.
The table below also sets out information about the maturities of Globe Group’s derivative instruments that were entered into to manage interest and foreign exchange risks related to the long-term debt and US dollar-based revenues (in thousands).
March 31, 2011
<1 year >1-<2 years >2-<3 years >3-<4 years >4-<5 years Total
(Unaudited and In Thousands) Derivatives: Principal Only Currency Swaps: Notional amount $– $2,500 $– $– $– $2,500 Weighted swap rate P=56.33 Pay fixed rate 4.62% Interest Rate Swaps Fixed-Floating Notional USD $– $5,000 $– $– $– $5,000
Pay-floating rate USD
LIBOR+4.23% Receive-fixed rate 9.75% Floating-Fixed Notional PHP P=350,000 P=450,000 P=2,300,000 P=2,425,000 P=1,350,000 P=6,875,000 Notional USD $37,918 $20,174 $15,451 $– $– $73,543 0.78% - 4.92%
Receive-floating rate USD LIBOR,
3moPDSTF Nondeliverable Forwards Notional USD $36,619 – – – – $36,619 Forward rate P=43.03 - P=45.21

- 31 -
March 31, 2010
<1 year >1-<2 years >2-<3 years >3-<4 years >4-<5 years Total (Unaudited and In Thousands) Derivatives: Principal Only Currency Swaps: Notional amount $– $– $2,500 $– $– $2,500 Weighted swap rate P=56.33 Pay fixed rate 4.62% Interest Rate Swaps Fixed-Floating Notional USD – – $5,000 – – $5,000 Pay-floating rate USD LIBOR+4.23% Receive-fixed rate 9.75% Floating-Fixed Notional USD $29,833 $20,000 $7,500 – – $57,333 Pay-fixed rate 1.03% - 4.84% Receive-floating rate USD LIBOR
Nondeliverable Forwards Notional USD $63,400 – – – – $63,400 Forward rate P=46.32 - P=48.70
December 31, 2010
<1 year >1-<2 years >2-<3 years >3-<4 years >4-<5 years Total Audited and In Thousands Derivatives: Principal Only Currency Swaps: Notional amount $– $2,500 $– $– $– $2,500 Weighted swap rate P=56.33 Pay fixed rate 4.62% Interest Rate Swaps Fixed-Floating Notional USD $– $5,000 $– $– $– $5,000 Pay-floating rate USD LIBOR+4.23% Receive-fixed rate 9.75% Floating-Fixed Notional Peso P=50,000 P=200,000 P=625,000 P=2,100,000 P=2,025,000 P=5,000,000 Notional USD $43,667 $15,000 – – – $58,667 Pay-fixed rate 1.01% - 4.92% Receive-floating rate USD LIBOR-3M PDSTF Nondeliverable Forwards Notional USD $35,000 $– $– $– $– $35,000 Forward rate P=42.84 -P45.21
The Globe Group’s other financial instruments that are exposed to interest rate risk are cash and cash equivalents and AFS investments. These mature in less than a year and are subject to market interest rate fluctuations.

- 32 -
The Globe Group’s other financial instruments which are non-interest bearing and therefore not subject to interest rate risk are trade and other receivables, accounts payable and accrued expenses and long-term liabilities.
The subsequent sections will discuss the Globe Group’s derivative financial instruments according to the type of financial risk being managed and the details of derivative financial instruments that are categorized into those accounted for as hedges and those that are not designated as hedges.
12.4 Derivative Instruments Accounted for as Hedges
The following sections discuss in detail the derivative instruments accounted for as cash flow hedges.
• Interest Rate Swaps
As of March 31, 2011 and 2010, and December 31, 2010, the Globe Group has USD73.54 million, USD54.00 million and USD57.00 million, respectively, in notional amount of interest rate swap that has been designated as cash flow hedge. The interest rate swaps effectively fixed the benchmark rate of the hedged loan at 0.78% to 4.92% over the duration of the agreement, which involves semi-annual or quarterly payment intervals up to July 2013.
The Globe Group also entered into an interest rate swap contract with a notional amount of P=6,875.00 million and P=5,000.00 million as of March 31, 2011 and December 31, 2010, respectively, which effectively swaps a floating rate PHP denominated loan into fixed rate with quarterly payment intervals up to September 2015. As of March 31, 2011 and 2010, and December 31, 2010, the fair value of the outstanding swap amounted to P=144.55 million gain, P=26.40 million loss and P=163.45 million loss, respectively, of which P=101.19 million, P=18.48 million and P=114.41 million (net of tax), respectively, is reported as “Other reserves” in the equity section of the condensed consolidated statements of financial position.
Accumulated swap cost as of March 31, 2011 and 2010, and December 31, 2010, amounted to P=51.69 million, P=11.09 million and P=58.98 million, respectively.
• Nondeliverable Forwards
The Globe Group entered into short-term nondeliverable currency forward contracts to hedge the changes in the cash flows of USD revenues related to changes in foreign currency exchange rates with maturities until December 2011. These currency forward contracts have a notional amount of USD36.00 million, USD23.40 million and USD35.00 million as of March 31, 2011 and 2010, and December 31, 2010, respectively. The fair value of the outstanding short-term nondeliverable currency forwards as of March 31, 2011 and 2010 and December 31, 2010 amounted to P=11.49 million gain, P=30.39 million gain and P=2.03 million loss, respectively, of which P=8.05 million, P=21.27 million and P=1.42 million (net of tax), respectively, is reported in the equity section of the consolidated statements of financial position.

- 33 -
Hedging gain loss on derivatives intended to manage foreign currency fluctuations on dollar based revenues for the periods ended March 31, 2011 and 2010, and for the year ended December 31, 2010 amounted to of P=0.78 million loss, P=2.98 million gain, and P=75.56 million gain, respectively. These hedging gains and losses are reflected under “Service revenues” in the consolidated statements of comprehensive income.
12.5 Other Derivative Instruments not Designated as Hedges
The Globe Group enters into certain derivatives as economic hedges of certain underlying exposures. Such derivatives, which include embedded and freestanding currency forwards, embedded call options, and certain currency and interest rate swaps with option combination or structured provisions, are not designated as accounting hedges. The gains or losses on these instruments are accounted for directly in the consolidated statements of comprehensive income. This section consists of freestanding derivatives and embedded derivatives found in both financial and nonfinancial contracts.
12.6 Freestanding Derivatives
Freestanding derivatives that are not designated as hedges consist of currency forwards, options, currency and interest rate swaps entered into by the Globe Group. Fair value changes on these instruments are accounted for directly in the consolidated statements of comprehensive income.
• Nondeliverable Forwards
As of March 31, 2011 and 2010, the Globe Group has short-term nondeliverable currency forward contracts which have a notional amount of USD0.62 million and USD40.00 million, respectively with maturities until April 2011. These currency forward contracts have a net fair value gain of P=0.01 million and P=4.65 million as of March 31, 2011 and 2010, respectively.
• Interest Rate Swaps The Globe Group has outstanding interest rate swap contracts with option-like structures which swap certain fixed and floating USD-denominated loans into floating and fixed rate with semi-annual payments interval up to April 2012. The swaps have outstanding notional amount of USD5.00 million, USD8.33 million and USD6.67 million as of March 31, 2011 and 2010, and December 31, 2010, respectively.
The fair values on the interest rate swaps as of March 31, 2011 and 2010, and December 31, 2010 amounted to a net gain of P=9.95 million, P=14.17 million and to P=11.53 million, respectively.
• Principal Only Currency Swaps
The Globe Group also has an outstanding foreign principal only currency swaps agreement with a certain bank, under which it swaps the principal of USD-denominated loans into PHP up to April 2012. Under this contract, swap cost is payable in semi-annual intervals in USD. The notional of the swaps amounted to USD2.50 million as of March 31, 2011 and 2010, and December 31, 2010. The fair value losses of the principal only currency swaps as of March 31, 2011 and 2010 and December 31, 2010 amounted to P=35.02 million, P=29.26 million and P=35.52 million, respectively.

- 34 -
12.7 Embedded Derivatives The Globe Group has instituted a process to identify any derivatives embedded in its financial or non financial contracts. Based on PAS 39, the Globe Group assesses whether these derivatives are required to be bifurcated or are exempted based on the qualifications provided by the said standard. The Globe Group’s embedded derivatives include embedded currency derivatives noted in non-financial contracts.
• Embedded Currency Forwards
As of March 31, 2011 and 2010, and December 31, 2010, the total outstanding notional amount of currency forwards embedded in nonfinancial contracts amounted to USD12.80 million, USD10.01 million, and USD14.65 million, respectively. The nonfinancial contracts consist mainly of foreign currency-denominated purchase orders with various expected delivery dates and unbilled leaselines receivables and payables denominated in foreign currency. The net fair value losses of the embedded currency forwards as of March 31, 2011 and 2010, and December 31, 2010 amounted to P=25.16 million, P=22.03 million and P=36.51 million, respectively.
• Embedded Currency Options
As of March 31, 2011, the Globe Group does not have an outstanding currency option embedded in non-financial contracts.
12.8 Fair Value Changes on Derivatives
The net movements in fair value changes of all derivative instruments are as follows:
March 31 December 31
2011
(Unaudited) 2010
(Unaudited) 2010
(Audited) (In Thousand Pesos) At beginning of period (P=225,977) (P=56,151) (P=56,151) Net changes in fair value of derivatives: Designated as cashflow hedges 269,055 28,095 (116,679) Not designated as cashflow hedges 11,150 (9,192) (27,631) 54,228 (37,248) (200,461) Less fair value of settled instruments (51,600) (8,748) 25,516 At end of period P=105,828 (P=28,500) (P=225,977)
12.9 Hedge Effectiveness Results
As of March 31, 2011 and 2010, and December 31, 2010, the effective fair value changes on the Globe Group’s cash flow hedges that were deferred in equity amounted to P=109.24 million gain, P=2.79 million gain and P=115.83 million loss, net of tax, respectively. Total ineffectiveness for the periods ended March 31, 2011 and 2010, and for the year December 31, 2010 is immaterial.
The distinction of the results of hedge accounting into “Effective” or “Ineffective” represent designations based on PAS 39 and are not necessarily reflective of the economic effectiveness of the instruments.

- 35 -
12.10 Categories of Financial Assets and Financial Liabilities The table below presents the carrying value of Globe Group’s financial instruments by category:
March 31 December 31 2011
(Unaudited) 2010
(Unaudited) 2010
(Audited) (In Thousand Pesos) Financial assets: Financial assets at FVPL: Derivative assets designated as cash flow hedges P=309,607 P=30,386 P=6,255 Derivative assets not designated as hedges 11,604 68,465 13,633 AFS investments in equity securities - net 99,392 89,572 101,877 Loans and receivables - net* 17,815,938 13,316,291 17,724,991 Financial liabilities: Financial liabilities at FVPL: Derivative liabilities designated as cash flow hedges 153,561 26,404 171,733 Derivative liabilities not designated as hedges 61,822 100,947 74,132 Financial liabilities at amortized cost** 73,748,861 68,639,539 71,345,737 * This consists of cash and cash equivalents, short-term investments and long-term investments, receivables, other nontrade receivables and loans receivables. **This consists of accounts payable, accrued expenses, accrued project cost, traffic settlement-net, dividends payable, notes
payable, long-term debt (including current portion) and other long-term liabilities (including current portion).
As of March 31, 2011 and 2010, and December 31, 2010, the Globe Group has no investments in foreign securities.
12.11 Fair Values of Financial Assets and Financial Liabilities
The table below presents a comparison of the carrying amounts and estimated fair values of all the Globe Group’s financial instruments as of:
March 31 December 31
2011
(Unaudited) 2010
(Unaudited) 2010
(Audited) Carrying Value Fair Value Carrying Value Fair Value Carrying Value Fair Value (In Thousand Pesos) Financial assets: Cash and cash equivalents P=7,278,785 P=7,278,785 P=3,940,847 P=3,940,847 P=5,868,986 P=5,868,986 Short-term investments – – 2,799 2,799 – – Receivables - net 8,035,441 8,035,441 6,541,735 6,541,735 8,374,123 8,374,123 Derivative assets (including
noncurrent portion) 321,211 321,211 98,851 98,851 19,888 19,888 Other nontrade receivables* 2,501,712 2,501,712 2,830,910 2,830,910 3,481,882 3,481,882 AFS investment in equity
securities - net 99,392 99,392 89,572 89,572 101,877 101,877 Financial liabilities: Accounts payable and accrued
expenses ** 22,571,853 22,571,853 19,254,675 19,254,675 20,333,340 20,333,340 Derivative liabilities (including
current portion) 215,383 215,383 127,351 127,351 245,865 245,865 Notes payable – – 2,500,415 2,500,415 – – Long-term debt (including
current portion) 50,523,671 51,967,659 45,490,595 45,452,292 50,371,470 52,363,670 Other long-term liabilities
(including current portion) 653,337 653,337 1,393,854 1,393,854 640,927 640,927 * This consists of loan, accrued interest and miscellaneous receivables included under “Prepayments and other current assets” and
“Other noncurrent assets”. ** This consists of accounts payable, accrued expenses, accrued project cost, traffic settlement-net and dividends payable.

- 36 -
The following discussions are methods and assumptions used to estimate the fair value of each class of financial instrument for which it is practicable to estimate such value.
12.11.1 Non-derivative Financial Instruments
The fair values of cash and cash equivalents, short-term investments, AFS investments, subscriber receivables, traffic settlements receivable, loan receivable, miscellaneous receivables, accrued interest receivables, accounts payable, accrued expenses and notes payable are approximately equal to their carrying amounts considering the short-term maturities of these financial instruments.
The fair value of AFS investments are based on quoted prices. Unquoted AFS equity securities are carried at cost, subject to impairment.
For variable rate financial instruments that reprice every three months, the carrying value approximates the fair value because of recent and regular repricing based on current market rates. For variable rate financial instruments that reprice every six months, the fair value is determined by discounting the principal amount plus the next interest payment using the prevailing market rate for the period up to the next repricing date. The discount rates used range from 0.15% to 2.63% (for USD floating loans) to 1.42% to 5.83% (for PHP floating loans). The variable rate PHP loans reprice every six months. For noninterest bearing obligations, the fair value is estimated as the present value of all future cash flows discounted using the prevailing market rate of interest for a similar instrument.
12.11.2. Derivative Instruments
The fair value of freestanding and embedded forward exchange contracts is calculated by using the net present value concept.
The fair values of interest rate swaps, currency and cross currency swap transactions are determined using valuation techniques with inputs and assumptions that are based on market observable data and conditions and reflect appropriate risk adjustments that market participants would make for credit and liquidity risks existing at the end each of reporting period. The fair value of interest rate swap transactions is the net present value of the estimated future cash flows. The fair values of currency and cross currency swap transactions are determined based on changes in the term structure of interest rates of each currency and the spot rate.
Embedded currency options are valued using the simple option pricing model of Bloomberg.

- 37 -
12.11.3. Fair Value Hierarchy The Group uses the following hierarchy for determining and disclosing the fair value of financial instruments by valuation technique:
Level 1: quoted (unadjusted) prices in active markets for identical assets or liabilities Level 2: other techniques for which all inputs which have a significant effect on the recorded fair value are observable, either directly or indirectly Level 3: techniques which use inputs which have a significant effect on the recorded fair value that are not based on observable market data.
March 31 December 31 2011
(Unaudited)2010
(Unaudited) 2010
(Audited) (In Thousand Pesos) Level 1 AFS investment in equity securities - net P=99,392 P=89,572 P=101,877 Level 2 Derivative assets (including noncurrent portion) 321,211 98,851 19,888 Derivative liabilities (including noncurrent portion) 215,383 127,351 245,865
There were no transfers from Level 1 and Level 2 fair value measurements as of March 31, 2011 and 2010, and December 31, 2010. The Globe Group has no financial instruments classified under Level 3.
13. Operating Segment Information
The Globe Group’s reportable segments consist of: (1) mobile communications services; (2) wireline communication services; and (3) others, which the Globe Group operate and manage as strategic business units and organize by products and services. The Globe Group presents its various operating segments based on segment net income.
Intersegment transfers or transactions are entered into under the normal commercial terms and conditions that would also be available to unrelated third parties. Segment revenue, segment expense and segment result include transfers between business segments. Those transfers are eliminated in consolidation.
Most of revenues are derived from operations within the Philippines, hence, the Globe Group does not present geographical information required by PFRS 8. The Globe Group does not have a single customer that will meet the 10% reporting criteria.
The Globe Group also presents the different product types that are included in the report that is regularly reviewed by the chief operating decision maker in assessing the operating segments performance.
Segment assets and liabilities are not measures used by the chief operating decision maker since the assets and liabilities are managed on a group basis.

- 38 -
The Globe Group’s segment information is as follows:
March 31, 2011 Mobile Wireline Communications Communications Services Services Others Consolidated (Unaudited and In Thousands Pesos) REVENUES: Service revenues External customers: Voice P=6,111,649 P=654,370 P=– P=13,686,467 Data 6,936,196 949,478 12,332 977,558 Broadband – 1,787,816 – 1,787,816 Nonservice revenues: External customers 807,749 209,729 – 1,017,478 Segment revenues 13,855,594 3,601,393 12,332 17,469,319 EBITDA 8,233,726 884,673 (27,278) 9,091,121 Depreciation and amortization (2,635,340) (1,709,372) (2,626) (4,347,338) EBIT 5,598,386 (824,699) (29,904) 4,743,783 NET INCOME (LOSS) BEFORE TAX2 5,100,234 (800,489) (29,959) 4,269,786 Provision for income tax2 (1,224,062) (52,489) (1,822) (1,278,373) NET INCOME (LOSS) P=3,876,172 (P=852,978) (P=31,781) P=2,991,413 Other segment information Intersegment revenues P=10,501 (P=61,735) (P=26,933) (P=78,167) Subsidy1 (384,133) (58,889) – (443,022) Interest income2 56,225 17,004 17 73,246 Interest expense (520,757) (1,448) – (522,205) Equity in net income of joint ventures 1,592 – – 1,592 Impairment losses and others (209,583) (237,333) – (446,916) Capital expenditure 4,404,172 1,060,177 1,237 5,465,586 Cash Flows Net cash provided by (used in): Operating activities 7,556,521 1,965,202 2,425 9,524,148 Investing activities (2,497,623) (983,985) (1,220) (3,482,828) Financing activities (4,625,180) – – (4,625,180)
1 Computed as non-service revenues less cost of sales 2 Net of final taxes

- 39 -
March 31, 2010 Mobile Wireline Communications Communications Services Services Others Consolidated Unaudited and In Thousand Pesos REVENUES: Service revenues External customers: Voice P= 6,304,357 P= 696,416 P=– P=7,000,773 Data 6,206,774 830,686 19,277 7,056,737 Broadband – 1,173,439 – 1,173,439 Nonservice revenues: External customers 517,327 93,264 – 610,591 Segment revenues 13,028,458 2,793,805 19,277 15,841,540 EBITDA 8,414,170 268,655 (31,805) 8,651,020 Depreciation and amortization (2,781,747) (1,455,440) (1,054) (4,238,241) EBIT 5,632,423 (1,186,785) (32,859) 4,412,779 NET INCOME (LOSS) BEFORE TAX2 5,376,927 (1,162,796) (32,847) 4,181,284 Benefit from (provision for) income tax2 (1,298,789) 64,009 – (1,234,780) NET INCOME (LOSS) P=4,078,138 (P=1,098,787) (P=32,847) P=2,946,504 Other segment information Intersegment revenues (P=5,447) (P=47,194) (P=21,809) (P=74,450) Subsidy1 (133,209) (125,141) – (258,350) Interest income2 36,274 6,239 19 42,532 Interest expense (455,374) (2,656) (15) (458,045) Equity in net losses of joint ventures (2,159) – – (2,159) Impairment losses and others (193,883) (206,429) – (400,312) Capital expenditure 4,089,887 1,478,935 796 5,569,618 Cash Flows Net cash provided by (used in): Operating activities 6,465,801 1,327,692 1,178 7,794,671 Investing activities (3,163,483) (1,318,801) (792) (4,483,076) Financing activities (5,286,452) – (430) (5,286,882)
1 Computed as non-service revenues less cost of sales 2 Net of final taxes

- 40 -
December 31, 2010
Mobile Wireline Communications Communications Services Services Others Consolidated (Audited and In Thousand Pesos) REVENUES: Service revenues External customers: Voice P=25,970,607 P=2,815,565 P=– P=28,786,172 Data 24,451,917 3,487,999 80,335 28,020,251 Broadband – 5,748,266 – 5,748,266 Nonservice revenues: External customers 2,374,542 618,759 – 2,993,301 Segment revenues 52,797,066 12,670,589 80,335 65,547,990 EBITDA 31,907,454 1,716,592 (84,928) 33,539,118 Depreciation and amortization (11,734,900) (6,346,429) (4,510) (18,085,839) EBIT 20,172,554 (4,629,837) (89,438) 15,453,279 INCOME ( LOSS) BEFORE TAX2 18,768,054 (4,661,415) (89,919) 14,016,720 Benefit from (provision for) income tax2 (4,518,236) 246,150 – (4,272,086) NET INCOME (LOSS) P=14,249,818 (P=4,415,265) (P=89,919) P=9,744,634 Other segment information: Intersegment revenues P=35,545 (P=191,933) (P=107,080) (P=263,468) Subsidy1 (900,760) (344,899) – (1,245,659) Interest income2 168,300 28,666 94 197,060 Interest expense (1,975,932) (5,823) (30) (1,981,785) Equity in net losses of a joint venture (2,968) – – (2,968) Impairment losses and others (838,169) (711,279) – (1,549,448) Capital expenditure (13,982,817) (5,478,589) (5,467) (19,466,873) Cash Flows Net cash provided by (used in): Operating activities 21,802,415 5,338,255 7,707 27,148,377 Investing activities (12,194,022) (4,729,510) (5,281) (16,928,813) Financing activities (10,171,150) – (859) (10,172,009) 1 Computed as non-service revenues less cost of sales 2 Net of final taxes

- 41 -
A reconciliation of segment revenue to the total revenues presented in the consolidated statements of comprehensive income is shown below:
March 31 December 31
2011
(Unaudited)2010
(Unaudited) 2010
(Audited) (In Thousand Pesos) Segment revenues P=17,469,319 P=15,841,540 P=65,547,990 Interest income 84,851 53,890 218,532 Other income - net 118,153 304,149 856,941 Gain on disposal of property and
equipment - net 60,193 16,938 52,449 Total revenues P=17,732,516 P=16,216,517 P=66,675,912
The reconciliation of the EBITDA to income before income tax presented in the consolidated statements of comprehensive income is shown below:
March 31 December 31
2011
(Unaudited) 2010
(Unaudited) 2010
(Audited) (In Thousand Pesos) EBITDA P=9,091,121 P=8,651,020 P=33,539,118 Depreciation and amortization (4,347,338) (4,238,241) (18,085,839) Interest income 84,851 53,890 218,532 Gain on disposal of property and
equipment - net 60,193 16,938 52,449 Financing costs (562,745) (478,326) (2,068,401) Equity in net income (losses) of joint
ventures 1,592 (2,159) (2,968) Other items (46,283) 189,520 385,301 INCOME BEFORE INCOME TAX P=4,281,391 P=4,192,642 P=14,038,192
13.1 Mobile Communications Services This reporting segment is made up of digital cellular telecommunications services that
allow subscribers to make and receive local, domestic long distance and international long distance calls, international roaming calls and other value added services in any place within the coverage areas.
13.1.1 Mobile communication voice net service revenues include the following:
a) Monthly service fees on postpaid plans; b) Charges for intra-network and outbound calls in excess of the consumable
minutes for various Globe Postpaid plans, including currency exchange rate adjustments (CERA) net of loyalty discounts credited to subscriber billings;
c) Airtime fees for intra network and outbound calls recognized upon the earlier of actual usage of the airtime value or expiration of the unused value of the prepaid reload denomination (for Globe Prepaid and TM) which occurs between 1 and 60 days after activation depending on the prepaid value reloaded by the subscriber net of (i) bonus credits and (ii) prepaid reload discounts; and
d) Revenues generated from inbound international and national long distance calls and international roaming calls.
Revenues from (a) to (d) are net of any settlement payouts to international and
local carriers.

- 42 -
13.1.2 Mobile communication data net service revenues consist of revenues from
value-added services such as inbound and outbound SMS and MMS, content downloading, browsing and infotext, subscription fees on unlimited and bucket prepaid SMS services net of any settlement payouts to international and local carriers and content providers.
13.1.3 Globe Telecom offers its wireless communications services to consumers,
corporate and SME clients through the following three (3) brands: Globe Postpaid, Globe Prepaid and Touch Mobile.
The Globe Group also provides its subscribers with mobile payment and remittance services under the GCash brand.
13.2 Wireline Communications Services
This reporting segment is made up of fixed line telecommunications services which offer subscribers local, domestic long distance and international long distance voice services in addition to broadband and mobile internet services and a number of VAS in various areas covered by the Certificate of Public Convenience and Necessity (CPCN) granted by the NTC.
13.2.1 Wireline voice net service revenues consist of the following:
a) Monthly service fees including CERA of voice-only subscriptions; b) Revenues from local, international and national long distance calls made by
postpaid, prepaid wireline subscribers and payphone customers, as well as broadband customers who have subscribed to data packages bundled with a voice service. Revenues are net of prepaid and payphone call card discounts;
c) Revenues from inbound local, international and national long distance calls from other carriers terminating on our network;
d) Revenues from additional landline features such as caller ID, call waiting, call forwarding, multi-calling, voice mail, duplex and hotline numbers and other value-added features; and
e) Installation charges and other one-time fees associated with the establishment of the service.
Revenues from (a) to (c) are net of any settlement payments to domestic and international carriers.
13.2.2 Wireline data net service revenues consist of the following:
a) Monthly service fees from international and domestic leased lines. This is net
of any settlement payments to other carriers; b) Other wholesale transport services; c) Revenues from value-added services; and d) One-time connection charges associated with the establishment of service.
13.2.3 Broadband service revenues consist of the following:
a) Monthly service fees on mobile and wired broadband plans and charges for
usage in excess of plan minutes; and b) Prepaid usage charges consumed by mobile broadband subscribers.

- 43 -
13.2.4 Innove provides wireline voice communications (local, national and international long distance), data and broadband and data services to consumers, corporate and SME clients in the Philippines.
• Consumers - the Globe Group’s postpaid voice service provides basic
landline services including toll-free NDD calls to other Globe landline subscribers for a fixed monthly fee. For wired broadband, consumers can choose between broadband services bundled with a voice line, or a broadband data-only service. For fixed wireless broadband connection using 3G with High-Speed Downlink Packet Access (HSDPA) network, the Globe Group offers broadband packages bundled with voice, or broadband data-only service. For subscribers who require full mobility, Globe Broadband Tattoo service come in postpaid and prepaid packages and allow them to access the internet via 3G with HSDPA, Enhanced Datarate for GSM Evolution (EDGE), General Packet Radio Service (GPRS) or WiFi at hotspots located nationwide.
• Corporate/SME clients - for corporate and SME enterprise clients wireline
voice communication needs, the Globe Group offers postpaid service bundles which come with a business landline and unlimited dial-up internet access. The Globe Group also provides a full suite of telephony services from basic direct lines to Integrated Services Digital Network (ISDN) services, 1-800 numbers, International Direct Dialing (IDD) and National Direct Dialing (NDD) access as well as managed voice solutions such as Voice Over Internet Protocol (VOIP) and managed Internet Protocol (IP) communications. Value-priced, high speed data services, wholesale and corporate internet access, data center services and segment-specific solutions customized to the needs of vertical industries.
13.3 Others
This reporting segment represents mobile value added data content and application development services. Revenues principally consist of revenue share with various carriers on content downloaded by their subscribers and contracted fees for other application development services provided to various partners.
14. Note to Condensed Consolidated Statements of Cash Flows
The principal noncash transactions are as follows:
March 31 December 31
2011
(Unaudited) 2010
(Unaudited) 2010
(Audited) (In Thousand Pesos) Increase in liabilities related to the acquisition of property and equipment P=1,827,443 P=634,642 P=612,613 Capitalized ARO 2,904 2,216 41,473