SECURITIES AND EXCHANGE COMMISSION - Annual …pdf.secdatabase.com/1806/0000088053-17-000445.pdf ·...
22
Business Address 345 PARK AVENUE NEW YORK NY 10154-0004 212-454-6778 Mailing Address 345 PARK AVENUE NEW YORK NY 10154-0004 SECURITIES AND EXCHANGE COMMISSION FORM N-Q Quarterly schedule of portfolio holdings of registered management investment company filed on Form N-Q Filing Date: 2017-03-28 | Period of Report: 2017-01-31 SEC Accession No. 0000088053-17-000445 (HTML Version on secdatabase.com) FILER DEUTSCHE MARKET TRUST CIK:95603| IRS No.: 366103490 | State of Incorp.:MA | Fiscal Year End: 1031 Type: N-Q | Act: 40 | File No.: 811-01236 | Film No.: 17718543 Copyright © 2017 www.secdatabase.com . All Rights Reserved. Please Consider the Environment Before Printing This Document
Transcript of SECURITIES AND EXCHANGE COMMISSION - Annual …pdf.secdatabase.com/1806/0000088053-17-000445.pdf ·...

Business Address345 PARK AVENUENEW YORK NY 10154-0004212-454-6778
Mailing Address345 PARK AVENUENEW YORK NY 10154-0004
SECURITIES AND EXCHANGE COMMISSION
FORM N-QQuarterly schedule of portfolio holdings of registered management investment company filed
on Form N-Q
Filing Date: 2017-03-28 | Period of Report: 2017-01-31SEC Accession No. 0000088053-17-000445
(HTML Version on secdatabase.com)
FILERDEUTSCHE MARKET TRUSTCIK:95603| IRS No.: 366103490 | State of Incorp.:MA | Fiscal Year End: 1031Type: N-Q | Act: 40 | File No.: 811-01236 | Film No.: 17718543
Copyright © 2017 www.secdatabase.com. All Rights Reserved.Please Consider the Environment Before Printing This Document

UNITED STATESSECURITIES AND EXCHANGE COMMISSION
Washington, DC 20549
FORM N-QQUARTERLY SCHEDULE OF PORTFOLIO HOLDINGS OF REGISTERED
MANAGEMENT INVESTMENT COMPANY_______________________________
Investment Company Act file number: 811-01236
Deutsche Market Trust(Exact name of registrant as specified in charter)
345 Park AvenueNew York, NY 10154
(Address of principal executive offices) (Zip code)
Paul Schubert60 Wall Street
New York, NY 10005(Name and address of agent for service)
Registrant's telephone number, including area code: (212) 250-3220
Date of fiscal year end: 10/31
Date of reporting period: 1/31/2017
ITEM 1. SCHEDULE OF INVESTMENTS
Investment Portfolio as of January 31, 2017 (Unaudited)
Deutsche Global Income Builder Fund
Shares Value ($)
Common Stocks 57.7%
Consumer Discretionary 4.7%
Automobiles 0.5%Mazda Motor Corp. 117,900 1,722,277Toyota Motor Corp. 43,200 2,501,548
4,223,825Hotels, Restaurants & Leisure 0.5%Galaxy Entertainment Group Ltd. 428,200 2,032,271McDonald's Corp. 2,619 321,011SJM Holdings Ltd. 1,812,300 1,440,129
3,793,411Internet & Direct Marketing Retail 0.5%Amazon.com, Inc.* 4,676 3,850,592
Media 1.7%Altice NV "B"* 47,526 1,047,027Comcast Corp. "A" 89,902 6,780,409
Copyright © 2017 www.secdatabase.com. All Rights Reserved.Please Consider the Environment Before Printing This Document

Discovery Communications, Inc. "A"* 33,399 946,861Liberty Media Corp.-Liberty Braves "C"* 6,270 125,274Liberty Media Corp.-Liberty Formula One "C"* 15,574 447,597Liberty Media Corp.-Liberty SiriusXM "C"* 62,397 2,239,428Twenty-First Century Fox, Inc. "B" 61,279 1,900,262Walt Disney Co. 4,301 475,906
13,962,764Multiline Retail 0.4%Dollarama, Inc. 37,512 2,840,966
Specialty Retail 1.1%Dixons Carphone PLC 526,884 2,092,141Home Depot, Inc. 38,637 5,315,678Kingfisher PLC 322,008 1,362,946
8,770,765
Consumer Staples 7.1%
Beverages 1.1%Coca-Cola Co. 150,618 6,261,190PepsiCo, Inc. 23,389 2,427,311
8,688,501Food & Staples Retailing 0.5%Costco Wholesale Corp. 27,129 4,447,799
Food Products 2.4%General Mills, Inc. 86,908 5,430,012Kellogg Co. 62,022 4,509,620Kerry Group PLC "A" 38,075 2,675,397McCormick & Co., Inc. 52,483 5,014,751Orkla ASA 161,282 1,504,586
19,134,366Household Products 2.3%Church & Dwight Co., Inc. 37,418 1,692,042Clorox Co. 38,356 4,602,720Kimberly-Clark Corp. 50,796 6,152,920Procter & Gamble Co. 65,609 5,747,348
18,195,030Tobacco 0.8%Altria Group, Inc. 6,645 472,991Philip Morris International, Inc. 62,585 6,016,296
6,489,287
Energy 3.9%
Energy Equipment & Services 0.7%TechnipFMC PLC* 148,186 4,856,590WorleyParsons Ltd.* 69,974 521,859
5,378,449Oil, Gas & Consumable Fuels 3.2%Delek Group Ltd. 10,758 2,322,344Exxon Mobil Corp. 53,509 4,488,870Inpex Corp. 244,900 2,391,847Lundin Petroleum AB* 141,823 3,057,748Repsol SA 252,590 3,728,166Royal Dutch Shell PLC "B" 75,406 2,121,163TOTAL SA 109,643 5,523,194Woodside Petroleum Ltd. 94,578 2,257,469
25,890,801
Financials 11.3%
Banks 5.2%Banco Santander SA 391,325 2,173,496Bank Leumi Le-Israel BM* 326,121 1,348,072Bank of America Corp. 182,986 4,142,803
Copyright © 2017 www.secdatabase.com. All Rights Reserved.Please Consider the Environment Before Printing This Document

Bank of Ireland* 8,145,273 2,180,206Canadian Imperial Bank of Commerce 19,366 1,649,142Citigroup, Inc. 62,960 3,515,057ING Groep NV 326,684 4,672,683JPMorgan Chase & Co. 78,581 6,650,310Toronto-Dominion Bank 170,359 8,825,284Wells Fargo & Co. 109,643 6,176,190
41,333,243Capital Markets 1.5%CI Financial Corp. 217,229 4,540,733Macquarie Group Ltd. 65,110 4,164,249Schroders PLC 91,308 3,371,152
12,076,134Consumer Finance 0.4%Discover Financial Services 48,645 3,370,126
Diversified Financial Services 1.4%Berkshire Hathaway, Inc. "B"* 44,532 7,309,483Onex Corp. 58,753 4,111,468
11,420,951Insurance 2.6%Arthur J. Gallagher & Co. 183,829 9,895,515Marsh & McLennan Companies, Inc. 60,341 4,104,395RenaissanceRe Holdings Ltd. 50,889 6,937,188
20,937,098Thrifts & Mortgage Finance 0.2%New York Community Bancorp., Inc. 105,248 1,598,717
Health Care 6.3%
Biotechnology 1.3%CSL Ltd. 42,382 3,608,616Grifols SA 320,883 6,863,513
10,472,129Health Care Equipment & Supplies 0.8%Medtronic PLC 43,313 3,292,654Smith & Nephew PLC 218,160 3,248,163
6,540,817Health Care Providers & Services 0.7%DaVita, Inc.* 25,167 1,604,396Henry Schein, Inc.* 25,073 4,008,170
5,612,566Life Sciences Tools & Services 0.1%Agilent Technologies, Inc. 21,047 1,030,672
Pharmaceuticals 3.4%Allergan PLC* 6,645 1,454,524AstraZeneca PLC 46,495 2,459,153GlaxoSmithKline PLC 184,705 3,557,457Johnson & Johnson 58,003 6,568,840Merck & Co., Inc. 70,911 4,395,773Orion Oyj "B" 82,888 3,853,608Pfizer, Inc. 110,205 3,496,805Sanofi 14,322 1,152,449
26,938,609
Industrials 7.1%
Aerospace & Defense 0.3%General Dynamics Corp. 11,696 2,117,912
Air Freight & Logistics 0.6%United Parcel Service, Inc. "B" 41,350 4,512,526
Commercial Services & Supplies 0.9%Quad Graphics, Inc. 67 1,754
Copyright © 2017 www.secdatabase.com. All Rights Reserved.Please Consider the Environment Before Printing This Document
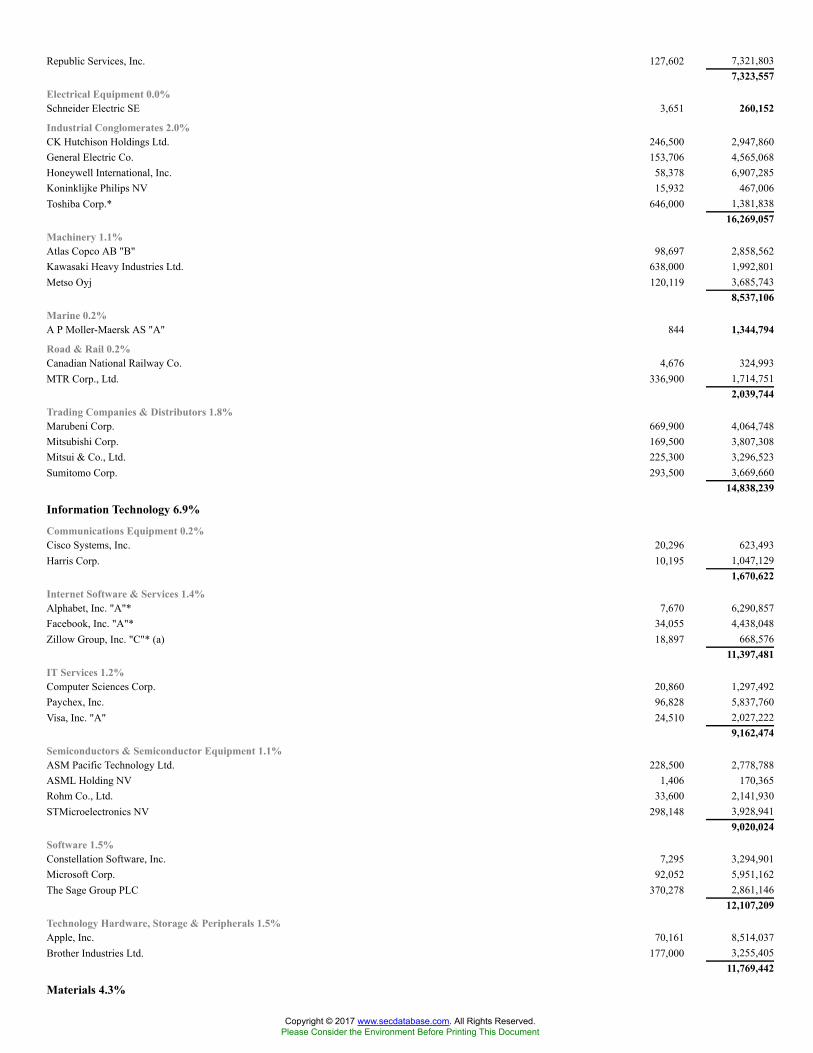
Republic Services, Inc. 127,602 7,321,8037,323,557
Electrical Equipment 0.0%Schneider Electric SE 3,651 260,152
Industrial Conglomerates 2.0%CK Hutchison Holdings Ltd. 246,500 2,947,860General Electric Co. 153,706 4,565,068Honeywell International, Inc. 58,378 6,907,285Koninklijke Philips NV 15,932 467,006Toshiba Corp.* 646,000 1,381,838
16,269,057Machinery 1.1%Atlas Copco AB "B" 98,697 2,858,562Kawasaki Heavy Industries Ltd. 638,000 1,992,801Metso Oyj 120,119 3,685,743
8,537,106Marine 0.2%A P Moller-Maersk AS "A" 844 1,344,794
Road & Rail 0.2%Canadian National Railway Co. 4,676 324,993MTR Corp., Ltd. 336,900 1,714,751
2,039,744Trading Companies & Distributors 1.8%Marubeni Corp. 669,900 4,064,748Mitsubishi Corp. 169,500 3,807,308Mitsui & Co., Ltd. 225,300 3,296,523Sumitomo Corp. 293,500 3,669,660
14,838,239
Information Technology 6.9%
Communications Equipment 0.2%Cisco Systems, Inc. 20,296 623,493Harris Corp. 10,195 1,047,129
1,670,622Internet Software & Services 1.4%Alphabet, Inc. "A"* 7,670 6,290,857Facebook, Inc. "A"* 34,055 4,438,048Zillow Group, Inc. "C"* (a) 18,897 668,576
11,397,481IT Services 1.2%Computer Sciences Corp. 20,860 1,297,492Paychex, Inc. 96,828 5,837,760Visa, Inc. "A" 24,510 2,027,222
9,162,474Semiconductors & Semiconductor Equipment 1.1%ASM Pacific Technology Ltd. 228,500 2,778,788ASML Holding NV 1,406 170,365Rohm Co., Ltd. 33,600 2,141,930STMicroelectronics NV 298,148 3,928,941
9,020,024Software 1.5%Constellation Software, Inc. 7,295 3,294,901Microsoft Corp. 92,052 5,951,162The Sage Group PLC 370,278 2,861,146
12,107,209Technology Hardware, Storage & Peripherals 1.5%Apple, Inc. 70,161 8,514,037Brother Industries Ltd. 177,000 3,255,405
11,769,442
Materials 4.3%
Copyright © 2017 www.secdatabase.com. All Rights Reserved.Please Consider the Environment Before Printing This Document

Chemicals 3.0%AdvanSix, Inc.* 2,319 59,575GEO Specialty Chemicals, Inc.* 57,540 22,193Israel Chemicals Ltd. 457,467 2,100,481Koninklijke DSM NV 89,527 5,715,532Shin-Etsu Chemical Co., Ltd. 12,300 1,060,371Solvay SA 37,794 4,427,651The Israel Corp., Ltd.* 12,533 2,353,259Umicore SA 105,992 5,920,493Yara International ASA 56,222 2,373,202
24,032,757Construction Materials 0.7%CRH PLC 175,222 6,062,846
Metals & Mining 0.6%JFE Holdings, Inc. 13,000 226,961Kobe Steel Ltd.* 181,200 1,755,851Sumitomo Metal Mining Co., Ltd. 211,000 2,847,435
4,830,247
Real Estate 2.0%
Equity Real Estate Investment Trusts (REITs) 1.5%Federal Realty Investment Trust 39,944 5,609,336Public Storage 21,328 4,585,520Regency Centers Corp. 31,343 2,185,547
12,380,403Real Estate Management & Development 0.5%Wharf Holdings Ltd. 474,500 3,566,813
Telecommunication Services 2.2%
Diversified Telecommunication Services 2.1%AT&T, Inc. 223,217 9,410,829Telecom Italia SpA (RSP)* 611,079 437,265Verizon Communications, Inc. 138,751 6,800,187
16,648,281Wireless Telecommunication Services 0.1%SoftBank Group Corp. 12,400 955,793
Utilities 1.9%
Electric Utilities 1.5%Alliant Energy Corp. 171,665 6,463,187Pinnacle West Capital Corp. 8,139 631,831Southern Co. 101,130 4,998,856
12,093,874Multi-Utilities 0.3%DTE Energy Co. 26,754 2,639,015
Water Utilities 0.1%American Water Works Co., Inc. 5,051 370,945Total Common Stocks (Cost $414,084,789) 462,948,931
Preferred Stocks 0.3%
Consumer DiscretionaryBayerische Motoren Werke (BMW) AG 21,516 1,614,137Volkswagen AG 6,551 1,015,530Total Preferred Stocks (Cost $2,671,160) 2,629,667
Warrant 0.0%
MaterialsHercules Trust II, Expiration Date 3/31/2029* (Cost $90,209) 506 4,123
PrincipalAmount ($) (b) Value ($)
Copyright © 2017 www.secdatabase.com. All Rights Reserved.Please Consider the Environment Before Printing This Document

Corporate Bonds 22.5%
Consumer Discretionary 3.9%1011778 B.C. Unlimited Liability Co., 144A, 4.625%, 1/15/2022 90,000 92,36321st Century Fox America, Inc., 144A, 3.375%, 11/15/2026 2,322,000 2,260,613Ally Financial, Inc., 4.125%, 3/30/2020 205,000 208,331Altice Financing SA, 144A, 7.5%, 5/15/2026 1,800,000 1,899,000AmeriGas Finance LLC, 7.0%, 5/20/2022 239,000 250,651Asbury Automotive Group, Inc., 6.0%, 12/15/2024 105,000 107,363Ashton Woods U.S.A. LLC, 144A, 6.875%, 2/15/2021 215,000 210,700Boyd Gaming Corp., 6.875%, 5/15/2023 105,000 112,749CCO Holdings LLC, 144A, 5.875%, 5/1/2027 2,035,000 2,159,013Cequel Communications Holdings I LLC, 144A, 5.125%, 12/15/2021 1,390,000 1,409,112
Charter Communications Operating LLC:3.579%, 7/23/2020 190,000 194,6474.908%, 7/23/2025 130,000 136,696
Churchill Downs, Inc., 5.375%, 12/15/2021 121,000 125,537Clear Channel Worldwide Holdings, Inc., Series B, 6.5%, 11/15/2022 595,000 621,180
CSC Holdings LLC:5.25%, 6/1/2024 185,000 185,925144A, 5.5%, 4/15/2027 1,800,000 1,827,000144A, 10.125%, 1/15/2023 1,000,000 1,159,380
CVS Health Corp., 5.125%, 7/20/2045 230,000 252,961Dana, Inc., 5.5%, 12/15/2024 170,000 176,800
DISH DBS Corp.:4.25%, 4/1/2018 290,000 295,8005.0%, 3/15/2023 845,000 831,2697.875%, 9/1/2019 1,120,000 1,233,400
Dollar Tree, Inc., 5.75%, 3/1/2023 247,000 261,573Fiat Chrysler Automobiles NV, 4.5%, 4/15/2020 (a) 380,000 388,588Ford Motor Co., 5.291%, 12/8/2046 150,000 148,912Ford Motor Credit Co., LLC, 5.875%, 8/2/2021 3,250,000 3,615,209General Motors Co., 6.6%, 4/1/2036 110,000 126,697
General Motors Financial Co., Inc.:3.2%, 7/13/2020 420,000 423,0693.2%, 7/6/2021 255,000 253,793
Goodyear Tire & Rubber Co., 5.0%, 5/31/2026 135,000 136,012
Group 1 Automotive, Inc.:5.0%, 6/1/2022 500,000 506,250144A, 5.25%, 12/15/2023 160,000 160,400
Hanesbrands, Inc., 144A, 4.875%, 5/15/2026 205,000 201,925MDC Partners, Inc., 144A, 6.5%, 5/1/2024 50,000 43,500Mediacom Broadband LLC, 6.375%, 4/1/2023 145,000 151,887
MGM Resorts International:6.625%, 12/15/2021 1,095,000 1,220,9256.75%, 10/1/2020 380,000 420,850
Nielsen Finance LLC, 144A, 5.0%, 4/15/2022 105,000 107,231Penske Automotive Group, Inc., 5.5%, 5/15/2026 165,000 164,175Quebecor Media, Inc., 5.75%, 1/15/2023 130,000 136,175SFR Group SA, 144A, 6.0%, 5/15/2022 700,000 720,125Sirius XM Radio, Inc., 144A, 5.375%, 7/15/2026 70,000 71,138Springs Industries, Inc., 6.25%, 6/1/2021 210,000 217,350The Gap, Inc., 5.95%, 4/12/2021 (a) 680,000 717,486Time Warner, Inc., 3.8%, 2/15/2027 480,000 468,180Unitymedia Hessen GmbH & Co., KG, 144A, 5.5%, 1/15/2023 2,855,000 2,969,200UPCB Finance IV Ltd., 144A, 5.375%, 1/15/2025 1,045,000 1,060,675
Viking Cruises Ltd.:144A, 6.25%, 5/15/2025 265,000 254,400144A, 8.5%, 10/15/2022 195,000 204,994
Copyright © 2017 www.secdatabase.com. All Rights Reserved.Please Consider the Environment Before Printing This Document

Virgin Media Secured Finance PLC, 144A, 5.25%, 1/15/2026 375,000 376,264Walgreens Boots Alliance, Inc., 4.8%, 11/18/2044 200,000 203,646
31,481,119
Consumer Staples 0.8%Anheuser-Busch InBev Finance, Inc., 4.9%, 2/1/2046 310,000 331,733Aramark Services, Inc., 5.125%, 1/15/2024 90,000 93,524
Cott Beverages, Inc.:5.375%, 7/1/2022 575,000 588,8006.75%, 1/1/2020 250,000 259,125
Danone SA, 144A, 2.947%, 11/2/2026 295,000 280,856JBS U.S.A. LUX SA, 144A, 8.25%, 2/1/2020 1,840,000 1,886,000Kellogg Co., 2.65%, 12/1/2023 1,540,000 1,507,737Kraft Heinz Foods Co., 4.375%, 6/1/2046 140,000 130,884Minerva Luxembourg SA, 144A, 12.25%, 2/10/2022 1,000,000 1,065,000Molson Coors Brewing Co., 4.2%, 7/15/2046 160,000 148,486
Smithfield Foods, Inc.:144A, 3.35%, 2/1/2022 (c) 95,000 95,511144A, 4.25%, 2/1/2027 (c) 115,000 116,304
The WhiteWave Foods Co., 5.375%, 10/1/2022 155,000 168,5636,672,523
Energy 5.1%
Anadarko Petroleum Corp.:4.85%, 3/15/2021 70,000 75,2465.55%, 3/15/2026 (a) 150,000 168,739
Antero Resources Corp., 5.125%, 12/1/2022 440,000 443,300Blue Racer Midstream LLC, 144A, 6.125%, 11/15/2022 65,000 66,625Carrizo Oil & Gas, Inc., 6.25%, 4/15/2023 180,000 184,725Cheniere Corpus Christi Holdings LLC, 144A, 7.0%, 6/30/2024 1,800,000 2,009,250ConocoPhillips Co., 4.15%, 11/15/2034 170,000 167,836Delek & Avner Tamar Bond Ltd., 144A, 5.082%, 12/30/2023 250,000 260,312Empresa Nacional del Petroleo, 144A, 3.75%, 8/5/2026 1,600,000 1,528,000Enbridge, Inc., 5.5%, 12/1/2046 485,000 524,241Encana Corp., 5.15%, 11/15/2041 300,000 285,081Energy Transfer Partners LP, 5.95%, 10/1/2043 110,000 116,006Halliburton Co., 4.85%, 11/15/2035 185,000 198,116Hilcorp Energy I LP, 144A, 5.75%, 10/1/2025 370,000 373,237KazMunayGas National Co. JSC, 144A, 9.125%, 7/2/2018 3,500,000 3,794,000
Kinder Morgan Energy Partners LP:4.7%, 11/1/2042 150,000 140,5786.375%, 3/1/2041 50,000 55,709
Korea National Oil Corp., 144A, 2.125%, 4/14/2021 320,000 310,358Laredo Petroleum, Inc., 6.25%, 3/15/2023 (a) 210,000 219,712Lukoil International Finance BV, 144A, 6.656%, 6/7/2022 3,500,000 3,893,750Marathon Oil Corp., 5.2%, 6/1/2045 610,000 596,481Newfield Exploration Co., 5.375%, 1/1/2026 105,000 108,675Noble Holding International Ltd., 5.25%, 3/16/2018 60,000 60,450Oasis Petroleum, Inc., 6.875%, 3/15/2022 (a) 80,000 82,000Pertamina Persero PT, 144A, 5.25%, 5/23/2021 3,520,000 3,722,375
Petrobras Global Finance BV:6.125%, 1/17/2022 (a) 936,000 965,4848.375%, 5/23/2021 7,000,000 7,805,000
Petroleos Mexicanos:4.625%, 9/21/2023 2,265,000 2,208,375144A, 5.375%, 3/13/2022 729,000 743,179
Plains All American Pipeline LP:2.85%, 1/31/2023 230,000 221,0904.3%, 1/31/2043 380,000 322,3814.5%, 12/15/2026 685,000 693,187
Copyright © 2017 www.secdatabase.com. All Rights Reserved.Please Consider the Environment Before Printing This Document
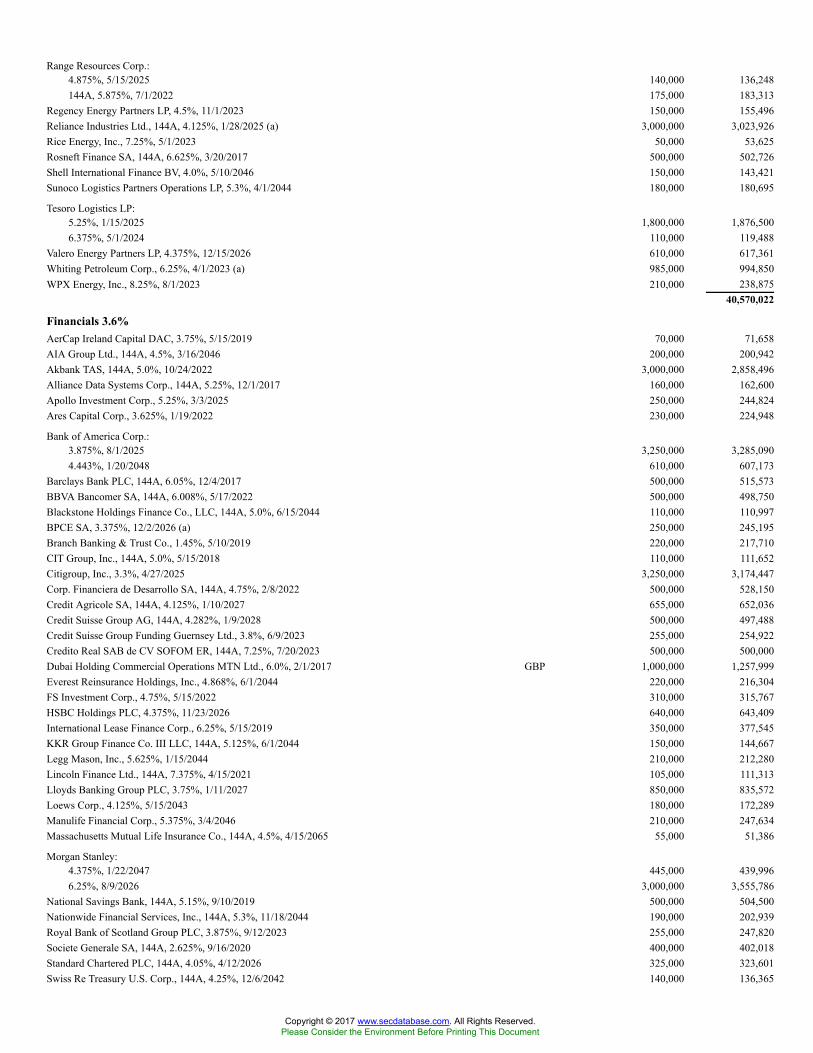
Range Resources Corp.:4.875%, 5/15/2025 140,000 136,248144A, 5.875%, 7/1/2022 175,000 183,313
Regency Energy Partners LP, 4.5%, 11/1/2023 150,000 155,496Reliance Industries Ltd., 144A, 4.125%, 1/28/2025 (a) 3,000,000 3,023,926Rice Energy, Inc., 7.25%, 5/1/2023 50,000 53,625Rosneft Finance SA, 144A, 6.625%, 3/20/2017 500,000 502,726Shell International Finance BV, 4.0%, 5/10/2046 150,000 143,421Sunoco Logistics Partners Operations LP, 5.3%, 4/1/2044 180,000 180,695
Tesoro Logistics LP:5.25%, 1/15/2025 1,800,000 1,876,5006.375%, 5/1/2024 110,000 119,488
Valero Energy Partners LP, 4.375%, 12/15/2026 610,000 617,361Whiting Petroleum Corp., 6.25%, 4/1/2023 (a) 985,000 994,850WPX Energy, Inc., 8.25%, 8/1/2023 210,000 238,875
40,570,022
Financials 3.6%AerCap Ireland Capital DAC, 3.75%, 5/15/2019 70,000 71,658AIA Group Ltd., 144A, 4.5%, 3/16/2046 200,000 200,942Akbank TAS, 144A, 5.0%, 10/24/2022 3,000,000 2,858,496Alliance Data Systems Corp., 144A, 5.25%, 12/1/2017 160,000 162,600Apollo Investment Corp., 5.25%, 3/3/2025 250,000 244,824Ares Capital Corp., 3.625%, 1/19/2022 230,000 224,948
Bank of America Corp.:3.875%, 8/1/2025 3,250,000 3,285,0904.443%, 1/20/2048 610,000 607,173
Barclays Bank PLC, 144A, 6.05%, 12/4/2017 500,000 515,573BBVA Bancomer SA, 144A, 6.008%, 5/17/2022 500,000 498,750Blackstone Holdings Finance Co., LLC, 144A, 5.0%, 6/15/2044 110,000 110,997BPCE SA, 3.375%, 12/2/2026 (a) 250,000 245,195Branch Banking & Trust Co., 1.45%, 5/10/2019 220,000 217,710CIT Group, Inc., 144A, 5.0%, 5/15/2018 110,000 111,652Citigroup, Inc., 3.3%, 4/27/2025 3,250,000 3,174,447Corp. Financiera de Desarrollo SA, 144A, 4.75%, 2/8/2022 500,000 528,150Credit Agricole SA, 144A, 4.125%, 1/10/2027 655,000 652,036Credit Suisse Group AG, 144A, 4.282%, 1/9/2028 500,000 497,488Credit Suisse Group Funding Guernsey Ltd., 3.8%, 6/9/2023 255,000 254,922Credito Real SAB de CV SOFOM ER, 144A, 7.25%, 7/20/2023 500,000 500,000Dubai Holding Commercial Operations MTN Ltd., 6.0%, 2/1/2017 GBP 1,000,000 1,257,999Everest Reinsurance Holdings, Inc., 4.868%, 6/1/2044 220,000 216,304FS Investment Corp., 4.75%, 5/15/2022 310,000 315,767HSBC Holdings PLC, 4.375%, 11/23/2026 640,000 643,409International Lease Finance Corp., 6.25%, 5/15/2019 350,000 377,545KKR Group Finance Co. III LLC, 144A, 5.125%, 6/1/2044 150,000 144,667Legg Mason, Inc., 5.625%, 1/15/2044 210,000 212,280Lincoln Finance Ltd., 144A, 7.375%, 4/15/2021 105,000 111,313Lloyds Banking Group PLC, 3.75%, 1/11/2027 850,000 835,572Loews Corp., 4.125%, 5/15/2043 180,000 172,289Manulife Financial Corp., 5.375%, 3/4/2046 210,000 247,634Massachusetts Mutual Life Insurance Co., 144A, 4.5%, 4/15/2065 55,000 51,386
Morgan Stanley:4.375%, 1/22/2047 445,000 439,9966.25%, 8/9/2026 3,000,000 3,555,786
National Savings Bank, 144A, 5.15%, 9/10/2019 500,000 504,500Nationwide Financial Services, Inc., 144A, 5.3%, 11/18/2044 190,000 202,939Royal Bank of Scotland Group PLC, 3.875%, 9/12/2023 255,000 247,820Societe Generale SA, 144A, 2.625%, 9/16/2020 400,000 402,018Standard Chartered PLC, 144A, 4.05%, 4/12/2026 325,000 323,601Swiss Re Treasury U.S. Corp., 144A, 4.25%, 12/6/2042 140,000 136,365
Copyright © 2017 www.secdatabase.com. All Rights Reserved.Please Consider the Environment Before Printing This Document

The Goldman Sachs Group, Inc., 2.789% **, 10/28/2027 3,250,000 3,306,810Voya Financial, Inc., 4.8%, 6/15/2046 165,000 160,026
28,828,677
Health Care 1.8%
Abbott Laboratories:2.9%, 11/30/2021 740,000 736,7503.75%, 11/30/2026 3,000,000 2,953,6204.9%, 11/30/2046 755,000 756,765
AbbVie, Inc., 4.7%, 5/14/2045 250,000 243,305Actavis Funding SCS, 4.75%, 3/15/2045 95,000 93,685Aetna, Inc., 4.375%, 6/15/2046 155,000 155,374Celgene Corp., 5.0%, 8/15/2045 120,000 124,642Endo Finance LLC, 144A, 5.375%, 1/15/2023 290,000 242,875
Endo Ltd.:144A, 6.0%, 7/15/2023 230,000 196,075144A, 6.0%, 2/1/2025 160,000 130,200
Gilead Sciences, Inc., 4.15%, 3/1/2047 165,000 155,242
HCA, Inc.:5.875%, 2/15/2026 285,000 296,4006.5%, 2/15/2020 2,020,000 2,206,850
LifePoint Health, Inc., 144A, 5.375%, 5/1/2024 45,000 43,088Mallinckrodt International Finance SA, 4.75%, 4/15/2023 (a) 370,000 305,250Mylan NV, 144A, 5.25%, 6/15/2046 225,000 211,473
Pfizer, Inc.:4.0%, 12/15/2036 170,000 171,5724.125%, 12/15/2046 85,000 85,267
Shire Acquisitions Investments Ireland DAC, 3.2%, 9/23/2026 453,000 425,345Stryker Corp., 4.625%, 3/15/2046 90,000 92,087
Tenet Healthcare Corp.:4.463% **, 6/15/2020 200,000 202,5006.25%, 11/1/2018 460,000 483,5756.75%, 6/15/2023 (a) 420,000 396,900
UnitedHealth Group, Inc.:3.45%, 1/15/2027 220,000 223,1474.2%, 1/15/2047 355,000 358,212
Valeant Pharmaceuticals International, Inc.:144A, 5.375%, 3/15/2020 385,000 331,100144A, 5.875%, 5/15/2023 355,000 270,244144A, 6.125%, 4/15/2025 1,050,000 786,187144A, 6.375%, 10/15/2020 (a) 365,000 319,831144A, 7.5%, 7/15/2021 1,515,000 1,316,156
14,313,717
Industrials 0.5%
ADT Corp.:3.5%, 7/15/2022 220,000 207,9006.25%, 10/15/2021 225,000 244,688
Bombardier, Inc., 144A, 5.75%, 3/15/2022 1,480,000 1,454,100FedEx Corp., 4.55%, 4/1/2046 115,000 114,774Kenan Advantage Group, Inc., 144A, 7.875%, 7/31/2023 175,000 179,156Masonite International Corp., 144A, 5.625%, 3/15/2023 145,000 150,075Ply Gem Industries, Inc., 6.5%, 2/1/2022 179,000 183,905Roper Technologies, Inc., 3.8%, 12/15/2026 245,000 244,393Transurban Finance Co. Pty Ltd., 144A, 3.375%, 3/22/2027 160,000 151,834United Rentals North America, Inc., 7.625%, 4/15/2022 810,000 848,475Wise Metals Group LLC, 144A, 8.75%, 12/15/2018 185,000 191,298ZF North America Capital, Inc., 144A, 4.5%, 4/29/2022 440,000 451,550
4,422,148
Copyright © 2017 www.secdatabase.com. All Rights Reserved.Please Consider the Environment Before Printing This Document

Information Technology 0.5%Activision Blizzard, Inc., 144A, 3.4%, 9/15/2026 190,000 181,370
Broadcom Corp.:144A, 3.0%, 1/15/2022 463,000 460,988144A, 3.625%, 1/15/2024 406,000 406,514144A, 3.875%, 1/15/2027 463,000 459,469
Cardtronics, Inc., 5.125%, 8/1/2022 135,000 137,025CDW LLC, 6.0%, 8/15/2022 325,000 342,875
Diamond 1 Finance Corp.:144A, 4.42%, 6/15/2021 465,000 483,945144A, 8.1%, 7/15/2036 130,000 156,995
First Data Corp., 144A, 6.75%, 11/1/2020 (a) 80,000 82,700Micron Technology, Inc., 144A, 5.25%, 8/1/2023 175,000 175,438NVIDIA Corp., 2.2%, 9/16/2021 160,000 156,056
Seagate HDD Cayman:144A, 4.25%, 3/1/2022 (c) 400,000 399,0805.75%, 12/1/2034 230,000 207,460
3,649,915
Materials 2.8%Ball Corp., 5.25%, 7/1/2025 225,000 236,531Berry Plastics Corp., 5.5%, 5/15/2022 695,000 722,800Cascades, Inc., 144A, 5.5%, 7/15/2022 145,000 146,994
CF Industries, Inc.:144A, 3.4%, 12/1/2021 790,000 787,195144A, 4.5%, 12/1/2026 95,000 94,943
Chemours Co., 6.625%, 5/15/2023 (a) 195,000 194,025Constellium NV, 144A, 7.875%, 4/1/2021 250,000 268,437Equate Petrochemical BV, 144A, 4.25%, 11/3/2026 2,490,000 2,446,425Glencore Funding LLC, 144A, 4.625%, 4/29/2024 80,000 82,780GTL Trade Finance, Inc., 144A, 5.893%, 4/29/2024 (a) 2,408,000 2,438,100Hexion, Inc., 6.625%, 4/15/2020 315,000 293,737Platform Specialty Products Corp., 144A, 6.5%, 2/1/2022 (a) 160,000 163,200Potash Corp. of Saskatchewan, Inc., 4.0%, 12/15/2026 360,000 361,673Reynolds Group Issuer, Inc., 5.75%, 10/15/2020 3,880,000 3,994,770St. Marys Cement, Inc., 144A, 5.75%, 1/28/2027 3,360,000 3,284,400
Teck Resources Ltd.:144A, 8.0%, 6/1/2021 205,000 226,013144A, 8.5%, 6/1/2024 50,000 58,188
Tronox Finance LLC:6.375%, 8/15/2020 45,000 43,256144A, 7.5%, 3/15/2022 245,000 238,875
United States Steel Corp., 144A, 8.375%, 7/1/2021 75,000 83,250UPL Corp., Ltd., 144A, 3.25%, 10/13/2021 2,800,000 2,737,076Vale Overseas Ltd., 5.875%, 6/10/2021 3,500,000 3,745,000
WR Grace & Co-Conn:144A, 5.125%, 10/1/2021 120,000 125,850144A, 5.625%, 10/1/2024 60,000 63,225
22,836,743
Real Estate 0.6%
CBL & Associates LP:(REIT), 4.6%, 10/15/2024 112,000 104,167(REIT), 5.25%, 12/1/2023 310,000 307,412(REIT), 5.95%, 12/15/2026 520,000 515,023
Crown Castle International Corp., (REIT), 4.0%, 3/1/2027 (c) 166,000 165,665CyrusOne LP, (REIT), 6.375%, 11/15/2022 225,000 237,375
Equinix, Inc.:(REIT), 5.375%, 4/1/2023 690,000 721,968
Copyright © 2017 www.secdatabase.com. All Rights Reserved.Please Consider the Environment Before Printing This Document

(REIT), 5.875%, 1/15/2026 120,000 127,500Hospitality Properties Trust, (REIT), 5.0%, 8/15/2022 900,000 947,477Omega Healthcare Investors, Inc., (REIT), 4.95%, 4/1/2024 260,000 264,561Select Income REIT, (REIT), 4.15%, 2/1/2022 260,000 259,543Trust F/1401, 144A, (REIT), 5.25%, 1/30/2026 1,095,000 1,034,775
VEREIT Operating Partnership LP:(REIT), 4.125%, 6/1/2021 40,000 40,592(REIT), 4.875%, 6/1/2026 35,000 35,680
4,761,738
Telecommunication Services 2.0%
AT&T, Inc.:4.25%, 3/1/2027 (c) 977,000 976,4144.5%, 5/15/2035 340,000 319,648
Bharti Airtel International Netherlands BV, 144A, 5.35%, 5/20/2024 750,000 786,811
CenturyLink, Inc.:Series T, 5.8%, 3/15/2022 395,000 406,234Series Y, 7.5%, 4/1/2024 (a) 370,000 391,738
Deutsche Telekom International Finance BV:144A, 2.82%, 1/19/2022 1,070,000 1,063,086144A, 3.6%, 1/19/2027 923,000 911,914
Digicel Group Ltd.:144A, 7.125%, 4/1/2022 760,000 607,666144A, 8.25%, 9/30/2020 610,000 540,612
Frontier Communications Corp.:6.875%, 1/15/2025 415,000 348,0817.125%, 1/15/2023 940,000 841,3008.5%, 4/15/2020 1,645,000 1,752,912
Intelsat Jackson Holdings SA, 144A, 8.0%, 2/15/2024 (a) 357,000 370,388
Level 3 Financing, Inc.:144A, 5.25%, 3/15/2026 180,000 179,3255.375%, 8/15/2022 830,000 856,9755.375%, 5/1/2025 210,000 214,3326.125%, 1/15/2021 525,000 542,719
Sprint Communications, Inc., 144A, 7.0%, 3/1/2020 245,000 266,131Sprint Corp., 7.125%, 6/15/2024 1,485,000 1,551,825Sprint Spectrum Co., LLC, 144A, 3.36%, 3/20/2023 865,000 866,081
T-Mobile U.S.A., Inc.:6.375%, 3/1/2025 316,000 341,6756.625%, 11/15/2020 540,000 553,500
Verizon Communications, Inc., 4.672%, 3/15/2055 280,000 250,740VimpelCom Holdings BV, 144A, 5.95%, 2/13/2023 250,000 261,550Wind Acquisition Finance SA, 144A, 6.5%, 4/30/2020 210,000 217,875Zayo Group LLC, 6.375%, 5/15/2025 265,000 280,404
15,699,936
Utilities 0.9%Adani Transmission Ltd., 144A, 4.0%, 8/3/2026 400,000 380,024
Calpine Corp.:5.375%, 1/15/2023 340,000 334,9005.75%, 1/15/2025 110,000 107,525
Dynegy, Inc., 7.625%, 11/1/2024 (a) 485,000 461,962Electricite de France SA, 144A, 4.75%, 10/13/2035 390,000 397,243Majapahit Holding BV, 144A, 7.75%, 1/20/2020 4,000,000 4,488,000NGL Energy Partners LP, 5.125%, 7/15/2019 175,000 175,000NRG Energy, Inc., 6.25%, 5/1/2024 (a) 870,000 885,225Southern Power Co., Series F, 4.95%, 12/15/2046 123,000 121,279
7,351,158Total Corporate Bonds (Cost $181,871,656) 180,587,696
Copyright © 2017 www.secdatabase.com. All Rights Reserved.Please Consider the Environment Before Printing This Document

Asset-Backed 0.2%
MiscellaneousHilton Grand Vacations Trust, "B", Series 2014-AA, 144A, 2.07%, 11/25/2026 899,752 888,135PennyMac LLC, "A1", Series 2015-NPL1, 144A, 4.0%, 3/25/2055 920,351 925,354Total Asset-Backed (Cost $1,819,142) 1,813,489
Mortgage-Backed Securities Pass-Throughs 0.0%Federal Home Loan Mortgage Corp., 6.0%, 11/1/2021 49,313 55,538Federal National Mortgage Association, 6.5% , with various maturities from 4/1/2017 until 6/1/2017 9,430 9,455Government National Mortgage Association, 6.5%, 8/20/2034 69,483 79,174Total Mortgage-Backed Securities Pass-Throughs (Cost $134,073) 144,167
Commercial Mortgage-Backed Securities 1.1%Credit Suisse First Boston Mortgage Securities Corp., "G", Series 2005-C6, 144A, 5.23% **, 12/15/2040 2,425,021 2,423,033CSAIL Commercial Mortgage Trust, "A4", Series 2015-C4, 3.808%, 11/15/2048 1,450,000 1,508,514FHLMC Multifamily Structured Pass-Through Certificates, "X1", Series K043, Interest Only, 0.548% ***, 12/25/2024 7,461,572 271,388GMAC Commercial Mortgage Securities, Inc., "G", Series 2004-C1, 144A, 5.455%, 3/10/2038 2,500,427 2,457,712
JPMBB Commercial Mortgage Securities Trust:"A4", Series 2015-C28, 3.227%, 10/15/2048 2,185,000 2,190,170"A3", Series 2014-C19, 3.669%, 4/15/2047 200,000 208,325
Total Commercial Mortgage-Backed Securities (Cost $9,036,391) 9,059,142
Collateralized Mortgage Obligations 1.7%Fannie Mae Connecticut Avenue Securities, "1M1", Series 2016-C02, 2.906% **, 9/25/2028 1,657,813 1,679,311
Federal Home Loan Mortgage Corp.:"HI", Series 3979, Interest Only, 3.0%, 12/15/2026 1,398,422 119,878"IC", Series 3971, Interest Only, 3.0%, 3/15/2026 562,362 31,115"IK", Series 4048, Interest Only, 3.0%, 5/15/2027 2,296,515 212,446"PI", Series 3987, Interest Only, 3.0%, 1/15/2027 2,934,942 252,447"PI", Series 4017, Interest Only, 3.0%, 3/15/2027 891,988 79,287"PI", Series 3940, Interest Only, 4.0%, 2/15/2041 347,239 52,514"C31", Series 303, Interest Only, 4.5%, 12/15/2042 6,030,461 1,178,904"LI", Series 3720, Interest Only, 4.5%, 9/15/2025 1,986,449 227,838"PI", Series 3843, Interest Only, 4.5%, 5/15/2038 2,243,276 208,765
Federal National Mortgage Association:"WO", Series 2013-27, Principal Only, Zero Coupon, 12/25/2042 1,200,000 689,730"4", Series 406, Interest Only, 4.0%, 9/25/2040 1,474,485 296,282"JZ", Series 2012-4, 4.0%, 9/25/2041 3,106,734 3,365,668"I", Series 2003-84, Interest Only, 6.0%, 9/25/2033 408,902 75,009
Government National Mortgage Association:"PI", Series 2015-40, Interest Only, 4.0%, 4/20/2044 1,605,427 223,777"QI", Series 2011-112, Interest Only, 4.0%, 5/16/2026 933,229 91,404"AI", Series 2010-25, Interest Only, 4.5%, 3/16/2023 39,659 75"BI", Series 2010-30, Interest Only, 4.5%, 7/20/2039 283,883 35,216"IP", Series 2014-11, Interest Only, 4.5%, 1/20/2043 1,966,748 330,136"IP", Series 2014-115, Interest Only, 4.5%, 2/20/2044 162,690 30,132"ND", Series 2010-130, 4.5%, 8/16/2039 3,400,000 3,596,992"NI", Series 2011-80, Interest Only, 4.5%, 5/16/2038 430,961 5,855"PI", Series 2014-108, Interest Only, 4.5%, 12/20/2039 221,754 37,818"IN", Series 2009-69, Interest Only, 5.5%, 8/20/2039 1,071,149 193,993"IQ", Series 2011-18, Interest Only, 5.5%, 1/16/2039 312,147 33,194"IV", Series 2009-69, Interest Only, 5.5%, 8/20/2039 1,025,924 204,236"AI", Series 2007-38, Interest Only, 5.693% ***, 6/16/2037 241,196 34,739"IJ", Series 2009-75, Interest Only, 6.0%, 8/16/2039 798,389 138,611"SC", Series 2002-33, Interest Only, 6.633% ***, 5/16/2032 672,412 118,142
Total Collateralized Mortgage Obligations (Cost $12,322,979) 13,543,514
Government & Agency Obligations 7.7%
Copyright © 2017 www.secdatabase.com. All Rights Reserved.Please Consider the Environment Before Printing This Document

Other Government Related (d) 1.6%Novatek OAO, 144A, 4.422%, 12/13/2022 1,392,000 1,389,940Novolipetsk Steel, 144A, 4.5%, 6/15/2023 3,600,000 3,599,820Provincia de Buenos Aires, 144A, 9.125%, 3/16/2024 375,000 408,750Rosneft Oil Co., 144A, 4.199%, 3/6/2022 3,500,000 3,453,555Sberbank of Russia, Series 7, REG S, 5.717%, 6/16/2021 900,000 963,234Vnesheconombank, 144A, 6.902%, 7/9/2020 2,500,000 2,718,750
12,534,049
Sovereign Bonds 3.5%Dominican Republic, 144A, 6.875%, 1/29/2026 400,000 426,820Export-Import Bank of India, 144A, 3.375%, 8/5/2026 4,000,000 3,771,732Government of Indonesia, Series FR56, 8.375%, 9/15/2026 IDR 4,020,000,000 315,735Ivory Coast Government International Bond, 144A, 6.375%, 3/3/2028 400,000 389,168Mexican Udibonos Inflation-Linked Bond, Series S, 2.0%, 6/9/2022 MXN 37,402,132 1,720,747Perusahaan Penerbit SBSN Indonesia III, 144A, 4.325%, 5/28/2025 800,000 808,240Republic of Angola, 144A, 9.5%, 11/12/2025 450,000 429,588Republic of Armenia, 144A, 7.15%, 3/26/2025 700,000 733,278Republic of Costa Rica, 144A, 7.158%, 3/12/2045 500,000 486,390
Republic of Hungary:6.25%, 1/29/2020 4,000,000 4,392,000Series 19/A, 6.5%, 6/24/2019 HUF 90,600,000 358,423
Republic of Namibia, 144A, 5.25%, 10/29/2025 250,000 248,020Republic of Panama, 3.75%, 3/16/2025 1,220,000 1,232,200Republic of Portugal, 144A, 5.125%, 10/15/2024 1,700,000 1,642,826
Republic of Sri Lanka:144A, 5.125%, 4/11/2019 1,000,000 1,014,933144A, 5.75%, 1/18/2022 525,000 525,323
United Mexican States, Series M, 5.75%, 3/5/2026 MXN 225,104,200 9,605,79228,101,215
U.S. Government Sponsored Agency 0.5%Tennessee Valley Authority, 4.25%, 9/15/2065 3,969,000 4,105,839
U.S. Treasury Obligations 2.1%
U.S. Treasury Bills:0.4% ****, 2/9/2017 (e) 1,381,000 1,380,8550.56% ****, 6/1/2017 (e) 2,107,000 2,103,382
U.S. Treasury Bonds:2.25%, 8/15/2046 257,100 216,2453.625%, 2/15/2044 300,000 332,789
U.S. Treasury Notes:0.75%, 10/31/2017 (f) (g) 10,500,000 10,498,3620.75%, 4/30/2018 (g) 1,000,000 997,3831.5%, 8/15/2026 175,000 160,8911.625%, 5/15/2026 1,420,000 1,323,318
17,013,225Total Government & Agency Obligations (Cost $62,077,330) 61,754,328
Convertible Bond 0.1%
MaterialsGEO Specialty Chemicals, Inc., 144A, 7.5% Cash, 7.5% PIK, 10/30/2018 (Cost $686,797) 684,683 687,833
Loan Participations and Assignments 1.8%
Senior Loans **AerCap Holdings NV, Term Loan A, 3.275%, 10/6/2023 1,500,000 1,512,562Altice U.S. Finance I Corp., Term Loan B, 3.778%, 1/15/2025 3,589 3,637Atlantic Broadband Finance LLC, Term Loan B, 3.278%, 11/30/2019 3,593 3,611Berry Plastics Group, Inc., Term Loan D, 3.5%, 2/8/2020 1,894 1,899
Copyright © 2017 www.secdatabase.com. All Rights Reserved.Please Consider the Environment Before Printing This Document

DaVita HealthCare Partners, Inc., Term Loan B, 3.53%, 6/24/2021 2,325,066 2,357,908FCA U.S. LLC, Term Loan B, 3.27%, 12/31/2018 582,217 583,583
Hilton Worldwide Finance LLC:Term Loan B2, 3.271%, 10/25/2023 1,642,366 1,660,753Term Loan B1, 3.5%, 10/26/2020 120,796 122,277
NRG Energy, Inc., Term Loan B, 3.028%, 6/30/2023 1,105,385 1,111,006Outfront Media Capital LLC, Term Loan B, 3.028%, 2/1/2021 1,237,500 1,246,008
Pinnacle Foods Finance LLC:Term Loan G, 3.276%, 4/29/2020 1,980 1,985Term Loan H, 3.276%, 4/29/2020 1,623,547 1,627,776
Ply Gem Industries, Inc., Term Loan, 4.0%, 2/1/2021 604,921 613,238SBA Senior Financial II LLC, Term Loan B1, 3.03%, 3/24/2021 721,994 725,405Seminole Tribe of Florida, Term Loan, 3.248%, 4/29/2020 1,189,516 1,193,608TransDigm, Inc., Term Loan F, 3.778%, 6/9/2023 1,303,688 1,302,652Visteon Corp., Term Delay Draw B, 3.929%, 4/9/2021 2,205 2,226Total Loan Participations and Assignments (Cost $13,977,517) 14,070,134
Municipal Bonds and Notes 0.1%New York, NY, General Obligation, Series C, 5.0%, 8/1/2033 (Cost $714,054) 620,000 706,192
Shares Value ($)
Exchange-Traded Funds 6.6%iShares iBoxx $ High Yield Corporate Bond ETF (a) 390,000 34,062,600VanEck Vectors JPMorgan EM Local Currency Bond ETF (a) 1,068,133 19,205,031Total Exchange-Traded Funds (Cost $53,960,302) 53,267,631
Securities Lending Collateral 5.4%Government & Agency Securities Portfolio "Deutsche Government Cash Institutional Shares", 0.51% (h) (i)
(Cost $43,740,218) 43,740,218 43,740,218
Cash Equivalents 0.2%Deutsche Central Cash Management Government Fund, 0.54% (h) (Cost $1,628,198) 1,628,198 1,628,198
% ofNet Assets Value ($)
Total Investment Portfolio (Cost $798,814,815) † 105.4 846,585,263Other Assets and Liabilities, Net (5.4) (43,709,615)Net Assets 100.0 802,875,648
For information on the Fund's policies regarding the valuation of investments and other significant accounting policies, please refer to the Fund's most recent semi-annual or annual financial statements.
* Non-income producing security.
** Floating rate securities’ yields vary with a designated market index or market rate, such as the coupon-equivalent of the U.S. Treasury Bill rate. Thesesecurities are shown at their current rate as of January 31, 2017.
*** These securities are shown at their current rate as of January 31, 2017.
**** Annualized yield at time of purchase; not a coupon rate.
† The cost for federal income tax purposes was $800,138,722. At January 31, 2017, net unrealized appreciation for all securities based on tax cost was$46,446,541. This consisted of aggregate gross unrealized appreciation for all securities in which there was an excess of value over tax cost of $66,061,232and aggregate gross unrealized depreciation for all securities in which there was an excess of tax cost over value of $19,614,691.
(a) All or a portion of these securities were on loan. In addition, "Other Assets and Liabilities, Net" may include pending sales that are also on loan. The value ofsecurities loaned at January 31, 2017 amounted to $42,556,496, which is 5.3% of net assets.
(b) Principal amount stated in U.S. dollars unless otherwise noted.
(c) When-issued security.
(d) Government-backed debt issued by financial companies or government sponsored enterprises.
(e) At January 31, 2017, this security has been pledged, in whole or in part, to cover initial margin requirements for open futures contracts.
(f) At January 31, 2017, this security has been pledged, in whole or in part, to cover initial margin requirements for open centrally cleared swap contracts.
(g) At January 31, 2017, this security has been pledged, in whole or in part, as collateral for open over-the-counter derivatives.
Copyright © 2017 www.secdatabase.com. All Rights Reserved.Please Consider the Environment Before Printing This Document

(h) Affiliated fund managed by Deutsche Investment Management Americas Inc. The rate shown is the annualized seven-day yield at period end.
(i) Represents collateral held in connection with securities lending. Income earned by the Fund is net of borrower rebates.
144A: Security exempt from registration under Rule 144A of the Securities Act of 1933. These securities may be resold in transactions exempt from registration, normallyto qualified institutional buyers.
EM: Emerging Markets
Interest Only: Interest Only (IO) bonds represent the "interest only" portion of payments on a pool of underlying mortgages or mortgage-backed securities. IO securitiesare subject to prepayment risk of the pool of underlying mortgages.
JSC: Joint Stock Company
PIK: Denotes that all or a portion of the income is paid in-kind in the form of additional principal.
Principal Only: Principal Only (PO) bonds represent the “principal only” portion of payments on a pool of underlying mortgages or mortgage-backed securities.
REG S: Securities sold under Regulation S may not be offered, sold or delivered within the United States or to, or for the account or benefit of, U.S. persons, exceptpursuant to an exemption from, or in a transaction not subject to, the registration requirements of the Securities Act of 1933.
REIT: Real Estate Investment Trust
RSP: Risparmio (Convertible Savings Shares)
SBSN: Surat Berharga Syariah Negara (Islamic Based Government Securities)
Included in the portfolio are investments in mortgage or asset-backed securities which are interests in separate pools of mortgages or assets. Effective maturities of theseinvestments may be shorter than stated maturities due to prepayments. Some separate investments in the Federal National Mortgage Association issues which havesimilar coupon rates have been aggregated for presentation purposes in this investment portfolio.
At January 31, 2017, open futures contracts purchased were as follows:
Futures Currency ExpirationDate Contracts Notional
Value ($)
UnrealizedAppreciation
(Depreciation) ($)10 Year AustralianTreasury Bond AUD 3/15/2017 118 11,481,396 15,546
3 Month Euro EuriborInterest Rate EUR 12/18/2017 13 3,517,145 (371)
3 Month Euro SwissFranc (Euroswiss)Interest Rate
CHF 12/18/2017 13 3,310,267 (348)
3 Month Euroyen JPY 12/18/2017 15 3,318,738 (709)90 Day Eurodollar USD 12/18/2017 13 3,201,250 (3,612)90 Day Sterling InterestRate GBP 12/20/2017 21 3,284,086 (705)
ASX 90 Day BankAccepted Bills AUD 12/7/2017 18 13,588,881 1,298
Ultra Long U.S. TreasuryBond USD 3/22/2017 295 47,402,813 (730,789)
Total net unrealized depreciation (719,690)
At January 31, 2017, open futures contracts sold were as follows:
Futures Currency ExpirationDate Contracts Notional
Value ($)Unrealized
Appreciation ($)10 Year U.S. Treasury Note USD 3/22/2017 338 42,070,438 99,666Euro-BTP Italian Government Bond EUR 3/8/2017 79 11,164,068 324,236U.S. Treasury Long Bond USD 3/22/2017 4 603,375 7,616Ultra 10 Year U.S. Treasury Note USD 3/22/2017 24 3,219,750 28,262Total net unrealized appreciation 459,780
At January 31, 2017, open credit default swap contracts sold were as follows:
Centrally Cleared Swaps
Copyright © 2017 www.secdatabase.com. All Rights Reserved.Please Consider the Environment Before Printing This Document

ExpirationDate
NotionalAmount ($) (j)
FixedCashFlows
Received
UnderlyingReference Obligation Value ($) Unrealized
Appreciation ($)
6/20/2021 17,600,000 5.0%Markit CDX North America High
Yield 1,330,953 709,430
(j) The maximum potential amount of future undiscounted payments that the Fund could be required to make under a credit default swap contract would be thenotional amount of the contract. These potential amounts would be partially offset by any recovery values of the referenced debt obligation or net amountsreceived from the settlement of buy protection credit default swap contracts entered into by the Fund for the same referenced debt obligation, if any.
At January 31, 2017, open interest rate swap contracts were as follows:
Centrally Cleared SwapsEffective/
ExpirationDate
NotionalAmount ($)
Cash FlowsPaid by
the Fund
Cash FlowsReceived by
the FundValue ($)
UnrealizedAppreciation/
(Depreciation) ($)5/9/20165/9/2026 8,800,000 Fixed — 2.48%
Floating — 3-MonthLIBOR (156,013) (64,482)
12/4/201512/4/2045 19,000,000 Fixed — 2.615%
Floating — 3-MonthLIBOR 12,331 408,640
12/16/20159/17/2035 400,000 Fixed — 2.938%
Floating — 3-MonthLIBOR (21,602) (14,059)
12/21/201612/21/2046 11,700,000 Fixed — 2.25%
Floating — 3-MonthLIBOR 1,085,870 2,180,707
7/13/20167/13/2046 13,500,000 Fixed — 2.22%
Floating — 3-MonthLIBOR 1,198,504 1,198,504
12/16/20159/16/2020 20,600,000
Floating — 3-MonthLIBOR Fixed — 2.214% 385,463 392,424
Total net unrealized appreciation 4,101,734
LIBOR: London Interbank Offered Rate; 3-Month LIBOR rate at January 31, 2017 is x.xx%.
At January 31, 2017, the Fund had the following open forward foreign currency exchange contracts:
Contracts to Deliver In Exchange For SettlementDate
UnrealizedAppreciation ($) Counterparty
MXN 96,100,000 USD 4,723,868 2/14/2017 123,332 Barclays Bank PLC
JPY 3,972,000,000 USD 36,374,459 2/17/2017 1,182,642 Goldman Sachs &Co.
USD 17,036,243 JPY 1,985,920,000 2/17/2017 558,956 Goldman Sachs &Co.
USD 17,554,801 JPY 1,986,080,000 2/17/2017 41,816 JPMorgan ChaseSecurities, Inc.
USD 2,447,421 MXN 51,195,000 2/21/2017 940 JPMorgan ChaseSecurities, Inc.
MXN 204,779,692 USD 9,935,586 2/21/2017 142,157 JPMorgan ChaseSecurities, Inc.
USD 3,163,301 MXN 68,260,000 2/21/2017 101,180 JPMorgan ChaseSecurities, Inc.
USD 3,193,249 MXN 68,259,692 2/21/2017 71,217 Barclays Bank PLC
MXN 35,710,000 USD 1,707,723 2/28/2017 1,636 Toronto-DominionBank
USD 14,512,855 KRW 16,955,369,000 3/2/2017 81,824 Barclays Bank PLCUSD 6,779,778 JPY 788,800,000 3/13/2017 215,547 Citigroup, Inc
USD 6,889,986 JPY 788,800,000 3/13/2017 105,339 Goldman Sachs &Co.
USD 7,316,854 EUR 6,800,000 3/13/2017 35,821 Barclays Bank PLCUSD 34,404,248 EUR 32,800,000 3/20/2017 1,075,517 Barclays Bank PLCUSD 7,828,708 GBP 6,340,000 4/4/2017 158,846 Barclays Bank PLC
USD 72,819,330 EUR 68,100,000 4/12/2017 931,449 Canadian ImperialBank of Commerce
USD 18,572,559 JPY 2,120,000,000 4/13/2017 256,979 Barclays Bank PLC
Copyright © 2017 www.secdatabase.com. All Rights Reserved.Please Consider the Environment Before Printing This Document

USD 21,793,479 GBP 17,700,000 4/13/2017 510,497 Canadian ImperialBank of Commerce
Total unrealized appreciation 5,595,695
Contracts to Deliver In Exchange For SettlementDate
UnrealizedDepreciation
($)Counterparty
GBP 1,058,000 USD 1,323,272 2/2/2017 (7,691) NomuraInternational PLC
USD 4,807,029 MXN 96,100,000 2/14/2017 (206,493) Citigroup, Inc
USD 816,294 MXN 17,065,000 2/21/2017 (174) JPMorgan ChaseSecurities, Inc.
MXN 102,390,000 USD 4,794,603 2/21/2017 (102,119) Goldman Sachs &Co.
USD 1,711,725 MXN 35,710,000 2/28/2017 (5,638) Toronto-DominionBank
JPY 1,274,000 USD 10,936 3/2/2017 (356) Barclays Bank PLCJPY 1,608,726,000 USD 14,049,008 3/2/2017 (209,468) Morgan Stanley
USD 14,328,433 JPY 1,610,000,000 3/2/2017 (58,666) Goldman Sachs &Co.
KRW 16,955,369,000 USD 14,463,706 3/2/2017 (130,974)Australia & NewZealand Banking
Group Ltd.EUR 6,800,000 USD 7,210,251 3/13/2017 (142,425) Barclays Bank PLCJPY 788,800,000 USD 6,875,662 3/13/2017 (119,663) Citigroup, Inc
JPY 788,800,000 USD 6,948,604 3/13/2017 (46,720) Goldman Sachs &Co.
EUR 32,800,000 USD 34,298,534 3/20/2017 (1,181,231) Bank of America
GBP 6,340,000 USD 7,728,099 4/4/2017 (259,455) NomuraInternational PLC
EUR 30,500,000 USD 32,386,425 4/12/2017 (644,394) Canadian ImperialBank of Commerce
EUR 37,600,000 USD 39,663,300 4/12/2017 (1,056,660) Barclays Bank PLC
JPY 2,120,000,000 USD 18,311,380 4/13/2017 (518,157) Canadian ImperialBank of Commerce
GBP 17,700,000 USD 21,483,552 4/13/2017 (820,423) Goldman Sachs &Co.
JPY 2,076,000,000 USD 18,379,814 4/13/2017 (58,921) Toronto-DominionBank
Total unrealized depreciation (5,569,628)
Currency AbbreviationsAUD Australian Dollar IDR Indonesian RupiahCHF Swiss Franc JPY Japanese YenEUR Euro KRW South Korean WonGBP British Pound MXN Mexican PesoHUF Hungarian Forint USD United States Dollar
Fair Value Measurements
Various inputs are used in determining the value of the Fund's investments. These inputs are summarized in three broad levels. Level 1 includes quoted prices in activemarkets for identical securities. Level 2 includes other significant observable inputs (including quoted prices for similar securities, interest rates, prepayment speeds, andcredit risk). Level 3 includes significant unobservable inputs (including the Fund's own assumptions in determining the fair value of investments). The level assigned tothe securities valuations may not be an indication of the risk or liquidity associated with investing in those securities.
The following is a summary of the inputs used as of January 31, 2017 in valuing the Fund's investments.
Assets Level 1 Level 2 Level 3 TotalCommon Stocks
Consumer Discretionary $ 25,243,984 $ 12,198,339 $ — $ 37,442,323Consumer Staples 52,775,000 4,179,983 — 56,954,983Energy 4,488,870 26,780,380 — 31,269,250Financials 72,826,411 17,909,858 — 90,736,269Health Care 25,851,834 24,742,959 — 50,594,793Industrials 25,751,341 31,491,746 — 57,243,087Information Technology 39,990,677 15,136,575 — 55,127,252Materials 59,575 34,844,082 22,193 34,925,850
Copyright © 2017 www.secdatabase.com. All Rights Reserved.Please Consider the Environment Before Printing This Document

Real Estate 12,380,403 3,566,813 — 15,947,216Telecommunication Services 15,181,561 2,422,513 — 17,604,074Utilities 15,103,834 — — 15,103,834
Preferred Stocks (k) — 2,629,667 — 2,629,667Warrants (k) — — 4,123 4,123Fixed Income Investments (k)
Corporate Bonds — 180,587,696 — 180,587,696Asset-Backed — 1,813,489 — 1,813,489Mortgage-Backed Securities Pass-Throughs — 144,167 — 144,167Commercial Mortgage-Backed Securities — 9,059,142 — 9,059,142Collateralized Mortgage Obligations — 13,543,514 — 13,543,514Government & Agency Obligations — 61,754,328 — 61,754,328Convertible Bond — — 687,833 687,833Loan Participations and Assignments — 14,070,134 — 14,070,134Municipal Bonds and Notes — 706,192 — 706,192
Fixed Income - Exchange-Traded Funds 53,267,631 — — 53,267,631Short-Term Investments (k) 45,368,416 — — 45,368,416Derivatives (l)
Futures Contracts 476,624 — — 476,624Credit Default Swap Contracts — 709,430 — 709,430Interest Rate Swap Contracts — 4,180,275 — 4,180,275Forward Foreign Currency Exchange Contracts — 5,595,695 — 5,595,695
Total $ 388,766,161 $ 468,066,977 $ 714,149 $857,547,287Liabilities Level 1 Level 2 Level 3 TotalDerivatives (l)
Futures Contracts $ (736,534) $ — $ — $ (736,534)Interest Rate Swap Contracts — (78,541) — (78,541)Forward Foreign Currency Exchange Contracts — (5,569,628) — (5,569,628)
Total $ (736,534) $ (5,648,169) $ — $ (6,384,703)
There have been no transfers between fair value measurement levels during the period ended January 31, 2017.(k) See Investment Portfolio for additional detailed categorizations.(l) Derivatives include unrealized appreciation (depreciation) on open futures contracts, credit default swap contracts, interest rate swap contracts and forward foreign
currency exchange contract.
Derivatives
The following table presents, by major type of derivative contract, the unrealized appreciation (depreciation) of the Fund's derivative instruments as of January 31, 2017categorized by the primary underlying risk exposure.
Primary Underlying Risk Disclosure Futures Swaps
Forward Currency
Contracts
Credit Contracts $ — $ 709,430 $ —
Foreign Exchange Contracts $ — $ — $ 26,067
Interest Rate Contracts $ (259,910) $ 4,101,734 $ —
ITEM 2. CONTROLS AND PROCEDURES
(a) The Chief Executive and Financial Officers concluded that the Registrant’s Disclosure Controls andProcedures are effective based on the evaluation of the Disclosure Controls and Procedures as of a datewithin 90 days of the filing date of this report.
(b) There have been no changes in the registrant’s internal control over financial reporting that occurred duringthe registrant’s last fiscal quarter that has materially affected, or is reasonably likely to materially affect,the registrant’s internal controls over financial reporting.
Copyright © 2017 www.secdatabase.com. All Rights Reserved.Please Consider the Environment Before Printing This Document

ITEM 3. EXHIBITS
Certification pursuant to Rule 30a-2(a) under the Investment Company Act of 1940 (17 CFR 270.30a-2(a)) isfiled and attached hereto as Exhibit 99.CERT.
SIGNATURES
Pursuant to the requirements of the Securities Exchange Act of 1934 and the Investment Company Act of 1940, the registrant has dulycaused this report to be signed on its behalf by the undersigned, thereunto duly authorized.
Registrant: Deutsche Global Income Builder Fund, a series of Deutsche Market Trust
By:/s/Brian E. BinderBrian E. BinderPresident
Date: March 23, 2017
Pursuant to the requirements of the Securities Exchange Act of 1934 and the Investment Company Act of 1940, this report has beensigned below by the following persons on behalf of the registrant and in the capacities and on the dates indicated.
By:/s/Brian E. BinderBrian E. BinderPresident
Date: March 23, 2017
By:/s/Paul SchubertPaul SchubertChief Financial Officer and Treasurer
Date: March 23, 2017
Copyright © 2017 www.secdatabase.com. All Rights Reserved.Please Consider the Environment Before Printing This Document

CERTIFICATIONS
I, Brian E. Binder, certify that:
1. I have reviewed this report on Form N-Q of Deutsche Global Income Builder Fund, a series of Deutsche MarketTrust;
2.Based on my knowledge, this report does not contain any untrue statement of a material fact or omit to state a materialfact necessary to make the statements made, in light of the circumstances under which such statements were made, notmisleading with respect to the period covered by this report;
3. Based on my knowledge, the schedules of investments included in this report fairly present in all material respects theinvestments of the registrant as of the end of the fiscal quarter for which the report is filed;
4.
The registrant's other certifying officer(s) and I are responsible for establishing and maintaining disclosure controlsand procedures (as defined in Rule 30a-3(c) under the Investment Company Act of 1940) and internal control overfinancial reporting (as defined in Rule 30a-3(d) under the Investment Company Act of 1940) for the registrant andhave:
(a)
Designed such disclosure controls and procedures, or caused such disclosure controls and procedures to bedesigned under our supervision, to ensure that material information relating to the registrant, including itsconsolidated subsidiaries, is made known to us by others within those entities, particularly during the periodin which this report is being prepared;
(b)
Designed such internal control over financial reporting, or caused such internal control over financialreporting to be designed under our supervision, to provide reasonable assurance regarding the reliability offinancial reporting and the preparation of financial statements for external purposes in accordance withgenerally accepted accounting principles;
(c)Evaluated the effectiveness of the registrant's disclosure controls and procedures and presented in this reportour conclusions about the effectiveness of the disclosure controls and procedures, as of a date within 90 daysprior to the filing date of this report, based on such evaluation; and
(d)Disclosed in this report any change in the registrant's internal control over financial reporting that occurredduring the registrant's most recent fiscal quarter that has materially affected, or is reasonably likely tomaterially affect, the registrant's internal control over financial reporting; and
5. The registrant's other certifying officer(s) and I have disclosed to the registrant's auditors and the audit committee ofthe registrant's board of directors (or persons performing the equivalent functions):
(a)All significant deficiencies and material weaknesses in the design or operation of internal control overfinancial reporting which are reasonably likely to adversely affect the registrant's ability to record, process,summarize, and report financial information; and
(b) Any fraud, whether or not material, that involves management or other employees who have a significantrole in the registrant's internal control over financial reporting.
By:/s/Brian E. BinderBrian E. BinderPresident
Date: March 23, 2017
Copyright © 2017 www.secdatabase.com. All Rights Reserved.Please Consider the Environment Before Printing This Document

CERTIFICATIONS
I, Paul Schubert, certify that:
1. I have reviewed this report on Form N-Q of Deutsche Global Income Builder Fund, a series of Deutsche MarketTrust;
2.Based on my knowledge, this report does not contain any untrue statement of a material fact or omit to state a materialfact necessary to make the statements made, in light of the circumstances under which such statements were made, notmisleading with respect to the period covered by this report;
3. Based on my knowledge, the schedules of investments included in this report fairly present in all material respects theinvestments of the registrant as of the end of the fiscal quarter for which the report is filed;
4.
The registrant's other certifying officer(s) and I are responsible for establishing and maintaining disclosure controlsand procedures (as defined in Rule 30a-3(c) under the Investment Company Act of 1940) and internal control overfinancial reporting (as defined in Rule 30a-3(d) under the Investment Company Act of 1940) for the registrant andhave:
(a)
Designed such disclosure controls and procedures, or caused such disclosure controls and procedures to bedesigned under our supervision, to ensure that material information relating to the registrant, including itsconsolidated subsidiaries, is made known to us by others within those entities, particularly during the periodin which this report is being prepared;
(b)
Designed such internal control over financial reporting, or caused such internal control over financialreporting to be designed under our supervision, to provide reasonable assurance regarding the reliability offinancial reporting and the preparation of financial statements for external purposes in accordance withgenerally accepted accounting principles;
(c)Evaluated the effectiveness of the registrant's disclosure controls and procedures and presented in this reportour conclusions about the effectiveness of the disclosure controls and procedures, as of a date within 90 daysprior to the filing date of this report, based on such evaluation; and
(d)Disclosed in this report any change in the registrant's internal control over financial reporting that occurredduring the registrant's most recent fiscal quarter that has materially affected, or is reasonably likely tomaterially affect, the registrant's internal control over financial reporting; and
5. The registrant's other certifying officer(s) and I have disclosed to the registrant's auditors and the audit committee ofthe registrant's board of directors (or persons performing the equivalent functions):
(a)All significant deficiencies and material weaknesses in the design or operation of internal control overfinancial reporting which are reasonably likely to adversely affect the registrant's ability to record, process,summarize, and report financial information; and
(b) Any fraud, whether or not material, that involves management or other employees who have a significantrole in the registrant's internal control over financial reporting.
By:/s/Paul SchubertPaul SchubertChief Financial Officer and Treasurer
Date: March 23, 2017
Copyright © 2017 www.secdatabase.com. All Rights Reserved.Please Consider the Environment Before Printing This Document