Secure Trust Bank PLC months ended 30 June - - - -
18
Secure Trust Bank PLC Interim Report for the six months ended 30 June 2016 Straightforward transparent banking Registered Number 00541132
Transcript of Secure Trust Bank PLC months ended 30 June - - - -

Secure Trust Bank PLC Interim Report for the six months ended
30 June 2016
Straightforward transparent banking
Registered Number 00541132

Achieving our ambitions
1
Secure Trust Bank PLC (‘the Bank’) is a well-established UK bank, having been incorporated in 1954 and being a subsidiary of the
Arbuthnot Banking Group since 1985, until Arbuthnot Banking Group sold its controlling share in the Bank on 15 June 2016. The
Bank intends to move to a full listing on the London Stock Exchange later in 2016.
The Bank successfully listed on the Alternative Investment Market (AIM) in 2011. The Bank has increased its portfolio in recent
years, acquiring the Everyday Loans Group (ELG) and the V12 Finance Group in 2012 and 2013 respectively as well as the trade
and certain assets of the Debt Managers Group in 2013. In 2014 the Bank developed solutions for the small and medium sized
enterprise (SME) market providing Real Estate Finance, Asset Finance and Commercial Finance. These portfolios have enjoyed
significant growth in new business during 2015 and 2016. On 13 April 2016, the Bank completed the sale of ELG at a significant
profit, which will be reinvested to accelerate the Group’s growth prospects and secure new income streams. The Bank and its
subsidiaries are referred to as ‘the Group’.
Trusted products
The core business of the Bank is the provision of banking services predominantly being a range of consumer and SME lending
solutions and savings products. The Group is committed to providing customers with straightforward transparent banking solutions,
coupled with great service and delivered by friendly and professional staff. Examples of customer feedback from FEEFO (the
Feedback Forum) are as follows:
“Friendly and professional service. Very efficient too - couldn't be happier.”
“Excellent customer service from start to finish.”
FEEFO is the global ratings and reviews provider used by the world's most trusted brands. It collects independent reviews from our
customers ensuring that we receive feedback that the Bank can trust to be genuine and thus act upon. Customer satisfaction
levels, as measured by FEEFO are consistently in the 95th centile.
Investors in people
The Bank operates from its head office in Solihull, West Midlands and had 593 full time equivalent employees at 30 June 2016. The
Bank achieved the group-wide Investors in People Silver Accreditation in 2016. The Bank also operates a number of award
schemes for its staff, which are designed to foster customer service excellence, outstanding achievement and more efficient
processes.
Innovative products for consumers
The Bank continues to develop its portfolio of products in the Retail sector, building successful new relationships with a number of
leading furniture, leisure and household high street brands. Under our V12 brand, the Bank continues to deliver prime retail lending
through an increasing number of online, mail order or in-store channels. Our established Motor Finance business has also evolved,
including lending to the prime market sector. With the exception of a £10 option to purchase fee, all motor loans are now fee free to
the consumer.
Partner for businesses
The Bank consolidated its position in the SME market during H1 2016. The Real Estate Finance business has maintained its
balances whilst ensuring that it manages its risk appetite in light of the EU referendum. The business will continue to have an
insignificant exposure to commercial real estate. The Bank’s partnership with Haydock Finance, an established Asset Finance
provider, has enabled us to continue to build balances in this portfolio. The Commercial Finance team continues to build strong,
professional relationships, enabling us to increase the size of the portfolio with a range of tailored solutions.
Stable funding profile
The Bank’s lending is predominantly funded by customer deposits. From 2013 the Bank was permitted to draw down facilities
under the Funding for Lending Scheme (FLS). FLS monies are maintained as a liquidity buffer, above that required to support
lending, reflecting the Bank’s cautious approach to risk.

Chairman’s statement
2
Secure Trust Bank PLC has traded successfully for over 64 years. Our history shows we take a long term perspective and do not
prioritise short term profits over longer term sustainability. To be clear, we are prepared to take risks if justified by the associated
reward as demonstrated by our recent results, but faced with highly unpredictable outcomes we will always take a prudent
approach. This philosophy is a key factor in our longevity.
During the second half of 2015 the Board identified the EU referendum as a pivotal moment for the UK economy. We set a strategy
to mitigate any potential shocks arising from a ‘Brexit’ vote and to position ourselves to continue to grow in a post EU environment.
The diligent execution of this strategy has resulted in today’s announcement of a total profit after tax for the first half of 2016 of
£129.1 million. These profits have further increased our strong capital and liquidity positions which provide a firm foundation for the
Group’s next phase of development.
The project to seek to move from the Alternative Investment Market to a Premium Listing on the Main Market of the London Stock
Exchange is progressing well. Stifel are acting as our Sponsor and Clifford Chance LLP have been appointed as our legal advisers.
We expect to complete this before the end of 2016 and will provide further updates as appropriate.
Associated with the move to the Main Market, I announced that I would retire as Chairman once a new Chair had been identified. I
am delighted to advise that the Board has nominated Lord Forsyth of Drumlean as my successor. He has been a director of the
Company since 2014. The Board consider Michael has the right mix of skills and experience to steer the group through the coming
years. His appointment has been discussed with a number of the larger institutional shareholders who are also supportive. The
appointment is subject to regulatory approval and I will remain as Chairman until this is forthcoming. Thereafter I will move to a non-
executive role and look forward to continuing to contribute in that capacity as the group grows and develops.
The Board proposes to pay an interim dividend of 17p per share (Interim 2015: 17p) in respect of the six months ending 30 June
2016. This will be paid on 23 September 2016 to shareholders on the register as at 26 August 2016. This interim dividend is in
addition to the special dividend of 165 pence per share payable on 27 July 2016. (The Group’s shares trade ex-dividend in respect
of this special dividend).
I would like to take this opportunity, on behalf of my Board, to thank all of our employees for their professionalism, commitment and
hard work that are helping us to achieve strong growth and consistently high levels of customer satisfaction.
STB will, as ever, continue to exercise prudence in the management of its business. Given the resources at our disposal, the
flexibility of our business model and the potential for HM Government, free of interference from the EU, to create a more
proportionate approach to the regulation of small banks, we face the long term future with optimism.
Sir Henry Angest
Chairman
19 July 2016

Chief Executive’s statement
3
The first half of 2016 has been a transformational period for the Secure Trust Bank Group. We are very pleased with the
announcement of a record level of profit after tax of £129.1 million. I commend my colleagues and fellow directors for all their hard
work over this very demanding period. We could not have grown the portfolio, repositioned the business model and delivered
excellent customer service levels without their continuing commitment and professionalism.
As the interim period ended, the EU referendum result created significant uncertainty. It is pertinent to note that over the last 64
years, STB has successfully traded through previous periods of economic turbulence. The profits announced today have generated
significant increases in our capital and liquidity positions. This provides the confidence and resources to continue supporting our
customers and business partners through our lending activities as matters evolve.
Longer term sustainability not short term profits
In my equivalent statement last year I noted that the proposed EU referendum had the potential to create uncertainty. We kept this
matter under continual review and in the second half of last year we resolved to adopt a defensive stance. Specific actions
included:
Conclusion of the sale of our Everyday Loans subprime unsecured personal loans business. This generated a very
substantial one off profit whilst also removing the bulk of our exposure to the unsecured personal loan sector.
Curtailment of net lending growth to residential housing developers, especially in Central London.
Increase in the proportion of funding held in the form of unbreakable fixed term fixed rate deposits.
Deferral of launch of UK residential mortgage proposition.
Ensuring the average life of the bank’s total loan book remained very short at less than 30 months.
Earlier this month the Financial Policy Committee (FPC) of the Bank of England (BoE) published their latest quarterly stability
report. This is the first report published since the EU referendum. It flags a wide range of uncertainties and risks facing the UK
economy. These include the commercial property market becoming stretched and the risk that buy to let (BTL) landlords could act
in a way to amplify the pro-cyclical housing market by selling properties in a falling market.
Investors will be well aware of STB’s cautious approach to Commercial Property Lending. Our lending appetite and policies are
very restrictive. Overall our exposure to the commercial property market amounts to £31 million. This is spread across a number of
counterparties and properties. The majority of this lending is in fact secured and risk assessed against residential property.
However as the properties incorporate small elements of commercial activity, the overall loan exposure is classified as commercial
lending, an example being the construction of apartments above a ground floor shop in a town centre location.
We have been very clear that we had deferred our planned entry into the UK residential mortgage market until after the EU
referendum and in any event had no plans to enter the regulated BTL mortgage market. Our stance was the polar opposite of many
lenders who rapidly grew their regulated BTL mortgage lending in Q1 2016 as landlords rushed to complete transactions before the
stamp duty changes in April 2016.
The latest stability report, not for the first time, noted the FPC’s unease with high levels of unsecured personal loan (UPL) lending.
Investors will recall that on a number of occasions I have expressed concerns about what I considered to be unsustainable trends
in this sector with some lenders offering medium term UPL at lower margins than those charged for secured mortgage lending.
Taking these observations into account we substantially reduced our exposure to the unsecured personal loan market via the sale
of Everyday Loans.
Overall we consider our balance sheet to be well positioned to deal with the challenges ahead and potential opportunities that may
arise.

Chief Executive’s statement
4
Robust Capital and Liquidity positions
The Bank’s capital and funding positions remain robust.
Our Common Equity Tier one ratio was 20.1% as at 30 June 2016 compared to 15.0% at the same point last year. Our overall
leverage ratio was 15.8% (2015: 11.9%).
Secure Trust Bank has continued to fund its lending activities primarily from customers’ deposits. Our loan to deposit ratio was
108% at 30 June 2016, which compares to 102% at 30 June 2015. The higher ratio is a product of the bank utilising the surplus
liquidity arising from the Everyday Loans sale in preference to raising additional interest bearing deposits during the second quarter
of 2016. Usage of the Funding for Lending Scheme has increased modestly from £26 million to £36 million, albeit this remains a
nominal 3% of total lending balances. We have no reliance for funding from wholesale or interbank markets. The Bank has
continued broadly to match fund its customer lending with customer deposits. This strategy seeks to mitigate maturity
transformation and interest basis risks. During the last six months we increased the proportion of fixed term fixed rate funding lest a
‘Brexit’ vote triggered a liquidity squeeze. Customer demand for our deposit products remains very strong and we are very pleased
to note that the majority of customers with maturing medium term savings bonds chose to reinvest their funds into deposit products
with us.
Lending activities
Consistent with the statements above, our focus over the last six months has been to position the loan book more defensively
ahead of the EU referendum. The successful conclusion of the Everyday Loans sale in April resulted in receiving repayment in full
of our funding of £117.9 million of unsecured personal loans. We have also curtailed net lending to UK house builders during this
period whilst continuing to support our proven customers. Overall therefore net customer lending as at 30 June 2016 of £1,128.3
million represents 32% growth over the same period in 2015. Adjusting for the divestment of Everyday Loans, customer lending
balances are 17% higher than as at 31 December 2015 and 51% higher than at 30 June 2015.
The total volume of new loans, excluding EverydayLoans group, written in H1 2016 was £462.5 million representing a 22%
increase on the £379.4 million for the same period last year. This overall growth rate is a function of our pre-referendum appetite in
certain lending markets.
Motor Finance balances have grown to £205.6 million from £152.3 million a year ago and £165.7 million as at 31 December 2015
representing 35% and 24% growth respectively.
Personal unsecured lending balances, excluding EverydayLoans group, have contracted to £64.6 million from £83.6 million a year
ago and £74.3 million as at 31 December 2015 representing a change of -23% and -13% respectively. This reflects our cautious
stance towards this particular market at this time.
Retail Point of Sale balances have grown to £271.7 million from £163.4 million a year ago and £220.4 million as at 31 December
2015 representing 66% and 23% growth respectively.
As at 30 June 2016 Real Estate Finance lending balances have grown to £361.7 million from £266.3 million a year ago and £368.0
million as at 31 December 2015 representing 36% growth and a fall of 2% respectively.
As at 30 June 2016 Asset Finance lending balances have grown to £112.3 million from £30.4 million a year ago and £70.7 million
as at 31 December 2015 representing 59% growth since the year end.
As at 30 June 2016 Invoice Finance lending balances have grown to £54.5 million from £15.7 million a year ago and £29.3 million
as at 31 December 2015 representing 86% growth since the year end.
We have not compromised our acceptance criteria or lending standards to achieve net growth and have actively managed the
composition of the book to manage risk. As expected, impairments as a percentage of lending balances in Motor and Retail
Finance have increased reflecting the increased levels of higher risk lending in Motor and interest bearing lending in Retail Finance.
Impairments as a percentage of lending balances in Unsecured Personal Lending (excluding Everyday Loans) are broadly
unchanged reflecting the absence of a change in the make-up of this book. In SME Lending impairment performance has been in
line with management expectations. We continue to target a 30% return on equity in our lending operations.

Chief Executive’s statement
5
Fee based services
The OneBill service remains closed for new business. Customer numbers continue to reduce in line with management expectations
and ended the period at 20,494.
We have taken the decision to close our basic bank account offering. This has been heavily influenced by an agreement between
HM Government and the large High St banks whereby these banks will provide a fee free basic bank account to all customers. It is
not equitable or right for us to continue to charge customers for a product they can now get for free elsewhere. The closure of this
product line will be concluded by the year end. The nature of the product requires constant IT investment and consumes
considerable management time and focus. Operational benefits will therefore arise following the closure but these are not expected
to have a material impact on the bank’s balance sheet or profit and loss account.
Our debt collection business, Debt Managers (Services) Limited, has traded profitably throughout the first half of 2016.
Strong customer relationships and ethics
We remain committed to providing straightforward transparent banking solutions to customers in a friendly and personal manner.
Customer satisfaction levels, as measured by the independent FEEFO customer feedback forum, are consistently in the 95th
centile. Customer numbers continue to grow and are over 35% higher than at 30 June last year at 608,891 (2015: 449,949,
excluding EverydayLoans group).
During the period we once again received reaffirmation of the Customer Service Excellence Award (an award introduced in 2010 by
the Cabinet Office to replace the Kite Mark). We are the only bank to hold this award.
Navigating current markets
With the benefit of hindsight the cautious stance adopted over recent periods has proved to be appropriate. As a result we have
virtually no exposure to the sorts of property lending the FPC has expressed reservations about and are one of the most well
capitalised banks in the UK. In line with our strategy a greater proportion of the Bank’s balance sheet lending is now in secured
lending assets. As at 30 June 2016 47% of the lending portfolio is secured by UK assets (2015: 37%).
STB does have exposure to the UK property market which is almost exclusively residential property lending. During the last cycle
average residential property prices experienced a 24% peak to trough swing. By contrast average commercial property prices saw
a 44% swing. STB’s credit policy is clearly informed by such data hence our stance to limit commercial property lending other than
in exceptional circumstance and restricting residential property lending to sensible leverage ratios.
Our current policy is not to offer loans exceeding 60% loan to gross development value (LTGDV) to residential house builders. We
will look to support residential developers and may continue to offer support up to these policy levels. This will however be the
preserve of those customers with an excellent track record. Policy will be continually reviewed in light of the changing market and
we will continue to exercise prudence. We have limited appetite to fund developments in Central London and are not looking to
write loans in respect of properties in Central London exceeding 50% LTGDV. We will continue to provide residential investment
lending to corporates and expect this will be at LTV levels comparable to those already on the book.
As at 30 June 2016, STB’s property exposures were as follows:
Category Lending balances
£millions
LTV / LTGDV*
%
Residential Development 161.4 56
Residential Investment 169.1 58
Commercial Investment 31.2 50
* Data assumes lending lines are drawn to maximum of available limits and therefore overstate the actual portfolio LTVs / LTGDVs as many customers have not fully
drawn their lines.

Chief Executive’s statement
6
The rest of the business is relatively short term consumer and asset finance lending. As a matter of course, we regularly refine our
credit criteria and pricing to take into account the current and likely future economic conditions. We have done this as a result of the
EU referendum outcome and will keep our credit appetite and associated risk based pricing under review going forward.
We intend to fine tune our residential mortgage proposition in light of developments and will progress the launch of this product
cautiously once the outlook for the UK owner occupied mortgage market becomes clearer.
Evolving competitive landscape
Markets are likely to be volatile and lacking in confidence until greater clarity and certainty is available. In the meantime the current
UK economic fundamentals are not bad. The market is absolutely awash with liquidity and banks are holding dramatically more
capital than they were ahead of the last downturn. I do not envisage a liquidity or solvency crisis which could develop into a deep
prolonged credit crunch and the negative consequences that would bring. There is record employment and unemployment is less
than 5%. There remains a high job vacancy rate. Net take home pay has been rising as employers compete for staff in a low
inflation environment. Interest rates are likely to be low for longer. If base rates fall, this will help to counteract the upward pressure
on fuel costs arising from the depreciation of sterling. There remains a chronic shortage of housing and an urgent need for much
more house building to address this.
My view is that the competitive landscape is likely to undergo a significant adjustment. If base rates fall, this will further depress the
net interest margins of the systemic banks which continue to control over 80% of the UK lending market. In turn their profitability
and thus capital generation will reduce. I expect they will respond by cutting costs by reducing staff numbers which will impact on
customer service, especially in SME markets. The Competition and Markets Authority noted that residential mortgage lending is the
most profitable activity of the systemic banks. Faced with the option of doing (sub 50%) mortgage lending which generates an
average 3% risk weighted asset or SME lending which generates an average 77% risk weighted asset, I expect the systemic banks
will repeat their behaviour last time around and retrench from higher risk weighted asset lending.
I believe this will impact non-bank lenders who rely on wholesale funding from larger banks in order to on lend to their customers.
This sector has been growing in recent years and competing increasingly aggressively on credit standards and price. I expect these
trends to possibly reverse as newer non-bank lenders will find it increasingly difficult to access wholesale markets and when they
can they are likely to have to pay more.
It would not surprise me to see some non-systemic banks and building societies curtail their lending activities. The latter are
exposed to net interest margin compression risks in a falling base rate environment.
Taking all of this into account, I envisage the competitive landscape resembling that during 2010-2014 when despite a weak and at
times shrinking economy, STB was able to cherry pick the lending assets it wanted to write and generate strong profitability. My
current assessment is that the evolving market dynamics will allow us to continue to focus in specialist areas in our targeted way by
providing customers with excellent service, suitably priced for our assessment of risk.
Obviously a period of heightened uncertainty will inform our M&A thinking. We are interested in opportunities which we believe are
compelling and recent valuation adjustments are noted. Investors will be aware that when non-bank lenders last became funding
constrained, this provided acquisition opportunities for STB.
Longer term, being outside of EU should be to the benefit of the smaller banks and building societies. HM Government and the
Bank of England should be able to create the more proportionate approach to the regulation of small banks they have been calling
for as they will not need to abide by directives from the European Banking Authority (EBA). As matters stand smaller lenders
cannot compete effectively or sustainably in the lower risk, lower loan to value end of the market because of their funding and
capital disadvantages. The disclosures by the FPC earlier this month show that they understand that these dynamics serve to force
the smaller players into the higher end of the LTV spectrum. The good news is that shorn of the shackles of the EBA, HM
Government will be able to create a truly level competitive playing field in UK banking. This will help smaller banks and building
societies to compete more effectively across the whole market with the 6 biggest firms which continue to control 80% of all lending.
This will allow the smaller lenders to write lower LTV lending and ultimately benefit consumer and SME customers via creating
competition and choice.
Chief Executive’s statement
7
Outlook
In the shorter term, we remain fully committed to supporting our customers during this current period of economic uncertainty, just
as we have supported customers for over six decades. Our approach to the market will reflect evolving economic conditions and
our credit appetite will be kept under review. I expect market dynamics to favour a well-funded bank with strong capital resources
and a short duration loan book. As such we expect to continue to write business in a targeted manner with due respect to risk and
pricing, while we progress our strategic priorities.
In the longer term I can see more opportunities than threats arising from Brexit. I expect the EU exit negotiations to have a much
greater impact on the large banks than the challenger banks exclusively focussed in the UK. I also expect the UK Government to
act consistently with their recent calls and adopt a more proportionate approach to the regulation of smaller, non-systemic banks
like Secure Trust Bank. Such an outcome would further increase our addressable market and with it the strategic opportunities
available to us.
Paul Lynam Chief Executive Officer 19 July 2016

Consolidated statement of comprehensive income
8
Six months ended 30 June
Note 2016 2016 2016 2015 2015 2015
Continuing Discontinued Total Continuing Discontinued Total
£million £million £million £million £million £million
Interest receivable and similar income 60.6 13.2 73.8 44.2 20.0 64.2
Interest expense and similar charges (11.1) (2.1) (13.2) (8.3) (1.5) (9.8)
Net interest income 49.5 11.1 60.6 35.9 18.5 54.4
Fee and commission income 8.7 0.1 8.8 8.3 1.1 9.4
Fee and commission expense (0.9) (0.1) (1.0) (1.4) (0.2) (1.6)
Net fee and commission income 7.8 - 7.8 6.9 0.9 7.8
Operating income 57.3 11.1 68.4 42.8 19.4 62.2
Net impairment losses on loans and advances to
customers (13.3) (2.6) (15.9) (8.0) (3.2) (11.2)
Operating expenses (31.5) (6.0) (37.5) (24.4) (10.6) (35.0)
Profit before income tax 2 12.5 2.5 15.0 10.4 5.6 16.0
Income tax expense (2.2) (0.5) (2.7) (2.0) (1.1) (3.1)
Profit after income tax 10.3 2.0 12.3 8.4 4.5 12.9
Gain recognised on disposal - 116.8 116.8 - - -
Profit after income tax and total comprehensive
income for the period 10.3 118.8 129.1 8.4 4.5 12.9
Profit and total comprehensive income
attributable to equity holders of the Company 10.3 118.8 129.1 8.4 4.5 12.9
Earnings per share for profit attributable to the
equity holders of the Company during the period
(expressed in pence per share)
Basic earnings per share 3 57.0 652.9 709.9 46.3 24.5 70.8
Diluted earnings per share 3 55.9 640.8 696.7 45.5 24.0 69.5
The notes on pages 12 to 16 are an integral part of these consolidated financial statements.
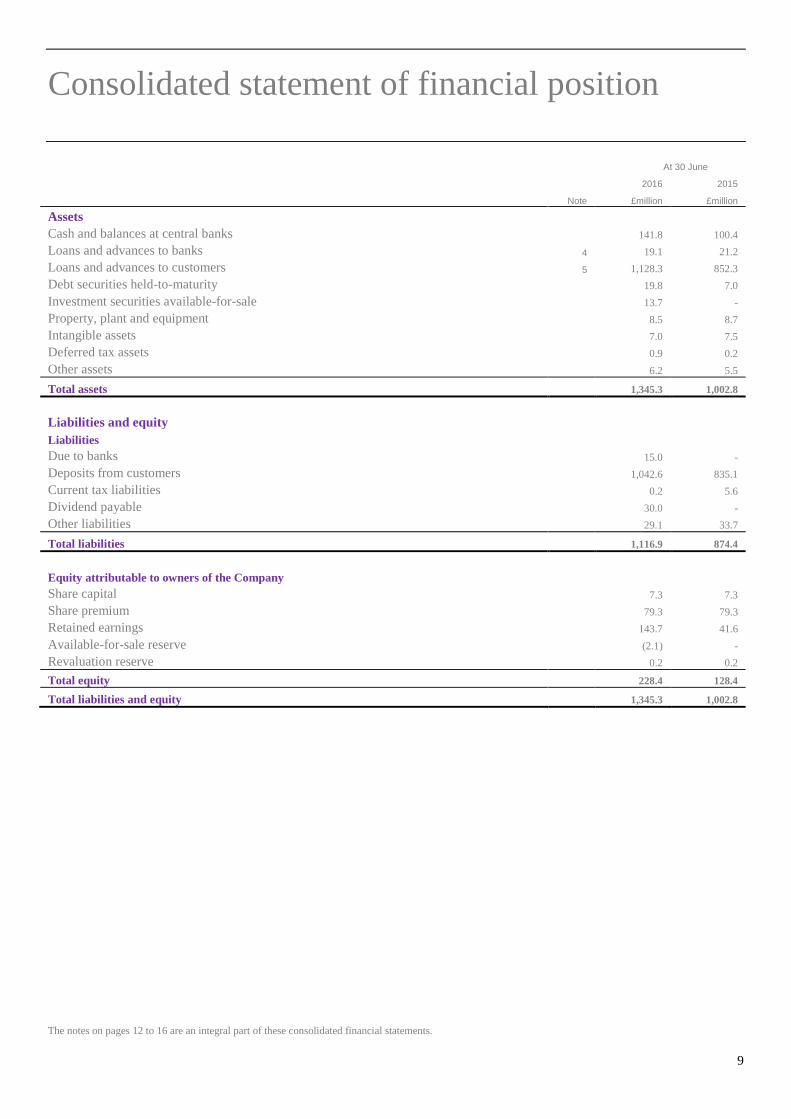
Consolidated statement of financial position
9
At 30 June
2016 2015
Note £million £million
Assets
Cash and balances at central banks 141.8 100.4
Loans and advances to banks 4 19.1 21.2
Loans and advances to customers 5 1,128.3 852.3
Debt securities held-to-maturity 19.8 7.0
Investment securities available-for-sale 13.7 -
Property, plant and equipment 8.5 8.7
Intangible assets 7.0 7.5
Deferred tax assets 0.9 0.2
Other assets 6.2 5.5
Total assets 1,345.3 1,002.8
Liabilities and equity
Liabilities
Due to banks 15.0 -
Deposits from customers 1,042.6 835.1
Current tax liabilities 0.2 5.6
Dividend payable 30.0 -
Other liabilities 29.1 33.7
Total liabilities 1,116.9 874.4
Equity attributable to owners of the Company
Share capital 7.3 7.3
Share premium 79.3 79.3
Retained earnings 143.7 41.6
Available-for-sale reserve (2.1) -
Revaluation reserve 0.2 0.2
Total equity 228.4 128.4
Total liabilities and equity 1,345.3 1,002.8
The notes on pages 12 to 16 are an integral part of these consolidated financial statements.

Consolidated statement of changes in equity
10
Share capital
Share premium
Revaluation reserve
Available-for-sale reserve
Retained earnings Total
£million £million £million £million £million £million
Balance at 1 January 2016 7.3 79.3 0.2 - 54.4 141.2
Total comprehensive income for the period
Profit for the six months ended 30 June 2016 - - - - 129.1 129.1
Movement in available-for-sale reserve - - - (2.1) - (2.1)
Total comprehensive income for the period - - - (2.1) 129.1 127.0
Transactions with owners, recorded directly in equity
Contributions by and distributions to owners
Final dividend relating to 2015 - - - (10.0) (10.0)
Special dividend relating to 2016 - - - (30.0) (30.0)
Charge for share based payments - - - 0.2 0.2
Total contributions by and distributions to owners - - - (39.8) (39.8)
Balance at 30 June 2016 7.3 79.3 0.2 (2.1) 143.7 228.4
Share capital
Share premium
Revaluation reserve
Available-for-sale reserve
Retained earnings Total
£million £million £million £million £million £million
Balance at 1 January 2015 7.3 79.3 0.2 - 38.1 124.9
Total comprehensive income for the period
Profit for the six months ended 30 June 2015 - - - - 12.9 12.9
Total comprehensive income for the period - - - - 12.9 12.9
Transactions with owners, recorded directly in equity
Contributions by and distributions to owners
Final dividend relating to 2014 - - - - (9.5) (9.5)
Charge for share based payments - - - - 0.1 0.1
Total contributions by and distributions to owners - - - - (9.4) (9.4)
Balance at 30 June 2015 7.3 79.3 0.2 - 41.6 128.4
The notes on pages 12 to 16 are an integral part of these consolidated financial statements.

Consolidated statement of cash flows
11
Six months ended
30 June
2016 2015
Note
£million £million
Cash flows from operating activities
Profit for the six months 10.3 8.4
Adjustments for:
Income tax expense 2.2 2.0
Depreciation of property, plant and equipment 0.3 0.2
Amortisation of intangible assets 0.7 0.8
Impairment losses on loans and advances 13.3 8.0
Equity settled share based payment transactions 0.2 0.1
Cash flows from operating profits before changes in operating assets and liabilities 27.0 19.5
Changes in operating assets and liabilities:
- net increase in debt securities held to maturity (16.0) -
- net (increase)/decrease in loans and advances to banks (5.0) 24.3
- net increase in loans and advances to customers (181.0) (226.4)
- net decrease in other assets 0.9 -
- net decrease in amounts due to banks (20.0) (15.9)
- net increase in deposits from customers 9.5 226.7
- net increase in other liabilities 2.9 0.4
Income tax paid (5.3) (0.5)
Net cash (outflow)/inflow from operating activities (187.0) 28.1
Cash flows from investing activities
Net cash realised from the sale of EverydayLoans group (net of selling costs and cash disposed) 209.9 -
Purchase of property, plant and equipment (0.3) (0.7)
Purchase of computer software (0.7) (0.6)
Net cash inflow/(outflow) from investing activities 208.9 (1.3)
Cash flows from financing activities
Dividends paid (10.0) (9.5)
Net cash outflow from financing activities (10.0) (9.5)
Net increase in cash and cash equivalents – Continuing operations 11.9 17.3
Net increase/(decrease) in cash and cash equivalents – Discontinued operations 6 0.7 (1.7)
Cash and cash equivalents at 1 January 143.3 106.0
Cash and cash equivalents at 30 June 155.9 121.6
The notes on pages 12 to 16 are an integral part of these consolidated financial statements.

Notes to the consolidated financial statements
12
1. Operating segments The Group is organised into six main operating segments, which consist of the different products available, disclosed below:
Business finance
1) Real Estate Finance: investment and development loans secured by UK real estate.
2) Asset Finance: loans to small and medium sized enterprises to acquire commercial assets.
3) Commercial Finance: invoice discounting and invoice financing.
Consumer finance
4) Personal Lending: Unsecured consumer loans sold to customers via brokers and affinity partners.
5) Motor Finance: Hire purchase agreements secured against the vehicle being financed.
6) Retail Finance: Point of sale unsecured finance for in-store and online retailers.
Other
Other includes Current Account, OneBill, RentSmart, debt collection and a £30 million loan to Non Standard Finance PLC as part
of their purchase of ELG (see note 6).
Management review these segments by looking at the income, size and growth rate of the loan books, impairments and customer
numbers. Except for these items no costs or balance sheet items are allocated to the segments.
Interest receivable and similar
income
Fee and commission
income
Revenue from
external customers
Net impairment losses on loans
and advances to customers
Loans and advances
to customers
Six months ended 30 June 2016 £million £million £million £million £million
Business finance
Real Estate Finance 13.9 0.1 14.0 - 361.7
Asset Finance 3.5 - 3.5 0.2 112.3
Commercial Finance 0.6 1.1 1.7 - 54.5
Consumer finance
Personal Lending 5.9 - 5.9 2.2 64.6
Motor Finance 18.4 0.4 18.8 6.1 205.6
Retail Finance 15.4 1.2 16.6 4.8 271.7
Other 2.9 5.9 8.8 - 57.9
60.6 8.7 69.3 13.3 1,128.3
Discontinued operations and assets held for sale:
Personal Lending 13.2 0.1 13.3 2.6 -
73.8 8.8 82.6 15.9 1,128.3
Interest receivable and similar
income
Fee and commission
income
Revenue from
external customers
Net impairment losses on loans
and advances to customers
Loans and advances
to customers
Six months ended 30 June 2015 £million £million £million £million £million
Business finance
Real Estate Finance 8.1 - 8.1 0.3 266.3
Asset Finance 0.6 - 0.6 - 30.4
Commercial Finance 0.1 0.4 0.5 - 15.7
Consumer finance
Personal Lending 7.0 - 7.0 2.3 83.6
Motor Finance 15.8 - 15.8 3.1 152.3
Retail Finance 9.6 0.7 10.3 2.3 163.4
Other 3.0 7.2 10.2 - 35.3
44.2 8.3 52.5 8.0 747.0
Discontinued operations and assets held for sale:
Personal Lending 20.0 1.1 21.1 3.2 105.3
64.2 9.4 73.6 11.2 852.3

Notes to the consolidated financial statements
13
The ‘other’ segment above includes other products which are individually below the quantitative threshold for separate disclosure
and fulfils the requirement of IFRS 8.28 by reconciling operating segments to the amounts reported in the financial statements.
The June 2016 impairment charge of £13.3 million relating to continuing operations includes an additional collective impairment
charge of £1.2 million. This charge is not driven by the current performance of the loan book and relates to additional provision
introduced due to the current unprecedented uncertainty in European and Global markets.
As interest expense, fee and commission expense and operating expenses are not aligned to operating segments for day to day
management of the business and cannot be allocated on a reliable basis, profit by operating segment has not been disclosed.
All of the Group’s operations are conducted wholly within the United Kingdom and geographical information is therefore not
presented.
2. Underlying profit reconciliation The profit before tax as reported in the Consolidated Statement of Comprehensive Income can be reconciled to the underlying
profit for the year as follows:
Six months ended 30 June
2016 2015
£million £million
Total profit before tax 15.0 16.0
Less: Profit before tax – Discontinued operations (2.5) (5.6)
Profit before tax – Continuing operations 12.5 10.4
Fair value amortisation 0.4 0.5
Share based incentive schemes 0.3 0.3
Net ABG management recharges 0.2 0.1
Current Account closure costs 0.1 -
Bonus payments made in respect of ELG sale 3.5 -
Other items relating to ELG sale (0.8) -
Additional collective impairment charge 1.2 -
Underlying profit before tax – Continuing operations 17.4 11.3
Underlying tax (3.1) (2.2)
Underlying profit after tax – Continuing operations 14.3 9.1
Underlying basic earnings per share (pence) 78.5 50.1

Notes to the consolidated financial statements
14
3. Earnings per ordinary share
Profit Shares
Earnings per share Profit Shares
Earnings per share
2016 2016 2016 2015 2015 2015
£million Number Pence £million Number Pence
Basic
Continuing operations 10.3 18,191,894 57.0 8.4 18,191,894 46.3
Discontinued operations 118.8 18,191,894 652.9 4.5 18,191,894 24.5
Total 129.1 18,191,894 709.9 12.9 18,191,894 70.8
Diluted
Continuing operations 10.3 18,535,617 55.9 8.4 18,537,699 45.5
Discontinued operations 118.8 18,535,617 640.8 4.5 18,537,699 24.0
Total 129.1 18,535,617 696.7 12.9 18,537,699 69.5
Basic
Basic earnings per ordinary share are calculated by dividing the profit attributable to equity holders of the parent by the weighted
average number of Ordinary Shares in issue during the period.
Diluted
Diluted earnings per ordinary share are calculated by dividing the profit attributable to equity holders of the parent by the
weighted average number of Ordinary Shares in issue during the period, as noted above, as well as the number of dilutive share
options in issue during the period.
The number of dilutive shares in issue at the period-end was 343,723, being based on the number of options granted of 460,419,
the exercise price of £7.20 per option and the average share price during the period from 1 January to 30 June 2016 of £28.41.
(2015: 345,805 dilutive shares in issue).
4. Loans and advances to banks Included within loans and advances to banks are amounts placed with Arbuthnot Latham & Co., Limited, prior to 15 June 2016 a
related company, of £5.0 million (31 December 2015: £5.3 million; 30 June 2015: £10.0 million). The current period amount of
£5.0 million is not included in cash and cash equivalents.
5. Loans and advances to customers
At 30 June
2016 2015
£million £million
Gross loans and advances 1,172.4 893.0
Less: allowances for impairment on loans and advances (44.1) (40.7)
1,128.3 852.3
Notes to the consolidated financial statements
15
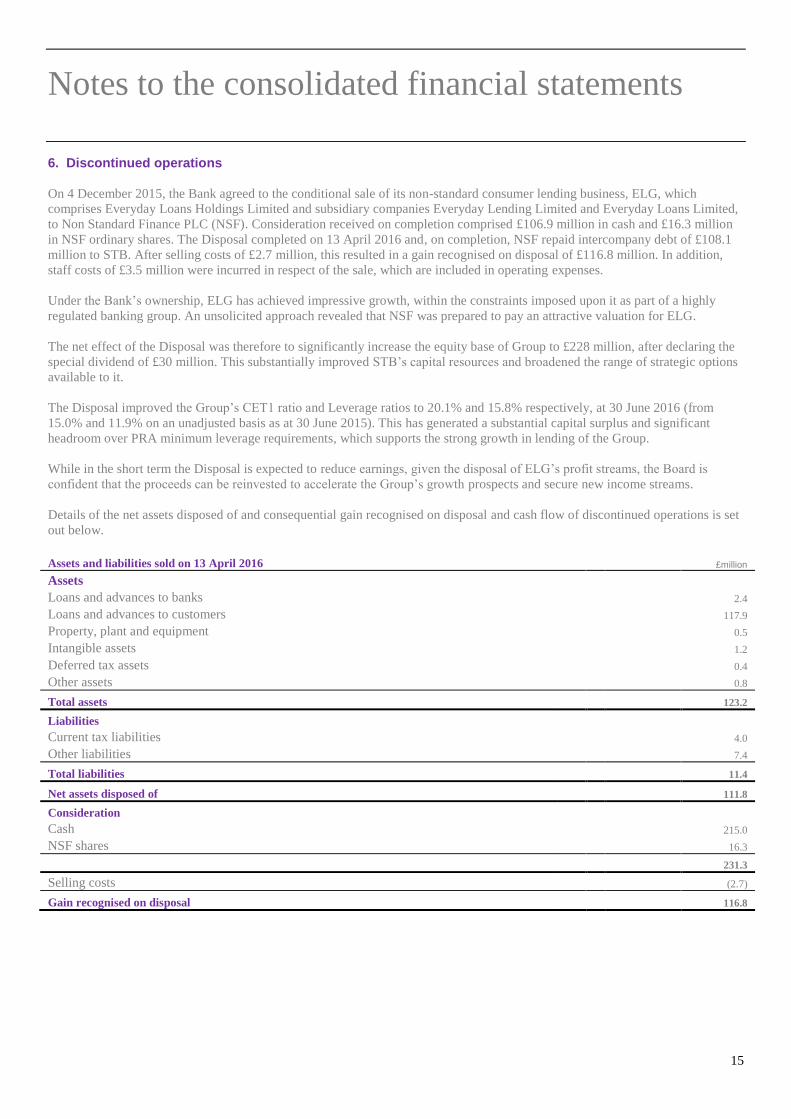
6. Discontinued operations
On 4 December 2015, the Bank agreed to the conditional sale of its non-standard consumer lending business, ELG, which
comprises Everyday Loans Holdings Limited and subsidiary companies Everyday Lending Limited and Everyday Loans Limited,
to Non Standard Finance PLC (NSF). Consideration received on completion comprised £106.9 million in cash and £16.3 million
in NSF ordinary shares. The Disposal completed on 13 April 2016 and, on completion, NSF repaid intercompany debt of £108.1
million to STB. After selling costs of £2.7 million, this resulted in a gain recognised on disposal of £116.8 million. In addition,
staff costs of £3.5 million were incurred in respect of the sale, which are included in operating expenses.
Under the Bank’s ownership, ELG has achieved impressive growth, within the constraints imposed upon it as part of a highly
regulated banking group. An unsolicited approach revealed that NSF was prepared to pay an attractive valuation for ELG.
The net effect of the Disposal was therefore to significantly increase the equity base of Group to £228 million, after declaring the
special dividend of £30 million. This substantially improved STB’s capital resources and broadened the range of strategic options
available to it.
The Disposal improved the Group’s CET1 ratio and Leverage ratios to 20.1% and 15.8% respectively, at 30 June 2016 (from
15.0% and 11.9% on an unadjusted basis as at 30 June 2015). This has generated a substantial capital surplus and significant
headroom over PRA minimum leverage requirements, which supports the strong growth in lending of the Group.
While in the short term the Disposal is expected to reduce earnings, given the disposal of ELG’s profit streams, the Board is
confident that the proceeds can be reinvested to accelerate the Group’s growth prospects and secure new income streams.
Details of the net assets disposed of and consequential gain recognised on disposal and cash flow of discontinued operations is set
out below.
Assets and liabilities sold on 13 April 2016 £million
Assets
Loans and advances to banks 2.4
Loans and advances to customers 117.9
Property, plant and equipment 0.5
Intangible assets 1.2
Deferred tax assets 0.4
Other assets 0.8
Total assets 123.2
Liabilities
Current tax liabilities 4.0
Other liabilities 7.4
Total liabilities 11.4
Net assets disposed of 111.8
Consideration
Cash 215.0
NSF shares 16.3
231.3
Selling costs (2.7)
Gain recognised on disposal 116.8

Notes to the consolidated financial statements
16
Six months ended
30 June
2016 2015
Cash flow statement £million £million
Cash flows from operating activities
Profit for the six months 2.0 4.5
Adjustments for:
Income tax expense 0.5 1.1
Depreciation of property, plant and equipment - 0.1
Amortisation of intangible assets - 0.5
Impairment losses on loans and advances 2.6 3.2
Cash flows from operating profits before changes in operating assets and liabilities 5.1 9.4
Changes in operating assets and liabilities:
- net increase in loans and advances to customers (6.2) (14.7)
- net increase in other assets (0.3) (0.2)
- net increase in other liabilities 2.1 4.1
Income tax paid - (0.1)
Net cash inflow/(outflow) from operating activities 0.7 (1.5)
Cash flows from investing activities
Purchase of property, plant and equipment - (0.2)
Net cash outflow from investing activities - (0.2)
Net increase/(decrease) in cash and cash equivalents 0.7 (1.7)
Cash and cash equivalents at 1 January 1.7 1.7
Cash and cash equivalents at 13 April 2.4 -
7. Basis of reporting The interim financial statements have been prepared on the basis of accounting policies set out in the Group’s 2015 Annual Report
and Accounts as amended by standards and interpretations effective during 2016 and in accordance with IAS34 ‘Interim Financial
Reporting’. The Directors of the Company do not consider the fair values of the assets and liabilities presented in these interim
financial statements to be materially different from their carrying values.
The statements were approved by the Board of Directors on 18 July 2016 and are unaudited. The interim financial statements will
be posted to shareholders and copies may be obtained from The Company Secretary, Secure Trust Bank PLC, One Arleston Way,
Solihull, West Midlands, B90 4LH.

Board of Directors
17
Sir Henry Angest LLL, Hon. F. UHI Non – Executive Chairman
Paul Lynam ACIB, AMCT, Fifs Chief Executive Officer
Neeraj Kapur BEng, ACGI, FCA, CF, FCIBS Chief Financial Officer
Andrew Salmon ACA Non – Executive Director
The Rt Hon Lord Forsyth of Drumlean PC, Kt Independent Non – Executive Director
Paul Marrow ACIB Independent Non – Executive Director
Corporate contacts and advisers Secretary & Registered Office
A J Karter
One Arleston Way
Solihull
West Midlands
B90 4LH
T 0121 693 9100
F 0121 693 9124
www.securetrustbank.com
Stockbrokers:
Canaccord Genuity Limited
88 Wood Street
London
EC2V 7QR
Stifel Nicolaus Europe Limited
One Broadgate
London
EC2M 2QS
Advisers
Independent Auditor:
KPMG LLP
One Snowhill
Snow Hill Queensway
Birmingham
B4 6GH
Nominated Adviser:
Canaccord Genuity Limited
88 Wood Street
London
EC2V 7QR
Principal Banker:
Barclays Bank PLC
38 Hagley Road
Edgbaston
Birmingham
B16 8NY
Registrar:
Capita Asset Services
The Registry
34 Beckenham Road
Beckenham
Kent
BR3 4TU