Secular decrease of wind power potential in India ...Secular decrease of wind power potential in...
9
ATMOSPHERIC SCIENCE Copyright © 2018 The Authors, some rights reserved; exclusive licensee American Association for the Advancement of Science. No claim to original U.S. Government Works. Distributed under a Creative Commons Attribution NonCommercial License 4.0 (CC BY-NC). Secular decrease of wind power potential in India associated with warming in the Indian Ocean Meng Gao 1 *, Yihui Ding 2 , Shaojie Song 1 , Xiao Lu 1,3 , Xinyu Chen 1 *, Michael B. McElroy 1 * The Indian government has set an ambitious target for future renewable power generation, including 60 GW of cumulative wind power capacity by 2022. However, the benefits of these substantial investments are vulnerable to the changing climate. On the basis of hourly wind data from an assimilated meteorology reanalysis dataset covering the 1980–2016 period, we show that wind power potential may have declined secularly over this in- terval, particularly in western India. Surface temperature data confirm that significant warming occurred in the Indian Ocean over the study period, leading to modulation of high pressure over the ocean. A multivariable linear regression model incorporating the pressure gradient between the Indian Ocean and the Indian sub- continent can account for the interannual variability of wind power. A series of numerical sensitivity experiments confirm that warming in the Indian Ocean contributes to subsidence and dampening of upward motion over the Indian continent, resulting potentially in weakening of the monsoonal circulation and wind speeds over India. INTRODUCTION India, the third largest energy-consuming country in the world, emitted 2.4 billion metric tons of carbon dioxide (CO 2 ) in 2013, trailing only China and the United States. The energy supply in India is domi- nated currently by fossil fuels (73.8%), composed of coal (44.5%), oil (24.2%), and natural gas (5.1%) (1). Energy demand in India is projected to increase significantly over the coming decades. Primary energy consumption is forecast to quadruple by 2040 compared to the level that applied in 2005 (2). The primary driver is a growing economy expected to reach more than five times its current size by 2040, combined with a demographic boom anticipated to make India the world’s most populous country by 2025 (2). To match the growing energy demand, approximately 800 GW of new power generation capacity will be required by 2040, equivalent to the existing installed capacity for the entire European Union (2). Wind power is one of the most important alternative energy sources for India, with the potential to decouple the growth of energy demand and emissions of air pollutants and CO 2 . Development of wind power in India is relatively recent; its wind capacity amounted to only 6 GW in 2006. The growth since then has been exponential: The cumulative capacity increased by a factor of five in a decade. The cumulative installed capacity for wind power reached 32.8 GW in 2017, ranked number 4 globally, behind only China, the United States, and Germany (3). The wind power investment in India is concentrated in western and southern regions, including the states of Tamil Nadu, Gujarat, Maharashtra, and Rajasthan (4). These four states account for ap- proximately 70% of the national total (24.3, 16.8, 14.7, and 13.2%, respectively) (4). The Indian government has set an ambitious target to double the capacity for wind power over the next 5 years (60 GW by 2022) (5). The overall wind power potential for India is 2.5 times higher than its current energy demand (1, 6). The current development of wind power is still at an early stage. Significant expansion of the current capacity will be needed to decarbonize the country’s energy economy over the long term. While wind power provides an important opportunity to miti- gate anthropogenic climate change, the available power generation and the economics of wind power investments are also susceptible to a changing climate (7, 8). Projections from climate models high- light prospective declines in wind power potential by 2100 on the order of 10 to 40% over the Northern Hemisphere middle latitudes (9). Sherman et al.(10) argued that the potential for wind power in China has been declining markedly over the past 37 years; the decline attributed primarily to weakening of the East Asia winter monsoon. The presence of a high-pressure system over Siberia in combina- tion with variations of pressure associated with changes in tempera- ture over the Western Pacific represents the dominant influence for the winter wind regime in China. Conditions determining wind power potential in India differ from those in China. Blocking due to the pres- ence of the Tibetan Plateau in combination with the seasonal dis- tribution of temperature in the Indian Ocean is especially important for India. The potential variation of wind power resources and pos- sible links to a changing climate in India are underappreciated. In- sights on this topic are critical, as wind power investments are expected to play an increasingly important role in satisfying India’s growing energy demand. In this study, we report an analysis of variations in wind power potential for India over the past four decades, with a focus on relevant driving climate factors. Following Sherman et al.(10), a high-resolution assimilated meteorology dataset for wind speeds [Modern-Era Retro- spective analysis for Research and Applications, version 2 (MERRA- 2)] was adopted to explore the potential wind power output for India, with an hourly time resolution and a spatial resolution of approxi- mately 50 km by 50 km. We find that India has been experiencing a significant reduction in the potential for wind power generation (−0.77 PWh per decade; P < 0.01) over the study period, primarily in spring and summer. The dominant influence responsible for the decreasing wind potential is attributed to strong warming in the Indian Ocean, resulting in a weakening of the Indian summer monsoon (ISM). This association is validated further on the basis of a statistical model and with simulations using a regional numerical climate- weather model. 1 School of Engineering and Applied Sciences, Harvard University, Cambridge, MA 02138, USA. 2 National Climate Center, Chinese Meteorological Administration, Beijing 100081, China. 3 Department of Atmospheric and Oceanic Sciences, School of Physics, Peking University, Beijing 100871, China. *Corresponding author. Email: [email protected] (M.G.); xchen@seas. harvard.edu (X.C.); [email protected] (M.B.M.) SCIENCE ADVANCES | RESEARCH ARTICLE Gao et al., Sci. Adv. 2018; 4 : eaat5256 5 December 2018 1 of 8 on May 29, 2020 http://advances.sciencemag.org/ Downloaded from
Transcript of Secular decrease of wind power potential in India ...Secular decrease of wind power potential in...

SC I ENCE ADVANCES | R E S EARCH ART I C L E
ATMOSPHER I C SC I ENCE
1School of Engineering and Applied Sciences, Harvard University, Cambridge, MA02138, USA. 2National Climate Center, Chinese Meteorological Administration,Beijing 100081, China. 3Department of Atmospheric and Oceanic Sciences, Schoolof Physics, Peking University, Beijing 100871, China.*Corresponding author. Email: [email protected] (M.G.); [email protected] (X.C.); [email protected] (M.B.M.)
Gao et al., Sci. Adv. 2018;4 : eaat5256 5 December 2018
Copyright © 2018
The Authors, some
rights reserved;
exclusive licensee
American Association
for the Advancement
of Science. No claim to
originalU.S. Government
Works. Distributed
under a Creative
Commons Attribution
NonCommercial
License 4.0 (CC BY-NC).
Do
Secular decrease of wind power potential in Indiaassociated with warming in the Indian OceanMeng Gao1*, Yihui Ding2, Shaojie Song1, Xiao Lu1,3, Xinyu Chen1*, Michael B. McElroy1*
The Indian government has set an ambitious target for future renewable power generation, including 60 GW ofcumulative wind power capacity by 2022. However, the benefits of these substantial investments are vulnerableto the changing climate. On the basis of hourly wind data from an assimilated meteorology reanalysis datasetcovering the 1980–2016 period, we show that wind power potential may have declined secularly over this in-terval, particularly in western India. Surface temperature data confirm that significant warming occurred in theIndian Ocean over the study period, leading to modulation of high pressure over the ocean. A multivariablelinear regression model incorporating the pressure gradient between the Indian Ocean and the Indian sub-continent can account for the interannual variability of wind power. A series of numerical sensitivityexperiments confirm that warming in the Indian Ocean contributes to subsidence and dampening of upwardmotion over the Indian continent, resulting potentially in weakening of the monsoonal circulation and windspeeds over India.
wn
on May 29, 2020
http://advances.sciencemag.org/
loaded from
INTRODUCTIONIndia, the third largest energy-consuming country in the world, emitted2.4 billion metric tons of carbon dioxide (CO2) in 2013, trailing onlyChina and the United States. The energy supply in India is domi-nated currently by fossil fuels (73.8%), composed of coal (44.5%),oil (24.2%), and natural gas (5.1%) (1). Energy demand in India isprojected to increase significantly over the coming decades. Primaryenergy consumption is forecast to quadruple by 2040 compared tothe level that applied in 2005 (2). The primary driver is a growingeconomy expected to reach more than five times its current size by2040, combined with a demographic boom anticipated to make Indiathe world’s most populous country by 2025 (2). To match the growingenergy demand, approximately 800 GW of new power generationcapacity will be required by 2040, equivalent to the existing installedcapacity for the entire European Union (2).
Wind power is one of themost important alternative energy sourcesfor India, with the potential to decouple the growth of energy demandand emissions of air pollutants and CO2. Development of wind powerin India is relatively recent; its wind capacity amounted to only 6 GWin 2006. The growth since then has been exponential: The cumulativecapacity increased by a factor of five in a decade. The cumulativeinstalled capacity for wind power reached 32.8 GW in 2017, rankednumber 4 globally, behind only China, the United States, and Germany(3). The wind power investment in India is concentrated in westernand southern regions, including the states of Tamil Nadu, Gujarat,Maharashtra, and Rajasthan (4). These four states account for ap-proximately 70% of the national total (24.3, 16.8, 14.7, and 13.2%,respectively) (4). The Indian government has set an ambitious targetto double the capacity for wind power over the next 5 years (60 GWby 2022) (5). The overall wind power potential for India is 2.5 timeshigher than its current energy demand (1, 6). The current developmentof wind power is still at an early stage. Significant expansion of the
current capacity will be needed to decarbonize the country’s energyeconomy over the long term.
While wind power provides an important opportunity to miti-gate anthropogenic climate change, the available power generationand the economics of wind power investments are also susceptibleto a changing climate (7, 8). Projections from climate models high-light prospective declines in wind power potential by 2100 on theorder of 10 to 40% over the Northern Hemisphere middle latitudes(9). Sherman et al. (10) argued that the potential for wind power inChina has been declining markedly over the past 37 years; the declineattributed primarily to weakening of the East Asia winter monsoon.The presence of a high-pressure system over Siberia in combina-tion with variations of pressure associated with changes in tempera-ture over the Western Pacific represents the dominant influence forthe winter wind regime in China. Conditions determining wind powerpotential in India differ from those in China. Blocking due to the pres-ence of the Tibetan Plateau in combination with the seasonal dis-tribution of temperature in the Indian Ocean is especially importantfor India. The potential variation of wind power resources and pos-sible links to a changing climate in India are underappreciated. In-sights on this topic are critical, as wind power investments are expectedto play an increasingly important role in satisfying India’s growingenergy demand.
In this study, we report an analysis of variations in wind powerpotential for India over the past four decades, with a focus on relevantdriving climate factors. Following Sherman et al. (10), a high-resolutionassimilated meteorology dataset for wind speeds [Modern-Era Retro-spective analysis for Research and Applications, version 2 (MERRA-2)] was adopted to explore the potential wind power output for India,with an hourly time resolution and a spatial resolution of approxi-mately 50 km by 50 km. We find that India has been experiencing asignificant reduction in the potential for wind power generation(−0.77 PWh per decade; P < 0.01) over the study period, primarilyin spring and summer. The dominant influence responsible for thedecreasing wind potential is attributed to strong warming in the IndianOcean, resulting in a weakening of the Indian summer monsoon(ISM). This association is validated further on the basis of a statisticalmodel and with simulations using a regional numerical climate-weather model.
1 of 8

SC I ENCE ADVANCES | R E S EARCH ART I C L E
on May 29, 2020
http://advances.sciencemag.org/
Dow
nloaded from
RESULTSWind power spatial distributionFigure 1 (A and B) shows mean values of capacity factors (CFs;more details in Materials and Methods) for wind power and relatedcoefficients of variation (CVs; based on annual values) for India dur-ing the 1980–2016 period. High-quality wind resources are locatedpredominantly in western and southern India, with CF values higherthan 25%. Compared with the global CF map shown in Lu et al. (6),values of CF calculated for India in this study are generally higher butwith a similar spatial distribution. Lu et al. (6) used the GoddardEarth Observing System Model, version 5 (GEOS-5) six-hourly op-erational meteorology dataset, while this study uses the more recentlyupdated MERRA-2 hourly assimilated fields, the likely source of thedifferences. Further, MERRA-2 covers a longer time period com-pared to GEOS-5. Northern and central Indian regions are associatedwith a high interannual variability, with values for CVs higher than10%. The implications of these interannual variations are detailedlater in the Discussion section.
Long-term wind power variabilityWe calculated a 37-year mean potential electricity (PE) generation forfive regions: western, northern, southern, eastern, and northeasternIndia, as presented in Fig. 2A. The spatial distribution of wind powerin India is extensive: Western India accounts for the largest share(36%) of the national total, followed by northern and southern India(26 and 25%, respectively). Northern and western India are found toshow the greatest declines (−18 and −14.4%) over the past severaldecades, with reductions of −5.0 and −4.0% per decade, respectively.In the states with the largest installed wind power capacity, significantdeclines are found as well, with the exception of the results for TamilNadu. The greatest decline is projected for Rajasthan, where PE gen-eration is highest (Fig. 2B). The long-term declining trend of thewind resource poses a potential risk for the financial return on windpower investments. The current investment accounts only for 2 to3 years of historical wind conditions, but the lifetimes of a wind turbinerange from 20 to 30 years (11, 12). A potential secular decline of windconditions triggered by climate change, in this case, could influence thefuture financial return of recent wind investments.
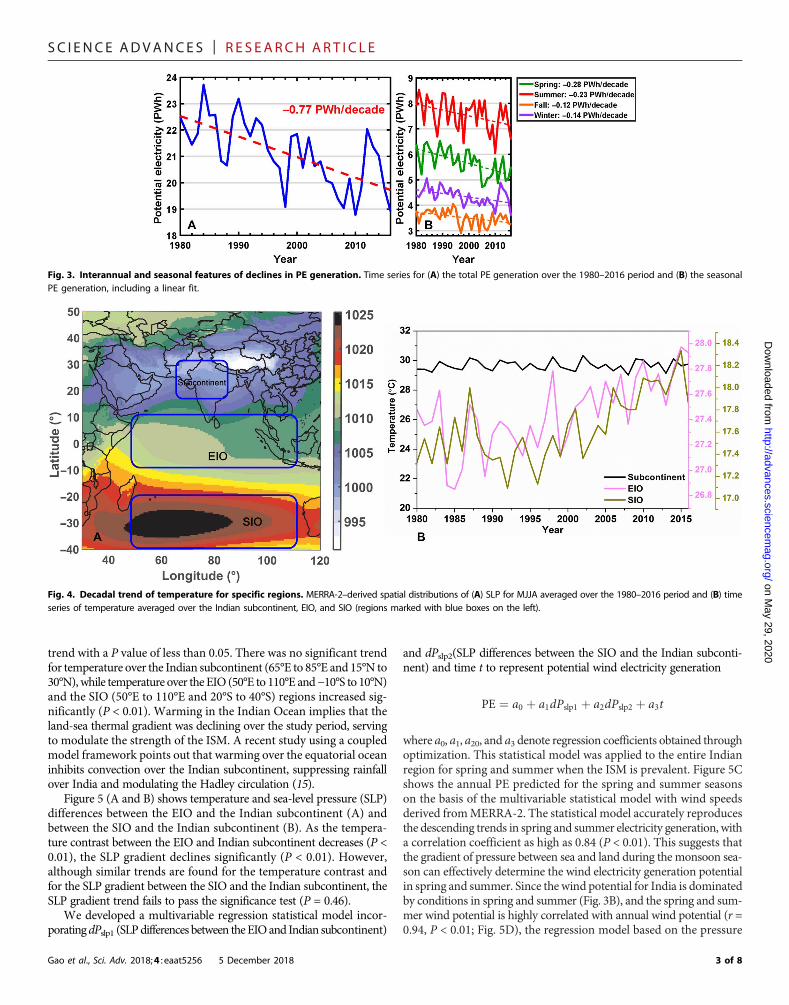
Over the entire Indian subcontinent, PE production decreasedat a rate of −0.77 PWh per decade [P < 0.01; −13% during the1980–2016 period (Fig. 3A)], suggesting that wind power systemsinstalled over this time interval would have become less productive.
Gao et al., Sci. Adv. 2018;4 : eaat5256 5 December 2018
In India, 63% of the annual production of electricity from wind iscontributed by winds in spring and summer (Fig. 3B). However, thePE that could be generated from winds in spring and summer has beendeclining rapidly,with rates of declinehigher than those in fall andwinter.The secular decrease in wind power in India, particularly during springand summer, reflects weakening of the ISM over the study interval.
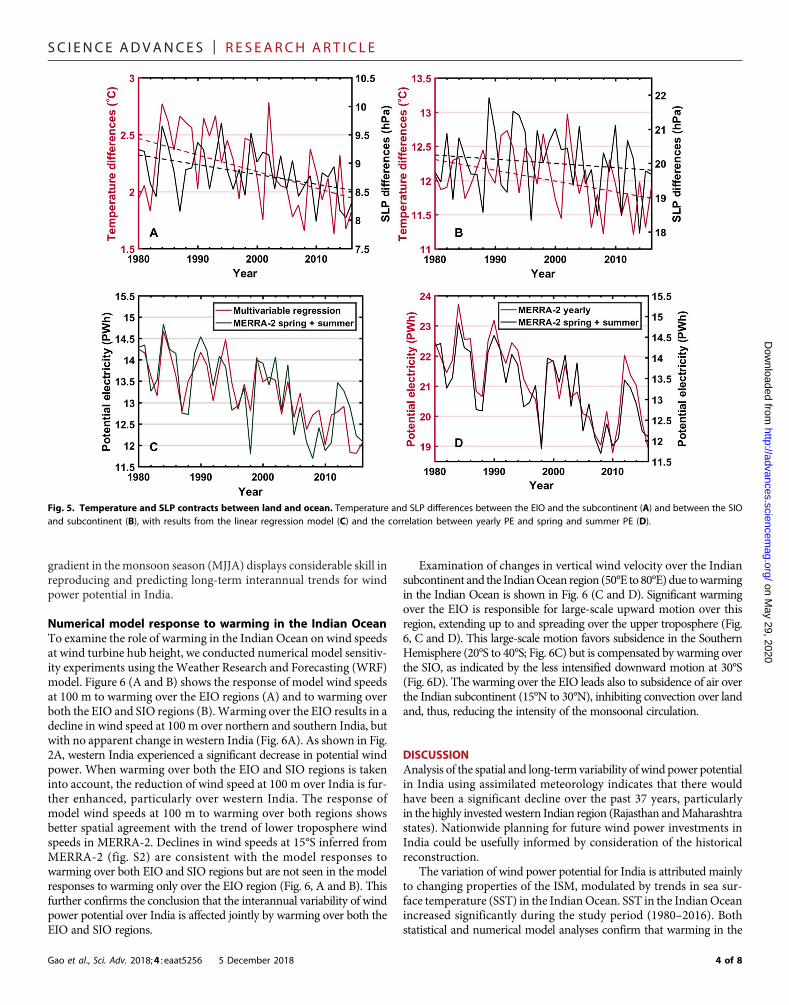
Warming in the Indian Ocean and decliningtemperature contrastThe contrast between low pressure associated with high temperatureover the Indian subcontinent and high pressure over the ocean drivesthe ISM (13). TheMascarene High in the southern Indian Ocean (SIO)is the powerhouse of the ISM.Winds originating from this system turnto the northeast under the cross-equatorial pressure gradient force. Theflow from the Southern Hemisphere can also form closed or almostclosed circulation patterns near the equator, systems referred to as equa-torial anticyclone/highs (14). The sinking air in the lower tropospherenear the equator confirms the existence of equatorial anticyclone/high(fig. S1).We calculated trends in surface temperature during themon-soon season [May, June, July, and August (MJJA)] in the Indian sub-continent, the equatorial Indian Ocean (EIO), and the SIO (regionsare marked in Fig. 4A) using the surface temperatures developed inMERRA-2. Figure 4B shows the time series of temperature averagedover these three regions during the study interval. Mann-Kendall trendanalysis was applied to examine the significance of the temperature
Fig. 1. Spatial features of wind resources. Spatial distribution of (A) 37-year mean CFs and (B) the CV (defined as the ratio of the SD to the means).
Fig. 2. Spatial features of declines in PE generation. The 37-year mean potentialfor electricity generation from the wind and declining rates inferred for western,northern, southern, eastern, and northeastern India (A) and a summary of results(B) for selected states with large wind power investments.
2 of 8
SC I ENCE ADVANCES | R E S EARCH ART I C L E
on May 29, 2020
http://advances.sciencemag.org/
Dow
nloaded from
trend with a P value of less than 0.05. There was no significant trendfor temperature over the Indian subcontinent (65°E to 85°E and 15°N to30°N), while temperature over the EIO (50°E to 110°E and−10°S to 10°N)and the SIO (50°E to 110°E and 20°S to 40°S) regions increased sig-nificantly (P < 0.01). Warming in the Indian Ocean implies that theland-sea thermal gradient was declining over the study period, servingto modulate the strength of the ISM. A recent study using a coupledmodel framework points out that warming over the equatorial oceaninhibits convection over the Indian subcontinent, suppressing rainfallover India and modulating the Hadley circulation (15).
Figure 5 (A and B) shows temperature and sea-level pressure (SLP)differences between the EIO and the Indian subcontinent (A) andbetween the SIO and the Indian subcontinent (B). As the tempera-ture contrast between the EIO and Indian subcontinent decreases (P <0.01), the SLP gradient declines significantly (P < 0.01). However,although similar trends are found for the temperature contrast andfor the SLP gradient between the SIO and the Indian subcontinent, theSLP gradient trend fails to pass the significance test (P = 0.46).
We developed a multivariable regression statistical model incor-poratingdPslp1 (SLPdifferences between theEIOand Indian subcontinent)
Gao et al., Sci. Adv. 2018;4 : eaat5256 5 December 2018
and dPslp2(SLP differences between the SIO and the Indian subconti-nent) and time t to represent potential wind electricity generation
PE ¼ a0 þ a1dPslp1 þ a2dPslp2 þ a3t
where a0, a1, a20, and a3 denote regression coefficients obtained throughoptimization. This statistical model was applied to the entire Indianregion for spring and summer when the ISM is prevalent. Figure 5Cshows the annual PE predicted for the spring and summer seasonson the basis of the multivariable statistical model with wind speedsderived fromMERRA-2. The statistical model accurately reproducesthe descending trends in spring and summer electricity generation, witha correlation coefficient as high as 0.84 (P < 0.01). This suggests thatthe gradient of pressure between sea and land during the monsoon sea-son can effectively determine the wind electricity generation potentialin spring and summer. Since the wind potential for India is dominatedby conditions in spring and summer (Fig. 3B), and the spring and sum-mer wind potential is highly correlated with annual wind potential (r =0.94, P < 0.01; Fig. 5D), the regression model based on the pressure
Fig. 3. Interannual and seasonal features of declines in PE generation. Time series for (A) the total PE generation over the 1980–2016 period and (B) the seasonalPE generation, including a linear fit.
Fig. 4. Decadal trend of temperature for specific regions. MERRA-2–derived spatial distributions of (A) SLP for MJJA averaged over the 1980–2016 period and (B) timeseries of temperature averaged over the Indian subcontinent, EIO, and SIO (regions marked with blue boxes on the left).
3 of 8
SC I ENCE ADVANCES | R E S EARCH ART I C L E
on May 29, 2020
http://advances.sciencemag.org/
Dow
nloaded from
gradient in themonsoon season (MJJA) displays considerable skill inreproducing and predicting long-term interannual trends for windpower potential in India.
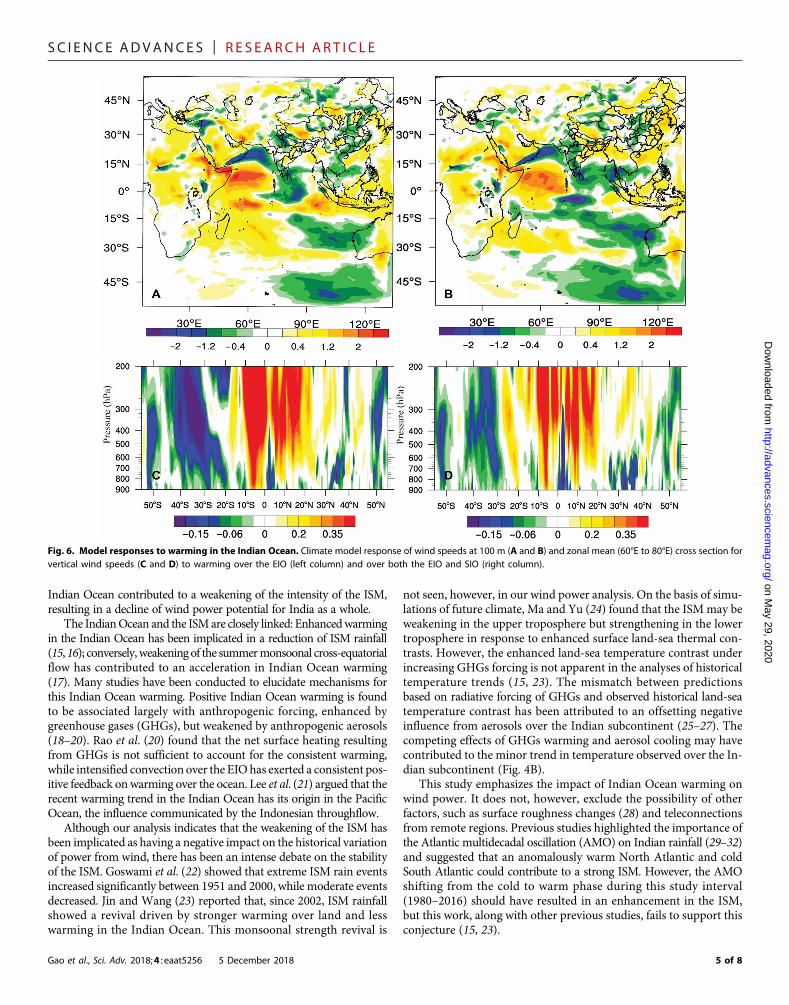
Numerical model response to warming in the Indian OceanTo examine the role of warming in the Indian Ocean on wind speedsat wind turbine hub height, we conducted numerical model sensitiv-ity experiments using theWeather Research and Forecasting (WRF)model. Figure 6 (A and B) shows the response of model wind speedsat 100 m to warming over the EIO regions (A) and to warming overboth the EIO and SIO regions (B).Warming over the EIO results in adecline in wind speed at 100 m over northern and southern India, butwith no apparent change in western India (Fig. 6A). As shown in Fig.2A, western India experienced a significant decrease in potential windpower. When warming over both the EIO and SIO regions is takeninto account, the reduction of wind speed at 100 m over India is fur-ther enhanced, particularly over western India. The response ofmodel wind speeds at 100 m to warming over both regions showsbetter spatial agreement with the trend of lower troposphere windspeeds in MERRA-2. Declines in wind speeds at 15°S inferred fromMERRA-2 (fig. S2) are consistent with the model responses towarming over both EIO and SIO regions but are not seen in the modelresponses to warming only over the EIO region (Fig. 6, A and B). Thisfurther confirms the conclusion that the interannual variability of windpower potential over India is affected jointly by warming over both theEIO and SIO regions.
Gao et al., Sci. Adv. 2018;4 : eaat5256 5 December 2018
Examination of changes in vertical wind velocity over the Indiansubcontinent and the IndianOcean region (50°E to 80°E) due towarmingin the Indian Ocean is shown in Fig. 6 (C and D). Significant warmingover the EIO is responsible for large-scale upward motion over thisregion, extending up to and spreading over the upper troposphere (Fig.6, C and D). This large-scale motion favors subsidence in the SouthernHemisphere (20°S to 40°S; Fig. 6C) but is compensated by warming overthe SIO, as indicated by the less intensified downward motion at 30°S(Fig. 6D). The warming over the EIO leads also to subsidence of air overthe Indian subcontinent (15°N to 30°N), inhibiting convection over landand, thus, reducing the intensity of the monsoonal circulation.
DISCUSSIONAnalysis of the spatial and long-term variability of wind power potentialin India using assimilated meteorology indicates that there wouldhave been a significant decline over the past 37 years, particularlyin the highly investedwestern Indian region (Rajasthan andMaharashtrastates). Nationwide planning for future wind power investments inIndia could be usefully informed by consideration of the historicalreconstruction.
The variation of wind power potential for India is attributed mainlyto changing properties of the ISM, modulated by trends in sea sur-face temperature (SST) in the IndianOcean. SST in the IndianOceanincreased significantly during the study period (1980–2016). Bothstatistical and numerical model analyses confirm that warming in the
Fig. 5. Temperature and SLP contracts between land and ocean. Temperature and SLP differences between the EIO and the subcontinent (A) and between the SIOand subcontinent (B), with results from the linear regression model (C) and the correlation between yearly PE and spring and summer PE (D).
4 of 8
SC I ENCE ADVANCES | R E S EARCH ART I C L E
on May 29, 2020
http://advances.sciencemag.org/
Dow
nloaded from
Indian Ocean contributed to a weakening of the intensity of the ISM,resulting in a decline of wind power potential for India as a whole.
The IndianOcean and the ISMare closely linked: Enhancedwarmingin the Indian Ocean has been implicated in a reduction of ISM rainfall(15, 16); conversely,weakening of the summermonsoonal cross-equatorialflow has contributed to an acceleration in Indian Ocean warming(17). Many studies have been conducted to elucidate mechanisms forthis Indian Ocean warming. Positive Indian Ocean warming is foundto be associated largely with anthropogenic forcing, enhanced bygreenhouse gases (GHGs), but weakened by anthropogenic aerosols(18–20). Rao et al. (20) found that the net surface heating resultingfrom GHGs is not sufficient to account for the consistent warming,while intensified convection over the EIO has exerted a consistent pos-itive feedback onwarming over the ocean. Lee et al. (21) argued that therecent warming trend in the Indian Ocean has its origin in the PacificOcean, the influence communicated by the Indonesian throughflow.
Although our analysis indicates that the weakening of the ISM hasbeen implicated as having a negative impact on the historical variationof power from wind, there has been an intense debate on the stabilityof the ISM. Goswami et al. (22) showed that extreme ISM rain eventsincreased significantly between 1951 and 2000, while moderate eventsdecreased. Jin and Wang (23) reported that, since 2002, ISM rainfallshowed a revival driven by stronger warming over land and lesswarming in the Indian Ocean. This monsoonal strength revival is
Gao et al., Sci. Adv. 2018;4 : eaat5256 5 December 2018
not seen, however, in our wind power analysis. On the basis of simu-lations of future climate, Ma and Yu (24) found that the ISMmay beweakening in the upper troposphere but strengthening in the lowertroposphere in response to enhanced surface land-sea thermal con-trasts. However, the enhanced land-sea temperature contrast underincreasing GHGs forcing is not apparent in the analyses of historicaltemperature trends (15, 23). The mismatch between predictionsbased on radiative forcing of GHGs and observed historical land-seatemperature contrast has been attributed to an offsetting negativeinfluence from aerosols over the Indian subcontinent (25–27). Thecompeting effects of GHGs warming and aerosol cooling may havecontributed to the minor trend in temperature observed over the In-dian subcontinent (Fig. 4B).
This study emphasizes the impact of Indian Ocean warming onwind power. It does not, however, exclude the possibility of otherfactors, such as surface roughness changes (28) and teleconnectionsfrom remote regions. Previous studies highlighted the importance ofthe Atlantic multidecadal oscillation (AMO) on Indian rainfall (29–32)and suggested that an anomalously warm North Atlantic and coldSouth Atlantic could contribute to a strong ISM. However, the AMOshifting from the cold to warm phase during this study interval(1980–2016) should have resulted in an enhancement in the ISM,but this work, along with other previous studies, fails to support thisconjecture (15, 23).
Fig. 6. Model responses to warming in the Indian Ocean. Climate model response of wind speeds at 100 m (A and B) and zonal mean (60°E to 80°E) cross section forvertical wind speeds (C and D) to warming over the EIO (left column) and over both the EIO and SIO (right column).
5 of 8

SC I ENCE ADVANCES | R E S EARCH ART I C L E
on May 29, 2020
http://advances.sciencemag.org/
Dow
nloaded from
The variable wind power will affect decisions made at all timescalesand across multiple geographic scales associated with the planning andoperation of power systems (33). Different time frames need to be ad-dressed when examining the impacts of integrating intermittent windpower.On the time frame of seconds tominutes, the systemoperation iscontrolled mainly by automatic equipment and control systems (34).From a time frame ofminutes to 1 week, system operators need to com-mit and dispatch generators tomaintain power balance through normalconditions and to deal with contingencies (34, 35). On annual-to-multiyear time frames, system planners must ensure that transmissionand generation facilities can provide reliable power at low costs underemission constraints (34). In addition, several important environmentaland climate policies, such as carbon reduction targets, renewable portfoliostandards, and carbon cap-and-trade initiatives, are mainly designed andevaluated on a yearly timescale.
The impacts of short-term variability of wind power on systemoperations, including unit commitment, economic dispatch, andoperational reserves, are consequential but relatively well understood.We note that the interannual variability discussed in this paper is notdirectly linked to the short-term power system operation. However, theimpacts of interannual variability of wind power on a longer time framehave been underappreciated (36) until recently. A recent study (36)combined power system long-term planning with 10 years of inter-annual variation of renewables for the first time. It pointed out that theinterannual variability of climate conditions significantly affects theplanning andoperationof power systemswith respect to the levelized costof electricity and CO2 emission intensities in the United Kingdom undermedium and high penetration of renewables. Another recent study (37)pointed out further that the volatility of annual total generation cost andemission intensity for Europeanpower systems (due to interannual climatevariations) will increase by a factor of 5 when the renewable penetra-tion increases to 35% as compared to the condition that applied in2015. The design of carbon policies, for instance, should allow for thebanking of renewable credits/carbon allowances over more than ayear to hedge against this interannual variability.
The relationship between warming of the Indian Ocean and windpower in India could help improve the understanding of interannualvariations. Predictions of the power available fromwind over the comingyear canbe improvedon the basis of the forecasts of the SSTanomaly. Forexample, the current National Oceanic andAtmospheric Administrationforecast for SST anomalies projects that significant changes in SST in theIndian Ocean are not expected to develop in 2018 (38), suggestinglittle change in expected wind power generation for India this year.Karnauskas et al. (9) concluded that the wind energy resource willincrease in India over the next century based on CMIP5 (CoupledModel Intercomparison Project Phase 5) models. Given the fact thatmost of these models failed to simulate the spatial distribution of aero-sols over India (27), nor did they capture land-sea temperature contrasts,it is clear that these projections should be interpreted with caution. Thepresent study provides insights on how warming in the Indian Oceanhistorically affected wind power in India. Focused studies of factorsinfluencing thermal conditions in the Indian Ocean could play an im-portant role in projections for the future potential of wind power.
MATERIALS AND METHODSCF and PE generation analysisThe power curve for the GE 2.5 MW wind turbine was applied in thisstudy to calculate hourly wind power outputs. The hub height of the GE
Gao et al., Sci. Adv. 2018;4 : eaat5256 5 December 2018
2.5 MWwind turbine is 100m. Previous studies estimated wind speedsat hub height through interpolation using the oversimplified 1/7coefficient that ignores the variation due to changes in surfaceroughness or atmospheric stability (39). We obtained wind speedsat 10 and 50 m from the NASA MERRA-2 dataset, a replacementfor the MERRA dataset with more observational constraints (40).MERRA-2 provides hourly wind speeds at 10 and 50 m on a grid of0.5° latitude by 0.625° longitude. Wind speeds fromMERRA-2 werevalidated using four reanalysis datasets [National Centers forEnvironmental Prediction (NCEP)/National Center for AtmosphericResearch Reanalysis-1, NCEP/Department of Energy Reanalysis-2,ERA-Interim reanalysis, and MERRA reanalysis] and measurementsofwind speeds at 10 and 100m in India (section S1). Validations at bothnear-surface levels and 100mdisplayed consistent declining trends.Weused Eqs. 1 and 2 (10, 39, 41) to estimate the friction coefficient (a) andwind speeds at 100 m (v100)
a ¼ ln V50V10
ln 5010
ð1Þ
v100 ¼ V1010010
� �a
ð2Þ
Estimated hourly wind speeds at 100 m were substituted into thepower curve for the GE 2.5 MWwind turbine to calculate hourly windpower outputs and hourly CFs. CF values are defined by
CF ¼ Preal
Pratedð3Þ
where Preal denotes the real hourly wind power output and Prated refersto the rated power of the turbine. To eliminate areas judged unsuitablefor deployment ofwind power systems, such as regions that are forested,urban, or covered with water or ice, we used land cover informationobtained from the NASAMODIS (Moderate Resolution Imaging Spec-troradiometer) satellite MCD12C1 dataset (42). The SRTM 90m digitalelevation database version 4.1 (43) was used to calculate terrain eleva-tion and slopes for each grid. Grids characterized by slopes ofmore than20% or by heights of more than 3000mwere excluded as inappropriatefor deployment of wind power systems. We assumed that the turbinesshould be separated by approximately 9 by 9 rotor diameters (0.58 km2)to minimize turbine-turbine interference (44). The area for each windreanalysis grid was divided by 0.58 km2 to calculate the number ofturbines in each grid. Grids with CFs less than 0.15 were considereduneconomical and were excluded accordingly. PE generation fromwind in India was calculated using
A ¼ ∑j¼ng
j¼1 ∑i¼nh
i¼1 Prated � CF� Aj
0:58ð4Þ
where ng denotes the number of grids in India judged as feasible fordeployment of wind power systems, nh represents number of oper-ational hours for each year, and Aj refers to the area for each grid (insquare kilometers).
We note that the wind power potential derived here is based on afixed separation distance for wind turbines, whereas actual wind turbine
6 of 8
SC I ENCE ADVANCES | R E S EARCH ART I C L E
http://advances.sciencemD
ownloaded from
siting for specific wind farms would be optimized on the basis of themicrolevel information on geographical topography and would yielda relatively higher source of electricity from the wind. Hence, we wouldargue that our results for the total wind power potential for India arerelatively conservative. The interannual variation of available windpower, however, should be similar once the specific locations of thewind turbines are fixed. The main conclusions drawn here associatedwith the interannual variation and the long-term declining trend arenot significantly influenced by this simplification.
Coupled numerical model experimentsTo explore the physical mechanism responsible for declining windspeeds in India, we conducted a number of simulations using theWRF model version 3.8.1. The WRF model was developed by theNational Centre for Atmospheric Research and has been shown tobe capable of simulating monsoon circulation and other weatherphenomena. Themodel domainwas configured usingMercator projec-tions extending from~22°E to ~137°E (160 grid points) in the east-westdirection and from 50°S to 50°N (160 grids) in the north-south direction,with a horizontal resolution of 81 km (fig. S4). According to the surfacetemperature trend in MERRA-2, SST increased by about 0.7° and 1.3°,respectively, in regions 1 (the EIO) and 2 (the SIO) over the study in-terval explored here. To examine the impacts of strong warming onwind potential in India in these two regions, we carried out threeexperiments: (i) a control simulation (WRFctl) with normal settingscovering MJJA for 2001; (ii) SST increased by 0.7° over the EIO(WRFw1); and (iii) SST increased by 0.7° and 1.3°over the EIO andSIO (WRFw1w2), respectively. The differences between WRFw1 andWRFctl are interpreted as representing the response of the model towarming over the EIO, and the differences between WRFw1w2 andWRFctl are taken as indications of the response of the model towarming over both regions.
on May 29, 2020
ag.org/
SUPPLEMENTARY MATERIALSSupplementary material for this article is available at http://advances.sciencemag.org/cgi/content/full/4/12/eaat5256/DC1Section S1. Datasets used to validate the trends in wind speeds derived from MERRA-2Fig. S1. Zonal mean vertical pressure velocity during summer averaged over the 1980–2016period inferred from MERRA-2.Fig. S2. Long-term trend of wind speeds at 850 hPa (in m/s per year) inferred from MERRA-2over the 1980–2016 interval.Fig. S3. Trends of wind speeds in India inferred from multiple datasets.Fig. S4. WRF modeling domain.REFERENCES AND NOTES1. International Energy Agency Statistics; www.iea.org/countries/non-membercountries/india/.2. International Energy Agency, India Energy Outlook: World Energy Outlook Special Report
(International Energy Agency, 2015); www.iea.org/publications/freepublications/publication/IndiaEnergyOutlook_WEO2015.pdf.
3. Global Wind Energy Council, Indian Wind Energy: A Brief Outlook (Global Wind EnergyCouncil, 2016); www.gwec.net/wp-content/uploads/vip/GWEC_IWEO_2016_LR.pdf.
4. India Wind Turbine Manufacturers Association: Cumulative Wind Power Installation up toMarch 2017 (MW); www.indianwindpower.com/news_views.php#tab1.
5. Government of India Ministry of New and Renewable Energy; https://mnre.gov.in/renewable-energy-regulatory-framework.
6. X. Lu, M. B. McElroy, J. Kiviluoma, Global potential for wind-generated electricity. Proc.Natl. Acad. Sci. U.S.A. 106, 10933–10938 (2009).
7. S. C. Pryor, R. J. Barthelmie, Climate change impacts on wind energy: A review. Renew.Sustain. Energy Rev. 14, 430–437 (2010).
8. R. Schaeffer, A. S. Szklo, A. F. P. de Lucena, B. S. M. C. Borba, L. P. P. Nogueira, F. P. Fleming,A. Troccoli, M. Harrison, M. S. Boulahya, Energy sector vulnerability to climate change: Areview. Energy 38, 1–12 (2012).
Gao et al., Sci. Adv. 2018;4 : eaat5256 5 December 2018
9. K. B. Karnauskas, J. K. Lundquist, L. Zhang, Southward shift of the global wind energyresource under high carbon dioxide emissions. Nat. Geosci. 11, 38–43 (2018).
10. P. Sherman, X. Chen, M. B. McElroy, Wind-generated electricity in China: Decreasingpotential, inter-annual variability and association with changing climate. Sci. Rep. 7,16294 (2017).
11. G. He, A.-P. Avrin, J. H. Nelson, J. Johnston, A. Mileva, J. Tian, D. M. Kammen,SWITCH-China: A systems approach to decarbonizing China’s power system. Environ. Sci.Technol. 50, 5467–5473 (2016).
12. C. Moné, M. Hand, M. Bolinger, J. Rand, D. Heimiller, J. Ho, “2015 Cost of Wind EnergyReview” (Technical Report NREL/TP-6A20-66861, National Renewable Energy Laboratory,2017).
13. S. Gadgil, The Indian monsoon and its variability. Annu. Rev. Earth Planet. Sci. 31, 429–467(2003).
14. T. T. Fujita, K. Watanabe, T. Izawa, Formation and structure of equatorial anticyclonescaused by large-scale cross-equatorial flows determined by ATS-I photographs. J. Appl.Meteorol. 8, 649–667 (1969).
15. M. K. Roxy, K. Ritika, P. Terray, R. Murtugudde, K. Ashok, B. N. Goswami, Drying of Indiansubcontinent by rapid Indian ocean warming and a weakening land-sea thermalgradient. Nat. Commun. 6, 7423 (2015).
16. M. Roxy, Y. Tanimoto, B. Preethi, P. Terray, R. Krishnan, Intraseasonal SST-precipitationrelationship and its spatial variability over the tropical summer monsoon region.Clim. Dyn. 41, 45–61 (2013).
17. P. Swapna, R. Krishnan, J. M. Wallace, Indian Ocean and monsoon coupled interactions ina warming environment. Clim. Dyn. 42, 2439–2454 (2014).
18. L. Dong, T. Zhou, The Indian Ocean sea surface temperature warming simulated byCMIP5 models during the twentieth century: Competing forcing roles of GHGs andanthropogenic aerosols. J. Climate 27, 3348–3362 (2014).
19. L. Dong, T. Zhou, B. Wu, Indian Ocean warming during 1958–2004 simulated by a climatesystem model and its mechanism. Clim. Dyn. 42, 203–217 (2014).
20. S. A. Rao, A. R. Dhakate, S. K. Saha, S. Mahapatra, H. S. Chaudhari, S. Pokhrel,S. K. Sahu, Why is Indian Ocean warming consistently? Clim. Change 110, 709–719(2012).
21. S.-K. Lee, W. Park, M. O. Baringer, A. L. Gordon, B. Huber, Y. Liu, Pacific origin of theabrupt increase in Indian Ocean heat content during the warming hiatus. Nat. Geosci. 8,445–449 (2015).
22. B. N. Goswami, V. Venugopal, D. Sengupta, M. S. Madhusoodanan, P. K. Xavier, Increasingtrend of extreme rain events over India in a warming environment. Science 314,1442–1445 (2006).
23. Q. Jin, C. Wang, A revival of Indian summer monsoon rainfall since 2002. Nat. Clim. Chang.7, 587–594 (2017).
24. J. Ma, J.-Y. Yu, Paradox in South Asian summer monsoon circulation change: Lowertropospheric strengthening and upper tropospheric weakening. Geophys. Res. Lett. 41,2934–2940 (2014).
25. M. A. Bollasina, Y. Ming, V. Ramaswamy, Anthropogenic aerosols and the weakening ofthe South Asian summer monsoon. Science 334, 502–505 (2011).
26. G. A. Meehl, J. M. Arblaster, W. D. Collins, Effects of black carbon aerosols on the Indianmonsoon. J. Climate 21, 2869–2882 (2008).
27. S. D. Sanap, G. Pandithurai, M. G. Manoj, On the response of Indian summer monsoon toaerosol forcing in CMIP5 model simulations. Clim. Dyn. 45, 2949–2961 (2015).
28. R. Vautard, J. Cattiaux, P. Yiou, J.-N. Thépaut, P. Ciais, Northern Hemisphere atmosphericstilling partly attributed to an increase in surface roughness. Nat. Geosci. 3, 756–761(2010).
29. B. N. Goswami, M. S. Madhusoodanan, C. P. Neema, D. Sengupta, A physical mechanismfor North Atlantic SST influence on the Indian summer monsoon. Geophys. Res. Lett.33, L02706 (2006).
30. S. Li, J. Perlwitz, X. Quan, M. P. Hoerling, Modelling the influence of North Atlanticmultidecadal warmth on the Indian summer rainfall. Geophys. Res. Lett. 35,L05804 (2008).
31. R. Lu, B. Dong, H. Ding, Impact of the Atlantic Multidecadal Oscillation on the Asiansummer monsoon. Geophys. Res. Lett. 33, L24701 (2006).
32. R. Zhang, T. L. Delworth, Impact of Atlantic multidecadal oscillations on India/Sahelrainfall and Atlantic hurricanes. Geophys. Res. Lett. 33, L17712 (2006).
33. H. Holttinen, J. Kiviluoma, A. Forcione, M. Milligan, C. J. Smith, J. Dillon, J. Dobschinski,J. S. van Roon, N. Cutululis, A. Orths, P. B. Eriksen, “Design and operation of powersystems with large amounts of wind power. Final summary report, IEA WIND Task 25,Phaser three 2012–2014” (VTT Technology, 2016).
34. MIT Energy Initiative, Managing Large-Scale Penetration of Intermittent Renewables(MIT Energy Initiative, 2011); https://energy.mit.edu/wp-content/uploads/2012/03/MITEI-RP-2011-001.pdf.
35. X. Chen, H. Zhang, Z. Xu, C. P. Nielsen, M. B. McElroy, J. Lv, Impacts of fleet types andcharging modes for electric vehicles on emissions under different penetrations of windpower. Nat. Energy 3, 413–421 (2018).
7 of 8

SC I ENCE ADVANCES | R E S EARCH ART I C L E
Dow
nloa
36. M. Zeyringer, J. Price, B. Fais, P.-H. Li, E. Sharp, Designing low-carbon power systems forGreat Britain in 2050 that are robust to the spatiotemporal and inter-annual variability ofweather. Nat. Energy 3, 395–403 (2018).
37. S. Collins, P. Deane, B. Ó. Gallachóir, S. Pfenninger, I. Staffell, Impacts ofinter-annual wind and solar variations on the European power system. Joule 2,2076–2090 (2018).
38. Experimental NOAA/ESRL PSD and CU CIRES Forecast in Global Tropics Domain; www.esrl.noaa.gov/psd/forecasts/sstlim/for4gl.html
39. E. Holt, J. Wang, Trends in wind speed at wind turbine height of 80 m over thecontiguous United States using the North American Regional Reanalysis (NARR). J. Appl.Meteorol. Climatol. 51, 2188–2202 (2012).
40. R. Gelaro, W. McCarty, M. J. Suárez, R. Todling, A. Molod, L. Takacs, C. A. Randles,A. Darmenov, M. G. Bosilovich, R. Reichle, K. Wargan, L. Coy, R. Cullather, C. Draper,S. Akella, V. Buchard, A. Conaty, A. M. da Silva, W. Gu, G.-K. Kim, R. Koster, R. Lucchesi,D. Merkova, J. E. Nielsen, G. Partyka, S. Pawson, W. Putman, M. Rienecker, S. D. Schubert,M. Sienkiewicz, B. Zhao, The Modern-Era Retrospective Analysis for Research andApplications, version 2 (MERRA-2). J. Climate 30, 5419–5454 (2017).
41. X. Lu, M. B. McElroy, C. P. Nielsen, X. Chen, J. Huang, Optimal integration of offshore windpower for a steadier, environmentally friendlier, supply of electricity in China. EnergyPolicy 62, 131–138 (2013).
42. NASA Land Processes Distributed Active Archive Center (LP DAAC), MCD12C1: Land CoverType Yearly L3 Global 500 m SIN Grid (LP DAAC, 2012); https://lpdaac.usgs.gov/dataset_discovery/modis/modis_products_table/mcd12c1.
43. A. Jarvis, H. I. Reuter, A. Nelson, E. Guevara, “Hole-filled seamless SRTM dataV4”(International Centre for Tropical Agriculture, 2008); http://srtm.csi.cgiar.org.
Gao et al., Sci. Adv. 2018;4 : eaat5256 5 December 2018
44. M. R. Davidson, D. Zhang, W. Xiong, X. Zhang, V. J. Karplus, Modelling the potential forwind energy integration on China’s coal-heavy electricity grid. Nat. Energy 1, 16086(2016).
Acknowledgments: We acknowledge the NASA Global Modeling and Assimilation Office forproviding the MERRA-2 reanalysis dataset. Funding: This study was supported by the HarvardGlobal Institute. This research was supported also by State Key Laboratory on Smart GridProtection and Operation Control of NARI Group, through the open topic project (20171613).Author contributions: M.G., X.C., and M.B.M. conceived the research; M.G. and X.C. calculatedthe wind energy potential; Y.D., S.S., and X.L. assisted with the discussion; and all authorscontributed to the final interpretation and writing of the manuscript, with major contributionsfrom M.G., X.C., and M.B.M. Competing interests: The authors declare that they have nocompeting interests. Data and materials availability: All data needed to evaluate the conclusionsin the paper are present in the paper and/or the Supplementary Materials. Additional data relatedto this paper may be requested from the authors.
Submitted 7 March 2018Accepted 31 October 2018Published 5 December 201810.1126/sciadv.aat5256
Citation: M. Gao, Y. Ding, S. Song, X. Lu, X. Chen, M. B. McElroy, Secular decrease of windpower potential in India associated with warming in the Indian Ocean. Sci. Adv. 4, eaat5256(2018).
de
8 of 8
on May 29, 2020
http://advances.sciencemag.org/
d from

OceanSecular decrease of wind power potential in India associated with warming in the Indian
Meng Gao, Yihui Ding, Shaojie Song, Xiao Lu, Xinyu Chen and Michael B. McElroy
DOI: 10.1126/sciadv.aat5256 (12), eaat5256.4Sci Adv
ARTICLE TOOLS http://advances.sciencemag.org/content/4/12/eaat5256
MATERIALSSUPPLEMENTARY http://advances.sciencemag.org/content/suppl/2018/12/03/4.12.eaat5256.DC1
REFERENCES
http://advances.sciencemag.org/content/4/12/eaat5256#BIBLThis article cites 33 articles, 3 of which you can access for free
PERMISSIONS http://www.sciencemag.org/help/reprints-and-permissions
Terms of ServiceUse of this article is subject to the
is a registered trademark of AAAS.Science AdvancesYork Avenue NW, Washington, DC 20005. The title (ISSN 2375-2548) is published by the American Association for the Advancement of Science, 1200 NewScience Advances
License 4.0 (CC BY-NC).Science. No claim to original U.S. Government Works. Distributed under a Creative Commons Attribution NonCommercial Copyright © 2018 The Authors, some rights reserved; exclusive licensee American Association for the Advancement of
on May 29, 2020
http://advances.sciencemag.org/
Dow
nloaded from