SectorUpdate-07 June 2017 CIPTADANASEKURITAS ASIA...
12
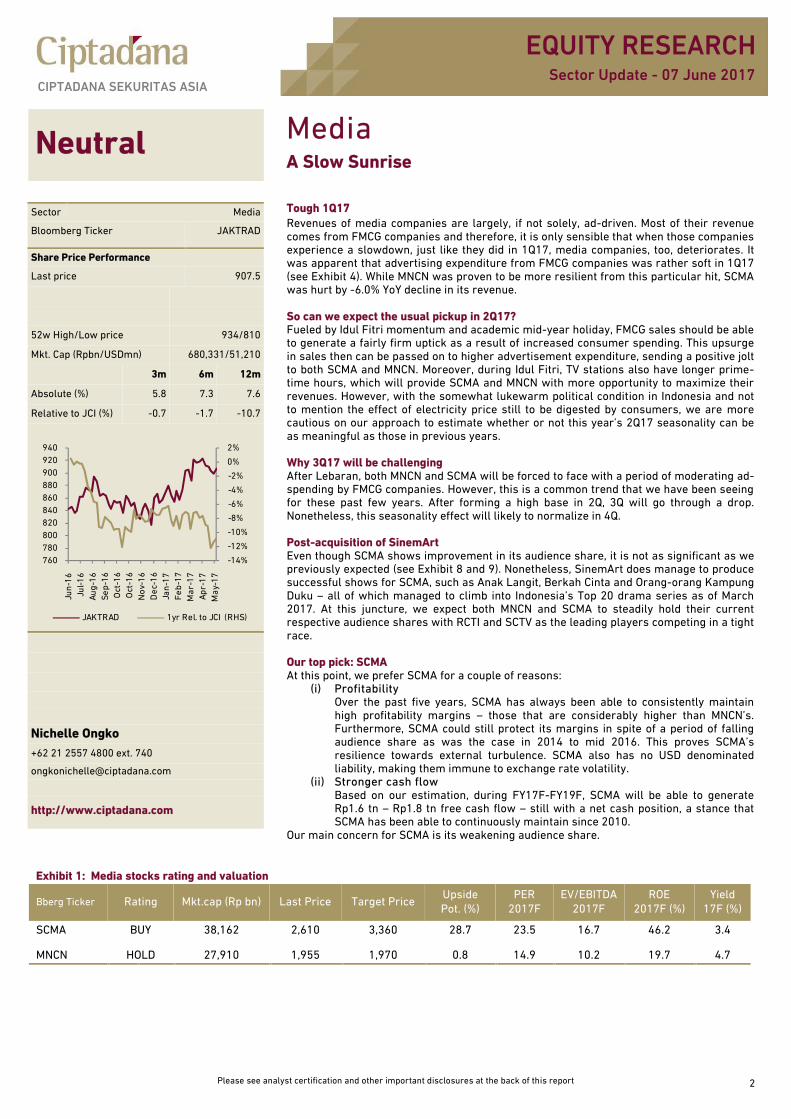
EQUITY RESEARCH CIPTADANA SEKURITAS ASIA Please see analyst certification and other important disclosures at the back of this report 2 Sector Update - 07 June 2017 Neutral Media A Slow Sunrise Tough 1Q17 Revenues of media companies are largely, if not solely, ad-driven. Most of their revenue comes from FMCG companies and therefore, it is only sensible that when those companies experience a slowdown, just like they did in 1Q17, media companies, too, deteriorates. It was apparent that advertising expenditure from FMCG companies was rather soft in 1Q17 (see Exhibit 4). While MNCN was proven to be more resilient from this particular hit, SCMA was hurt by -6.0% YoY decline in its revenue. So can we expect the usual pickup in 2Q17? Fueled by Idul Fitri momentum and academic mid-year holiday, FMCG sales should be able to generate a fairly firm uptick as a result of increased consumer spending. This upsurge in sales then can be passed on to higher advertisement expenditure, sending a positive jolt to both SCMA and MNCN. Moreover, during Idul Fitri, TV stations also have longer prime- time hours, which will provide SCMA and MNCN with more opportunity to maximize their revenues. However, with the somewhat lukewarm political condition in Indonesia and not to mention the effect of electricity price still to be digested by consumers, we are more cautious on our approach to estimate whether or not this year’s 2Q17 seasonality can be as meaningful as those in previous years. Why 3Q17 will be challenging After Lebaran, both MNCN and SCMA will be forced to face with a period of moderating ad- spending by FMCG companies. However, this is a common trend that we have been seeing for these past few years. After forming a high base in 2Q, 3Q will go through a drop. Nonetheless, this seasonality effect will likely to normalize in 4Q. Post-acquisition of SinemArt Even though SCMA shows improvement in its audience share, it is not as significant as we previously expected (see Exhibit 8 and 9). Nonetheless, SinemArt does manage to produce successful shows for SCMA, such as Anak Langit, Berkah Cinta and Orang-orang Kampung Duku – all of which managed to climb into Indonesia’s Top 20 drama series as of March 2017. At this juncture, we expect both MNCN and SCMA to steadily hold their current respective audience shares with RCTI and SCTV as the leading players competing in a tight race. Our top pick: SCMA At this point, we prefer SCMA for a couple of reasons: (i) Profitability Over the past five years, SCMA has always been able to consistently maintain high profitability margins – those that are considerably higher than MNCN’s. Furthermore, SCMA could still protect its margins in spite of a period of falling audience share as was the case in 2014 to mid 2016. This proves SCMA’s resilience towards external turbulence. SCMA also has no USD denominated liability, making them immune to exchange rate volatility. (ii) Stronger cash flow Based on our estimation, during FY17F-FY19F, SCMA will be able to generate Rp1.6 tn – Rp1.8 tn free cash flow – still with a net cash position, a stance that SCMA has been able to continuously maintain since 2010. Our main concern for SCMA is its weakening audience share. Sector Media Bloomberg Ticker JAKTRAD Share Price Performance Last price 907.5 52w High/Low price 934/810 Mkt. Cap (Rpbn/USDmn) 680,331/51,210 3m 6m 12m Absolute (%) 5.8 7.3 7.6 Relative to JCI (%) -0.7 -1.7 -10.7 Nichelle Ongko +62 21 2557 4800 ext. 740 [email protected] http://www.ciptadana.com -14% -12% -10% -8% -6% -4% -2% 0% 2% 760 780 800 820 840 860 880 900 920 940 Jun-16 Jul-16 Aug-16 Sep-16 Oct-16 Oct-16 Nov-16 Dec-16 Jan-17 Feb-17 Mar-17 Apr-17 May-17 JAKTRAD 1yr Rel. to JCI (RHS) Exhibit 1: Media stocks rating and valuation Bberg Ticker Rating Mkt.cap (Rp bn) Last Price Target Price Upside Pot. (%) PER 2017F EV/EBITDA 2017F ROE 2017F (%) Yield 17F (%) SCMA BUY 38,162 2,610 3,360 28.7 23.5 16.7 46.2 3.4 MNCN HOLD 27,910 1,955 1,970 0.8 14.9 10.2 19.7 4.7
Transcript of SectorUpdate-07 June 2017 CIPTADANASEKURITAS ASIA...
EQUITY RESEARCHCIPTADANA SEKURITAS ASIA
Please see analyst certification and other important disclosures at the back of this report 2
Sector Update - 07 June 2017
Neutral MediaA Slow Sunrise
Tough 1Q17Revenues of media companies are largely, if not solely, ad-driven. Most of their revenuecomes from FMCG companies and therefore, it is only sensible that when those companiesexperience a slowdown, just like they did in 1Q17, media companies, too, deteriorates. Itwas apparent that advertising expenditure from FMCG companies was rather soft in 1Q17(see Exhibit 4). While MNCN was proven to be more resilient from this particular hit, SCMAwas hurt by -6.0% YoY decline in its revenue.
So can we expect the usual pickup in 2Q17?Fueled by Idul Fitri momentum and academic mid-year holiday, FMCG sales should be ableto generate a fairly firm uptick as a result of increased consumer spending. This upsurgein sales then can be passed on to higher advertisement expenditure, sending a positive joltto both SCMA and MNCN. Moreover, during Idul Fitri, TV stations also have longer prime-time hours, which will provide SCMA and MNCN with more opportunity to maximize theirrevenues. However, with the somewhat lukewarm political condition in Indonesia and notto mention the effect of electricity price still to be digested by consumers, we are morecautious on our approach to estimate whether or not this year’s 2Q17 seasonality can beas meaningful as those in previous years.
Why 3Q17 will be challengingAfter Lebaran, both MNCN and SCMA will be forced to face with a period of moderating ad-spending by FMCG companies. However, this is a common trend that we have been seeingfor these past few years. After forming a high base in 2Q, 3Q will go through a drop.Nonetheless, this seasonality effect will likely to normalize in 4Q.
Post-acquisition of SinemArtEven though SCMA shows improvement in its audience share, it is not as significant as wepreviously expected (see Exhibit 8 and 9). Nonetheless, SinemArt does manage to producesuccessful shows for SCMA, such as Anak Langit, Berkah Cinta and Orang-orang KampungDuku – all of which managed to climb into Indonesia’s Top 20 drama series as of March2017. At this juncture, we expect both MNCN and SCMA to steadily hold their currentrespective audience shares with RCTI and SCTV as the leading players competing in a tightrace.
Our top pick: SCMAAt this point, we prefer SCMA for a couple of reasons:
(i) ProfitabilityOver the past five years, SCMA has always been able to consistently maintainhigh profitability margins – those that are considerably higher than MNCN’s.Furthermore, SCMA could still protect its margins in spite of a period of fallingaudience share as was the case in 2014 to mid 2016. This proves SCMA’sresilience towards external turbulence. SCMA also has no USD denominatedliability, making them immune to exchange rate volatility.
(ii) Stronger cash flowBased on our estimation, during FY17F-FY19F, SCMA will be able to generateRp1.6 tn – Rp1.8 tn free cash flow – still with a net cash position, a stance thatSCMA has been able to continuously maintain since 2010.
Our main concern for SCMA is its weakening audience share.
Sector Media
Bloomberg Ticker JAKTRAD
Share Price Performance
Last price 907.5
52w High/Low price 934/810
Mkt. Cap (Rpbn/USDmn) 680,331/51,210
3m 6m 12m
Absolute (%) 5.8 7.3 7.6
Relative to JCI (%) -0.7 -1.7 -10.7
Nichelle Ongko+62 21 2557 4800 ext. 740
http://www.ciptadana.com
-14%
-12%
-10%
-8%
-6%
-4%
-2%
0%
2%
760780800820840860880900920940
Jun-
16Ju
l-16
Aug-
16Se
p-16
Oct
-16
Oct
-16
Nov
-16
Dec
-16
Jan-
17Fe
b-17
Mar
-17
Apr-
17M
ay-1
7
JAKTRAD 1yr Rel. to JCI (RHS)
Exhibit 1: Media stocks rating and valuation
Bberg Ticker Rating Mkt.cap (Rp bn) Last Price Target PriceUpsidePot. (%)
PER2017F
EV/EBITDA2017F
ROE2017F (%)
Yield17F (%)
SCMA BUY 38,162 2,610 3,360 28.7 23.5 16.7 46.2 3.4
MNCN HOLD 27,910 1,955 1,970 0.8 14.9 10.2 19.7 4.7
EQUITY RESEARCHCIPTADANA SEKURITAS ASIA
Please see analyst certification and other important disclosures at the back of this report 3
Sector Update - 07 June 2017
21%
8%7%
14%
9%
0%
5%
10%
15%
20%
25%
0
20
40
60
80
100
120
140
160
180
2013 2014 2015 2016 2017F
Grow
th (%
)
Val
ue (
Rp
tn)
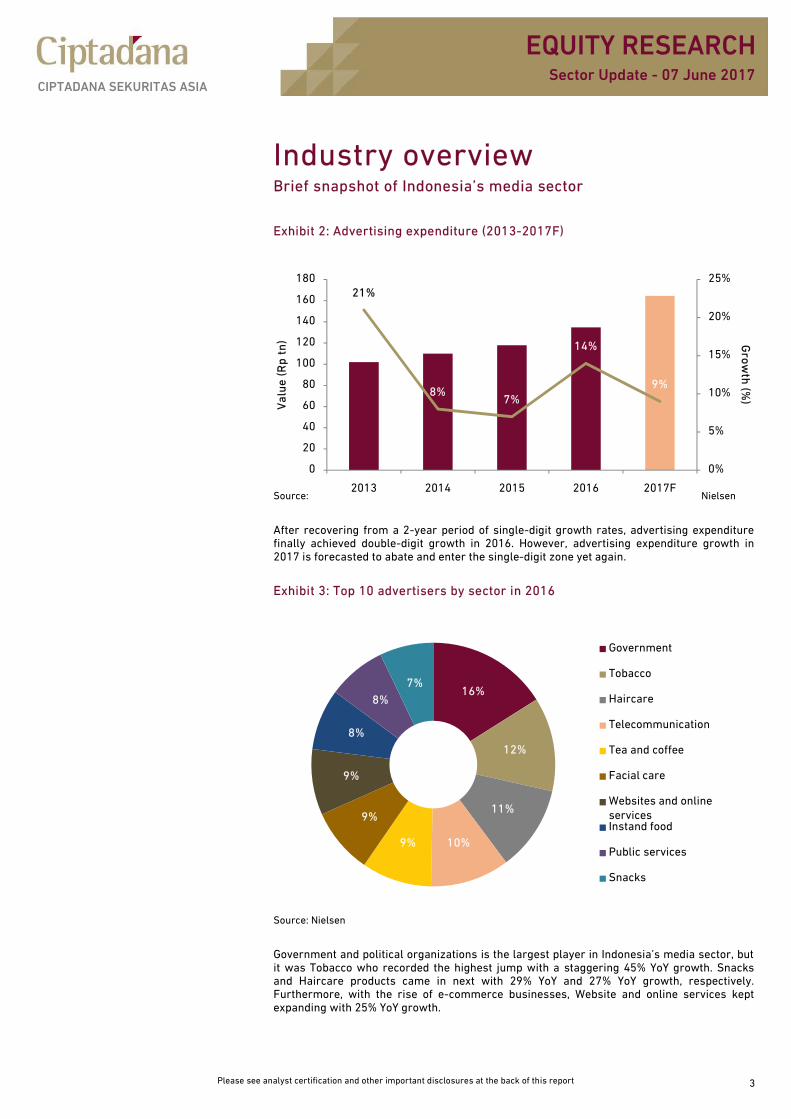
Industry overviewBrief snapshot of Indonesia’s media sector
Exhibit 2: Advertising expenditure (2013-2017F)
Source: Nielsen
After recovering from a 2-year period of single-digit growth rates, advertising expenditurefinally achieved double-digit growth in 2016. However, advertising expenditure growth in2017 is forecasted to abate and enter the single-digit zone yet again.
Exhibit 3: Top 10 advertisers by sector in 2016
Source: Nielsen
Government and political organizations is the largest player in Indonesia’s media sector, butit was Tobacco who recorded the highest jump with a staggering 45% YoY growth. Snacksand Haircare products came in next with 29% YoY and 27% YoY growth, respectively.Furthermore, with the rise of e-commerce businesses, Website and online services keptexpanding with 25% YoY growth.
16%
12%
11%
10%9%
9%
9%
8%
8%
7%
Government
Tobacco
Haircare
Telecommunication
Tea and coffee
Facial care
Websites and onlineservicesInstand food
Public services
Snacks

EQUITY RESEARCHCIPTADANA SEKURITAS ASIA
Please see analyst certification and other important disclosures at the back of this report 4
Sector Update - 07 June 2017
Tough 1Q17To estimate ad-spending growth, we examined a basket of FMCG companies, namely, UNVR,GGRM, HMSP, ICBP, MYOR and KLBF and put together their advertising expenses over thepast few years. It was rather apparent that advertising spending from these companies wasexceptionally soft in 1Q17 (see Exhibit 4). In fact, on a yearly basis, 1Q17 ad-spend declinedby -0.1% YoY. While MNCN was proven to be more resilient from this particular hit, SCMAwas hurt by -6.0% YoY decline in its revenue.
Exhibit 4: 1Q14 – 1Q17 adex by FMCG companies*
Source: as per stated under Selling expenses*UNVR, GGRM, HMSP, ICBP, MYOR and KLBF
Behind the sluggish ad-spend figuresCreeping under the disappointing 1Q17 was an overall stagnation sweeping the consumersector. As a matter of fact, retail sales in 1Q17 sank further below what seems to be analready weak 1Q16’s performance compares to 1Q15’s (see Exhibit 5).
Exhibit 5: 1Q15 – 1Q17 retail sales
Source: BI survey publications
-
500
1,000
1,500
2,000
2,500
3,000
3,500
1Q14 1Q15 1Q16
Adex
EQUITY RESEARCHCIPTADANA SEKURITAS ASIA
Please see analyst certification and other important disclosures at the back of this report 4
Sector Update - 07 June 2017
Tough 1Q17To estimate ad-spending growth, we examined a basket of FMCG companies, namely, UNVR,GGRM, HMSP, ICBP, MYOR and KLBF and put together their advertising expenses over thepast few years. It was rather apparent that advertising spending from these companies wasexceptionally soft in 1Q17 (see Exhibit 4). In fact, on a yearly basis, 1Q17 ad-spend declinedby -0.1% YoY. While MNCN was proven to be more resilient from this particular hit, SCMAwas hurt by -6.0% YoY decline in its revenue.
Exhibit 4: 1Q14 – 1Q17 adex by FMCG companies*
Source: as per stated under Selling expenses*UNVR, GGRM, HMSP, ICBP, MYOR and KLBF
Behind the sluggish ad-spend figuresCreeping under the disappointing 1Q17 was an overall stagnation sweeping the consumersector. As a matter of fact, retail sales in 1Q17 sank further below what seems to be analready weak 1Q16’s performance compares to 1Q15’s (see Exhibit 5).
Exhibit 5: 1Q15 – 1Q17 retail sales
Source: BI survey publications
-5.0%
0.0%
5.0%
10.0%
15.0%
20.0%
25.0%
1Q16 1Q17
Growth
EQUITY RESEARCHCIPTADANA SEKURITAS ASIA
Please see analyst certification and other important disclosures at the back of this report 5
Sector Update - 07 June 2017
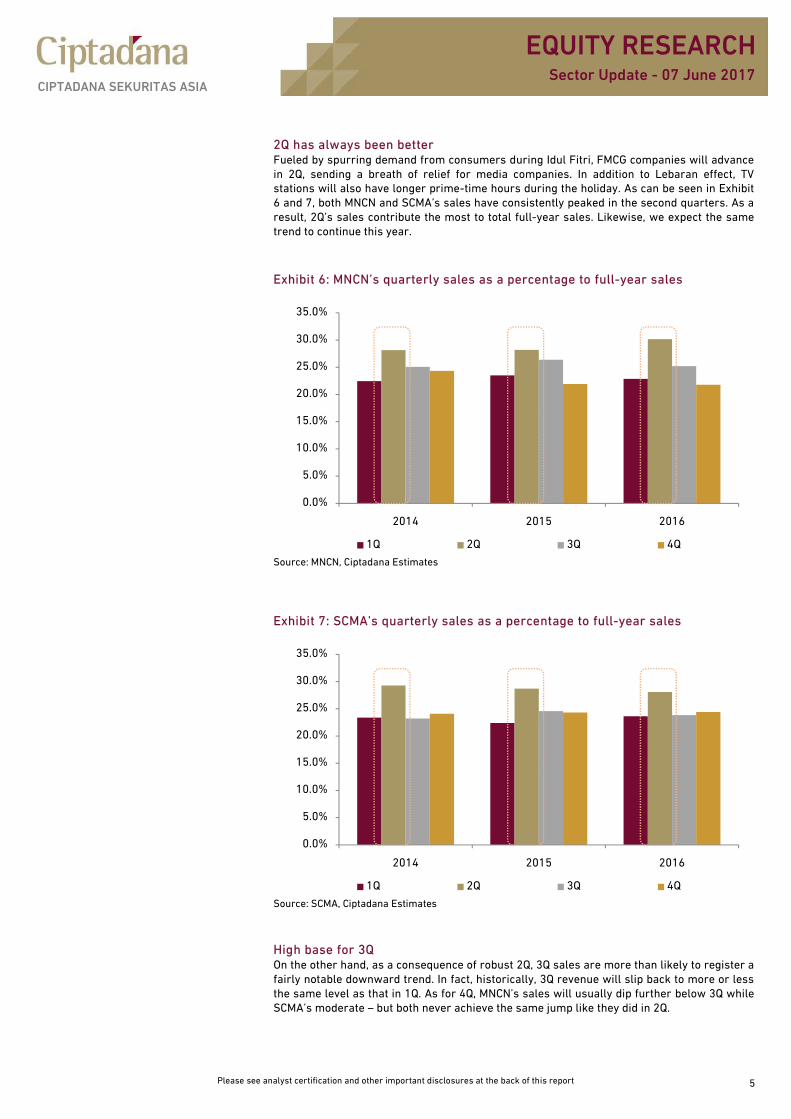
2Q has always been betterFueled by spurring demand from consumers during Idul Fitri, FMCG companies will advancein 2Q, sending a breath of relief for media companies. In addition to Lebaran effect, TVstations will also have longer prime-time hours during the holiday. As can be seen in Exhibit6 and 7, both MNCN and SCMA’s sales have consistently peaked in the second quarters. As aresult, 2Q’s sales contribute the most to total full-year sales. Likewise, we expect the sametrend to continue this year.
Exhibit 6: MNCN’s quarterly sales as a percentage to full-year sales
Source: MNCN, Ciptadana Estimates
Exhibit 7: SCMA’s quarterly sales as a percentage to full-year sales
Source: SCMA, Ciptadana Estimates
High base for 3QOn the other hand, as a consequence of robust 2Q, 3Q sales are more than likely to register afairly notable downward trend. In fact, historically, 3Q revenue will slip back to more or lessthe same level as that in 1Q. As for 4Q, MNCN’s sales will usually dip further below 3Q whileSCMA’s moderate – but both never achieve the same jump like they did in 2Q.
0.0%
5.0%
10.0%
15.0%
20.0%
25.0%
30.0%
35.0%
2014 2015 2016
1Q 2Q 3Q 4Q
0.0%
5.0%
10.0%
15.0%
20.0%
25.0%
30.0%
35.0%
2014 2015 2016
1Q 2Q 3Q 4Q

EQUITY RESEARCHCIPTADANA SEKURITAS ASIA
Please see analyst certification and other important disclosures at the back of this report 6
Sector Update - 07 June 2017
Post-acquisition of SinemArtSCMA’s audience share improvement not as significant as expectedAfter acquiring SinemArt, SCMA does show improvement in its audience share; however,after 2 months (March onwards), the gain subdues, in spite of having successful dramashows that are consecutively included in the top 10 programs (see Exhibit 8 and 9). SCMA’saverage monthly audience shares YTD (January 2017 – May 2017) comes in at 15.7%, thesame to its average audience shares in 2015 but much better than 2016’s average of 12.8%.
RCTI has proven itself remarkably resilientMeanwhile, under MNCN’s wholly-owned production house, MNC Pictures, RCTI continues toflourish and even manages to yet again, as seen in 2016, widen its gap with SCTV. However,supported mainly by SinemArt, we do not expect SCTV’s shares to drop as much as it did in2016. By the same token, as of March 2017 YTD, SCTV has more shows admitted in the top 10programs than it did before SinemArt (see Exhibit 10 and 11).
Exhibit 8: All time (02:00 – 25:59) audience share
Source: Nielsen
Exhibit 9: Prime time (18:00 – 22:59) audience share
Source: Nielsen
0
5
10
15
20
25
2013Avg.
2014Avg.
2015Avg.
2016Avg.
Jan-17 Feb-17 Mar-17 Apr-17 May-17
SCTV RCTI IVM MNCTV TVONE GTV
0
5
10
15
20
25
30
35
2013Avg.
2014Avg.
2015Avg.
2016Avg.
Jan-17 Feb-17 Mar-17 Apr-17 May-17
SCTV RCTI IVM MNCTV TVONE GTV

EQUITY RESEARCHCIPTADANA SEKURITAS ASIA
Please see analyst certification and other important disclosures at the back of this report 7
Sector Update - 07 June 2017
Exhibit 10: After SinemArt – Top 10 drama shows as of March 2017
Top drama series as of March 2017
Program Channel TV Rating Share
1 Dunia Terbalik RCTI 6.2 24.9
2 Anak Langit SCTV 5.3 21.6
3 Berkah Cinta SCTV 4.0 20.4
4 Top Tukang Ojek Pengkolan RCTI 3.7 17.1
5 Orang-orang Kampung Duku SCTV 3.0 13.2
6 Anak Sekolahan SCTV 2.9 16.9
7 Geet ANTV 2.7 14.5
8 Anandhi ANTV 2.7 20.7
9 Mohabbatein ANTV 2.7 10.3
10 Cinta Dari Surga RCTI 2.4 14.8
Source: Company presentation
Exhibit 11: Before SinemArt – Top 10 drama shows in January 2017
Top drama series in January 2017
Program Channel TV Rating Share
1 Dunia Terbalik RCTI 6.3 25.6
2 Anugerah Cinta RCTI 5.7 26.9
3 Tukang Bubur Naik Haji RCTI 4.6 18.9
4 Anak Jalanan RCTI 4.5 22.0
5 Anadhi ANTV 3.6 24.5
6 Geet ANTV 3.5 26.0
7 Gopi ANTV 3.5 21.6
8 Lonceng Cinta ANTV 3.2 14.3
9 Top Tukang Ojek Pengkolan RCTI 3.0 17.9
10 Thapki ANTV 2.9 21.8
Source: Company presentation
RCTI’s Dunia Terbalik remains audience’s favoriteSince Dunia Terbalik first aired on RCTI in January, it continues to display strong trend. Up toMarch 2017, the shows remain the #1 program. The shows primarily targets mid-to-lowerincome segment. Essentially, Dunia Terbalik takes place in a small village where thehusbands are left to take care of household works, including raising their children, while thewives work overseas as maids. Although MNC Pictures has previously produced severalshows for RCTI, this is the first drama series that the house produced after SinemArt’sdeparture.
Exhibit 12: Poster for Dunia Terbalik
Source: RCTI website

EQUITY RESEARCHCIPTADANA SEKURITAS ASIA
Please see analyst certification and other important disclosures at the back of this report 8
Sector Update - 07 June 2017
MNCN’s refinancing phaseMNCN (HOLD/TP: Rp1,970/share)
Refinancing detailsMNCN is currently eyeing USD200 mn syndicated loan to refinance its existing USD250 mnloan that will be due this September 2017. MNCN has just finished conducting its Roadshowin Singapore (May 31), Taipei (June 1) and Hong Kong (June 2). Deutsche Bank, ING andStandard Chartered have been chosen by MNCN to arrange the new loan which will bear amargin interest of 3.25% + Libor rate. Retail lenders can participate in this refinancingthrough 4 different programs:
(i) Mandated lead arrangers and bookrunners (minimum commitment: USD35 mn),(ii) Mandated lead arrangers (minimum commitment: USD20 mn - USD35 mn),(iii) Lead arrangers (minimum commitment: USD15 mn – USD20 mn) and(iv) (Arrangers committing (minimum commitment: USD5 mn – USD15 mn).
MNCN has just finished its Roadshow to Singapore (May 31), Taipei (June 1) and Hong Kong(June 2).
What it means for MNCNMNCN expects to provide further details at the end of 2Q17. However, looking at the currentscheme, MNCN would able to gain 0.25% interest rate spread from the new loan (theprevious loan bears an interest rate of 3.5% + Libor per annum). This will reduce MNCN’smonthly interest expense. However, since the new loan will be a bullet-term loan, just likethe old one, at the end of the loan’s term MNCN will be left with yet again another largepayment of the loan’s principal amount. Therefore, during the term of the loan, MNCN willneed to pay careful attention to its cash flow if MNCN wants to fully pay off the loan withoutfurther refinancing.
A closer look at MNCN’s refinancing planAfter committing itself to a large investment that lasts for 2 years to build new studios,MNCN’s cash flow has become slightly tight and we believe this is reflected in MNCN’s plan ofobtaining USD200 mn loan, which indicates that they will repay only USD50 mn of its USD250mn loan. MNCN has previously stated that they will only repay a part of its loan and refinancethe rest. The company stated its repayment range was within USD50 mn – USD100 mn,depending on their cash flow position. Choosing the minimum amount of repayment signals anegative indication on MNCN’s cash flow.
Exhibit 13: New studio facilities
Source: Company presentation
Entertainment-based News center
MNC TV RCTI Global TV iNews

EQUITY RESEARCHCIPTADANA SEKURITAS ASIA
Please see analyst certification and other important disclosures at the back of this report 9
Sector Update - 07 June 2017
Top pick: SCMAMNCN undoubtedly has stronger audience base but relatively weakerfundamentalRCTI has been constantly leading the FTA TV market with its top drama shows that are ableto attract large audience share. We do believe that RCTI has a very strong and wide audiencebase. Its success in cementing brand loyalty has led them to a comfortable place as one ofIndonesia’s top TV stations. That being said, we prefer SCMA for several reasons:
(i) ProfitabilityOver the past five years, SCMA has always been able to consistently maintain highprofitability margins – those that are considerably higher than MNCN’s (see Exhibit14). Furthermore, the Company could still protect its margins in spite of a period offalling audience share as was the case in 2014 to mid 2016. This proves SCMA’sresilience towards external turbulence. On top of that, SCMA also has no USDdenominated liability, which makes them immune to foreign exchange ratevolatility.
Exhibit 14: Margin comparison2016
Gross profit margin Operating profit margin Net profit margin
SCMA 61% 44% 33%
MNCN 57% 35% 20%Source: SCMA, MNCN, Ciptadana Estimates
We believe SCMA’s ability to maintain high margins is one of the reasons why in spite ofdeclining audience shares (i.e. during 2013 – 2016), SCMA was still able to deliver solidperformance and even surpassing MNCN’s net profit in FY16 (see Exhibit 15).
Exhibit 15: FY16 performance comparison
Source: SCMA, MNCN, Ciptadana Estimates
EQUITY RESEARCHCIPTADANA SEKURITAS ASIA
Please see analyst certification and other important disclosures at the back of this report 10
Sector Update - 07 June 2017
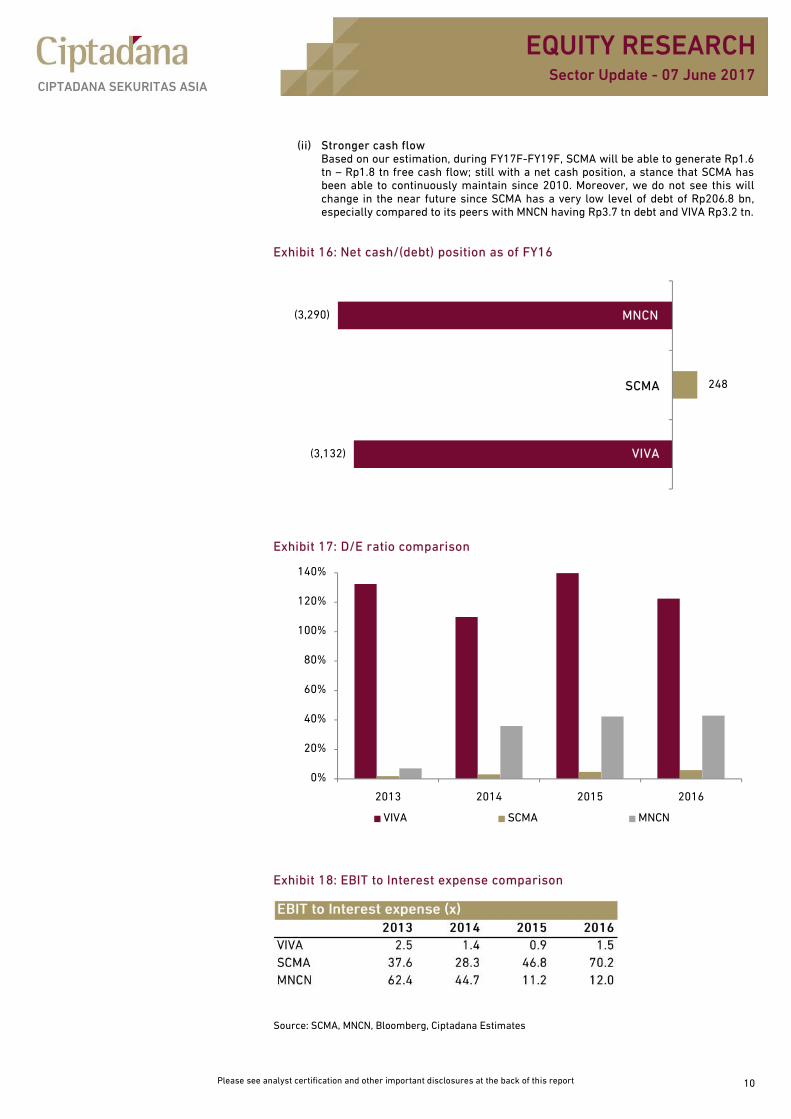
(ii) Stronger cash flowBased on our estimation, during FY17F-FY19F, SCMA will be able to generate Rp1.6tn – Rp1.8 tn free cash flow; still with a net cash position, a stance that SCMA hasbeen able to continuously maintain since 2010. Moreover, we do not see this willchange in the near future since SCMA has a very low level of debt of Rp206.8 bn,especially compared to its peers with MNCN having Rp3.7 tn debt and VIVA Rp3.2 tn.
Exhibit 16: Net cash/(debt) position as of FY16
Exhibit 17: D/E ratio comparison
Exhibit 18: EBIT to Interest expense comparison
Source: SCMA, MNCN, Bloomberg, Ciptadana Estimates
(3,132)
248
(3,290) MNCN
VIVA
SCMA
EBIT to Interest expense (x)2013 2014 2015 2016
VIVA 2.5 1.4 0.9 1.5SCMA 37.6 28.3 46.8 70.2MNCN 62.4 44.7 11.2 12.0
0%
20%
40%
60%
80%
100%
120%
140%
2013 2014 2015 2016
VIVA SCMA MNCN

EQUITY RESEARCHCIPTADANA SEKURITAS ASIA
Please see analyst certification and other important disclosures at the back of this report 11
Sector Update - 07 June 2017
Exhibit 19: SCMA’s share price performance
Exhibit 21: MNCN’s share price performance
-45%-40%-35%-30%-25%-20%-15%-10%-5%0%
0
500
1,000
1,500
2,000
2,500
3,000
3,500
4,000
Jun-
16Ju
l-16
Aug-
16Se
p-16
Oct-1
6Oc
t-16
Nov-
16De
c-16
Jan-
17Fe
b-17
Mar
-17
Apr-
17M
ay-1
7
SCMA 1yr Rel. to JCI (RHS)
-50%
-40%
-30%
-20%
-10%
0%
10%
0
500
1,000
1,500
2,000
2,500
Jun-
16Ju
l-16
Aug-
16Se
p-16
Oct-1
6Oc
t-16
Nov-
16De
c-16
Jan-
17Fe
b-17
Mar
-17
Apr-
17M
ay-1
7
MNCN 1yr Rel. to JCI (RHS)
Exhibit 20: SCMA’s financial highlightsYear to 31 Dec 2015A 2016A 2017F 2018F 2019F
Revenue (Rpbn) 4,238 4,524 5,019 5,567 6,175
Operating profit (Rpbn) 2,015 2,003 2,331 2,594 2,878
Net profit (Rpbn) 1,524 1,501 1,746 1,935 2,142
EPS (Rp) 104.2 102.7 119.4 132.3 146.5
EPS growth (%) 4.7 -1.5 16.3 10.8 10.7
EV/EBITDA (x) 19.9 19.1 16.7 15.0 13.5
PER (x) 26.9 27.3 23.5 21.2 19.1
PBV (x) 13.0 11.9 10.8 9.8 8.9
Dividend yield (%) 4.5 3.0 3.4 3.8 4.2
ROE (%) 48.4 43.8 46.2 46.4 46.5
Source : SCMA, Ciptadana Estimates
Exhibit 22: MNCN’s financial highlightsYear to 31 Dec 2015A 2016A 2017F 2018F 2019F
Revenue (Rpbn) 6,445 6,730 7,269 7,850 8,478
Operating profit (Rpbn) 2,194 2,332 2,689 2,905 3,137
Net profit (Rpbn) 1,186 1,369 1,803 2,010 2,163
EPS (Rp) 83.1 95.9 126.3 140.8 151.5
EPS growth (%) -32.7 15.4 31.8 11.5 7.6
EV/EBITDA (x) 12.4 11.8 10.2 9.4 8.7
PER (x) 22.7 19.7 14.9 13.4 12.4
PBV (x) 3.0 3.1 2.9 2.8 2.7
Dividend yield (%) 3.3 2.2 4.7 5.2 5.6
ROE (%) 13.2 15.5 19.7 21.0 21.6
Source : MNCN, Ciptadana Estimates
EQUITY RESEARCHCIPTADANA SEKURITAS ASIA
Please see analyst certification and other important disclosures at the back of this report 12
Sector Update - 07 June 2017
EQUITY RESEARCH
HEAD OF RESEARCH ANALYST ANALYSTArief Budiman Syaiful Adrian Zabrina Raissa, CSAStrategy, Automotive, Heavy Equipment,Construction
Banking, Consumer, Cigarette Poultry, Cement, Toll Road, AviationConstruction, Shipping T +62 21 2557 4800 ext 919 T +62 21 2557 4800 ext 735T +62 21 2557 4800 ext 819 E [email protected] E [email protected] [email protected]
ANALYST ANALYST ANALYSTKurniawan Sudjatmiko Nichelle Ongko Edward LowisCoal, Metal Mining, Oil & Gas and Services Media, Retail, Others Consumer, PlantationsT +62 21 2557 4800 ext 739 T +62 21 2557 4800 ext 740 T +62 21 2557 4800 ext 760E [email protected] E [email protected] E [email protected]
ANALYST ANALYST JUNIOR ECONOMISTNiko Margaronis Yasmin Soulisa Imanuel ReinaldoTelecommunication, Tower Property, Healthcare T +62 21 2557 4800 ext 820T +62 21 2557 4800 ext 734 T +62 21 2557 4800 ext 799 E [email protected] [email protected] E [email protected]
TECHNICAL ANALYST RESEARCH ASSISTANTTrevor Gasman SumarniT +62 21 2557 4800 ext 934 T +62 21 2557 4800 ext 920E [email protected] E [email protected]
EQUITY SALESCo HEAD OF INSTITUTIONAL SALES Co HEAD OF INSTITUTIONAL SALESDadang Mulyana The Fei MingPlaza ASIA Office Park unit 2 Plaza ASIA Office Park unit 2Jl. Jend. Sudirman Kav. 59 Jl. Jend. Sudirman Kav. 59Jakarta - 12190 Jakarta - 12190T +62 21 2557 4800 ext 838 T +62 21 2557 4800 ext 807F +62 21 2557 4900 F +62 21 2557 4900E [email protected] E [email protected]
SURABAYAJAKARTA - MANGGA DUA JAKARTA - PURI KENCANA Imelda SoetiknoGavin Ishak Chandra Herotionjaya Intiland Tower SurabayaKomplek Harco Mangga Dua Perkantoran Puri Niaga III Ground Floor Suite 5 & 6Rukan Blok C No.10 Jl. Puri Kencana Blok M8 No.2E Jl. Panglima Sudirman 101-103Jl. Mangga Dua Raya Kembangan Surabaya - 60271Jakarta - 10730 Jakarta - 11610 T +62 31 534 3938T +62 21 600 2850 T +62 21 5830 3450 F +62 31 534 3886F +62 21 612 1049 F +62 21 5830 3449 E [email protected] [email protected] E [email protected]
SEMARANGLusiana PermatasariGedung Menara Suara Merdeka6th Floor Unit-02Jl. Pandanaran No.30Semarang - 50134T +62 24 7692 8777F +62 24 7692 8778E [email protected]
Please see analyst certification and other important disclosures at the back of this report 13
EQUITY RESEARCHSector Update - 07 June 2017
CIPTADANA SEKURITAS ASIA
Analyst Certification
Each contributor to this report hereby certifies that all the views expressed accurately reflect his or her personal views about thecompanies, securities and all pertinent variables. It is also certified that the views and recommendations contained in this report are notand will not be influenced by any part or all of his or her compensation.
Disclaimer
This report does not constitute an offer to buy or sell any security/instrument, invitation to offer or recommendation to enter into anytransaction. Nor are we acting in any other capacity as a fiduciary to you. When making and investment decision, you should determine,without reliance upon us or our affiliates, the economic risks and merits (and independently determine that you are able to assume theserisks) as well as the legal, tax and accounting characterizations and consequences of any such transaction. In this regard, by accepting thisreport, you acknowledge that (a) we are not in the business of providing (and you are not relying on us for) legal, tax or accounting advice,(b) there may be legal, tax or accounting risks associated with any transaction, (c) you should receive (and rely on) separate and qualifiedlegal, tax and accounting advice and (d) you should apprise senior management in your organization as to such legal, tax and accountingadvice (and any risks associated with any transaction and our disclaimer as to these matters.
The information contained in this report is based on material we believe to be reliable; however, we do not represent that it is accurate,current, complete, or error free. Assumptions, estimates and opinions contained in this report constitute our judgment as of the date of thedocument and are subject to change without notice. Any projections are based on a number of assumptions as to market conditions andthere can be no guarantee that any projected results will be achieved. Past performance is not a guarantee of future results. PTCIPTADANA SECURITIES AND ITS AFFILIATES SPECIFICALLY DISCLAIMS ALL LIABILITY FOR ANY DIRECT, INDIRECT, CONSEQUENTIAL OROTHER LOSSES OR DAMAGES INCLUDING LOSS OF PROFITS INCURRED BY YOU OR ANY THIRD PARTY THAT MAY ARISE FROM ANYRELIANCE ON THIS REPORT OR FOR THE RELIABILITY, ACCURACY, COMPLETENESS OR TIMELINESS THEREOF.
Analyst Certi ficationDisclaimer: This document is not intended to be an offer, or a solicitation of an offer, to buy or sell relevant securities (i.e. securitiesmentioned herein or of the same issuer and options, warrants or rights to or interest in any such securities). The information and opinionscontained in this document have been compiled from or arrived at in good faith from sources believed to be reliable. No representation orwarranty, expressed or implied, is made by PT CIPTADANA SECURITIES or any other member of the Ciptadana Capital, including any othermember of the Ciptadana Group of Companies from whom this document may be received, as to the accuracy or completeness of theinformation contained herein. All opinions and estimates in this report constitute our judgment as of this date and there can be noassurance that future results or events will be consistent with any such opinions, forecasts or estimates. The information in this documentis subject to change without notice; its accuracy is not guaranteed; and it may be incomplete or condensed.