Sector Study on Environmental Services: Energy Efficiency ...
59
Sector Study on Environmental Services: Energy Efficiency Businesses APEC Policy Support Unit October 2017
Transcript of Sector Study on Environmental Services: Energy Efficiency ...

Sector Study on Environmental Services: Energy Efficiency Businesses
APEC Policy Support Unit October 2017

Prepared by:
International Institute for Energy Conservation (IIEC) in partnership with MP Ensystems
Advisory Private Limited for
Asia-Pacific Economic Cooperation Policy Support Unit
Asia-Pacific Economic Cooperation Secretariat
35 Heng Mui Keng Terrace
Singapore 119616
Tel: (65) 6891-9600 Fax: (65) 6891-9690
Email: [email protected] Website: www.apec.org
Produced for:
Asia-Pacific Economic Cooperation
Committee on Trade and Investments
APEC#217-SE-01.26
This work is licensed under the Creative Commons Attribution-NonCommercial-
ShareAlike 3.0 Singapore License. To view a copy of this license, visit
http://creativecommons.org/licenses/by-nc-sa/3.0/sg/.
The views expressed in this paper are those of the authors and do not necessarily represent
those of APEC Member Economies.

TABLE OF CONTENTS
1. OVERVIEW OF THE STUDY ................................................................... 1
A. BACKGROUND ........................................................................................................... 1
B. OBJECTIVES ............................................................................................................... 2 C. INSIDE THIS REPORT .............................................................................................. 3
2. EE SERVICES INDUSTRY BUSINESS ANALYSIS .............................. 4
A. INDUSTRY CLASSIFICATION ................................................................................ 4 B. TYPES OF ESPS .......................................................................................................... 5
C. ESP BUSINESS MODELS .......................................................................................... 6 D. INTERACTIONS BETWEEN ESPS AND OTHER MARKET
STAKEHOLDERS ....................................................................................................... 9 E. EE SERVICES MARKET IN APEC ........................................................................ 14 F. CHALLENGES FACING THE ESP INDUSTRY .................................................. 17
3. EE TECHNOLOGIES ............................................................................... 21
A. TRENDS IN EE TECHNOLOGIES......................................................................... 21
4. DEMAND DRIVERS AND OPPORTUNITIES FOR EE SERVICES 32
A. DEMAND DRIVERS FOR EE SERVICES ............................................................ 32 B. OPPORTUNITIES FOR EE SERVICE BUSINESSES IN APEC ........................ 38
5. CONCLUSION ........................................................................................... 40
APPENDIX I: MAJOR EE MARKET PLAYERS IN APEC ...................... 42
APPENDIX II: ESP ASSOCIATIONS IN APEC ......................................... 46
APPENDIX III. MAJOR MANUFACTURERS OF EE EQUIPMENT IN
APEC ECONOMIES ........................................................................................ 47
BIBLIOGRAPHY ............................................................................................. 49
ABBREVIATIONS ........................................................................................... 52
LIST OF TABLES
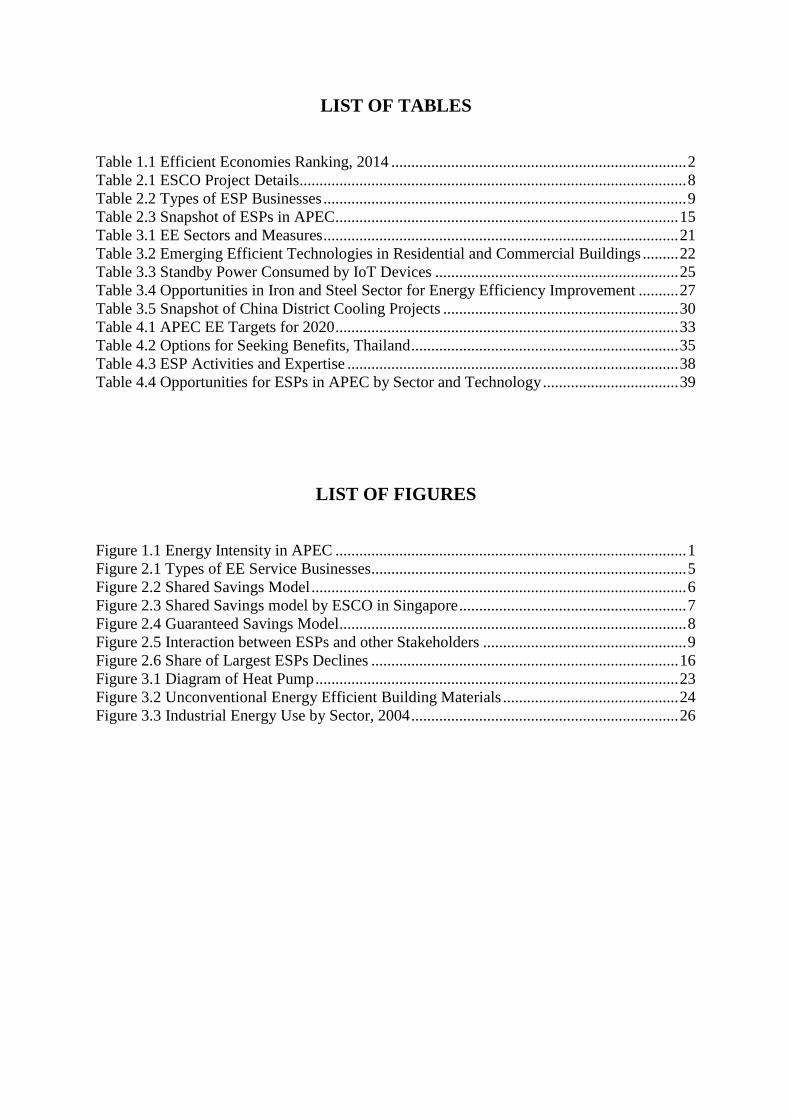
Table 1.1 Efficient Economies Ranking, 2014 .......................................................................... 2 Table 2.1 ESCO Project Details................................................................................................. 8 Table 2.2 Types of ESP Businesses ........................................................................................... 9 Table 2.3 Snapshot of ESPs in APEC ...................................................................................... 15
Table 3.1 EE Sectors and Measures ......................................................................................... 21 Table 3.2 Emerging Efficient Technologies in Residential and Commercial Buildings ......... 22 Table 3.3 Standby Power Consumed by IoT Devices ............................................................. 25 Table 3.4 Opportunities in Iron and Steel Sector for Energy Efficiency Improvement .......... 27
Table 3.5 Snapshot of China District Cooling Projects ........................................................... 30 Table 4.1 APEC EE Targets for 2020 ...................................................................................... 33 Table 4.2 Options for Seeking Benefits, Thailand ................................................................... 35
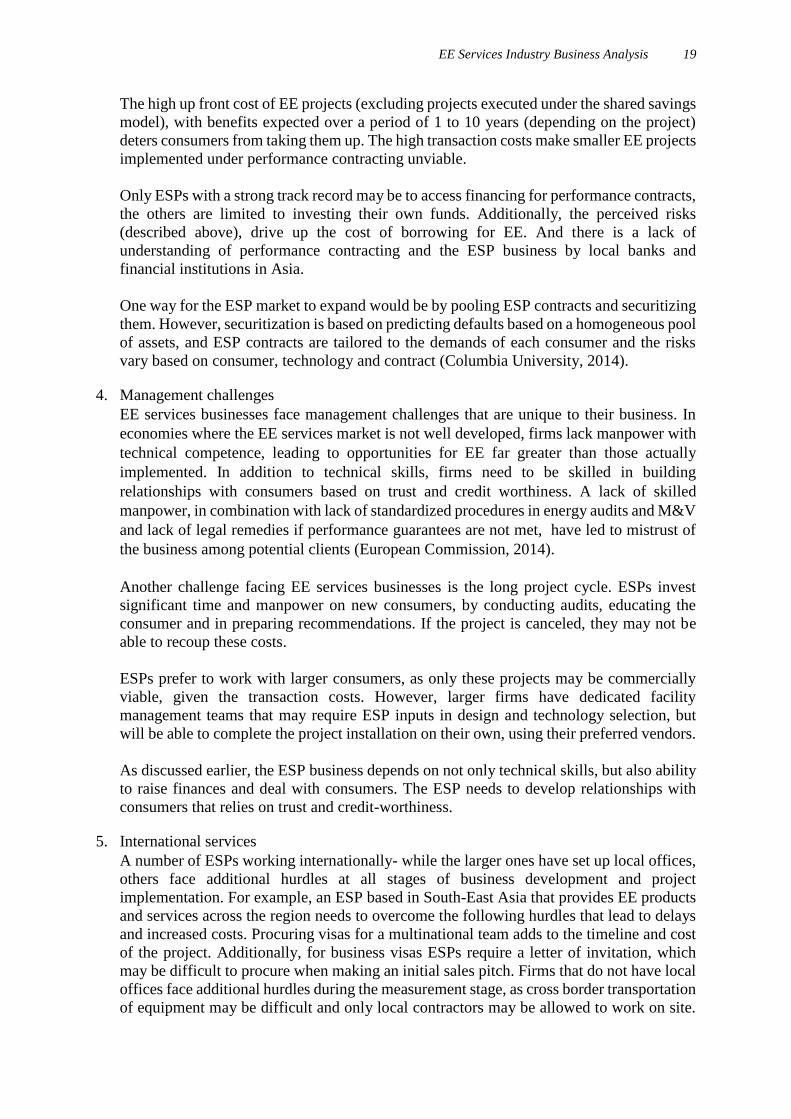
Table 4.3 ESP Activities and Expertise ................................................................................... 38 Table 4.4 Opportunities for ESPs in APEC by Sector and Technology .................................. 39
LIST OF FIGURES
Figure 1.1 Energy Intensity in APEC ........................................................................................ 1 Figure 2.1 Types of EE Service Businesses............................................................................... 5 Figure 2.2 Shared Savings Model .............................................................................................. 6
Figure 2.3 Shared Savings model by ESCO in Singapore ......................................................... 7 Figure 2.4 Guaranteed Savings Model....................................................................................... 8
Figure 2.5 Interaction between ESPs and other Stakeholders ................................................... 9 Figure 2.6 Share of Largest ESPs Declines ............................................................................. 16 Figure 3.1 Diagram of Heat Pump ........................................................................................... 23
Figure 3.2 Unconventional Energy Efficient Building Materials ............................................ 24 Figure 3.3 Industrial Energy Use by Sector, 2004 ................................................................... 26

EXECUTIVE SUMMARY
The APEC region represents approximately 60% of the world’s primary energy demand.
Actions taken in the region play a significant role in determining the world’s Greenhouse Gas
emissions. All APEC economies have individual energy or emissions intensity targets and have
collectively set a target equivalent to reducing energy intensity by 45% between 2005 and 2035.
Energy efficiency (EE) is the provision of more services per unit of energy consumed.
Investment in energy efficiency in 2016 stood at $231 billion in 2016, an increase of 9% over
the past year. We estimate at least 70% of this investment is in the form of EE equipment, with
the remainder on EE services. Energy efficiency services include consultancy, energy audits,
finance, design, installation, maintenance, training, and monitoring and verification of energy
savings. EE service businesses are dispersed in a number of industry categories under UN CPC.
Energy Service Providers (ESPs) is an umbrella term referring to commercial or non-profit
businesses providing a broad range of energy solutions, while ESCOs or Energy Service
Companies, are a type of ESP that receive performance-based compensation, depending on
energy savings achieved.
ESPs face regulatory challenges such as a bias towards the supply side, lack of recognition of
the ESP industry and lack of fiscal support to the industry. The industry may also encounter
market challenges such as financial and performance risks, high transaction costs, difficulties
in obtaining credit and management challenges such as lack of trained personnel, long project
cycles, hurdles doing business across borders and competition with in-house EE teams.
Table 1 summarises key technology trends, policy drivers and sectors of opportunities in APEC
for ESPs.
Table 1. Technologies and Policy Drivers for ESPs in APEC Sectors Policy Drivers Technologies Opportunities for ESPs
Buildings Minimum Energy
Performance Standards
(MEPS),
Building Codes
Insulation, HVAC
improvements, IoT
Opportunities in growing
commercial sector- e.g.
BPOs in the Philippines
Industry Mandatory energy auditing
(Australia)
Requirement for large units to
have energy managers
Minimising heat
losses, Heat
recovery through
exchangers,
Right sizing motors
Less energy intensive
sectors such as
construction, electronics
and food products
Transport Subsidies for new
technologies (Japan)
Green vehicle subsidy and tax
on high consumption vehicles
(USA; Hong Kong, China )
Improving fuel
efficiency
Opportunities to partner
with utilities for smart
charging, Vehicle2Grid
Power Creating energy districts
(Russia; and Hong Kong,
China)
District heating and
cooling, smart grids
Act as district cooling
utility

ACKNOWLEDGEMENTS
We would like to thank the individuals and organisation that made the Environmental Services:
Energy Efficiency Businesses report possible, namely the APEC Secretariat Policy Support
Unit, that funded this report and provided guidance at every step. We would also like to thank
the participants at the APEC Workshop on Environmental Services who provided insights into
the issues facing EE service providers. We would like to also thank government officials, ESP
association members and other industry specialists who provided us with data and helpful
comments.
Project Team
Ira Prem, Samat Sukenaliev, Sommai Phon Amnuaisuk, Sonia Shukla, Mahesh Patankar
(Project Manager), Felix Gooneratne.

1. OVERVIEW OF THE STUDY
A. BACKGROUND
The APEC region represents approximately 60% of the world’s primary energy demand1 and
more than half of global real GDP. Actions taken in the region play a significant role in
determining the world’s Greenhouse Gas (GHG) emissions.
Energy efficiency (EE) is the concept of providing more desired services per unit of energy
consumed. Energy intensity is the amount of energy used to produce one unit of GDP. Figure
1.1 shows the energy intensity in APEC economies and regional groupings, compared to the
world. APEC’s energy intensity goal is equivalent to reducing energy intensity for APEC as a
whole by 45% from 2005 to 2035 (APERC, 2016).
Figure 1.1 Energy Intensity in APEC
Note: Toe- Tonnes of oil equivalent
Source: APEC (2013)
Investment in energy efficiency in 2016 stood at $231 billion in 2016, an increase of 9% over
the past year (IEA, 2017). We estimate at least 70% of this investment is in the form of EE
equipment, with the remainder on EE services.
The American Council for an Energy Efficient Economy (ACEEE) has published an
International Energy Efficiency Scorecard that examines the energy policies and performance
of 23 of the world’s top energy-consuming economies. Economies were evaluated and scored
on efficiency policies and how efficiently their buildings, industry, and transportation sectors
use energy. As seen in Table 1.1 Five APEC economies ranked among the top 10 energy
efficient economies: Japan; China; Korea; United States; and Canada.
1 According to U.S. Energy Information Administration data reported in 2016, APEC economies consumed
approximately 342 quadrillion BTU (British Thermal Units) or 62% of the world’s primary energy in 2014.
0
20
40
60
80
100
120
140
160
180
200 Toe/ unit GDP

2 Sector Study on Environmental Services: Energy Efficiency Businesses
Table 1.1 Efficient Economies Ranking, 2014
Ranking Economy
1 Germany
2 Japan
2 Italy
4 France
5 UK
6 China
7 Spain
8 United States
8 Korea
10 Canada
11 Netherlands
12 Poland
13 Chinese Taipei
14 India
15 Turkey
16 Australia
17 Russia
18 Indonesia
19 Mexico
20 Thailand
21 South Africa
22 Brazil
23 Saudi Arabia Source: ACEEE (2016)
The scorecard indicates that there is a robust market for EE goods and services in the major
APEC economies. In the region’s smaller economies, there is substantial potential to expand
EE services.
B. OBJECTIVES
This study aims to build and enhance the understanding of energy efficiency services among
APEC economies, with a view to identifying key challenges. The study is expected to
contribute to the implementation of Phase 1 of the Environmental Services Action Plan (ESAP)
and subsequent works of the action plan. Understanding and addressing challenges and
opportunities faced by energy efficient equipment manufacturers and service providers will
empower APEC economies to rapidly employ energy efficiency and conservation (EE&C)
strategies.
The primary objectives of this report are to:
Provide an overview of the EE sector and types of EE service providers
Analyse the major trends in demand and technology in EE services in APEC economies
Identify the business models under which EE service providers operate
Identify major players in APEC economies
Identify the regulatory challenges faced by these businesses
Highlight the opportunities in the sector

Overview of the study 3
C. INSIDE THIS REPORT
Section 2 of the report has a detailed analysis of Energy Efficiency Service Providers (ESPs)-
business models, market conditions and challenges facing the sector. This section includes the
interactions between ESPs and other EE stakeholders. Section 3 describes technology trends in
the EE market. Section 4 looks at the demand drivers and opportunities facing the EE services
sector, followed by concluding remarks in Section 5.

2. EE SERVICES INDUSTRY BUSINESS ANALYSIS
This section describes the EE Services industry. The first part contains an analysis of the scope,
types and business models of EE service providers. The second part looks at market conditions
for ESPs in APEC. The third part analyses regulatory and market challenges facing the sector.
A. INDUSTRY CLASSIFICATION
Energy efficiency investments are important in combating climate change in the following
ways:
1. By reducing energy consumed, lower Greenhouse Gas (GHG) emissions are produced.
Studies have shown that standard EE interventions can reduce energy consumption and
GHG emissions by 20%.
2. GHG emission reductions can be achieved at lower cost, since energy efficiency acts as a
low-cost resource, requiring much lower investment than setting up a new source of energy
supply (EPA, 2009).
Energy Efficiency Service Providers (ESPs) are a vital part of the energy efficiency market.
They are businesses that help their clients reduce energy consumption and costs by providing
some or all of the following types of services:
Consultancy
Energy audits
Finance
Design
Equipment installation
Maintenance
Training
Monitoring and verification of energy savings
Currently, depending on services provided, and the level of vertical integration, ESPs are
dispersed under the following UN CPC2 categories (UNStats, 2017):
1710 Electrical Energy
512 Construction work for buildings
513 Construction work for civil engineering
514 Assembly and erection of prefabricated constructions
516 Installation work
517 Building completion and finishing work
811 Financial intermediation services, except insurance and pension fund services
831 Leasing or rental services concerning machinery and equipment without operator
867 Architectural, engineering and other technical services
879 Other business services
94090 Other environmental protection services
2 UN CPC version 2.1

EE Services Industry Business Analysis 5
B. TYPES OF ESPS
Energy Efficiency Service Providers (ESPs) is an umbrella term referring to commercial or
non-profit businesses providing a broad range of energy solutions including design and
implementation of energy saving projects, retrofitting, energy conservation, energy
infrastructure outsourcing, power generation and energy supply, and risk management. The
presence and size of the ESP market in an economy reflects the efforts to advance energy
efficiency through effective business models and creative financing.
ESCOs or Energy Service Companies, are a specific type of ESP that receive performance-
based compensation, depending on energy savings achieved. The distinction between ESCOs
and other ESPs that act as advisories is not clear-cut, as practices may differ across economies,
and firms may change the scope of their work depending on market demand. Energy efficiency
businesses may be owned by companies, utilities or the Government. They can be commercial
or non-profit entities.
Sources: World Bank (2010); (MP Ensystems & IIEC , 2017)
ESCOs provide some or all the services listed below (European Commission, 2003):
Energy audits
Feasibility studies
Engineering design
Equipment procurement
Full
service,
High
risk
Limited
service,
low risk
•Designs, finances, implements the project, verifies energy savings
•Shares agreed percent of actual energy savings over fixed periodFull Service ESCO
•Takes over operations and maintenance, supplying output (steam, heat, cooling, lighting)
•Costs borne by ESCO, ownership remains with customer
End-use Outsourcing
•Designs and implements project but does not finance it
•Guarantees that energy savings will cover cost of projectESCO with third-party
financing
•Similar to Full Service ESCO, but contract term can vary to ensure ESCO recovers agreed amount
ESCO with variable term contract
•Equipment supplier designs and commissions project
•Customer pays lumpsum or over-time, based on expected energy savings
Equipment Supplier Credit
•Similar to equipment supplier credit, but ownership of equipment remains with supplier till all payments are madeEquipment Leasing
•Conducts energy audit, project implementation
•Performance-based fee
Technical Consultant (performance-based
payment)
•Conducts energy audit, designs project
•Fixed feeTechnical Consultant (fixed
payment)
Figure 2.1 Types of EE Service Businesses

6 Sector Study on Environmental Services: Energy Efficiency Businesses
Subcontractor management
Construction
Measurement and verification
Operation and maintenance
Project Financing
While features of ESCOs vary among APEC economies, the defining feature of these
businesses is Energy Savings Performance Contracting (ESPC). The main features of ESPC
are:
The contract states that payments are dependent on results
The contract recognizes ownership of risks
It acknowledges responsibilities
Baseline energy consumption is established and documented in the contract
It documents the equipment to be installed
The term of the contract is established
Identifies monitoring and verification (M&V) requirements
C. ESP BUSINESS MODELS
ESP firms that act as consultants and charge clients for their EE services have a similar business
model to other advisories and consultancies. ESCOs have two main business models- Shared
Savings and Guaranteed Savings.
i. Shared Savings Model
Under the shared savings model, the ESCO finances the project, without investment from the
consumer. The ESCO and consumer share the financial savings due to reduced energy
consumption in a defined ratio, over the contract period.
Figure 2.2 Shared Savings Model
Source: UNECE (2014)

EE Services Industry Business Analysis 7
ii. Guaranteed Savings Model
Under the guaranteed savings model, the customer finances the project, while the ESCO
provides a performance guarantee. The ESCO is paid once the facility achieves the desired
efficiency level. This model is undertaken when the customer has easier access to capital than
the ESCO. Figure 2.4 shows the flow of funds in a Guaranteed Savings model.
Case Study: Shared Savings Model in Singapore
An ESCO in Singapore replaces the controllers in building chiller plants and uses the data
from the controllers to optimize the operation of the chiller plant equipment and reduce the
energy consumption of the building. The client does not pay upfront, instead the baseline
energy consumption is measured and energy savings are monitored by an independent third
party. The ESCO receives its payment from these savings, as shown in Figure 2.3 below.
Figure 2.3 Shared Savings model by ESCO in Singapore
Source: BBP Singapore (2017)
Current Monthly Energy Bill
Reduced Energy Bill
Net Savings to Client
Portion of savings to ESCO
Savings calculated by 3rd
party

8 Sector Study on Environmental Services: Energy Efficiency Businesses
Figure 2.4 Guaranteed Savings Model
Source: UNECE (2014)
Case Study: Guaranteed Savings model in Korea
In Korea, approximately 74% of buildings were constructed over 20 years ago, a majority
of them were inefficient. Hence, there is considerable potential for ESCOs to enhance EE
of buildings. In this case study, an ESCO carried out insulation and window retrofits to
improve the efficiency of a commercial building (Hyein Yi, 2017). The project details are
in Table 2.1.
Table 2.1 ESCO Project Details
Project cost 462,000 USD
Target savings 75,600 USD/year
Guaranteed savings 60,480 USD/year
Expected savings 66,528 USD/year
Performance guarantee period 8 years Source: Hyein Yi (2017)
The target energy savings and guaranteed savings levels were proposed by the ESCO. An
external agency verified the value of the expected energy savings. Using the interest rate
and inflation, a discount rate was calculated and this was used to determine the period of
the project- 8 years. An estimate was made for volatility due to change in electric and gas
usage (the price of gas and electricity were fixed at the time of the contract). The project
also included Certified Emissions Reductions (CERs) as a part of the savings accruing to
the customer (Hyein Yi, 2017). This project is currently underway, hence the final savings
are not known.

EE Services Industry Business Analysis 9
iii. Other ESP Business Models
ESPs that do not work under performance contracting typically carry out EE services and are
paid for them. The payments may not be linked to energy savings. Some of these types of
businesses are in Table 2.2.
Table 2.2 Types of ESP Businesses
Businesses Services Provided for a Fee
Consultancies and
advisories
Provide technical inputs on process and management changes,
Energy Auditors
Measure and meter energy consumption of premises, provide
comprehensive report on recommended EE measures, costs,
expected savings
Product suppliers Use EE services as a sales and marketing tool, and provide finance
for customers to purchase their products and services
Contractors Procure and install EE equipment
Design firms Provide inputs for new or existing green building design Source: (MP Ensystems & IIEC , 2017)
D. INTERACTIONS BETWEEN ESPS AND OTHER MARKET STAKEHOLDERS
Figure 2.5 shows the relationship between ESPs, manufacturers, electricity distribution
companies. This interaction is described in the section below.
Figure 2.5 Interaction between ESPs and other Stakeholders
Source: (MP Ensystems & IIEC , 2017)
i. Interaction between ESPs and Manufacturers
Investment in energy efficiency in 2016 rose 9% to $231 billion in 2016 (IEA, 2017). We
estimate at least 70% of this investment is in the form of EE equipment, with the remainder on
EE services. US, China and Southeast Asian APEC economies are a manufacturing hub for the
world’s EE equipment, including LEDs, air-conditioners and electric vehicles. Appendix III
contains a list of the major manufacturers and suppliers of EE equipment.

10 Sector Study on Environmental Services: Energy Efficiency Businesses
Manufacturers and ESPs are closely linked, with some ESPs owned by manufacturers, others
working in partnership with certain manufacturers. Most topics covered in this report- demand
drivers, technology trends, regulatory environment, opportunities and challenges that affect the
ESP industry, equally affect the manufacturers of efficient equipment.
The case study below highlights the synergy between ESPs, manufacturers and electricity
distribution companies in implementing large-scale energy efficiency projects.
ii. Interaction between ESPs and Electricity Distribution Companies
Electric distribution companies supply energy to consumers, while ESPs work with consumers
to reduce energy demand. Despite these opposing goals, the two industries work together in
the following ways:
1. Subsidiary: ESPs may be subsidiary arms of electricity distribution companies. They
participate in utility Demand Side Management3
(DSM) programs, provide efficiency
services at a discount, or act as for-profit entities.
3 A Demand Side Management program is conducted by utilities to reduce energy consumption on the consumer
side of the meter. DSM activities include planning, implementing, and monitoring energy savings, which can be
conducted by the utility or an ESP.
Case Study: Efficient Lighting Initiative
The Efficient Lighting Initiative (ELI) is a World Bank sponsored program that promotes
the manufacture, distribution and installation of EE lighting in a number of economies,
including APEC economies Peru; China; Viet Nam; and the Philippines. At the onset of
this program in 2009, compact fluorescent light bulbs (CFLs) were procured from
manufacturers and distributed to consumers in exchange for less efficient incandescent
lightbulbs. Manufacturers such as Anhui, GE, OSRAM, and Philips were certified by the
China Standard Certification Center to meet technical and performance criteria. The
institute considered criteria set by ESPs and electricity distribution companies during their
procurement process, while setting these standards. The actual procurement and
distribution of the CFLs was conducted differently across economies. For example, in Viet
Nam, bulk procurement was carried out from manufacturers and the CFLs were sold by
distribution companies. In other economies, market channels (distributors and retailers)
were used to promote the sale of CFLs.
Some results of the program:
20-fold increase in sale of CFLs in Peru
Price reduction of CFLs (up to 85% in Argentina)
Market shift towards higher quality CFLs in the Philippines
Thousands of trained efficient lighting experts
Energy consumption reduced by 2,590 gigawatt-hours (GWH), and CO2 emissions by
2,018,000 tonnes between 2000- 2003 (IFC, 2005)
Source: (World Bank, 2009)

EE Services Industry Business Analysis 11
2. Contractor: Utilities may hire ESPs as contractors or partner with them for DSM programs
3. Competitor:
i. In some economies where the electricity sector is deregulated, large energy consumers
may purchase energy from ESPs that have become energy suppliers. In this case, ESPs
directly compete with utilities in their core area of business.
ii. In the case of an energy efficiency power plant, an ESP invests to reduce energy
consumption in a measurable and predictable way that can be compared to the output
of a convention power plant. To produce “negawatts” or energy savings, the ESP carries
out load management, DSM and Demand Response activities among a set of
consumers. Demand Response is a program in which energy consumers reduce or shift
their electricity load during peak hours in response to Time of Use rates, or other
financial incentives. (Limaye, 2010). In this way, the ESP competes with the utility in
supplying energy.

12 Sector Study on Environmental Services: Energy Efficiency Businesses
Case study: ESCO Standard Offer program for Commercial and Industrial consumers,
Centerpoint USA
A Standard Offer Program (SOP) is a utility program in which an ESP (or other aggregator
firm) implements energy efficiency measures (EEMs) at the consumer end, producing
negawatts (saved energy/demand or both), which can be purchased by the utility.
Centerpoint, a US-based utility has implemented an SOP, with the following features:
Sponsors: ESPs, engineering and architecture firms, contractors or private individuals can
act as project sponsors, by installing EEMs at Centerpoint consumer locations in non-
residential buildings.
Consumers: Government, commercial and industrial consumers of Centerpoint can take part
in the program.
Project: Measures installed at a location must reduce peak demand by at least 20 kW or
generate annual energy savings of at least 120,000 kWh.
EEMs: Eligible EEMs include improving HVAC efficiency by replacing a chiller,
cogeneration projects, replacing inefficient lights with efficient fluorescent or LED lights
etc.
Payments: Project sponsors can be paid in the following ways:
1. Incentives paid for specific measures (such as changing light fixtures), post installation
and verification
2. For certain measures (such as fuel switching from electric to gas), measurement and
verification is conducted for a year’s savings, before the project sponsor is paid
Savings achieved: Until June 2015, over 100 projects were implemented, with a 15 MW
reduction in peak demand.
Source: (CenterPoint Energy, 2015)
iii. Interaction between ESPs and Regulators
Electricity is a regulated industry in most APEC economies and the role of the electricity
regulator is to promote public interest, through its rate-making and rule-making functions.
When an ESP conducts its activities with households or businesses as its customers, typically
the electricity regulator has no role to play.
However, rules set by the regulator or other Government agencies on energy efficiency
appliance labels, buildings energy ratings, DSM or other efficiency programs affect the
functioning of ESPs. Additionally, in many economies, the regulator or a Government agency
empanels or certifies ESPs, based on criteria such as financial strength, projects performed and
energy savings achieved, and number of trained personnel.

EE Services Industry Business Analysis 13
For example, the Malaysian Energy Commission (Suruhanjaya Tenaga) is a statutory body
created under the Energy Commission Act 2001 to regulate the energy sector. Its main role is
to carry out economic, technical and safety regulation of the electricity and piped gas industries.
In addition, it is responsible for registering and accrediting ESCOs (Energy Commission,
2017).
Some economies outside APEC, e.g. UAE, have set up special regulatory bodies for ESPs, in
order to streamline ESP activity and meet a national energy efficiency target. The role of such
a regulator is to certify ESPs, standardise M&V methodologies, provide standards for energy
performance contracting and set up a dispute resolution mechanism (RSB, 2017).
iv. Interaction between ESPs and Consumers
Consumers working with ESPs to reduce their energy consumption follow one of the options
below, depending on their access to funds, credit worthiness, business viability and risk
appetite:
Fees: Hire ESP to improve EE of the premises and pay on completion of work
Guaranteed savings: Consumer pays for the EE improvements, the ESP provides a
guarantee of energy savings and is paid when savings are achieved, leading to a reduced
risk to consumer
Shared savings: ESP pays for EE project and is paid out of the energy savings
Third party financing- The ESP or consumer borrow funds from a financial institution and
repay it from the savings generated by the EE project
Although 90% of global enterprises are SMEs and their economic contribution varies between
15-50% of an economy’s GDP (IFC, 2012), ESPs mainly work with large commercial,
industrial, public and institutional consumers. Residential, small commercial and micro small
commercial and small and medium enterprise (MSME) consumers are typically under-served.
Reasons for this include the higher cost to ESPs of servicing multiple consumers (eg individual
apartments in a building, number of SMEs in a cluster), lack of consumer awareness and the
inability of these consumers to make large upfront payments.
v. Interaction between ESPs and Financial Institutions
EE services are financed from one of the following sources:
Consumer funds the EE services and equipment through own balance sheet
Consumer borrows from a financial institution
Institutional consumer issues a bond to finance EE
ESP using performance contracting funds project through own balance sheet
ESP using performance contracting borrows from a financial institution
ESP and/or consumer access Government or donor agency ESP fund
14 Sector Study on Environmental Services: Energy Efficiency Businesses
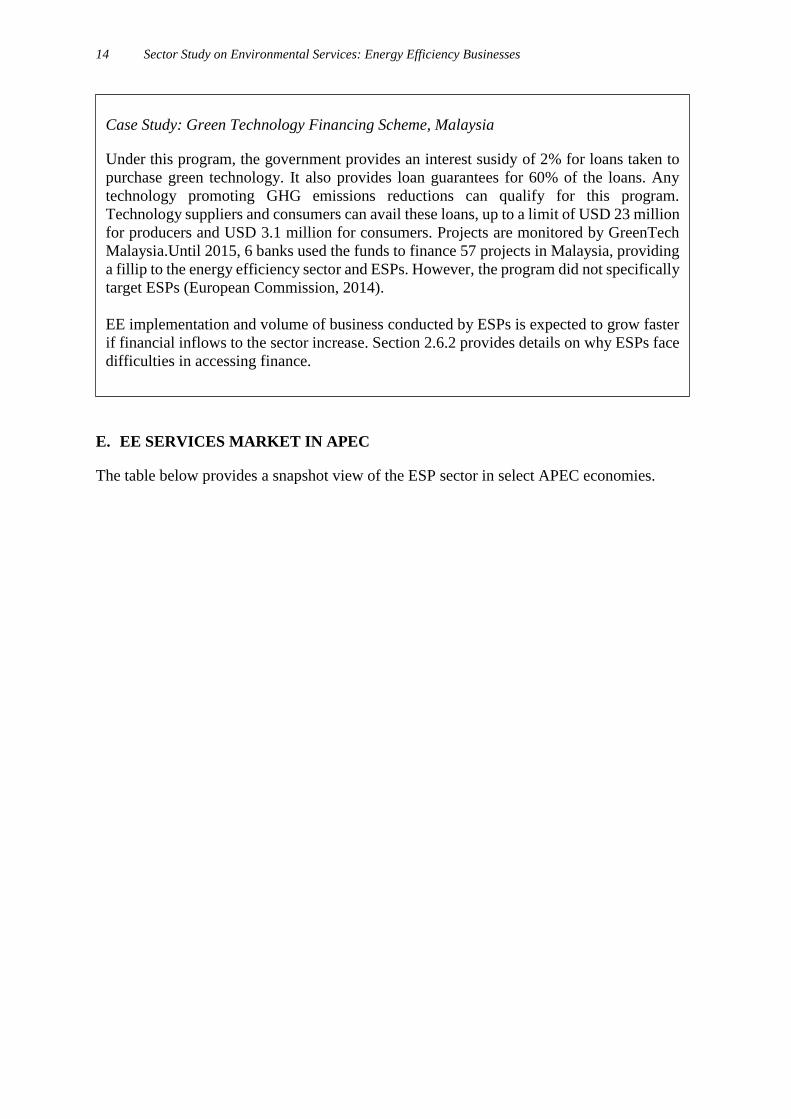
E. EE SERVICES MARKET IN APEC
The table below provides a snapshot view of the ESP sector in select APEC economies.
Case Study: Green Technology Financing Scheme, Malaysia
Under this program, the government provides an interest susidy of 2% for loans taken to
purchase green technology. It also provides loan guarantees for 60% of the loans. Any
technology promoting GHG emissions reductions can qualify for this program.
Technology suppliers and consumers can avail these loans, up to a limit of USD 23 million
for producers and USD 3.1 million for consumers. Projects are monitored by GreenTech
Malaysia.Until 2015, 6 banks used the funds to finance 57 projects in Malaysia, providing
a fillip to the energy efficiency sector and ESPs. However, the program did not specifically
target ESPs (European Commission, 2014).
EE implementation and volume of business conducted by ESPs is expected to grow faster
if financial inflows to the sector increase. Section 2.6.2 provides details on why ESPs face
difficulties in accessing finance.

EE Services Industry Business Analysis 15
Table 2.3 Snapshot of ESPs in APEC Viet Nam Thailand China United States Australia
Number
of ESPs
About 20 existing ESPs
could act as ESCOs, but only
a few have implemented
ESCO projects so far.
45 registered ESPs, about 10
of them work under EPC
5246 ESCOs (2015) 144 ESCOs 12 ESCOs
ESP
market
size and
potential
There is an increased focus
on ESCOs' business in
government policy, but it is
not possible to define a
market trend as the ESCO
market has not taken off
Market size around USD
100-200 million in 2012.
Market potential around
USD 500 million in 2012
(Leaver, 2013).
ESCO revenues of USD 13.3
Bn in 2015. Currently
ESCOs employ over 600,000
people.
$6.4 billion (2013);
Remaining market potential
estimated at $71- $133
billion
$72,587,386 (total value of
EPCs implemented in the
financial year 2013- 2014);
no information available on
the existing market potential.
ESCO
market
trend
Growing Growing Poised for rapid and
sustained growth, with the
market growing at 7% in
2015
Steady to high growth rate
expected
Slightly decreasing in the
last year
Main type
of
contract
EPCs with shared savings
(first-out approach).
EPCs with guaranteed
savings, BOOT contracts
(not very frequent)
Shared savings Performance-based (e.g.,
guaranteed savings), design-
build, onsite generation PPA,
consulting, utility program
administration, other
EPCs with guaranteed
savings, BOOT contracts,
chauffage contracts
Typical
ESP
projects
Demonstration EPC projects
carried out in food
processing facilities. There is
potential for project
implementation in energy
intensive industries such as
cement, iron, steel, chemical,
pulp and paper industries
Projects mainly implemented
for industry. Technologies
and fields of application:
pumps, electric motors and
inverters, CHP, lighting, air
conditioning.
Industrial sector accounted
for 80% of the demand,
followed by buildings (in
2011).
Technologies employed
include- variable speed
controls, central air
conditioning, waste heat
power generation
Energy conservation
measures (lighting, control,
etc.), onsite renewable
generation, other, consulting,
engines/turbines
Public buildings (higher
education facilities and
hospitals). Installation of
energy efficient lighting
solutions, HVAC solutions.
Co-generation and tri-
generation in the commercial
and industrial sector.
Source (European Commission,
2014)
(European Commission,
2014)
(IFC, 2012) (European Commission,
2014)
(European Commission,
2014)

16 Sector Study on Environmental Services: Energy Efficiency Businesses
i. ESPs in APEC: Trends
Among APEC economies, United States; Japan; and Canada have long-standing ESP
industries, while those of China; Chinese Taipei; Korea; Thailand; Viet Nam; and Singapore
are rapidly developing (European Commission, 2014). Major trends observed in the ESP
market are
1. Major market players
In the United States, the market share of the eight largest ESPs4 has reduced between 2006
and 2014, as seen in Figure 2.5 (Charles Goldman, 2005). In contrast, smaller economies
such as Indonesia have approximately 15 ESPs, which include state-owned companies,
manufacturers and multinationals, none of which dominate the market (European
Commission, 2014).
Figure 2.6 Share of Largest ESPs Declines
Source: LBNL (2016)
2. New entrants
In developed economies, utilities are increasingly providing energy efficiency services in
order to bolster revenue that has been hit by a low energy demand outlook. Additionally,
due to the use of remote monitoring and control, new firms are entering the ESP market to
sell energy solutions, that include EE services, program design, marketing, data analytics,
strategic energy management, policy advisory, market research and training (Charles
Goldman, 2005).
3. Regional disparity
In mature markets such as the United States, ESPs are concentrated in states with high
economic activity. (LBNL, 2016). In developing economies, location and growth of ESPs
is dependent on local Government support.
4 Appendix I contains a list of the major market players in APEC
0
10
20
30
40
50
60
70
80
2008 2011 2014
Share of Gross revenue, %
Small (<$100 mn) Medium ($100mn - $300mn)

EE Services Industry Business Analysis 17
4. Sources of finance
In the US, ESPs use loans and leases to finance Government projects, and used bonds to
raise funds for institutional consumers (LBNL, 2016). In developing economies, ESPs
finance projects from their working capital, Government ESP funds, international grants
and commercial bank loans.
F. CHALLENGES FACING THE ESP INDUSTRY
i. Regulatory Challenges
Regulatory challenges encountered by ESPs in APEC economies include:
1. Bias towards supply side
While developing infrastructure plans, governments typically undervalue the importance
of energy efficiency in enhancing productivity and have a bias towards energy supply
options. Energy planners may overestimate future energy demand and exclude the option
of EE as an energy resource to meet demand.
2. Lack of recognition and understanding of the ESP industry
Because of the supply side bias, the government may have limited interest in employing
ESPs to carry out projects on public infrastructure. Governments may not recognize or
understand the ESP industry, may not support ESP associations, or not recognize ESP
accreditation. This may lead to a lack of regulation or over-regulation of the EE services
industry, which can hurt ESP growth.
For example, in some economies as a part of government plans to promote energy
efficiency in public buildings, the duration and share of energy savings for performance
contracting are predetermined, even before the investment-grade energy audits can be
conducted, leading to lack of participation by ESPs in the project. Indonesia is an example
where policies on energy efficiency, management and audits have been in place since 2009,
but these have not yet been sufficient to create significant demand to promote energy
efficiency business and energy efficiency projects (World Business Council for Sustainable
Development, 2015). .
3. ESPs and government buildings
Public procurement of energy services is a large, untapped target for efficiency
improvement. ESPCs can be beneficial to government agencies in implementing EE in
public buildings and facilities since the entire work can be outsourced to the ESP, skipping
the slow process of procurement. Additionally, by using performance contracting, ESPs
can pay for the services through savings, which can be an attractive, low-risk proposition
for cash-strapped government agencies. However, many economies have rigid rules for
procurement - performance contraction may not be specified as an option and EE may not
be a criterion for appliances, limiting the role of ESPs in government facilities (ESMAP,
2010). For example, Indonesia’s government procurement rules rely mainly on selection of
the lowest cost bidder, and projects have two different bids on project design and
implementation, which restrict the role an ESP can play (European Commission, 2014).

18 Sector Study on Environmental Services: Energy Efficiency Businesses
4. Taxes
Economic incentives such as tax credits, subsidies and rebates for ESPs can be an important
instrument for promoting investment in EE products and services. These incentives, when
paired with efficiency standards and labels can help businesses overcome the barrier of
higher cost of efficient appliances. While some economies have put in place tax incentives
(See Section 3. Policy and Regulatory drivers for a description of tax incentives), these are
not in place in many APEC economies. For example, the Philippines has not provided tax
incentives to develop its nascent ESP industry.
ii. Market Constraints
EE businesses face the following types of challenges in the marketplace:
1. Business risks
i. Financial risk- The credit-worthiness of the consumer and the state of the economy
could affect the consumer’s business and ability to pay the ESP. To minimise this risk,
ESPs may choose to work only with credit-worthy consumers that are expected to have
long-term stability, such as municipalities and universities (Columbia University,
2014).
ii. Technology risk- The energy end-use selected (e.g. installing plug and play LED
lighting vs HVAC equipment retrofit) affects whether the project requires limited
expertise, has low chances of failure, is less affected by external factors such as weather
and occupancy determined and is low risk.
iii. Performance risk- Related to technology risk is the risk that there is a gap between the
potential savings and actual savings achieved by a project.
2. Transaction costs in Performance Contracting
Performance contracting entails transaction costs such as:
Cost of developing baseline over a period
Developing M&V plan using an appropriate methodology5
Cost of metering to measure energy consumption of new EE appliances
Using third party to verify savings
Legal costs of enforcing contract (if required)
Each of these steps requires time, financial and human resources, adding to the cost of the
EE project. In addition, performance contracting requires information or forecasts on
production, occupancy and weather during the metering period.
3. Financial Challenges
In some APEC economies (e.g. Chinese Taipei; Indonesia; Malaysia; Viet Nam; and Brunei
Darussalam) energy prices are heavily subsidized to stimulate economic growth, reducing
the return on energy efficiency investments.
5 The International Performance Measurement and Verification Protocol (IPMVP) has proposed standard
methodologies that can be used to conduct M&V of energy efficiency projects. Trained personnel who are certified
IPMVP professionals
EE Services Industry Business Analysis 19
The high up front cost of EE projects (excluding projects executed under the shared savings
model), with benefits expected over a period of 1 to 10 years (depending on the project)
deters consumers from taking them up. The high transaction costs make smaller EE projects
implemented under performance contracting unviable.
Only ESPs with a strong track record may be to access financing for performance contracts,
the others are limited to investing their own funds. Additionally, the perceived risks
(described above), drive up the cost of borrowing for EE. And there is a lack of
understanding of performance contracting and the ESP business by local banks and
financial institutions in Asia.
One way for the ESP market to expand would be by pooling ESP contracts and securitizing
them. However, securitization is based on predicting defaults based on a homogeneous pool
of assets, and ESP contracts are tailored to the demands of each consumer and the risks
vary based on consumer, technology and contract (Columbia University, 2014).
4. Management challenges
EE services businesses face management challenges that are unique to their business. In
economies where the EE services market is not well developed, firms lack manpower with
technical competence, leading to opportunities for EE far greater than those actually
implemented. In addition to technical skills, firms need to be skilled in building
relationships with consumers based on trust and credit worthiness. A lack of skilled
manpower, in combination with lack of standardized procedures in energy audits and M&V
and lack of legal remedies if performance guarantees are not met, have led to mistrust of
the business among potential clients (European Commission, 2014).
Another challenge facing EE services businesses is the long project cycle. ESPs invest
significant time and manpower on new consumers, by conducting audits, educating the
consumer and in preparing recommendations. If the project is canceled, they may not be
able to recoup these costs.
ESPs prefer to work with larger consumers, as only these projects may be commercially
viable, given the transaction costs. However, larger firms have dedicated facility
management teams that may require ESP inputs in design and technology selection, but
will be able to complete the project installation on their own, using their preferred vendors.
As discussed earlier, the ESP business depends on not only technical skills, but also ability
to raise finances and deal with consumers. The ESP needs to develop relationships with
consumers that relies on trust and credit-worthiness.
5. International services
A number of ESPs working internationally- while the larger ones have set up local offices,
others face additional hurdles at all stages of business development and project
implementation. For example, an ESP based in South-East Asia that provides EE products
and services across the region needs to overcome the following hurdles that lead to delays
and increased costs. Procuring visas for a multinational team adds to the timeline and cost
of the project. Additionally, for business visas ESPs require a letter of invitation, which
may be difficult to procure when making an initial sales pitch. Firms that do not have local
offices face additional hurdles during the measurement stage, as cross border transportation
of equipment may be difficult and only local contractors may be allowed to work on site.

20 Sector Study on Environmental Services: Energy Efficiency Businesses
The location of signing the contract may also affect the tax jurisdiction of the project,
adding costs and complexity. Uncertainty and delays may occur due to lack of clarity of
import tariff on pre-programmed equipment and different tariffs on provision of goods and
services and customs clearance may add to the delay. Cross-border payments, rules on
permanent establishment, tax withholding, and capital requirements for incorporation in
multiple economies are additional barriers faced by smaller ESPs (BBP Singapore, 2017).

3. EE TECHNOLOGIES
In Section 3, we review trends in energy efficient technologies in buildings, industry, transport
and the power sector.
A. TRENDS IN EE TECHNOLOGIES
This section details the technology trends in the buildings, industrial, transport and power
sectors and case studies of applications of these technologies. Table 3.1 summarizes the EE
measures that are applicable to the relevant sectors.
Table 3.1 EE Sectors and Measures
Sector EE Measures
Residential and
Commercial
buildings
• Efficient lighting, HVAC and appliances
• Adjustments in use patterns
• Using appropriate construction materials for new and
retrofitted buildings
• Maintenance and monitoring
Industrial • Data collection, regular analysis of energy performance
• Combustion control and instrumentation of boilers and
furnaces
• Minimize heat loss in industrial processes
• Waste heat recovery
• Installing efficient motors, boilers, pumps, fans
Transport • Vehicle-to-Grid system
Power Sector • Distributed generation: District Cooling and Heating
• Smart Grid: Big data, smart meters
i. Buildings
Buildings account for 30-40% of total energy consumption in most economies (IEA, 2017).
Within buildings, the major energy applications and new technologies in these areas are
provided in Table 3.2 below:

22 Sector Study on Environmental Services: Energy Efficiency Businesses
Table 3.2 Emerging Efficient Technologies in Residential and Commercial Buildings
End use Technology Description
Nearly Net Zero
Energy Building
(NZEB)
Green Building
Materials
An NZEB is a building where the annual
energy used by the building is close to the amount
of renewable energy created on the site. NZEB
requires integration between building design
(location, materials, envelope, insulation) and use
(heating, ventilation and air conditioning
(HVAC), lighting, appliances). New green
building materials include bioplastics, structural
3D printing, cool roof paints, window coatings,
unconventional insulation materials etc.
HVAC Heat Pumps These have the technical potential to save 50% of
energy used by conventional HVAC technologies
in residential buildings. New technologies include
heat exchangers, advanced refrigerators, air
conditioners and clothes dryers that generate
waste heat, and non-vapor compression
technologies (EERE, 2017)
Lighting Solid State
Lighting
As use of LEDs, OLEDs and PLEDs 6 rises,
energy savings of 75%, lower maintenance and
more uniform light distribution can be achieved
(EERE, 2017) . Sensors for daylight and
occupancy, use of a Building Monitoring System
and lighting connected via IoT can improve
productivity and efficiency.
Appliances Internet of Things
(IoT)
Smart homes and lighting automation are all
expected to occur as appliances become
connected to the internet. Using applications,
these could lead to lower energy consumption.
However, mains-connected IoT appliances may
consume additional stand-by power in order to
always remain online (IEA, 2016).
Appliances Behavior Based
Energy Efficiency
(BBEE)
BBEE programs achieve energy savings due to
changes in individual or organizational behavior.
Examples include providing residential
consumers with information on their energy use,
comparisons with usage of others, goal setting
and rewards. Another example- helping
commercial end-users benchmark their building’s
energy use and improve operating performance
through changes to O&M practices. Sources: IEA (2016), EERE (2017), and EERE (2017)
6 Light emitting diode (LED), organic light emitting diode (OLED), polymer LED (PLED).

EE Technologies 23
Case Study: Heat Pump and Solar in Australia
The city of Sydney sponsored a study to test the optimum energy saving option for water
heating and lighting common areas in residential buildings. In a 5-storey residential building
that had an existing gas water heating system and some roof, a comparative study of solar
PV, solar thermal, gas and heat pump was conducted. Given the existing conditions (rising
gas prices, local climatic conditions, small area available for solar panels), installing an
electric heat pump system with 10kW solar PV panels was found to be the optimum solution
for lighting and heating in the common area, leading to a 26% reduction in electricity bills.
Combining a heat pump with the gas water heating system allowed slow heating of water
and the use of off-peak hours to heat water. If such a system were widespread, by absorbing
warm air, it would also make a dent in the urban heat island effect7 (Edmunds, 2017). Figure
3.1 shows the working of a heat pump.
Figure 3.1 Diagram of Heat Pump
Source: Energy Rating Australia (2017)
7 The urban heat island effect is when temperatures of an urban area are 1-2 degrees Celsius higher than the
temperature in neighbouring rural areas, mainly due to modification of land surfaces and waste heat generated
from energy use.
Electronic controller
Heat pump storage tank Hot water
outlet
Cold water inlet
Tempered water to appliances

24 Sector Study on Environmental Services: Energy Efficiency Businesses
Case Study: Insulation using unconventional materials
Building insulation helps keep energy bills low, by maintaining the desired conditions
indoors. Conventional building insulation is made of petrochemicals, or from natural sources
that require high energy consumption to produce (glass and rock wools). In addition, it may
be linked to health hazards. Research on low-cost, unconventional materials that provide
thermal and acoustic insulation, with low embodied energy and easy end-of-life disposal are
included in Figure 3.2.
Figure 3.2 Unconventional Energy Efficient Building Materials
Source: Francesco Asdrubalia (2015)
While the value of these insulation materials has been recognized, they require more research
on durability, fire resistance, water vapour diffusion and fungal resistance.
Unconventional Materials
Natural Recycled
Glass foam
Plastics
Textile fibers
Others
Reeds
Bagesse
Cattail
Corn cob
Cotton
Date palm
Durian
Oil palm fiber
Pineapple leaves
Rice
Sensevieria fiber
Sunflower
Straw bale

EE Technologies 25
ii. Industry
In the industrial sector, energy is purchased, stored, treated and used in equipment, or in a
process, using oil, coal, gas, biomass or electricity. Energy end-uses include heating, cooling,
production processes, transport, pumping etc. The major industrial sectors in terms of energy
consumption are shown in Figure 3.3 below:
Case Study: Reducing energy consumption of IoT connected appliances
The Internet of Things (IoT) is a network of connected physical objects that are accessible
through the internet. IoT may have a number of applications, including enhancing energy
efficiency. However, having these devices always connected, even when not required for
their primary function requires stand-by power. Although the standby power consumption of
a single device is low, the impact of millions of connected devices is expected to be sizeable.
Table 3.3 has an estimate of standby power consumption of commonly used devices.
Table 3.3 Standby Power Consumed by IoT Devices
Category Device Average Standby Power
(W)
Smart Lighting Smart LED bulbs 1.0
Gateways 1.6
Home Automation Gateways 1.7
IP Camera 2.2
Mains connected Sensors 0.6
Mains connected Actuators 1.0
Smart Appliances Appliances 0.4
Gateway 1.6 Source: IEA (2016)
An analysis of existing communication technologies shows that appliances have a wide range
of levels of standby power consumption. Technologies with low standby power are already
established, mainly in battery-powered edge devices. The major energy saving standards for
power communication that already exist are IEEE 802.15.4, IEEE 802.3az (EE Ethernet,
Wake-on-LAN (WOL), Wi-Fi (IEEE 802.11). These standards need to be applied to mains-
connected appliances used in residential and commercial buildings (IEA, 2016).

26 Sector Study on Environmental Services: Energy Efficiency Businesses
Figure 3.3 Industrial Energy Use by Sector, 2004
Source: UNEP (2016)
Non-Specified, 16%
Chemical & Petrochem, 30%
Iron & Steel, 19%Non-Metallic Minerals, 9%
Paper & Pulp, 6%
Food & Tobacco, 5%
Non-Ferrous Metals, 4%
Machinery, 4%
Textile & …
Mining & Quarrying, 2%
Construction, 1%
Wod & Wood Products, 1%
Transport Equipment, 1%

EE Technologies 27
Case Study: EE Technologies in the Iron and Steel Sector
The iron and steel industry is the largest industrial energy consumer and share of energy as
a proportion of total cost is high, up to 40% of the cost of manufacturing steel (UNEP, 2016).
Some processes that steel manufacturers currently employ to increase energy efficiency
include- enhancing continuous production processes to reduce heat loss, recover waste
energy, design efficient electric arc furnaces, and carry out “near-net-shape casting”, which
is the production of items close to their final shape, rather than ingots that need to be rolled
and pressed as an additional energy-intensive step. Some specific measures and technologies
at different stages of iron and steel making to improve energy efficiency are in Table 3.4
below.
Table 3.4 Opportunities in Iron and Steel Sector for Energy Efficiency Improvement
Sub-
Sector/Product
Energy efficiency opportunities
Iron making -
blast furnace
Injection of pulverised coal
Injection of natural gas
Injection of oil
Injection of plastic waste
Injection of coke oven gas and
basic oxygen furnace gas
Charging carbon composite
agglomerates
Top pressure recovery turbines
Recovery of blast furnace gas
Top gas recycling
Improved blast furnace control
Slag heat recovery
Pre-heating of fuel for hot
stove
Improvement of combustion in
hot stove
Improved hot stove control
Steelmaking -
Basic oxide
furnace
Recovery of Basic Oxygen
Furnace (BOF)8 gas and
sensible heat
Variable speed drive on
ventilation fans
Ladle pre-heating
Improvement of process
monitoring and control
Efficient ladle heating program
Steelmaking –
Electric Arc
Furnace (EAF)
Variable speed drives
Oxy-fuel burners / lancing
Post combustion of flue gasses
Improving process control
Direct current are furnace
Scrap pre-heating
Visage injection
Air tight operation
Bottom stirring / gas injection
Casting and
refining
Integration of casting and rolling
Lade pre-heating
Tundish heating
Metal shaping Use efficient drive units
Gate communicated turn off inverters
Installation of automated lubrication system

28 Sector Study on Environmental Services: Energy Efficiency Businesses
Hot rolling Recuperative or regenerative
burners
Flameless burners
Controlling oxygen levels
Variable speed drives on
combustion air fans
Hot charging
Integration of casting and
rolling
Proper reheating temperature
Process control in hot strip mill
Heat recovery to the product
Waste heat recovery from
cooling water
Cold rolling Continuous annealing
Reducing losses on annealing
line
Reduced steam use in the acid
pickling line
Inter-electrode insulation in
electrolytic picking line
Source: UNEP (2016)
iii. Transport
Electric vehicles (EVs) represent one of the most promising technology pathways for reducing
oil use and CO2 emissions on a per-kilometer basis. With a moderately clean electric grid, EVs
can achieve emissions of 50 grams of CO2 per kilometer (IEA, 2010). EVs can also be an
independent distributed energy source for the electricity grid.
8 The gas produced in the BOF has a temperature of approximately 1200°C. The gas is produced intermittently,
its composition can vary hence many steel plants flare the gas. However, by recovering sensible and latent heat,
this process can become a net energy generator (IEA, 2007).
Latent and sensible heat are types of energy released. Latent heat is related to changes in phase between liquids,
gases, and solids. Sensible heat is related to changes in temperature of a gas or object with no change in phase
(NCSU, 2013).

EE Technologies 29
iv. Power Sector
1. Distributed Generation
When power is generated on site, rather than at a central location, it reduces the cost,
complexity and inefficiency of transmission and distribution. District heating and district
cooling are systems that carry out distributed generation of space heating, space cooling or hot
water. When buildings in an area are connected to a district heating or cooling system, they do
not require individual boilers or chillers. Renewable or other energy sources can be used in this
system and the system can result in energy savings ranging from 25 to 50%, depending on
system characteristics9. Specifically, the advantages of a district cooling system include:
Cost savings due to benefits of scale
Increase in efficiency due to reduced urban heat island effect from many split and window
air conditioners
Environmental benefits due to the use of a variety of energy sources, including renewable
energy and waste heat, lower use of harmful refrigerants and pollutants
Improved comfort and reliability within the buildings
However, developing district cooling faces challenges including gaining customer acceptance,
higher upfront investment, high cost of land for centralized cooling system and requirement of
coordination among several market participants.
9 The efficiency gains from a district heating or cooling system can vary greatly, depending on factors such as
climatic conditions affecting demand for heating/ cooling, heat/ cooling loss due to uninsulated buildings, whether
waste heat is used etc.
Case Study: Vehicle To Grid Charging Infrastructure
Electric-drive vehicles generate the energy and power electronics to produce 60-Hz AC
electricity, which can be used to power residences and offices. When this electricity flows
from cars to power lines, it is referred to as “vehicle-to-grid” (V2G) power. V2G
technology promotes clean and efficient energy powered transportation, by allowing
electric vehicles to power and be powered by the grid ( (Tugrul U. Daim, 2016)
A pilot project was conducted in the UK in 2016 to charge electric cars at times when
energy costs are low and release energy back into the grid when demand peaked, with a
reasonable economic return. Integrated energy company Enel and Japanese car
manufacturer Nissan conducted the project. These companies collaborated to develop an
energy management solution with a V2G recharging device that allows car owners as well
as energy users to operate as individual “energy hubs”, that are able to draw, store and
return electricity to the grid. As a part of the pilot, 100 V2G units were installed and
connected at locations agreed by private and fleet owners of Nissan Leaf and e-NV200
electric vans. This project, if scaled up, is expected to help the grid strengthen its ability to
handle distributed renewable energy, increasing the spread of renewable energy and
reducing the cost (ENEL, 2016).

30 Sector Study on Environmental Services: Energy Efficiency Businesses
Case Study: Potential for District Cooling in China
North America, Middle East, Europe, and Japan account for over 80% of the global district
cooling market. China’s district cooling at present is approximately 5.9 TWh and is expected
to increase rapidly, at the rate of 5.39 TWh annually, enabling it to match the size of the
North American market for district cooling by 2022 (ADB, 2017).
The district cooling market in China accelerated in the 11th 5-year plan period (2006-10) and
currently most tier I and II cities in China have some district cooling systems, primarily for
commercial and industrial complexes. Several district cooling plants in China rely on
trigeneration- combined cooling heat and power plants. Table 3.5 contains a snapshot of
some district cooling plants in China from 2001 onwards.
Table 3.5 Snapshot of China District Cooling Projects
Project Name Project Overview Status
Shanghai
Pudong
International
Airport
Inception year: 2001
Project owner: Shanghai International Airport Co.,
Ltd.
Type of owner: State-owned Enterprise
Total cooling load: 170 MW
Total cooling area: 1.07 million m2
Technology: CCHP
Cooling technology: Electric compressor chillers and
absorption chillers
Implemented
Sanya
Yalongwan
Inception year: 2011
Project owner: Huade Pengye Energy Investment
Co., Ltd.
Type of owner: Energy investor
Total cooling load: 31.24 MW
Total cooling area: 0.36 million m2
Overall technology: Pure cooling
Cooling technology: Electric chillers (23.7 MW)
combined with ice storage
Temperature: 3.3°/11° (supply/return)
The first-stage
project (8
of 11 hotels)
has been
implemented
Shenzheng
Qianhai
Inception year: 2015
Project owner: Shenzhen Qianhai Energy Investment
Co., Ltd
Type of owner: Energy investor
Total cooling load: 1,406 MW
Total cooling area: 27 million m2
Overall technology: Pure cooling
Cooling technology: Electric chillers combined
with ice storage
Ongoing
Source: ADB (2017)

EE Technologies 31
Currently, China does not have specific regulations, policies or government guidelines on
district cooling or heating and the existing systems are mainly market driven. Business models
for district cooling include:
An electricity or gas utility invests in district cooling, owns the assets, manages them and
provides district cooling to customers
Private firms and utilities act as co-investors
Private investors partner with utilities, the utility only provides the service. The utility
may work under an energy saving contract.
Real estate developers provide district cooling, in partnership with electricity and gas
utilities and the municipal government.
District cooling utilities in China are owned by private investors, asset managers, energy
services company (ESCOs) and comprise both domestic and international firms (ADB, 2017).
2. Smart Grids
A smart grid consists of four layers: hardware such as advanced metering and sensors; two-
way communications between utility and consumer, analytical software to process the data and
IT-enabled operational processes. A smart grid can offer substantial energy efficiency gains by
allowing consumers to better understand their energy use by using smart meters which help
utilities operate the grid more efficiently and reliably by analyzing second-by-second demand
data. Utilities can also reduce congestion during peak periods through demand response
programs and encouraging charging of plug-in electric vehicles during off-peak hours.
Case Study: Utilities, Smart Meters and Big Data
As the use of sensors, network communication and cloud computing rises, utilities, firms
and EE service providers are increasingly gathering large amounts of energy data. This
data can be used for power generation side management, microgrid and renewable energy
management, asset management and collaborative operation, and demand side
management (Kaile Zhou, 2016).
Utilities are moving from a single meter reading in a month to smart meter readings every
15 minutes, which means a 3000-fold increase in data. The data gathered from smart meters
can be used to analyze consumer stratification, behavior patterns and how pricing
influences usage. Big data can be used for granular forecasting and load planning,
improving the efficiency of generation and scheduling (IBM, 2012).
Oncor, a private utility in Texas installed over a million smart meters to access real time
energy usage. It provided this data to its consumers in real time, allowing them to see how
they consume energy and make changes to it. This resulted in energy savings of 5-10%.
Additionally, they installed sensors across their distribution network, to track and quickly
respond to power outages (IBM, 2013).

4. DEMAND DRIVERS AND OPPORTUNITIES FOR EE SERVICES
This section covers the demand drivers for EE services- including policies, economic
environment and social and environmental factors. This is followed by a discussion of the
opportunities facing the EE services sector in APEC.
A. DEMAND DRIVERS FOR EE SERVICES
The global ESP market is experiencing growth across the world, with only ESCOs (not
including other ESPs) valued at more than USD 24 billion in 2015 (IEA, 2016). Factors that
are driving demand for EE services across economies, include the policy environment,
economics, technology and social and environmental drivers.
i. Policy and Regulatory Environment
1. An economy’s energy efficiency target is a major driver for its public and private sector
to implement energy efficiency, giving a boost to the EE services industry. For example,
China set binding domestic targets for energy conservation and emissions reduction in the
11th (2006- 2010) and 12th ( 2011-2015) Five Year Plans. In the 12th Five Year Plan, energy
intensity of the economy was set a target of reducing by approximately 16% compared to
2010. The target was disaggregated to the province level, and large energy consumers were
the focus of local governments to achieve targets (IFC, 2012). These efforts built on the
successful Top-1,000 Program, which focused on the economy’s top 1,000 energy-
consuming enterprises. Because of this initiative, China cut its energy intensity by almost
20 percent between 2006 and 2010 - primarily through energy efficiency upgrades and by
closing obsolete facilities (ADB, 2013).
All APEC economies now have some form of energy efficiency target in place. Table 4.1
below highlights the main targets set by Governments in APEC economies and the expected
investment required to meet these targets.

Demand drivers and opportunities for EE services 33
Table 4.1 APEC EE Targets for 2020
Economy Energy Efficiency Targets, 2020 Required
Investment,
USD million
Brunei
Darussalam
Attain 25% reduction of energy intensity from 2005 level by
2030
48
Indonesia Decrease energy intensity by 1% annually and decrease
energy-GDP elasticity to below 1% by 2025
6
Malaysia Reduce final energy consumption in the industry, commercial
and residential sectors by 10% from 2011 to 2030, and reduce
final energy consumption of the transport sector by 1.4 ktoe
by 2030
901
The
Philippines
Reduce final energy consumption by 10% in all sectors from
2007 to 2014
601
Singapore Reduce energy intensity by 20% by 2020 and by 35% by 2030
from 2005 level
97
Thailand Reduce the energy intensity of GDP by 25% by 2030 relative
to Business as Usual (BAU)
2,006
Viet Nam Reduce energy consumption by 3%-5% by 2010 and by 5%-
8% by 2010-2015
649
China Reduce CO2 emissions per unit of GDP by 40%-45% from
2005 level by 2020
865,260
Source: ADB (2013)
2. ESP Funds
Creating specific funds for the EE Services sector is another driver that has promoted
demand in APEC economies. Funds designed to promote a domestic ESCO industry have
been used to support a sector at the nascent stage.

34 Sector Study on Environmental Services: Energy Efficiency Businesses
Case Study: Thailand ESCO Fund
Thailand’s Department of Alternative Energy Development and Efficiency (DEDE) created
an ESCO fund scheme in 2008 to target potential investors for small projects in energy
efficiency improvement and renewable energy development, mostly to be implemented by
small and medium enterprises.
The Energy for Environment Foundation (E for E) is currently designated to manage a
portion of the ESCO Venture Capital fund, while another portion is entrusted to the Energy
Conservation Foundation of Thailand. As of beginning of 2017, the results of ESCO fund
shows that promotion of energy conservation by ESCO mechanism has resulted in energy
savings of more than 3,338 million baht or 53.29 ktoe10. The fund contains the following sub
programs:
1. Equity Investment- The ESCO Fund will make equity investments in energy efficiency
or renewable energy projects. Investment criteria applied are: i) size of equity
investment: 10-50 percent of total investment cost but limited to THB 50 million (USD
1.5 million) per project; ii) investment period of 5-7 years; and iii) exit method of selling
back the shares to the entrepreneur, or find new strategic partners.
2. ESCO Venture Capital- The scheme will partner with ESCOs to raise capital for
investments in energy saving projects. Investment criteria applied are: i) size of equity
investment is 30 percent of registered capital but limited to THB 50 million (USD 1.5
million) per project; ii) investment period of 5-7 years; iii) exit method of selling back
the shares to the entrepreneur, or find new strategic partners and; iv) board seat is
required in the company.
3. Equipment Leasing- The leasing criteria include: i) 100 percent of equipment cost but
limited to THB 10 million (USD 300,000) per project; ii) repayment duration of 5 years;
and iii) interest rate of 4% per annum.
4. Carbon Credit Facility- The ESCO Fund will support project owners in developing CDM
documents and help to bundle small projects so that buyers are willing to purchase the
carbon credits from the projects.
5. Credit Guarantee Facility- The Fund will cooperate with financial institutions or credit
guarantee agencies to assist entrepreneurs in accessing long-term loans from banks by
providing a credit guarantee depending on the project risk and limited to THB 10 million
(USD 300,000) at a low premium rate.
6. Technical Assistance- The ESCO fund will provide financial support for technical
assistance, e.g. energy audit, feasibility study. The support is limited to THB 100,000 per
project and this support must be reimbursed to the ESCO Fund unless the proposed
technical solutions have been implemented.
Source: UNEP (2012)
10 Thai ESCO Association (http://thaiesco.org/2016/thai/activitydetail.aspx?id=85).

Demand drivers and opportunities for EE services 35
3. Tax incentives
Taxes and other fiscal benefits are the most common measure used by governments to
promote the energy efficiency improvements in an economy. Many APEC economies
already have policies and measures in place to promote the EE businesses, although their
effectiveness differs considerably and most are still evolving. There are considerable
variations between the incentive policies and measures employed throughout APEC.
Differences are apparent between developed and transition economies, Asian, Australasian
and North American economies, industrialized and agrarian economies.
Case Study: Thailand’s tax incentives for ESPs, manufacturers and consumers
Since 2006, Thailand has put in place the following policies to promote EE:
For ESPs11: Tax exemption on import duty of efficient equipment
For ESPs and EE equipment manufacturers: Corporate tax exemption for 8 years
For consumers: Lower corporate income tax for companies enhancing EE
(IEPD, 2016)
The incentives are monitored by the Department of Alternative Energy Development and
Efficiency (DEDE) under the Ministry of Energy. The tax incentives can be availed in the
following ways, listed in Table 4.2:
Table 4.2 Options for Seeking Benefits, Thailand
Type of Exemption sought Conditions Benefits
Cost-based Up to 50 million THB (1.5
million USD)
Corporate tax deduction
phased over 5 years, i.e.
25% tax break on
investment in EE
Performance-based Up to 2 million THB
(60,000 USD)
Performance to be audited
30% of savings value is
deductible for project
owners
Board of Investment Applicable to ESPs, EE
equipment manufacturers
ESPs must be approved by
Ministry of Energy before
submitting an application
Waiver on income and
import tax for 8 years
Source: IEPD (2016)
4. Other policies
Other government efforts include legislation (EE Acts, statutory standards and labelling),
demonstration projects or strategic support to the sector. Policy approaches vary, reflecting
different drivers across regions, economic and energy contexts, such as concerns over
energy imports and climate change in developed APEC economies and focus on energy
security and economic development among APEC economies in Southeast Asia.
The government agencies responsible for the promotion of the ESP industry in selected APEC
11 Only ESPs using performance contracting are eligible for the tax exemption.

36 Sector Study on Environmental Services: Energy Efficiency Businesses
economies are below:
China: National Development and Reform Commission (NDRC)
Indonesia: Ministry of Energy and Mineral Resources (KESDM)
Japan: Ministry of Economy, Trade and Industry (METI)
Korea: Korean Energy Management Corporation (KEMCO)
Malaysia: Ministry of Energy, Ministry of Finance
The Philippines: Department of Energy (DOE)
Singapore: National Environment Agency (NEA)
Thailand: Department of Alternative Energy Development and Efficiency (DEDE),
Ministry of Energy
United States: Department of Energy (DOE)
In a number of APEC economies, ESP associations are created and successfully cooperate with
dedicated government agencies. A list of ESP associations is provided in Appendix II.
Basic energy conservation legislation has been carried out in many economies at different times
such as China’s Energy Conservation Law, Japan’s Energy Conservation Law, Malaysia’s
Efficient Management of Electrical Energy Regulations, and Thailand’s Energy Conservation
Promotion Act. Energy-saving standards have been established based on the development of
these laws. Most of them closely relate to the business growth of ESCO industry.
In the United States, related laws on energy conservation such as The Energy Policy and
Conservation Act of 1975 (EPCA), National Energy Conservation Policy Act of 1978
(NECPA), and The Energy Policy Act of 1992 (EPAct) were implemented, and Executive
Order 13123, 1999 was used to promote public facilities which is the main market in the United
States. An Executive Order issued in 2012 helps meet the national goal of deploying 40
gigawatts of new, cost-effective industrial combined heat and power (CHP) by the end of 2020.
CHP involves recovering the heat normally lost in power generation and using it to provide
useful thermal energy to businesses and factories. If achieved, this goal will help generate
significant amount of electricity over their entire lifetime (White House, 2012).
A successful mix of information provision and regulation has played a leading role in
stimulating the energy efficiency market in Japan. Measures developed include: standards and
labelling for a range of products (including light-duty vehicles, new buildings, appliances,
lighting and other equipment used in the commercial and industrial sectors); providing access
to energy assessments and to preferential financing; and energy efficiency obligations placed
on energy suppliers. Assessments of these programs show that most have had a positive impact
on the size of national energy efficiency markets.

Demand drivers and opportunities for EE services 37
Case Study: South Korea’s mix of Policy and Financial Support
The South Korean government helped the nascent EE service industry through measures
such as
Retooling its Energy Act in order to financially support ESCOs
Providing tax credits for ESCO projects
Grating long term, low interest loans to ESCO projects
Providing loans through Korea Energy Management Corporation (KEMCO) using
surcharges on import and/or sale of oil and some petroleum products
However, studies have shown that despite receiving financial support, the ESCO industry of
Korea grew only after institutional barriers (Government procurement procedures,
budgeting, accounting laws to allow multi-year contracts) were removed in 1998 (Ellis,
2010).
ii. Economic Drivers
Energy prices are one of the key factors driving expansion of the energy efficiency market in
APEC economies. Historically, sustained high energy prices have triggered energy-saving
activity. Over the past decade, increases in global oil prices have stimulated technological
innovation and enhanced efficiency in various sectors within most APEC member economies,
which will continue to deliver energy savings in coming years. These high prices have also
created the political space to develop and implement policies that reduce market barriers that
impede energy efficiency investments. Energy prices and the presence (or absence) of
transparent and dynamic price signals can facilitate or hinder investment in energy efficiency.
For example, various fossil fuel subsidies distort price signals, lowering the demand for energy
efficiency by artificially reducing the price consumers pay for energy. However, other barriers
to energy efficiency mean that transparent pricing alone does not directly lead to an optimal
level of energy efficiency investment.
iii. Technology Drivers
Rapid advancements in technology (described in Section 3.1 Technology Trends in EE) are
leading to a rise in demand for EE services, as energy end-users lack the expertise to identify
appropriate energy saving technologies, estimate savings and assess costs and benefits. This is
particularly true for public institutions such as hospitals and schools (IFC, 2012). The process
followed by ESPs described in Table 4.3 shows the technical, financial and other skills that are
required to successfully implement an EE project.
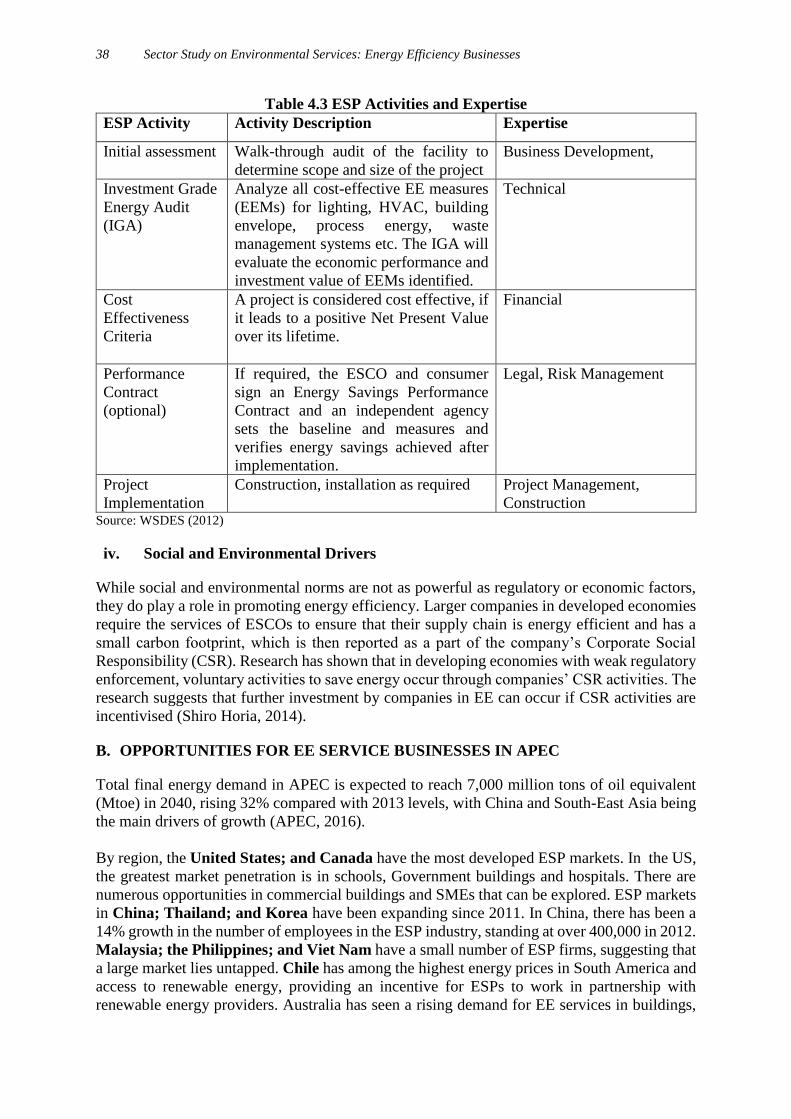
38 Sector Study on Environmental Services: Energy Efficiency Businesses
Table 4.3 ESP Activities and Expertise
ESP Activity Activity Description Expertise
Initial assessment
Walk-through audit of the facility to
determine scope and size of the project
Business Development,
Investment Grade
Energy Audit
(IGA)
Analyze all cost-effective EE measures
(EEMs) for lighting, HVAC, building
envelope, process energy, waste
management systems etc. The IGA will
evaluate the economic performance and
investment value of EEMs identified.
Technical
Cost
Effectiveness
Criteria
A project is considered cost effective, if
it leads to a positive Net Present Value
over its lifetime.
Financial
Performance
Contract
(optional)
If required, the ESCO and consumer
sign an Energy Savings Performance
Contract and an independent agency
sets the baseline and measures and
verifies energy savings achieved after
implementation.
Legal, Risk Management
Project
Implementation
Construction, installation as required Project Management,
Construction Source: WSDES (2012)
iv. Social and Environmental Drivers
While social and environmental norms are not as powerful as regulatory or economic factors,
they do play a role in promoting energy efficiency. Larger companies in developed economies
require the services of ESCOs to ensure that their supply chain is energy efficient and has a
small carbon footprint, which is then reported as a part of the company’s Corporate Social
Responsibility (CSR). Research has shown that in developing economies with weak regulatory
enforcement, voluntary activities to save energy occur through companies’ CSR activities. The
research suggests that further investment by companies in EE can occur if CSR activities are
incentivised (Shiro Horia, 2014).
B. OPPORTUNITIES FOR EE SERVICE BUSINESSES IN APEC
Total final energy demand in APEC is expected to reach 7,000 million tons of oil equivalent
(Mtoe) in 2040, rising 32% compared with 2013 levels, with China and South-East Asia being
the main drivers of growth (APEC, 2016).
By region, the United States; and Canada have the most developed ESP markets. In the US,
the greatest market penetration is in schools, Government buildings and hospitals. There are
numerous opportunities in commercial buildings and SMEs that can be explored. ESP markets
in China; Thailand; and Korea have been expanding since 2011. In China, there has been a
14% growth in the number of employees in the ESP industry, standing at over 400,000 in 2012.
Malaysia; the Philippines; and Viet Nam have a small number of ESP firms, suggesting that
a large market lies untapped. Chile has among the highest energy prices in South America and
access to renewable energy, providing an incentive for ESPs to work in partnership with
renewable energy providers. Australia has seen a rising demand for EE services in buildings,

Demand drivers and opportunities for EE services 39
stimulated by the government’s certification and rating schemes (European Commission,
2014).
Based on the demand and technology trends discussed in the section above, Table 4.4
summarises the opportunities for ESPs in APEC by sector.
Table 4.4 Opportunities for ESPs in APEC by Sector and Technology
Sectors Energy
demand,
2013
Policy Drivers Technologies Opportunities
for ESPs
Buildings 31% Minimum Energy
Performance
Standards
(MEPS)
Building Codes
Insulation HVAC
improvements
IoT
Opportunities in
growing
commercial
sector- e.g. BPOs
in the Philippines
Industry 33% Mandatory energy
auditing
(Australia)
Requirement for
large units to have
energy managers,
Minimising heat
losses
Heat recovery
through
exchangers
Right sizing
motors
Less energy
intensive sectors
such as
construction,
electronics and
food products
Transport 26% Subsidies for new
technologies
(Japan) Green
vehicle subsidy
and tax on high
consumption
vehicles (United
States; and Hong
Kong, China )
Improving fuel
efficiency
Opportunities to
partner with
utilities for smart
charging, V2G
Power ---12 Creating energy
districts (Russia;
and Hong Kong,
China)
District heating
and cooling,
smart grid
Act as district
cooling utility
Source: APEC (2016), APERC (2016)
12 Energy demand in the power sector is part of the industrial sector.

5. CONCLUSION
APEC economies are increasing their energy use to meet population growth and rising
standards of living. APEC economies have set a target of decreasing the energy intensity by
45% from 2005 to 2035 (APEC, 2013). In order to meet this target, the use of energy efficiency
products and services needs to register sharp growth. Some economies in APEC are a
manufacturing hub for EE products (lights, ACs, other appliances), while others have a robust
ESP sector that carries out activities such as Investment Grade Audits, building retrofits using
a performance contracting or consultancy model. The aim of this report is to highlight the trends
in demand and technology for EE services, note the existing policy framework and lay out
challenges and opportunities for the sector in APEC. To summarize:
Key trends in EE technology:
Efficient building materials
Reducing energy consumption of IoT- connected appliances
Industry-specific efficiency technologies
Vehicle To Grid
Distributed Power Generation
Key drivers for EE in APEC economies:
National policies and priorities on energy intensity
Structural factors such as share of industrial sector in economy, innovation, supply chain
Energy efficiency infrastructure including prevalence of energy management system,
presence of ESPs and EE equipment manufacturing firms
Availability of finance for efficiency improvements to end-users and ESPs
EE Services cover a variety of business models, from consulting to performance contracting.
Across economies, they are a part of different industries, under UN CPC 94, including
1710 - Electrical Energy
512 - Construction work for buildings
513 - Construction work for civil engineering
514 - Assembly and erection of prefabricated constructions
516 - Installation work
517 - Building completion and finishing work
811 - Financial intermediation services, except insurance and pension fund services
831 - Leasing or rental services concerning machinery and equipment without operator
867 - Architectural, engineering and other technical services
879 - Other business services
94090 - Other environmental protection services
APEC officials have endorsed the Environmental Services Action Plan (ESAP) in the
September 2015 meeting in Cebu, the Philippines. In November 2016, APEC published its

Conclusion 41
Survey of Regulatory Measures in Environmental Services, covering the following
environmental services under UN CPC 94:
941 - Sewerage, sewage treatment and septic tank cleaning services
942 - Waste collection services
943 - Waste treatment and disposal services
944 - Remediation services
945 - Sanitation and similar services
949 - Other environmental protection services
This report on EE services in APEC marks the first step to consider and study a wider range of
environmental services beyond CPC 94, as a part of “Other Environmental Service”.

APPENDIX I: MAJOR EE MARKET PLAYERS IN APEC
Thailand
Company Description
Energy Design
Concept
Services provided: technology and equipment and consultancy.
Authorised capital 55 million baht.
Technology tie ups with Electrolux, Optilux
Energy
Conservation
Systems Thailand
Services provided: technology and equipment, installation,
maintenance and equipment servicing, consultancy
Authorised capital: 50 million baht
Technology tie ups with Broad, Altivar, Powerlogic
Elyo/ Cofely Services provided: technology and equipment, installation,
maintenance and equipment servicing, consultancy
Authorised capital: 50 million baht
Technology tie ups with Sullair, Carrier, Kaeser, Atlas Copco,
Hiross
BTM Engineering Services provided: installation, maintenance and equipment
servicing
Authorised capital: 20 million baht
Technology tie ups with Trane, York, Hitachi
Guarantee Company
Engineering
Services provided: technology and equipment, installation,
maintenance and equipment servicing, consultancy
Authorised capital: 50 million baht
Focus on industrial and commercial sector
Excellent Energy
International
Services provided: technology and equipment
Authorised capital: 25 million baht
Technology tie ups with Carrier, ECM
Chamnankankij
Engineering
Services provided: installation, maintenance and equipment
servicing
Authorised capital: 20 million baht
Attain Engineering
and Energy
Services provided installation, maintenance and equipment servicing
Authorised capital: 10 million baht
Technology tie ups with EMK, KEB Inverters
Energica Services provided:installation, maintenance and equipment
servicing
Authorised capital: 10 million baht
Technology tie ups with Man Gas Engines, Tethys Instruments Source: Thai ESCO (2011)

Appendix I: Major EE Market Players in APEC 43
United States
Company Description
ABM Industries Leading provider of end-to-end facility solutions with revenues of
approximately $5.0 billion.
AECOM
McKinstry
Metrus Energy
Ameresco
Provider of advisory and infrastructure asses for governments,
businesses and organizations. Develops and finances large-scale
energy efficiency projects
Energy Systems
Group
Leading energy services provider that specializes in energy
efficiency, sustainability, and infrastructure improvement solutions.
Siemens Industry
Schneider Electric
Johnson Controls
Leading provider of energy and environmental solutions, building
controls, fire safety and security systems solutions.
AMERESCO
ConEdison Solution
Leading independent provider of energy efficiency, infrastructure
upgrades, asset sustainability and renewable energy solutions.
Honeywell
International
SCIenergy
Leader in the Internet of Things (IoT) and creates products, software
and technologies for building management solutions
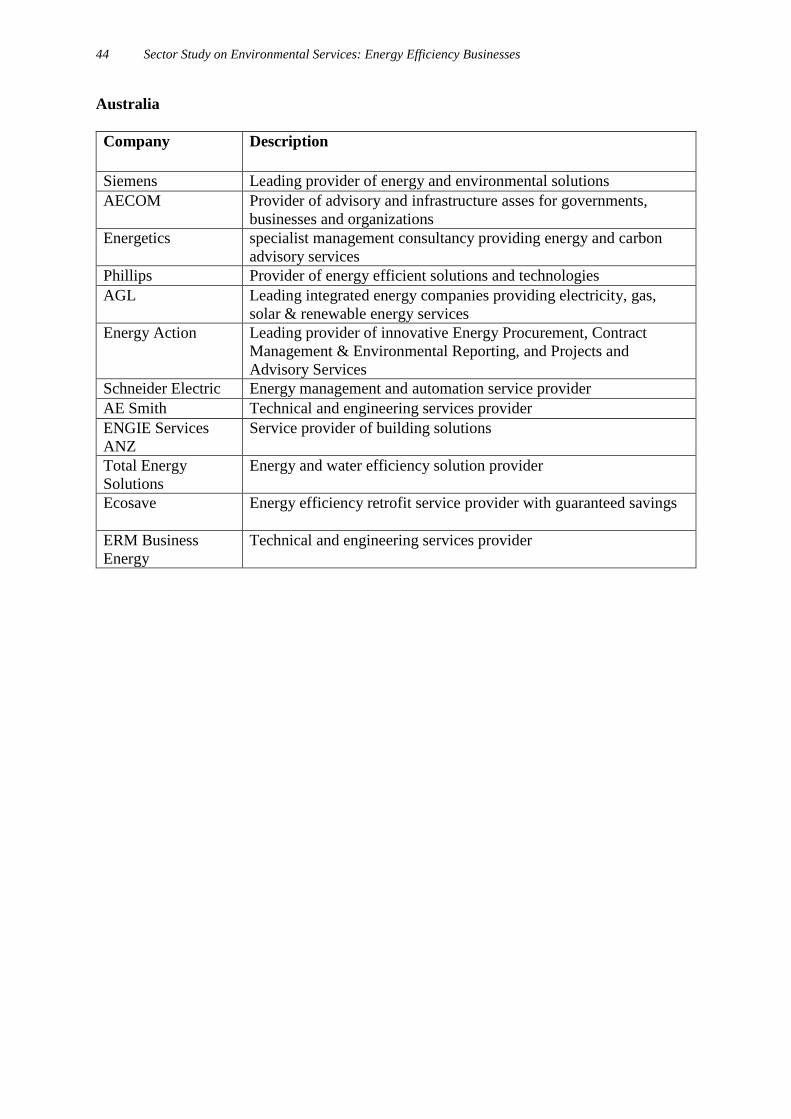
44 Sector Study on Environmental Services: Energy Efficiency Businesses
Australia
Company Description
Siemens Leading provider of energy and environmental solutions
AECOM
Provider of advisory and infrastructure asses for governments,
businesses and organizations
Energetics
specialist management consultancy providing energy and carbon
advisory services
Phillips Provider of energy efficient solutions and technologies
AGL
Leading integrated energy companies providing electricity, gas,
solar & renewable energy services
Energy Action
Leading provider of innovative Energy Procurement, Contract
Management & Environmental Reporting, and Projects and
Advisory Services
Schneider Electric Energy management and automation service provider
AE Smith Technical and engineering services provider
ENGIE Services
ANZ
Service provider of building solutions
Total Energy
Solutions
Energy and water efficiency solution provider
Ecosave
Energy efficiency retrofit service provider with guaranteed savings
ERM Business
Energy
Technical and engineering services provider
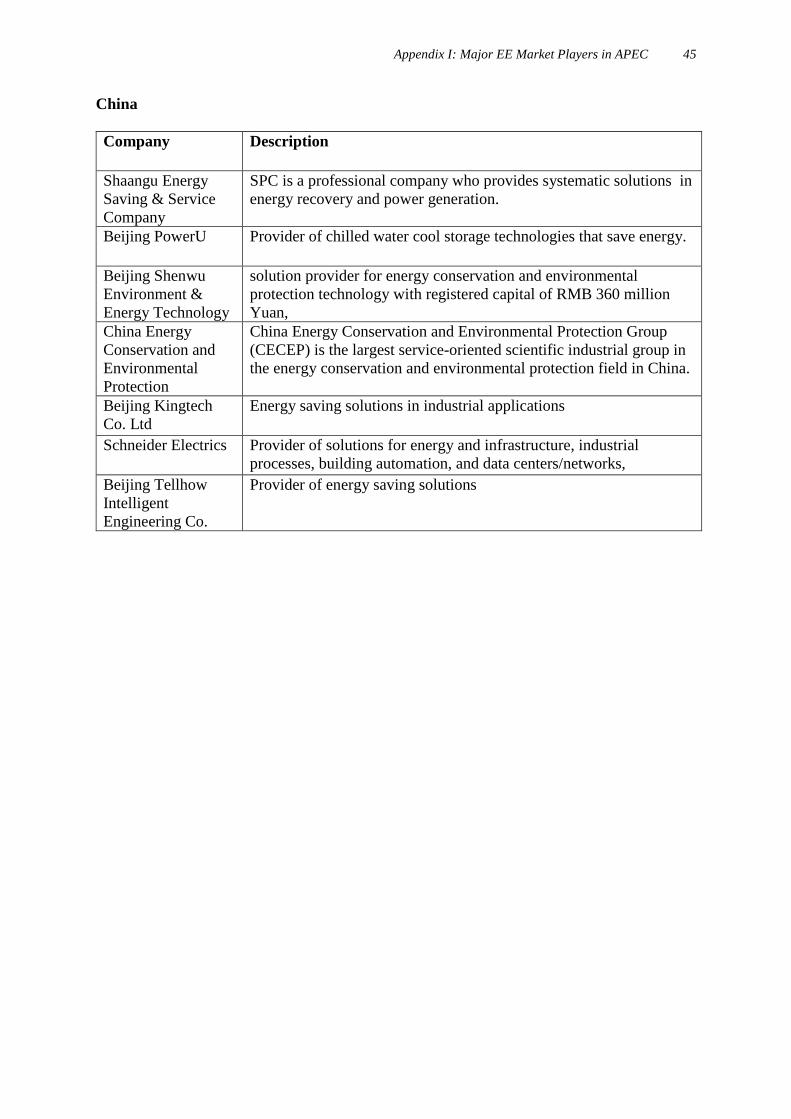
Appendix I: Major EE Market Players in APEC 45
China
Company Description
Shaangu Energy
Saving & Service
Company
SPC is a professional company who provides systematic solutions in
energy recovery and power generation.
Beijing PowerU Provider of chilled water cool storage technologies that save energy.
Beijing Shenwu
Environment &
Energy Technology
solution provider for energy conservation and environmental
protection technology with registered capital of RMB 360 million
Yuan,
China Energy
Conservation and
Environmental
Protection
China Energy Conservation and Environmental Protection Group
(CECEP) is the largest service-oriented scientific industrial group in
the energy conservation and environmental protection field in China.
Beijing Kingtech
Co. Ltd
Energy saving solutions in industrial applications
Schneider Electrics Provider of solutions for energy and infrastructure, industrial
processes, building automation, and data centers/networks,
Beijing Tellhow
Intelligent
Engineering Co.
Provider of energy saving solutions

APPENDIX II: ESP ASSOCIATIONS IN APEC
Economy ESCO Association
Australia Australasian Energy Performance Contracting Association (AEPCA)
Canada Energy Services Association of Canada
Chile National Association of Energy Efficiency Companies Chile
(ANESCO Chile)
China China Energy Management Company Association (EMCA)
Hong Kong, China Hong Kong Association of Energy Service Companies (HAESCO)
Indonesia Indonesia ESCO Association
Japan Japan Association of Energy Service Companies (JAESCO)
Korea Korean Association of ESCO Companies (KAESCO)
Malaysia Malaysia Association of Energy Service Companies (MAESA)
Mexico Mexican Association of Companies ESCO (AMESCO)
The Philippines ESCO Association of the Philippines (ESCO Phil)
United States National Association of Energy Efficiency Companies (NAESCO)
Source: European Commission (2014)

APPENDIX III. MAJOR MANUFACTURERS OF EE EQUIPMENT IN
APEC ECONOMIES
APEC
Economies
Lighting HVAC
(Market share)
Building Management
Systems
Thailand Asia Lamp Industry
Company Limited13;
L&E14; Panasonic;
Phillips; Osram; GE;
Racer Electric Thailand
Co., Ltd.15
Mitsubishi (34%);
LG (19%);
Panasonic (17%);
Others (30)16;
Cisco;
Honeywell;
Johnson Controls;
Schneider Electric;
United Technologies
The
Philippines
Philips;
GE;
OSRAM;
Omni;
Firefly;
Akari, Toshiba;
Starlux; Econowatt17;
Concepcion (53%);
Panasonic (20%);
Fedders (12%);
Other (15%)18;
China Philips; General
Electric and Osram;
NVC; TCL; Foshan
Lighting; Yankon
Energetic Lighting and
Opple;
Chigo; Midea; Gree;
Changhong; TCL and
Hisense;
United
States
Philips;
GE;
OSRAM
Carrier (17%);
Daikin (15%);
Trane (10%);
York (9%);
(Statista, 2017)
Viet Nam Rang Dong;
Dien Quang;
Phillips;
Panasonic (26.7%);
Daikin (21.6%)19;
Malaysia LG; Panasonic and
York; 20 %
manufactured locally20;
Singapore Daikin and Mitsubishi
(60%); Panasonic;
13 Asia Lamp Industry Company Limited – also original equipment manufacturer (OEM) for other brands 14 Lighting & Equipment Public Company Limited - L&E – also original equipment manufacturer (OEM) for
other brands 15 Racer Electric Thailand Co., Ltd. - also original equipment manufacturer (OEM) for other brands 16 Marketeer, 2016 17 All lighting products sold in the Philippines are mainly imported from China; India; and Viet Nam.
Information source: IIEC Retail survey (2015) 18 The ASEAN SHINE program 19 Manufacturers survey conducted by the International Copper Association 20 ASEAN Shine

48 Sector Study on Environmental Services: Energy Efficiency Businesses
APEC
Economies
Lighting HVAC
(Market share)
Building Management
Systems
Fujitsu General; Mhi;
(Jarn, 2013)
Korea LG and Samsung (80%)
(Jarn, year)
Indonesia Philips; Panasonic;
Osram; Ge; Toshiba;
Sylvania; Indomaret;
Shukaku; Cosmos21;
21 80% imported from China. (Manoppo, J. (2016). Fact & Figures: Lighting in Indonesia Today. Jakarta:
Asosiasi Industri Perlampuan Listrik Indonesia (APERLINDO - Indonesian Electrical Lighting Industry
Association)

BIBLIOGRAPHY
ACEEE. (2016). The International Energy Efficiency Scorecard. Retrieved from American
Council for Energy Efficient Economy : http://aceee.org/portal/national-
policy/international-scorecard
ADB. (2013). Accelerating Energy Efficiency in Asia. ADB.
ADB. (2017). District Cooling in the People’s Republic of China. ADB.
APEC. (2013). APEC Energy Demand and Supply Outlook 5th Edition. APERC.
APEC. (2016). APEC Energy Demand And Supply Outlook 6th Edition. Tokyo, Japan: Asia
Pacific Energy Research Centre.
APERC. (2016). APEC Energy Demand and Supply Outlook 6th Edition. Tokyo: APERC.
APERC. (2016). Compendium of Energy Efficiency Policies of APEC Economies. Tokyo,
Japan: Asia Pacific Energy Research Centre.
BBP Singapore. (2017). Energy Efficiency Business. APEC Workshop on Environmental
Services. Hanoi: APEC.
CCAP. (2012). Retrieved from Center for Clean Air Policy: http://ccap.org/assets/Success-
Stories-in-Building-Energy-Efficiency_CCAP.pdf
CenterPoint Energy. (2015). 2016 Commercial and Industrial Standard Offer Program:
Program Manual. Houston. Retrieved from http://www.centerpointenergy.com/en-
us/Documents/2016%20CenterPoint%20Energy%20Commercial%20Standard%20Of
fer%20Program%20Manual.pdf
Charles Goldman, N. H. (2005). Review of US ESCO industry market trends: an empirical
analysis of project data. Energy Policy, 387-405.
Columbia University. (2014). Private Sector Financing and Public-Private Partnerships for
Financing Clean Energy. New York, USA: Columbia University. Retrieved from
http://spm.ei.columbia.edu/files/2014/09/SPM_Probst_FinancingCleanEnergy.pdf
Edmunds, S. (2017, February 16). Retrieved from The FIfth Estate:
http://www.thefifthestate.com.au/innovation/case-studies/case-study-why-heat-
pumps-now-trump-gas-hot-water/88782
EERE. (2017). HVAC, Water Heating and Appliances. Retrieved from Office of Energy
Efficiency and Renewable Energy: https://energy.gov/eere/buildings/hvac-water-
heating-and-appliances
EERE. (2017). Solid State Lighting. Retrieved from Office of Energy Efficiency and
Renewable Energy: http://www1.eere.energy.gov/buildings/ssl/
Ellis, J. (2010). Energy Service Companies in Developing Countries. IISD.
ENEL. (2016). NISSAN AND ENEL LAUNCH GROUNDBREAKING VEHICLE-TO-GRID
PROJECT IN THE UK. Retrieved 2017, from
https://www.enel.it/en/media/press/d201605-nissan-and-enel-launch-groundbreaking-
vehicle-to-grid-project-in-the-uk.html
Energy Commission. (2017). List of Registered Energy Service Companies. Retrieved from
Suruhanjaya Tenaga: http://www.st.gov.my/index.php/en/consumer/electricity/list-of-
registered-energy-service-company-esco
Energy Rating Australia. (2017). Retrieved from Energy Rating Australia:
http://www.energyrating.gov.au/products/water-heaters/heat-pump-water-heaters
EPA. (2009). Effi ciency as a Low-Cost Resource for Achieving Carbon Emissions Reductions.
Washington, D.C.: Environmental Protection Agency.
ESMAP. (2010). Public Procurement of Energy Efficiency Services. ESMAP.
50 Sector Study on Environmental Services: Energy Efficiency Businesses
European Commission. (2003). The Role of ESCOs and M&V in Promoting Energy Efficiency.
Retrieved from http://www.unido.org/fileadmin/import/18585_Bertoldi.pdf
European Commission. (2014). ESCO Market Report for Non-European Countries.
Luxembourg: European Commission Joint Research Center.
Francesco Asdrubalia, F. D. (2015). A review of unconventional sustainable building insulation
materials. Sustainable Materials and Technologies, 1-17.
Hyein Yi, S. L. (2017). An ESCO Business Model Using CER for Buildings’ Energy Retrofit.
Sustainability.
IBM. (2012). Managing big data for smart grids and smart meters.
IBM. (2013). Oncor Electric (video). Retrieved from Energy and Utility Case Studies:
https://www-935.ibm.com/industries/ae/energy/case_studies.html
IEA. (2007). Tracking Industrial Energy Efficiency and CO2 Emissions. IEA.
IEA. (2010). Energy Technology Perspective . IEA.
IEA. (2016). Energy Efficiency of the Internet of Things. Lucerne, Switzerland: IEA.
IEA. (2016). nergy Efficiency of the Internet of Things, Technology and Energy Assessment
Report. Lucerne, Switzerland: IEA.
IEA. (2017). World Energy Investment 2017. Retrieved from International Energy Association:
https://www.iea.org/publications/wei2017/
IEPD. (2016). Thailand Tax Incentives. Retrieved from Industrial Efficient Policy Database:
http://iepd.iipnetwork.org/policy/tax-incentives
IFC. (2005). The ELI Story: Transforming Markets for Efficient Lighting. Retrieved from
International Finance Corporation:
https://www.ifc.org/wps/wcm/connect/16dcf40048855431b1ccf36a6515bb18/ELI_FI
NAL.PDF?MOD=AJPERES&CACHEID=16dcf40048855431b1ccf36a6515bb18
IFC. (2012). China Energy Servicce Company (ESCO) Market Study.
IFC. (2012). IFC and Small and Medium Enterprises. Retrieved from
http://www.ifc.org/wps/wcm/connect/277d1680486a831abec2fff995bd23db/AM11IF
C+IssueBrief_SME.pdf?MOD=AJPERES
Kaile Zhou, C. F. (2016). Big data driven smart energy management: From big data to big
insights. Renewable and Sustainable Energy Reviews, 215-225.
LBNL. (2016). U.S. Energy Service Company (ESCO) Industry: Recent Market Trends.
Berkely, USA: Lawrence Berkely National Laboratory.
Limaye, D. (2010). The Energy Efficiency Power Plant: Concepts, Benefits and
Implementation Strategies. Retrieved from MERC:
http://www.mercindia.org.in/pdf/DSM%20Presentation/Presentation_By_Mr.%20Dili
p%20Limaye_011910.pdf
Mahesh Patankar, I. (2017, May 11). Retrieved from Pacific Economic Cooperation Council:
https://www.pecc.org/resources/minerals-a-energy/2467-energy-efficiency-business-
in-apec/file
MP Ensystems & IIEC . (2017). Research on Energy Efficiency (unpublished). Mumbai, India.
NCSU. (2013, May 17). Retrieved from North Carolina State University:
http://climate.ncsu.edu/edu/health/health.lsheat
OECD, IEA. (2010). Energy Technology Perspectives. Paris: OECD/IEA.
RSB. (2017). Supervisory Bureau for Electricity & Water . Retrieved from Government of
Dubai: http://www.rsbdubai.gov.ae/esco/
Shiro Horia, M. S. (2014). The role of CSR in promoting companies’ energy-saving actions in
two Asian cities. Energy Policy, 116-121.
Strahil Panev, N. L. (2014). ESCO Market Report for Non-European Countries 2013.
Luxembourg: European Commission.
Thai ESCO. (2011). The ESCO Information Center thailand. Retrieved from thaiesco.org

Bibliography 51
Tugrul U. Daim, X. W. (2016). Technology roadmap for smart electric vehicle-to-grid (V2G)
of residential chargers. Journal of Innovation and.
UNECE. (2014, June 24). Retrieved from UNECE:
https://www.unece.org/fileadmin/DAM/energy/se/pp/gee21/Worshop_Bangkok_April
_14/Session_7d_Vejakit.pdf
UNEP. (2012). Case Study: The Thai Energy Efficiency Revolving Fund. Frankfurt: UNEP,
Frankfurt School of Finance & Management .
UNEP. (2016). Best Practices and Case Studies Case Studies for Industrial Energy Efficiency
Improvement - An Introduction for Policy Makers. Copenhagen, Denmark:
Copenhagen Center on Energy Efficienccy.
UNStats. (2017). Central Product Classification (CPC) Ver.2.1. Retrieved from United
Nations Stats Division.
White House. (2012, August 30). Executive Order -- Accelerating Investment in Industrial
Energy Efficiency.
World Bank. (2009). Large-Scale Residential Energy Efficiency Programs Based on CFLs.
Retrieved from esmap.org: http://www.esmap.org/sites/default/files/esmap-
files/216201021421_CFL_Toolkit_Web_Version_021610_REVISED.pdf
World Bank. (2010). Public Procurement of Energy Efficiency Services. Washington D.C.:
World Bank .
World Business Council for Sustainable Development. (2015). A Review of Building Energy
Efficiency Development in Indonesia. Retrieved from http://wbcsdpublications.org/wp-
content/uploads/2015/12/Market-review-Indonesia.pdf
WSDES. (2012). Retrieved from Washington State Department of Enterprise Services:
http://des.wa.gov/sites/default/files/public/documents/Facilities/EPC/ESPCProgramPr
ocessDescription.pdf

ABBREVIATIONS
ACEEE American Council for an Energy Efficient Economy
APEC Asia-Pacific Economic Cooperation Secretariat
ASEAN Association of Southeast Asian Nations
BBEE Behavior Based Energy Efficiency
BEE Bureau of Energy Efficiency
BOF Basic Oxygen Furnace
BRESL Barrier Removal to the cost-effective development of Energy Efficiency
Standards and Labelling
BTU British Thermal Units
CCHP Combined Cooling Heating And Power
CHP Combined Heat and Power
CER Certified Emissions Reduction
CLASP Collaborative Labeling and Appliance Standards Program
CPC Central Product Classification
DEDE Department of Alternative Energy Development and Efficiency
DoE Department of Energy
EAF Electric Arc Furnace
EBRD European Bank for Reconstruction and Development
EE Energy Efficiency
ESCO Energy Service Company
ESP Energy Service Provider
ESPC Energy Savings Performance Contracting
EV Electric Vehicle
GHG Greenhouse Gas
HVAC Heating Ventilation Air Conditioning
IEA International Energy Agency
IGA Investment Grade Audit
IoT Internet of Things
KEMCO Korean Energy Management Corporation
KESDM Indonesia: Ministry of Energy and Mineral Resources
LBNL Lawrence Berkeley National Laboratory
LED Light Emitting Diode
METI Ministry of Economy, Trade and Industry
MToE Million Tons of Oil equivalent
NDRC National Development and Reform Commission
NZEB Nearly Net Zero Energy Building
OLED Organic Light-Emitting Diode
PV Photo Voltaic
SEAD Super-Efficient Equipment and Appliance Deployment
SEI Sustainable Energy Initiative
TCE Tons Of Coal Equivalent
THB Thailand Baht
TFED Total Final Energy Demand
TWh Tera Watt hour

Abbreviations 53
V2G Vehicle To Grid
WOL Wake-on-LAN