Sector Rotation Strategies - S&P Dow Jones Indices · Sector Rotation Strategies . Ko Tseng,...
15
Sector Rotation Strategies Ko Tseng, FRM/PRM/CAIA Asian Sector Index Investment Strategy September 2012 www.tigeretf.com.hk
Transcript of Sector Rotation Strategies - S&P Dow Jones Indices · Sector Rotation Strategies . Ko Tseng,...

Sector Rotation Strategies
Ko Tseng, FRM/PRM/CAIA Asian Sector Index Investment Strategy September 2012 www.tigeretf.com.hk
For Professional Investor Only. Not For Public Distribution - 2 -
Why Sector?
► CASE STUDY OF SECTOR
ROTATION IMPLEMENTED
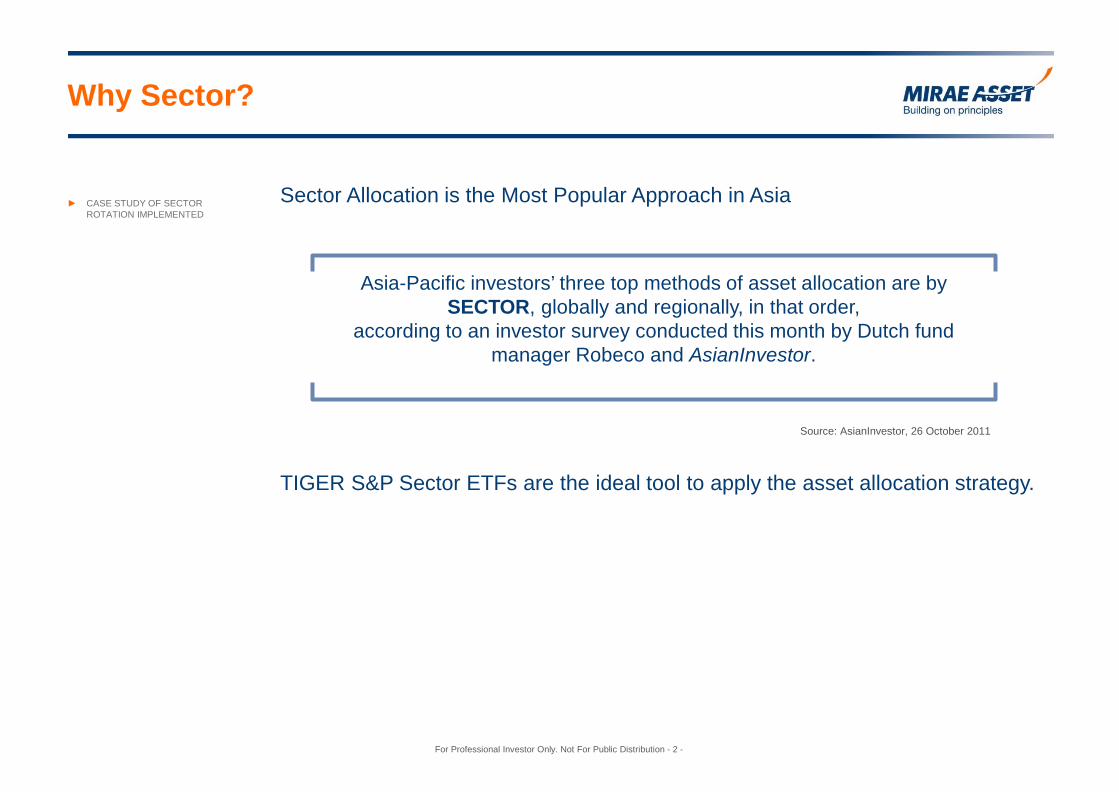
Sector Allocation is the Most Popular Approach in Asia
Source: AsianInvestor, 26 October 2011
Asia-Pacific investors’ three top methods of asset allocation are by SECTOR, globally and regionally, in that order,
according to an investor survey conducted this month by Dutch fund manager Robeco and AsianInvestor.
TIGER S&P Sector ETFs are the ideal tool to apply the asset allocation strategy.
For Professional Investor Only. Not For Public Distribution - 3 -
S&P Pan Asia ex JANZ LargeCap Sector Indices
► S&P ASIA EX JANZ SECTOR
INDICES
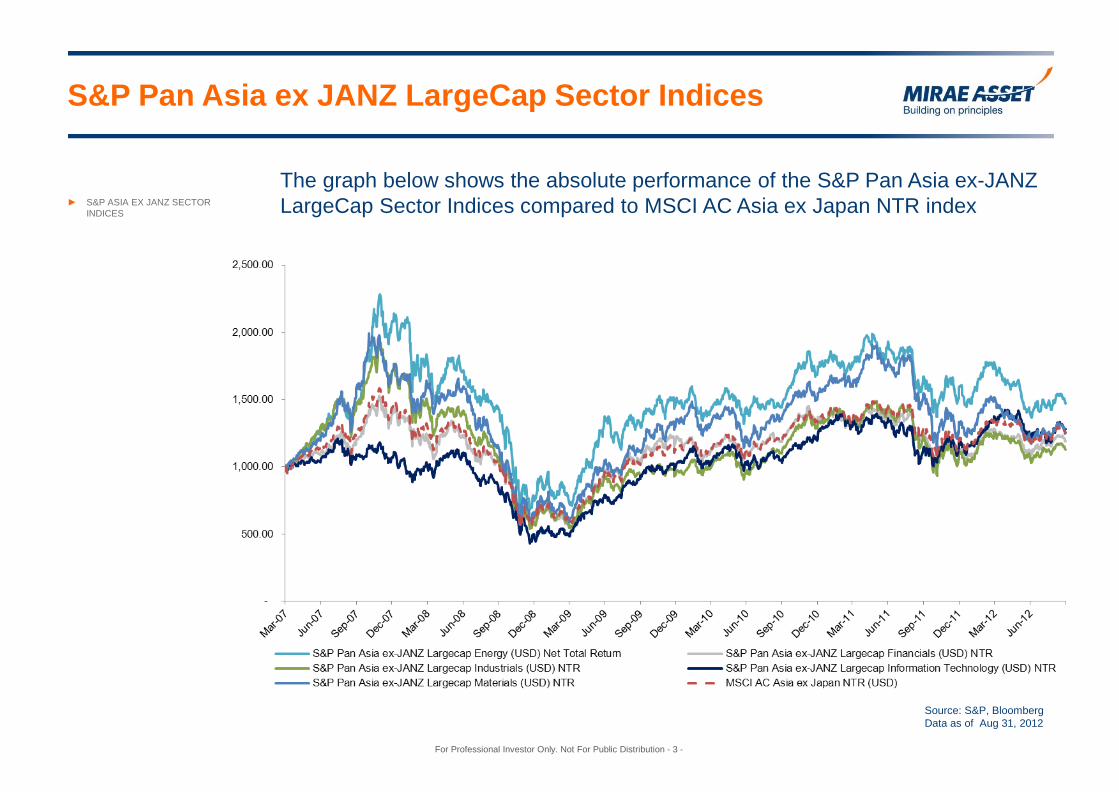
The graph below shows the absolute performance of the S&P Pan Asia ex-JANZ LargeCap Sector Indices compared to MSCI AC Asia ex Japan NTR index
Source: S&P, Bloomberg Data as of Aug 31, 2012
For Professional Investor Only. Not For Public Distribution - 4 -
S&P Pan Asia ex JANZ LargeCap Sector Indices
► S&P ASIA EX JANZ SECTOR
INDICES
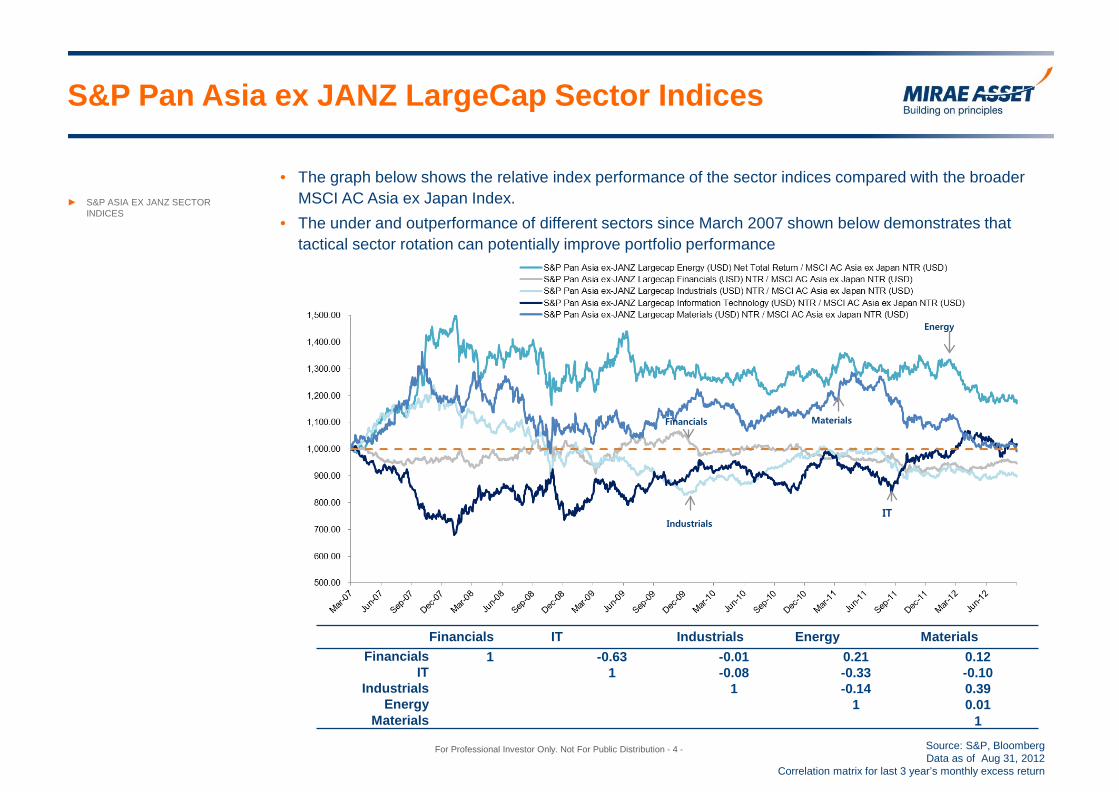
• The graph below shows the relative index performance of the sector indices compared with the broader MSCI AC Asia ex Japan Index.
• The under and outperformance of different sectors since March 2007 shown below demonstrates that tactical sector rotation can potentially improve portfolio performance
Financials IT Industrials Energy Materials Financials 1 -0.63 -0.01 0.21 0.12
IT 1 -0.08 -0.33 -0.10 Industrials 1 -0.14 0.39
Energy 1 0.01 Materials 1
Source: S&P, Bloomberg Data as of Aug 31, 2012
Correlation matrix for last 3 year’s monthly excess return
Energy
Materials
IT Industrials
Financials
For Professional Investor Only. Not For Public Distribution - 5 -
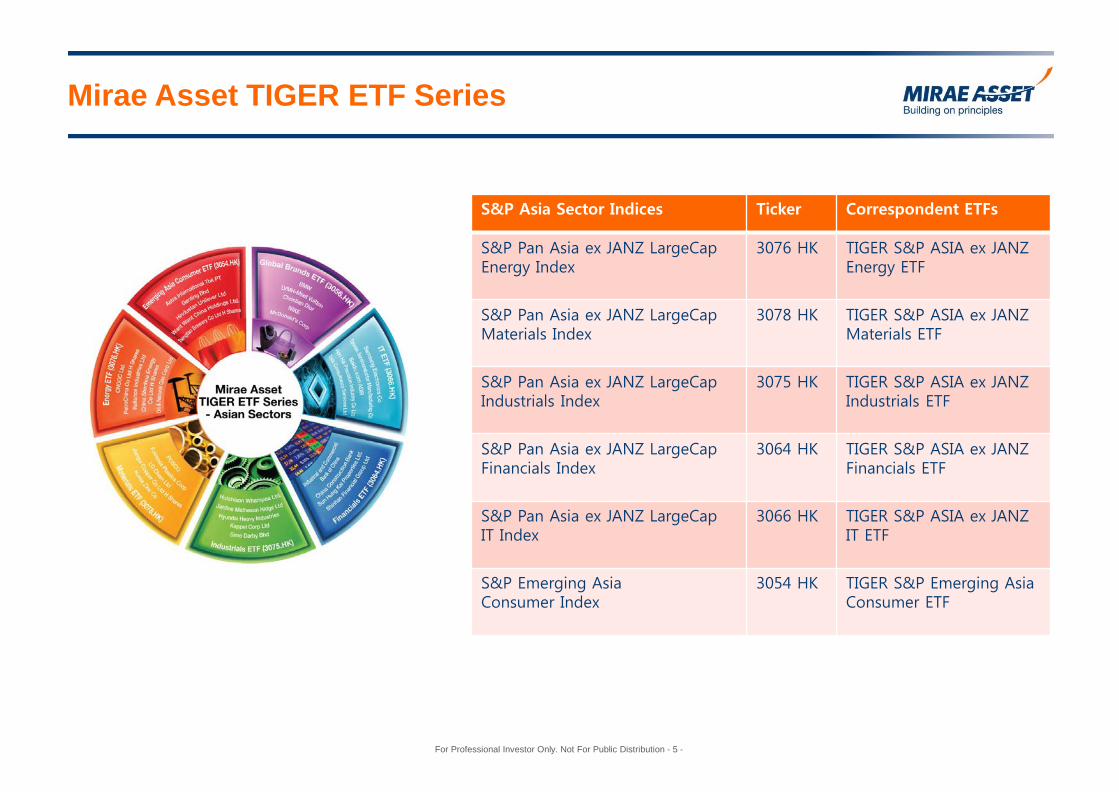
Mirae Asset TIGER ETF Series
S&P Asia Sector Indices Ticker Correspondent ETFs
S&P Pan Asia ex JANZ LargeCap Energy Index
3076 HK TIGER S&P ASIA ex JANZ Energy ETF
S&P Pan Asia ex JANZ LargeCap Materials Index
3078 HK TIGER S&P ASIA ex JANZ Materials ETF
S&P Pan Asia ex JANZ LargeCap Industrials Index
3075 HK TIGER S&P ASIA ex JANZ Industrials ETF
S&P Pan Asia ex JANZ LargeCap Financials Index
3064 HK TIGER S&P ASIA ex JANZ Financials ETF
S&P Pan Asia ex JANZ LargeCap IT Index
3066 HK TIGER S&P ASIA ex JANZ IT ETF
S&P Emerging Asia Consumer Index
3054 HK TIGER S&P Emerging Asia Consumer ETF
For Professional Investor Only. Not For Public Distribution - 6 -
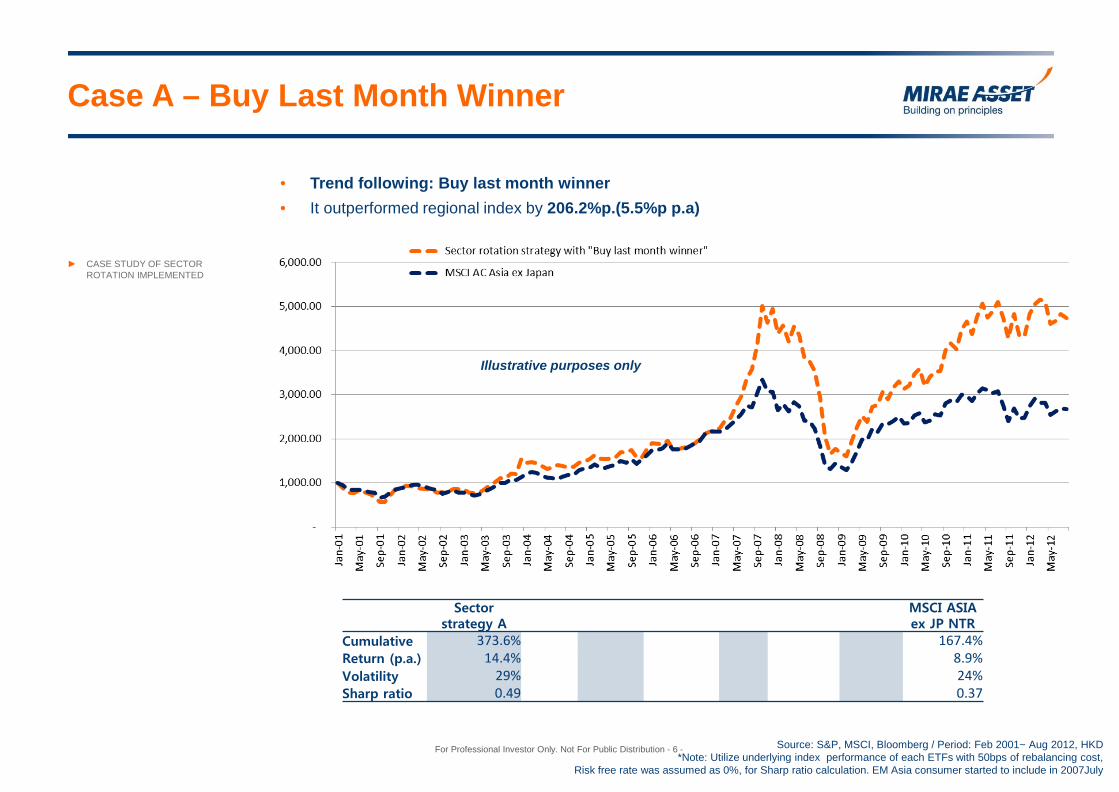
Case A – Buy Last Month Winner
► CASE STUDY OF SECTOR ROTATION IMPLEMENTED
Source: S&P, MSCI, Bloomberg / Period: Feb 2001~ Aug 2012, HKD *Note: Utilize underlying index performance of each ETFs with 50bps of rebalancing cost,
Risk free rate was assumed as 0%, for Sharp ratio calculation. EM Asia consumer started to include in 2007July
Sector strategy A
MSCI ASIA ex JP NTR
Cumulative 373.6% 167.4% Return (p.a.) 14.4% 8.9% Volatility 29% 24% Sharp ratio 0.49 0.37
• Trend following: Buy last month winner • It outperformed regional index by 206.2%p.(5.5%p p.a)
Illustrative purposes only
For Professional Investor Only. Not For Public Distribution - 7 -
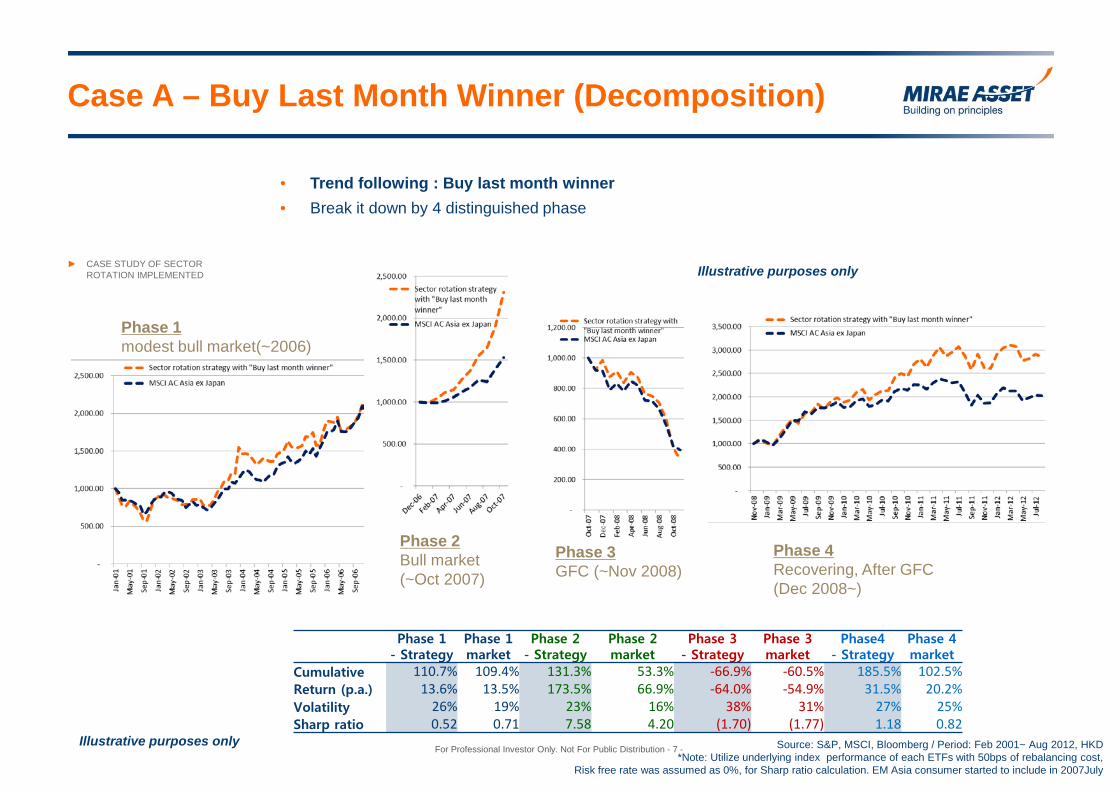
Case A – Buy Last Month Winner (Decomposition)
► CASE STUDY OF SECTOR ROTATION IMPLEMENTED
Source: S&P, MSCI, Bloomberg / Period: Feb 2001~ Aug 2012, HKD *Note: Utilize underlying index performance of each ETFs with 50bps of rebalancing cost,
Risk free rate was assumed as 0%, for Sharp ratio calculation. EM Asia consumer started to include in 2007July
Illustrative purposes only
• Trend following : Buy last month winner • Break it down by 4 distinguished phase
Phase 1 modest bull market(~2006)
Phase 2 Bull market (~Oct 2007)
Phase 3 GFC (~Nov 2008)
Phase 4 Recovering, After GFC (Dec 2008~)
Phase 1 - Strategy
Phase 1 market
Phase 2 - Strategy
Phase 2 market
Phase 3 - Strategy
Phase 3 market
Phase4 - Strategy
Phase 4 market
Cumulative 110.7% 109.4% 131.3% 53.3% -66.9% -60.5% 185.5% 102.5% Return (p.a.) 13.6% 13.5% 173.5% 66.9% -64.0% -54.9% 31.5% 20.2% Volatility 26% 19% 23% 16% 38% 31% 27% 25% Sharp ratio 0.52 0.71 7.58 4.20 (1.70) (1.77) 1.18 0.82
Illustrative purposes only
For Professional Investor Only. Not For Public Distribution - 8 -
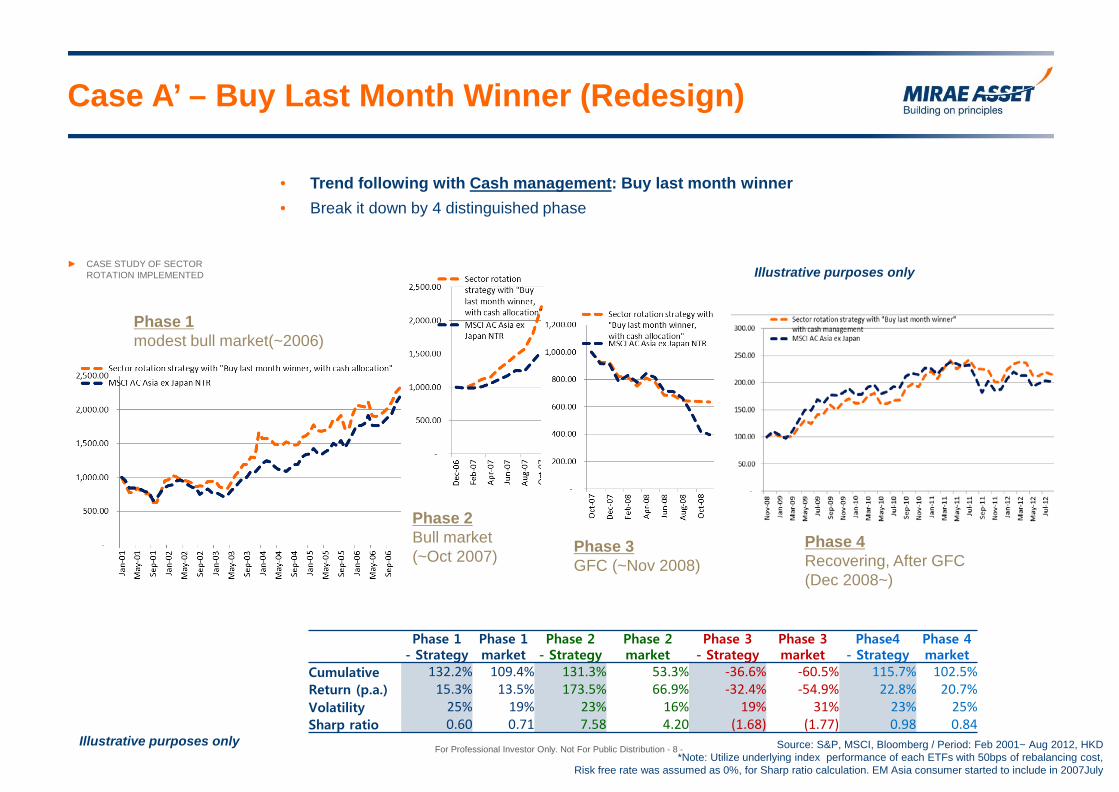
Case A’ – Buy Last Month Winner (Redesign)
► CASE STUDY OF SECTOR ROTATION IMPLEMENTED
Source: S&P, MSCI, Bloomberg / Period: Feb 2001~ Aug 2012, HKD *Note: Utilize underlying index performance of each ETFs with 50bps of rebalancing cost,
Risk free rate was assumed as 0%, for Sharp ratio calculation. EM Asia consumer started to include in 2007July
Illustrative purposes only
• Trend following with Cash management: Buy last month winner • Break it down by 4 distinguished phase
Phase 1 - Strategy
Phase 1 market
Phase 2 - Strategy
Phase 2 market
Phase 3 - Strategy
Phase 3 market
Phase4 - Strategy
Phase 4 market
Cumulative 132.2% 109.4% 131.3% 53.3% -36.6% -60.5% 115.7% 102.5% Return (p.a.) 15.3% 13.5% 173.5% 66.9% -32.4% -54.9% 22.8% 20.7% Volatility 25% 19% 23% 16% 19% 31% 23% 25% Sharp ratio 0.60 0.71 7.58 4.20 (1.68) (1.77) 0.98 0.84
Phase 1 modest bull market(~2006)
Phase 2 Bull market (~Oct 2007) Phase 3
GFC (~Nov 2008) Phase 4 Recovering, After GFC (Dec 2008~)
Illustrative purposes only

For Professional Investor Only. Not For Public Distribution - 9 -
Case A’ – Buy Last Month Winner (Recomposition)
► CASE STUDY OF SECTOR ROTATION IMPLEMENTED
Source: S&P, MSCI, Bloomberg / Period: Feb 2001~ Aug 2012, HKD *Note: Utilize underlying index performance of each ETFs with 50bps of rebalancing cost,
Risk free rate was assumed as 0%, for Sharp ratio calculation. EM Asia consumer started to include in 2007July
• Trend following with Cash management: Buy last month winner • Add cash management strategy
→when last month winner performed negative return, allocate cash to 100%. • It outperformed regional index by 466.6%p.(9.9%p p.a)
Sector strategy A’
MSCI ASIA ex JP NTR
Cumulative 634.1% 167.4% Return (p.a.) 18.8% 8.9% Volatility 25% 24% Sharp ratio 0.74 0.37
Illustrative purposes only
For Professional Investor Only. Not For Public Distribution - 10 -
Case B – Buy Last Month Winner Duo
► CASE STUDY OF SECTOR ROTATION IMPLEMENTED
Source: S&P, MSCI, Bloomberg / Period: 2007 July~ 2012 Aug, HKD *Note: Utilize underlying index performance of each ETFs with 50bps of rebalancing cost,
Risk free rate was assumed as 0%, for Sharp ratio calculation
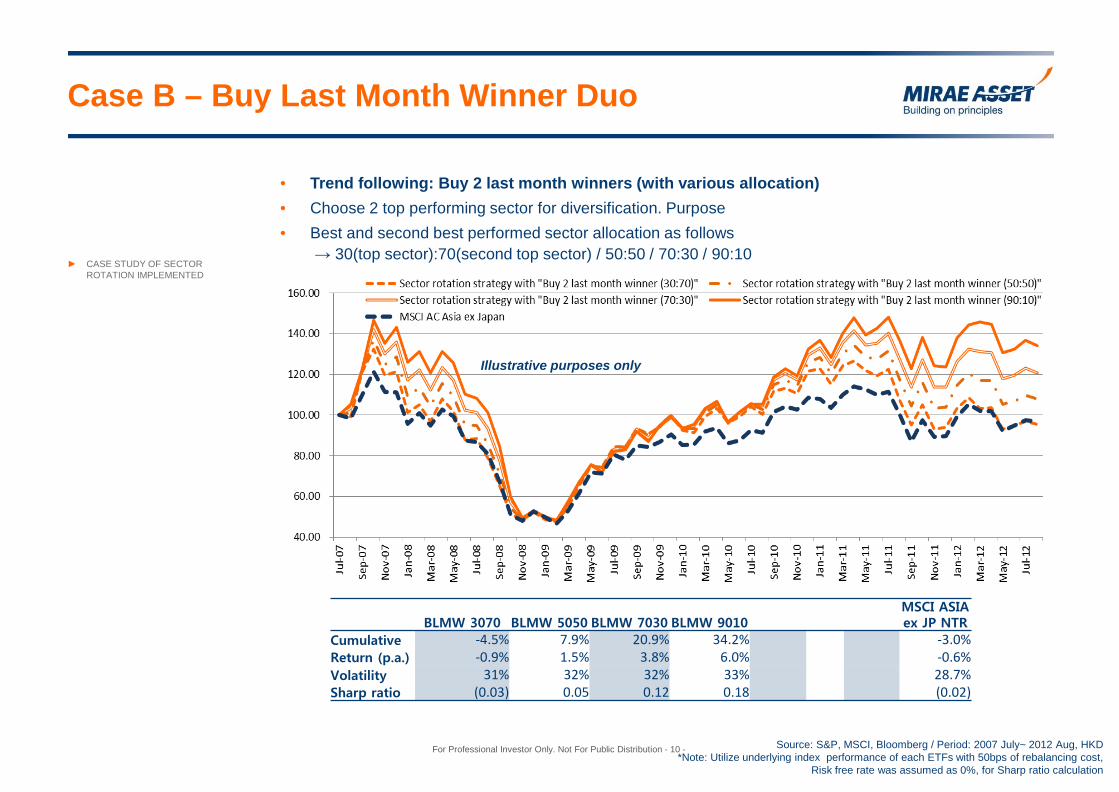
• Trend following: Buy 2 last month winners (with various allocation) • Choose 2 top performing sector for diversification. Purpose • Best and second best performed sector allocation as follows
→ 30(top sector):70(second top sector) / 50:50 / 70:30 / 90:10
BLMW 3070 BLMW 5050 BLMW 7030 BLMW 9010 MSCI ASIA ex JP NTR
Cumulative -4.5% 7.9% 20.9% 34.2% -3.0% Return (p.a.) -0.9% 1.5% 3.8% 6.0% -0.6% Volatility 31% 32% 32% 33% 28.7% Sharp ratio (0.03) 0.05 0.12 0.18 (0.02)
Illustrative purposes only
For Professional Investor Only. Not For Public Distribution - 11 -
Case C – Buy Last Month Winner as Satellite
► CASE STUDY OF SECTOR ROTATION IMPLEMENTED
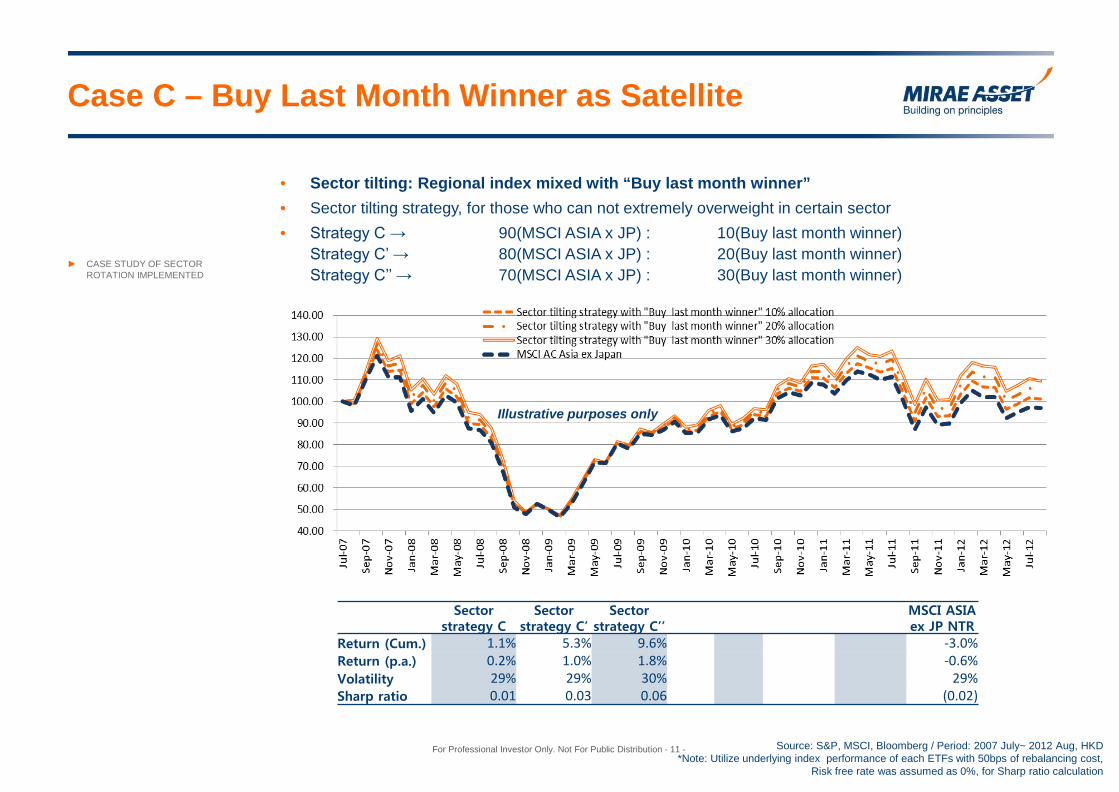
• Sector tilting: Regional index mixed with “Buy last month winner” • Sector tilting strategy, for those who can not extremely overweight in certain sector • Strategy C → 90(MSCI ASIA x JP) : 10(Buy last month winner)
Strategy C’ → 80(MSCI ASIA x JP) : 20(Buy last month winner) Strategy C’’ → 70(MSCI ASIA x JP) : 30(Buy last month winner)
Sector strategy C
Sector strategy C’
Sector strategy C’’
MSCI ASIA ex JP NTR
Return (Cum.) 1.1% 5.3% 9.6% -3.0% Return (p.a.) 0.2% 1.0% 1.8% -0.6% Volatility 29% 29% 30% 29% Sharp ratio 0.01 0.03 0.06 (0.02)
Illustrative purposes only
Source: S&P, MSCI, Bloomberg / Period: 2007 July~ 2012 Aug, HKD *Note: Utilize underlying index performance of each ETFs with 50bps of rebalancing cost,
Risk free rate was assumed as 0%, for Sharp ratio calculation

For Professional Investor Only. Not For Public Distribution - 12 -
Case D – Sector Pair Trading
► CASE STUDY OF SECTOR ROTATION IMPLEMENTED
Source: S&P, MSCI, Bloomberg / Period: 2007 3Q~ 2012 2Q, HKD *Note: Utilize underlying index performance of each ETFs with 50bps of rebalancing cost, 100bps of quarterly
stock borrowing cost is applied to calculation. Risk free rate was assumed as 0%, for Sharp ratio calculation
• Long/Short: Buy Last quarter Loser & Short last quarter winner, 50:50 (with 5 S&P Pan Asia ex JANZ Sector Indices)
Sector strategy D
Asia Energy
Asia Financials
Asia Industrials
Asia IT
Asia Materials
MSCI ASIA ex JP NTR
Return (p.a.) 1.1% -4.8% -3.2% -8.2% 2.2% -8.0% -3.0% Volatility 5% 33% 33% 34% 33% 35% 30% Sharp ratio 0.23 (0.15) (0.10) (0.24) 0.07 (0.23) (0.10)
Illustrative purposes only
For Professional Investor Only. Not For Public Distribution - 13 -
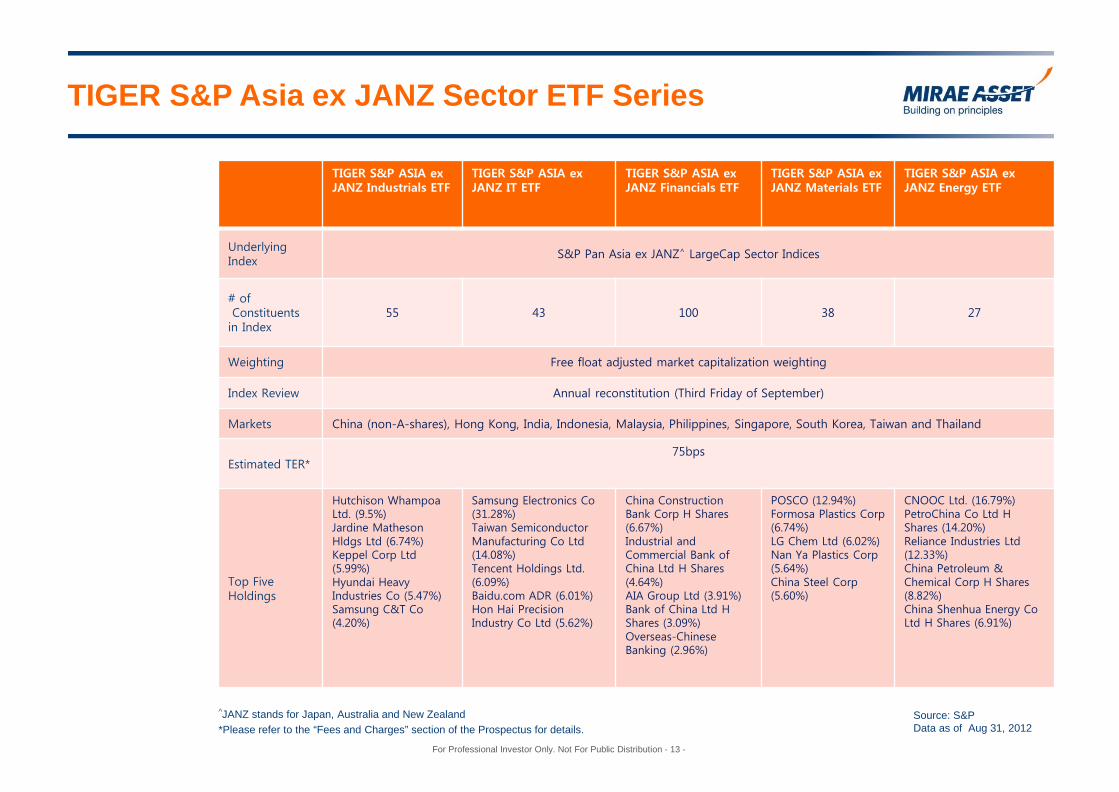
TIGER S&P Asia ex JANZ Sector ETF Series
TIGER S&P ASIA ex JANZ Industrials ETF
TIGER S&P ASIA ex JANZ IT ETF
TIGER S&P ASIA ex JANZ Financials ETF
TIGER S&P ASIA ex JANZ Materials ETF
TIGER S&P ASIA ex JANZ Energy ETF
Underlying Index
S&P Pan Asia ex JANZ^ LargeCap Sector Indices
# of Constituents in Index
55 43 100 38 27
Weighting Free float adjusted market capitalization weighting
Index Review Annual reconstitution (Third Friday of September)
Markets China (non-A-shares), Hong Kong, India, Indonesia, Malaysia, Philippines, Singapore, South Korea, Taiwan and Thailand
Estimated TER* 75bps
Top Five Holdings
Hutchison Whampoa Ltd. (9.5%) Jardine Matheson Hldgs Ltd (6.74%) Keppel Corp Ltd (5.99%) Hyundai Heavy Industries Co (5.47%) Samsung C&T Co (4.20%)
Samsung Electronics Co (31.28%) Taiwan Semiconductor Manufacturing Co Ltd (14.08%) Tencent Holdings Ltd. (6.09%) Baidu.com ADR (6.01%) Hon Hai Precision Industry Co Ltd (5.62%)
China Construction Bank Corp H Shares (6.67%) Industrial and Commercial Bank of China Ltd H Shares (4.64%) AIA Group Ltd (3.91%) Bank of China Ltd H Shares (3.09%) Overseas-Chinese Banking (2.96%)
POSCO (12.94%) Formosa Plastics Corp (6.74%) LG Chem Ltd (6.02%) Nan Ya Plastics Corp (5.64%) China Steel Corp (5.60%)
CNOOC Ltd. (16.79%) PetroChina Co Ltd H Shares (14.20%) Reliance Industries Ltd (12.33%) China Petroleum & Chemical Corp H Shares (8.82%) China Shenhua Energy Co Ltd H Shares (6.91%)
^JANZ stands for Japan, Australia and New Zealand *Please refer to the “Fees and Charges” section of the Prospectus for details.
Source: S&P Data as of Aug 31, 2012
For Professional Investor Only. Not For Public Distribution - 14 -
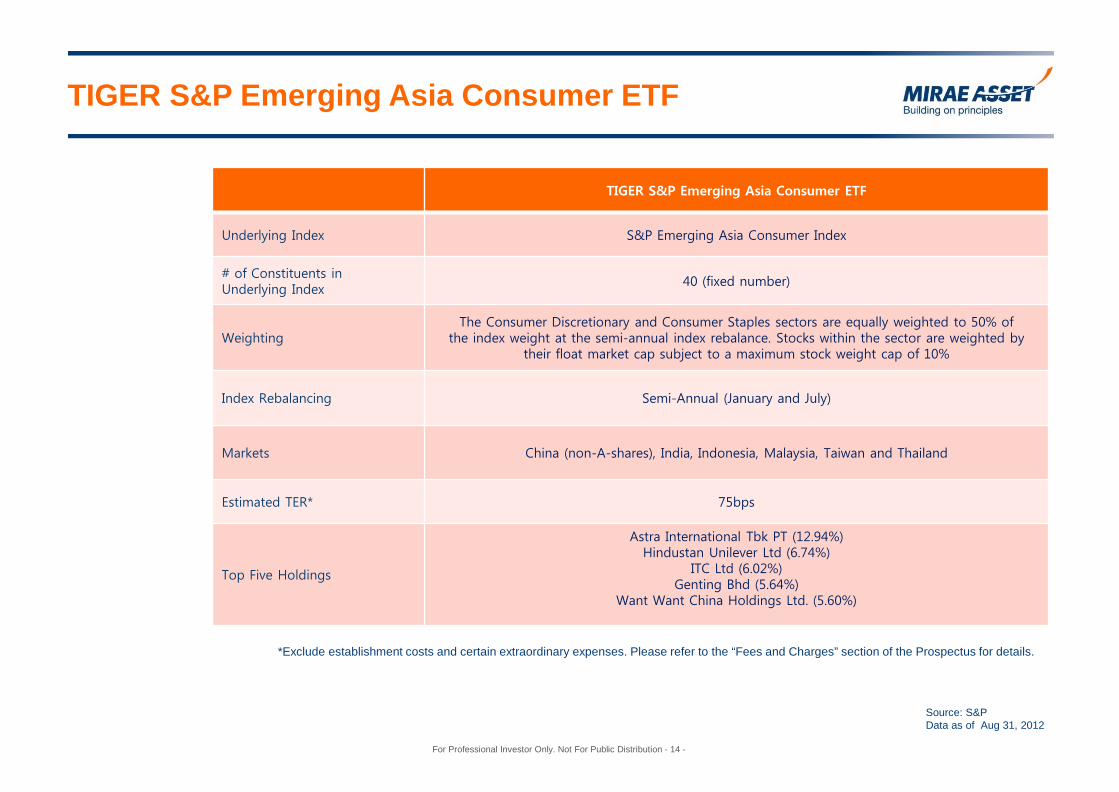
TIGER S&P Emerging Asia Consumer ETF
TIGER S&P Emerging Asia Consumer ETF
Underlying Index S&P Emerging Asia Consumer Index
# of Constituents in Underlying Index
40 (fixed number)
Weighting The Consumer Discretionary and Consumer Staples sectors are equally weighted to 50% of
the index weight at the semi-annual index rebalance. Stocks within the sector are weighted by their float market cap subject to a maximum stock weight cap of 10%
Index Rebalancing Semi-Annual (January and July)
Markets China (non-A-shares), India, Indonesia, Malaysia, Taiwan and Thailand
Estimated TER* 75bps
Top Five Holdings
Astra International Tbk PT (12.94%) Hindustan Unilever Ltd (6.74%)
ITC Ltd (6.02%) Genting Bhd (5.64%)
Want Want China Holdings Ltd. (5.60%)
Source: S&P Data as of Aug 31, 2012
*Exclude establishment costs and certain extraordinary expenses. Please refer to the “Fees and Charges” section of the Prospectus for details.
For Professional Investor Only. Not For Public Distribution - 15 -
This document has been prepared for presentation, illustration and discussion purpose only to persons reasonably believed to be within one of the professional investor exemptions contained in the Securities and Futures Ordinance or “professional/qualified investors” in relevant jurisdiction and is not legal binding. It is not intended for general public distribution. The investment is designed for professional investors. It may not be suitable for persons unfamiliar with the underlying securities or who are unwilling or unable to bear the risk of loss and ownership of such investment. The contents of this document have not been reviewed by any regulatory authority in Hong Kong. You are advised to exercise caution and if you are in any doubt of the contents of this document, you should seek independent professional advice before you make any investment. Certain information contained in this document is compiled from third party sources. Whilst Mirae Asset Global Investments (Hong Kong) Limited ("Mirae Asset HK") has, to the best of its endeavor, ensured that such information is accurate, complete and up-to-date, and has taken care in accurately reproducing the information, it shall have no responsibility or liability whatsoever for the accuracy of such information or any use or reliance thereof. The distribution of this document or the information contained in it may be restricted by law and may not be used in any jurisdiction or any circumstances in which its use would be unlawful. Mirae Asset HK is not responsible for any distribution of this document to any third parties in whole or in part or for information reconstructed from this document. Mirae Asset HK accepts no liability for any loss or damage of any kind resulting out of the unauthorized use of this document. All information in this document is strictly for information purposes only and subject to change without prior notice. This document is strictly for information purposes only and does not constitute a representation that any investment strategy is suitable or appropriate for an investor’s individual circumstances. Further, this document should not be regarded by investors as a substitute for independent professional advice or the exercise of their own judgment. Investment involves risk. It cannot be guaranteed that the performance of the Fund will generate a return and there may be circumstances where no return is generated or the amount invested is lost. Past performance is not indicative of future performance. Before making any investment decision to invest in the Fund, investors should read the Prospectus and the Information for Hong Kong Investors of the Fund for details and the risk factors. Investors should ensure they fully understand the risks associated with the Fund and should also consider their own investment objective and risk tolerance level. Investors are advised to seek independent professional advice before making any investment. References to particular sectors, securities or companies are for general information & illustration purposes only and are not recommendations to buy or sell a security, or an indication of the author’s holdings at any one time. This document is issued by Mirae Asset Global Investments (Hong Kong) Limited and has not been reviewed by the Securities and Futures Commission. S&P® is the trademark of Standard & Poor’s and has been licensed for use by Mirae Asset HK. The Product is not sponsored, endorsed, sold or promoted by Standard & Poor's and Standard & Poor's does not make any representation regarding the advisability of investing in the Product. S&P does not make any representation or warranty, express or implied, to the owners of the Mirae Asset TIGER S&P ETF series (“TIGER S&P ETFs”) or any member of the public regarding the advisability of investing in securities generally or in the TIGER S&P ETFs particularly or the ability of the underlying S&P Indices (the “Indices”) to track general stock market performance. S&P has no obligation to take the needs of Mirae Asset HK or the owners of the TIGER S&P ETFs into consideration in determining, composing or calculating the Indices. S&P is not responsible for and has not participated in the determination of the prices and amount of the TIGER S&P ETFs or the timing of the issuance or sale of the TIGER S&P ETFs or in the determination or calculation of the equation by which the TIGER S&P ETFs is to be converted into cash. S&P has no obligation or liability in connection with the administration, marketing or trading of the TIGER S&P ETFs.
Disclaimer