Section 5. State Risk Assessment - New Jersey Office...
38
State of New Jersey 2014 Hazard Mitigation Plan Page 5.1-1 Section 5.1. State Risk Assessment Overview Section 5. State Risk Assessment 2014 Plan Update Changes The 2011 Plan risk assessment overview was presented in Section 4. For the 2014 Plan, it is presented in Section 5.1. The hazard identification process with the Mitigation Core Team, State Hazard Mitigation Team, New Jersey Office of Emergency Management planners, Emergency Support Function leads, and Regional Operations Intelligence Center analysts is outlined and discussed. Changes to the hazards of concern are presented in a new table (Table 5.1-1). Local HMPs were reviewed and their hazards of concern and risk ranking were extracted and summarized. Presidential Disaster Declarations were updated (previously found in the 2011 Executive Summary). The New Jersey Office of Management and Budget Statewide Land and Building Asset Management (LBAM) database was used as the state building dataset for the risk assessment allowing for quantifiable loss estimation and compliance with 44 CFR 201.4. A critical facility definition was established by the Mitigation Core Team. The critical facility and infrastructure dataset was expanded to include additional types. A new subsection was added ‘Changes in Development for Hazard-Prone Areas’. 5.1 State Risk Assessment Overview 44 CFR §201.4(c)(2): States are required to undertake a risk assessment that provides ‘…the factual basis for activities proposed in the strategy portion of the mitigation plan. Statewide risk assessments must characterize and analyze natural hazards and risks to provide a statewide overview.’ According to 44 CFR 201.4 (c)(2), states are required to undertake a risk assessment that provides the factual basis for developing a mitigation strategy. The State of New Jersey risk assessment shall include an overview of the location of all natural hazards that can affect the State, including information on previous occurrences of hazard events as well as the probability of future hazard events, using maps where appropriate. For the 2014 Plan update, all information on the risk assessment can be found in Section 5, as well as the referenced supporting appendices. For ease of review, the vulnerability assessment follows each hazard profile, so that all information about a specific hazard is continuous. This section describes the identification of hazards, Presidential disaster declarations, hazard profiles, and the vulnerability assessment. 5.1.1 Identification of Hazards Planning initiatives in the State of New Jersey are enhanced through the State’s participation in the Emergency Management Accreditation Program (EMAP). EMAP is a voluntary assessment and accreditation process for the emergency management programs of states, territories, tribes, and local governments. The State passed the EMAP assessment and became accredited on October 28, 2011. EMAP is discussed further in Section 9 (Consequence Analysis) of this Plan. According to the State’s EMAP Program Manager, the State Hazard Mitigation Plan (HMP) has been identified as the one body of work that defines the hazards of concern to the State of New Jersey. Therefore, this Plan identifies the potential hazards (natural and human-caused), assesses their risks, and analyzes their consequences for all preparedness and planning efforts in the State. The hazard identification process took into account hazards that had been documented in local mitigation plans (including the 2011 State HMP); 2011
Transcript of Section 5. State Risk Assessment - New Jersey Office...

State of New Jersey 2014 Hazard Mitigation Plan
Page 5.1-1 Section 5.1. State Risk Assessment Overview
Section 5. State Risk Assessment
2014 Plan Update Changes
The 2011 Plan risk assessment overview was presented in Section 4. For the 2014 Plan, it is presented in
Section 5.1.
The hazard identification process with the Mitigation Core Team, State Hazard Mitigation Team, New
Jersey Office of Emergency Management planners, Emergency Support Function leads, and Regional
Operations Intelligence Center analysts is outlined and discussed.
Changes to the hazards of concern are presented in a new table (Table 5.1-1).
Local HMPs were reviewed and their hazards of concern and risk ranking were extracted and summarized.
Presidential Disaster Declarations were updated (previously found in the 2011 Executive Summary).
The New Jersey Office of Management and Budget Statewide Land and Building Asset Management
(LBAM) database was used as the state building dataset for the risk assessment allowing for quantifiable
loss estimation and compliance with 44 CFR 201.4.
A critical facility definition was established by the Mitigation Core Team.
The critical facility and infrastructure dataset was expanded to include additional types.
A new subsection was added ‘Changes in Development for Hazard-Prone Areas’.
5.1 State Risk Assessment Overview
44 CFR §201.4(c)(2): States are required to undertake a risk assessment that provides ‘…the factualbasis for activities proposed in the strategy portion of the mitigation plan. Statewide risk assessmentsmust characterize and analyze natural hazards and risks to provide a statewide overview.’
According to 44 CFR 201.4 (c)(2), states are required to undertake a risk assessment that provides the factual
basis for developing a mitigation strategy. The State of New Jersey risk assessment shall include an overview
of the location of all natural hazards that can affect the State, including information on previous occurrences of
hazard events as well as the probability of future hazard events, using maps where appropriate.
For the 2014 Plan update, all information on the risk assessment can be found in Section 5, as well as the
referenced supporting appendices. For ease of review, the vulnerability assessment follows each hazard
profile, so that all information about a specific hazard is continuous. This section describes the identification
of hazards, Presidential disaster declarations, hazard profiles, and the vulnerability assessment.
5.1.1 Identification of Hazards
Planning initiatives in the State of New Jersey are enhanced through the State’s participation in the Emergency
Management Accreditation Program (EMAP). EMAP is a voluntary assessment and accreditation process for
the emergency management programs of states, territories, tribes, and local governments. The State passed the
EMAP assessment and became accredited on October 28, 2011. EMAP is discussed further in Section 9
(Consequence Analysis) of this Plan.
According to the State’s EMAP Program Manager, the State Hazard Mitigation Plan (HMP) has been
identified as the one body of work that defines the hazards of concern to the State of New Jersey. Therefore,
this Plan identifies the potential hazards (natural and human-caused), assesses their risks, and analyzes their
consequences for all preparedness and planning efforts in the State. The hazard identification process took into
account hazards that had been documented in local mitigation plans (including the 2011 State HMP); 2011

State of New Jersey 2014 Hazard Mitigation Plan
Page 5.1-2 Section 5.1. State Risk Assessment Overview
FEMA Crosswalk comments and interagency comments; and review from members of the Mitigation Core
Team (MCT), State Hazard Mitigation Team (SHMT), New Jersey Office of Emergency Management
(NJOEM) planners, Emergency Support Function leads, and Regional Operations Intelligence Center (ROIC)
analysts.
During their meeting held on December 12, 2012, the hazards list was distributed and approved by the SHMT.
Additional input was sought on both the natural and human-caused hazards from NJOEM planners, ESF leads,
ROIC analysts through additional telephone conversations, electronic mail correspondence, and meetings.
On June 6, 2013, the planning consultant met with NJOEM and the State’s EMAP Program Manager to
discuss EMAP and the process to review and confirm the State’s hazards of concern. On June 11, 2013, all
ESF leads were provided the list of natural and human-caused hazards of concern for review and comment.
Based on their review, two additional human-caused hazards were identified: cyber-attack and economic
collapse. Additionally, based on their review, the pandemic hazard profile will include disease outbreaks.
Coincident to this plan update process, the State Office of Homeland Security and Preparedness has been
preparing a Threat, Hazard Identification and Risk Assessment (THIRA) that further expands our
understanding of risk to the broad range of hazards that can affect our State. The New Jersey Office of
Homeland Security and Preparedness (NJOHSP) led the development of the State’s THIRA process. The
NJOHSP coordinated with the ESF Coordinators and the SHMT on this effort by providing critical facility
data, attended SHMT meetings and reviewed and confirmed the 2014 Plan hazards of concern.
The revised and updated list of hazards was presented and approved by the MCT at the MCT meeting held on
June 18, 2013. At the ESF lead meeting on September 18, 2013, the updated list of hazards was presented and
formally approved by all ESF leads in attendance. The final list of hazards was presented to the SHMT on
September 24, 2013. Refer to Appendix F which includes the meeting minutes regarding the approval of the
hazards of concern.
The State HMP planning process identified 24 hazards of concern: 11 natural and 13 human-caused. Table 5.1-
1 lists the hazards of concern for the State, including the natural and human-caused hazards profiled in the
2014 State HMP update. Please note, the 2011 HMP classification of hazards as natural or human-caused were
maintained for the 2014 update.
For the purpose of this planning effort, the MCT and SHMT chose to group some natural hazards together,
based on similarity of hazard events, their typical occurrence or impacts, consideration of how hazards have
been grouped in FEMA guidance documents (FEMA 386-1), and FEMA Crosswalk comments. Additional
natural and human-caused hazards were added to the hazards in the 2011 Plan based on FEMA Crosswalk
comments, MCT and SHMT interagency review and comments, and NJ ROIC analysts’ input. Many of the
identified hazards are related (for example, during tropical storm events, flooding can occur) and other hazards
are the result of an event, such as sinkholes stemming from flooding, and are not listed individually. Table
5.1-1 below lists the natural and human-caused hazards listed in the 2011 State HMP, and those added to the
2014 Plan update, with additional hazards to be discussed in the update.

State of New Jersey 2014 Hazard Mitigation Plan
Page 5.1-1 Section 5.1. State Risk Assessment Overview
Table 5.1-1. State Hazards of Concern
2011 Plan 2014 Plan
Natural Hazards
Coastal Erosion (including preparing for coastal climatechange)
Coastal Erosion (including enhanced discussion of beachprotection) and Sea-Level Rise
Not included in the 2011 Plan Dam/Levee Failure
Drought Drought
Earthquakes Earthquakes
Flood ( riverine, coastal, storm surge, and tsunami)Flood (riverine, coastal, storm surge, tsunami, and stormwater
flooding caused by local drainage and high groundwater levels)
Geological Hazards (landslide, subsidence, and sinkholes) Geological Hazards (landslide and subsidence/sinkholes)
Hurricanes and Tropical Storms Hurricanes and Tropical Storms
Extreme Heat Included with Severe Weather
HailIncluded with Severe Weather because of their directrelationship with severe weather/thunderstorm events
Nor’Easters Nor’Easters
Tornadoes and High Winds (including thunderstorms)Severe Weather (high winds, tornadoes, thunderstorms, hail,
and extreme temperature)
Wildfire Wildfire
Winter Storms (snow, blizzards, ice storm, cold waves, andwind chill)
Winter Storms (snow, blizzards, and ice storms)
Human-Caused Hazards
Animal Disease Events Animal Disease Events
Civil Unrest Civil Unrest
Not included in the 2011 Plan Cyber Attack
Crop Failure Crop Failure
Not included in the 2011 Plan Economic Collapse
Fishing Failure Fishing Failure
Hazardous Waste – Fixed Sites
Hazardous Substances – (Fixed Sites, In-Transit, Offshore)Hazardous Waste – Transportation
Hazardous Waste – Offshore
Nuclear Hazard Issues Nuclear Hazard
Pandemic Pandemic (including disease outbreak)
Power Outages Power Outages
Terrorism Terrorism
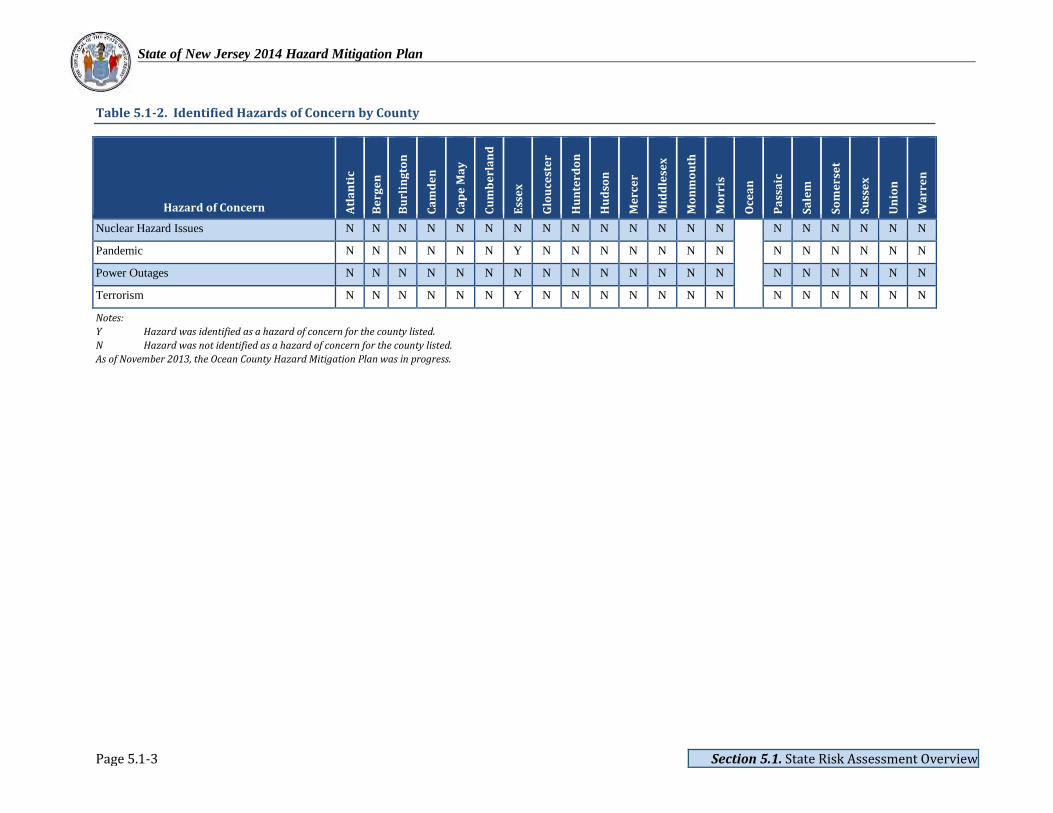
The following table (Table 5.1-2) includes the hazards of concern identified during each county’s local
mitigation planning efforts. The hazards named by each county for their distinct plan were then integrated and
evaluated to assist the State in identifying the overall hazards of concern for the State of New Jersey.

State of New Jersey 2014 Hazard Mitigation Plan
Page 5.1-2 Section 5.1. State Risk Assessment Overview
Table 5.1-2. Identified Hazards of Concern by County
Hazard of Concern Atl
an
tic
Be
rge
n
Bu
rlin
gto
n
Ca
md
en
Ca
pe
Ma
y
Cu
mb
erl
an
d
Ess
ex
Glo
uce
ste
r
Hu
nte
rdo
n
Hu
dso
n
Me
rce
r
Mid
dle
sex
Mo
nm
ou
th
Mo
rris
Oce
an
Pa
ssa
ic
Sa
lem
So
me
rse
t
Su
sse
x
Un
ion
Wa
rre
n
Natural
Coastal Erosion Y N N Y Y Y Y Y N N N Y Y Y
Pla
nC
urr
entl
yin
Pro
gre
ss
Y Y N N Y N
Dam/Levee Failure Y N Y Y N Y Y Y Y N Y Y Y Y Y Y Y Y Y Y
Drought Y Y Y Y N Y Y Y Y Y Y Y Y Y Y Y Y Y Y Y
Earthquake Y Y Y Y N Y Y Y Y Y Y Y Y Y Y Y Y Y Y Y
Flood Y Y Y Y Y Y Y Y Y Y Y Y Y Y Y Y Y Y Y Y
Geological Hazards N Y Y Y N Y Y Y Y Y Y Y Y Y Y Y N Y Y Y
Hurricane and Tropical Storm Y Y Y Y Y Y Y Y Y Y Y Y Y Y Y Y Y Y Y Y
Nor'Easter Y Y Y Y Y Y Y Y Y Y Y Y Y Y Y Y Y Y Y Y
Severe Weather Y Y Y Y Y Y Y Y Y Y Y Y Y Y Y Y Y Y Y Y
Severe Winter Weather Y Y Y Y Y Y Y Y Y Y Y Y Y Y Y Y Y Y Y Y
Wildfire Y Y Y Y Y Y Y Y Y Y Y Y Y Y Y Y Y Y Y Y
Human-Caused
Animal Disease N N N N N N N N N N N N N N
Pla
nC
urr
entl
yin
Pro
gre
ss
N N N N N N
Civil Unrest N N N N N N Y N N N N N N N N N N N N N
Crop Failure N N N Y N Y N Y N N N N N N N Y N N N N
Cyber Attack N N N N N N N N N N N N N N N N N N N N
Economic Collapse N N N N N N N N N N N N N N N N N N N N
Fishing Failure N N N Y N Y N Y N N N N N N N Y N N N N
Hazardous Substances - Fixed Sites N N N Y N Y Y Y Y N Y Y N Y N Y N Y Y Y
Hazardous Substances – Offshore N N N N N N N N N N N N N N N N N N N N
Hazardous Substances - Transportation N N N Y N Y Y Y Y N Y Y N Y N Y N Y Y Y
State of New Jersey 2014 Hazard Mitigation Plan
Page 5.1-3 Section 5.1. State Risk Assessment Overview
Table 5.1-2. Identified Hazards of Concern by County
Hazard of Concern Atl
an
tic
Be
rge
n
Bu
rlin
gto
n
Ca
md
en
Ca
pe
Ma
y
Cu
mb
erl
an
d
Ess
ex
Glo
uce
ste
r
Hu
nte
rdo
n
Hu
dso
n
Me
rce
r
Mid
dle
sex
Mo
nm
ou
th
Mo
rris
Oce
an
Pa
ssa
ic
Sa
lem
So
me
rse
t
Su
sse
x
Un
ion
Wa
rre
n
Nuclear Hazard Issues N N N N N N N N N N N N N N N N N N N N
Pandemic N N N N N N Y N N N N N N N N N N N N N
Power Outages N N N N N N N N N N N N N N N N N N N N
Terrorism N N N N N N Y N N N N N N N N N N N N N
Notes:
Y Hazard was identified as a hazard of concern for the county listed.
N Hazard was not identified as a hazard of concern for the county listed.
As of November 2013, the Ocean County Hazard Mitigation Plan was in progress.
State of New Jersey 2014 Hazard Mitigation Plan
Page 5.1-4 Section 5.1. State Risk Assessment Overview
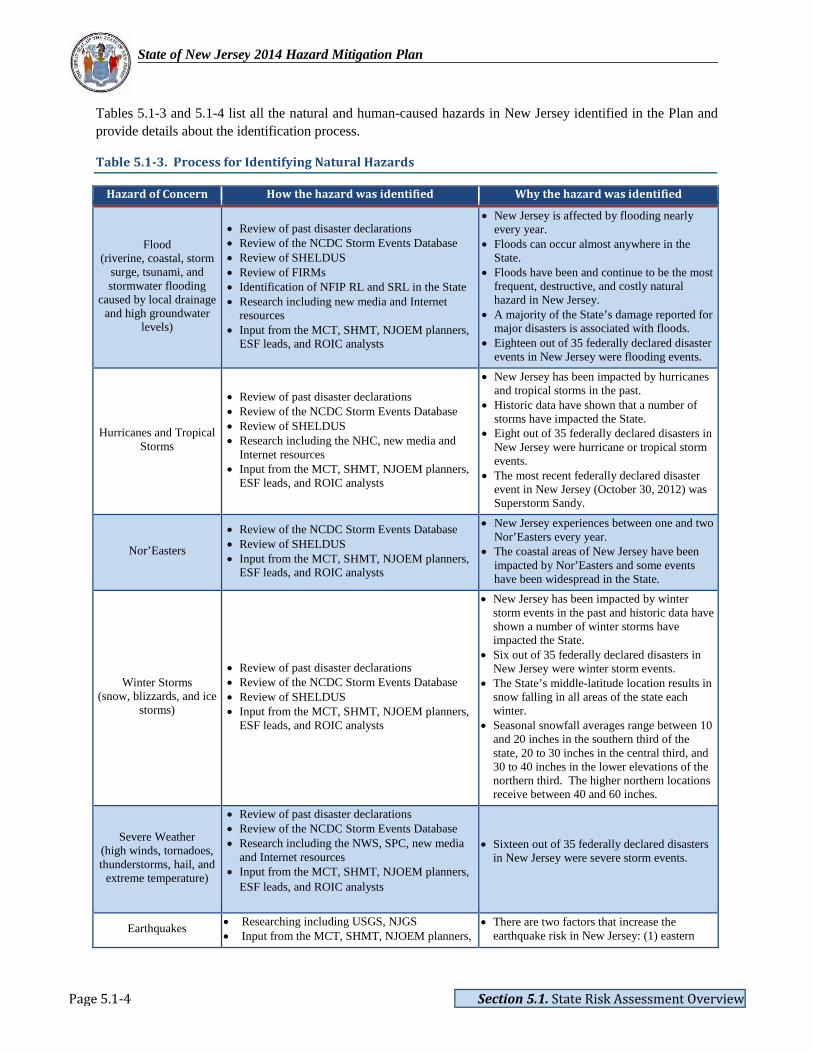
Tables 5.1-3 and 5.1-4 list all the natural and human-caused hazards in New Jersey identified in the Plan and
provide details about the identification process.
Table 5.1-3. Process for Identifying Natural Hazards
Hazard of Concern How the hazard was identified Why the hazard was identified
Flood(riverine, coastal, storm
surge, tsunami, andstormwater flooding
caused by local drainageand high groundwater
levels)
Review of past disaster declarations Review of the NCDC Storm Events Database Review of SHELDUS Review of FIRMs Identification of NFIP RL and SRL in the State Research including new media and Internet
resources Input from the MCT, SHMT, NJOEM planners,
ESF leads, and ROIC analysts
New Jersey is affected by flooding nearlyevery year.
Floods can occur almost anywhere in theState.
Floods have been and continue to be the mostfrequent, destructive, and costly naturalhazard in New Jersey.
A majority of the State’s damage reported formajor disasters is associated with floods.
Eighteen out of 35 federally declared disasterevents in New Jersey were flooding events.
Hurricanes and TropicalStorms
Review of past disaster declarations Review of the NCDC Storm Events Database Review of SHELDUS Research including the NHC, new media and
Internet resources Input from the MCT, SHMT, NJOEM planners,
ESF leads, and ROIC analysts
New Jersey has been impacted by hurricanesand tropical storms in the past.
Historic data have shown that a number ofstorms have impacted the State.
Eight out of 35 federally declared disasters inNew Jersey were hurricane or tropical stormevents.
The most recent federally declared disasterevent in New Jersey (October 30, 2012) wasSuperstorm Sandy.
Nor’Easters
Review of the NCDC Storm Events Database Review of SHELDUS Input from the MCT, SHMT, NJOEM planners,
ESF leads, and ROIC analysts
New Jersey experiences between one and twoNor’Easters every year.
The coastal areas of New Jersey have beenimpacted by Nor’Easters and some eventshave been widespread in the State.
Winter Storms(snow, blizzards, and ice
storms)
Review of past disaster declarations Review of the NCDC Storm Events Database Review of SHELDUS Input from the MCT, SHMT, NJOEM planners,
ESF leads, and ROIC analysts
New Jersey has been impacted by winterstorm events in the past and historic data haveshown a number of winter storms haveimpacted the State.
Six out of 35 federally declared disasters inNew Jersey were winter storm events.
The State’s middle-latitude location results insnow falling in all areas of the state eachwinter.
Seasonal snowfall averages range between 10and 20 inches in the southern third of thestate, 20 to 30 inches in the central third, and30 to 40 inches in the lower elevations of thenorthern third. The higher northern locationsreceive between 40 and 60 inches.
Severe Weather(high winds, tornadoes,thunderstorms, hail, and
extreme temperature)
Review of past disaster declarations Review of the NCDC Storm Events Database Research including the NWS, SPC, new media
and Internet resources Input from the MCT, SHMT, NJOEM planners,
ESF leads, and ROIC analysts
Sixteen out of 35 federally declared disastersin New Jersey were severe storm events.
Earthquakes Researching including USGS, NJGS Input from the MCT, SHMT, NJOEM planners,
There are two factors that increase theearthquake risk in New Jersey: (1) eastern

State of New Jersey 2014 Hazard Mitigation Plan
Page 5.1-5 Section 5.1. State Risk Assessment Overview
Table 5.1-3. Process for Identifying Natural Hazards
Hazard of Concern How the hazard was identified Why the hazard was identified
and ROIC analysts earthquakes affect areas 10 times larger thanwestern ones of the same magnitude; and (2)New Jersey is the most densely populatedstate in the United States.
Numerous fault lines are located in NewJersey.
Earthquakes have impacted New Jersey in thepast. Between 1783 and 2013, there havebeen 181 earthquake events with epicenters inNew Jersey.
Drought
Review of past disaster declarations Review of the U.S. Drought Monitor and
Drought Impact Reporter Research including NRCC, NJDEP Review of the NCDC Storm Events Database Review of SHELDUS Input from the MCT, SHMT, NJOEM planners,
ESF leads, and ROIC analysts
The entire State is subject to the effects ofdrought. Nearly every county in the State hasexperienced at least one drought in the past 10years.
The State has been included in two federallydeclared disasters (emergency declaration andmajor disaster declaration) for drought events.
Wildfire
New Jersey Forest Fire Service statistics Review of the NCDC Storm events Database Review of the WUI Input from the MCT, SHMT, NJOEM planners,
ESF leads, and ROIC analysts
In 2012, there were 946 wildfires in NewJersey, burning over 3,052 acres.
The State has been included in two FEMAfire management assistance declarations.
The New Jersey Pine Barrens has one of themost hazardous fuel types for wildfires in theUnited States.
Each year, an average of 1,500 wildfiresdamage or destroy 7,000 acres in New Jersey.
Geological Hazards(landslides and
subsidence/sinkholes)
Research including NJGS Input from the MCT, SHMT, NJOEM planners,
ESF leads, and ROIC analysts
Naturally occurring subsidence and sinkholesin New Jersey occur within bands ofcarbonate bedrock; in northern New Jersey,there are more than 225 square miles that areunderlain by limestone, dolomite, and marble.In the southern part of New Jersey, there are100 square miles that are underlain by alimesand, with thin limestone layers.
Between 1782 and 2012, there have been 285landslide events in New Jersey.
Coastal Erosion(including enhanceddiscussion of beacherosion and climate
change/sea level rise)
Input from the MCT, SHMT, NJOEM planners,ESF leads, and ROIC analysts
Coastal communities are most affected bycoastal erosion. The Atlantic Ocean makesup the eastern border of New Jersey.
Notes:
ESF Emergency Support Function FEMA Federal Emergency Management Agency
FIRM Flood Insurance Rate Map MCT Mitigation Core Team
NCDC National Climatic Data Center NFIP National Flood Insurance Program
NJDEP New Jersey Department of Environmental Protection NJOEM New Jersey Office of Emergency Management
NRCC Northeast Regional Climate Center NWS National Weather Service
SHELDUS Spatial Hazard Events and Losses Database for the United States SHMT State Hazard Mitigation Team
SRL Severe Repetitive Loss SPC Storm Prediction Center
RL Repetitive Loss ROIC Regional Operations and Intelligence Center
WUI Wildland-Urban Index

State of New Jersey 2014 Hazard Mitigation Plan
Page 5.1-6 Section 5.1. State Risk Assessment Overview
Table 5.1-4. Process for Identifying Human-Caused Hazards
Hazard of Concern How the hazard was identified Why the hazard was identified
Animal Disease Events Input from the MCT, SHMT, NJOEM
planners, ESF leads, ROIC analysts, andDepartment of Agriculture
There are over 10,000 farms in NewJersey totaling over $986 million invalue. Of the $986 million, $135 millionis livestock, poultry and their products.
Animal diseases in New Jersey include:avian influenza, canine influenza, equineherpes virus, eastern equine encephalitis,Johne’s disease, West Nile Virus, andrabies.
Between 2010 and 2012, New Jersey had884 reports of animal rabies cases.
Civil Unrest Input from the MCT, SHMT, NJOEM
planners, ESF leads, and ROIC analysts
There have been reported civil unrestincidents in New Jersey’s history,including the Newark Riots in 1967 thatleft 26 people dead and injured hundreds.
With New Jersey’s close proximity toNew York City, areas of New Jersey maybe targets of civil disturbance.
Crop Failure Input from the MCT, SHMT, NJOEM
planners, ESF leads, ROIC analysts, andDepartment of Agriculture
In 2007, there were 10,327 farms in NewJersey (733,450 acres). The market valueof produce sold was over $900 million.
Fishing Failure Input from the MCT, SHMT, NJOEM
planners, ESF leads, and ROIC analysts
New Jersey’s fishery and aquacultureresources contribute more than $1 billionannually to the State’s economy.
New Jersey is home to six major fishingports: Atlantic City, Barnegat Light,Bedford, Cape May, Point Pleasant, andPort Norris; four of these ranks in the top50 ports in the U.S. (in terms ofeconomic value).
In 2012, Superstorm Sandy caused severeflooding that mandated statewideclosures of waters where shellfish areproduced. Hatcheries were severelydamaged or destroyed. New Jersey’sfishing industry sustained nearly $120million in losses.
The economic conditions of the Statecould be greatly affected by a fishingfailure. In total, the New Jerseycommercial fishing industry brings in anestimated $4.5 billion annually fromfisheries, aquaculture, and recreationalfishing. This is part of a $50 billion-a-year “Coastal Zone” sector of the State’seconomy, which employs one out ofevery six people working in New Jersey.The value of the seafood harvest extendswell beyond the industry itself. Theeffects of a prosperous seafood industryare felt in other waterfront activities suchas shipbuilding, maintenance and repair,support services (equipment, fuel,materials, and supplies), and ecotourism.

State of New Jersey 2014 Hazard Mitigation Plan
Page 5.1-7 Section 5.1. State Risk Assessment Overview
Table 5.1-4. Process for Identifying Human-Caused Hazards
Hazard of Concern How the hazard was identified Why the hazard was identified
Hazardous Waste – FixedSites
Input from the MCT, SHMT, NJOEMplanners, ESF leads, and ROIC analysts
There are 1,593 SARA Title III facilitiesin New Jersey.
Between 2007 and 2011, over 68 millionpounds of chemicals have been releasedin New Jersey.
Hazardous Waste –Transportation
Input from the MCT, SHMT, NJOEMplanners, ESF leads, and ROIC analysts
There are over 39,000 miles of publicroads and approximately 1000 miles ofrail freight lines in New Jersey andincidents involving hazardous materials intransit can occur anywhere in the State.
Between 2007 and 2011, over 15 millionpounds of chemicals have been releasedoff site in New Jersey.
Between 2008 and 2012, there have been1,795 accidents in New Jersey involvinghazardous materials (air, highway, andrail).
Hazardous Waste – Offshore Input from the MCT, SHMT, NJOEM
planners, ESF leads, and ROIC analysts
New Jersey has 14 ports including thePort of New York and New Jersey, whichis a critical link for shipping worldwide.The Port of New York and New Jerseyships a variety of goods, many of whichconsist of hazardous materials.
The ConocoPhillips’ Bayway Refinery islocated in the Cities of Linden andElizabeth and processes 10 milliongallons of crude oil each day.
There are six major petroleum refinerieson the Delaware River shoreline thatprocess nearly one million barrels ofcrude oil each day, as well as otherchemicals associated with the refiningprocess.
There have been several incidentsinvolving hazardous material spillsoffshore of New Jersey that include theM/T ATHOS I releasing 265,000 gallonsof crude oil in the Delaware River in2004, and an Exxon underwater pipelinerupture in 1990 that released 567,000gallons of No. 2 fuel oil into the ArthurKill.
Nuclear Hazard Issues Input from the MCT, SHMT, NJOEM
planners, ESF leads, and ROIC analysts
Three active nuclear power plants arelocated within the State of New Jersey.There are also facilities in neighboringstates that are within the 50-mile ingestionpathway zone that affects New Jersey.
There have been no major incidents inNew Jersey; however, there have been afew minor incidents.
Due to the number of nuclear powerplants in and around New Jersey,incidents will continue to occur.

State of New Jersey 2014 Hazard Mitigation Plan
Page 5.1-8 Section 5.1. State Risk Assessment Overview
Table 5.1-4. Process for Identifying Human-Caused Hazards
Hazard of Concern How the hazard was identified Why the hazard was identified
Pandemic Input from the MCT, SHMT, NJOEM
planners, ESF leads, and ROIC analysts
All 21 counties in New Jersey haveexperienced the effects of a pandemic ordisease outbreak (e.g., influenza).
Due to New Jersey’s densely populatedareas, a pandemic has the potential tospread more quickly.
There are numerous bodies of waterlocated within the State that assist withthe breeding of mosquitos, which can leadto the spread of the West Nile Virus. In2012, there were 46 positive test resultsfor West Nile Virus.
The H1N1 outbreak was widespread inNew Jersey in July 2009, with 1,414confirmed cases and 15 deaths.
As the population density increases inNew Jersey, so will the probability of apandemic event.
Extreme weather conditions in NewJersey can lead to an increase in WestNile Virus outbreaks.
Power Outages Input from the MCT, SHMT, NJOEM
planners, ESF leads, and ROIC analysts
There are four major electric serviceproviders in the State of New Jerseyresponsible for maintaining powerthroughout their respective regions.
Power failures are problematic for homesheated with electricity. Approximately10.7% of the homes in New Jersey areheated with electricity.
New Jersey has a history of widespreadpower outages, including SuperstormSandy in 2012 when 2.7 million peoplewere without power for an extendedperiod of time. In August 2003, there wasa widespread power outage that affectedeight states in the northeast United States,including the State of New Jersey.
Based on past trends and historic poweroutages, New Jersey will continue toexperience power outages.

State of New Jersey 2014 Hazard Mitigation Plan
Page 5.1-9 Section 5.1. State Risk Assessment Overview
Table 5.1-4. Process for Identifying Human-Caused Hazards
Hazard of Concern How the hazard was identified Why the hazard was identified
Terrorism Input from the MCT, SHMT, NJOEM
planners, ESF leads, and ROIC analysts
Terrorist attacks can occur anywhere;however, New Jersey is an attractivetarget because of its dense population andlocation relative to major urban areas.
New Jersey is also home to the busiestcommuter rail system in the UnitedStates, as well as the headquarters ofmajor corporations for the financial andpharmaceutical industries.
Targets in New Jersey include criticalinfrastructure such as utilities, roadways,bridges, tunnels, hospitals, schools, civiccenters, and reservoirs.
There have been several terrorist attacksin New Jersey’s history and there is thepotential for future occurrences.
Cyber Attack Input from the MCT, SHMT, NJOEM
planners, ESF leads, and ROIC analysts
New Jersey is located along a heavytransit corridor of people and goods,which makes the State a vulnerable target.
There have been reports of cyber-attacksin New Jersey, but on the smaller scale.
Economic Collapse Input from the MCT, SHMT, NJOEM
planners, ESF leads, and ROIC analysts
Economic collapse could impact theentire State.
There have been two reported economiccollapses in New Jersey’s history, andanother economic collapse could occur inthe future.
Notes:
ESF Emergency Support Function H1N1 Influenza A
MCT Mitigation Core Team NJOEM New Jersey Office of Emergency Management
ROIC Regional Operations and Intelligence Center SHMT State Hazard Mitigation Team
5.1.2 Presidential Disaster Declarations
The State of New Jersey’s disaster history provides direction on the identification of hazards and their
significance to the State. Of the 49 federal disasters declared in New Jersey from 1955 to 2012, New Jersey
received 35 major disaster declarations; 12 emergency declarations; and two fire emergency assistance
declarations. These events included the following hazard events:
Two coastal storm events
Two drought events
Three fire events
Eight flood events
Ten hurricane events
Two other events (virus threat; power outage)
Fifteen severe storm events
Seven snow events
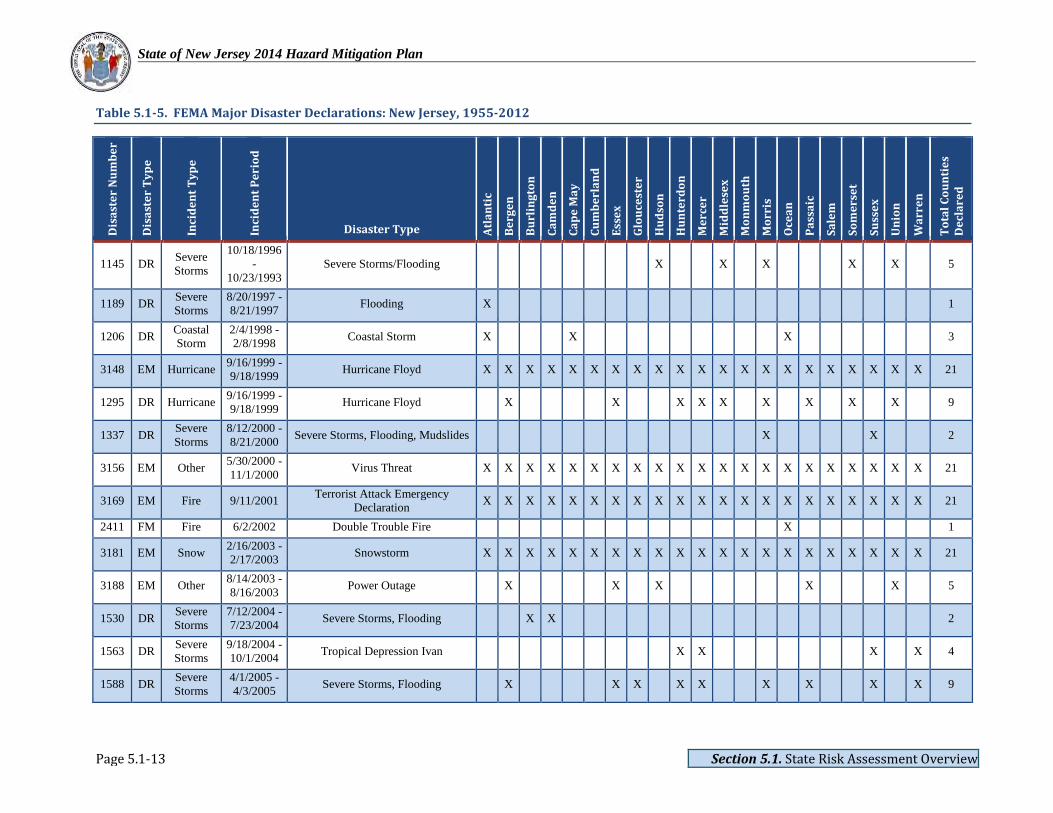
Table 5.1-5 outlines (in chronological order) each FEMA major disaster declaration that New Jersey has
received since 1955. This establishes the vulnerability and historic occurrences of hazards that the State of
New Jersey regularly experiences.

State of New Jersey 2014 Hazard Mitigation Plan
Page 5.1-12 Section 5.1. State Risk Assessment Overview
Table 5.1-5. FEMA Major Disaster Declarations: New Jersey, 1955-2012D
isa
ste
rN
um
be
r
Dis
ast
er
Ty
pe
Inci
de
nt
Ty
pe
Inci
de
nt
Pe
rio
d
Disaster Type Atl
an
tic
Be
rge
n
Bu
rlin
gto
n
Ca
md
en
Ca
pe
Ma
y
Cu
mb
erl
an
d
Ess
ex
Glo
uce
ste
r
Hu
dso
n
Hu
nte
rdo
n
Me
rce
r
Mid
dle
sex
Mo
nm
ou
th
Mo
rris
Oce
an
Pa
ssa
ic
Sa
lem
So
me
rse
t
Su
sse
x
Un
ion
Wa
rre
n
To
tal
Co
un
tie
sD
ecl
are
d
41 DR Hurricane 8/20/1955 Hurricane, Flooding Not Available
124 DR Flood3/6/1962 -3/8/1962
Severe Storm, High Tides, Flooding Not Available
205 DR Drought 8/18/1965 Water Shortage X X X X X X X X X X X X X X X X X X X X X 21
245 DR Flood 6/18/1968 Heavy Rains, Flooding X X X X X X X 7
310 DR Flood 9/4/1971 Heavy Rains, Flooding X X X X X X X X X X X X X X X X X X X X X 21
402 DR Flood 8/7/1973 Severe Storms, Flooding X X X X 4
3005 EMCoastalStorm
12/24/1974Severe Storms, High Winds, High
TidesX 1
477 DR Flood 7/23/1975Heavy Rains, High Winds, Hail,
TornadoesX X X X X X X X X X X X X 13
519 DR Flood 8/21/1976 Severe Storms, High Winds, Flooding X X X X 4
528 DR Snow 2/8/1977 Ice Conditions X X X X X X X X X 9
3083 EM Drought 10/19/1980 Water Shortage X X X X X X X X X X X X X X X X X X X X X 21
701 DR Flood3/28/1984 -
4/8/1984Coastal Storms, Flooding X X X X X X X X 8
749 DR Hurricane 9/27/1985 Hurricane Gloria X X X X 4
936 DRSevereStorms
1/4/1992 Severe Coastal Storm X X X X X 5
973 DR Flood12/10/1992
-12/17/1992
Coastal Storm, High Tides, HeavyRain, Flooding
X X X X X X X X X X X X 12
3106 EM Snow3/13/1993 -3/17/1993
Severe Blizzard X X X X X X X X X X X X X X X X X X X X X 21
1088 DR Snow1/7/1996 -1/12/1996
Blizzard X X X X X X X X X X X X X X X X X X X X X 21
State of New Jersey 2014 Hazard Mitigation Plan
Page 5.1-13 Section 5.1. State Risk Assessment Overview
Table 5.1-5. FEMA Major Disaster Declarations: New Jersey, 1955-2012D
isa
ste
rN
um
be
r
Dis
ast
er
Ty
pe
Inci
de
nt
Ty
pe
Inci
de
nt
Pe
rio
d
Disaster Type Atl
an
tic
Be
rge
n
Bu
rlin
gto
n
Ca
md
en
Ca
pe
Ma
y
Cu
mb
erl
an
d
Ess
ex
Glo
uce
ste
r
Hu
dso
n
Hu
nte
rdo
n
Me
rce
r
Mid
dle
sex
Mo
nm
ou
th
Mo
rris
Oce
an
Pa
ssa
ic
Sa
lem
So
me
rse
t
Su
sse
x
Un
ion
Wa
rre
n
To
tal
Co
un
tie
sD
ecl
are
d
1145 DRSevereStorms
10/18/1996-
10/23/1993Severe Storms/Flooding X X X X X 5
1189 DRSevereStorms
8/20/1997 -8/21/1997
Flooding X 1
1206 DRCoastalStorm
2/4/1998 -2/8/1998
Coastal Storm X X X 3
3148 EM Hurricane9/16/1999 -9/18/1999
Hurricane Floyd X X X X X X X X X X X X X X X X X X X X X 21
1295 DR Hurricane9/16/1999 -9/18/1999
Hurricane Floyd X X X X X X X X X 9
1337 DRSevereStorms
8/12/2000 -8/21/2000
Severe Storms, Flooding, Mudslides X X 2
3156 EM Other5/30/2000 -11/1/2000
Virus Threat X X X X X X X X X X X X X X X X X X X X X 21
3169 EM Fire 9/11/2001Terrorist Attack Emergency
DeclarationX X X X X X X X X X X X X X X X X X X X X 21
2411 FM Fire 6/2/2002 Double Trouble Fire X 1
3181 EM Snow2/16/2003 -2/17/2003
Snowstorm X X X X X X X X X X X X X X X X X X X X X 21
3188 EM Other8/14/2003 -8/16/2003
Power Outage X X X X X 5
1530 DRSevereStorms
7/12/2004 -7/23/2004
Severe Storms, Flooding X X 2
1563 DRSevereStorms
9/18/2004 -10/1/2004
Tropical Depression Ivan X X X X 4
1588 DRSevereStorms
4/1/2005 -4/3/2005
Severe Storms, Flooding X X X X X X X X X 9

State of New Jersey 2014 Hazard Mitigation Plan
Page 5.1-14 Section 5.1. State Risk Assessment Overview
Table 5.1-5. FEMA Major Disaster Declarations: New Jersey, 1955-2012D
isa
ste
rN
um
be
r
Dis
ast
er
Ty
pe
Inci
de
nt
Ty
pe
Inci
de
nt
Pe
rio
d
Disaster Type Atl
an
tic
Be
rge
n
Bu
rlin
gto
n
Ca
md
en
Ca
pe
Ma
y
Cu
mb
erl
an
d
Ess
ex
Glo
uce
ste
r
Hu
dso
n
Hu
nte
rdo
n
Me
rce
r
Mid
dle
sex
Mo
nm
ou
th
Mo
rris
Oce
an
Pa
ssa
ic
Sa
lem
So
me
rse
t
Su
sse
x
Un
ion
Wa
rre
n
To
tal
Co
un
tie
sD
ecl
are
d
3257 EM Hurricane8/29/2005 -10/1/2005
Hurricane Katrina Evacuation X X X X X X X X X X X X X X X X X X X X X 21
1653 DRSevereStorms
6/23/2006 -7/10/2006
Severe Storms, Flooding X X X X 4
1694 DRSevereStorms
4/14/2007 -4/20/2007
Severe Storms, Inland and CoastalFlooding
X X X X X X X X X X X X X X 14
2695 FM Fire 5/15/2007 Warren Grove Fire X X 2
1867 DRSevereStorms
11/11/2009-
11/15/2009
Severe Storms and FloodingAssociated with Tropical Depression
Ida and a Nor'easterX X X 3
1873 DR Snow12/19/2009
-12/20/2009
Snowstorm X X X X X X X 7
1889 DR Snow2/5/2010 -2/6/2010
Severe Winter Storm, Snowstorm X X X X X X X 7
1897 DRSevereStorms
3/12/2010 -4/15/2010
Severe Storms, Flooding X X X X X X X X X X X X X X X X 16
1954 DR Snow12/26/2010
-12/27/2010
Severe Winter Storm, Snowstorm X X X X X X X X X X X X X X X 15
3332 EM Hurricane8/26/2011 -
9/5/2011Hurricane Irene X X X X X X X X X X X X X X X X X X X X X 21
4021 DR Hurricane8/27/2011 -
9/5/2011Hurricane Irene X X X X X X X X X X X X X X X X X X X X X 21
4033 DRSevereStorms
8/13/2011 -8/15/2011
Severe Storms, Flooding X X X 3
4039 DRSevereStorms
9/28/2011 -10/6/2011
Remnants of Tropical Storm Lee X X X X X 5
4048 DR Severe 10/29/2011 Severe Storm X X X X X X X X X X 10

State of New Jersey 2014 Hazard Mitigation Plan
Page 5.1-15 Section 5.1. State Risk Assessment Overview
Table 5.1-5. FEMA Major Disaster Declarations: New Jersey, 1955-2012D
isa
ste
rN
um
be
r
Dis
ast
er
Ty
pe
Inci
de
nt
Ty
pe
Inci
de
nt
Pe
rio
d
Disaster Type Atl
an
tic
Be
rge
n
Bu
rlin
gto
n
Ca
md
en
Ca
pe
Ma
y
Cu
mb
erl
an
d
Ess
ex
Glo
uce
ste
r
Hu
dso
n
Hu
nte
rdo
n
Me
rce
r
Mid
dle
sex
Mo
nm
ou
th
Mo
rris
Oce
an
Pa
ssa
ic
Sa
lem
So
me
rse
t
Su
sse
x
Un
ion
Wa
rre
n
To
tal
Co
un
tie
sD
ecl
are
d
Storms
4070 DRSevereStorms
6/30/2012 Severe Storms, Straight-Line Winds X X X 3
3354 EM Hurricane10/26/2012- 11/8/2012
Hurricane Sandy X X X X X X X X X X X X X X X X X X X X X 21
4086 DR Hurricane10/26/2012- 11/8/2012
Hurricane Sandy X X X X X X X X X X X X X X X X X X X X X 21
Notes:
DR Major Disaster Declarations EM Emergency Declaration
FM Fire Management Assistance Declarations

State of New Jersey 2014 Hazard Mitigation Plan
Page 5.1-16 Section 5.1. State Risk Assessment Overview
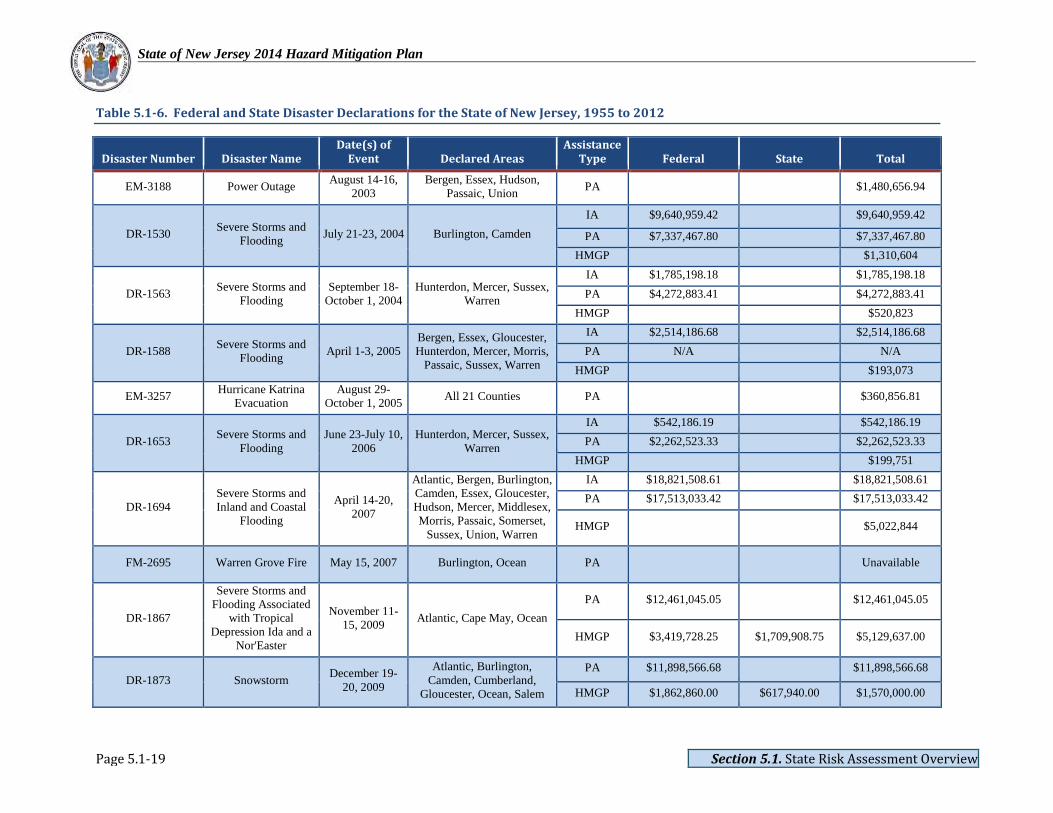
Table 5.1-6 provides an itemized list of state and federal disaster declarations for the State of New Jersey. It includes a summary of assistance funding
disbursed as a result of each past disaster declaration. This table was changed from the 2011 Plan to list disaster declarations in chronological order,
and remove assistance type for disaster declarations prior to FEMA being founded in 1979. In addition, total funding was updated as provided by
FEMA Region II. The funding is distributed in the following categories:
Public Assistance (PA) project grants - Supplemental disaster assistance for states, local governments, and private non-profit organizations
after declared disasters or emergencies
Hazard Mitigation Grant Program (HMGP) project grants - To prevent future losses of lives and property caused disasters. Presidential
declaration of a major disaster or emergency is designated for hazard mitigation assistance.
Individual Assistance (IA) includes Individual Household Program (IHP; formerly named Individual and Family Grant Program [IFG]) -
Grants to individuals to provide funds for the serious needs and necessary expenses of disaster victims. NOTE: Individual assistance funding
includes loans and grants under the FEMA Disaster Housing, State IFG Program, and/or SBA Home and Business Loan Programs.
Table 5.1-6. Federal and State Disaster Declarations for the State of New Jersey, 1955 to 2012
Disaster Number Disaster NameDate(s) of
Event Declared AreasAssistance
Type Federal State Total
DR-41 Hurricane and Floods August 20, 1955 Not available Unavailable
DR-124Severe Storm, HighTides, and Flooding
March 9, 1962 Not available Unavailable
DR-205Water Shortage
(Drought)August 18, 1965 All 21 Counties Unavailable
DR-245Heavy Rains and
FloodingJune 18, 1968
Bergen, Essex, Middlesex,Morris, Passaic, Somerset,
UnionUnavailable
DR-310Heavy Rains and
FloodingSeptember 4,
1971All 21 Counties Unavailable
DR-402Severe Storms and
FloodingAugust 7, 1973
Essex, Middlesex, Somerset,Union
Unavailable

State of New Jersey 2014 Hazard Mitigation Plan
Page 5.1-17 Section 5.1. State Risk Assessment Overview
Table 5.1-6. Federal and State Disaster Declarations for the State of New Jersey, 1955 to 2012
Disaster Number Disaster NameDate(s) of
Event Declared AreasAssistance
Type Federal State Total
EM-3005Severe Storms, High
Winds, and HighTides
December 24,1974
Cape May Unavailable
DR-477Heavy Rains, HighWinds, Hail, and
TornadoesJuly 23, 1975
Bergen, Burlington,Cumberland, Essex,Gloucester, Mercer,
Middlesex, Morris, Passaic,Somerset, Sussex, Union
Unavailable
DR-519Severe Storms, HighWinds, and Flooding
August 21, 1976Atlantic, Cape May,Monmouth, Ocean
Unavailable
DR-528 Ice Conditions February 8, 1977
Atlantic, Burlington,Camden, Cape May,
Cumberland, Gloucester,Middlesex, Monmouth,
Ocean, Salem
Unavailable
EM-3083Water Shortage
(Drought)October 19,
1980All 21 Counties
PA Unavailable
HMGP Unavailable
DR-701Coastal Storms and
FloodingMarch 28-April
8, 1984
Atlantic, Bergen, Cape May,Essex, Monmouth, Morris,
Ocean, Passaic
IA Unavailable
PA Unavailable
HMGP Unavailable
DR-749 Hurricane GloriaSeptember 27,
1985Atlantic, Cape May,
Cumberland, Monmouth
PA Unavailable
HMGP Unavailable
DR-936 Severe Coastal Storm January 4, 1992Atlantic, Cape May,
Cumberland, Monmouth,Ocean
PA Unavailable
HMGP $250,736
DR-973Coastal Storm, HighTides, Heavy Rain,
and Flooding
December 10-17, 1992
Atlantic, Bergen, Cape May,Cumberland, Essex, Hudson,
Middlesex, Monmouth,Ocean, Salem, Somerset,
Union
IA Unavailable
PA Unavailable
HMGP $2,061,868

State of New Jersey 2014 Hazard Mitigation Plan
Page 5.1-18 Section 5.1. State Risk Assessment Overview
Table 5.1-6. Federal and State Disaster Declarations for the State of New Jersey, 1955 to 2012
Disaster Number Disaster NameDate(s) of
Event Declared AreasAssistance
Type Federal State Total
EM-3106 Severe BlizzardMarch 13-17,
1993All 21 Counties
PA Unavailable
HMGP Unavailable
DR-1088Severe Snow Storm
(Blizzard of '96)January 7-12,
1996All 21 Counties
PA Unavailable
HMGP Unavailable
DR-1145Severe Storms and
FloodingOctober 18-23,
1996Hudson, Middlesex, Morris,
Somerset, Union
IA Unavailable
HMGP $298,688
DR-1189Severe Storms and
FloodingAugust 20-21,
1997Atlantic
IA Unavailable
PA Unavailable
HMGP $358,416
DR-1206Severe Winter CoastalStorm, High Winds,
Flooding
February 4-8,1998
Atlantic, Cape May, Ocean
IA Unavailable
PA Unavailable
HMGP $476,631
DR-1295 Hurricane FloydSeptember 16-
18, 1999
Bergen, Essex, Hunterdon,Mercer, Middlesex, Morris,Passaic, Somerset, Union
IA Unavailable
PA $38,703,382.74 $38,703,382.74
HMGP $10,345,765
EM-3148 Hurricane FloydSeptember 16-
18, 1999All 21 Counties PA $2,032,513.93
EM-3156 West Nile VirusMay 30-
November 1,2000
All 21 Counties PA $2,440,546.55
DR-1337Severe Storms,Flooding, and
Mudslides
August 12-21,2000
Morris, Sussex
IA Unavailable
PA $4,697,327.57 $4,697,327.57
HMGP $950,900
EM-3169 Terrorist AttackSeptember 11,
2001All 21 Counties PA $88,203,232.21
FM-2411Double Trouble
WildfireJune 2, 2002 Ocean PA Unavailable
EM-3181 SnowFebruary 16-17,
2003All 21 Counties PA $36,139,478.42
State of New Jersey 2014 Hazard Mitigation Plan
Page 5.1-19 Section 5.1. State Risk Assessment Overview
Table 5.1-6. Federal and State Disaster Declarations for the State of New Jersey, 1955 to 2012
Disaster Number Disaster NameDate(s) of
Event Declared AreasAssistance
Type Federal State Total
EM-3188 Power OutageAugust 14-16,
2003Bergen, Essex, Hudson,
Passaic, UnionPA $1,480,656.94
DR-1530Severe Storms and
FloodingJuly 21-23, 2004 Burlington, Camden
IA $9,640,959.42 $9,640,959.42
PA $7,337,467.80 $7,337,467.80
HMGP $1,310,604
DR-1563Severe Storms and
FloodingSeptember 18-
October 1, 2004Hunterdon, Mercer, Sussex,
Warren
IA $1,785,198.18 $1,785,198.18
PA $4,272,883.41 $4,272,883.41
HMGP $520,823
DR-1588Severe Storms and
FloodingApril 1-3, 2005
Bergen, Essex, Gloucester,Hunterdon, Mercer, Morris,
Passaic, Sussex, Warren
IA $2,514,186.68 $2,514,186.68
PA N/A N/A
HMGP $193,073
EM-3257Hurricane Katrina
EvacuationAugust 29-
October 1, 2005All 21 Counties PA $360,856.81
DR-1653Severe Storms and
FloodingJune 23-July 10,
2006Hunterdon, Mercer, Sussex,
Warren
IA $542,186.19 $542,186.19
PA $2,262,523.33 $2,262,523.33
HMGP $199,751
DR-1694Severe Storms andInland and Coastal
Flooding
April 14-20,2007
Atlantic, Bergen, Burlington,Camden, Essex, Gloucester,Hudson, Mercer, Middlesex,Morris, Passaic, Somerset,
Sussex, Union, Warren
IA $18,821,508.61 $18,821,508.61
PA $17,513,033.42 $17,513,033.42
HMGP $5,022,844
FM-2695 Warren Grove Fire May 15, 2007 Burlington, Ocean PA Unavailable
DR-1867
Severe Storms andFlooding Associated
with TropicalDepression Ida and a
Nor'Easter
November 11-15, 2009
Atlantic, Cape May, Ocean
PA $12,461,045.05 $12,461,045.05
HMGP $3,419,728.25 $1,709,908.75 $5,129,637.00
DR-1873 SnowstormDecember 19-
20, 2009
Atlantic, Burlington,Camden, Cumberland,
Gloucester, Ocean, Salem
PA $11,898,566.68 $11,898,566.68
HMGP $1,862,860.00 $617,940.00 $1,570,000.00

State of New Jersey 2014 Hazard Mitigation Plan
Page 5.1-20 Section 5.1. State Risk Assessment Overview
Table 5.1-6. Federal and State Disaster Declarations for the State of New Jersey, 1955 to 2012
Disaster Number Disaster NameDate(s) of
Event Declared AreasAssistance
Type Federal State Total
DR-1889Severe Winter Storm
and SnowstormFebruary 5-6,
2010
Atlantic, Burlington,Camden, Cape May,
Cumberland, Gloucester,Salem
PA $13,770,410.46 $ 13,432,189.14 $27,202,599.60
HMGP $1,913,345.25 $637,781.73 $2,551,127.00
DR-1897Severe Storms and
FloodingMarch 12-April
15, 2010
Atlantic, Bergen, Burlington,Cape May, Cumberland,
Essex, Gloucester,Hunterdon, Mercer,
Middlesex, Monmouth,Morris, Ocean, Passaic,
Somerset, Union
IA $16,920,234.13 $16,920,234.13
PA $30,742,405.66 $24,667,127.84 $55,409,533.50
HMGP $5,153,859.64 $1,717,953.21 $6,871,812.85
DR-1954Severe Winter Storm
and SnowstormDecember 26-
27, 2010
Atlantic, Bergen, Burlington,Cape May, Cumberland,Essex, Hudson, Mercer,Middlesex, Monmouth,Morris, Ocean, Passaic,
Somerset, Union
PA $50,662,080.83 $ 44,504,231.42 $95,166,312.25
HMGP $7,247,261.10 $3,972,803.90 $11,220,065.00
DR-4033Severe Storms and
FloodingAugust 13-15,
2011Cumberland, Gloucester,
Salem
PA $4,151,239.58 $1,064,555.52 $5,215,795.10
HMGP $1,438,007.00 $453,973.00 $1,891,980.00
EM-3332 Hurricane IreneAugust 26-
September 5,2011
All 21 Counties PA See DR-4021
DR-4021 Hurricane IreneAugust 27-
September 5,2011
All 21 Counties
IA $176,949,241.27 $176,949,241.27
PA $114,403,945.05 $71,140,286.73 $185,544,231.78
HMGP $48,002,753.00 $17,031,101.29 $65,033,854.29
DR-4033Severe Storms and
FloodingAugust 13-15,
2011Cumberland, Gloucester,
Salem
PA $4,151,239.58 $1,064,555.52 $5,215,795.10
HMGP $1,438,007.00 $453,973.00 $1,891,980.00
DR-4039Remnants of Tropical
Storm LeeSeptember 28-
October 6, 2011Hunterdon, Mercer, Passaic,
Sussex, Warren
PA $4,152,279.29 $1,760,635.56 $5,912,914.85
HMGP $1,200,000.00 $400,000.00 $1,600,000.00
DR-4048 Severe StormOctober 29,
2011
Bergen, Cape May, Essex,Hunterdon, Middlesex,
Morris, Passaic, Somerset,Sussex, Union, Warren
PA $24,843,185.64 $16,033,991.07 $40,877,176.71
HMGP $3,533,500.00 $3,717,250.00 $7,317,417.00

State of New Jersey 2014 Hazard Mitigation Plan
Page 5.1-21 Section 5.1. State Risk Assessment Overview
Table 5.1-6. Federal and State Disaster Declarations for the State of New Jersey, 1955 to 2012
Disaster Number Disaster NameDate(s) of
Event Declared AreasAssistance
Type Federal State Total
DR-4070Severe Storms and
Straight-Line WindsJune 30, 2012 Atlantic, Cumberland, Salem
PA $9,744,730.09 $9,744,730.09
HMGP $1,485,312.56 $343,662.52 $1,374,650.08
DR-4086 Hurricane SandyOctober 26-November 8,
2012All 21 Counties
IA $407,177,760.94 $407,177,760.94
PA $830,241,825.63 $830,241,825.63
HMGP In process
EM-3354 Hurricane SandyOctober 26-November 8,
2012All 21 Counties PA See DR-4086
Notes:
DR Major Disaster Declaration
EM Emergency Declarations
FM Fire Management Assistance Declarations
HMGP Hazard Mitigation Grant Program
IA Individual Assistance
PA Public Assistance

State of New Jersey 2014 Hazard Mitigation Plan
Page 5.1-22 Section 5.1. State Risk Assessment Overview
5.1.3 Hazard Profile
44 CFR §201.4(c)(2)(i): The risk assessment shall include the following: An overview of the type andlocation of all natural hazards that can affect the State, including information on previous occurrences ofhazard events, as well as the probability of future events, using maps where appropriate.
During the profiling process for hazard events, planners considered historical records, information regarding
the geographic area, and the probability of future occurrences. As part of the 2014 Plan update, each hazard
was reconsidered and new information was added for the period from 2010 to 2012. The hazard profiles
section of the 2014 HMP update contains the following subsections:
General background information, including a description of all natural and human-caused hazards of
concern. The hazard description provides a definition and description of each hazard, including any
indices and/or classifications pertaining to the hazard of concern.
Information regarding the geographic location and extent of the hazard, including detailed maps. A
description of the geographic boundaries in the State that may be affected by each hazard is included.
The anticipated magnitude and severity of the hazard, such as wind speeds, peak ground acceleration,
and meteorological measurements are discussed in this section as well.
Previous Occurrence section includes an overview of past significant events that occurred in the State
before 2013, with special emphasis on the 36 months between January 1, 2010 and December 31,
2012. This section includes damages, level of severity, dates and duration of events, and sources of
information used to obtain the information. Federal, state, and local sources were reviewed to obtain
the historic information. Research was based on events that caused fatalities, injuries, property
damages, and/or crop damages.
Discussions and analyses of each hazard’s probability for future occurrence, severity, warning time
and secondary hazards are included. The probability of future occurrences are based on the number of
past events divided by the number of years researched to determine the percentage.
Potential change in climate and its impacts on the hazards of concern are discussed.
5.1.4 Vulnerability Assessment
44 CFR §201.4(c)(2)(ii): An overview and analysis of the State's vulnerability to the hazards describedin this paragraph (c)(2), based on estimates provided in local risk assessments as well as the State riskassessment. The State shall describe vulnerability in terms of the jurisdictions most threatened by theidentified hazards, and most vulnerable to damage and loss associated with hazard events. State ownedor operated critical facilities located in the identified hazard areas shall also be addressed;
44 CFR §201.4(c)(2)(iii): An overview and analysis of potential losses to the identified vulnerablestructures, based on estimates provided in local risk assessments as well as the State risk assessment.The State shall estimate the potential dollar losses to State-owned or -operated buildings, infrastructure,and critical facilities located in the identified hazard areas.
For the 2014 Plan update, the vulnerability assessment for each hazard follows its hazard profile, so that all
information about a particular hazard is found in one section. A statewide risk assessment was conducted with
results summarized at the county level. As discussed below, the 2014 Plan update contains an enhanced
vulnerability assessment. New to this Plan update, the New Jersey Office of Management and Budget (OMB)
within the Department of Treasury provided the Statewide Land and Building Asset Management (LBAM)
database to use as the state building dataset for the risk assessment. The critical facility and infrastructure
State of New Jersey 2014 Hazard Mitigation Plan
Page 5.1-23 Section 5.1. State Risk Assessment Overview
dataset was also expanded to include additional types. In addition, because increased numbers of local HMPs
are available, a more in-depth discussion of their results is incorporated throughout this section.
Between 2009 and 2012, the New Jersey Department of Transportation (NJDOT) conducted two separate risk
assessments of its assets. The first assessment was of NJDOT-owned and other state transportation agency-
owned bridges and other public use infrastructure. During this same time period, it also conducted a risk
assessment of NJDOT buildings, maintenance yards, and traffic operations centers. The risk assessments are
considered sensitive security information by the United States Department of Homeland Security and the
NJOHSP, but are available on a need to know basis.
Post-Superstorm Sandy, the NJ Transit has made significant progress repairing the damage, restoring
operations and working toward making the transit system more resilient against future storms. Close
coordination will continue with state agencies and federal partners through the NJ Transit Commissioner’s
office. Emergency preparedness is coordinated through the NJ Transit Office of Emergency Management. NJ
Transit is conducting an agency wide counter-terrorism risk assessment. This risk assessment will be used to
identify vulnerabilities to terrorism and identify mitigation measures. The risk assessment is not public
information. For more detailed information on the NJ Transit’s impacts from Superstorm Sandy, refer to
Appendix D.
The Port Authority of New York & New Jersey (PANYNJ) has embarked upon two new risk assessment
efforts since experiencing severe damages from Superstorm Sandy. A consultant has been hired to identify
various realistic cyclonic events of concern (Hurricanes and Nor’Easters) and identify the risks, vulnerabilities,
and mitigation options throughout the entire PANYNJ inventory of facilities. Cost benefit analysis for all
proposed resilience and mitigation projects will be conducted to aid the PANYNJ in prioritizing its funding
resources. Another contract has been issued to a consultant to develop real time surge modeling data for actual
approaching storms to better enable preventative responses from PANYNJ personnel.
This vulnerability assessment section outlines vulnerability assessments by jurisdiction and of state facilities,
estimates the potential losses to each and discusses potential impacts on the environment. Further, new
development in hazard-prone areas is discussed by hazard.
Assessing Vulnerability by Jurisdiction
For the purpose of this Plan, the State of New Jersey has defined “jurisdiction” as its counties; whereas local
HMPs defined jurisdictions as municipalities and special-purpose districts. Each local HMP was consulted,
and the identification process for the hazards of concern, risk ranking (if any), and exposure and loss
estimation methodology were reviewed for each hazard. Table 5.1-2 earlier in this section summarizes the
hazards of concern identified in each local plan.
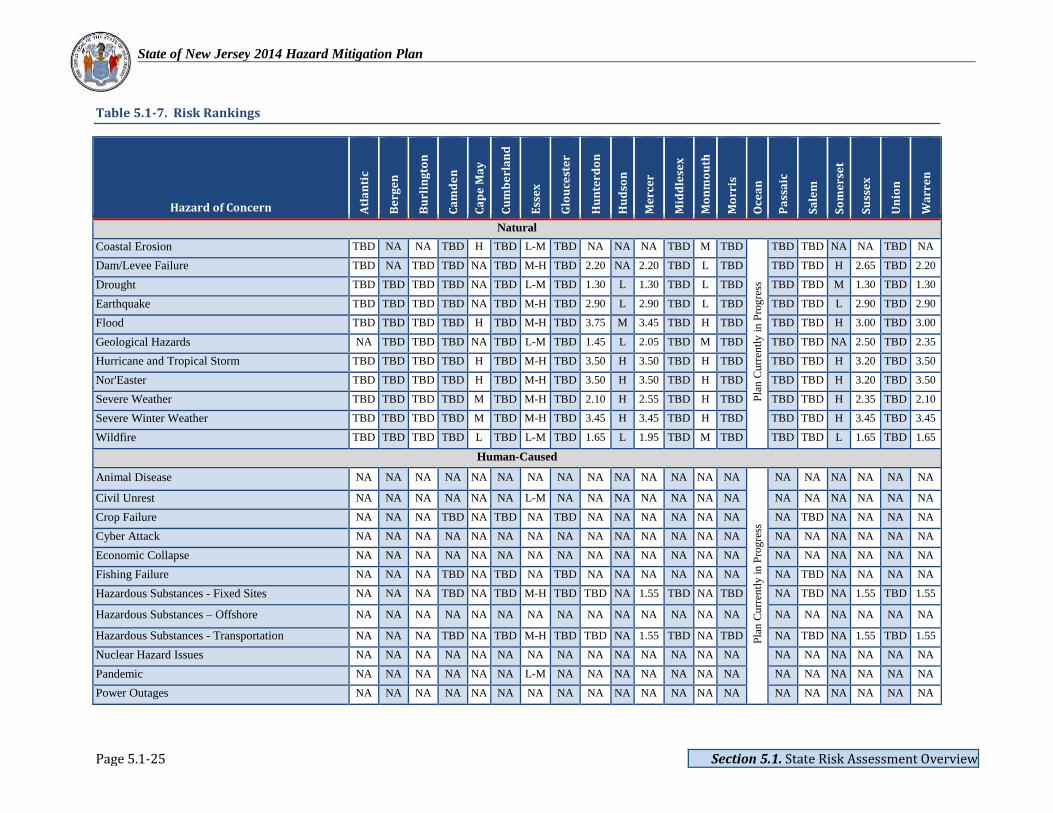
In terms of risk ranking, not every local plan ranked the risk of the hazards profiled. If the local HMP did not
conduct a risk ranking, the jurisdictions prioritized mitigation actions and identified their most significant
hazards using other methods. The local HMPs that ranked the hazards did not use a consistent methodology.
In some cases, a risk quantitative ranking process was used; however, the results were not categorized as high,
medium, or low. Table 5.1-7 below summarizes the risk rankings as presented in the local HMPs. If the local
HMP identified the hazard as a concern but did not rank the hazard, then ‘TBD’ (risk ranking is to be
determined) is noted in Table 5.1-7. If the local HMP determined the hazard does not impact the County and
the hazard was not evaluated, or the local HMP did not consider human-caused hazards, then ‘NA’ (not
applicable) is noted in Table 5.1-7.

State of New Jersey 2014 Hazard Mitigation Plan
Page 5.1-24 Section 5.1. State Risk Assessment Overview
When available, local HMP risk rankings were considered when assessing vulnerability by jurisdiction for the
2014 Plan update. These rankings are discussed in the specific hazard sections under ‘Assessing Vulnerability
by Jurisdiction’ (Sections 5.2 through 5.23).
The evaluation and roll-up of local HMP risk assessments into the State Plan proved challenging due to
inconsistent hazard data, population and building data and overall methodologies being used at the local level.
The State recognizes these challenges and has proposed annual technical updates to the SHMP as outlined in
the updated Section 7 (Plan Maintenance). Currently all local HMPs have been funded for updates. With the
exception of Somerset and Ocean Counties, the remaining local HMPs will be completed between 2014 and
2017. NJOEM has identified a new mitigation action to provide technical assistance regarding hazard
mitigation plan updates to ensure consistency for reporting risk ranking and other elements to local HMPs
(refer to Section 6, Table 6-14). The State risk assessment will continue to be enhanced using updated local
HMPs as they are completed.
Therefore, for the purposes of the 2014 Plan, a statewide vulnerability assessment was conducted to ensure
consistent asset data (population and buildings) and hazard areas were used. The planning consultant
collaborated with the subject-matter experts listed in Table 2-2 and Table 2-5 (Section 2, Planning Process) to
identify the most appropriate risk assessment methodology and best available data for the State. The results of
this analysis may be used for future local mitigation plan updates.
To determine exposure, a spatial analysis was conducted in GIS using the best available defined hazard
boundaries, the 2010 Census block population and default HAZUS-MH general building stock inventory.
When the analysis determined that a hazard could impact the area in a jurisdiction, these locations were
deemed potentially vulnerable to the hazard. The estimated population and general building stock located
within defined hazard boundaries is reported by County. For hazards of concern with defined hazard
boundaries, the area (square miles) of each County in the hazard boundary is calculated and reported.
The limitations of the analysis conducted at a Census-block level are recognized and the results presented
should only be viewed as estimates. The population exposure analyses do not account for the increase in
population (of both residents and tourists) during the summer months, or the changes in occupancy of homes
seasonally or post-Superstorm Sandy. In terms of population and building exposure, a Census-block centroid
analysis was conducted which can under or over- estimate exposure and potential loss. When statewide
building footprint data becomes available, the risk assessment will be updated.
Additional details regarding the methodology and hazard data used are included in each hazard section
(Sections 5.2 through 5.23) within the Vulnerability Assessment subsection.
State of New Jersey 2014 Hazard Mitigation Plan
Page 5.1-25 Section 5.1. State Risk Assessment Overview
Table 5.1-7. Risk Rankings
Hazard of Concern Atl
an
tic
Be
rge
n
Bu
rlin
gto
n
Ca
md
en
Ca
pe
Ma
y
Cu
mb
erl
an
d
Ess
ex
Glo
uce
ste
r
Hu
nte
rdo
n
Hu
dso
n
Me
rce
r
Mid
dle
sex
Mo
nm
ou
th
Mo
rris
Oce
an
Pa
ssa
ic
Sa
lem
So
me
rse
t
Su
sse
x
Un
ion
Wa
rre
n
Natural
Coastal Erosion TBD NA NA TBD H TBD L-M TBD NA NA NA TBD M TBD
Pla
nC
urr
entl
yin
Pro
gre
ss
TBD TBD NA NA TBD NA
Dam/Levee Failure TBD NA TBD TBD NA TBD M-H TBD 2.20 NA 2.20 TBD L TBD TBD TBD H 2.65 TBD 2.20
Drought TBD TBD TBD TBD NA TBD L-M TBD 1.30 L 1.30 TBD L TBD TBD TBD M 1.30 TBD 1.30
Earthquake TBD TBD TBD TBD NA TBD M-H TBD 2.90 L 2.90 TBD L TBD TBD TBD L 2.90 TBD 2.90
Flood TBD TBD TBD TBD H TBD M-H TBD 3.75 M 3.45 TBD H TBD TBD TBD H 3.00 TBD 3.00
Geological Hazards NA TBD TBD TBD NA TBD L-M TBD 1.45 L 2.05 TBD M TBD TBD TBD NA 2.50 TBD 2.35
Hurricane and Tropical Storm TBD TBD TBD TBD H TBD M-H TBD 3.50 H 3.50 TBD H TBD TBD TBD H 3.20 TBD 3.50
Nor'Easter TBD TBD TBD TBD H TBD M-H TBD 3.50 H 3.50 TBD H TBD TBD TBD H 3.20 TBD 3.50
Severe Weather TBD TBD TBD TBD M TBD M-H TBD 2.10 H 2.55 TBD H TBD TBD TBD H 2.35 TBD 2.10
Severe Winter Weather TBD TBD TBD TBD M TBD M-H TBD 3.45 H 3.45 TBD H TBD TBD TBD H 3.45 TBD 3.45
Wildfire TBD TBD TBD TBD L TBD L-M TBD 1.65 L 1.95 TBD M TBD TBD TBD L 1.65 TBD 1.65
Human-Caused
Animal Disease NA NA NA NA NA NA NA NA NA NA NA NA NA NA
Pla
nC
urr
entl
yin
Pro
gre
ss
NA NA NA NA NA NA
Civil Unrest NA NA NA NA NA NA L-M NA NA NA NA NA NA NA NA NA NA NA NA NA
Crop Failure NA NA NA TBD NA TBD NA TBD NA NA NA NA NA NA NA TBD NA NA NA NA
Cyber Attack NA NA NA NA NA NA NA NA NA NA NA NA NA NA NA NA NA NA NA NA
Economic Collapse NA NA NA NA NA NA NA NA NA NA NA NA NA NA NA NA NA NA NA NA
Fishing Failure NA NA NA TBD NA TBD NA TBD NA NA NA NA NA NA NA TBD NA NA NA NA
Hazardous Substances - Fixed Sites NA NA NA TBD NA TBD M-H TBD TBD NA 1.55 TBD NA TBD NA TBD NA 1.55 TBD 1.55
Hazardous Substances – Offshore NA NA NA NA NA NA NA NA NA NA NA NA NA NA NA NA NA NA NA NA
Hazardous Substances - Transportation NA NA NA TBD NA TBD M-H TBD TBD NA 1.55 TBD NA TBD NA TBD NA 1.55 TBD 1.55
Nuclear Hazard Issues NA NA NA NA NA NA NA NA NA NA NA NA NA NA NA NA NA NA NA NA
Pandemic NA NA NA NA NA NA L-M NA NA NA NA NA NA NA NA NA NA NA NA NA
Power Outages NA NA NA NA NA NA NA NA NA NA NA NA NA NA NA NA NA NA NA NA

State of New Jersey 2014 Hazard Mitigation Plan
Page 5.1-26 Section 5.1. State Risk Assessment Overview
Table 5.1-7. Risk Rankings
Hazard of Concern Atl
an
tic
Be
rge
n
Bu
rlin
gto
n
Ca
md
en
Ca
pe
Ma
y
Cu
mb
erl
an
d
Ess
ex
Glo
uce
ste
r
Hu
nte
rdo
n
Hu
dso
n
Me
rce
r
Mid
dle
sex
Mo
nm
ou
th
Mo
rris
Oce
an
Pa
ssa
ic
Sa
lem
So
me
rse
t
Su
sse
x
Un
ion
Wa
rre
n
Terrorism NA NA NA NA NA NA M-H NA NA NA NA NA NA NA NA NA NA NA NA NA
Notes:
L Hazard ranked as a low priority
M Hazard ranked as a medium priority
H Hazard ranked as a high priority
NA Not applicable: the local HMP determined the hazard does not impact the County therefore the hazard was not evaluated, or the local HMP did not consider human-caused hazards.
TBD To be determined: the local HMP identified the hazard as a concern but did not rank the hazard. . If the local HMP did not conduct a risk ranking, the jurisdictions prioritized
mitigation actions and identified their most significant hazards using other methods.
Hazards ranking numbers listed are based on previous event history and hazard definitions, combined with the hazard’s probability of future occurrence, magnitude or severity of the hazard’s
impacts, warning time before an event occurs, and the duration of the event.

State of New Jersey 2014 Hazard Mitigation Plan
Page 5.1-27 Section 5.1. State Risk Assessment Overview
Assessing Vulnerability of State Facilities
To address the requirements of 44 CFR 201.4 and assess the vulnerability of state facilities, the best available
data were gathered and used for the 2014 update. A detailed description of the state building and critical
facility/infrastructure data used is described below, followed by a general description of the methodology used.
More detailed information on the methodology used to assess vulnerability is included in the vulnerability
assessment portion of each hazard section (Sections 5.2 through 5.23). This section discusses the vulnerability
assessments of state buildings, and critical facilities and infrastructure within the State.
State Buildings
The State of New Jersey maintains a comprehensive GIS mapping database of State-owned and leased
facilities. The Department of Treasury, coordinating its efforts with the centralized statewide GIS office in the
Department of Environmental Protection, is continually updating its GIS mapping capabilities for State-owned
and leased facilities. The OMB within the Department of Treasury has developed a centralized statewide Land
and Building Asset Management (LBAM) database that is currently being populated with an updated and
expanded inventory of land, building improvements, infrastructure and inspections data. All State agencies
maintaining facilities are included in the LBAM database.
LBAM includes purchased, leased, and licensed buildings. The licensed buildings are those that the State does
not own but is responsible for maintenance and repairs (such as federally-constructed buildings or buildings
where ownership is unclear). For the purposes of this Plan, the OMB advised that the licensed buildings be
classified as owned. Types of state-owned and -leased facilities contained in LBAM include, but are not
limited to, administrative/office buildings, housing, armories, barns/garages/sheds, communication centers,
dispensaries, correctional facilities, special-needs housing, hospitals, law enforcement buildings, schools,
water and sewer facilities, fuel service stations, utility buildings, and warehouses.
Many state buildings and their attributes and locations are considered sensitive in nature. Therefore, all
buildings reported in the 2014 Plan will be presented at the aggregate level (by agency or county). Individual
facilities will not be specifically identified.
The 2011 HMP outlined a three-phase program regarding the LBAM database and its use in future mitigation
planning efforts. Much progress has been made to the development and use of the database. Attributes have
been added to the database to enable the capture of flood hazard areas, history of vulnerability, and mitigation
actions. In addition, the critical state buildings have been identified in the database as an attribute. In May
2012, the Department of Treasury, the OMB, initiated the collection of GIS coordinates and photographs of all
State-occupied buildings. There is an active effort in GIS and photography. As of November 2013, 49% of
the State’s buildings have been photographed and 62% have been GIS coded. The OMB anticipates this
project to be completed in 2014.
The LBAM database is always being updated, changed, and corrected as agencies change or modify. The
August 5, 2013 export of the database was used for the purposes of this Plan update. The LBAM database
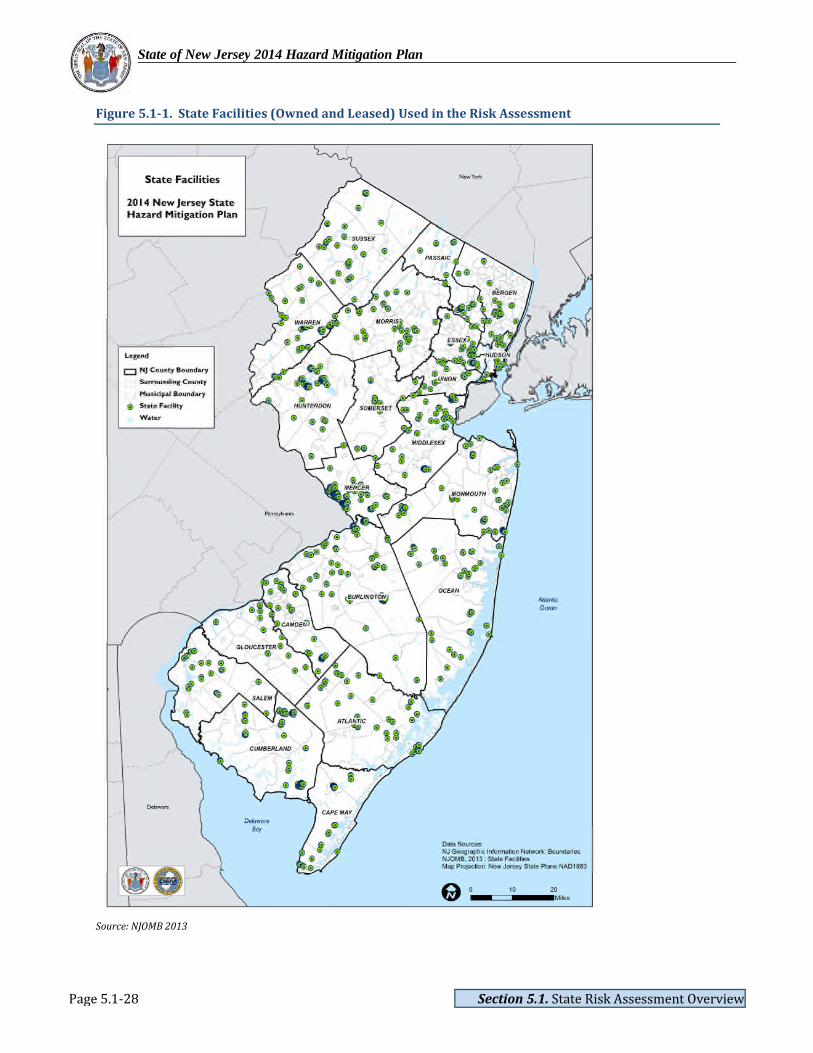
included 5,372 State-owned and leased buildings; however, only 2,910 buildings had geographic coordinates
associated with them. Five buildings in LBAM are located outside of the State of New Jersey and five NJDOT
facilities were added to the state building inventory (provided by NJDOT) for a total of 2,910 buildings
included in the risk assessment. All statistics reported in this Plan on state facilities are based on these 2,910
buildings. Figure 5.1-1 displays the location of these buildings. Tables 5.1-8 and 5.1-9 summarize the number
of buildings and their replacement costs by agency and county, respectively.
State of New Jersey 2014 Hazard Mitigation Plan
Page 5.1-28 Section 5.1. State Risk Assessment Overview
Figure 5.1-1. State Facilities (Owned and Leased) Used in the Risk Assessment
Source: NJOMB 2013

State of New Jersey 2014 Hazard Mitigation Plan
Page 5.1-29 Section 5.1. State Risk Assessment Overview
Table 5.1-8. State Facilities by Agency
State Agency
Leased OwnedTotal (Leased and
Owned)
Count Total RCV Count Total RCV Count Total RCV
Agriculture 0 - 1 $1,438,307 1 $1,438,307
Banking And Insurance 0 - 1 $41,888,820 1 $41,888,820
Chief Executive 1 $6,326,688 0 - 1 $6,326,688
Children and Families 50 $410,958,311 40 $18,392,486 90 $429,350,797
Community Affairs 8 $44,819,536 1 $26,247,441 9 $71,066,977
Corrections 8 $12,187,400 688 $1,016,917,420 696 $1,029,104,820
Education 5 $25,813,604 59 $143,816,418 64 $169,630,022
Environmental Protection 25 $96,503,071 305 $141,285,332 330 $237,788,403
Health 1 $20,584,392 2 $52,632,460 3 $73,216,852
Human Services 1 $2,825,013 462 $908,574,581 463 $911,399,594
Judiciary 4 $57,010,526 0 - 4 $57,010,526
Juvenile Justice Commission 3 $14,117,965 178 $139,489,253 181 $153,607,218
Labor and Work Force Development 5 $60,004,859 1 $61,327,079 6 $121,331,938
Law And Public Safety 6 $137,247,263 5 $112,085,564 11 $249,332,826
Legislature 1 $1,953,710 3 $80,588,984 4 $82,542,694
Military And Veterans Affairs 5 $1,798,368 257 $513,337,895 262 $515,136,263
Miscellaneous Commissions 1 $7,825,328 0 - 1 $7,825,328
Motor Vehicles Commission 28 $328,640,726 41 $135,375,932 69 $464,016,658
Personnel 1 $4,256,708 0 - 1 $4,256,708
State 0 - 9 $104,408,353 9 $104,408,353
State Police 37 $60,744,845 85 $176,102,782 122 $236,847,627
Transportation 0 - 565 $261,616,942 565 $261,616,942
Treasury 9 $129,598,706 8 $70,758,761 17 $200,357,468
Total 199 $1,423,217,020 2,711 $4,006,284,809 2,910 $5,429,501,828
Source: NJOMB 2013
Notes:
RCV = Replacement cost value provided by the New Jersey Department of Treasury, Office of Management and Budget (structure only)

State of New Jersey 2014 Hazard Mitigation Plan
Page 5.1-30 Section 5.1. State Risk Assessment Overview
Table 5.1-9. State Facilities by County
County
Leased Owned Total (Leased and Owned)
Count Total RCV Count Total RCV Count Total RCV
Atlantic County 16 $144,401,649 71 $35,304,926 87 $179,706,575
Bergen County 8 $34,121,796 38 $86,596,739 46 $120,718,535
Burlington County 12 $76,631,138 333 $435,001,660 345 $511,632,798
Camden County 8 $141,414,541 62 $181,519,764 70 $322,934,305
Cape May County 5 $2,584,257 109 $63,712,640 114 $66,296,896
Cumberland County 5 $4,470,003 362 $464,018,612 367 $468,488,615
Essex County 13 $198,465,073 61 $160,993,164 74 $359,458,236
Gloucester County 4 $25,072,915 42 $13,332,978 46 $38,405,893
Hudson County 7 $41,978,058 15 $41,270,388 22 $83,248,446
Hunterdon County 3 $3,541,525 330 $232,064,505 333 $235,606,030
Mercer County 47 $385,738,794 343 $1,406,231,538 390 $1,791,970,332
Middlesex County 14 $51,649,811 250 $330,728,031 264 $382,377,843
Monmouth County 10 $22,579,255 153 $102,793,091 163 $125,372,346
Morris County 8 $43,286,730 95 $186,824,926 103 $230,111,656
Ocean County 8 $22,408,626 95 $64,743,186 103 $87,151,813
Passaic County 7 $87,020,372 64 $68,765,508 71 $155,785,880
Salem County 4 $16,079,823 52 $13,166,601 56 $29,246,425
Somerset County 3 $76,068,982 35 $40,910,917 38 $116,979,899
Sussex County 5 $7,318,677 58 $18,539,425 63 $25,858,102
Union County 9 $28,629,805 26 $14,280,053 35 $42,909,858
Warren County 3 $9,755,189 117 $45,486,157 120 $55,241,346
Total 199 $1,423,217,020 2,711 $4,006,284,809 2,910 $5,429,501,828
Source: NJOMB 2013
Notes:RCV = Replacement cost value provided by the New Jersey Department of Treasury, Office of Management and Budget (structure only)
The OMB has implemented procedures (new RM/OMB Circular Loss Reporting) that require the agencies to
immediately report losses via LBAM database.
To determine vulnerability, a spatial analysis was conducted in GIS using the best available hazard data and
the LBAM database results. When the analysis determined the hazard area would impact the location of state
buildings and critical facilities, these buildings and critical facilities/infrastructure were deemed vulnerable to
the hazard. Additional details regarding the methodology used to assess vulnerability are presented in each
hazard section (Sections 5.2 through 5.23).
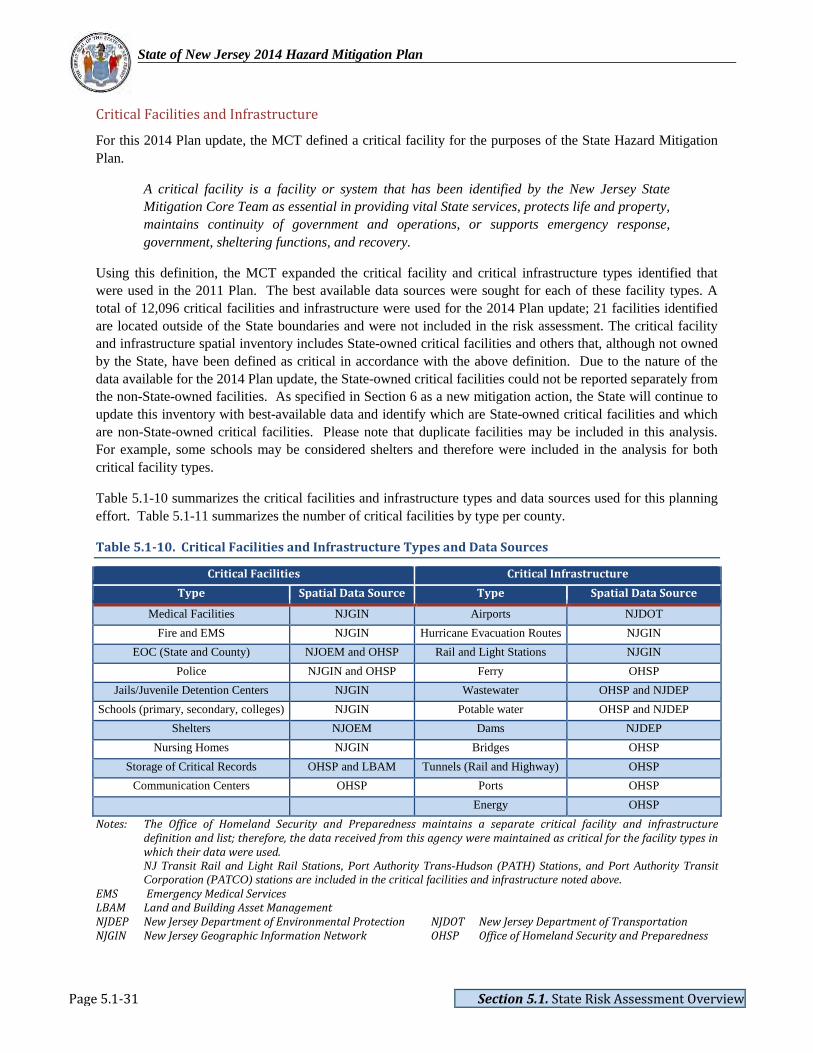
State of New Jersey 2014 Hazard Mitigation Plan
Page 5.1-31 Section 5.1. State Risk Assessment Overview
Critical Facilities and Infrastructure
For this 2014 Plan update, the MCT defined a critical facility for the purposes of the State Hazard Mitigation
Plan.
A critical facility is a facility or system that has been identified by the New Jersey State
Mitigation Core Team as essential in providing vital State services, protects life and property,
maintains continuity of government and operations, or supports emergency response,
government, sheltering functions, and recovery.
Using this definition, the MCT expanded the critical facility and critical infrastructure types identified that
were used in the 2011 Plan. The best available data sources were sought for each of these facility types. A
total of 12,096 critical facilities and infrastructure were used for the 2014 Plan update; 21 facilities identified
are located outside of the State boundaries and were not included in the risk assessment. The critical facility
and infrastructure spatial inventory includes State-owned critical facilities and others that, although not owned
by the State, have been defined as critical in accordance with the above definition. Due to the nature of the
data available for the 2014 Plan update, the State-owned critical facilities could not be reported separately from
the non-State-owned facilities. As specified in Section 6 as a new mitigation action, the State will continue to
update this inventory with best-available data and identify which are State-owned critical facilities and which
are non-State-owned critical facilities. Please note that duplicate facilities may be included in this analysis.
For example, some schools may be considered shelters and therefore were included in the analysis for both
critical facility types.
Table 5.1-10 summarizes the critical facilities and infrastructure types and data sources used for this planning
effort. Table 5.1-11 summarizes the number of critical facilities by type per county.
Table 5.1-10. Critical Facilities and Infrastructure Types and Data Sources
Critical Facilities Critical Infrastructure
Type Spatial Data Source Type Spatial Data Source
Medical Facilities NJGIN Airports NJDOT
Fire and EMS NJGIN Hurricane Evacuation Routes NJGIN
EOC (State and County) NJOEM and OHSP Rail and Light Stations NJGIN
Police NJGIN and OHSP Ferry OHSP
Jails/Juvenile Detention Centers NJGIN Wastewater OHSP and NJDEP
Schools (primary, secondary, colleges) NJGIN Potable water OHSP and NJDEP
Shelters NJOEM Dams NJDEP
Nursing Homes NJGIN Bridges OHSP
Storage of Critical Records OHSP and LBAM Tunnels (Rail and Highway) OHSP
Communication Centers OHSP Ports OHSP
Energy OHSP
Notes: The Office of Homeland Security and Preparedness maintains a separate critical facility and infrastructuredefinition and list; therefore, the data received from this agency were maintained as critical for the facility types inwhich their data were used.NJ Transit Rail and Light Rail Stations, Port Authority Trans-Hudson (PATH) Stations, and Port Authority TransitCorporation (PATCO) stations are included in the critical facilities and infrastructure noted above.
EMS Emergency Medical ServicesLBAM Land and Building Asset ManagementNJDEP New Jersey Department of Environmental Protection NJDOT New Jersey Department of TransportationNJGIN New Jersey Geographic Information Network OHSP Office of Homeland Security and Preparedness

State of New Jersey 2014 Hazard Mitigation Plan
Page 5.1-32 Section 5.1. State Risk Assessment Overview
Table 5.1-11. Number of Critical Facilities by County
County To
tal
Co
un
t
Air
po
rt
Sp
eci
al
Ne
ed
s
Co
mm
un
ica
tio
n
Co
rre
ctio
na
lIn
stit
uti
on
s
Da
m
Ele
ctri
cP
ow
er
EM
S
Em
erg
en
cyO
pe
rati
on
sC
en
ter
Fe
rry
Fir
e
Hig
hw
ay
Bri
dg
e
Hig
hw
ay
Tu
nn
el
Lig
ht
Ra
ilF
aci
lity
Me
dic
al
Mil
ita
ry
Na
tura
lG
as
Oil
Po
lice
Po
rt
Po
tab
leW
ate
r
Ra
ilF
aci
lity
Ra
ilT
un
ne
l
Sch
oo
l
Sh
elt
er
Sto
rag
eo
fC
riti
cal
Re
cord
s
Wa
ste
wa
ter
Atlantic 388 2 19 1 48 2 51 1 59 9 8 1 24 1 4 103 52 3
Bergen 1,148 1 46 1 81 4 101 1 1 142 1 9 74 3 30 419 228 6
Burlington 747 1 29 1 2 164 75 1 73 4 11 8 4 39 1 179 137 18
Camden 701 31 2 80 1 95 1 76 3 6 10 45 1 1 3 231 112 3
Cape May 229 2 10 16 32 1 1 36 2 1 1 14 1 1 42 63 6
Cumberland 251 1 9 1 6 37 28 1 25 6 15 70 49 3
Essex 784 2 43 2 33 1 57 2 63 2 17 15 42 3 4 22 360 109 1 6
Gloucester 346 17 68 43 1 55 1 3 26 120 9 3
Hudson 493 16 1 2 3 2 37 1 8 54 4 2 24 9 1 24 5 2 8 1 186 96 7
Hunterdon 328 6 3 99 38 1 38 2 19 1 4 69 45 3
Mercer 538 1 25 2 3 95 1 35 3 37 3 12 1 24 3 4 157 119 7 6
Middlesex 816 38 4 45 3 107 2 89 4 11 1 32 7 10 321 137 1 4
Monmouth 905 1 55 1 1 122 1 128 1 2 124 1 7 2 55 1 3 14 328 48 10
Morris 913 1 42 1 245 4 89 1 91 10 1 41 5 19 246 103 14
Ocean 621 50 1 99 1 93 1 80 5 9 34 2 2 208 32 1 3
Passaic 648 29 2 146 1 58 1 57 6 21 12 9 215 87 1 3
Salem 201 10 1 1 47 1 22 1 25 1 2 8 40 39 3
Somerset 539 29 1 1 96 1 52 1 51 5 22 2 11 159 105 3
Sussex 542 1 8 264 38 1 44 2 16 70 96 2
Union 607 26 1 29 1 53 1 45 2 9 26 5 3 16 244 141 5
Warren 351 10 1 1 102 1 29 1 32 4 3 15 1 55 94 2
Total 12,096 13 548 13 31 1,919 25 1,261 25 12 1,296 43 2 61 147 10 1 1 616 16 51 157 1 3,822 1,901 11 113
Notes:
EMS = Emergency Medical Services
State of New Jersey 2014 Hazard Mitigation Plan
Page 5.1-33 Section 5.1. State Risk Assessment Overview
The State recognizes transit and infrastructure system vulnerability to hazard events. Impacts from SuperstormSandy are described in Appendix D. As previously noted, NJ Transit Rail and Light Rail Stations, PortAuthority Trans-Hudson (PATH) Stations, and Port Authority Transit Corporation (PATCO) stations wereincluded in the critical facilities and infrastructure data and were used to inform the 2014 Plan risk assessmentanalysis. For future plan updates, the SHMT will re-examine the critical facility and infrastructure types andconsider including additional facilities/infrastructure in future plan updates (e.g., bus terminals and NJDOT-owned weight stations, maintenance yards, rest areas, and barges). Refer to Section 11 which further describesthe ‘next steps.’
Information regarding critical facilities and infrastructure, specifically their attributes and locations, are
considered sensitive in nature. Therefore, all critical facilities and infrastructure reported in the 2014 Plan will
be at the aggregate level (by type or county). Individual facilities will not be specifically identified.
To determine vulnerability, a spatial analysis was conducted in GIS using the best available hazard data for the
critical facilities. When the exposure analysis determined the hazard area could potentially impact the location
of critical facilities, they were deemed vulnerable to the hazard. The replacement cost value for the State-
critical facilities was not available for the 2014 Plan update. The State will update the risk assessment with
quantifiable loss estimates as replacement cost values for critical facilities become available.
Additional details regarding the methodology used to assess vulnerability are discussed in each hazard section
(Sections 5.2 through 5.23).
Estimating Potential Losses to Jurisdictions and State Facilities
To address the requirements of 44 CFR 201.4 and better understand potential losses associated with the
hazards of concern, standardized tools combined with local, state, and federal data and expertise were used to
conduct the risk assessment. The vulnerability assessment section in each hazard section (Sections 5.2 through
5.23) summarizes the detailed methodology used for each particular hazard of concern. A brief description of
the methodology used to support estimating potential losses to jurisdictions and state facilities is described
below.
Hazards U.S. – Multi-Hazard (HAZUS-MH)
In 1997, FEMA developed a standardized model for estimating losses caused by earthquakes, known as
Hazards U.S. or HAZUS. HAZUS was developed in response to the need for more effective national-, state-,
and community-level planning, and the need to identify areas that face the highest risk and potential for loss.
HAZUS was expanded into a multi-hazard tool (HAZUS-MH) with new models for estimating potential losses
from wind (hurricanes) and flood (riverine and coastal) hazards. HAZUS-MH is a GIS-based software tool that
applies engineering and scientific risk calculations that have been developed by hazard and information
technology experts, to provide defensible damage and loss estimates. These methodologies are accepted by
FEMA and provide a consistent framework for assessing risk across a variety of hazards. The GIS framework
also supports the evaluation of hazards and assessment of inventory and loss estimates for these hazards.
HAZUS-MH uses GIS technology to produce detailed maps and analytical reports that estimate a community’s
direct physical damage to building stock, critical facilities, transportation systems, and utility systems. To
generate this information, HAZUS-MH uses default data provided by HAZUS-MH for inventory,
vulnerability, and hazards; this default data can be supplemented with local data to provide a more refined
analysis. Damage reports can include induced damage (inundation, fire, and threats posed by hazardous
materials and debris) and direct economic and social losses (casualties, shelter requirements, and economic
impact) depending on the hazard and available local data. HAZUS-MH’s open data architecture can be used to
manage community GIS data in a central location. The use of this software also promotes consistency of data
State of New Jersey 2014 Hazard Mitigation Plan
Page 5.1-34 Section 5.1. State Risk Assessment Overview
output now and in the future and standardization of data collection and storage. The guidance “Using HAZUS-
MH for Risk Assessment: How-to Guide (FEMA 433)” was used to support the application of HAZUS-MH
for this risk assessment and Plan. More information on HAZUS-MH is available at
http://www.fema.gov/plan/prevent/hazus/index.shtm.
Probabilistic analyses were performed to estimate losses (mean return period losses) for the earthquake, flood,
and wind hazards. The probabilistic hazard analysis generates estimates of damage and loss for specified
return periods (such as a 100-year or one-percent annual chance event). For annualized losses, HAZUS-MH
version 2.1 calculates the maximum potential annual dollar loss resulting from various return periods averaged
on a per-year basis. It is the summation of all HAZUS-supplied return periods (such as 10-, 50-, 100-, 200-,
and 500-year periods) multiplied by the return period probability (as a weighted calculation). In summary, the
estimated cost of a hazard each year is calculated.
HAZUS-MH was updated with the state buildings provided in LBAM. The default building stock data in
HAZUS-MH version 2.1 was not updated to estimate potential losses. The default aggregate building
inventory is based on United States Census data for residential occupancies and Dun & Bradstreet for non-
residential occupancies. As discussed earlier, the 2010 Census block population data was used to evaluate
population exposure.
Hazard-Specific Methodologies
The vulnerability assessment section in each hazard section (Sections 5.2 through 5.23) summarizes the
detailed methodology used for that particular hazard of concern. For hazards in which HAZUS-MH could not
be used, an exposure-based methodology was applied using the best available spatial data gathered from the
State’s subject-matter experts (SME), as well as the default general building stock in HAZUS-MH, state
buildings as provided by LBAM and critical facilities and infrastructure.
5.1.5 Changes in Development for Hazard-Prone Areas
44 CFR §201.4(c)(2)(ii): The State shall describe vulnerability in terms of the jurisdictions mostthreatened by the identified hazards, and most vulnerable to damage and loss associated with hazardevents.
44 CFR §201.4(d): Plan must be reviewed and revised to reflect changes in development…
As described earlier in this section, the 2014 Plan vulnerability assessment used the best available defined
hazard areas, population, buildings, and facilities data. Each hazard section includes tables, maps, and
narrative that illustrate and describe the most vulnerable areas. The use of these updated data sets (e.g., 2010
Census population, 2013 State buildings, updated critical facilities) and hazard areas (e.g., preliminary working
flood maps and DFIRMs) provide an update in changes in vulnerability to population and development since
the 2011 Plan.
Section 4 (State Profile) of the Plan provides a detailed overview of the land use, development, transportation,
economy, and population trends within the State of New Jersey. This section, as well as federal, state and local
laws and regulations that impact development in hazard prone areas described in Section 6 (Mitigation
Strategy), served as the basis for the assessment of changes in jurisdictions and in development that may
impact vulnerability by either increasing or decreasing risk. Additional discussion on changes in development
for jurisdictions in hazard prone areas may be found in Sections 5.2 through 5.23 (Vulnerability Assessment
subsections).
State of New Jersey 2014 Hazard Mitigation Plan
Page 5.1-35 Section 5.1. State Risk Assessment Overview
One of the key indicators of changes in development is the number of authorized building permits within each
County. Increased development also occurs with population growth. As shown in Section 4, Table 4-9,
Hudson County experienced the greatest population growth from 2010 to 2012 followed by Middlesex, Bergen
and Union Counties, in descending order. As summarized in subsection 4.6.2, there is a growing trend in
urbanization and redevelopment in Bergen, Hudson, Essex, Middlesex, Monmouth, Ocean and Union Counties
as demonstrated by the increase in building permits and growth compared to the less developed areas of the
State.
Damages and losses as a result of hazard events are generally associated with older existing infrastructure and
buildings rather than new development. This is because building codes and land use regulations, described in
Section 6 (Tables 6-4 and 6-5), limit development in hazard areas or require construction to meet higher
standards within hazard areas. This provides a reduction of risk in areas where new development or
redevelopment is occurring.
The following discusses changes in development that may impact vulnerability for the coastal erosion, sea
level rise, hurricanes and tropical storms, flood, earthquake and wildfire hazards. The State will continue to
enhance this section through the review and incorporation of development trends provided in local HMPs as
they are updated between 2014 and 2017. Refer to Section 7 (Plan Maintenance) which identifies the annual
roll-up changes in development in the State Plan.
Coastal Erosion and Sea Level Rise
New Jersey coastal counties are exposed to erosion and sea level rise. Open space within coastal areas prone
to growth are either protected areas of open space or have regulatory controls [e.g., Coastal Area Facility
Review Act (CAFRA)] which limit new development from taking place.
As discussed in Section 5.2 the counties most threatened by coastal erosion are Atlantic, Cape May,
Monmouth and Ocean. Figure 4-22 in Section 4 indicates an increase in the number of housing units
authorized by building permits from 2010 to 2012 for many of the coastal counties: Bergen, Essex, Hudson,
Middlesex, Monmouth, Ocean, and Union. If the proposed new development is located within the coastal
erosion-susceptible and hazard areas, there is a potential increase in risk to life, property and the environment.
However, new construction will be required to meet current standards which are designed to provide increased
protection compared to existing development in the area.
Coastal areas impacted by Superstorm Sandy have seen an increase in redevelopment. Similar to new
construction, redevelopment will be required to meet current standards which may provide increased
protection compared to their pre-event conditions. The U. S. Army Corps of Engineers dune replenishment
projects as described in Section 5.2 and locations illustrated on Figure 5.2-13 will serve to help mitigate the
impacts of coastal erosion.
Drought
As development continues in New Jersey, the demand for water will increase as well. While New Jersey is not
particularly prone to extreme instances of drought, increased demand has the potential to exacerbate moderate
or severe droughts. New development in the southern portion of the State could increase the vulnerability to
drought events, in terms of water supply. This is because the major source of water in southern New Jersey is
the unconfined Kirkwood-Cohansey aquifer with a limited number of reservoirs for the collection and storage
of back up supply. As indicated in Table 4-8 (Population Growth Projections by County) in Section 4 (State
Profile), several southern New Jersey counties are estimated to grow in excess of 4% through 2020, including
Gloucester and Ocean Counties where greater than 7% growth is estimated. These growing populations will
State of New Jersey 2014 Hazard Mitigation Plan
Page 5.1-36 Section 5.1. State Risk Assessment Overview
increase demand for water and may make the area increasingly vulnerable to the direct and indirect water
supply impacts associated with drought.
Earthquake
In general the northern half of New Jersey is more vulnerable to potential damage from an earthquake. The
most vulnerable areas of the State are located near the Ramapo Fault. Bergen, Essex, Hudson, Hunterdon,
Middlesex, Monmouth, Mercer, Passaic, Somerset, Sussex, and Union counties have the highest potential of
sustaining damage during an event. As illustrated in Figure 4-22 in Section 4 many of these Counties are
experiencing growth as seen by an increase in the number of housing building permits from 2010 to 2012.
Increases in development and population growth may increase vulnerability to and impacts from earthquake
events in these Counties. Seismic provisions in prevailing building code are intended to mitigate this risk in
new construction.
Flood
As discussed throughout the 2014 Plan update and identified in the local HMPs, flood is the most significant
natural hazard in New Jersey. In terms of life safety, the vulnerability assessment in Section 5.6 (Flood)
indicates Cape May County has the highest percent of total population located within the SFHA (40%). The
following counties have greater than 10% of their population in the Special Flood Hazard Area (SFHA or 1%
annual chance flood boundary), in descending order: Cape May, Atlantic, Salem, Ocean, Hudson, and
Monmouth. Monmouth, Ocean, Cape May and Atlantic Counties have the greatest percentage of population
located in the V-zone (areas vulnerable to wave damage).
In terms of the built environment, Cape May County has greater than 60% of its total building stock located in
the SFHA. The following counties have highest number of buildings exposed to the 1% annual chance flood
event (in descending order): Cape May, Atlantic, Ocean, Salem and Hudson. Please note that Ocean, Cape
May, Monmouth and Atlantic Counties have the greatest number of buildings located in the V-zone.
The jurisdictions most threatened by the flood hazard have also been experiencing an increase in permits for
new construction and an overall increase in population. Hudson County experienced the greatest increase in
permits for new construction from 2010 to 2012 closely followed by Ocean and Bergen Counties. The greatest
increase occurred in 2012 which may be attributed to the post-Sandy environment.
An increase in impervious surfaces associated with development has the potential to impact urban and
stormwater flooding. If the proposed new development is located within the flood hazard areas, there is a
potential increase in risk to life and property. However, new construction will be required to meet current
standards which may provide increased protection compared to existing development in the area. Further, the
stricter construction codes are required for new and re-development in the V-zone. Changes to New Jersey's
Flood Hazard Area Control Act rules, adopted March 25, 2013, set minimum elevation standards for the
reconstruction of houses and buildings in areas that are in danger of flooding. These standards will help
mitigate the impacts of these events.
Geologic Hazards
Section 5.7 (Geologic Hazards) presents the landslide and subsidence/sinkhole hazards. Bergen, Essex,
Hudson, Hunterdon, Monmouth, Morris, Sussex, and Warren Counties have experienced the highest number of
historic landslide events. As discussed in Section 5.7, naturally occurring subsidence and sinkholes in New
Jersey occur within bands of carbonate bedrock. Primarily the northern region of New Jersey may be
susceptible to natural subsidence and sinkholes. In addition, due to at least 588 abandoned mines, the northern
part of the State may have a greater potential for significant surface collapse than does the southern part.

State of New Jersey 2014 Hazard Mitigation Plan
Page 5.1-37 Section 5.1. State Risk Assessment Overview
Abandoned mines in Bergen, Essex, Hunterdon, Morris, Passaic, Somerset, Sussex and Warren Counties could
make these locations vulnerable to the subsidence/sinkhole hazard.
Over time, individual municipalities have implemented steep slope ordinances which prohibit development in
the areas most susceptible to landslides. Therefore, potential to develop these vulnerable areas are decreasing.
However, the existing populations in these areas remain potentially vulnerable. Similar to landslides,
subsidence and sinkholes pose a danger to populations living in high risk areas, including loss of life.
Compounding the vulnerability of populations to subsidence/sinkholes is the vast array of abandoned mines
and the geological makeup of much of northern New Jersey, coupled with recent growth in the region. As
illustrated by the population trends in Section 4, with the exception of Hunterdon, Sussex and Warren
Counties, the counties most threatened by subsidence/sinkholes have experienced an increase in population.
As populations move into high hazard areas, their vulnerability and potential for loss will increase.
Hurricanes and Tropical Storms
Historically, hurricanes and tropical storms have impacted all 21 New Jersey counties. The entire State is
exposed to the wind and rains associated with these events. However, certain areas and types of building and
infrastructure are at greater risk than others because of their proximity to the coast and/or their manner of
construction. Storm surge from a hurricane/tropical storm poses one of the greatest risks to residents and
property along the coast. The Counties with population and buildings exposed to storm surge are: Atlantic,
Bergen, Burlington, Camden, Cape May, Cumberland, Essex, Gloucester, Hudson, Mercer, Middlesex,
Monmouth, Ocean, Passaic, Salem and Union.
As New Jersey continues to develop, the State will remain vulnerable to the impacts of wind and storm surge.
Improved mapping and higher regulatory standards will mitigate future impacts to new and redeveloped areas
in defined hazard zones. FEMA’s Advisory Base Flood Elevations (ABFE) maps were made available post
Superstorm Sandy to certain impacted communities as best-available data for rebuilding and recovery efforts.
Preliminary and updated work maps continue to be released showing coastal flood hazard data to replace the
ABFE maps. These maps reflect the results of an ongoing coastal flood hazard study and are considered best
available information. They are intended to help communities and property owners understand current flood
risk and future flood insurance requirements based upon updated data.
Measures taken by the New Jersey Department of Environmental Protection (NJDEP) further increase New
Jersey citizens’ awareness of the impacts of tropical cyclone wind and storm surge hazards. People are
increasingly aware that measures, like elevating their homes or installing hurricane straps on their roofs will
help protect and mitigate against these hazards. Municipalities are increasingly aware that requiring measures
such as flood proofing of the lower levels of buildings will help mitigate the impacts of these hazards.
However, it is clear that much of the existing infrastructure and development along the immediate coast and
adjacent bays will continue to be vulnerable.
Severe Weather
As discussed in Section 5.10, severe weather includes numerous weather types including high winds,
tornadoes and extreme temperature events. The continued development of the State will increase the overall
vulnerability to high winds and severe storm hazards. The entire population of the State is considered exposed
to high wind. Wind speeds for the 50-year mean recurrence interval were determined based on three-second
gusts in miles per hour at 33 feet above the ground. For the 50-year wind event, the portions of the following
12 coastal counties may experience wind speeds greater than 100 miles per hour: Atlantic, Bergen, Burlington,
Cape May, Camden, Cumberland, Essex, Hudson, Gloucester, Middlesex, Monmouth, and Union Counties.
Any future new or redevelopment in Atlantic, Bergen, Burlington, Cape May, Camden, Cumberland, Essex,

State of New Jersey 2014 Hazard Mitigation Plan
Page 5.1-38 Section 5.1. State Risk Assessment Overview
Hudson, Gloucester, Middlesex, Monmouth, and Union Counties are vulnerable to winds over 100 mph. The
development of new buildings in these areas must meet or exceed the standards in Section R301.2.1.1 of the
International Building Code (IBC).
Tornado events are typically localized; whereas high wind and thunderstorm events can be more widespread.
The impacts of tornadoes on the environment may include severe damage to complete devastation to buildings,
vegetation and anything in its path. Based on previous occurrences of tornado touchdowns, generally the
Interstate 95 corridor in New Jersey may be more vulnerable to tornado activity than other areas. New
development proximate to this corridor has the potential to increase the number of people vulnerable to the
hazards associated with tornadoes.
As summarized in Section 4 (State Profile), subsection 4.6.2, there is a growing trend in urbanization and
redevelopment in Bergen, Hudson, Essex, Middlesex, Monmouth, Ocean and Union Counties as demonstrated
by the increase in building permits and growth compared to the less developed areas of the State.
Development that expands the densely developed urban centers has the potential to increase the vulnerability
to extreme heat events due to the heat island effect.
Wildfire
The New Jersey Pinelands is one of the most hazardous wildland fuel types in the nation. A review of the
historic record indicates a majority of the wildfire events in the State have occurred in the New Jersey
Pinelands located in Atlantic, Burlington, Camden, Cape May, Cumberland, Gloucester, and Ocean Counties.
Section 4 describes an increase in the number of housing building permits from 2010 to 2012 for Ocean
County which is one of the most vulnerable counties to wildfire. Wildfire specifically is a hazard that has and
will continue to impact new development on or near the suburban and rural fringe, especially in areas in
southern New Jersey. Although many areas of the Pinelands are publically owned, permanently preserved land,
much of the undeveloped privately owned land is located in the suburban rural fringe surrounding the
Pinelands. As development in this area increases, the vulnerability to wildfire will increase.