Section 5: Needs and Gap Analysis - Waco, Texas
31
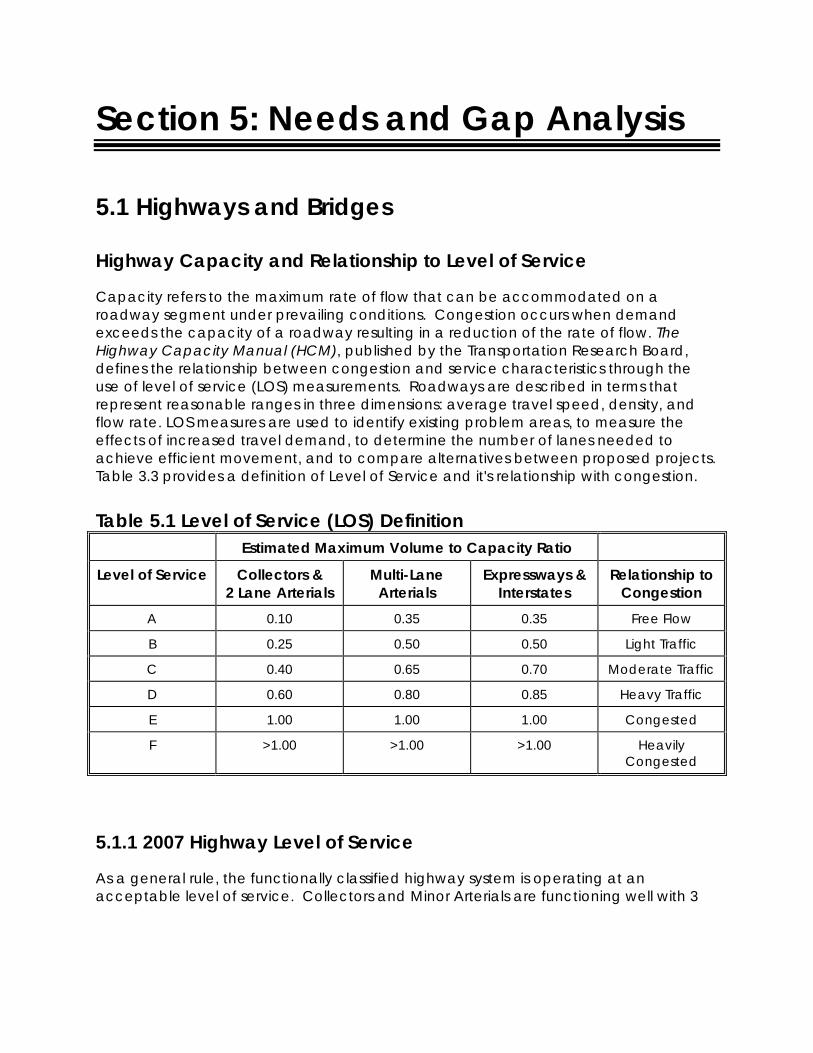
Section 5: Needs and Gap Analysis 5.1 Highways and Bridges Highway Capacity and Relationship to Level of Service Capacity refers to the maximum rate of flow that can be accommodated on a roadway segment under prevailing conditions. Congestion occurs when demand exceeds the capacity of a roadway resulting in a reduction of the rate of flow. The Highway Capacity Manual (HCM), published by the Transportation Research Board, defines the relationship between congestion and service characteristics through the use of level of service (LOS) measurements. Roadways are described in terms that represent reasonable ranges in three dimensions: average travel speed, density, and flow rate. LOS measures are used to identify existing problem areas, to measure the effects of increased travel demand, to determine the number of lanes needed to achieve efficient movement, and to compare alternatives between proposed projects. Table 3.3 provides a definition of Level of Service and it's relationship with congestion. Table 5.1 Level of Service (LOS) Definition Estimated Maximum Volume to Capacity Ratio Level of Service Collectors & 2 Lane Arterials Multi-Lane Arterials Expressways & Interstates Relationship to Congestion A 0.10 0.35 0.35 Free Flow B 0.25 0.50 0.50 Light Traffic C 0.40 0.65 0.70 Moderate Traffic D 0.60 0.80 0.85 Heavy Traffic E 1.00 1.00 1.00 Congested F >1.00 >1.00 >1.00 Heavily Congested 5.1.1 2007 Highway Level of Service As a general rule, the functionally classified highway system is operating at an acceptable level of service. Collectors and Minor Arterials are functioning well with 3
Transcript of Section 5: Needs and Gap Analysis - Waco, Texas
Section 5: Needs and Gap Analysis
5.1 Highways and Bridges
Highway Capacity and Relationship to Level of Service
Capacity refers to the maximum rate of flow that can be accommodated on a roadway segment under prevailing conditions. Congestion occurs when demand exceeds the capacity of a roadway resulting in a reduction of the rate of flow. The Highway Capacity Manual (HCM), published by the Transportation Research Board, defines the relationship between congestion and service characteristics through the use of level of service (LOS) measurements. Roadways are described in terms that represent reasonable ranges in three dimensions: average travel speed, density, and flow rate. LOS measures are used to identify existing problem areas, to measure the effects of increased travel demand, to determine the number of lanes needed to achieve efficient movement, and to compare alternatives between proposed projects. Table 3.3 provides a definition of Level of Service and it's relationship with congestion.
Table 5.1 Level of Service (LOS) Definition Estimated Maximum Volume to Capacity Ratio
Level of Service Collectors & 2 Lane Arterials
Multi-Lane Arterials
Expressways & Interstates
Relationship to Congestion
A 0.10 0.35 0.35 Free Flow
B 0.25 0.50 0.50 Light Traffic
C 0.40 0.65 0.70 Moderate Traffic
D 0.60 0.80 0.85 Heavy Traffic
E 1.00 1.00 1.00 Congested
F >1.00 >1.00 >1.00 Heavily Congested
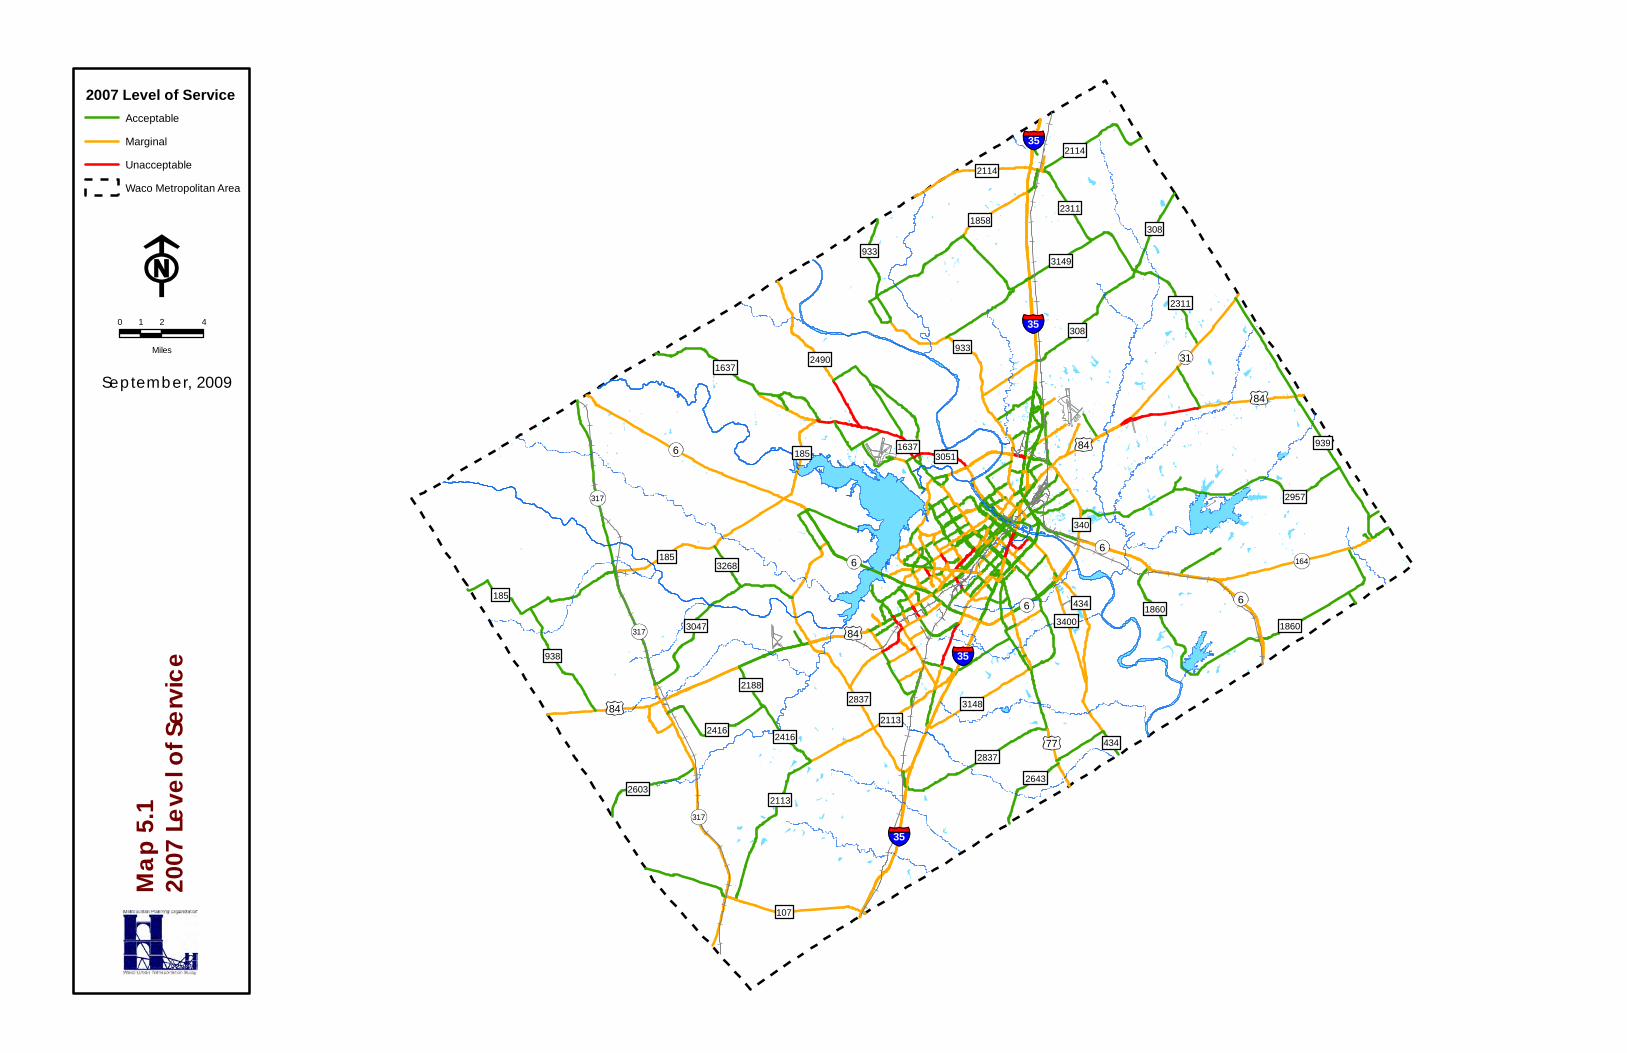
5.1.1 2007 Highway Level of Service
As a general rule, the functionally classified highway system is operating at an acceptable level of service. Collectors and Minor Arterials are functioning well with 3
Connections 2035 – The Waco Metropolitan Transportation Plan PAGE 5-1

out of 5 miles operating at a level of service “C” or better. Interstate 35 and the Principal Arterial system are not functioning as well with the majority of miles operating at marginal levels of service. Table 3.4 outlines the level of service characteristics for the functionally classified highway system.
Generally only 1 out of 20 miles of the functionally classified highway system is operating at an unacceptable level of service. Those that are at a level of service “F” do tend to be concentrated within the suburban areas. Table 3.5 identifies those highway segments that have the worst congestion levels within the Metropolitan Area.
Table 5.2 Level of Service (LOS) per Classification – Existing Network Classification Acceptable
LOS A to C Marginal LOS D & E
Unacceptable LOS F
Average LOS
Interstate 3.8% 87.4% 9.4% E
Other Expressways 100.0% 0.0% 0.0% B
Principal Arterials 43.3% 53.3% 3.4% D
Minor Arterials 59.7% 32.5% 7.8% C
Collectors 61.0% 35.9% 3.2% D
Total System 54.0% 41.3% 4.7% C
Chart 5.1 Percent Marginal or Unacceptable Level of Service by Functional Classification - 2007
0.00%
10.00%
20.00%
30.00%
40.00%
50.00%
60.00%
70.00%
80.00%
90.00%
100.00%
Inters
tate
Other E
xpres
sway
s
Princip
al Arte
rials
Minor A
rteria
ls
Collec
tors
Total S
ystem
Perc
ent M
argi
nal o
r Una
ccep
tabl
e LO
S
Connections 2035 – The Waco Metropolitan Transportation Plan PAGE 5-2
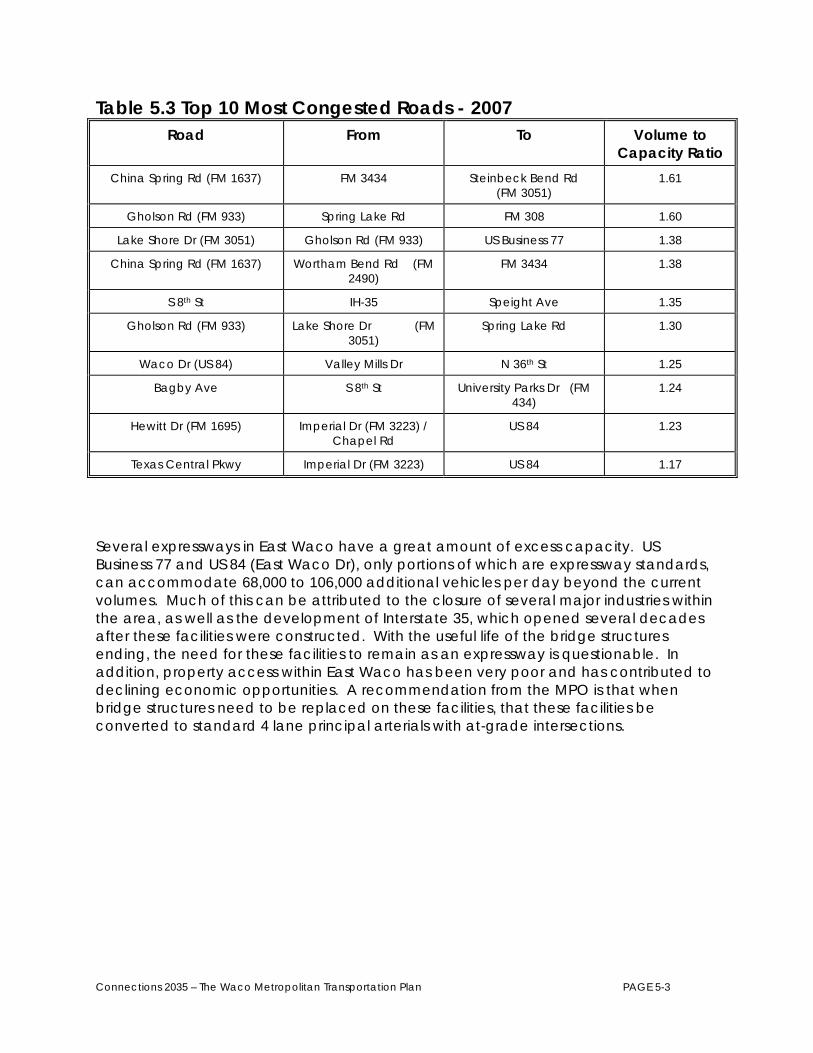
Table 5.3 Top 10 Most Congested Roads - 2007 Road From To Volume to
Capacity Ratio China Spring Rd (FM 1637) FM 3434 Steinbeck Bend Rd
(FM 3051) 1.61
Gholson Rd (FM 933) Spring Lake Rd FM 308 1.60
Lake Shore Dr (FM 3051) Gholson Rd (FM 933) US Business 77 1.38
China Spring Rd (FM 1637) Wortham Bend Rd (FM 2490)
FM 3434 1.38
S 8th St IH-35 Speight Ave 1.35
Gholson Rd (FM 933) Lake Shore Dr (FM 3051)
Spring Lake Rd 1.30
Waco Dr (US 84) Valley Mills Dr N 36th St 1.25
Bagby Ave S 8th St University Parks Dr (FM 434)
1.24
Hewitt Dr (FM 1695) Imperial Dr (FM 3223) / Chapel Rd
US 84 1.23
Texas Central Pkwy Imperial Dr (FM 3223) US 84 1.17
Several expressways in East Waco have a great amount of excess capacity. US Business 77 and US 84 (East Waco Dr), only portions of which are expressway standards, can accommodate 68,000 to 106,000 additional vehicles per day beyond the current volumes. Much of this can be attributed to the closure of several major industries within the area, as well as the development of Interstate 35, which opened several decades after these facilities were constructed. With the useful life of the bridge structures ending, the need for these facilities to remain as an expressway is questionable. In addition, property access within East Waco has been very poor and has contributed to declining economic opportunities. A recommendation from the MPO is that when bridge structures need to be replaced on these facilities, that these facilities be converted to standard 4 lane principal arterials with at-grade intersections.
Connections 2035 – The Waco Metropolitan Transportation Plan PAGE 5-3

Table 5.4 The Bottom 10 – Roads with the Greatest Excess Capacity - 2007
Road From To Excess Capacity (Vehicles per
Day) US Business 77 (LaSalle Ave) S University Parks Dr Spur 484 (Marlin Hwy) 106,280
E Waco Dr (US 84) US Business 77 (N Loop Dr)
IH-35 75,000
E Waco Dr (US 84) Gholson Rd (FM 933) US Business 77 (N Loop Dr)
71,900
US Business 77 (S Loop Dr) Spur 484 (Marlin Hwy) Orchard Ln 70,320
US Business 77 (S Loop Dr) Orchard Ln IH-35 69,570
US Business 77 (N Loop Dr) IH-35 E Waco Dr (US 84) 68,160
Spur 484 (Marlin Hwy) E Loop 340 US Business 77 (LaSalle Ave)
60,980
SH 6 Bosque Blvd Fish Pond Rd 57,490
SH 6 Speegleville Rd Dosher Ln / Spur 412 54,890
SH 6 Fish Pond Rd Speegleville Rd 52,350
5.1.2 Projected 2035 Highway Level of Service
The Waco MPO utilizes a travel demand forecast model to estimate future level of service for the functionally classified highway system. Section 3.3.1 provides a complete description of the development of the Waco model. The results of this analysis represent a “no build” scenario in which only those roads completed or under construction since 2002 are added to the 2002 highway network.
The travel demand model was developed prior to the expansion of the Metropolitan Area Boundary in 2003. Therefore areas within McLennan County but outside of the former boundary are not included within the model forecasts (see map 3.3A).
Travel Demand Forecast Model Development
Travel Demand Modeling is the process used to determine street facility needs in the future. The Travel Demand Model is developed by the Texas Department of Transportation with assistance from the MPO staff using TRANSCAD modeling software. This Plan Update is based on an updated model. The Waco MPO staff provided TxDOT
Connections 2035 – The Waco Metropolitan Transportation Plan PAGE 5-4

with 2005 base year data and highway network and 2035 forecast of population, income, employment and dwelling units by Traffic Analysis Zone to be used by TxDOT in the development of the model.
Travel demand modeling utilizes the following four step process:
1. Trip Generation
2. Trip Distribution
3. Mode Choice
4. Traffic Assignment
The Waco Urban Area, due to its size and relatively low utilization of modes other than automobiles, does not utilize Mode Choice in the modeling process.
Modeling utilizes socioeconomic data (population, income, dwelling units and employment by Standard Industrial Code) to forecast the number of trips from one given destination to another. This data is collected in small study areas called Traffic Analysis Zones (TAZ's). The Waco MPO Study Area was originally delineated into 206 analysis zones for the 1964 Plan. Since that time the analysis zones have been revised several times as the arterial network and study area have changed. In 1998 the MPO expanded the Study Area to include Lorena and McGregor and unincorporated areas in between. For this Plan Update, the model uses the 251 TAZ's delineated in 1998.
Trip Generation
Trip generation is the process by which socioeconomic variables (population, income, number of dwelling units, employment, land use and special generators) are translated into numbers of trips. Based on the relationships mentioned above, this process determines the number of trips each traffic zone will produce and the number of trips each traffic zone will attract.
Detailed analyses of household trip making characteristics, stratified by income, provides the basis for the development of zonal trip production rates. Trip attraction rates are based primarily on employment data in each zone, but also look at special generators and land use acreage found within each zone.
Trip Distribution
Trip distribution is the process by which the model determines where the trips produced in each traffic zone will go. In other words it determines how the trips produced in each zone will be allotted among all the other zones in the area. In general, this model takes into account the relative attractiveness (based on employment, land use and special generators) and accessibility (based on trip lengths in minutes and socioeconomic and topographical barriers) of all zones in the area.
Connections 2035 – The Waco Metropolitan Transportation Plan PAGE 5-5
Once trip distribution is completed, the model is calibrated. Calibration is necessary to ensure the transportation network will have a balanced number of productions and attractions.
Traffic Assignment
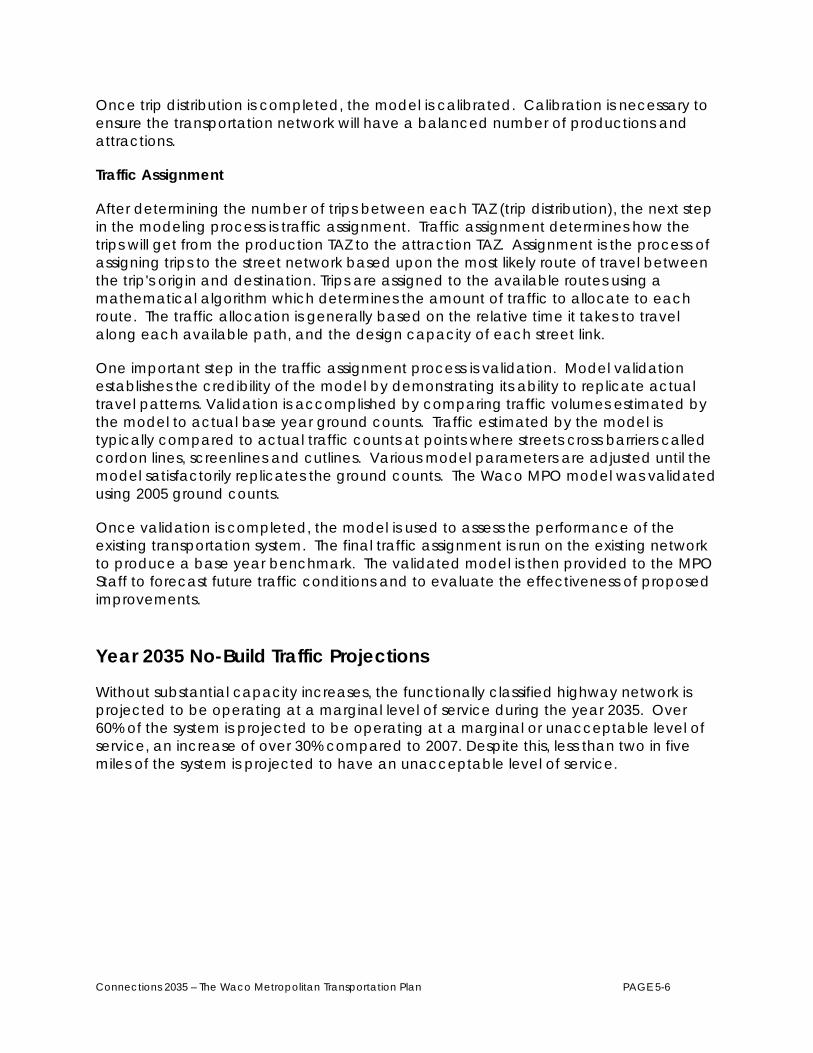
After determining the number of trips between each TAZ (trip distribution), the next step in the modeling process is traffic assignment. Traffic assignment determines how the trips will get from the production TAZ to the attraction TAZ. Assignment is the process of assigning trips to the street network based upon the most likely route of travel between the trip's origin and destination. Trips are assigned to the available routes using a mathematical algorithm which determines the amount of traffic to allocate to each route. The traffic allocation is generally based on the relative time it takes to travel along each available path, and the design capacity of each street link.
One important step in the traffic assignment process is validation. Model validation establishes the credibility of the model by demonstrating its ability to replicate actual travel patterns. Validation is accomplished by comparing traffic volumes estimated by the model to actual base year ground counts. Traffic estimated by the model is typically compared to actual traffic counts at points where streets cross barriers called cordon lines, screenlines and cutlines. Various model parameters are adjusted until the model satisfactorily replicates the ground counts. The Waco MPO model was validated using 2005 ground counts.
Once validation is completed, the model is used to assess the performance of the existing transportation system. The final traffic assignment is run on the existing network to produce a base year benchmark. The validated model is then provided to the MPO Staff to forecast future traffic conditions and to evaluate the effectiveness of proposed improvements.
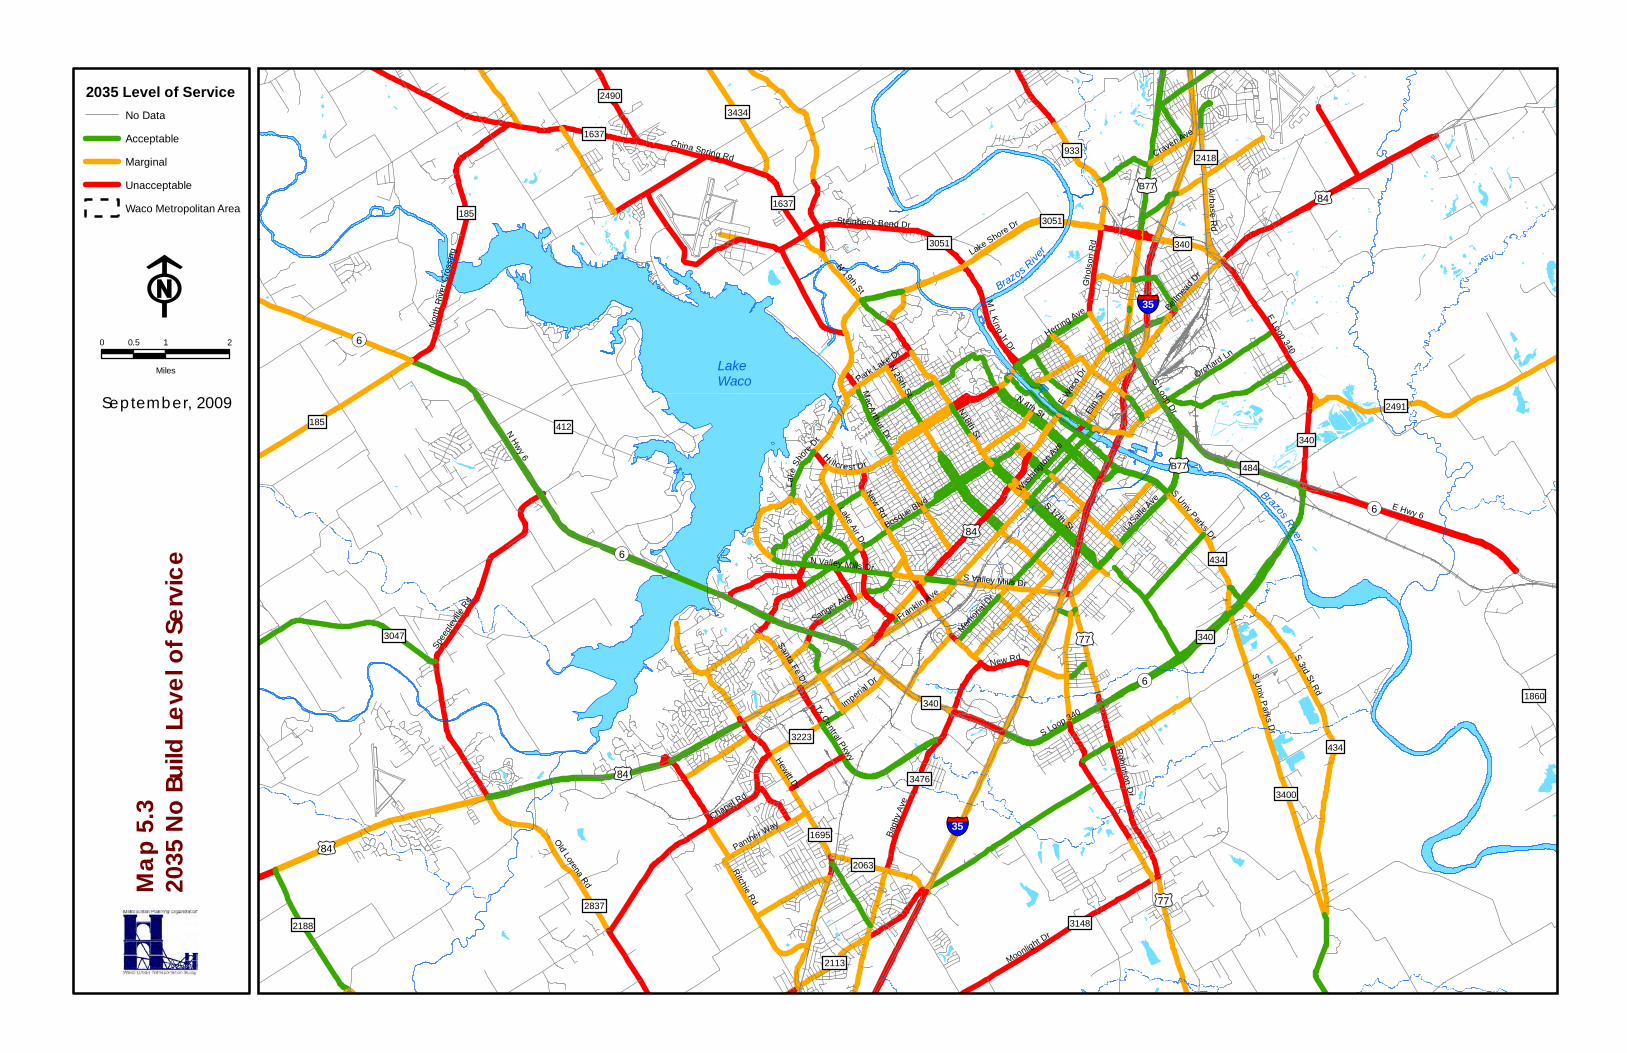
Year 2035 No-Build Traffic Projections
Without substantial capacity increases, the functionally classified highway network is projected to be operating at a marginal level of service during the year 2035. Over 60% of the system is projected to be operating at a marginal or unacceptable level of service, an increase of over 30% compared to 2007. Despite this, less than two in five miles of the system is projected to have an unacceptable level of service.
Connections 2035 – The Waco Metropolitan Transportation Plan PAGE 5-6
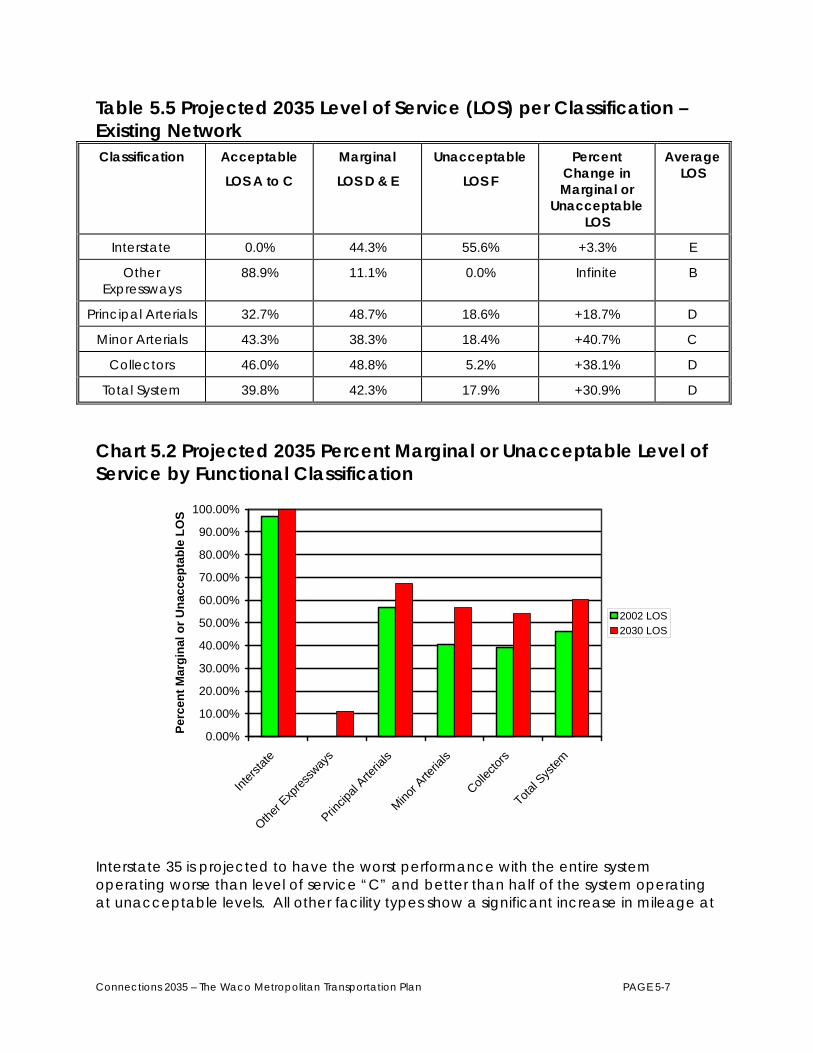
Table 5.5 Projected 2035 Level of Service (LOS) per Classification – Existing Network Classification Acceptable
LOS A to C
Marginal
LOS D & E
Unacceptable
LOS F
Percent Change in Marginal or
Unacceptable LOS
Average LOS
Interstate 0.0% 44.3% 55.6% +3.3% E
Other Expressways
88.9% 11.1% 0.0% Infinite B
Principal Arterials 32.7% 48.7% 18.6% +18.7% D
Minor Arterials 43.3% 38.3% 18.4% +40.7% C
Collectors 46.0% 48.8% 5.2% +38.1% D
Total System 39.8% 42.3% 17.9% +30.9% D
Chart 5.2 Projected 2035 Percent Marginal or Unacceptable Level of Service by Functional Classification
0.00%
10.00%
20.00%
30.00%
40.00%
50.00%
60.00%
70.00%
80.00%
90.00%
100.00%
Inters
tate
Other E
xpres
sway
s
Princip
al Arte
rials
Minor A
rteria
ls
Collec
tors
Total S
ystem
Perc
ent M
argi
nal o
r Una
ccep
tabl
e LO
S
2002 LOS2030 LOS
Interstate 35 is projected to have the worst performance with the entire system operating worse than level of service “C” and better than half of the system operating at unacceptable levels. All other facility types show a significant increase in mileage at
Connections 2035 – The Waco Metropolitan Transportation Plan PAGE 5-7
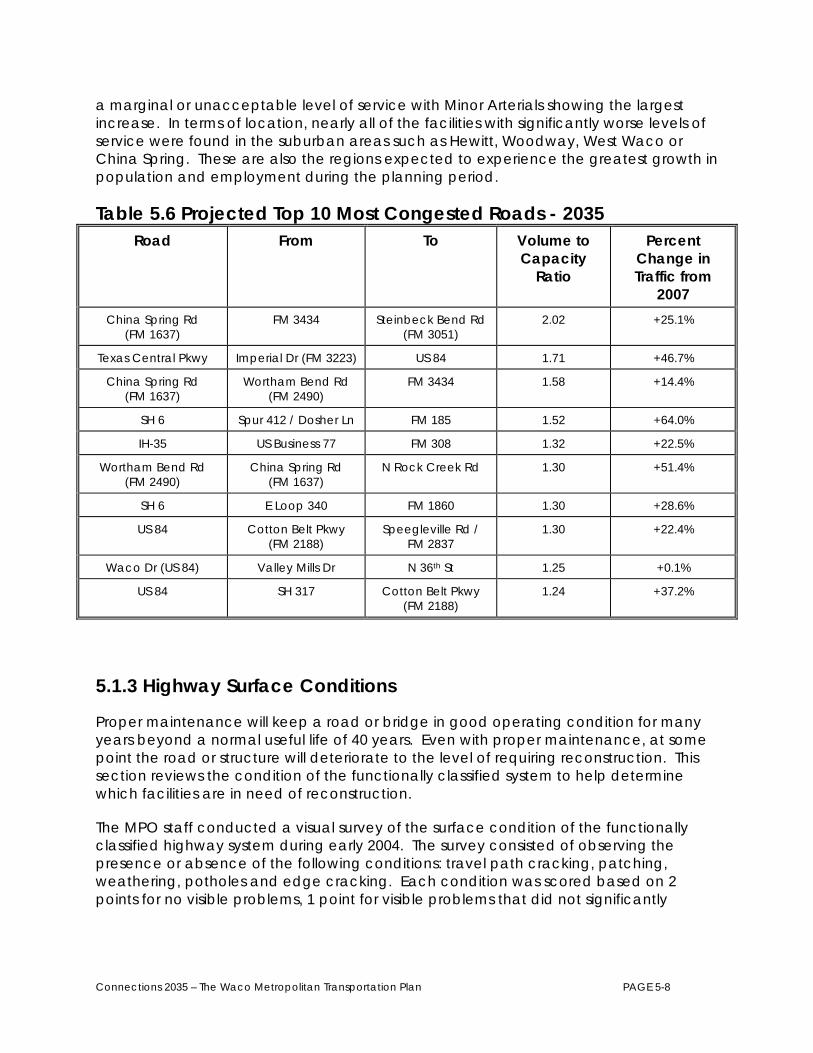
a marginal or unacceptable level of service with Minor Arterials showing the largest increase. In terms of location, nearly all of the facilities with significantly worse levels of service were found in the suburban areas such as Hewitt, Woodway, West Waco or China Spring. These are also the regions expected to experience the greatest growth in population and employment during the planning period.
Table 5.6 Projected Top 10 Most Congested Roads - 2035 Road From To Volume to
Capacity Ratio
Percent Change in Traffic from
2007 China Spring Rd
(FM 1637) FM 3434 Steinbeck Bend Rd
(FM 3051) 2.02 +25.1%
Texas Central Pkwy Imperial Dr (FM 3223) US 84 1.71 +46.7%
China Spring Rd (FM 1637)
Wortham Bend Rd (FM 2490)
FM 3434 1.58 +14.4%
SH 6 Spur 412 / Dosher Ln FM 185 1.52 +64.0%
IH-35 US Business 77 FM 308 1.32 +22.5%
Wortham Bend Rd (FM 2490)
China Spring Rd (FM 1637)
N Rock Creek Rd 1.30 +51.4%
SH 6 E Loop 340 FM 1860 1.30 +28.6%
US 84 Cotton Belt Pkwy (FM 2188)
Speegleville Rd / FM 2837
1.30 +22.4%
Waco Dr (US 84) Valley Mills Dr N 36th St 1.25 +0.1%
US 84 SH 317 Cotton Belt Pkwy (FM 2188)
1.24 +37.2%
5.1.3 Highway Surface Conditions
Proper maintenance will keep a road or bridge in good operating condition for many years beyond a normal useful life of 40 years. Even with proper maintenance, at some point the road or structure will deteriorate to the level of requiring reconstruction. This section reviews the condition of the functionally classified system to help determine which facilities are in need of reconstruction.
The MPO staff conducted a visual survey of the surface condition of the functionally classified highway system during early 2004. The survey consisted of observing the presence or absence of the following conditions: travel path cracking, patching, weathering, potholes and edge cracking. Each condition was scored based on 2 points for no visible problems, 1 point for visible problems that did not significantly
Connections 2035 – The Waco Metropolitan Transportation Plan PAGE 5-8

impact ride quality and 0 points for visible problems that significantly impacted ride quality.
The results showed that as a general rule, the functionally classified network has an acceptable pavement surface condition. Only 5 highways were found to have a surface condition rating equal to zero (see table 3.8) and only 6% of all functionally classified facilities were found to have a surface condition rating below 5.
Of concern was the relatively high number of urban collectors rating below 5. These facilities are generally maintained by McLennan County or a municipal government and may point to a need for additional resources for highway maintenance at the county or municipal level. Another point of concern was the relatively low average scores for Interstate 35. It should be noted, however, that at the time of publication, resurfacing work was being conducted for a significant portion of the lowest scoring segments of IH-35.
Table 5.7 Road Surface Condition by Functional Classification*
Classification Average Condition Rating
Percent with Rating Below 5
Interstate 6.8 0.0%
Other Expressways 9.0 8.5%
Principal Arterials 9.4 1.9%
Minor Arterials 8.7 5.4%
Urban Collectors 6.8 27.8%
Rural Collectors 8.6 3.4%
Total** 8.4 6.0% *20.4 centerline miles of roads were not evaluated due to the facility being under construction. **Roads classified as local were not evaluated.
Table 5.8 Facilities with Surface Condition of Zero Road From To Classification Traffic Count
Craven Ave FM 933
(Gholson Rd)
Business 77 Minor Arterial 475
Williams Rd US 84 Concord Rd Collector 2,545
Walnut St Crest Dr Craven Ave Collector 510
Connections 2035 – The Waco Metropolitan Transportation Plan PAGE 5-9

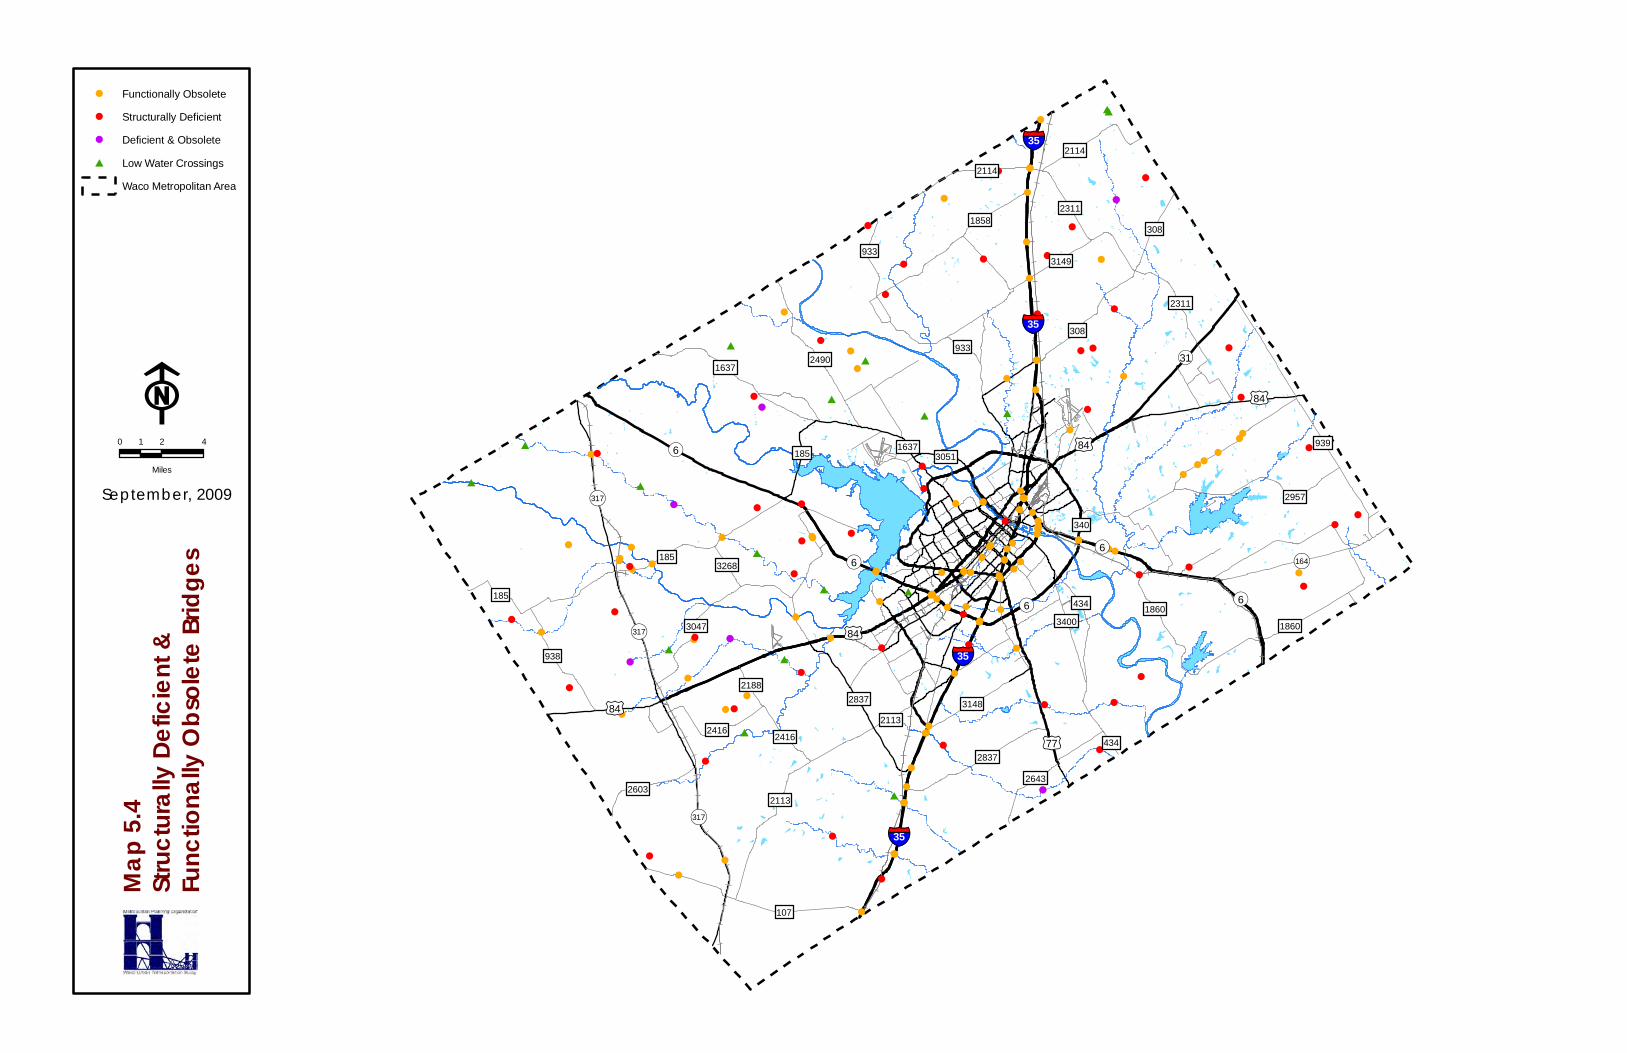
5.1.4 Bridge Conditions
Every 2 years the Texas Department of Transportation evaluates the structural condition of every public use bridge within Texas to help in determining priorities for bridge rehabilitation and reconstruction. Each bridge receives a score based on a maximum of 100 points with scores of 50 or below an indication of structural deficiency. Bridges scoring below 50 points are eligible for replacement using federal funds.
The results show that most bridges significantly exceed minimum standards for structural integrity. Of the 659 public use bridges in McLennan County, only 51 or 7.7% were considered structurally deficient. Of the structurally deficient bridges, 43 or 84.3% were maintained either by McLennan County or a local municipality.
In addition to bridges, there are 17 low water crossings within McLennan County. These are crossings were instead of a bridge being built over the water feature, the road uses the creek bed for the crossing. Low water crossings are used in locations where traffic volumes are generally low and the creeks are dry most of the time. Low water crossings are not used as extensively as in other parts of Texas due primarily to the amount of rainfall received within McLennan County. Despite the fact that these crossings are usually dry, they do occasionally flood due to excessive rainfall.
Table 5.9 2007 Bridge Sufficiency Ratings by Functional Classification Classification Bridges Average Rating Percent Structurally
Deficient Interstate 110 82.3 0.0%
Other Expressways 58 77.7 1.7%
Principal Arterials 75 84.3 1.3%
Minor Arterials 78 85.4 2.6%
Collectors 126 87.9 3.2%
Local 207 72.2 20.8%
Total 659 81.2 7.7%
Connections 2035 – The Waco Metropolitan Transportation Plan PAGE 5-10
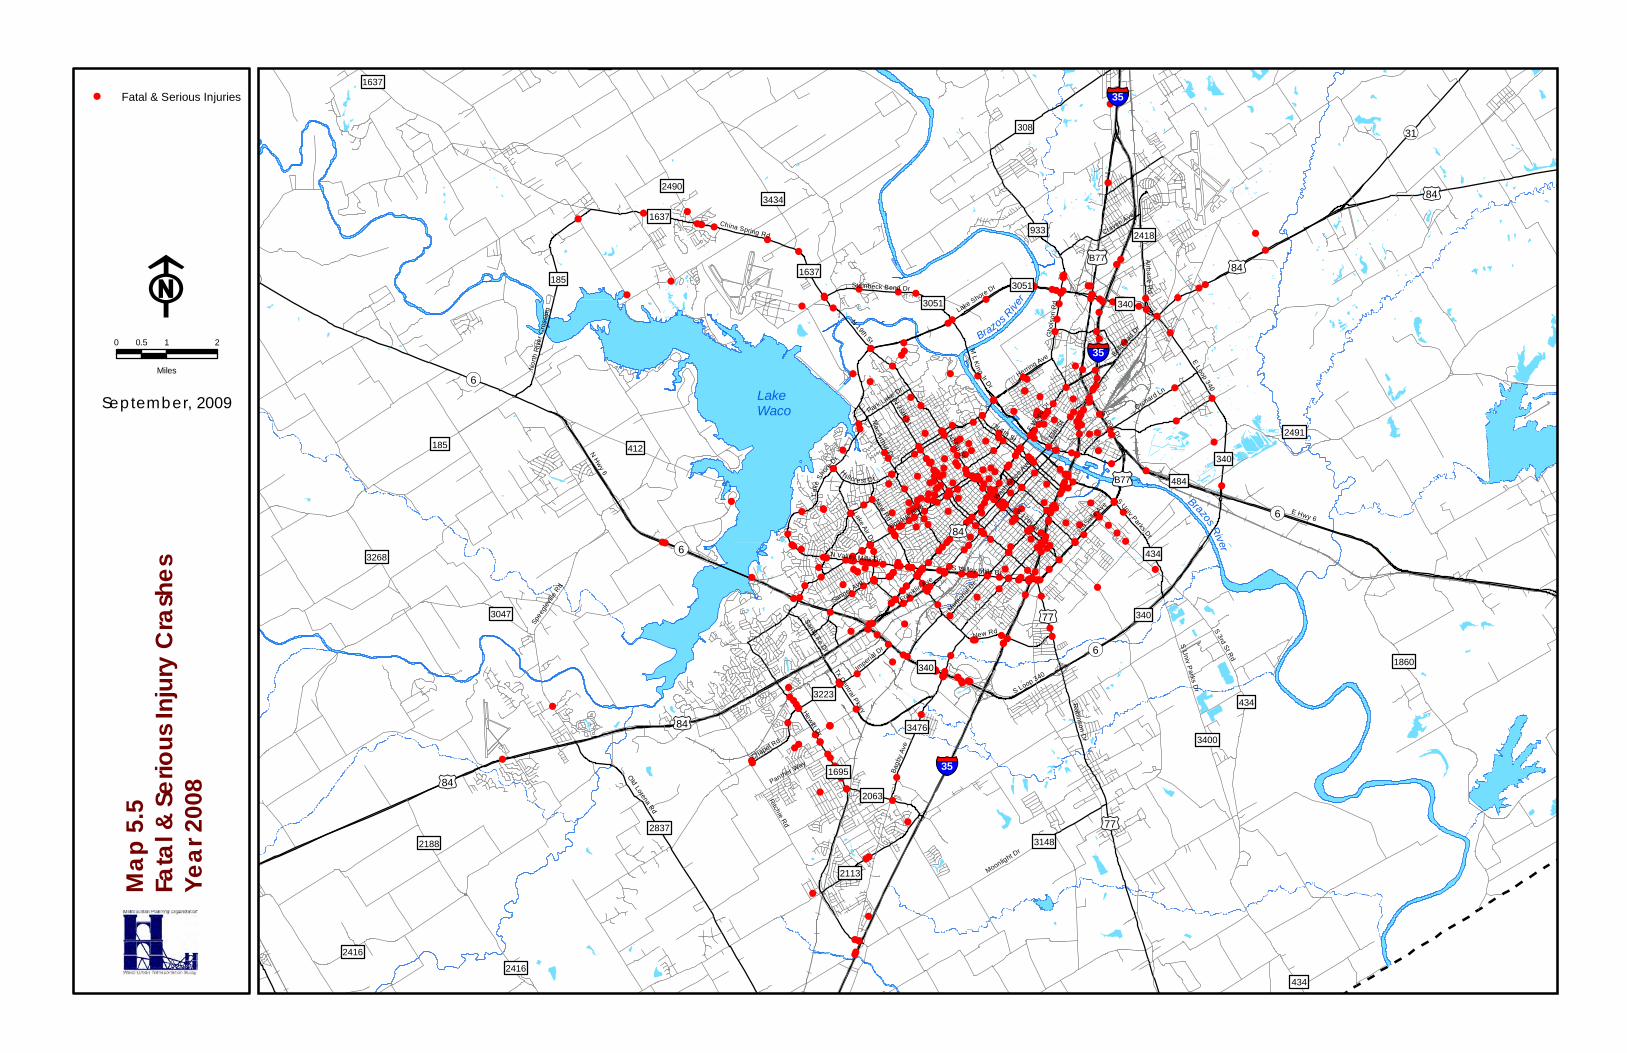
5.1.5 Highway Crash Analysis
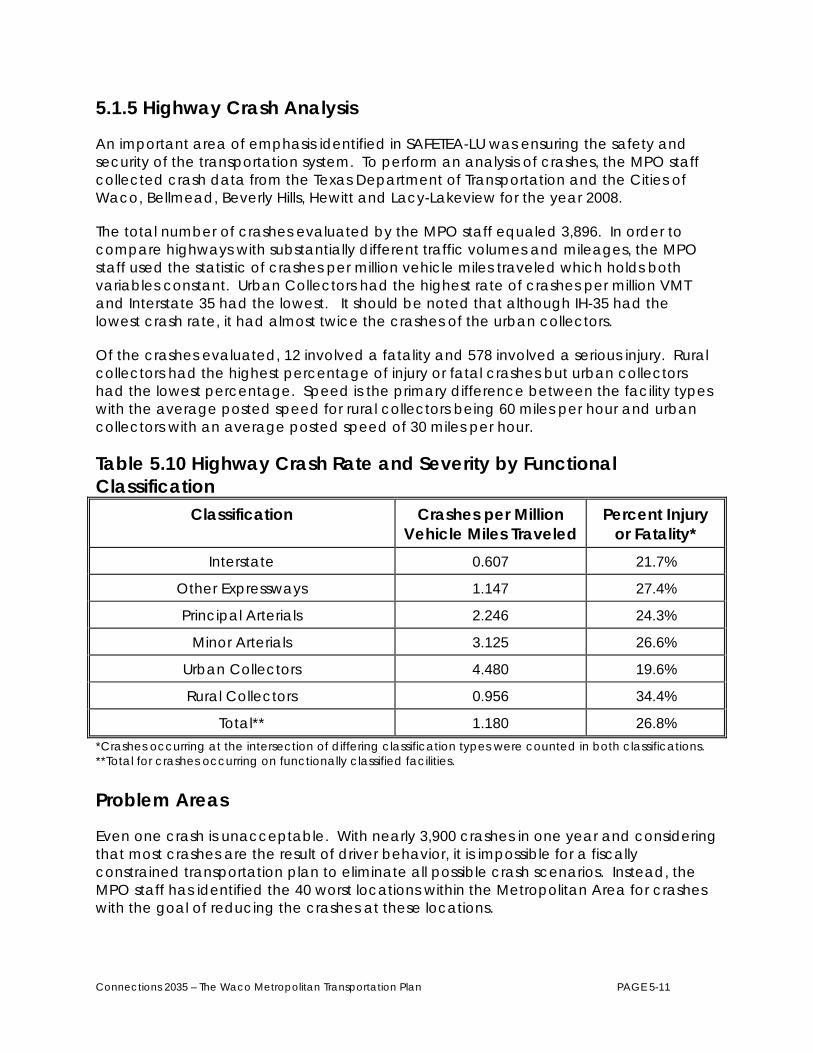
An important area of emphasis identified in SAFETEA-LU was ensuring the safety and security of the transportation system. To perform an analysis of crashes, the MPO staff collected crash data from the Texas Department of Transportation and the Cities of Waco, Bellmead, Beverly Hills, Hewitt and Lacy-Lakeview for the year 2008.
The total number of crashes evaluated by the MPO staff equaled 3,896. In order to compare highways with substantially different traffic volumes and mileages, the MPO staff used the statistic of crashes per million vehicle miles traveled which holds both variables constant. Urban Collectors had the highest rate of crashes per million VMT and Interstate 35 had the lowest. It should be noted that although IH-35 had the lowest crash rate, it had almost twice the crashes of the urban collectors.
Of the crashes evaluated, 12 involved a fatality and 578 involved a serious injury. Rural collectors had the highest percentage of injury or fatal crashes but urban collectors had the lowest percentage. Speed is the primary difference between the facility types with the average posted speed for rural collectors being 60 miles per hour and urban collectors with an average posted speed of 30 miles per hour.
Table 5.10 Highway Crash Rate and Severity by Functional Classification
Classification Crashes per Million Vehicle Miles Traveled
Percent Injury or Fatality*
Interstate 0.607 21.7%
Other Expressways 1.147 27.4%
Principal Arterials 2.246 24.3%
Minor Arterials 3.125 26.6%
Urban Collectors 4.480 19.6%
Rural Collectors 0.956 34.4%
Total** 1.180 26.8% *Crashes occurring at the intersection of differing classification types were counted in both classifications. **Total for crashes occurring on functionally classified facilities.
Problem Areas
Even one crash is unacceptable. With nearly 3,900 crashes in one year and considering that most crashes are the result of driver behavior, it is impossible for a fiscally constrained transportation plan to eliminate all possible crash scenarios. Instead, the MPO staff has identified the 40 worst locations within the Metropolitan Area for crashes with the goal of reducing the crashes at these locations.
Connections 2035 – The Waco Metropolitan Transportation Plan PAGE 5-11

In identifying the worst crash locations, the MPO staff separated locations into highway segments and intersections. Then the worst locations for each were identified by the absolute number of crashes and then by crashes per million vehicle miles traveled for highway segments and crashes per million vehicles for intersections. This analysis is used in order to compare highways and intersections with differing traffic volumes and segment lengths. Further analysis provided details about the manner of collisions for each segment or intersection thus providing insights on possible corrective actions to reduce the number of crashes at these locations.
Table 5.11 Worst 10 Highway Segments – Crashes per Million Vehicle Miles Traveled - 2008*
Street From To Total Crashes
Crashes per Million VMT
Fatal & Serious Injury Crashes
Bosque Blvd** N 34th St N 18th St 29 31.37 8 N 26th St** Waco Dr Franklin Ave 16 31.33 5
Franklin Ave** S 18th St S 11th St 27 29.24 4 N 17th St** Franklin Ave Waco Dr 42 25.92 5 N 18th St** Waco Dr Franklin Ave 41 25.30 9 S 12th St Speight Ave LaSalle Ave 22 20.10 1
Valley Mills Dr Wooded Acres Dr
Lake Air Dr 26 19.92 2
Dutton Ave S 11th St S 18th St 13 19.86 3 Homan Ave** N 18th St N 26th St 18 19.79 2
S 26th St Franklin Ave Dutton Ave 20 17.99 4 *Minimum 10 crashes **One-Way streets
Connections 2035 – The Waco Metropolitan Transportation Plan PAGE 5-12

Table 5.12 Worst 10 Highway Segments – Total Crashes - 2008 Street From To Total Crashes Fatal & Serious
Injury Crashes
SH 6 / W Lp 340* US 84 IH-35 82 15 IH-35* S 5th St S 18th St 74 12
North Lp 340 IH-35 US 84 59 3 IH-35* M L King Jr Dr US Business 77 48 10 IH-35* Valley Mills Dr S 18th St 43 8
N 17th St** Franklin Ave Waco Dr 42 5 N 18th St** Waco Dr Franklin Ave 41 9 Hewitt Dr US 84 Chapel Rd /
Imperial Dr 41 5
LaSalle Ave S 18th St Waco Traffic Circle
39 4
Valley Mills Dr Bosque Blvd Wooded Acres Dr 36 5 *Expressway section – includes frontage road crashes. **One-Way streets
Reviewing the highway segment analysis, the highways with the greatest number of crashes, in addition to the greatest number of serious injury & fatal crashes are generally expressway or interstate sections. These facilities, however, also have the greatest traffic volumes, thus when taking into account vehicle miles of travel (VMT), these facilities have some of the lower values (<2.0 crashes per million VMT). When taking into account VMT, many of the worst highway segments are the one-way pairs within Waco.
When reviewing the contributing factors, there is not a clear pattern as to why the one-way pairs have significantly higher crash rates other than the signalized intersections along these facilities have significant numbers of red-light running crashes (see tables 5.13 & 5.14). These red-light running crashes are not necessarily related to the operations of the one-way pairs and would not necessarily have been prevented by conversion to two-way streets. In 2009, the City of Waco did convert the 11th / 12th street pair from one-way to two-way operations. The MPO will monitor crash rates along these facilities to assess whether such a conversion would have an impact on crash rates for similar facilities.
Another facility type, highways with continuous left turn lanes, appears to have significantly higher numbers of crashes in addition to higher crash rates per million VMT. One facility in particular, Valley Mills Drive, appears to be particularly problematic, especially between Bosque Blvd and Lake Air Drive. One of the significant issues are vehicles either turning left from the center turn lane into a place of business or vehicles turning left from a place of business into the flow of traffic. These maneuvers are
Connections 2035 – The Waco Metropolitan Transportation Plan PAGE 5-13

resulting in a large number of front to side-impact collisions, which are also the manner of collision most likely to result in either a serious injury or fatality when speed is not a significant factor. Another similar facility with a similar crash experience is Hewitt Dr. This corridor is becoming a concern due to the significant growth in both population and retail activity recently experienced in the corridor and projected during the planning period.
Other trends of concern are the high number of crashes occurring at merge locations along the expressway and interstate systems where high speed traffic is mixing with relatively lower speed traffic merging from the frontage roads. TxDOT is current reviewing designs for such facilities to reduce the number of on-ramps and to reconfigure these ramps to an ‘X’ configuration which switches many of the merging activities from the main lanes of such facilities to the lower speed frontage roads.
Table 5.13 Worst 10 Intersections – Crashes Per Million Vehicles – 2008*
Primary Street Secondary Street Total Crashes
Crashes per Million Vehicles
Fatal & Serious Injury Crashes
N 17th St** Austin Ave 19 3.28 2 LaSalle Ave Waco Traffic Circle 24 2.87 1
Bosque Blvd** N 26th St** 10 2.25 6 N 18th St** Franklin Ave 13 1.90 1 N 17th St** Franklin Ave 10 1.82 1 N 18th St** Austin Ave 10 1.73 2
US Business 77 N Lp 340 / Industrial Dr (FM 3051)
18 1.37 3
M L King Jr Dr E Herring Ave 10 1.31 3 Lyle Ave** N 18th St 11 1.21 1
Valley Mills Dr Waco Dr 23 0.95 4 *Minimum 10 crashes **One-Way street
Connections 2035 – The Waco Metropolitan Transportation Plan PAGE 5-14

Table 5.14 Worst 10 Intersections – Total Crashes - 2008
Primary Street Secondary Street Total Crashes Fatal & Serious Injury Crashes
LaSalle Ave Waco Traffic Circle 24 1 Valley Mills Dr Waco Dr 23 4
N 17th St* Austin Ave 19 2 US Business 77 N Lp 340 / Industrial Dr (FM
3051) 18 3
Franklin Ave N New Rd 14 4 Valley Mills Dr N New Rd 13 2
N 18th St* Franklin Ave 13 1 Valley Mills Dr Bagby Ave 12 3
Waco Dr N 4th St* 11 3 Waco Dr N New Rd 11 2
*One-Way street
In the staff review of intersection related crashes, the primary factor identified is one or more vehicles intending to run a red signal or failing to yield at either a stop or yield sign. Of the worst intersections, all but one, LaSalle Ave at the Waco Traffic Circle, are controlled by a traffic signal. As mentioned with the highway segment analysis, signalized intersections along the one-way pair system experienced significant numbers of red-light running crashes, thus contributing to the high crash rates per million VMT for those facilities. The 17th and 18th street corridors between Washington and Franklin Avenues and the intersections between Bosque / Homan / 25th / 26th Streets are some of the more problematic in terms of red-light running. The City of Waco is currently evaluating these are several other intersections with similar problems for red-light camera enforcement to reduce these types of crashes. The City and MPO staff are also reviewing some intersections, such as Franklin Ave at New Rd, for different design treatments such as the possibility of a traffic circle where space permits.
Another problematic intersection is where LaSalle Ave intersects the Waco Traffic Circle. Review by TxDOT and the City of Waco indicated that the primary problem is the close proximity of the Circle Drive intersection which does not permit LaSalle Ave traffic to safely merge into the traffic circle. TxDOT and Waco are currently reviewing design treatments for this portion of the circle to determine a low-cost alternative that preserves traffic flow onto Circle Drive.
Connections 2035 – The Waco Metropolitan Transportation Plan PAGE 5-15

5.2 Public Transportation In this section, the demand for public transportation is estimated to compare to current services and identify existing gaps in coverage. Important destination points are also identified and mapped to analyze the efficiency and completeness of existing services. The results from this section will be used in Chapter 5 to identify future projects to eliminate gaps in service and to ensure adequate service to those areas with the greatest estimated demand.
5.2.1 Transit Need Index
All areas have some degree of need for public transportation. In order to estimate this demand, an index was used to quantify and locate areas of greatest need for the six county region. Transit need indices have been widely used within urbanized areas, but generally have a significant emphasis on population density for the provision of urban fixed route services. For this plan, the transit need index has been modified to estimate overall need regardless of population density. The MTP uses the transit need index used to estimate need for the 6 county Heart of Texas region in the Regional Public Transportation Coordination Plan.
Methodology To estimate need, several characteristics were identified for persons for whom use of a motor vehicle is either a financial burden or a physical impossibility. Each population characteristic was identified at the US Census Block Group level, the smallest level of geography for which this data were available. The primary characteristics included the following:
• Median Household Income • Persons in Poverty • Persons Age 65 and Above • Persons with a Self-Care or Stay at Home Disability
Although not a population characteristic, occupied housing units with no automobiles was also used to estimate those households that have no access to a motor vehicle. Even though high transit usage by minorities is generally related to overall lower household incomes or higher poverty rates for minorities, minority population was also utilized within the index primarily because there was not a direct relationship between minority population and low income or high poverty. Some block groups within the region had relatively high minority populations but relatively high household incomes or relatively low poverty rates and vice-versa. Minority population was not emphasized within the index, however, and was weighted accordingly.
Connections 2035 – The Waco Metropolitan Transportation Plan PAGE 5-16

Each population characteristic was weighted within the index to reflect its relative importance or unimportance. Table 4.1 identifies the relative weights for each characteristic.
Table 5.14 – Population Characteristics & Weights Population Characteristic Weight Median Household Income 1.0
Persons in Poverty 2.0
Persons Age 65 or Over 2.0
Persons with a Self-Care or Stay at Home Disability 1.5
Occupied Housing Units with No Automobiles 1.5
Minority Population 1.0
Population Density 0.5 While the goal of the transit need index is to identify places where the population may have a greater need for transit, regardless of the size of the population, the quantity of service would be greater for areas with a high need index and high population densities. For this reason, population size classes were used within the index to provide a slightly higher score for those areas with greater population. Table 4.2 identifies the population size classes used within the index.
Table 5.15 – Population Size Classes Population Density
(Persons per Square Mile) Size
Class 0 to 500 1
500.1 to 1000 2
1000.1 to 3000 3
3000.1 to 6000 4
Over 6000 5
In constructing the transit need index, each population characteristic for each block group was compared to the averages for the entire region. The average for the Heart of Texas region was indexed at 1.0. Scores for individual block groups were based on a percentage of the regional average. For instance, the regional average for percent of persons in poverty is 16.37%. A block group with a percentage of 32.74% (double the regional average) would achieve a score of 2.0 for this population characteristic. For population density, the size class would be the score for the block group. Once a score
Connections 2035 – The Waco Metropolitan Transportation Plan PAGE 5-17
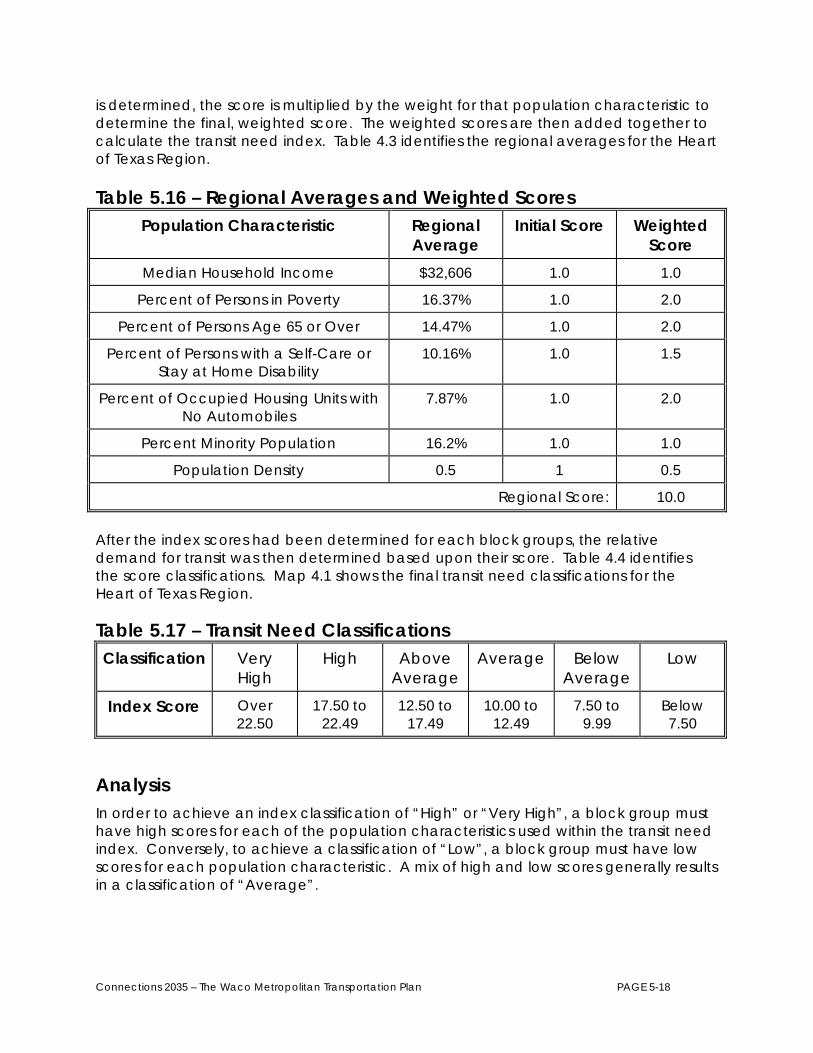
is determined, the score is multiplied by the weight for that population characteristic to determine the final, weighted score. The weighted scores are then added together to calculate the transit need index. Table 4.3 identifies the regional averages for the Heart of Texas Region. Table 5.16 – Regional Averages and Weighted Scores
Population Characteristic Regional Average
Initial Score Weighted Score
Median Household Income $32,606 1.0 1.0
Percent of Persons in Poverty 16.37% 1.0 2.0
Percent of Persons Age 65 or Over 14.47% 1.0 2.0
Percent of Persons with a Self-Care or Stay at Home Disability
10.16% 1.0 1.5
Percent of Occupied Housing Units with No Automobiles
7.87% 1.0 2.0
Percent Minority Population 16.2% 1.0 1.0
Population Density 0.5 1 0.5
Regional Score: 10.0 After the index scores had been determined for each block groups, the relative demand for transit was then determined based upon their score. Table 4.4 identifies the score classifications. Map 4.1 shows the final transit need classifications for the Heart of Texas Region.
Table 5.17 – Transit Need Classifications Classification Very
High High Above
Average Average Below
Average Low
Index Score Over 22.50
17.50 to 22.49
12.50 to 17.49
10.00 to 12.49
7.50 to 9.99
Below 7.50
Analysis In order to achieve an index classification of “High” or “Very High”, a block group must have high scores for each of the population characteristics used within the transit need index. Conversely, to achieve a classification of “Low”, a block group must have low scores for each population characteristic. A mix of high and low scores generally results in a classification of “Average”.
Connections 2035 – The Waco Metropolitan Transportation Plan PAGE 5-18

According to the transit need index, the most significant concentration of transit demand exists near Downtown Waco, East Waco and portions of South Waco (See Map 5.10). These areas are characterized by low incomes and high poverty rates, high percentages of persons with disabilities and relatively low automobile accessibility. Other areas within the region with high demand can be found in the vicinity of McLennan Community College, TSTC and along the Sanger Ave corridor between Lake Air Dr and Valley Mills Dr. Most other areas were generally classified as having “Average” or less transit need. The lowest scores were found in Woodway, which had the highest incomes and the lowest poverty rates. Low scores were also found in Hewitt, Robinson and the China Spring Areas. Map 5.6 shows the transit need index scores for the Waco Urbanized Area.
Transit need only measures half of the equation for determining the location and type of public transportation service. Locating primary destination points (large employers, retail shopping center, doctors offices, etc.) and how to connect these to the high demand areas is the other half of the equation. Section 5.2.2 identifies the most important destinations within the region and provides this analysis.
5.2.2 Destination Analysis
The MPO staff analyzed the Waco Transit Fixed Route system to determine its effectiveness in reaching primary destination points within McLennan County. The MPO identified 1,318 locations that are likely attractors of riders from the system. Of these destinations, 174 (13.2%) were located outside of the Waco Urbanized Area. Of the destinations within the urbanized area, the MPO determined that 72.8% of the destinations within the Waco Urbanized Area were within a reasonable walking distance of one of the fixed routes (defined as ¼ mile without significant barriers to cross).
Of all destination classes, three stand out for being underserved by the fixed route service: Industrial / Manufacturing, Nursing Home / Assisted Living and Parks / Recreation / Tourism. In each case less than 70% of the destinations are within walking distance, although only Nursing Home / Assisted Living had less than 70% of destinations within the ¾ mile distance of one or more fixed routes.
Connections 2035 – The Waco Metropolitan Transportation Plan PAGE 5-19

Table 5.21 – Destination Analysis for Waco Transit Fixed Routes: Waco Urbanized Area
Destination Total in Urban Area Percent within ¼ Mile
Percent within ¾ Mile
Apartment Complexes 123 73.2% 91.1%
Banks / Financial 59 78.0% 88.1%
Child Day Care 79 72.2% 82.3%
Government / Public Assistance 91 83.5% 89.0%
Hotels / Motels 49 93.9% 98.0%
Industrial / Manufacturing 103 58.3% 79.6%
Medical / Dental 105 83.8% 89.5%
Nursing Home / Assisted Living 15 66.7% 66.7%
Parks / Recreation / Tourism 104 51.9% 71.1%
Retail / Office Centers 135 85.9% 90.4%
All Others 281 67.7% 81.9%
All Destinations 1,144 72.8% 85.5%
Public transportation services from the surrounding rural counties make daily trips into the Waco Metropolitan Area primarily for medical or school trips. As these services are primarily demand response services, providing curb to curb service, access to other destinations within the Waco Metropolitan Area can only be accomplished through a transfer to one of the fixed routes for Waco Transit. Below is a discussion of the medical and educational services which serve as the primary destination points for these rural services and connectivity to the Waco Transit fixed route system.
Hospitals / Medical Offices / Kidney Dialysis The Waco Metropolitan Area is served by 3 hospitals, Providence Medical Center and Hillcrest Baptist Medical Center both of which are located along SH 6 / Loop 340 and the VA Medical Center located on New Rd near Beverly Hills. Although each rural county has some medical services available, specialized treatments within the 6 county Heart of Texas region are generally only found in Waco. Medical treatments are generally not optional and for those older than age 65 or with serious medical conditions and regular visits to medical professionals can be a matter of life or death. For this reason, medical appointments dominate the trip purposes for rural public
Connections 2035 – The Waco Metropolitan Transportation Plan PAGE 5-20
transportation within the Heart of Texas region with between 45 and 75 percent of all current trips being medically related. A significant percentage of these trips are related to kidney dialysis, trips that must be made on a regular basis. The following are the more important medical destinations within the region, all of which are served by one or more Waco Transit fixed routes.
• VA Medical Center, Waco • Hillcrest Baptist Medical Center, Waco • Providence Medical Center, Waco • Brazos Kidney Disease Center, Waco • Bellmead Kidney Disease Center, Bellmead
Education Three institutions of higher education exist within the Waco region. Baylor University in Waco is the only four-year university within the region. Texas State Technical College (TSTC) provides two-year degrees focusing on technical trades. McLennan Community College provides two-year associate degrees in a number of disciplines as well as the City College program which permits students to earn 4-year and graduate degrees through Tarleton State University and the University of Texas at Arlington. Waco Transit serves Baylor with a shuttle service that circulates through the campus and immediate vicinity. The Waco Transit Fixed Route Service serves all three schools with one or more fixed routes.
5.2.3 Security of the System
Ever since the terrorist attacks of September 11th, ensuring adequate security of the transportation system has been a top priority of the US Government. To emphasis this, SAFETEA-LU separated security into a stand alone planning consideration. In Waco, the public transportation system is the most obvious first line of defense in securing the transportation system, as this is the mode with the largest concentration of travelers in one place at one time. It is not terrorism, however, but crimes such as robbery, theft or assault that pose the most realistic, although uncommon, threat to users of Waco Transit. It is important to note, however, that due to the very nature of topic, some details regarding the security of the system cannot be discussed in a public forum. Both Waco Transit and the Heart of Texas Council of Governments (rural and elderly & disabled programs) coordinate with local first responders and McLennan County Emergency Management to minimize potential threats to their respective systems. The details provided below are such that a public discussion does not jeopardize their effectiveness in minimizing threats to the users of the system.
The first line of defense for users of Waco Transit are the buses themselves. In late 2007, Waco Transit began accepting delivery of new buses to replace the existing fleet (See project T-2). These new buses are equipped with an audio / video surveillance system to record all activities inside and outside of the bus as well as all sound inside the bus.
Connections 2035 – The Waco Metropolitan Transportation Plan PAGE 5-21
This system can be monitored remotely in real time should the driver declare an emergency or a threat be made against the system. The buses also include Geographical Positioning System (GPS) technology which allows Waco Transit to track every movement the bus makes. Finally each bus is equipped with an emergency switch that can be activated by the driver that automatically sends an emergency signal to the Waco Police department and Waco Transit and activates an emergency indicator on the bus for easy identification.
The next line of defense are the facilities maintained by Waco Transit, including the Intermodal Center and the Maintenance & Administration Facility. Both facilites have video surveillance to monitor activities in and around these buildings. In addition, electronic door locks have been installed to restrict access to certain areas of each facility. Access to restricted areas can only be provided through magnetic ID cards which records the employees name, date, time, and area of the facility the employee is accessing. This system can also be programmed to restrict the access of employees to only those areas within each facility where access is necessary for their position.
Bus shelters (See project T-1) are another area being targeted by Waco Transit for additional security measures. During the winter months, Waco Transit fixed route operations begin and end during darkness. To provide a level of comfort for system users, future shelters are proposed to be lit with solar powered lights. In addition to these measures, emergency call boxes are proposed for installation at each shelter. Once activated by a user being threatened, video and audio surveillance of the shelter would begin and then would connect to E-911 and to local first responders.
5.2.4 Coordination of Public Transportation Services
In November of 2006, the Heart of Texas Council of Governments (HOTCOG), in cooperation with the Waco MPO, Waco Transit, TxDOT, and Central Texas Senior Ministries, developed a the Coordinated Regional Public Transportation Plan. This plan, which covers the 6 county region served by HOTCOG, identifies the long term public transportation needs for the region and strategies the region’s governments intend to implement to provide more service with the same resources. The Waco MPO Policy Board adopted and supported this plan in November, 2006 and by this reference incorporates the recommendations of this plan into the MTP.
5.3 Bicycle and Pedestrian
5.3.1 Bicycle Needs
Wilbur Smith Associates identified several corridors appropriate for bicycle facilities within the Waco Urbanized Area in a draft document submitted in 2005. The MPO staff reviewed these corridors and made appropriate changes and prioritized the corridors in
Connections 2035 – The Waco Metropolitan Transportation Plan PAGE 5-22

order of importance. Sections 7.17 and 7.26 identify the top priorities identified by the staff and Map 7.9 identifies all corridors and priorities within the Waco Urbanized Area.
5.3.2 Pedestrian Needs
The City of Waco has produced a sidewalk plan to identify corridors where the construction or reconstruction of sidewalks are required when plans are submitted for new commercial or residential construction. This plan also serves as a guide for the construction of new sidewalks as city funds become available. The MPO staff used the Waco plan as a starting point for the development of a regional sidewalk network and to prioritize corridors for project recommendations identified in sections 7.17 and 7.26. Corridors identified by the staff would construct a sidewalk on one side of the roadway, unless otherwise noted, and would provide all other necessary infrastructure such as wheelchair ramps, etc. The MPO staff identified 3 levels of priority for pedestrian corridors. The top priorities were to connect elementary and some secondary schools to nearby neighborhoods, correct a safety problem or complete a short gap in the existing system. Second priorities extend the system to connect to retail corridor and remaining secondary schools. Third priorities were to make final connections necessary to support an expanded public transportation network and to support the Alternative 2 land use scenario identified in section 3.1.4. The MPO staff did not identify all corridors identified within the Waco plan and focused on the most important connections. Maps 7.7 and 7.8 identify the priorities identified by the MPO staff.
5.4 Rail The population of the Dallas / Houston / San Antonio triangle is anticipated to nearly double during the MTP planning period putting significant strains on the highway and aviation systems. It is anticipated that even with a wider IH-35, a separate toll road, and larger airplanes that these systems will not be able to accommodate the mobility demands of the triangle. Two proposals have been made to introduce high speed rail into the modal mix in an attempt to meet these mobility needs.
Future Passenger Rail
Commuter rail uses self-propelled cars on existing freight rail tracks with travel speeds less than 60 mph. These systems are generally far less expensive than other forms of passenger rail and also make numerous stops. Commuter rail only been discussed as a possibility by governments in the Heart of Texas and North Central Texas Regions. Mobility 2035, the Metropolitan Transportation Plan for the Dallas / Fort Worth region identifies potential future extensions of commuter rail southward from the Fort Worth Intermodal Center into Cleburne and further south. Additional service is also identified southward from Union Station in Dallas to Waxahatchie and could provide another possible southward connection. Conceptually a commuter rail line would run
Connections 2035 – The Waco Metropolitan Transportation Plan PAGE 5-23
approximately parallel to IH-35 and connect to Austin and San Antonio via Waco. Such a system would compliment any high-speed system (see below) by providing stops to smaller communities which could not be feasibly served by the high-speed system. It is envisioned that Waco would be a connection point between the two systems. Currently there are no substantive plans for development of such a system and no funding has been authorized.
High-speed passenger rail refers to any such equipment that has a normal operating speed in excess of 150 mph. Due to their speed, these facilities are completely grade separated from other transportation facilities and make far fewer stops than other forms of rail transportation. The current proposed high speed rail concept is referred to as the “Texas T-Bone”. This concept would create 2 high speed lines: the first line running from the Dallas / Fort Worth International Airport to San Antonio, the second line running from Houston and intersecting the first line in Temple. The Texas T-Bone is currently only conceptual and does not have funding for any phase of study.
Future Freight Concepts
The Texas Transportation Institute is currently developing a system to transport short to medium haul freights via a fully automated monorail based system. Called the ‘Freight Shuttle’, the system would use individual carriers to transport a single 40 foot container distances of up to 500 miles. The system would be fully elevated, travel at speeds of 60 mph and use electricity at least partly generated by solar power. Due to the relatively low speeds, existing expressway right of way could be utilized thus keeping potential costs relatively low. The intent of the Freight Shuttle is to provide an energy efficient, low emission and cost effective means of transporting goods which Class I railroads such as BNSF or Union Pacific cannot transport cost-effectively and to minimize the amount of freight being transported long-distances by truck. A conceptual model of the Freight Shuttle is currently being developed by TTI and could be implemented by as early as 2020. The IH-35 corridor has been discussed as one of the first lines on the system should the concept prove to be reliable and cost-effective. If implemented, freight transfer stations would have to be developed and located to deliver freights from the shuttle to businesses and industries within the region.
5.5 Aviation US Airlines are in the process of phasing out turbo-prop aircraft for their short distance and low volume routes in favor of regional jets. Regional jets are generally larger than the turboprops they are replacing with seating capacities in the range of 50 to 70. As a result they require more terminal space to accommodate the larger number of passengers and the larger aircraft require greater runway distances for takeoff and landing. ACT is capable of handling regional jets both in terms of terminal space and runway length.
General aviation is also moving towards a greater usage of corporate jets as they are capable of traveling greater distances before refueling and are faster than the
Connections 2035 – The Waco Metropolitan Transportation Plan PAGE 5-24
turboprop aircraft. These aircraft also require greater runway distances than their turboprop cousins for takeoff and landing. ACT, CNW and PWG all currently accommodate corporate jets with sufficient runway length, parking aprons, refueling and powerplant services.
An opportunity to greatly expand aviation related industries at CNW has generated a proposal to construct a 6500’ x 150’ taxiway extending eastward from the end of runway 35R into property owned by the Waco Industrial Foundation. This taxiway will effectively force traffic accessing the L-3 plant at CNW to use Aviation Pkwy instead of Williams Road, which most plant traffic currently uses. Williams Road and Concord Road will both be closed to traffic at the point where the taxiway crosses. The resulting traffic increase at the intersection of Aviation Pkwy and US 84 will likely require the installation of a traffic signal short term and perhaps the construction of a grade separation long term.
Connections 2035 – The Waco Metropolitan Transportation Plan PAGE 5-25
84
35
35
6
164
317
317
31
185
2113
16372490
933
308
1860
77 434
2643
35
1858
3149933
2311
2114
2957
939
938
185
107
2603
35
2837
2113
16373051
434
3148
1860
2416
2188
2416
3047
3268
185
3400
340
2311
308
2114
317 84
84
84
2837
6
6
6
6
Map 5
.120
07 Le
vel o
f Serv
ice
2007 Level of ServiceAcceptable
Marginal
Unacceptable
Waco Metropolitan Area
0 2 41
Miles
September, 2009

New Rd
New Rd
S Loop 340
S Univ P
arks Dr
S 3rd St Rd
Robinson D
r
Moonlight Dr
Bagb
y Av
e
Hewitt Dr
Ritchie Rd
Chapel Rd
Panther Way
Tx Central Pkwy
Imperia
l Dr
MacArthur Dr
Park Lake Dr
Elm
St
Was
hingto
n Ave
Franklin Ave
M L K
i ng Jr Dr
LaSall
e Ave
S Valley Mills Dr
S Univ Parks Dr
S 17th StBosque BlvdLake Air Dr
N 25th St
N18th St
N 4th St
Herring Ave
E W
aco
Dr
H i ll crest Dr
Lake
Sho
re Dr
N Valley Mills Dr
Sanger Ave
Santa Fe Dr
Memor
ial D
r
Orchard LnE Loop 340
S Loop Dr
Bellmea
d Dr
Gho
lson
Rd
Lake Shore DrSteinbeck Bend Dr
Craven Ave
Airbase Rd
China Spring Rd
N 19th St
Nor
th R
iver
Cro
ssin
g
N Hwy 6
Spee
glev
ille R
d
Old Lorena Rd
E Hwy 6
77
35
2837
2113
1637
3051
434
3148
1860
2188
3047
3268
185
3400
340
84
84
6
6
6
84
77 340
484
2491
434
B77
340
1695
3476
3223
2063
3051
340
B77
9332418
35
1637
3434
2490
185 412
6
84
LakeWaco
Brazos River
Brazos Rive
r
Map 5
.220
07 Le
vel o
f Serv
ice -
Down
town
2007 Level of ServiceNo Data
Acceptable
Marginal
Unacceptable
Waco Metropolitan Area
0 1 20.5
Miles
September, 2009
New Rd
New Rd
S Loop 340
S Univ P
arks Dr
S 3rd St Rd
Robinson D
r
Moonlight Dr
Bagb
y Av
e
Hewitt Dr
Ritchie Rd
Chapel Rd
Panther Way
Tx Central Pkwy
Imperia
l Dr
MacArthur Dr
Park Lake Dr
Elm
St
Was
hingto
n Ave
Franklin Ave
M L K
i ng Jr Dr
LaSall
e Ave
S Valley Mills Dr
S Univ Parks Dr
S 17th StBosque BlvdLake Air Dr
N 25th St
N18th St
N 4th St
Herring Ave
E W
aco
Dr
H i ll crest Dr
Lake
Sho
re Dr
N Valley Mills Dr
Sanger Ave
Santa Fe Dr
Memor
ial D
r
Orchard LnE Loop 340
S Loop Dr
Bellmea
d Dr
Gho
lson
Rd
Lake Shore DrSteinbeck Bend Dr
Craven Ave
Airbase Rd
China Spring Rd
N 19th St
Nor
th R
iver
Cro
ssin
g
N Hwy 6
Spee
glev
ille R
d
Old Lorena Rd
E Hwy 6
£¤77
§̈¦35
2837
2113
1637
3051
434
3148
1860
2188
3047
3268
185
3400
340
£¤84
£¤84
!(6
!(6
!(6
£¤84
£¤77 340
484
2491
434
£¤B77
340
1695
3476
3223
2063
3051
340
£¤B77
9332418
§̈¦35
1637
3434
2490
185 412
!(6
£¤84
LakeWaco
Brazos River
Brazos Rive
r
Map 5
.320
35 N
o Buil
d Lev
el of
Servi
ce
F
2035 Level of ServiceNo Data
Acceptable
Marginal
Unacceptable
Waco Metropolitan Area
0 1 20.5
Miles
September, 2009
!!
!
!
!
!
!
!
!!
!
!!!!!!
!
!
!!
!
!
!
!
!
!
!
!!
!
!
!
!
!
!
!
!
!
!
!
!!
!
!
!!
!!!
!!!!
!!!
!
!
!
!
!
!
!
!!
!
!
!
!
!!
!!
!!!!!!
!
!!
!!
!
!
!!
!
!!
!
!
!!
!!
!
!
!!!
!
!
!
!
!
!
!
!
!
!
!
!
!
!
!
!
!
!
!
!
!
!
!
!
!
!
!
!
!
!
!
!
!
!
!
!
!
!
!
!
!
!
!
!
!
!
!
!
!
!
!
!
!
!
!
!
!
!
!
!
!
!
!
!
!
!
!
!
!
#
#
#
#
#
#
##
#
#
#
#
#
#
#
#
#
£¤84
§̈¦35
§̈¦35
!(6
!(164
!(317
!(317
!(31
185
2113
16372490
933
308
1860
£¤77 434
2643
§̈¦35
1858
3149933
2311
2114
2957
939
938
185
107
2603
§̈¦35
2837
2113
16373051
434
3148
1860
2416
2188
2416
3047
3268
185
3400
340
2311
308
2114
!(317 £¤84
£¤84
£¤84
2837
!(6
!(6
!(6
!(6
Map 5
.4Str
uctur
ally D
eficie
nt &
Func
tiona
lly O
bsole
te Bri
dges
F
! Functionally Obsolete
! Structurally Deficient
! Deficient & Obsolete
# Low Water Crossings
Waco Metropolitan Area
0 2 41
Miles
September, 2009
!
!
!
!
!
!
!!
!
! !!
!!
!!
!
!
!
!!
!
!
!
!
!
!
!
!
!
!
!!
!
!
!
!
!
!
!!
!
!
!
!
!
!
!
!
!
!
!
!
!
!
!
!
!
!
!
!
!
!
!
!
!
!
!
!
!
!
!
!
!
!
!
!
!
!
!
!
!
!
!
!
!
!
!
!
!
!
!
!
!
!!
!
!
!
!
!
!
!
!!
!
!
!
!
!
!
!
!
!
!
!
!
!
!
!
!
!
!
!
!
!
!
!
!
!
!
!
!
!!
!
!
!
!
!
!
!
!
!
!
!
!
!
!
!
!
!
!
!
!
!
!
!
!
!
!
!
!
!
!
!!
!!
!
!
!
!
!
!
!
!
!
!
!
!
!
!
!
!
!
!
!
!
!
!
!
!
!
!
!
!
!
!
!
!
!
!
!
!
!
!
!
!
!
!
!!
!!
!
!
!
!
!
!
!
!
!
!
!
!
!
!
!
!
!
!
!
!
!
!
!
!
!
!
!
!
!
!
!
!
!
!
!
!
!
!
!
!
!
!
!
!
!
!
!
!
!
!
!
!
!
!
!
!
!
! !
!
!
!!
!
!
!
!
!
!
!
!
!
!
!
!!!
!
!
!
!
!
!
!
!
!!
!
!
!
!
!
!!
!
!
!
!
!
!
!
!
!
!
!
!
!
!
!
!
!
!
!
!
!
!
!
! !
!
!
!
!
!
!
!
!
!
!!
!
!
!
!
!
!
!!
!
!
!
!
!
!
!
!
!
!
!
!
!
!
!
!
!
!!
!
!
!
!
!
!
!
!
!
!
! !
!
!
!
!
!
!
!
!
!
!
!
!
!
!
!
!
!
!
!
!
!
!
!
!
!
!
!
!
!
!
!
! !
!
!
!!
!
!
!!
!!
!
!
!
!
!
!
!
!
!
!
!
!!
!
!
!
!
!
!
!
!
!
!
!
!
!
!
!
!
!
!
!
!
!
!
!
!
!
!
!
!
!
!
!
!!
!
!
!
!
!
!
!
!
!
!
!
!
!
!
!
!
!
!!
!
!
!
! !
!
!
!!
!
!
!
!
!
!
!
!
!
!
!
!
!
!
!
!
!
!
!
!
!
!
!
!
!
!
!
!
!
!
!
!
!
!
!
!
!
!
!
!
!!!
!
!
!
!
!!
!
!
!!!
!
!
!
!!
!
!
!!!
!!!
!!
!
!
!
!
!!
!!!!! !!
!
!
!!!
New Rd
New Rd
S Loop 340
S Univ P
arks Dr
S 3rd St Rd
Robinson D
r
Moonlight Dr
Bagb
y Av
e
Hewitt Dr
Ritchie Rd
Chapel Rd
Panther Way
Tx Central Pkwy
Imperia
l Dr
MacA
rthur Dr
Park Lake Dr
Elm
St
Wash
ingto
n Ave
Franklin Ave
M L K
ing Jr Dr
LaSall
e Ave
S Valley Mills Dr
S Univ Parks Dr
S 17th StBosque BlvdLake Air Dr
N 25th St
N18th St
N 4th St
Herring Ave
E W
aco
Dr
H
i ll crest Dr
Lake
Sho
re
Dr
N Valley Mills Dr
Sanger Ave
Santa Fe Dr
Memoria
l Dr
Orchard Ln
E Loop 340
S Loop Dr
Bellm
ead D
r
Gho
lson
Rd
Lake Shore DrSteinbeck Bend Dr
Craven Ave
Airbase Rd
China Spring Rd
N 19th St
Nor
th R
iver
Cro
ssin
g
N Hwy 6
Spee
glevil
le Rd
Old Lorena Rd
E Hwy 6
§̈¦35
!(6
!(31
185
1637
2490
933
308
£¤77
434
2643
§̈¦35
2837
2113
1637
3051
434
3148
1860
2416
2188
2416
3047
3268
185
3400
340
£¤84
£¤84
£¤84
2837
!(6
!(6
!(6
!(6
£¤84
£¤77 340
484
2491
434
£¤B77
340
1695
3476
3223
2063
3051
340
£¤B77
933 2418
§̈¦35
1637
34342490
185 412
!(6
£¤84
LakeWaco
Brazos River
Brazos Rive
r
Map 5
.5Fa
tal &
Serio
us In
jury C
rash
esYe
ar 20
08
F
! Fatal & Serious Injuries
0 1 20.5
Miles
September, 2009

New Rd
New Rd
S Loop 340
S Univ P
arks Dr
S 3rd St Rd
Robinson D
r
Bagb
y Av
e
Hewitt Dr
Ritchie RdChapel R
d
Panther Way
Tx Central Pkwy
Imperia
l Dr
MacArthur Dr
Park Lake Dr
Elm
St
Was
hingto
n Ave
Franklin Ave
M L K
ing Jr Dr
LaSall
e Ave
S Valley Mills Dr
S Univ Parks Dr
S 17th StBosque BlvdLake Air Dr
N 25th St
N18th St
N 4th St
Herring Ave
E W
aco
Dr
H
i ll cres t Dr
Lake
Sho
re Dr
N Valley Mills Dr
Sanger Ave
Santa Fe DrMem
orial
Dr
Orchard Ln
E Loop 340
S Loop Dr
Bellmea
d Dr
Gho
lson
Rd
Lake Shore DrSteinbeck Bend Dr
Craven Ave
Airbase Rd
China Spring Rd
N 19th St
Nor
th R
iver
Cro
ssin
g
N Hwy 6
Spee
glev
ille R
d
Old Lorena Rd
E Hwy 6
§̈¦35
!(31
2490
308
£¤77
§̈¦35
1637
3051
434
1860
3047
185
3400
340
£¤84
£¤84
!(6
!(6
!(6
£¤84
£¤77 340
484
2491
434
£¤B77
340
1695
3476
3223
2063
3051
340
£¤B77
9332418
§̈¦35
1637
3434
2490
185 412
!(6
£¤84
LakeWaco
Brazos RiverBrazos R
iver
£¤84
Map 5
.6Tra
nsit N
eed I
ndex
F
Transit Need IndexLow
Below Average
Average
Above Average
High
Very High
0 1 20.5
Miles
September, 2009