Section 4.1 Graphs of the Sine and Cosine...
12
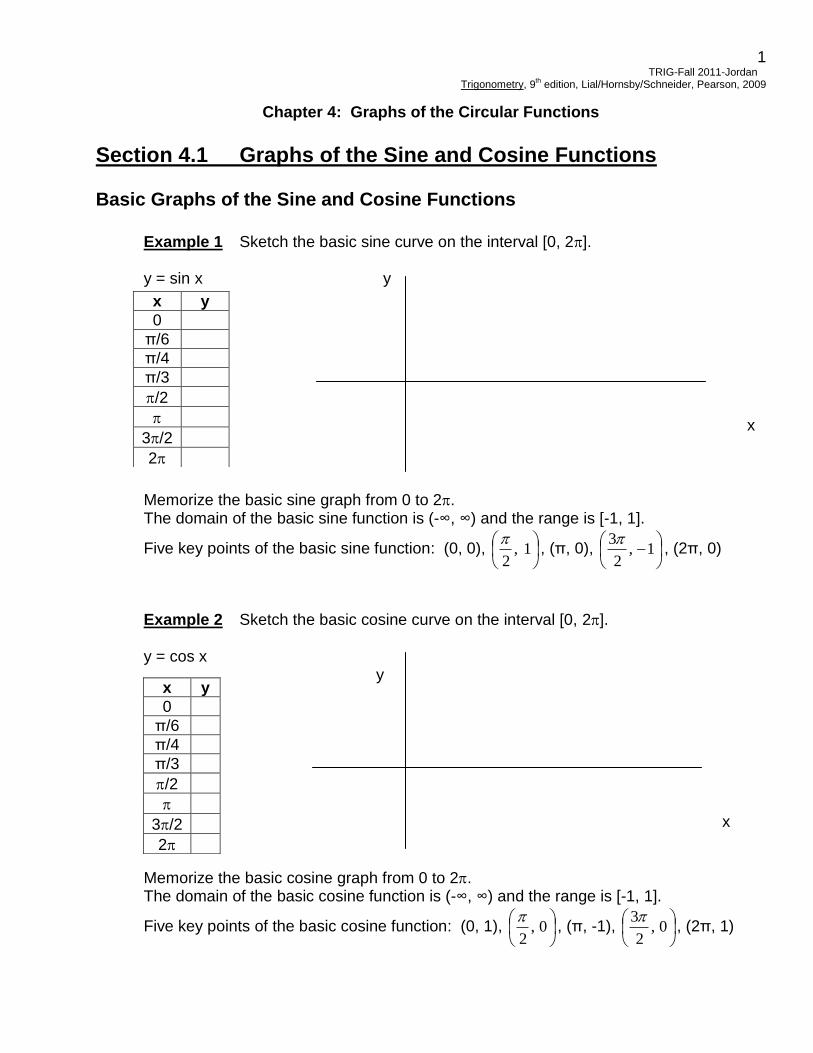
1 TRIG-Fall 2011-Jordan Trigonometry, 9 th edition, Lial/Hornsby/Schneider, Pearson, 2009 Chapter 4: Graphs of the Circular Functions Section 4.1 Graphs of the Sine and Cosine Functions Basic Graphs of the Sine and Cosine Functions Example 1 Sketch the basic sine curve on the interval [0, 2]. y = sin x y x Memorize the basic sine graph from 0 to 2. The domain of the basic sine function is (-∞, ∞) and the range is [-1, 1]. Five key points of the basic sine function: (0, 0), 1 , 2 , (π, 0), 1 , 2 3 , (2π, 0) Example 2 Sketch the basic cosine curve on the interval [0, 2]. y = cos x y x Memorize the basic cosine graph from 0 to 2. The domain of the basic cosine function is (-∞, ∞) and the range is [-1, 1]. Five key points of the basic cosine function: (0, 1), 0 , 2 , (π, -1), 0 , 2 3 , (2π, 1) x y 0 π/6 π/4 π/3 /2 3/2 2 x y 0 π/6 π/4 π/3 /2 3/2 2
Transcript of Section 4.1 Graphs of the Sine and Cosine...
1 TRIG-Fall 2011-Jordan
Trigonometry, 9th edition, Lial/Hornsby/Schneider, Pearson, 2009
Chapter 4: Graphs of the Circular Functions
Section 4.1 Graphs of the Sine and Cosine Functions Basic Graphs of the Sine and Cosine Functions Example 1 Sketch the basic sine curve on the interval [0, 2].
y = sin x y
x
Memorize the basic sine graph from 0 to 2. The domain of the basic sine function is (-∞, ∞) and the range is [-1, 1].
Five key points of the basic sine function: (0, 0),
1,
2
, (π, 0),
1,
2
3, (2π, 0)
Example 2 Sketch the basic cosine curve on the interval [0, 2]. y = cos x y
x
Memorize the basic cosine graph from 0 to 2. The domain of the basic cosine function is (-∞, ∞) and the range is [-1, 1].
Five key points of the basic cosine function: (0, 1),
0,
2
, (π, -1),
0,
2
3, (2π, 1)
x y
0
π/6
π/4
π/3
/2
3/2
2
x y
0
π/6
π/4
π/3
/2
3/2
2

2
Amplitude The amplitude of the sine and cosine curves is defined to be half the distance between the maximum and minimum values, which is not necessarily the same as the maximum height if the graph has been shifted up or down. The graph of y = a sin x or y = a cos x, with a ≠ 0, will have the same shape as the
graph of y = sin x or y = cos x, respectively, except the range will be a a, .
If a > 1, the graph is vertically stretched. If a < 1, the graph is vertically shrunk.
If a is negative, the graph is a reflection with respect to the x-axis.
Period The period of a graph is the length of one cycle of the graph.
X-scale
The x-scale is the distance on the x-axis between the key points.
The amplitude of y = a sin bx or y = a cos bx is a .
The period of y = a sin bx or y = a cos bx is b
2.
The x-scale is found by dividing the period of the function by 4.

3
Guidelines for Sketching Variations of the Sine and Cosine Graphs, y = a sin bx or y = a cos bx (b > 0) You should have the shapes of the basic sine and cosine graphs memorized between 0 and 2π. Find the amplitude. Find the period. Determine if there is an x-axis reflection (a < 0). Find the x-scale. Make your first mark on the x-axis at 0 and then make four more marks on the x-axis. Add the x-scale to 0 and then add the x-scale to each successive answer three times to label the markings on the x-axis. The fourth sum should equal the period. Label these
marks on the graph. Make four more marks on the x-axis either to the right or left as required and label the last mark. The amplitude will determine how to mark the y-axis as well as how high and low to draw the curve. If the value of a is negative, remember to reflect the graph with respect to the x-axis. Draw the general shape of the curve through the x and y-axis markings. Example 3 Sketch two full periods of the graph of y = -4cos 3x. State the amplitude, x-axis reflection, period, and five key points.
Example 4 Sketch two full periods of the graph of yx
1
2 4sin
. State the amplitude,
x-axis reflection, period, and five key points.
Correlating Online Graphs to Paper/pencil Graphs Do all the graphing problems on paper as presented in the lecture notes, including all the requested information. When your paper graph is complete, you can graph the function in your calculator and adjust the window settings to match the ones presented in the multiple choice format. This will help determine the correct online answer since their graphs may not be scaled in the same way as our paper ones will be.

4
Section 4.2 Translations of the Graphs of the Sine and Cosine Functions
Memorize the Basic Shapes of the Following Graphs
Phase Shift
The phase shift of a trig function is the horizontal translation (shift) of the graph and will give you the left or starting endpoint of one cycle of the graph.
The phase shift can also be found by setting the expression inside the trigonometric function between 0 and 2π, 0 ≤ bx + c ≤ 2π, and solving for x,. The left side of the solved inequality is the phase shift and represents the beginning of one cycle and the right side of the solved inequality is the end of one cycle.
Vertical Translations y = f(x) + d is a vertical shift of the graph of y = f(x). If d > 0, then the graph is shifted up from the original graph. If d < 0, then the graph is shifted down from the original graph. Example 1 Find the amplitude, x-axis reflection, period, phase shift, and vertical
translation of the graph of the following function:
2
1
2cos3 xy
The phase shift of y = a sin (bx + c) + d or y = a cos (bx + c) + d is found by setting bx + c = 0 and solving for x.
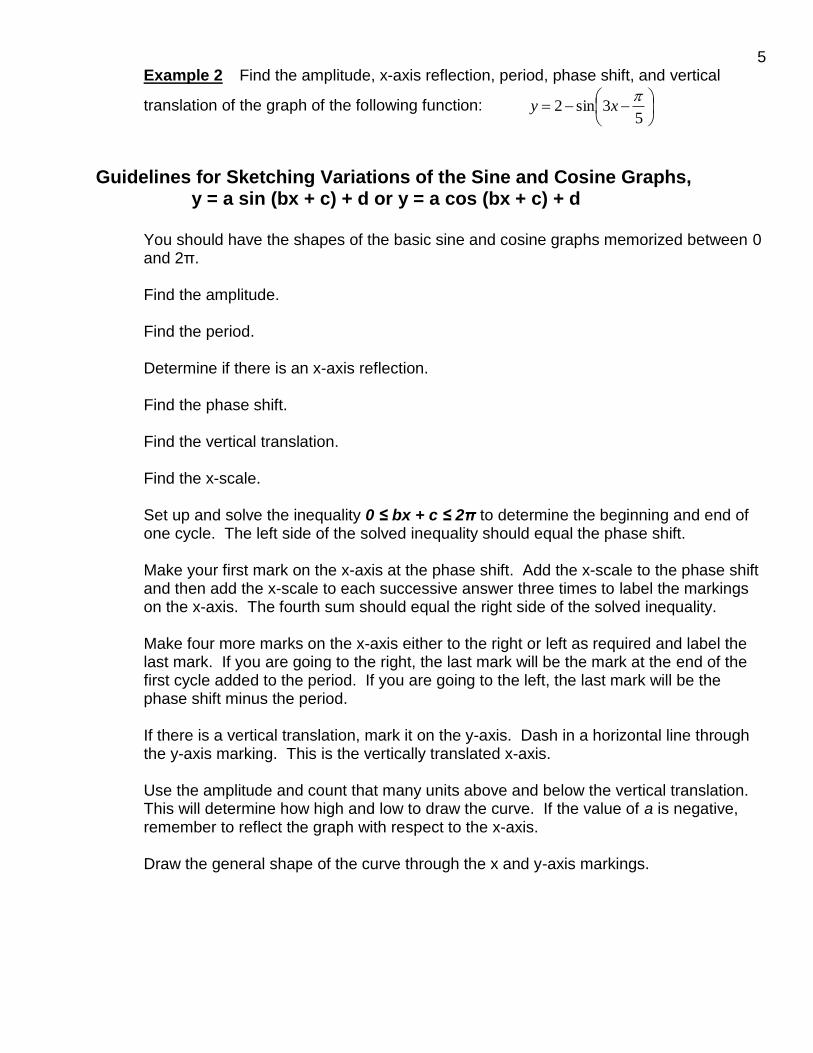
5 Example 2 Find the amplitude, x-axis reflection, period, phase shift, and vertical
translation of the graph of the following function:
53sin2
xy
Guidelines for Sketching Variations of the Sine and Cosine Graphs, y = a sin (bx + c) + d or y = a cos (bx + c) + d You should have the shapes of the basic sine and cosine graphs memorized between 0 and 2π. Find the amplitude. Find the period. Determine if there is an x-axis reflection. Find the phase shift. Find the vertical translation. Find the x-scale. Set up and solve the inequality 0 ≤ bx + c ≤ 2π to determine the beginning and end of one cycle. The left side of the solved inequality should equal the phase shift. Make your first mark on the x-axis at the phase shift. Add the x-scale to the phase shift and then add the x-scale to each successive answer three times to label the markings on the x-axis. The fourth sum should equal the right side of the solved inequality.
Make four more marks on the x-axis either to the right or left as required and label the last mark. If you are going to the right, the last mark will be the mark at the end of the first cycle added to the period. If you are going to the left, the last mark will be the phase shift minus the period.
If there is a vertical translation, mark it on the y-axis. Dash in a horizontal line through the y-axis marking. This is the vertically translated x-axis. Use the amplitude and count that many units above and below the vertical translation. This will determine how high and low to draw the curve. If the value of a is negative, remember to reflect the graph with respect to the x-axis. Draw the general shape of the curve through the x and y-axis markings.

6
Example 3 Sketch two full periods of the graph of
4sin3
xy . State the
amplitude, x-axis reflection, period, phase shift, vertical translation, and five key points. Example 4 Sketch two full periods of the graph of )4cos(21 xy . State the
amplitude, x-axis reflection, period, phase shift, vertical translation, and five key points.
7
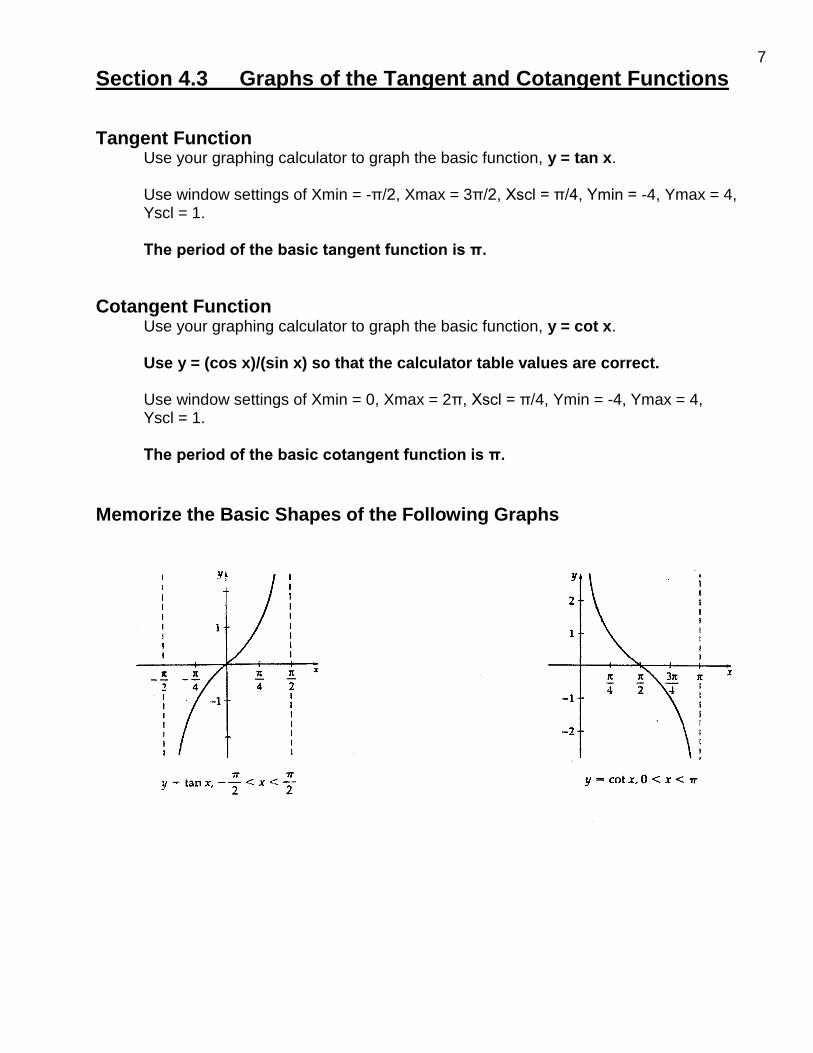
Section 4.3 Graphs of the Tangent and Cotangent Functions
Tangent Function Use your graphing calculator to graph the basic function, y = tan x. Use window settings of Xmin = -π/2, Xmax = 3π/2, Xscl = π/4, Ymin = -4, Ymax = 4, Yscl = 1. The period of the basic tangent function is π.
Cotangent Function Use your graphing calculator to graph the basic function, y = cot x. Use y = (cos x)/(sin x) so that the calculator table values are correct. Use window settings of Xmin = 0, Xmax = 2π, Xscl = π/4, Ymin = -4, Ymax = 4, Yscl = 1. The period of the basic cotangent function is π.
Memorize the Basic Shapes of the Following Graphs

8
Guidelines for Sketching Graphs of Tangent and Cotangent Functions, y = a tan (bx + c) + d or y = a cot (bx + c) + d Find the x-scale by dividing the period by 4.
Tangent Function: Bound the expression inside the tangent function between
2
and
2
and solve for x. This gives the beginning and the end of one cycle.
Cotangent Function: Bound the expression inside the cotangent function between 0 and π and solve for x. This gives the beginning and the end of one cycle. Add the x-scale to the beginning of the cycle and then add the x-scale to each successive answer three times to determine the markings on the x-axis. The fourth sum should equal the end of the first cycle. Find the end of the second cycle by adding the period to the end of the first cycle. The vertical asymptotes of both functions are found at the endpoints of each cycle. If there is a vertical translation, mark it on the y-axis and draw a dashed horizontal line through the marking to denote the translated x-axis. The midpoint between two consecutive vertical asymptotes is an x-intercept. The absolute value of “a” will determine the marking on the y-axis. If there is a vertical translation, count up and down from the translated x-axis. If a < 0, the graph is reflected with respect to the x-axis. Plot three points between each asymptote. Set bx + c = 0 to find the phase shift. Warning: The phase shift of the tangent function will not necessarily equal the beginning of the first cycle.
Example 1 Sketch two full periods of the graph of xy 3tan . State the period,
x-axis reflection, phase shift, vertical translation, left asymptote, right asymptote, left key point, middle key point, and right key point.
Find the period of the graph by using the formula
b.
9
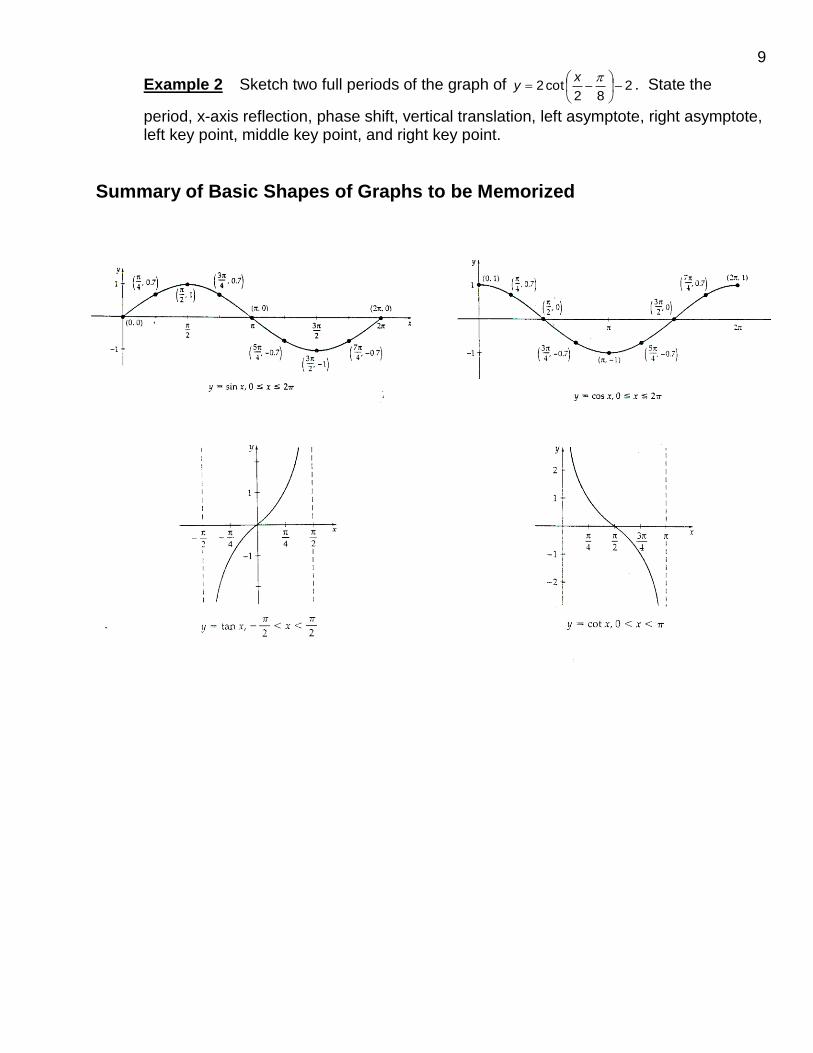
Example 2 Sketch two full periods of the graph of 282
cot2
x
y . State the
period, x-axis reflection, phase shift, vertical translation, left asymptote, right asymptote, left key point, middle key point, and right key point.
Summary of Basic Shapes of Graphs to be Memorized
10
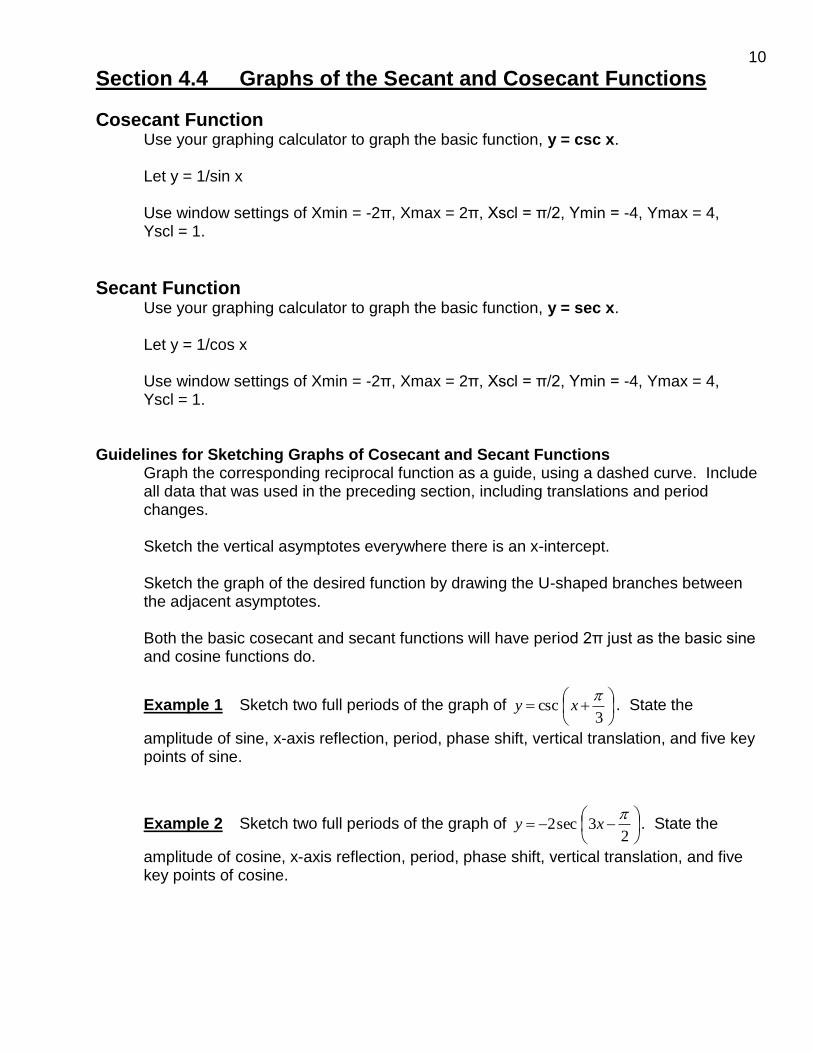
Section 4.4 Graphs of the Secant and Cosecant Functions
Cosecant Function Use your graphing calculator to graph the basic function, y = csc x. Let y = 1/sin x Use window settings of Xmin = -2π, Xmax = 2π, Xscl = π/2, Ymin = -4, Ymax = 4, Yscl = 1.
Secant Function Use your graphing calculator to graph the basic function, y = sec x. Let y = 1/cos x Use window settings of Xmin = -2π, Xmax = 2π, Xscl = π/2, Ymin = -4, Ymax = 4, Yscl = 1. Guidelines for Sketching Graphs of Cosecant and Secant Functions Graph the corresponding reciprocal function as a guide, using a dashed curve. Include all data that was used in the preceding section, including translations and period changes. Sketch the vertical asymptotes everywhere there is an x-intercept.
Sketch the graph of the desired function by drawing the U-shaped branches between the adjacent asymptotes.
Both the basic cosecant and secant functions will have period 2π just as the basic sine and cosine functions do.
Example 1 Sketch two full periods of the graph of
3csc
xy . State the
amplitude of sine, x-axis reflection, period, phase shift, vertical translation, and five key points of sine.
Example 2 Sketch two full periods of the graph of
23sec2
xy . State the
amplitude of cosine, x-axis reflection, period, phase shift, vertical translation, and five key points of cosine.
11
Section 4.5 Harmonic Motion
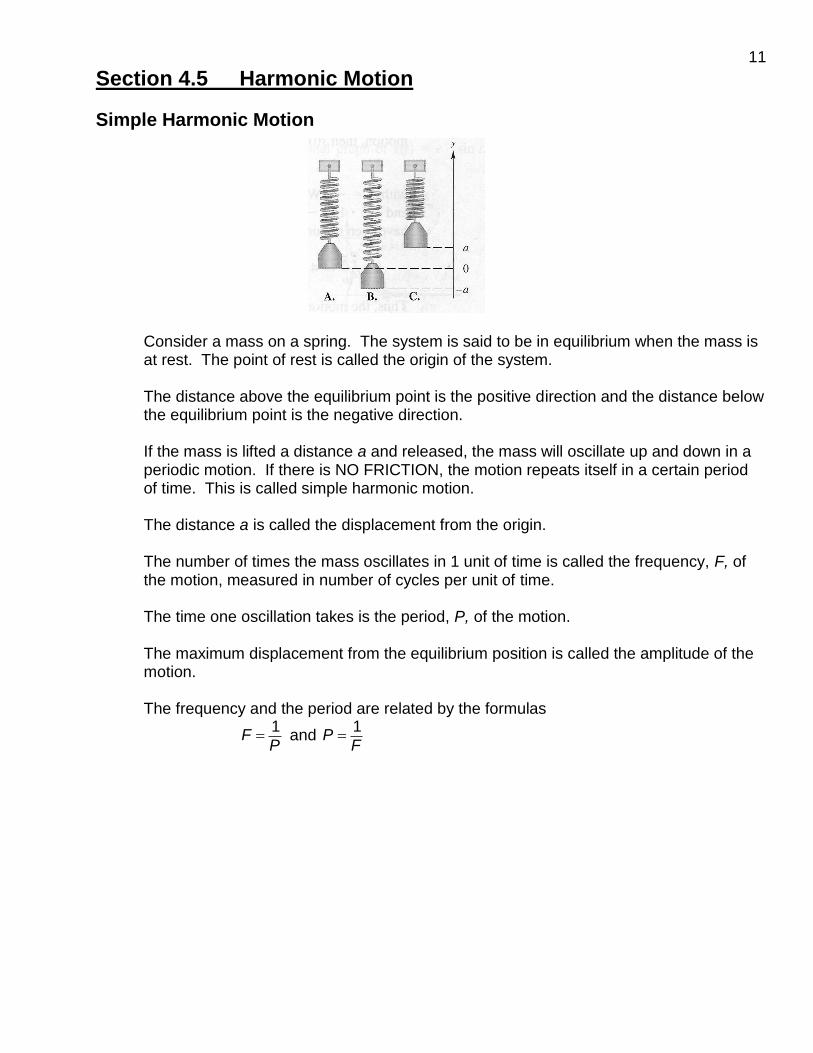
Simple Harmonic Motion Consider a mass on a spring. The system is said to be in equilibrium when the mass is at rest. The point of rest is called the origin of the system. The distance above the equilibrium point is the positive direction and the distance below the equilibrium point is the negative direction. If the mass is lifted a distance a and released, the mass will oscillate up and down in a periodic motion. If there is NO FRICTION, the motion repeats itself in a certain period of time. This is called simple harmonic motion. The distance a is called the displacement from the origin. The number of times the mass oscillates in 1 unit of time is called the frequency, F, of the motion, measured in number of cycles per unit of time. The time one oscillation takes is the period, P, of the motion. The maximum displacement from the equilibrium position is called the amplitude of the motion. The frequency and the period are related by the formulas
P
F1
and F
P1
12
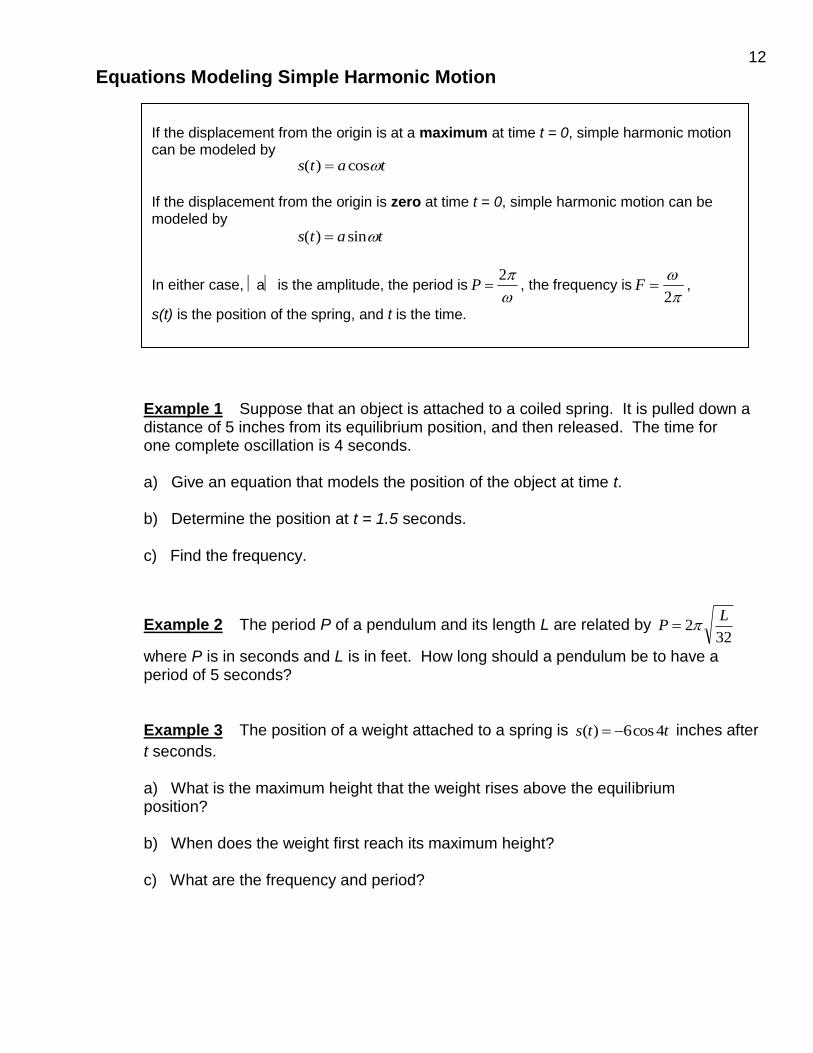
Equations Modeling Simple Harmonic Motion
Example 1 Suppose that an object is attached to a coiled spring. It is pulled down a distance of 5 inches from its equilibrium position, and then released. The time for one complete oscillation is 4 seconds.
a) Give an equation that models the position of the object at time t. b) Determine the position at t = 1.5 seconds. c) Find the frequency.
Example 2 The period P of a pendulum and its length L are related by 32
2L
P
where P is in seconds and L is in feet. How long should a pendulum be to have a period of 5 seconds?
Example 3 The position of a weight attached to a spring is tts 4cos6)( inches after
t seconds.
a) What is the maximum height that the weight rises above the equilibrium position? b) When does the weight first reach its maximum height? c) What are the frequency and period?
If the displacement from the origin is at a maximum at time t = 0, simple harmonic motion can be modeled by s t a t( ) cos
If the displacement from the origin is zero at time t = 0, simple harmonic motion can be modeled by
s t a t( ) sin
In either case, a is the amplitude, the period is P 2
, the frequency is F
2,
s(t) is the position of the spring, and t is the time.