Section 3 Japanese economic development and the future ... · (1) Balance of payments and stages of...
24
-88- Section 3 Japanese economic development and the future balance of payments 【Key points 】 1. Stages of economic development and the international balance of payments Looking back historically at national economic development and changes in the international balance of payments structure, countries usually pass through certain stages of development. Beginning as immature debtors, they become mature debtors, move on to debt repayment, become immature creditors and then mature creditors, and finally reach credit disposition status. Japan’s international balance of payments structure too has evolved in line with this development theory. The current dwindling of Japan’s surplus on goods and services even as the surplus on income and external net assets expand suggests that Japan is following the United States and the United Kingdom in shifting to mature creditor status. 2. Medium- to long-term current account prospects and issues facing Japan If Japan is in the process of becoming a mature creditor nation, any immediate reduction of the current account surplus should not be a cause for concern. However, maintaining economic dynamism is important even for a mature creditor nation, and Japan will need to maintain its export competitiveness, grow the service industry, and stimulate the domestic and external investment activities of Japanese companies. Further, it will be difficult to ensure stable capital inflows if Japan is unable to maintain its international credibility and standing by revitalizing the economy and bolstering international competitiveness. First of all, it will be important to continue creating internationally competitive exports. Japan’s exports have continued to grow over the years even as the exports themselves have changed, with Japanese industry not only constantly producing exports in new areas but also finding overseas markets for general products. Secondly, new service industries with international competitiveness too will need to be created and fostered. Thirdly, ongoing stable income revenues will require the sound operation of external assets and active investment activities based on a solid grasp of changes in the profit structures of the world’s industries and their profit rates. Fourthly, domestic systemic reform must be pursued to create an investment environment which will attract not only foreign but also domestic companies. As described above, Japan will have to constantly develop new sources of revenue, provision of the necessary environment for which will mean advancing economic structural reform and promoting innovation across the economy as a whole.
Transcript of Section 3 Japanese economic development and the future ... · (1) Balance of payments and stages of...

-88-
Section 3 Japanese economic development and the future balance of payments
【Key points】
1. Stages of economic development and the international balance of payments
Looking back historically at national economic development and changes in the
international balance of payments structure, countries usually pass through certain stages of
development. Beginning as immature debtors, they become mature debtors, move on to debt
repayment, become immature creditors and then mature creditors, and finally reach credit
disposition status.
Japan’s international balance of payments structure too has evolved in line with this
development theory. The current dwindling of Japan’s surplus on goods and services even as the
surplus on income and external net assets expand suggests that Japan is following the United
States and the United Kingdom in shifting to mature creditor status.
2. Medium- to long-term current account prospects and issues facing Japan
If Japan is in the process of becoming a mature creditor nation, any immediate reduction of
the current account surplus should not be a cause for concern. However, maintaining economic
dynamism is important even for a mature creditor nation, and Japan will need to maintain its
export competitiveness, grow the service industry, and stimulate the domestic and external
investment activities of Japanese companies. Further, it will be difficult to ensure stable capital
inflows if Japan is unable to maintain its international credibility and standing by revitalizing
the economy and bolstering international competitiveness.
First of all, it will be important to continue creating internationally competitive exports.
Japan’s exports have continued to grow over the years even as the exports themselves have
changed, with Japanese industry not only constantly producing exports in new areas but also
finding overseas markets for general products.
Secondly, new service industries with international competitiveness too will need to be
created and fostered.
Thirdly, ongoing stable income revenues will require the sound operation of external assets
and active investment activities based on a solid grasp of changes in the profit structures of the
world’s industries and their profit rates.
Fourthly, domestic systemic reform must be pursued to create an investment environment
which will attract not only foreign but also domestic companies.
As described above, Japan will have to constantly develop new sources of revenue,
provision of the necessary environment for which will mean advancing economic structural
reform and promoting innovation across the economy as a whole.

-89-
1. Stages of economic development and the balance of payments
(1) Balance of payments and stages of economic development theory
Japan’s current account balance and trade balance have recorded surpluses since the 1960s,
remaining at the relatively high level of 2-4 percent of GDP since the 1980s. Looking to other
countries, the Netherlands and Switzerland have also sustained large current account and trade
surpluses, while the United States, formerly the world’s largest creditor nation, began to
experience a current account deficit as of the 1980s and is now the world’s largest debtor nation.
The United Kingdom too ran a current account surplus of more than five percent of GNP from
the 19th century into the early 20th century, but has subsequently seen its current account balance
alternate between surplus and deficit.
One approach to national economic development and changes in the balance of payments
structure is the balance of payments development stage theory. This theory focuses on the
changes in a country’s IS balance which occur in the course of economic development,
explaining changes in the balance of payments structure from a long-term perspective in
combination with the asset accumulation process.
Crowther1 uses two main criteria in classifying countries’ balance of payments structures,
namely whether they are creditor nations (positive income balance) or debtor nations (negative
income balance), and whether they are capital importers (positive capital balance) or capital
exporters (negative capital account balance). He then divides balance of payments development
into six stages2 (Fig. 2.3.1). Figure 2.3.2 shows balance of payments structures around the world
in the late 1990s. When the main powers are classified according to the above theory, the results
are as follows.
(a) Young debtor nation
At this stage, the lack of economic development and inadequate domestic savings force a
country to depend on the offshore procurement of goods and capital. Imports outweigh exports
and interest payments are met by further borrowing, resulting in goods and services and balance
on income (or investment income) deficits, while the capital and financial balance runs a surplus,
positioning the country as a capital importer. Mexico and other Latin American nations are
currently in this situation.
1 Crowther (1957)2 However, Crowther himself regards this development as to some extent cyclical, and countries donot simply cease economic development once they reach the sixth stage.

-90-
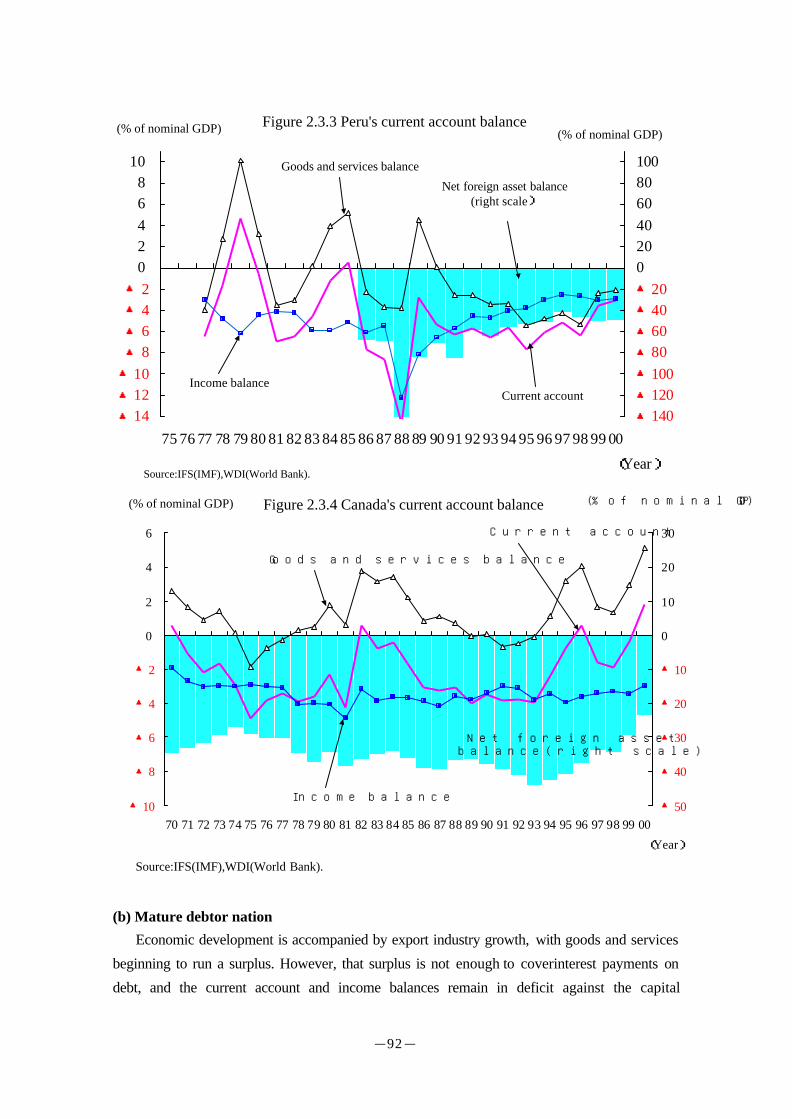
Mexico, Brazil, Argentina, Chile, Peru (Fig. 2.3.3) and other Latin American countries
engaged in swift industrialization in the 1970s based on expanded fiscal spending, procuring
capital from abroad in the form of loans from developed countries to cover fiscal shortfalls.
However, in the 1980s, high interest rates on the US dollar and plummeting prices for primary
goods caused Latin American exports to stall and made it difficult to repay claims. The 1982
Mexican crisis pushed claim payments into arrears, temporarily braking the supply of new
capital to debtor nations. Consequently, the Latin American nations prioritized balancing
current accounts about all other policy goals, and as trade-restricting measures brought down
Figure 2.3.1 Image of international balance of payments development stage theory
I. Immature II. Mature III. Debt IV. Immature V. Mature VI. Creditdebtor nation debtor nationrepayment nation creditor nation creditor nationdisposition nation
Surplus
+ ++ +- - -
Deficit
Surplus
+ ++ +- - -
Deficit
Surplus
+ ++ +- - -
Deficit
Surplus
+ ++ +- - -
Deficit
Surplus
+ + +- -- -
Deficit
Note: “+” denotes a surplus, “-“ a deficit. Source: Bank of Japan (2001).
Balance on goodsand services
Balance on income(Balance on investment income)
Current account 0
External net assets
Capital and financial account
0
0
0
0

-91-
imports, current accounts also started to balance out. However, these measures came at great
cost, depressing domestic investment levels and impeding economic growth. Capital inflows
later resumed, and the capital surpluses achieved by the Latin American countries since the
1990s have held at 2-5 percent of GDP.
Figure 2.3.2 Balance of payments structures and development stages in the late 1990sAgainst nominal GDP (%)
Stage ofdevelopment
Currentaccount
Balance ongoods andservices
Balance onincome
External netassets
Capital andfinancialaccount
Austria Ⅰ ▲2.5 ▲0.9 ▲0.8 ▲16.5 2.5Spain Ⅰ ▲1.0 ▲0.2 ▲1.3 ▲19.6 2.0Portugal Ⅰ ▲7.3 ▲9.6 ▲1.3 ▲21.8 8.3Peru Ⅰ ▲4.8 ▲3.8 ▲2.8 ▲47.7 4.3Chile Ⅰ ▲3.5 ▲0.9 ▲3.3 ▲22.9 4.7Argentina Ⅰ ▲3.8 ▲1.5 ▲2.4 4.3Brazil Ⅰ ▲3.7 ▲1.6 ▲2.3 3.8Mexico Ⅰ ▲2.5 ▲0.8 ▲3.0 2.1
Australia Ⅰ ▲4.3 ▲1.1 ▲3.2 ▲51.9 4.3New Zealand Ⅱ ▲6.2 0.1 ▲6.9 ▲83.0 5.5Canada Ⅱ ▲0.3 2.9 ▲3.3 ▲31.9 ▲0.1Denmark Ⅲ 0.9 3.7 ▲2.1 ▲21.1 ▲0.0Norway Ⅲ 5.1 8.0 ▲1.0 ▲3.8Sweden Ⅲ 2.5 6.0 ▲2.1 ▲35.8 ▲0.8Finland Ⅲ 5.6 8.1 ▲2.1 ▲95.6 ▲4.1ROK Ⅲ 3.2 3.7 ▲1.0 ▲2.3Malaysia Ⅲ 4.7 12.3 ▲5.6 ▲4.7Thailand Ⅲ 4.1 5.8 ▲2.1 ▲40.8 ▲1.6Italy Ⅲ 1.5 3.1 ▲1.1 0.9 ▲0.5Japan Ⅳ 2.4 1.3 1.3 22.9 ▲2.6Netherlands Ⅳ 5.1 6.1 0.7 ▲0.8 ▲2.3
France Ⅳ 2.2 2.7 0.6 10.4 ▲2.4Singapore Ⅳ 21.4 16.7 6.1 ▲22.1Switzerland Ⅴ 7.8 4.8 7.1 126.8 ▲10.4UK Ⅵ→Ⅰ ▲0.4 ▲1.0 1.1 ▲10.6 0.4US Ⅵ→Ⅰ ▲2.8 ▲2.2 ▲0.0 ▲15.0 3.2
Note: Average values 1996-2000.Sources: IFS (IMF), WDI (World Bank).
-92-
(b) Mature debtor nation
Economic development is accompanied by export industry growth, with goods and services
beginning to run a surplus. However, that surplus is not enough to coverinterest payments on
debt, and the current account and income balances remain in deficit against the capital
Figure 2.3.3 Peru's current account balance
▲14▲12▲10▲8▲6▲4▲2
02468
10
75 76 77 78 79 80 81 82 83 84 85 86 87 88 89 90 91 92 93 94 95 96 97 98 99 00
(Year)
(% of nominal GDP)
▲140▲120▲100▲80▲60▲40▲20020406080100
Current account
Net foreign asset balance(right scale)
Source:IFS(IMF),WDI(World Bank).
Goods and services balance
Income balance
(% of nominal GDP)
Figure 2.3.4 Canada's current account balance
▲10
▲8
▲6
▲4
▲2
0
2
4
6
70 71 72 73 74 75 76 77 78 79 80 81 82 83 84 85 86 87 88 89 90 91 92 93 94 95 96 97 98 99 00
(Year)
(% of nominal GDP)
▲50
▲40
▲30
▲20
▲10
0
10
20
30Current account
Net foreign assetbalance(right scale)
Goods and services balance
Income balance
(% of nominal GDP)
Source:IFS(IMF),WDI(World Bank).

-93-
accountsurplus. Canada and New Zealand, as well as Malaysia, Thailand and other East Asian
nations, fall within this category.
(Canada, New Zealand)
These countries have run long-term current account deficits, but have no difficulty procuring
international capital and have achieved comparatively stable economic growth due to abundant
inward investment, particularly securities investment, and the high level of inward investment
against GDP. Canada in particular (Fig. 2.3.4) receives the bulk of its investment from the
United States and the United Kingdom, and uses this stable capital inflow to maintain economic
growth.
(East Asia)
South Korea, Malaysia, Thailand and other East Asian nations initially depended on imports
of the goods and capital necessary for economic development, sustaining goods and services
and current account deficits and a capital and financial surplus. Subsequently, after a certain
amount of development had been achieved, changes began to occur in the balance of payments
structure. These countries became goods exporters, and began to record goods and services and
current account surpluses as capital exporters. South Korea (Fig. 2.3.5) and Thailand have seen
reduced income deficits in recent years due to diminishing net foreign debts.
Figure 2.3.5 South Korea's current account balance
▲10
▲8
▲6
▲4
▲2
0
2
4
6
8
10
12
14
75 76 77 78 79 80 81 82 83 84 85 86 87 88 89 90 91 92 93 94 95 96 97 98 99 00(Year)
(% of nominal GDP)
Current accountGoods and services balanceIncome balance
Net foreign asset balance(right scale)
Source:IFS(IMF),WDI(World Bank).
-94-
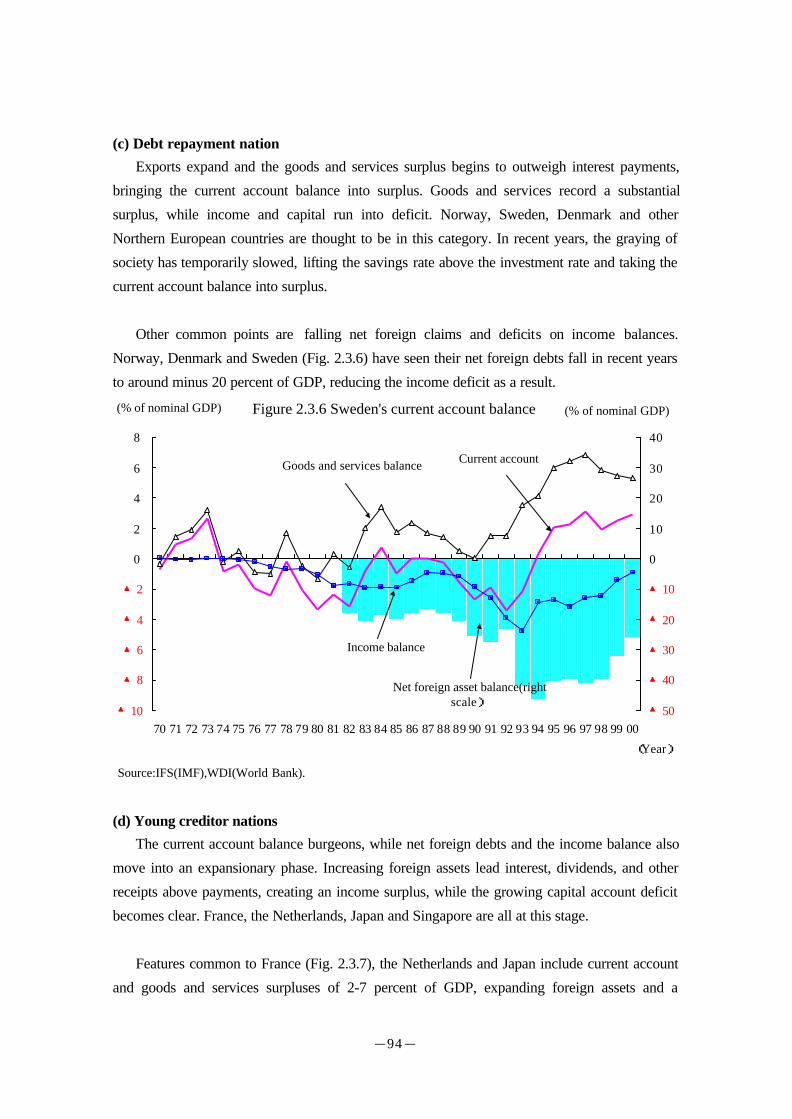
(c) Debt repayment nation
Exports expand and the goods and services surplus begins to outweigh interest payments,
bringing the current account balance into surplus. Goods and services record a substantial
surplus, while income and capital run into deficit. Norway, Sweden, Denmark and other
Northern European countries are thought to be in this category. In recent years, the graying of
society has temporarily slowed, lifting the savings rate above the investment rate and taking the
current account balance into surplus.
Other common points are falling net foreign claims and deficits on income balances.
Norway, Denmark and Sweden (Fig. 2.3.6) have seen their net foreign debts fall in recent years
to around minus 20 percent of GDP, reducing the income deficit as a result.
(d) Young creditor nations
The current account balance burgeons, while net foreign debts and the income balance also
move into an expansionary phase. Increasing foreign assets lead interest, dividends, and other
receipts above payments, creating an income surplus, while the growing capital account deficit
becomes clear. France, the Netherlands, Japan and Singapore are all at this stage.
Features common to France (Fig. 2.3.7), the Netherlands and Japan include current account
and goods and services surpluses of 2-7 percent of GDP, expanding foreign assets and a
Figure 2.3.6 Sweden's current account balance
▲10
▲8
▲6
▲4
▲2
0
2
4
6
8
70 71 72 73 74 75 76 77 78 79 80 81 82 83 84 85 86 87 88 89 90 91 92 93 94 95 96 97 98 99 00
(Year)
(% of nominal GDP)
▲50
▲40
▲30
▲20
▲10
0
10
20
30
40
Current account
Net foreign asset balance(rightscale)
Goods and services balance
Income balance
(% of nominal GDP)
Source:IFS(IMF),WDI(World Bank).

-95-
subsequent income surplus derived from these assets.
Singapore has been experiencing changes in its balance of payments structure in line with
the development stage theory for the last 30 years. In the early stages of economic development,
goods and capital were both imported, while now that Singapore has achieved a certain level of
development, it is instead exporting goods and capital, and has a growing foreign income
surplus.
(e) Mature creditor nations
Accumulated net foreign assets reach a major scale, with the income balance derived from
these expanding heavily as a result. The greater income balance pushes some income into
consumption, while the aging of society and higher wages lower international competitiveness,
creating a goods and services deficit.
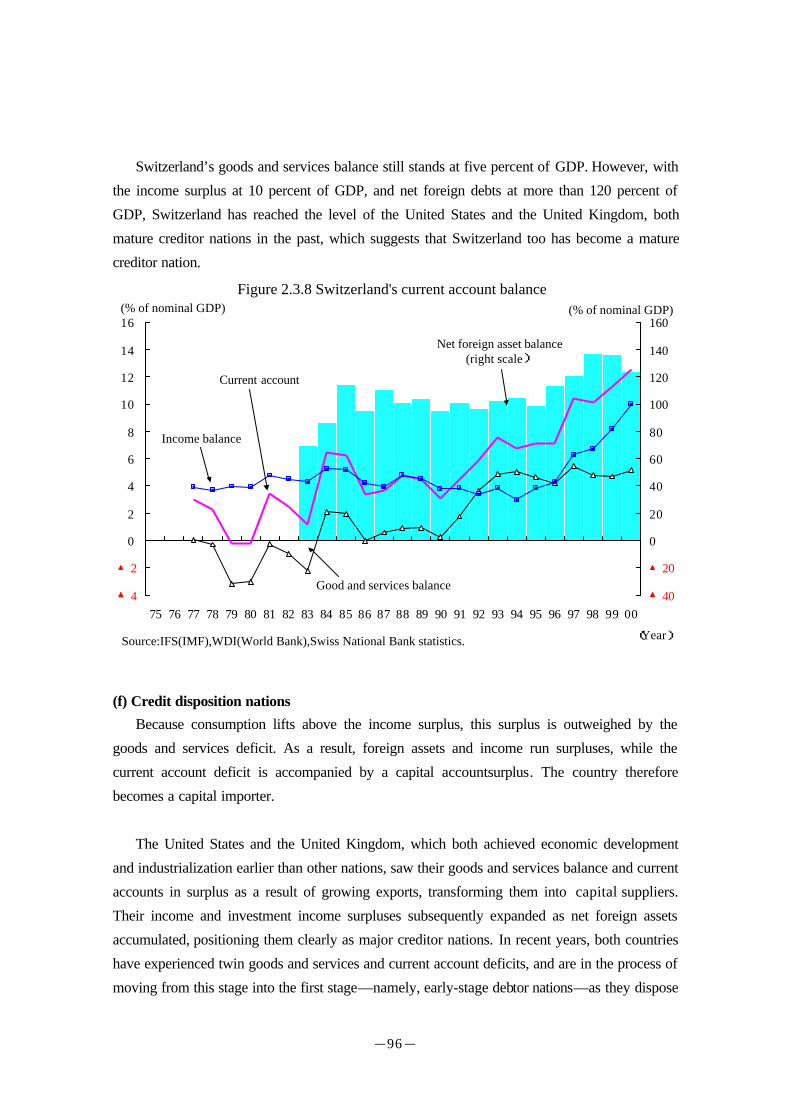
Switzerland has a goods and services surplus of five percent of GDP, and a substantial
income surplus of 10 percent of GDP, while the current account surplus is even greater still at
more than 10 percent of GDP. Net foreign assets far outweigh GDP, positioning Switzerland as
a net creditor. The net foreign debt balance has also recently shifted from a level on a par with
GDP to more than 120 percent, making Switzerland the second largest creditor nation in the
world after Japan (Fig. 2.3.8).
Figure 2.3.7 France's current account balance
▲4
▲3
▲2
▲1
0
1
2
3
75 76 77 78 79 80 81 82 83 84 85 86 87 88 89 90 91 92 93 94 95 96 97 98 99 00
(Year)
(% of nominal GDP)
▲40
▲30
▲20
▲10
0
10
20
30
Current account Net foreign asset balance(right scale)
Income balance
Goods and services balance
(% of nominal GDP)
Source:IFS(IMF),WDI(World Bank).
-96-
Switzerland’s goods and services balance still stands at five percent of GDP. However, with
the income surplus at 10 percent of GDP, and net foreign debts at more than 120 percent of
GDP, Switzerland has reached the level of the United States and the United Kingdom, both
mature creditor nations in the past, which suggests that Switzerland too has become a mature
creditor nation.
(f) Credit disposition nations
Because consumption lifts above the income surplus, this surplus is outweighed by the
goods and services deficit. As a result, foreign assets and income run surpluses, while the
current account deficit is accompanied by a capital accountsurplus. The country therefore
becomes a capital importer.
The United States and the United Kingdom, which both achieved economic development
and industrialization earlier than other nations, saw their goods and services balance and current
accounts in surplus as a result of growing exports, transforming them into capital suppliers.
Their income and investment income surpluses subsequently expanded as net foreign assets
accumulated, positioning them clearly as major creditor nations. In recent years, both countries
have experienced twin goods and services and current account deficits, and are in the process of
moving from this stage into the first stage—namely, early-stage debtor nations—as they dispose
Figure 2.3.8 Switzerland's current account balance
▲4
▲2
0
2
4
6
8
10
12
14
16
75 76 77 78 79 80 81 82 83 84 85 86 87 88 89 90 91 92 93 94 95 96 97 98 99 00
(Year)
(% of nominal GDP)
▲40
▲20
0
20
40
60
80
100
120
140
160
Current account
Net foreign asset balance(right scale)
Good and services balance
Income balance
Source:IFS(IMF),WDI(World Bank),Swiss National Bank statistics.
(% of nominal GDP)

-97-
of their foreign assets. At the same time, the international credibility of their domestic
economies and markets have enabled both countries to maintain stable capital inflows.
(United Kingdom)
The United Kingdom, which achieved economic development before any other nation,
already had a current account surplus by the early 19th century. The current account balance
steadily expanded against GDP, recording an average of four percent in the late 19th century.
The capital account, however, ran a deficit, identifying the United Kingdom as a capital supplier.
The net foreign assets accumulated accordingly outweighed GDP by the end of the 19th century,
and the investment income derived accordingly led to the gradual expansion of the current
account surplus. The United Kingdom became a creditor nation in the late 19th century, with its
net foreign assets growing to 140 percent of GDP by the early 20th century, while the investment
income derived from foreign investment also reached more than seven percent of GNP.
From around 1930 through to WWII, the United Kingdom became a capital importer, but in
the 1970s, soaring oil prices pushed the current account balance back into surplus, and net
foreign assets reached 20 percent of GDP, marking the United Kingdom again as a creditor
nation. The UK goods and services balance and current account balance subsequently fluctuated
heavily. The income balance remained in surplus, but foreign assets fell below foreign debts,
with the United Kingdom again becoming a net debtor nation.
(United States)
The United States was the next nation to achieve economic development, recording a
current account surplus and a capital account deficit by the end of the 19th century to become a
capital supplier. In the 1920s, foreign assets rose above foreign debts, taking investment income
into surplus. Following WWII, accumulated net foreign assets reached around 10 percent of
GNP, with the United States taking over from the United Kingdom as the world’s largest
creditor and capital supplier. From the 1970s through the 1980s, the investment income surplus
expanded, while net foreign assets also grew to more than 13 percent of GDP.
However, the current account balance dipped into deficit in the late 1970s, while the
expansionary fiscal policies of the late 1980s saw this deficit burgeon. In 1989, foreign assets
undercut foreign debts, and the United Sates became a debtor nation. The prolonged economic
boom of the 1990s encouraged a vigorous inflow of capital, and the current account deficit
reached US$444.7 billion in 2000 (minus 4.5 percent of GDP), while net foreign debts also
grew to minus 22 percent of GDP. Investment income and the income balance consequently fell

-98-
into deficit in 1999. Once the world’s largest creditor, the United States became the world’s
largest debtor.
(2) Development stage of Japan’s balance of payments
(a) Changes in Japan’s balance of payments structure
Japan’s balance of payments structure to date has evolved along the general lines of the
development stage theory. Figure 2.3.9 compares Japan’s balance of payments structure from
1986 to 1990, from 1991 to 1995, and from 1996 to 2000. In terms of trends, the current
account and trade surpluses have continued to shrink, while net foreign assets have grown, the
interest derived from these expanding the income surplus. Japan therefore seems to be evolving
into a mature creditor nation. Changes in Japan’s balance of payments structure and the
development stage of its balance of payments are examined below.
(b) Trends in the current account, balance on goods and services, and capital account
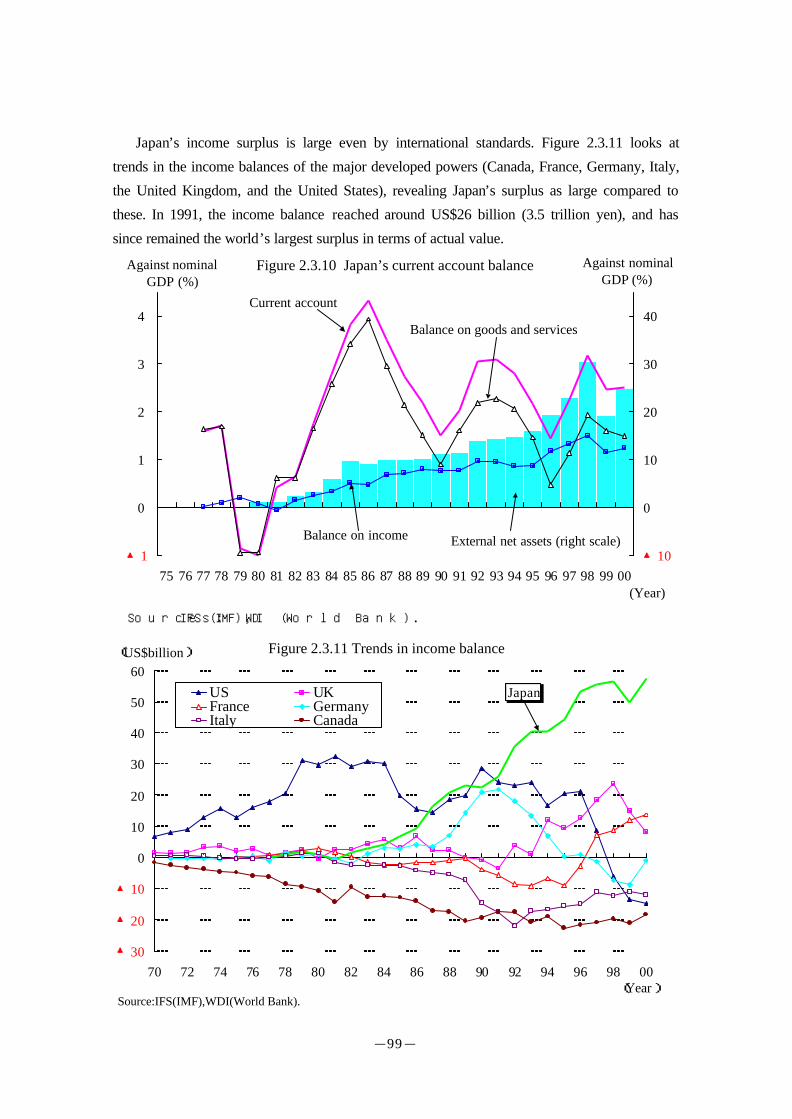
Japan’s current account surplus expanded steadily as of the late 1960s, with the exception of
the period following the two oil shocks in the 1970s, reaching 4.2 percent of GDP in 1986 (Fig.
2.3.10). However, since the late 1980s, the current account surplus has gradually shrunk,
although maintaining a level of more than two percent of GDP, slipping from an average of 2.8
percent of GDP in the late 1980s to 2.6 percent in the early 1990s and 2.4 percent in the late
1990s. The goods and services surplus also shrank, although holding a level of more than one
percent on GDP. The capital account deficit expanded, falling from an average of 2.1 percent on
GDP in the late 1980s to 2.6 percent in the late 1990s.
(c) Income balance trends
Japan’s income surplus has steadily risen to equal the goods and services surplus, the result
of the current account surplus which has accumulated since the late 1960s building up foreign
assets and gradually increasing the interest and dividend income deriving from these assets.
Figure 2.3.9 Changes in Japan’s balance of payments structureAgainst nominal GDP (%)
Period Currentaccount
Balance on goodsand services
Balance onincome
External netassets
Capital andfinancialaccount
86-90 2.8 2.3 0.7 10.1 ▲2.191-95 2.6 1.9 0.9 14.0 ▲2.596-00 2.4 1.3 1.3 22.9 ▲2.6
Note: Average values for each period.Sources: IFS (IMF), WDI (World Bank).
-99-
Japan’s income surplus is large even by international standards. Figure 2.3.11 looks at
trends in the income balances of the major developed powers (Canada, France, Germany, Italy,
the United Kingdom, and the United States), revealing Japan’s surplus as large compared to
these. In 1991, the income balance reached around US$26 billion (3.5 trillion yen), and has
since remained the world’s largest surplus in terms of actual value.
Figure 2.3.10 Japan’s current account balance
▲1
0
1
2
3
4
75 76 77 78 79 80 81 82 83 84 85 86 87 88 89 90 91 92 93 94 95 96 97 98 99 00(Year)
Against nominalGDP (%)
▲10
0
10
20
30
40Current account
External net assets (right scale)
Balance on goods and services
Balance on income
Sources: IFS (IMF), WDI (World Bank).
Against nominalGDP (%)
Figure 2.3.11 Trends in income balance
▲30
▲20
▲10
0
10
20
30
40
50
60
70 72 74 76 78 80 82 84 86 88 90 92 94 96 98 00(Year)
(US$billion)
US UKFrance GermanyItaly Canada
Source:IFS(IMF),WDI(World Bank).
Japan

-100-
The expansion of the income balance, or the investment income which comprises the bulk of
this, has proceeded as follows in other countries. Around 1990, the United Kingdom, which was
considered to be a mature creditor nation at the time, recorded an investment income surplus of
six percent of GDP, while the US investment income surplus in the 1970s and 1980s reached
three percent of GDP. Switzerland, which is now considered to have become a mature creditor
nation, has an income surplus of 10 percent of GDP.
By contrast, Japan’s current investment income and balance on income surpluses are both
around the one percent mark. Accordingly, while Japan’s surpluses in these areas may be high,
they have not reached the stage of maturity of the United Kingdom and the United States in the
past and Switzerland in the present.
(d) Accumulation of net foreign assets
Japan’s net foreign assets have expanded since the late 1980s, reaching 179 trillion yen at
the end of 2001, or 36 percent of GDP.
Figure 2.3.12 compares the net foreign assets of the major developed powers at the end of
2000, revealing Japan as the world’s greatest net creditor. Japan’s US$1.158 trillion stands out
even internationally at around four times the level of second-placed Switzerland with US$297
billion. In terms of GDP ratio, Japan follows Switzerland’s 124 percent at 25 percent.
Figure 2.3.12 External net assets at end of 2000
Country Actual value Against nominalGDP
(US$ billion) (%)Japan 1,158 25Switzerland 297 124Germany 69 4Belgium 61 25France 60 5Italy 44 4Iceland ▲5 ▲60Denmark ▲27 ▲17Austria ▲32 ▲17New Zealand ▲39 - Portugal ▲39 ▲38Netherlands ▲42 ▲11Greece ▲47 ▲42Sweden ▲59 ▲26Spain ▲114 ▲21Canada ▲162 ▲24Finland ▲181 ▲151UK ▲184 ▲13Australia ▲208 ▲53US ▲2,187 ▲22Source: IFS (IMF).

-101-
This tops 13 percent of GDP, which was the net foreign asset level of the United States
around 1980, when it was a mature creditor nation. However, the percentage of GNP and GDP
did not cross the 100 percent mark, as was the case in the United Kingdom at the end of the 19th
century through into the 20th century and with Switzerland today.
(e) Japan in transition to mature creditor status
To summarize, Japan is currently sustaining the level of its current account surplus while the
balance on goods and services shrinks and the income surplus and net foreign assets expand,
suggesting that Japan is in the process of transition to mature creditor status. However, while the
income surplus may be expanding, it has not reached the level of Switzerland today or the US
and the UK in the past, suggesting that Japan’s sources of income revenue are insufficient for its
economic scale. Japan’s accumulated net foreign assets top past US levels, but are not as high as
those of the UK in the past or of Switzerland today. Further, while the goods and services
balance is decreasing, it is still sustaining a surplus.
The balance of payments development stage theory would therefore suggest that Japan has
not completely reached the level of a mature creditor nation but is in the process of transition to
that status. Whether Japan’s income surplus and net foreign assets continue to expand and Japan
reaches mature creditor nation status will depend on future developments in balance of
payments and the domestic economy.
2. Medium- to long-term current account forecast and challenges for Japan
(1) Savings and investment forecasts
(a) Savings trends
If the Japanese economy revives and government finance and the social security system are
placed on a sustainable basis, reducing future uncertainties, the savings rate should fall again.
According to the lifestyle hypothesis 3, whereby the elderly draw on the assets which they
accumulated during their working lives, the aging of society should increase the ratio of
unemployed elderly with relatively low savings rates, reducing the savings rate of the country as
a whole.
Looking at the household savings rate in terms of age brackets, the elderly employed have
higher savings rates than the young, but the savings rates of the unemployed are below zero,
suggesting that the unemployed are already drawing on their savings to live. The aging of
society is proceeding at a much faster pace than in other developed countries, and given that

-102-
unemployed households at least will have already eaten into their savings, the graying of society
seems likely to reduce the savings rate over the medium- to long-term.
However, the savings rates of the elderly employed are actually rising in employed
households. In terms of forecasting the savings rate, therefore, the possibility must also be
considered of higher employment rates for the elderly and women in future.
(b) Investment trends
If the economy recovers, investment too may revive from its currently sluggish levels, but if
the population decline relieves the need for economic expansion and increased investment,
investment could conversely start to fall away. The rise in the capital equipment ratio per
worker in postwar Japan was one of the major factors behind Japan’s high economic growth.
However, Japan’s capital coefficient (productivity reciprocal) has gradually risen, and currently
tops that of the US (Fig. 2.3.13). A rising capital equipment ratio pushes down the return on
capital rate as a capital surplus emerges, and in fact Japan’s capital income rate has been
gradually falling since the 1990s (Fig. 2.3.14). Future investment trends will depend in the
short-term on progress with working out excess capital and improving the income rate, in the
long-term on the impact of factors such as population decline.
3 The lifestyle hypothesis assumes that the employed are not elderly.
Figure 2.3.13 Trends in Japan's capital coefficient
0.0
0.5
1.0
1.5
2.0
2.5
70 72 74 76 78 80 82 84 86 88 90 92 94 96 98 00(Year)
Capital stock/real GDP
Japan
US
Note:Private company stock/GDP for Japan, non-residential private company stock/GDP for the US.Source:National Statistics(Cabinet Office),SCB(US Department of Commerce).

-103-
(2) Current account prospects and stimulation of investment and the economy
As a result, all other conditions being equal, if the extent of the drop in the investment rate is
less than the drop in the savings rate, the current account surplus will diminish4, but if Japan can
maintain the international credibility of the domestic economy and secure a stable capital inflow,
this is not a cause for concern. On the other hand, if the investment rate falls below the savings
rate, the current account surplus itself will expand, but Japan will become a country lacking in
domestic investment opportunities and, consequently, dynamism. While the direction of the
current account balance will therefore be determined by trends in savings and investment, any
immediate decline in the current account should not be regarded as problematic given that Japan
is currently in the process of transition to mature creditor status. However, even where Japan
becomes a mature creditor nation, it will be important to sustain Japan’s economic dynamism,
and sustaining international competitiveness, developing the service industry and stimulating
domestic and foreign investment by Japanese companies will all be critical issues. If economic
dynamism and international competitiveness cannot be boosted to maintain Japan’s
international credibility and standing, it will be difficult to realize a smooth capital inflow.
4 The view has been expressed that because the drop in the investment rate has not been as extensiveas the decline in the savings rate, the decline in Japan’s current account surplus will be moderate(Horioka (1994), etc.)
Figure 2.3.14 Trends in capital income ratio
0.00
0.05
0.10
0.15
0.20
0.25
0.30
70 72 74 76 78 80 82 84 86 88 90 92 94 96 98(Year)
Operatingsurplus/capital
stock
Note:Operating surplus adjusted on to a real base using GDP deflator.Source:National Accounts,Capital Stock of Private Enterprises(Cabinet Office).
All industries
Non-manufacturing
Manufacturing

-104-
Accordingly, it remains vital to secure international sources of income by (1) ensuring that
Japan’s exports are internationally competitive; (2) fostering an internationally competitive
service industry; (3) ensuring sound foreign asset management; and (4) developing an attractive
environment for inward investment.
(a) Fostering internationally competitive export industries
Where accompanied by stimulation of the domestic economy and expanded inward
investment, a declining current account surplus would in fact become preferable . However, if
Japan found itself nursing a large current account deficit, unless capital and labor inflows were
as vigorous and sustained as in the United States and Canada, it could become difficult to
sustain that deficit over the long term, given that it represents a debt which must be repaid in
future. In that sense, Japan needs competitive industries.
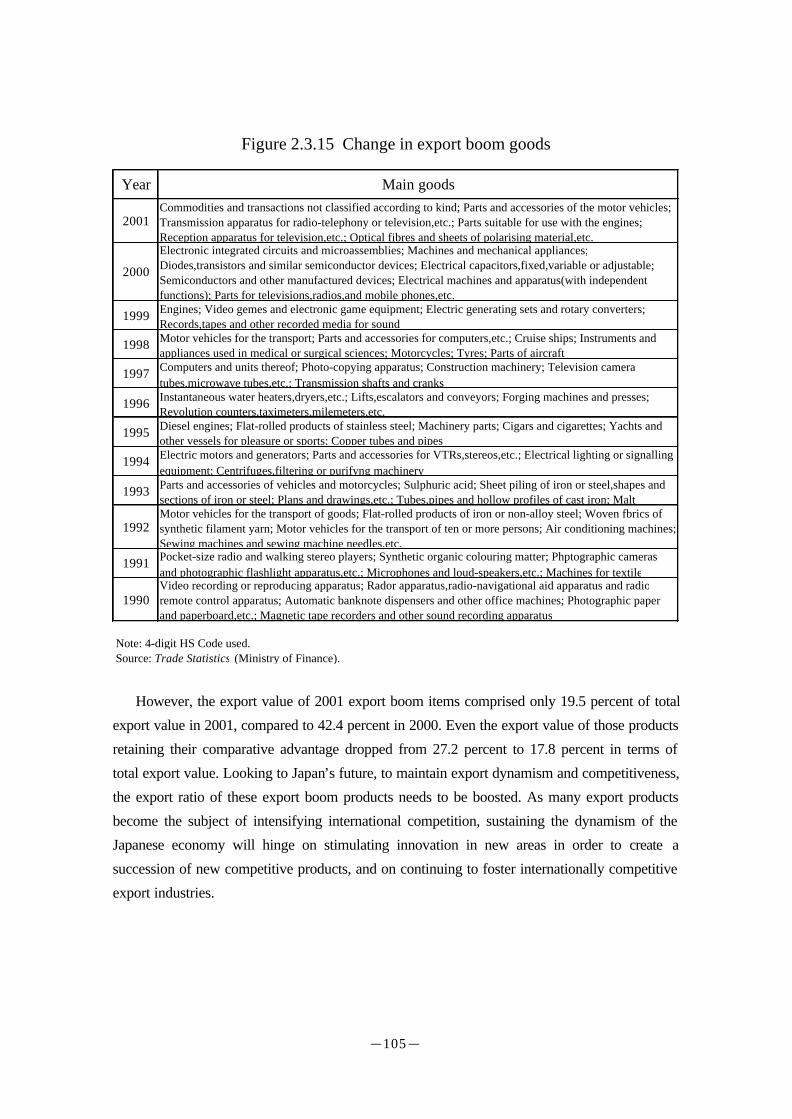
(Evolution of export boom products and creation of new boom products)
Figure 2.3.15 maps the evolution of Japan’s main export boom products5 since the 1990s.
Japan’s total export value generally increased through the 1990s, but the composition of export
goods changed. As the manufacturing industry moved offshore, exports of general-use goods
which were technically easy to manufacture or assemble peaked out, while new products and
parts have continued to emerge and sustain a high rate of growth. The successive emergence of
internationally competitive products has underpinned the overall growth of Japanese exports.
Figure 2.3.16 reveals trends in the export values of main export boom products in 2001 and
2000. Many of these products, which sustained strong growth until quite recently, related to
leading-edge technology and were produced in Japan. They were also capital-intensive products,
with the labor cost factor having little effect on competitiveness.
(Maintaining international competitiveness and fostering export industries)
Japan’s exports fell in 2001, and many of the export products which have recently powered
Japan’s exports saw their export value drop compared to 2000. However, it should be noted that
even in 2001, when the export environment was suffering as a result of the world economic
slowdown, there were still some export goods which boosted their export value. Many of those
products, moreover, retained a comparative advantage even in terms of their trade specialization
coefficient.
5 Here, “export boom products” indicates those which have recorded the highest export values in thevarious years up to 2001.
-105-
However, the export value of 2001 export boom items comprised only 19.5 percent of total
export value in 2001, compared to 42.4 percent in 2000. Even the export value of those products
retaining their comparative advantage dropped from 27.2 percent to 17.8 percent in terms of
total export value. Looking to Japan’s future, to maintain export dynamism and competitiveness,
the export ratio of these export boom products needs to be boosted. As many export products
become the subject of intensifying international competition, sustaining the dynamism of the
Japanese economy will hinge on stimulating innovation in new areas in order to create a
succession of new competitive products, and on continuing to foster internationally competitive
export industries.
Figure 2.3.15 Change in export boom goods
Year Main goods
2001Commodities and transactions not classified according to kind; Parts and accessories of the motor vehicles;Transmission apparatus for radio-telephony or television,etc.; Parts suitable for use with the engines;Reception apparatus for television,etc.; Optical fibres and sheets of polarising material,etc.
2000
Electronic integrated circuits and microassemblies; Machines and mechanical appliances;Diodes,transistors and similar semiconductor devices; Electrical capacitors,fixed,variable or adjustable;Semiconductors and other manufactured devices; Electrical machines and apparatus(with independentfunctions); Parts for televisions,radios,and mobile phones,etc.
1999 Engines; Video gemes and electronic game equipment; Electric generating sets and rotary converters;Records,tapes and other recorded media for sound
1998 Motor vehicles for the transport; Parts and accessories for computers,etc.; Cruise ships; Instruments andappliances used in medical or surgical sciences; Motorcycles; Tyres; Parts of aircraft
1997 Computers and units thereof; Photo-copying apparatus; Construction machinery; Television cameratubes,microwave tubes,etc.; Transmission shafts and cranks
1996 Instantaneous water heaters,dryers,etc.; Lifts,escalators and conveyors; Forging machines and presses;Revolution counters,taximeters,milemeters,etc.
1995 Diesel engines; Flat-rolled products of stainless steel; Machinery parts; Cigars and cigarettes; Yachts andother vessels for pleasure or sports; Copper tubes and pipes
1994 Electric motors and generators; Parts and accessories for VTRs,stereos,etc.; Electrical lighting or signallingequipment; Centrifuges,filtering or purifyng machinery
1993 Parts and accessories of vehicles and motorcycles; Sulphuric acid; Sheet piling of iron or steel,shapes andsections of iron or steel; Plans and drawings,etc.; Tubes,pipes and hollow profiles of cast iron; Malt
1992Motor vehicles for the transport of goods; Flat-rolled products of iron or non-alloy steel; Woven fbrics ofsynthetic filament yarn; Motor vehicles for the transport of ten or more persons; Air conditioning machines;Sewing machines and sewing machine needles,etc.
1991 Pocket-size radio and walking stereo players; Synthetic organic colouring matter; Phptographic camerasand photographic flashlight apparatus,etc.; Microphones and loud-speakers,etc.; Machines for textile
1990Video recording or reproducing apparatus; Rador apparatus,radio-navigational aid apparatus and radioremote control apparatus; Automatic banknote dispensers and other office machines; Photographic paperand paperboard,etc.; Magnetic tape recorders and other sound recording apparatus
Note: 4-digit HS Code used. Source: Trade Statistics (Ministry of Finance).

-106-
(b) International competitiveness of service areas
Japan’s service account runs a heavy deficit, highlighting the urgency of securing a more
internationally competitive service industry. The trade specialization coefficients6 for the trade
in services of the major powers (Japan, the US, the UK, Italy, Canada, Germany and France)
show that where the US and the UK have positive coefficients in many areas, Japan’s
coefficients are negative (Fig. 2.3.17). While Japan’s coefficients have recently been rising in
areas such as information, telecommunications and finance, it would still be difficult to say that
6 (Export value – import value)/(export value + import value)
Figure 2.3.16 Recent main boom exports and export value
Item HS CodeValue of exports
(US$ 100 million)Trade specialization
coefficient2000 2001 2000 2001
Export total 516,542 489,792Items peaking in 2001
Total 86,821 95,496 Share of total 16.8% 19.5%Commodities and transactions not classified according to kind 0000 18,142 19,546 0.51 0.47Parts and accessories of the motor vehicles 8708 18,551 18,719 0.79 0.76Transmission apparatus for radio-telephony or television,etc. 8525 10,612 10,690 0.83 0.79Parts suitable for use with the engines 8409 5,127 5,349 0.84 0.84Reception apparatus for television,etc. 8528 3,586 3,918 0.30 0.25Optical fibres and sheets of polarising material,etc. 9001 2,826 3,174 0.48 0.43Insulated wire,cable and other insulated electric conductors 8544 2,571 2,796 0.07 0.06Measuring or checking instruments(excluding HS9030) 9031 2,034 2,176 0.14 0.12Cyclic hydrocarbons 2902 1,886 1,966 0.86 0.85Instruments and apparatus for physical analysis 9027 1,543 1,686 0.21 0.19Lenses,prisms,mirrors and other optical elements 9002 1,647 1,682 0.76 0.72Rice 1006 15 1,135 ▲0.90 0.65Apparatus based on use of X-rays or of alpha,etc. 9022 875 976 0.17 0.19Photographic plates and film in the flat 3701 926 968 0.56 0.70Refined copper,copper anodes for electrolytic refining 7403 628 859 0.20 0.44
Items peaking in 2000Total 143,770 117,914 Share of total 42.4% 34.7%Electronic integrated circuits and microassemblies 8542 32,619 26,755 0.26 0.22Machines and mechanical appliances 8479 12,527 8,937 0.77 0.67Diodes,transistors and similar semiconductor devices 8541 9,261 7,034 0.68 0.62Electrical capacitors,fixed,variable or adjustable 8532 5,679 4,094 0.85 0.77Electrical apparatus for swuiching or protecting electrical circuits 8536 5,515 4,723 0.50 0.46Semiconductors and other manufactured devices 9010 4,852 4,162 0.91 0.88Electrical machines and apparatus(with independent functions) 8543 4,671 3,612 0.20 0.18Parts for televisions,radios,and mobile phones,etc. 8529 4,354 4,062 0.42 0.23Electric accumulators(for mobile phones,cars,etc.) 8507 4,099 3,186 0.86 0.83Air or vacuum pumps,air or other gas compressors,etc. 8414 3,778 3,752 0.62 0.57Instruments and apparatus for measuring or checking electrical quantities 9030 3,715 2,238 0.58 0.32Liquid crystal devices,lasers and other optical appliances 9013 2,978 2,495 0.38 0.41Printed circuits 8534 2,961 2,354 0.65 0.53Flat-rolled products of iron or non-alloy steel 7208 2,815 2,640 0.51 0.62Ball ir roller bearings 8482 2,708 2,487 0.71 0.69
Note: 1. 4-digit HS Code used. Note: 2. Trade specialization coefficient=(export value-import value)/(export value+import value).Source: Trade Statistics (Ministry of Finance).

-107-
Japan’s service industry has secured international competitiveness. Elsewhere, however,
internationally competitive service industries are locking in growth and contributing to greater
service account receipts in the balance of payments. Examples include information in the United
States, and finance and insurance in the United Kingdom.
The United States in particular saw the rapid expansion and diversification of the service
industry in the course of the 1990s revitalization of the domestic economy, and a pattern of
interdependent economic development has emerged with the manufacturing industries using
these services7. To secure technology development in new areas and the international
competitiveness of high added-value products, as noted above, Japan’s service industry too will
need to deepen interdependence with the manufacturing industry.
The service industry can also target not only domestic manufacturers and consumers, but
users all around the world, a feature which has been strongly marked in the recent development
of the US and European service industries. Japan’s manufacturing industry has continued to
expand offshore production and other activities to reach out to the world market. Similarly,
Japan’s service industry too needs to expand its vision beyond the domestic market to the world
and boost its international competitiveness to become the engine for the next generation, to
which end it will be vital to stimulate innovation in services in order to increase productivity8.
(c) Sound external investment
(Japan’s capital outflow)
The enormous capital outflow from Japan, which maintains a capital account deficit, is
serving to enhance Japan’s presence in international finance markets, particularly in terms of
international securities investment.
7 See Section 3, Chapter 1.8 See Section 2, Chapter 4 in regard to policy issues in stimulating innovation.
Figure 2.3.17 Service trade specialization coefficients
US UK Italy Canada Germany France JapanServices trade 0.18 0.09 0.03 ▲0.13 ▲0.20 0.12 ▲0.29 Royalties and license fees 0.58 0.05 ▲0.49 ▲0.40 ▲0.31 ▲0.10 ▲0.19 Computer and license fees 0.74 0.52 ▲0.40 0.26 ▲0.24 ▲0.23 ▲0.39 Finance 0.50 0.70 ▲0.18 ▲0.19 0.43 ▲0.01 ▲0.27 Insurance ▲0.50 0.61 ▲0.10 ▲0.12 ▲0.76 0.14 ▲0.90 Communication ▲0.33 ▲0.08 ▲0.24 ▲0.01 ▲0.23 0.01 ▲0.29 Travel 0.21 ▲0.14 0.24 ▲0.17 ▲0.46 0.26 ▲0.79 Transportation 0.00 ▲0.06 ▲0.11 ▲0.17 ▲0.10 ▲0.02 ▲0.19
Note: 1. Trade specialization coefficient=(export value-import value)/(export value+import value).Note: 2. 1990-2000 average values.Sources: Balance of Payments (Bank of Japan), BOP (IMF).
-108-
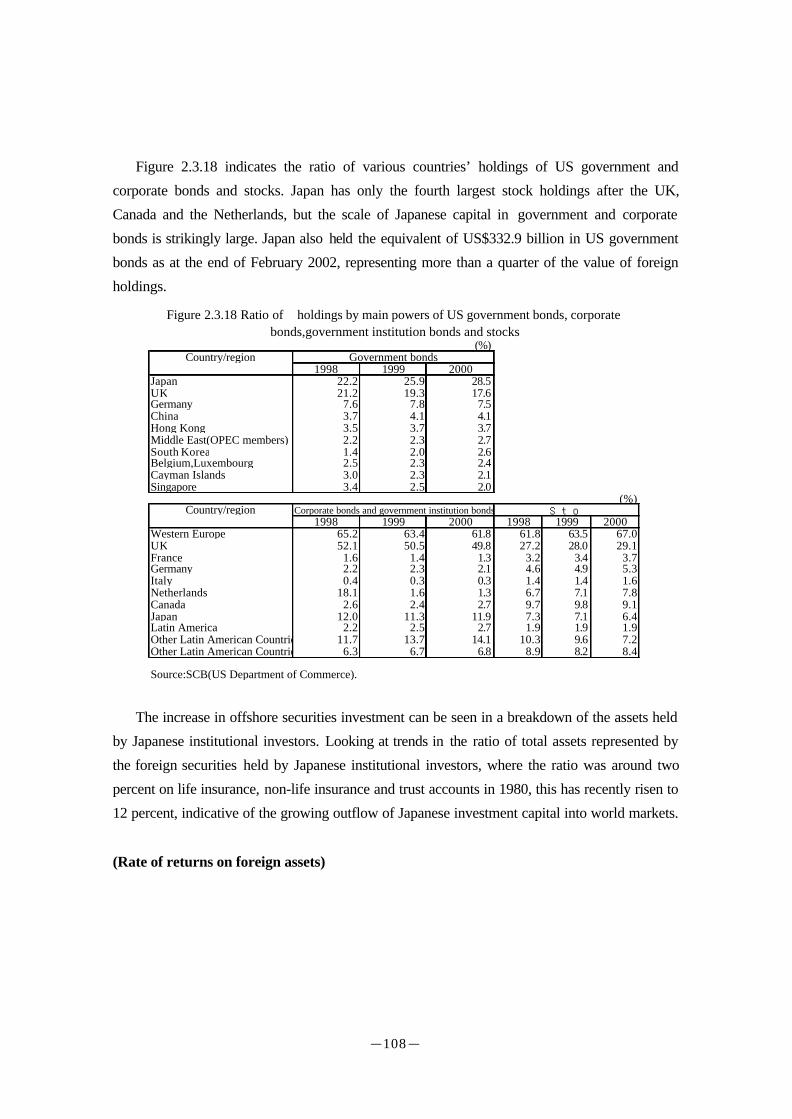
Figure 2.3.18 indicates the ratio of various countries’ holdings of US government and
corporate bonds and stocks. Japan has only the fourth largest stock holdings after the UK,
Canada and the Netherlands, but the scale of Japanese capital in government and corporate
bonds is strikingly large. Japan also held the equivalent of US$332.9 billion in US government
bonds as at the end of February 2002, representing more than a quarter of the value of foreign
holdings.
The increase in offshore securities investment can be seen in a breakdown of the assets held
by Japanese institutional investors. Looking at trends in the ratio of total assets represented by
the foreign securities held by Japanese institutional investors, where the ratio was around two
percent on life insurance, non-life insurance and trust accounts in 1980, this has recently risen to
12 percent, indicative of the growing outflow of Japanese investment capital into world markets.
(Rate of returns on foreign assets)
(%)Country/region Government bonds
1998 1999 2000Japan 22.2 25.9 28.5UK 21.2 19.3 17.6Germany 7.6 7.8 7.5China 3.7 4.1 4.1Hong Kong 3.5 3.7 3.7Middle East(OPEC members) 2.2 2.3 2.7South Korea 1.4 2.0 2.6Belgium,Luxembourg 2.5 2.3 2.4Cayman Islands 3.0 2.3 2.1Singapore 3.4 2.5 2.0
(%)Country/region Corporate bonds and government institution bonds
1998 1999 2000 1998 1999 2000Western Europe 65.2 63.4 61.8 61.8 63.5 67.0UK 52.1 50.5 49.8 27.2 28.0 29.1France 1.6 1.4 1.3 3.2 3.4 3.7Germany 2.2 2.3 2.1 4.6 4.9 5.3Italy 0.4 0.3 0.3 1.4 1.4 1.6Netherlands 18.1 1.6 1.3 6.7 7.1 7.8Canada 2.6 2.4 2.7 9.7 9.8 9.1Japan 12.0 11.3 11.9 7.3 7.1 6.4Latin America 2.2 2.5 2.7 1.9 1.9 1.9Other Latin American Countries 11.7 13.7 14.1 10.3 9.6 7.2Other Latin American Countries 6.3 6.7 6.8 8.9 8.2 8.4
Source:SCB(US Department of Commerce).
Figure 2.3.18 Ratio of holdings by main powers of US government bonds, corporatebonds,government institution bonds and stocks
Stocks
-109-
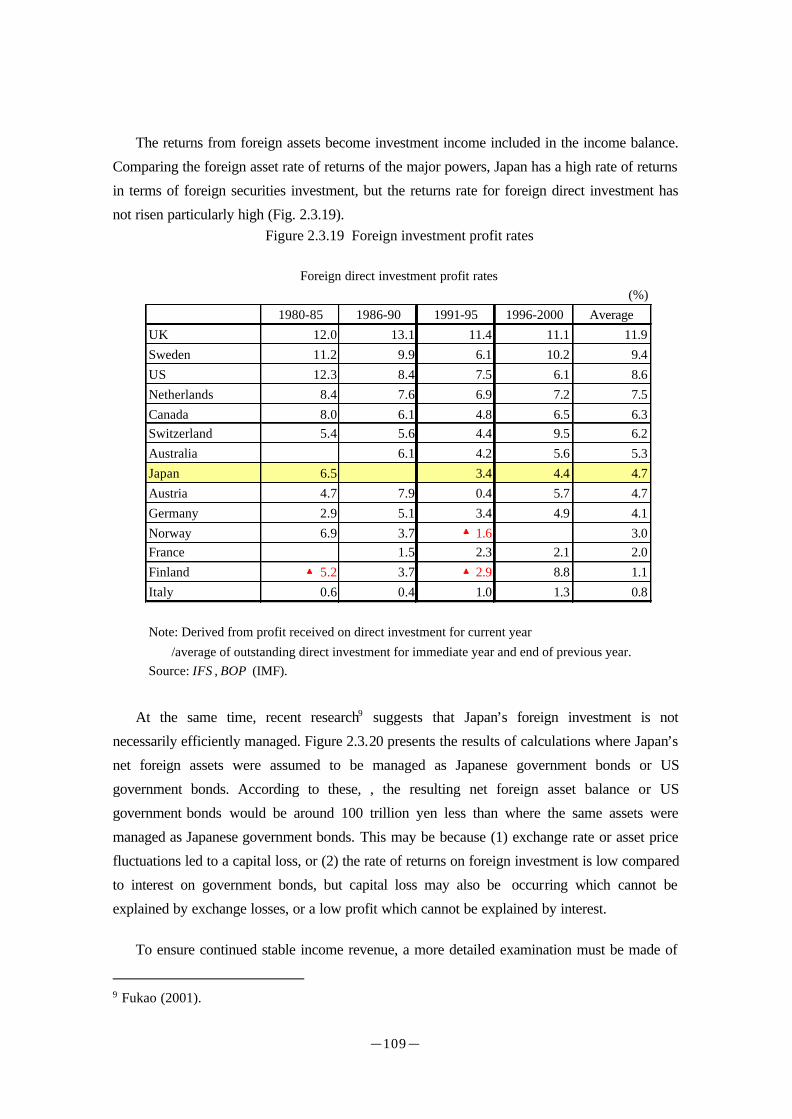
The returns from foreign assets become investment income included in the income balance.
Comparing the foreign asset rate of returns of the major powers, Japan has a high rate of returns
in terms of foreign securities investment, but the returns rate for foreign direct investment has
not risen particularly high (Fig. 2.3.19).
At the same time, recent research9 suggests that Japan’s foreign investment is not
necessarily efficiently managed. Figure 2.3.20 presents the results of calculations where Japan’s
net foreign assets were assumed to be managed as Japanese government bonds or US
government bonds. According to these, , the resulting net foreign asset balance or US
government bonds would be around 100 trillion yen less than where the same assets were
managed as Japanese government bonds. This may be because (1) exchange rate or asset price
fluctuations led to a capital loss, or (2) the rate of returns on foreign investment is low compared
to interest on government bonds, but capital loss may also be occurring which cannot be
explained by exchange losses, or a low profit which cannot be explained by interest.
To ensure continued stable income revenue, a more detailed examination must be made of
9 Fukao (2001).
Figure 2.3.19 Foreign investment profit rates
Foreign direct investment profit rates(%)
1980-85 1986-90 1991-95 1996-2000 AverageUK 12.0 13.1 11.4 11.1 11.9Sweden 11.2 9.9 6.1 10.2 9.4US 12.3 8.4 7.5 6.1 8.6Netherlands 8.4 7.6 6.9 7.2 7.5Canada 8.0 6.1 4.8 6.5 6.3Switzerland 5.4 5.6 4.4 9.5 6.2Australia 6.1 4.2 5.6 5.3Japan 6.5 3.4 4.4 4.7Austria 4.7 7.9 0.4 5.7 4.7Germany 2.9 5.1 3.4 4.9 4.1Norway 6.9 3.7 ▲1.6 3.0France 1.5 2.3 2.1 2.0Finland ▲5.2 3.7 ▲2.9 8.8 1.1Italy 0.6 0.4 1.0 1.3 0.8
Note: Derived from profit received on direct investment for current year /average of outstanding direct investment for immediate year and end of previous year.Source: IFS , BOP (IMF).

-110-
the management of foreign assets, analyzing rates of return and changes in the income structures
of the world’s industries to promote sound management of foreign assets and active investment
activities.
(d) Development of the required inward investment environment
Inward investment in Japan stands at a lower percentage of GDP than other countries, while
outstanding inward investment as a ratio of GDP is also well under the levels of other countries.
This indicates a sluggish capital inflow (Fig. 2.3.21).
Inward direct investment has increased in recent years in response to a growing number of
large-scale M&As. This phenomenon is thought to reflect a concurrence between the desire of
Japanese companies to improve business efficiency and raise corporate value by restructuring
unprofitable areas of their operations, and the ambitions of foreign companies seeking an inroad
into the Japanese market for its huge economic scale. Business environment factors such as
deregulation and the decline in acquisition costs caused by falling stock prices have also played
a major role. Japan will need to continue advancing domestic institutional reforms such as
deregulation, elimination of restrictions, and improvement of the tax system, creating an
investment environment which is attractive to not only foreign but also domestic companies and
Figure 2.3.20 Asset balance where net foreign assets are managedas Japanese or US government bonds
0
50
100
150
200
250
70 71 72 73 74 75 76 77 78 79 80 81 82 83 84 85 86 87 88 89 90 91 92 93 94 95 96 97 98(Year)
(Trillion yen)
Asset balance where net foreign assets aremanaged as Japanese government bondsAsset balance where net foreign assets aremanaged as US government bonds
Actual net foreign asset balance
Source:Fukao(2001).

-111-
expanding investment opportunities10.
For Japan to maintain its economic dynamism into the future and sustain the international
credibility and standing of the Japanese economy, it will be vital to continue to create new
sources of revenue, as noted above, in terms of export products, the service industry and inward
and foreign investment. Key issues will therefore be the promotion of economic structural
reform as a means of creating a favorable environment, and promotion of innovation across the
economy as a whole.
10 See Section 2, Chapter 4 concerning policies required in regard to inward investment.
(%)Inward investment balance at end of
2000Average inward investment(flow) for
1998-2000Direct Investment Portfolio investment Direct Investment Portfolio investment
Sweden 33.9 99.0 14.3 1.9Netherlands 65.3 154.2 11.5 16.3Denmark 29.3 64.4 11.0 1.6Finland 20.3 211.5 6.8 9.2UK 36.8 106.4 6.6 11.1Canada 28.2 48.0 5.6 1.7Switzerland 35.7 171.2 5.3 3.5Germany 22.6 55.4 4.6 5.7Norway 4.0 4.8New Zealand 42.9 50.0 3.8 0.4France 54.6 67.6 2.9 7.6Austria 15.1 81.3 2.8 11.9US 27.7 44.2 2.7 3.9South Korea 2.0 1.7Australia 28.5 58.3 1.9 3.3Italy 10.6 53.4 0.7 7.9Japan 1.1 18.6 0.2 1.8
Source:IFS(IMF).
Figure 2.3.21 Inward investment and inward investment balance against nominalGDP