Section 2 Methodology - valdostacity.com · The hydrologic module of SWMM uses overland flow data...
29
2-1 Z:\20790_City_of_Valdosta\70141_SWMP Update Phase 1\Reports\Final_Report_01-14-11\Section2_v3.docx Section 2 Methodology 2.1 Stormwater Modeling Proper evaluation of existing stormwater facilities (conveyance and storage) is critical in order for the City to effectively manage flood risk, capital improvements, water quality issues, and maintenance of hurricane evacuation routes. For this evaluation, CDM used USEPA SWMM version 5.0.014 to simulate the surface water hydrology and hydraulics. SWMM is also approved by FEMA for floodplain mapping and accepted as an industry standard modeling platform for urban systems with systems of combined open channels and piped networks. SWMM is a dynamic hydrologic and hydraulic model capable of performing continuous or event simulations of surface runoff, and subsequent hydraulic conveyance in open channel and pipe systems. The hydrologic system operates by applying precipitation across Hydrologic Units (HU) and through hydrologic calculations, determining surface runoff to loading points on the user-defined In-Stream Primary Stormwater Management System (PSWMS). Runoff hydrographs for these loading points provide input for hydraulic routing the PSWMS to the outlet. Please refer to Figure 2.2.5 for the PSWMS. The hydraulic flow routing routine of SWMM 5 uses a link-node representation of the stormwater management system to dynamically route flows by continuously solving the complete one-dimensional Saint-Venant flow equations. The dynamic flow routing allows for representation of channel storage, branched or looped networks, backwater effects, free surface flow, pressure flow, entrance and exit losses, weirs, orifices, pumping facilities, rating curves, and other special structures/links. Control rules may be used to operate the structures based on timing and/or stage and flow conditions within the model. 2.2 Hydrologic Parameters Hydrologic model parameters used for the model simulations are described in this section. 2.2.1 Topographic Data Topographic data were used to define hydrologic boundaries, overland flow slopes, channel floodplains, critical flood elevations, and stage-storage area relationships. Topographic data were available from four major sources: 1. Survey data (creek cross section and roadway crossings) obtained by CDM using services of ASA Engineering & Surveying, Inc. The survey is in
Transcript of Section 2 Methodology - valdostacity.com · The hydrologic module of SWMM uses overland flow data...

2-1
Z:\20790_City_of_Valdosta\70141_SWMP Update Phase 1\Reports\Final_Report_01-14-11\Section2_v3.docx
Section 2 Methodology
2.1 Stormwater Modeling Proper evaluation of existing stormwater facilities (conveyance and storage) is critical in order for the City to effectively manage flood risk, capital improvements, water quality issues, and maintenance of hurricane evacuation routes. For this evaluation, CDM used USEPA SWMM version 5.0.014 to simulate the surface water hydrology and hydraulics. SWMM is also approved by FEMA for floodplain mapping and accepted as an industry standard modeling platform for urban systems with systems of combined open channels and piped networks.
SWMM is a dynamic hydrologic and hydraulic model capable of performing continuous or event simulations of surface runoff, and subsequent hydraulic conveyance in open channel and pipe systems.
The hydrologic system operates by applying precipitation across Hydrologic Units (HU) and through hydrologic calculations, determining surface runoff to loading points on the user-defined In-Stream Primary Stormwater Management System (PSWMS). Runoff hydrographs for these loading points provide input for hydraulic routing the PSWMS to the outlet. Please refer to Figure 2.2.5 for the PSWMS.
The hydraulic flow routing routine of SWMM 5 uses a link-node representation of the stormwater management system to dynamically route flows by continuously solving the complete one-dimensional Saint-Venant flow equations. The dynamic flow routing allows for representation of channel storage, branched or looped networks, backwater effects, free surface flow, pressure flow, entrance and exit losses, weirs, orifices, pumping facilities, rating curves, and other special structures/links. Control rules may be used to operate the structures based on timing and/or stage and flow conditions within the model.
2.2 Hydrologic Parameters Hydrologic model parameters used for the model simulations are described in this section.
2.2.1 Topographic Data Topographic data were used to define hydrologic boundaries, overland flow slopes, channel floodplains, critical flood elevations, and stage-storage area relationships. Topographic data were available from four major sources:
1. Survey data (creek cross section and roadway crossings) obtained by CDM using services of ASA Engineering & Surveying, Inc. The survey is in
Section 2 Methodology
2-2
Z:\20790_City_of_Valdosta\70141_SWMP Update Phase 1\Reports\Final_Report_01-14-11\Section2_v3.docx
compliance with FEMA Data Capture Standards. All elevations are tied to NAVD88 benchmarks within the City of Valdosta.
Establishment of a Survey Benchmark Network Prior to collecting survey a Survey Benchmark Network was established. A citywide geodetic control network was developed. Each geodetic control monument help develop a basis for tying all of the stormwater features and storm drainage structures together on a common datum. A geodetic control monument is essentially a surveyed point whose positional value has been established and verified for future use by the engineering, GIS and surveying communities. Refer Appendix H for the Benchmark network points.
Each structure (culvert, dam, or bridge) survey includes the following:
Four color pictures of upstream/downstream channel and structure views
One sketch in the form of structure data sheet
One survey file in text format including the appropriate survey codes consistent with FEMA feature labels. Surveys files are in ASCII format files
Each cross section survey includes the following:
Two color pictures of upstream/downstream channel views
One sketch provided in the form of cross-section data sheet
One survey file in text format including the appropriate survey codes consistent with FEMA feature table. Survey files are in ASCII format file
A total of 90 structures and 65 channel cross sections have been surveyed. All survey points are also available spatially in the form of a shapefile.
2. GIS contour data (USGS – 10-ft interval contours) and interpolated contours were used by CDM. The interpolated contours were developed by Valdosta-Lowndes-Regional (VALOR) Geographic Information System and provided by the City to CDM. This dataset of 2-ft interpolated contours was used for limited reference since it had no elevation data attributed to it.
3. As-built plans and design drawings for upgraded roadway crossings and other stormwater regional facilities. The following drawings were received from the City and incorporated in the models.
Browns Canal retention ponds.

Section 2 Methodology
2-3
Z:\20790_City_of_Valdosta\70141_SWMP Update Phase 1\Reports\Final_Report_01-14-11\Section2_v3.docx
Norman Spells pond
Lee Street Pond (La Forrest)
Mill Dam Pond
CDM used the data to delineate hydrologic divides, define stage-area-storage relationships, define channel geometries, and define bridge/culvert/control structure characteristics.
Vertical Datum NAVD88 vertical datum was used in all model development tasks. All flood elevations in the current Flood Insurance Study (FIS-Sept 2008) and on the Flood Insurance Rate Maps (FIRMs) for the City of Valdosta are referenced to NAVD88. FEMA established the average datum conversion of -0.68 foot to convert all elevations in Lowndes County from NGVD29 to NAVD88. CDM used this conversion whenever such conversions needed be made.
2.2.2 Hydrologic Units (HUs) Natural physical features or constructed stormwater management systems that control and direct stormwater runoff to a common outfall generally define HUs. The following general criteria were used to determine HU boundaries:
Topographic highs
Large-scale physical features such as railroad grades, airport runways, and roads
Where structures of topographic features could appreciably impound water for the 100-year event
Existing reports and studies and field verification, to define ambiguous boundaries
NPDES stormwater pipes and drainage coverage provided by the City were also utilized to determine the extent and boundaries of HUs.
GIS software was used to digitize the HUs, calculate properties, and to extract land use and soil properties for use in calculation of HU hydrologic parameters.
2.2.3 Rainfall Intensities and Quantities For the City of Valdosta, 15-minute rainfall distributions were generated for the 1.2-inch event and recurrence intervals of 5-, 10-, 25- and 100-year of 24-hour duration design storms. The rainfall intensities for the City of Valdosta were obtained from the Georgia Stormwater Management Manual Volume 2 (Technical Handbook). Table 2.2.1 shows the rainfall depths in tabular and graphical form in inches for the various

Section 2 Methodology
2-4
Z:\20790_City_of_Valdosta\70141_SWMP Update Phase 1\Reports\Final_Report_01-14-11\Section2_v3.docx
design storm events used in this study. NRCS (SCS) type II rainfall distribution was used to determine the above mentioned rainfall distributions.
Table 2.2.1. 24-Hour Design Storm Depths in Inches
Recurrence Interval
1.2 Inches 5-year 10-year 25-year 50-year 100-year Design Storm Depths (in) 1.2 5.5 6.5 7.7 8.4 9.1
To verify this rainfall information, rainfall data were collected from local rain gages in the City of Valdosta region. Data were obtained and analyzed from USGS Gage: 023177483 at McMillan Rd, near Bemiss, GA and USGS gage: 02318500 at US 84 near Quitman, GA. Long-term daily rainfall data (1954-2009) were obtained from NCDC (National Climatic Data Center) Coop Number 098974, station ID number: 20004705. Data were also obtained from Valdosta Regional Airport and Moody Air force Base stations. The approximate location of these gages is shown on Figure 2.2.1.
2.2.4 Hydrologic Parameters The hydrologic module of SWMM uses overland flow data in the form of width, slope, and Manning’s roughness coefficient to create a physically based overland flow runoff plane to route runoff to the PSWMS for hydraulic routing. The overland flow hydraulic length is the weighted-average travel length to the PSWMS.

N VALDOSTA RD CHER
RY C
REEK
RD
BEMI
SS RD
COLS
ON R
D
COUNTRY CLUB RD
N OA
K ST INNER PERIMETER RD
N ST AUGUSTINE RD
S ST AUGUSTINE RD
OLD CLYATTVILLE RDMADISON HWY
INNER PERIMETER RD Railro
adWithlaco
ochee R
iver
Mud Swamp Creek
84
41
41
75
Knights Creek
Cherry Creek
Dukes Bay Canal
Sugar Creek
One Mile BranchTwo Mile Branch
Hightower Creek
Browns Canal
Stillhouse Branch
Three Mile Branch
USGS Gage at US 84, near Quitman, GA
USGS Gage at McMillan Rd near Bemiss, GA
NCDC Rain Gage
Moody Airforce base
Valdosta Regional Airport
LegendCity LimitsStreams
Rain GagesStream Gages
Figure 2.2.1City of Valdosta, GA
Rain Gages and Stream Gages Locations0 2.5 51.25Miles

Section 2 Methodology
2-6
Z:\20790_City_of_Valdosta\70141_SWMP Update Phase 1\Reports\Final_Report_01-14-11\Section2_v3.docx
Overland flow slope is the average slope across the overland flow hydraulic length. Length and slope information was estimated from topographic map data and field inspection data. The Manning’s equation is used for the overland flow routing. Table 2.2.2 lists typical Manning’s roughness coefficient (n) values for overland flow. Note that pervious land use coverage appears rough because the depth of overland flow (a few inches) is equal to or less than the height of the roughness feature. Refer to Appendix J for hydrologic parameters, tabulated for hydrologic units per sub-basin.
Based on the reference data, CDM developed a set of land use based Manning’s roughness coefficient values used in the SWMM, as shown in Table 2.2.3.
Table 2.2.2. Published Values of Manning’s Roughness Coefficients for Overland Flow
Source Ground Cover Manning’s n Range
Crawford and Linsley (1966)a Smooth asphalt Asphalt of concrete paving Packed clay Light turf Dense turf Dense shrubbery and forest litter
0.012 0.014 0.03 0.20 0.35 0.4
Engman (1986)b Concrete or asphalt Bare sand Graveled Surface Bare clay-loam (eroded) Range (natural) Bluegrass sod Short grass prairie Bermuda grass
.011
.01
.02 0.02 0.13 0.45 0.15 0.41
0.01-0.013 0.01-0.16 0.012-0.03 0.012-0.033 0.01-0.32 0.39-0.63 0.10-0.20 0.30-0.48
: aObtained by calibration of Stanford Watershed Model bComputed by Engman (1986) by kinematic wave and storage analysis of measured rainfall-runoff data.
Table 2.2.3. Land Use Based Manning’s Roughness Coefficients used in SWMM
2.2.5 Infiltration Rates and Capacities
Fo
rest
, Op
en &
P
ark
Pas
ture
Ag
ricu
ltu
ral &
G
olf
Co
urs
es
Lo
w D
ensi
ty
Res
iden
tial
Med
ium
Den
sity
R
esid
enti
al
Hig
h D
ensi
ty
Res
iden
tial
Lig
ht
Ind
ust
rial
, C
om
mer
cial
&
Inst
itu
tio
nal
Hea
vy I
nd
ust
rial
Wet
lan
ds
Wat
erco
urs
es &
W
ater
bo
die
s
Impervious Manning’s n
0.015 0.015 0.015 0.015 0.015 0.015 0.015 0.015 0.100 0.024
Pervious Manning’s n
0.400 0.300 0.300 0.250 0.250 0.250 0.250 0.250 0.400 0.060

Section 2 Methodology
2-7
Z:\20790_City_of_Valdosta\70141_SWMP Update Phase 1\Reports\Final_Report_01-14-11\Section2_v3.docx
2.2.5 Infiltration Rates and Capacities Soil infiltration rates were taken from CDM experience with similar areas and the USDA-SCS Soil Survey for Lowndes County based upon the hydrologic soil group. Soil capacity (or soil storage) is a measure of the amount of storage (in inches) available in the soil type for a given antecedent moisture condition. The average Antecedent Moisture Condition (AMC II) was used for all design storm analyses per St. Johns River Water Management District (SJRWMD) guidelines. Actual storm antecedent moisture conditions were used for calibration storms. Soil capacities were estimated based on calibration results (i.e., simulated volumes were compared to measured runoff volumes), available depth-to-water table data, and the use of equations as outlined in the SJRWMD Technical Publication 85-5 (A Guide to SCS Runoff Procedures).
The Horton infiltration equation was used because it provides all of the features needed and its parameters are more familiar to local engineers. The following paragraphs provide further discussion on the Horton approach.
The Horton equation is an exponential relationship that reduces soil infiltration rates to an asymptotic value or zero as saturation occurs. Figure 2.2.2 shows the change in infiltration rates over time as described by Horton’s equation. In addition, it shows that the soil has a set maximum amount of moisture that can infiltrate before all voids in the soil are filled, and that part of the infiltration capacity of the soil may contain antecedent soil moisture. Table 2.2.4 lists Horton infiltration parameters for each soil type, and for various antecedent soil conditions based upon a variety of stormwater master plans by CDM in southeastern United States.
To account for moisture already in the soil, the initial infiltration rate, fo, may be reduced according to Horton’s equation to the value f shown on Figure 2.2.2, the total soil storage may be reduced accordingly. For this study, the total maximum infiltration volume was set to the available soil storage capacity less the antecedent soil moisture. Often, a high groundwater table or low-lying impervious layer was the determining factor for this parameter.
Horton infiltration parameters and available storage capacity are required for each hydrologic unit. Minimum and maximum rates were determined by using an area-weighting of the soil percentages within each hydrologic unit. For example, if a hydrologic unit had 50 percent of both hydrologic soil groups A and B, the minimum infiltration rate (based on the global soil parameters in Table 2.2.4) would be 0.5 * 1.0 in/hr plus 0.5 * 0.5 in/hr, or 0.75 in/hr.
A further reduction in infiltration was performed to account for non-directly connected impervious areas (NDCIA) that drain onto pervious areas (e.g., roof drains onto lawns). RUNOFF uses as effective pervious area which groups the NDCIA with the pervious area. Rainfall subject to infiltration falls over the combined NDCIA and pervious area but can only infiltrate into the pervious area. In order to limit predicted

Section 2 Methodology
2-8
Z:\20790_City_of_Valdosta\70141_SWMP Update Phase 1\Reports\Final_Report_01-14-11\Section2_v3.docx
infiltration to that which is actually occurring only over the previous areas, the infiltration rates and soil storage values were reduced by the ratio of pervious areas to the sum of NDCIA and pervious areas.
Figure 2.2.2. Diagram of Infiltration Curve and Infiltration Rates as Related to Storage in Soil Additional discussion and an alternate method of describing infiltration rates is given by the standard ASCE infiltration capacity curves shown in the USEPA-SWMM User’s manual.

Section 2 Methodology
2-9
Z:\20790_City_of_Valdosta\70141_SWMP Update Phase 1\Reports\Final_Report_01-14-11\Section2_v3.docx
Table 2.2.4. Factors used for Calculating Standard Infiltration Curves for Pervious Areas (CDM 1998)
ItemSCS USDA Hydrologic Soil Group Destination A B C D
Final constant infiltration rate, fc (inches/hour) 1.00 0.50 0.25 0.10
Initiation infiltration rate, fo (inches/hour) 10.0-12.0 8.0-10.0 5.0-8.0 3.0-5.0Shape factor, k for infiltration curve (1/hour) 2 2 2 2
Typical Ranges of Value
Available storage capacity soil mantle S (inches) for four Antecendent Moisture Conditions (AMC)
Soil Group A B C DDry, Condition 1 12.0-4.3 9.0-3.4 7.0-2.3 3.0-1.3Normal, Condition 2 5.4-3.4 4.0-2.8 3.0-1.8 1.3-1.0Wet, Condition 3 2.1-1.8 1.5-1.3 1.0-0.8 0.7-0.5Saturated, Condition 4 0 0 0 0
Infiltration accumulated in soil mantle F (inches) at start of rainfall
Soil Group A B C DDry, Condition 1 0 0 0 0Normal, Condition 2 2.1-1.8 1.5-1.3 1.0-0.8 0.7-0.5Wet, Condition 3 5.4-3.4 4.0-2.8 3.0-1.8 1.3-1.0Saturated, Condition 4 12.0-4.3 9.0-3.4 7.0-2.3 3.0-1.3
Antecedent Moisture Conditions For Previous Areas Condition Description
1 Dry <1.42 Normal 1.4-2.13 Wet >2.14 Saturated Saturation
Value
Factors Used for Calculating the Standard Infiltration Curves for Pervious Areas (CDM, 1988)
Total rainfall during 5 days preceding storm (inches)
2.2.6 Soils Types and Characteristics Soils within each Hydrologic Unit were classified by the Natural Resource Conservation Service (NRCS, formerly the Soil Conservation Service [SCS]). The NRCS Soils coverage for Lowndes County was obtained from VALOR (Valdosta-Lowndes-Regional Geographic Information System).
The hydrologic model within SWMM uses both soil storage and infiltration rates to determine the volume of surface water runoff and infiltration in pervious land areas. Soil capacity (or soil storage) is a measure of the amount of storage (in inches) available in the soil type for a given antecedent moisture condition. The average antecedent moisture condition (AMC II) was used for all design storm analyses. Soil

Section 2 Methodology
2-10
Z:\20790_City_of_Valdosta\70141_SWMP Update Phase 1\Reports\Final_Report_01-14-11\Section2_v3.docx
capacities were estimated based on SJRWMD TP 85-5 (A Guide to SCS Runoff Procedures).
The Horton soil infiltration equation was used within SWMM to simulate infiltration into the soil. For design storm modeling, the Horton method presumes that the infiltration rate varies exponentially from an initial maximum infiltration rate to a minimum infiltration rate during the event. Model input includes maximum and minimum infiltration rates, and a decay constant that determines how fast the infiltration rate is moving toward the minimum rate during the event. Additionally, a total maximum infiltration depth can be specified based on the moisture capacity of the soil. SWMM will not allow the infiltration volume during the event to exceed this volume.
Each of the soil types described above has been assigned to one of the four Hydrologic Soil Groups (A, B, C, or D) established by the SCS. Hydrologic Soil Group A is comprised of soils with a very high infiltration potential and a low runoff potential. Hydrologic Soil Group D is comprised of soils with very low infiltration potential and a high runoff potential. The other two categories fall between A and D soil groups. Dual class soils (e.g., A/D) mean that a hard pan or impermeable layer limits vertical infiltration, but the surficial soils are highly permeable and could infiltrate as a Class A soil if the confining layer was cut with a ditch or swale. All dual class soils were classified as the soil class with low infiltration potential and hence a higher runoff potential, for example all (B/D) were classified as D for this study. Figure 2.2.3 shows the Soils distribution for the City of Valdosta.
Global parameters were established for each Hydrologic Soil Group, and were used to determine area-weighted parameter values based on the percent of each Hydrologic Soil Group within each HU. Detailed information on the use of the Horton infiltration equation is described in the SWMM 5 Users Manual. Table 2.2.5 lists the global infiltration parameters used to calculate the hydrologic input data used in this study.
Table 2.2.5. Global Horton Infiltration Parameters
Hydrologic Soil Group
Maximum Infiltration Rate (in/hr)
Minimum Infiltration Rate
(in/hr)
Decay Rate (1/sec)
Maximum Soil Storage (in)
A B C D
12.0 9.0 6.0 4.0
1.00 0.50 0.25 0.10
0.000556 0.000556 0.000556 0.000556
6.75 5.00 3.80 1.40

LegendHydrologic Soils Group Distribution
ABCD
0 1 20.5Miles
Figure 2.2.3City of Valdosta, GA
Hydrologic Soils GroupDistribution

Section 2 Methodology
2-12
Z:\20790_City_of_Valdosta\70141_SWMP Update Phase 1\Reports\Final_Report_01-14-11\Section2_v3.docx
2.2.7 Impervious Areas The impervious area for each hydrologic unit was calculated by estimating percentages of homogenous (or nearly homogeneous) land use from the existing land use data obtained from VALOR for City of Valdosta, then applying guideline impervious and directly-connected-impervious area (DCIA) percentages. These guideline percentages are based on SCS methodology, CDM experience, and field checks. DCIA sensitivity was also examined in order to refine initial estimates. Table 2.2.6 shows a simplified list of land use types, their impervious percentage, percent DCIA, percent NDCIA, and percent pervious area. As previously discussed, NDCIA is grouped with pervious areas in the model as a common flow surface. Pervious initial abstractions and Manning’s n values were weighted based on the percentages of pervious area and NDCIA within each of the land uses in a hydrologic unit. Weighing of pervious and NDCIA parameters to develop the pervious are parameters for a hydrologic unit is done to account for the fact that NDCIA is grouped with pervious area within the model. Similarly, DCIA initial abstractions and Manning’s n values were weighed based on the percentage of DCIA in each of the land uses within a hydrologic unit.
Table 2.2.6. City of Valdosta Sub-basins Tributary Area and Stream Miles
Stream Tributary Area (Acres) Stream Miles
One Mile Branch 1,944 3.0
Two Mile Branch 1,798 3.7
Three Mile Branch 598 2.2
Sugar Creek 1,622 4.2
Hightower Creek 1,019 2.7
Browns Canal 676 1.6
Dukes Bay Canal 2,700 5.0
Cherry Creek 8,106 8.6
Stillhouse Branch 586 1.6
Knights Creek* 10,485 10.2
Total 29,534 42.8
* Not part of Phase 2 of SWMP
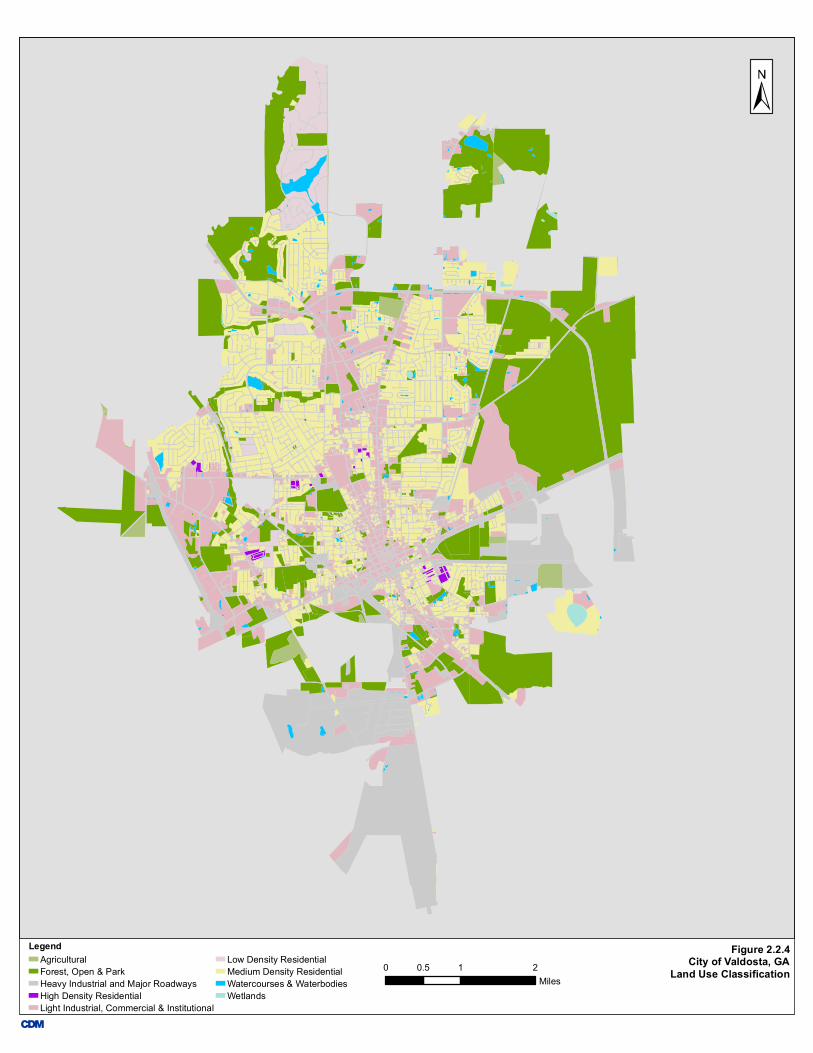
2.2.8 Land Use For this study, existing land use was obtained from VALOR for the City of Valdosta. The original land use data were classified in 10 categories, namely: Agricultural, Commercial, Industrial, Multi-Family Residential, Office Professional, Public/ Institutional, Parks/Recreation/Conservation, Residential, Transportation/Communications/Utilities and Undeveloped/Unused. These land use data were re-classified into 10 hydrologically significant land use classes with similar hydrologic characteristics used in the hydrologic modeling.

Section 2 Methodology
2-13
Z:\20790_City_of_Valdosta\70141_SWMP Update Phase 1\Reports\Final_Report_01-14-11\Section2_v3.docx
Original Land Use Category Hydrologic Land Use Category
Agriculture Agricultural Commercial Light Industrial Commercial, and Institutional Industrial Light Industrial, Commercial, and Institutional Multi-Family Residential High Density Residential Office Professional Light Industrial, Commercial, and Institutional Public / Institutional Light Industrial, Commercial, and Institutional Parks / Recreation / Conservation Forest, Open and Park Residential Medium Density Residential Transportation/Communications/Utilities Heavy Industrial and Major Roadways Undeveloped/Unused Forest, Open and Park
Residential land use was more carefully inspected and large tracts of residential land uses where dwelling density was lower than 2 dwelling units per acre was classified as Low Density Residential. Similar inspections were carried out for Medium and High Density Residential area confirmations. High density residential land use consists of areas where dwelling density is greater than five dwelling units per acre. CDM used the 2007 Aerials, which were purchased from Southern Georgia Regional Commission (SGRC). These aerials provide 6-inch resolution, color imagery for the entire city. Wetland coverage from the National Wetland Inventory was used to determine the Wetland areas and the corresponding tracts were classified under Wetland land use category. All water bodies, ponds, lakes, stormwater facilities coverage obtained from the City was classified under Watercourses and Water bodies land use class. Figure 2.2.4 shows the Land Use classification for City of Valdosta.
Each land use class has unique parameters for percent impervious, percents of directly and non-directly connected impervious areas (DCIA and NDCIA, respectively), and pervious and impervious cover roughness factors. Land use distribution for the area of the City that is explicitly modeled (e.g., areas within the 9 major basins) is presented in Table 2.2.7. Table 2.2.6 shows all the sub-basins along with their tributary areas and stream miles. Figure 2.2.5 shows all the sub-basins, along with the streams and hydrologic units (HUs).
Table 2.2.7. City of Valdosta Land Use Distribution
Land Use Class Acres Percent Forest, Open & Park 7,436 25.0
Agricultural 4,633 15.6
Low Density Residential 475 1.60
Medium Density Residential 8,150 27.5
High Density Residential 55 0.20
Light Industrial, Commercial & Institutional 4,201 14.2
Heavy Industrial & Roadways 4,398 14.8
Wetlands 62 0.20
Watercourses & Water bodies 276 0.90
Total 29,686 100
LegendAgriculturalForest, Open & ParkHeavy Industrial and Major RoadwaysHigh Density ResidentialLight Industrial, Commercial & Institutional
Low Density ResidentialMedium Density ResidentialWatercourses & WaterbodiesWetlands
0 1 20.5Miles
Figure 2.2.4City of Valdosta, GA
Land Use Classification

N VALDOSTA RD
CHER
RY C
REEK
RD
BEMI
SS RD
COLS
ON R
D
COUNTRY CLUB RD
N OA
K ST
INNER PERIMETER RD
N ST AUGUSTINE RD
S ST AUGUSTINE RDOLD CLYATTVILLE RD
MADISON HWY Railro
adWithlaco
ochee R
iver
Mud Swamp Creek
84
41
41
75
Knights Creek
Cherry Creek
Dukes Bay Canal
Sugar Creek
One Mile BranchTwo Mile Branch
Hightower Creek
Browns Canal
Stillhouse Branch
Three Mile Branch
LegendBrowns CanalCherry CreekDukes Bay CanalHightower CreekKnights Creek
One Mile BranchStillhouse BranchSugar CreekThree Mile BranchTwo Mile Branch
City Limits Streams Figure 2.2.5City of Valdosta, GA
Sub-basins Areas, Hydrologic Units Delineations and Streams
0 1 20.5Miles

Section 2 Methodology
2-16
Z:\20790_City_of_Valdosta\70141_SWMP Update Phase 1\Reports\Final_Report_01-14-11\Section2_v3.docx
The DCIA represents all the impervious surfaces that are directly connected to the stormwater system. The NDCIA represents the impervious surfaces that have a pervious buffer prior to discharge into the stormwater system. Using the spatial distribution of the 10 land use classes, an area-weighted average percent imperviousness for each hydrologic unit can be obtained for the existing condition.
The percent imperviousness of each hydrologic unit is the most sensitive parameter defined in the SWMM hydrologic model which determines the volume and rate of surface water runoff. As discussed above, the imperviousness is based on land use percentages. A summary of model input parameters per land use is presented in Table 2.2.8.
Note: (1) Total Impervious Area
2.2.9 Depression Storage Land use specific depression storage values are used in the model to account for initial abstractions of rainfall totals for the design storm events. The parameter accounts for small depressions in the landscape that form puddles, as well as rainfall that is caught in tree canopies and the foliage of vegetation. These initial abstractions are withheld from the hydrologic routing and effectively removed from the system. At the beginning of a rainfall event and for each land use, rainfall is intercepted up to the depth reported in Table 2.2.9, after which the rainfall bypasses the initial abstraction and is used for hydrologic routing.
Table 2.2.8. Imperviousness by Land Use Category
Land Use Category Percent
Impervious(1)
Percent
DCIA
Percent
NDCIA
Percent
Pervious
Forest, Open & Park 5 1 4 95
Agricultural 5 1 4 95
Low Density Residential 15 8 8 85
Medium Density Residential 35 30 5 65
High Density Residential 83 50 33 18
Light Industrial, Commercial & Institutional 75 65 10 25
Heavy Industrial & Roadways 90 81 9 10
Wetlands 100 100 0 0
Watercourses & Waterbodies 100 100 0 0

Section 2 Methodology
2-17
Z:\20790_City_of_Valdosta\70141_SWMP Update Phase 1\Reports\Final_Report_01-14-11\Section2_v3.docx
Table 2.2.9. Land Use Based Initial Abstractions used in SWMM
2.3 Hydraulic Parameters This section presents the development of the hydraulic parameters for SWMM.
2.3.1 Field Investigations, As-Built Data, and Additional Survey The City of Valdosta PSWMS consists of streams, creeks, canals, culverts, bridges, control structures, underground pipe networks, and detention ponds. CDM conducted field investigations to assist in updating the definition of the hydraulic network.
For this study, field surveys were conducted by ASA Engineering & Surveying, Inc. for cross sections and structure. Survey was taken in the NAVD88 datum and in accordance with FEMA Data Capture Standards.
2.3.2 Model Schematic The SWMM hydrologic and hydraulic model uses a node/link representation of the PSWMS. Nodes are located at:
The ends of culverts
Upstream and downstream of bridge structures
Points along the streams where the geometry, direction, and/or slope of the channel varies significantly
Stream intersections
Structures along the streams (weirs, but in general may include pump stations, orifices, etc.)
Points representing the HU low elevations
Fo
rest
, Op
en &
P
ark
Pas
ture
Ag
ricu
ltu
ral &
G
olf
Co
urs
es
Lo
w D
ensi
ty
Res
iden
tial
Med
ium
Den
sity
R
esid
enti
al
Hig
h D
ensi
ty
Res
iden
tial
Lig
ht
Ind
ust
rial
, C
om
mer
cial
&
Inst
itu
tio
nal
Hea
vy I
nd
ust
rial
Wet
lan
ds
Wat
erco
urs
es &
W
ater
bo
die
s
Impervious Ia (inches)
0.10 0.10 0.10 0.10 0.10 0.10 0.10 0.10 0.50 0.10
Pervious Ia (inches)
0.25 0.25 0.25 0.25 0.25 0.25 0.25 0.25 0.50 0.10

Section 2 Methodology
2-18
Z:\20790_City_of_Valdosta\70141_SWMP Update Phase 1\Reports\Final_Report_01-14-11\Section2_v3.docx
2.3.3 Stage-Area Relationships Stage area relationships were computed for low lying areas in some HUs using the available topographic data. The plan area for storage at 2-ft intervals was calculated from the topographic surface as appropriate. In SWMM, the stage-area data can be assigned to a “storage node.” SWMM uses the data to calculate the relationship between stage and storage volume.
To avoid “double counting“ of storage in the model, storage associated with the floodplain of a stream reach must be kept separate from the stage-area storage nodes outside of the stream reach floodplain. Therefore, stage-area relationships were only provided to storage junctions at the furthest upstream node on a tributary, upstream of a structure, in roadway swales, to represent inline ponds, and to represent inline or offline storage where reaches do not include floodplains.
Stage-area relationships are necessary in relatively flat models where flood waters may overflow the channel banks and fill low-lying areas. An accounting of the volume of these areas is needed for both accurate flood elevation predictions as well as peak flow estimates.
2.3.4 Conduits The following data was incorporated in SWMM to characterize conduits (channel, pipes, and bridges): local losses, Manning’s n value, length, height, and width.
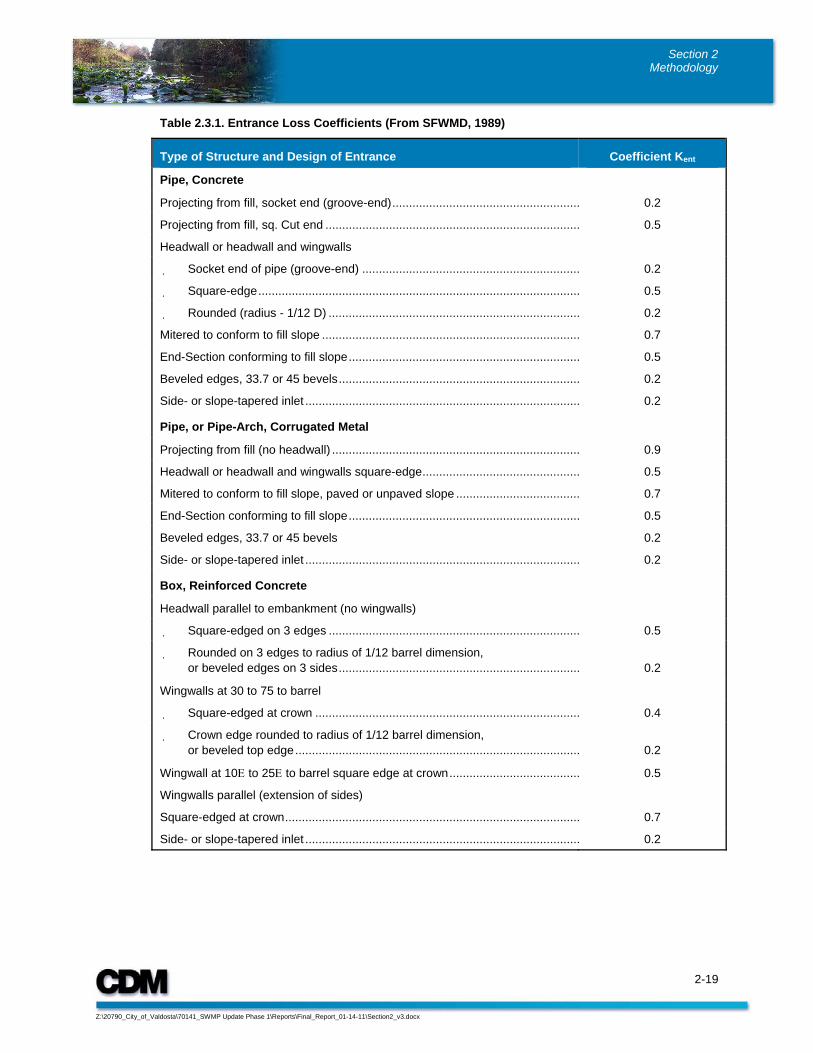
2.3.4.1 Culverts For circular and elliptical pipes, as well as rectangular box culverts, model input data included surveyed depth, width (if non-circular), length and upstream and downstream inverts. Local loss coefficients are listed in Tables 2.3.1 and 2.3.2.
2.3.4.2 Natural Channels Most of the natural channel (or irregular conduit) cross-sections in the model were developed from the survey data. To model 100-year events or other events that generate large flows, it was necessary to augment the surveyed cross-section with floodplain elevations from the topographic data. As the top of bank is reached during extreme events, SWMM treats irregular cross-sections as a closed conduit and the cross-sectional area becomes limited at this elevation.
For more intense storms, floodwater is simulated to the top of the bank for many of the cross-sections and flows over floodplains. These floodplains have been added to the canal/stream reaches in the model by augmenting the measured survey, while the significant storage that then was represented in each reach was removed from the stage-area relationship in the adjacent storage junctions, where applicable.
Section 2 Methodology
2-19
Z:\20790_City_of_Valdosta\70141_SWMP Update Phase 1\Reports\Final_Report_01-14-11\Section2_v3.docx
Table 2.3.1. Entrance Loss Coefficients (From SFWMD, 1989)
Type of Structure and Design of Entrance
Coefficient Kent
Pipe, Concrete
Projecting from fill, socket end (groove-end) ........................................................
0.2
Projecting from fill, sq. Cut end ............................................................................
0.5
Headwall or headwall and wingwalls
Socket end of pipe (groove-end) .................................................................
0.2
Square-edge ................................................................................................
0.5
Rounded (radius - 1/12 D) ...........................................................................
0.2
Mitered to conform to fill slope .............................................................................
0.7
End-Section conforming to fill slope .....................................................................
0.5
Beveled edges, 33.7 or 45 bevels ........................................................................
0.2
Side- or slope-tapered inlet ..................................................................................
0.2
Pipe, or Pipe-Arch, Corrugated Metal
Projecting from fill (no headwall) ..........................................................................
0.9
Headwall or headwall and wingwalls square-edge ...............................................
0.5
Mitered to conform to fill slope, paved or unpaved slope .....................................
0.7
End-Section conforming to fill slope .....................................................................
0.5
Beveled edges, 33.7 or 45 bevels
0.2
Side- or slope-tapered inlet ..................................................................................
0.2
Box, Reinforced Concrete
Headwall parallel to embankment (no wingwalls)
Square-edged on 3 edges ...........................................................................
0.5
Rounded on 3 edges to radius of 1/12 barrel dimension, or beveled edges on 3 sides ........................................................................
0.2 Wingwalls at 30 to 75 to barrel
Square-edged at crown ...............................................................................
0.4
Crown edge rounded to radius of 1/12 barrel dimension,
or beveled top edge .....................................................................................
0.2 Wingwall at 10 to 25 to barrel square edge at crown .......................................
0.5
Wingwalls parallel (extension of sides)
Square-edged at crown ........................................................................................
0.7
Side- or slope-tapered inlet ..................................................................................
0.2

Section 2 Methodology
2-20
Z:\20790_City_of_Valdosta\70141_SWMP Update Phase 1\Reports\Final_Report_01-14-11\Section2_v3.docx
Table 2.3.2. Exit and In-Pipe Loss Coefficients (CDM 1988)
Description K Inlet to manhole 0.25 Manhole in straight section of closed conduit 0.10 Manhole at a 45 degree bend 0.25 Manhole at a 90 degree bend 0.50 Exit closed conduit to lake 1.00 Exit closed conduit to open channel 0.3-0.5
2.3.4.3 Bridges and Roadway Overflows Bridges are irregular cross-sections that are unique in that if flood stages rise high enough, the cross-section is cut off by the bottom of the roadway (at the lower chord elevation) and the flow regime changes from an open channel with free water surface to a pressurized flow regime. In order to model bridges, the custom shape type conduit has been used in SWMM 5. A custom shape may be any closed conduit shape that can be characterized by depth versus width at multiple depths in the section. From this data a shape curve is used to represent the bridge in SWMM. To validate the use of shape curves for use in simulation of bridge hydraulics, testing and comparison of the SWMM shape curve methodology to the United States Army Corps of Engineers model HEC-RAS was performed.
Due to the high intensity of the design storms, some of the roads in City of Valdosta are expected to be flooded, especially for the 25-, 50-, and 100-yr storms. For this SWMP update, the surveyed road crown elevations, where applicable, were merged with the topographic data to provide a wider, deeper cross-section for flow, in the same manner as channel cross-sections.
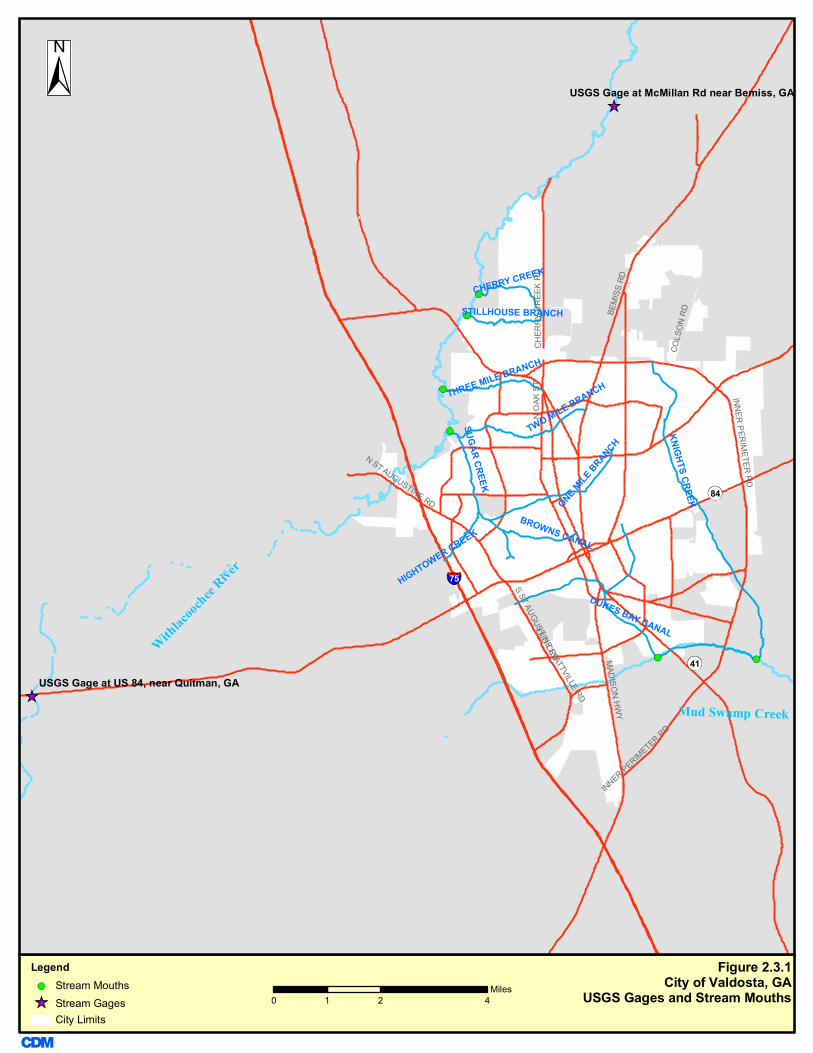
2.3.5 Boundary Conditions Hydrologic boundary conditions are needed in order to simulate the tailwater effects on the streams system. All the streams from the City of Valdosta drain into either the Withlacoochee River in the west or Mud Swamp Creek in the south. Sugar Creek, Two Mile Branch, Three Mile Branch, Cherry Creek and Stillhouse Branch discharge into the Withlacoochee River. Dukes Bay Canal and Knights Creek discharge into the Mud Swamp Creek. Different methodology, as explained below, was used to determine boundary conditions existing at Withlacoochee River and Mud Swamp Creek.
2.3.5.1 Withlacoochee River Sugar Creek, Two Mile Branch, Three Mile Branch, Cherry Creek and Stillhouse Branch discharge into the Withlacoochee River. Two USGS stations located along the Withlacoochee River were used to determine the boundary conditions for the streams

Section 2 Methodology
2-21
Z:\20790_City_of_Valdosta\70141_SWMP Update Phase 1\Reports\Final_Report_01-14-11\Section2_v3.docx
discharging to it. See Figure 2.3.1 for the location of the gages as well as the mouths of the creeks. Historical stage and discharge data from these stations were used to estimate stages for the various design storm events using the HEC-SSP statistical software. Linear interpolation between these two stations was used to determine the stage height for the various design storms at the mouth of Sugar Creek, Two Mile Branch, Three Mile Branch, Cherry Creek, and Stillhouse Branch.
For the stormwater model development using SWMM, boundary conditions corresponding to a 1-year storm event as calculated using the method explained above were utilized. The basis of this method is that the joint probability of a big storm event and stage conditions at the Withlacoochee River being high at the same time is low. However, the SWMM results tables in Appendix B, water surface elevations due to high stages at Withlacoochee River for the various design storm events, have been presented and highlighted.
2.3.5.2 Mud Creek Swamp For Dukes Bay Canal and Knights Creek discharging into the Mud Swamp, there were not enough USGS data available to estimate stages for the various design storms. Therefore, the FEMA - FIS of September 2008 was used to obtain boundary elevations at the confluences of these creeks with Mud Swamp. The FIS provided elevations for the FEMA defined flood events of 10, 50, 100 and 500 years. Boundary conditions for the 1.2-inch, 5-year, and 25-years storms were extrapolated from the FEMA data. For the 1.2-inch storm, the extrapolated 1-year stillwater elevation at Mud Swamp Creek was used. See Table 2.3.3 for the boundary condition elevations for various design storms.
Table 2.3.3. Boundary Stage Elevations for Various Design Storm Events
a Italics denote data extrapolated from FEMA FIS (Sept. 2008)
Boundary Conditions for Various Flood Events (feet)
Stream 1.2-in 5-Year 10-Year 25-Year 50-Year 100-Year
Sugar Creek 111 128 130 133 137 140
Two Mile Branch 111 128 130 133 137 140
Three Mile Branch 114 131 134 136 140 144
Cherry Creek 119 135 138 140 144 148
Stillhouse Branch 118 134 137 139 143 147
Dukes Bay Canala 162.6 163.6 164 164.5 165 166
Knights Creek - - 156 - 157 158
CHER
RY C
REEK
RD
BEMI
SS RD
COLS
ON R
D
N OA
K ST
INNER PERIMETER RD
N ST AUGUSTINE RD
S ST AUGUSTINE RDOLD CLYATTVILLE RD
MADISON HWY
INNER PERIMETER RD Railro
adWithlaco
ochee R
iver
Mud Swamp Creek
CHERRY CREEK
STILLHOUSE BRANCH
DUKES BAY CANAL
ONE MILE BRANCH
BROWNS CANAL
HIGHTOWER CREEK
SUGAR CREEK
THREE MILE BRANCH
TWO MILE BRANCH
KNIGHTS CREEK 84
41
41
75
USGS Gage at US 84, near Quitman, GA
USGS Gage at McMillan Rd near Bemiss, GA
LegendStream MouthsStream GagesCity Limits
Figure 2.3.1City of Valdosta, GA
USGS Gages and Stream Mouths0 2 41Miles

Section 2 Methodology
2-23
Z:\20790_City_of_Valdosta\70141_SWMP Update Phase 1\Reports\Final_Report_01-14-11\Section2_v3.docx
2.3.6 Model Calibration/Verification Calibration and verification are desirable to validate predicted stages, flows, and velocities. For calibration or verification, data must be available in the form of rainfall, stage, flow, and/or high water marks for specific storm events, land use, and hydraulic conditions.
2.4 Water Quality Parameters 2.4.1 Total Suspended Solids (TSS) Reduction Goal and TSS Evaluation Yearly TSS loads were calculated based on Event Mean Concentrations (EMCs) of TSS, yearly rainfall, tributary area; land use characteristics like percent imperviousness for Valdosta, GA.
CDM reviewed the EMCs for TSS from Georgia specific sources and studies namely Big Creek Study in Fulton County, GA, 2000 and Watershed Management Manual, Atlanta Regional Commission, 1998. However upon calculation of TSS loads using these values and discussions with City of Valdosta’s stormwater management staff regarding sediment loads generated and subsequent sediment dredging carried out at city’s various stormwater facilities, it was determined that EMCs from H.H. Harper’s study - Stormwater Loading Rate Parameters for Central and South Florida (Revised), ERD, 1994 were found suitable to be used in Valdosta. Yearly TSS loads from various hydrologic units for each sub-basin were computed in lbs/year units.
Georgia Stormwater Manual’s approach is to require treatment of the Water Quality treatment volume (WQV) from a site to reduce post-development TSS loadings by 80 percent, as measured on an average annual basis. The Georgia Stormwater Manual states the sizing criteria for any stormwater control/mitigation system to treat the runoff from 85 percent of the storms that occur in an average year. For Georgia, this equates to providing water quality treatment for the runoff resulting from a rainfall depth of 1.2 inches. This runoff is also termed as the WQV. Please refer to Georgia Stormwater Manual Volume 2 (technical handbook) Section 1.3 for a detailed discussion on WQV and the unified stormwater sizing criteria.
At most of the locations suitable for providing stormwater control by construction of a Regional Stormwater Facility (RSF) in the City of Valdosta, this 80 percent TSS removal criterion calls for extremely large facilities. Limited by the size and location of the RSFs, CDM has proposed most appropriately sized facilities at the locations to achieve maximum benefit in terms of TSS removal and flood control.
To determine the TSS removal efficiency of the RSFs not meeting the sizing criteria based on the Georgia Stormwater Manual, CDM used an average method, where TSS removal efficiencies were calculated using three methods and defining the final removal efficiency as the average of the three. The steps involved are explained below.

Section 2 Methodology
2-24
Z:\20790_City_of_Valdosta\70141_SWMP Update Phase 1\Reports\Final_Report_01-14-11\Section2_v3.docx
1. Assuming 80 percent of “fully treated” area. For example, the Patterson Street RSF has a permanent pool volume of 12.1 ac-ft and the WQV according to Georgia Stormwater Manual is 69.8 ac-ft, so the estimated removal is 80% X 12.1/69.8 = 14%.
2. Solids Settling Method (Driscoll 1985): Used curves by Driscoll (1985) relating
TSS removal to the ratio of permanent pool volume (VB) to runoff volume from average event (VR). VB (in units of inches over the tributary area) is calculated based on the permanent pool volume and the tributary area. VR is calculated based on the runoff coefficient, annual rainfall, and number of events per year. The number of events per year was set at 96.
3. For the method discussed in Step 2, curves tend to be a bit optimistic as they
reach efficiencies over 90 percent for larger ponds, whereas 80 percent TSS removal efficiency may be more reasonable. So a third estimated value is calculated as 80 percent of the value estimated for method 2.
4. Final efficiency used for TSS removal: Average of efficiencies estimated by
methods 1 through 3. This method of calculating TSS removal rates has been used for proposed RSFs which would receive direct flows from tributary areas for treatment and where no diversion of the stream channel flow is necessary.
For the RSFs where a diversion structure has been proposed to divert flows from the stream to the facility for treatment and post treatment, the flows join the stream downstream; a flow percent capture has been calculated. SWMM flow hydrographs for the Georgia water quality storm event of 1.2 inches and 24-hr duration were used to determine the percent flow capture of a 1.2 inch event by a RSF. Based on this percent flow capture, the residence time for the RSF was calculated. Using the Driscoll (1985) method for TSS removal efficiencies as described in bullet 2 above, removal efficiency was calculated.
Some proposed RSFs meet the Georgia Stormwater Manual sizing criteria based on WQV. For such facilities, 80 percent TSS removal efficiency has been used.
2.4.2 Channel Bank Erosion Evaluation SWMM results for channel velocities were used to determine locations of high velocities. Channels with high velocities are more susceptible to erosion. Such findings were verified in the field to locate evidence of channel erosion. Depending on the soils and slopes in each of the sub-basins, a threshold velocity was established. Stream sections having velocities greater than the threshold velocity were noted as channels having erosive velocities and therefore under bank erosion. For Sugar Creek, Hightower Creek, Browns Canal, One Mile Branch, Three Mile Branch, Cherry Creek and Stillhouse Branch, all channel sections with velocities greater than 3 feet per

Section 2 Methodology
2-25
Z:\20790_City_of_Valdosta\70141_SWMP Update Phase 1\Reports\Final_Report_01-14-11\Section2_v3.docx
second (ft/sec) for a 1.2-inch storm event were considered to have erosive velocities. For Two Mile Branch and Dukes Bay Canal, a velocity of 5 ft/sec was used as the threshold velocity.
Total stream lengths in linear feet have been estimated for each sub-basin with erosive velocities. These lengths are presented in Section 4 and Section 5.
2.5 Alternatives Evaluation The process of Alternative evaluation in each sub-basin for the Alternative projects proposed in Section 4 and Section 5 of this report involved several steps. Alternatives were suggested and evaluated on the basis of the maximum benefit they provided. To quantify the benefits, the following steps were undertaken.
First the areas with problems were identified. These problems included flooding of houses, structures, roads, and erosion issues. Intensity and frequency of such flooding issues were considered. Sources and causes of flooding such as insufficient drainage, conveyance issues, undersized culverts or streams flooding were also identified. CDM obtained the Residents Questionnaire survey results and geo-referenced it to see flooding complaints throughout the city. Second, field investigations were carried out to locate areas of stream bank erosion. The geomorphologic assessment report also enlisted all areas in Sugar Creek sub-basin with erosion issues. Falling trees, threat to existing structures, sewer lines, and general infrastructure due to such erosion issues were also identified. SWMM results were used to locate stream sections with high and erosive velocities. Third, alternative projects that can provide retrofit treatment to areas with no prior stormwater treatment and control measures were identified. Last, alternative projects that can potentially be developed as recreational facilities along with providing benefits in terms of flood control, total suspended solid (TSS) removal, and erosion control were identified. Section 2.5.4 discusses in detail how benefits were quantified and how the projects were evaluated, prioritized and ranked on the basis of the benefits provided.
All the alternatives evaluations performed in Section 4.0 and Section 5.0 are preliminary and should not be used as a basis of design. These are for descriptive and benefits quantifying purposes. Safety, design standards, and normal operation procedures have not been considered. Additionally, geotechnical, survey, structural analysis and any remediation needs have not been included. These components should be considered before implementing any of the alternative projects. The alternatives with water quantity and flood control benefits were modeled and the water surface elevation reductions were tabulated. In addition to these Alternative Projects proposed in Sections 4 and 5, some early out projects were recommended by CDM to the City during the beginning phases of this project. Appendix G has the list of these early out projects.

Section 2 Methodology
2-26
Z:\20790_City_of_Valdosta\70141_SWMP Update Phase 1\Reports\Final_Report_01-14-11\Section2_v3.docx
2.5.1 Level of Service In order to establish a stormwater program, and to fairly assess the benefits of proposed projects, it is necessary to identify specific goals. These goals, or levels of service, are specific to each community. During the first phase of this stormwater master plan, the City identified a stormwater committee that represented community stakeholders and City staff. CDM organized a series of monthly meetings to discuss the specific local concerns regarding stormwater quantity and quality.
During the meetings, CDM presented to the committee examples of Levels of Service from other communities, as well as examples of the impact to the City economic development and protection of water resources. In April 2010 the Committee reached an agreement, and proposed the following for consideration of the City Council:
Arterial and Collector Roads shall have less than 0.5 ft of street flooding for the 50-year storm (8.4 inches in 24 hours).
Local Roads shall have less than 0.5 ft of street flooding for the 5-year storm (5.5 inches in 24 hours).
New structures shall be built at least 2 feet above the 100-year flood elevation.
Onsite Storage/Treatment: Urban development shall retain on-site the 25-year/24-hour pre-condition volume. One exception to this rule is Cherry Creek, since most of its upstream tributary area is outside City limits.
Detailed information regarding the topics discussed during the stormwater committee meetings is included in Appendix F.
2.5.2 Construction Costs For each one of the proposed alternatives, CDM provided a conceptual opinion of construction costs based on recent projects completed in the southeast with similar components as the ones included in this report. The costs are provided in 2010 dollars, and should be adjusted in the future based on average inflation rates.
The estimated costs do not include remediation or cleanup costs related to existing sediment contamination. Relocation of existing utilities different than stormwater is also excluded from the cost estimates. Contractor’s overhead and profit and design contingencies are included in the contingency costs for each alternative. For a majority of the alternative projects proposed, this contingency is calculated at 30 percent of the total construction costs. Depending on the complexity of the project, 15 to 25 percent of the total cost plus the contingency costs is estimated as the engineering, surveying and permitting cost and has been added to the conceptual cost estimates for each project.

Section 2 Methodology
2-27
Z:\20790_City_of_Valdosta\70141_SWMP Update Phase 1\Reports\Final_Report_01-14-11\Section2_v3.docx
Several of the proposed alternatives involved replacing or upgrading a culvert. In such cases, the costs include the maintenance of traffic, installation, and roadway reconstruction costs. Land acquisition costs have been included at $30,000 to $50,000 per acre depending on the location. Alternatives proposed on City-owned land have no cost for land acquisition.
Very often the work proposed in this report involves construction in the stream channel, due to the lack of open spaces to retrofit existing urban developments. In order to have staff and material in the main channel it is vital to consider dewatering costs, which can add up to a significant portion of the construction projects. Detailed itemized costs for each component of the project have been included in Section 4.0 and Section 5.0 along with each project’s description.
In some cases, as part of the alternative evaluation, projects have been proposed in Section 4.0 and Section 5.0 that have a component of developing the stormwater facility and its surrounding area to be converted into a recreational area for citizens. These projects have been identified on the basis of the location and potential to be utilized as a recreational facility. However, cost estimates for any such development have not been included in the total costs estimates of these alternative projects. CDM realizes that on the basis of past projects in Georgia and Florida, the costs of adding a recreational component to a RSF may be high. Due diligence needs to be performed when considering whether to develop any facility for recreational purposes.
2.5.3 Operation and Maintenance Costs The addition of a new stormwater facility requires additional maintenance that should be considered at the planning phase to allow the Stormwater Division to properly fund future activities. For each one of the alternatives evaluated, CDM estimated the operation and maintenance costs for a period of 30 years, to account for routine maintenance as well as special rehabilitation activities. An important point to note is that the source of funding for the Operation and Maintenance (O&M) activities mentioned below is the Stormwater Utility Fee the City charges its residents. However, the source of funding for the Capital Improvement Projects (CIPs) suggested in Section 4 and Section 5 is Special Purpose Local Option Sales Tax (SPLOST).
Wet Detention Pond Mowing: Currently the City has several contracts to mow and maintain wet detention ponds, and the recent invoices average $5,340 per year per pond. An existing average pond in Valdosta is 1.3 acres. Larger communities have achieved lower mowing costs by contracting a higher number of facilities to the same contractor. Local mowing costs are higher than those at other communities due to the fact that most existing ponds have a steep bank that requires manual mowing and many facilities are dry and require mowing the entire bottom surface. However, in the proposed alternative projects, some regional stormwater facilities are greater than 1 acre and are proposed to be wet detention facilities. In such cases an adequate slope of side banks 3:1 or 4:1 has been assumed and also a drivable berm of 12-20 feet has been

Section 2 Methodology
2-28
Z:\20790_City_of_Valdosta\70141_SWMP Update Phase 1\Reports\Final_Report_01-14-11\Section2_v3.docx
proposed. For mowing costs of such facilities, CDM assumed $5,000 per acre per year of the buffer area of the stormwater facility. This buffer area includes the berm area as well as the side slopes. For smaller facilities with steeper slopes, an annual cost of $5,000 per facility was considered.
Wet Detention Pond Dredging: In addition to the mowing costs, CDM also considered the amount of sediment buildup that is expected for a facility in an urban environment, assuming a unit cost of $45 per cubic yard of dredged material. When compared with the actual construction cost of the facility, the dredging cost ranges between 5 and 9 percent, depending on factors such as grade slope, directly connected impervious area, and more. Since there is evidence of stream bank erosion in Valdosta, in the case of regional facilities the actual sediment load can increase significantly. CDM proposes to assign 8 percent of the construction cost to future dredging costs, and 15 percent of the construction cost to regional facilities receiving stream flows with high sediment content.
Culvert Crossing Maintenance: Under normal conditions it is anticipated that a culvert needs visual inspection three times per year. One staff member ($20/hr) in one truck ($80/hr) can visually inspect 3 culvert crossings in 1 hour, with an annual cost of $100. In addition to this, a significant cleanup is required when debris and trash blocks the culvert. It is anticipated that this will occur once every 2 years, and that the cleaning process will require 8 hours for 2 staff ($20/hr), 1 truck ($80/hr), and other equipment such as chain saws ($5/hr). Considering the present value, 30 years of maintenance under these conditions equate to about $17,800.
Grade Control Structures: It is anticipated that in order to maintain a grade control structure in operation, it is necessary to dedicate a team of 4 staff ($20/hr), 1 dump truck ($80/hr), during 4 hours. During a 30-year life cycle, this equates to $19,200.
Streambank Maintenance: Based on recent quotes in northeast Florida, the average cost for this activity is $2/year per linear foot of stream bank maintained. Since the field observations have confirmed that in Valdosta the current stream erosion is more severe than in Florida due to steeper channel slopes, CDM used a unit cost of $3/year per linear foot.
Baffle Box Maintenance: Manufacturers suggest very frequent maintenance for these structures, which could be as much as once a week during summer months. CDM considers a more conservative estimate of 1 hour of a vacuum truck and one operator, once a month. Considering 30 years of useful life, this adds up to a present value of $46,800.
2.5.4 Project Ranking CDM ranked projects identified in this master plan according to the highest benefit per cost, to provide the City with a tool to maximize the benefit of limited construction funds.

Section 2 Methodology
2-29
Z:\20790_City_of_Valdosta\70141_SWMP Update Phase 1\Reports\Final_Report_01-14-11\Section2_v3.docx
The methodology used to rank the projects included quantifying the benefits and assigning a weighting factor to the various benefits. The various benefits included:
a. Road flooding LOS – Reducing road flooding to the level of service for its class (local, collector or arterial), into compliance.
b. Structures/buildings flooding - Reducing the number of structures flooding during a 100 year event.
c. Quantity of total suspended solids (TSS) removed per year.
d. Reduction of erosive velocities in the stream sections to below erosive levels.
e. Other/Miscellaneous factors/benefits such as emergency repairs, threat to existing infrastructure, private property protection, erosion and sedimentation control, stream protection, parcels impact, traffic disruption, access easement status, shared funding availability and recreational opportunities were also accounted for.
Each of the benefits mentioned above were quantified on a city-wide basis. The benefits were expressed as a percentage. A weight (percentage) was assigned to each benefit category and a project score was determined by multiplying the weight and benefit percent. The weighing factors for each benefit category were assigned on the basis of the recommendations of the City of Valdosta Stormwater Committee and City staff. Total cost of construction for each project was also determined, and a cost benefit ratio was obtained by dividing the total cost of the project by the project score. The ranks were assigned by arranging the projects in an ascending order of the Cost/Benefit ratios. The projects with greater benefits (higher project score) and lower cost of construction, would have the better Cost/Benefit ratio and a better rank.
Please refer to Section 4 and Section 5 for details on the Alternative Projects proposed in each sub-basin and construction costs for each project. Section 6 lists the project recommendations based on the Project Ranking methodology discussed above. A summary table listing the Project Rank, Project Description, Total Cost, Cost/Benefit and Project ID is presented in Section 6.