Section 1 General Fertilization Concepts€¦P1: SFK/UKS P2: SFK BLBS105-c01 BLBS105-Mischke March...
22
P1: SFK/UKS P2: SFK BLBS105-c01 BLBS105-Mischke March 12, 2012 11:59 Trim: 246mm X 189mm Printer Name: Yet to Come Section 1 General Fertilization Concepts COPYRIGHTED MATERIAL
-
Upload
trinhthien -
Category
Documents
-
view
217 -
download
2
Transcript of Section 1 General Fertilization Concepts€¦P1: SFK/UKS P2: SFK BLBS105-c01 BLBS105-Mischke March...

P1: SFK/UKS P2: SFK
BLBS105-c01 BLBS105-Mischke March 12, 2012 11:59 Trim: 246mm X 189mm Printer Name: Yet to Come
Section 1General Fertilization Concepts
COPYRIG
HTED M
ATERIAL

P1: SFK/UKS P2: SFK
BLBS105-c01 BLBS105-Mischke March 12, 2012 11:59 Trim: 246mm X 189mm Printer Name: Yet to Come

P1: SFK/UKS P2: SFK
BLBS105-c01 BLBS105-Mischke March 12, 2012 11:59 Trim: 246mm X 189mm Printer Name: Yet to Come
Chapter 1Nutrient Cycling
Claude E. Boyd
1.1 INTRODUCTION
Pond fertilization is the practice of adding plant nu-trients to pond water. These additions enhance phy-toplankton growth at the food web base, eventuallyculminating in fish and other aquaculture species.This task is accomplished by applying either chem-ical fertilizer or organic matter such as animal dungand other agricultural wastes. Chemical fertilizersdissolve in pond water increasing nutrient concen-trations and stimulating phytoplankton growth. Or-ganic matter is decomposed by saprophytic microor-ganisms with mineralization of inorganic nutrientsfor use by phytoplankton. Organic matter also maybe a direct organic nutrient source for invertebratefish food organisms, and some fish species feed di-rectly on manure particles. Pond treatment with or-ganic matter actually represents combined fertiliza-tion and feeding.
In this chapter, only inorganic nutrients resultingfrom chemical fertilizer and organic matter applica-tions to ponds will be considered. These nutrientsparticipate in complex biogeochemical cycles, andeffective pond fertilization programs must considerhow these cycles influence fertilizer nutrient avail-ability to phytoplankton.
1.2 PLANT NUTRIENTS
Green plants require numerous inorganic nutrients inrelatively large amounts (macronutrients) or in fairly
small quantities (micronutrients) (Pais and Jones1997). Macronutrients are carbon, oxygen, hydro-gen, nitrogen, phosphorus, sulfur, calcium, magne-sium, and potassium. Sodium is a macronutrient forsome species, and diatoms need a relatively large sil-icon amount. The common micronutrients are iron,manganese, zinc, copper, and molybdenum—someplants also require one or more other elements suchas chloride, boron, and cobalt.
Carbon dioxide enters water from the atmosphereand from microbial organic matter decomposition.Hydrogen and oxygen are available from water.The major nitrogen source is organic nitrogen min-eralization to ammonia nitrogen during microbialorganic matter decomposition. Other nutrients arederived from mineral dissolution. Sources of thesenutrients may be runoff entering ponds followingcontact with minerals in catchment soils, spring orwell water contacting minerals in aquifer forma-tions, and mineral dissolution in pond bottom soil.Seawater and estuarine water used in coastal pondshave high major cation concentrations.
According to Liebig’s Law of the Minimum(Odum 1975), plant growth is limited by the nu-trient present in shortest supply relative to its needby phytoplankton. Phytoplankton and other aquaticplants are limited most commonly by inadequatephosphorus and nitrogen, but in waters of either lowor high alkalinity, a carbon dioxide shortage maylimit plant growth (Boyd 1972). In seawater, it is
Aquaculture Pond Fertilization: Impacts of Nutrient Input on Production, First Edition. Edited by Charles C. Mischke.C© 2012 John Wiley & Sons, Inc. Published 2012 by John Wiley & Sons, Inc.
3

P1: SFK/UKS P2: SFK
BLBS105-c01 BLBS105-Mischke March 12, 2012 11:59 Trim: 246mm X 189mm Printer Name: Yet to Come
4 General Fertilization Concepts
suspected that low iron and manganese concentra-tions may also limit phytoplankton growth (Nadis1998).
Liebig’s Law does not imply that a single nutrientcontrols phytoplankton growth. To illustrate, sup-pose, phosphorus is the most limiting nutrient in apond to which a phosphorus fertilizer applicationis made. After fertilizer application, phytoplanktonabundance will increase in response to the greaterphosphorus concentration until some other nutri-ent becomes limiting. Remaining added phosphoruswill not elicit a growth response until more secondlimiting nutrient is applied. Adding more secondlimiting nutrient could lead to a third nutrient be-coming limiting (Polisini et al. 1970). Thus, Liebig’sLaw applies to multiple limiting nutrients (Fig. 1.1).
Plant response to nutrients also may be con-founded by luxury consumption (Gerloff and Skoog1954, 1957). In luxury consumption, plants absorbmore nutrient than necessary for maximum growth.The excess nutrient is stored in plant cells for lateruse, or in the case of phytoplankton cells, the nu-trient may be passed on to succeeding generationswhen cells divide. The luxury consumption conceptis illustrated in Figure 1.2.
Liebig’s Law was expanded by Shelford’s Law ofTolerance (Odum 1975). This law states there maybe either too little or too much nutrient or other en-vironmental factors as illustrated in Figure 1.3 forlight. In the case of nutrients, some such as copper
Gro
wth
Nutrient concentration
Phosphorus
Phosphorus+ nitrogen +sulfur
Phosphorus+ nitrogen
Figure 1.1. Multiple limiting nutrients andphytoplankton growth.
Luxuryconsumption
Phosphorus concentration in water
Pho
spho
rus
conc
entr
atio
n in
pla
nts
Gro
wth
Growth
P in
pla
nts
Figure 1.2. Luxury consumption ofphosphorus by phytoplankton.
can be limiting to phytoplankton growth at low con-centrations, but be toxic to phytoplankton at higherconcentrations (Boyd and Tucker 1998). In fact, cop-per sulfate is probably the most common algicidein use today. Most nutrients can be toxic at highconcentration, but in ponds, nutrient concentrationsseldom reach toxic levels.
Factors other than nutrients also can limit phy-toplankton growth. Some examples are inadequatelight because of cloudy weather or excessive pondturbidity, low temperature, and low pH.
Water analyses may be used to measure nutri-ent concentrations, but it is difficult to determinewhich nutrients limit phytoplankton growth. In lake
Light intensity
Death Insufficient Optimum Excessive Death
Gro
wth
Figure 1.3. Illustration of Shelford’s Law ofTolerance using effect of light onphytoplankton growth.
P1: SFK/UKS P2: SFK
BLBS105-c01 BLBS105-Mischke March 12, 2012 11:59 Trim: 246mm X 189mm Printer Name: Yet to Come
Nutrient Cycling 5
eutrophication studies, water samples were filteredto remove phytoplankton, aliquots were placed inflasks, nutrients were added singly and in variouscombinations to flasks, flasks were inoculated witha planktonic algal species, and after a few days, thealgal abundance was more in the flasks comparedwith algal abundance in a flask to which no nutrientswere added (Miller et al. 1974; Golterman 1975).Because of its complexity, this procedure is seldomsuitable for determining nutrient requirements forindividual ponds, but it could be used in a studyto assess nutrient limitations in ponds across a re-gion. Results of such a study would reveal the likelylimiting nutrients for ponds in the region.
Experience with pond fertilization in manycountries suggests nitrogen and phosphorus are theonly two nutrients normally needed in fertilizers forfreshwater ponds (Mortimer 1954; Hepher 1962;Hickling 1962; Boyd and Tucker 1998). These twonutrients also are most commonly used in fertilizingponds filled with brackish water or seawater.However, micronutrients are sometimes includedin fertilizers for shrimp ponds. Moreover, becausethey think diatoms are a superior natural food forshrimp, farmers in Central and South America oftenapply silicate fertilizer such as calcium silicate toshrimp ponds.
There is a widespread idea, phosphorus is not asimportant in brackish water and seawater ponds asin freshwater ponds. This has led to frequent useof wide N:P ratios in fertilizers for shrimp pondsin Central and South America. However, a recentreview (Elser et al. 2007), suggested nitrogen andphosphorus limitation of freshwater, marine, and ter-restrial ecosystems are similar.
Another common idea about nutrient ratios in fer-tilizer originates in the observation of the averagemolecular ratio of carbon, nitrogen, and phospho-rus in marine phytoplankton of 106:16:1 (weight ra-tio = 41:7.2:1)—the Redfield ratio (Redfield 1934).Brzezinski (1985) suggested including silicon in theRedfield ratio—the molecular ratio C:Si:N:P for ma-rine phytoplankton is 106:15:16:1 (weight ratio =41:13.6:7.2:1). The Redfield ratio suggests phyto-plankton need nitrogen and phosphorus in roughly a7:1 ratio, and it is often recommended that pond fer-tilizers for freshwater and saline water ponds shouldcontain nitrogen and phosphorus in this ratio. How-
ever, several factors influence the fate of nitrogen andphosphorus added to ponds in fertilizers, and addingnitrogen and phosphorus in fertilizers according tothe Redfield ratio does not assure the same ratio ofthe two nutrients in pond water.
1.2.1 Phosphorus
Forms in Water
There are several phosphorus forms in water; themost common are: (1) soluble inorganic phospho-rus, (2) soluble organic phosphorus, (3) phospho-rus in particulate organic matter (living planktonor detritus), and (4) phosphorus adsorbed on sus-pended mineral particles. Soluble inorganic phos-phorus is an ionization product of orthophosphoricacid (H3PO4):
H3PO4 = H+ + H2PO4− K = 10−2.13
H2PO4− = H+ + HPO4
2− K = 10−7.21
HPO42− = H+ + PO4
3− K = 10−12.36
Pond water pH is usually between 6 and 9, and themost common soluble inorganic phosphorus formsare H2PO4
− and HPO4−. These two ion proportions
are equal at pH 7.21—at lower pH, H2PO4− is dom-
inant and at higher pH, HPO4− is more abundant.
All soluble phosphorus in water is not in inorganicform; some associated with soluble organic com-pounds. The most common way of estimating plant-available phosphorus in water is to measure solu-ble reactive phosphorus (SRP) concentration (Eatonet al. 2005). This test measures all soluble inorganicphosphorus, but it also measures some soluble or-ganic phosphorus. Soluble organic phosphorus is notavailable to phytoplankton until it is mineralized tophosphate by microbial activity.
The other common phosphorus measurement isfor total phosphorus. For practical purposes, theSRP concentration subtracted from total phosphorusconcentration is a particulate phosphorus concentra-tion estimate. This is not entirely true, because SRPdetermination does not include all soluble organicphosphorus (Eaton et al. 2005).
More detailed analyses required to precisely de-termine soluble organic phosphorus and to sepa-rate particulate organic phosphorus from particulate

P1: SFK/UKS P2: SFK
BLBS105-c01 BLBS105-Mischke March 12, 2012 11:59 Trim: 246mm X 189mm Printer Name: Yet to Come
6 General Fertilization Concepts
inorganic phosphorus are seldom done with regardsto pond fertilization.
Forms in Pond Soil
Phosphorus occurs in soils in a variety of iron, alu-minum, and calcium phosphate compounds (Brady2002). Representative iron and aluminum phos-phates and their dissolution equations are shown asfollows:
AlPO4 · 2H2O + 2H+ = Al3+ + H2PO42−
+ 2H2O K = 10−2.5
FePO4 · 2H2O + 2H+ = Fe3+ + H2PO42−
+ 2H2O K = 10−6.85
Iron and aluminum oxides in soil also can adsorbphosphorus as follows:
Al(OH)3 + H2PO4− = Al(OH)2H2PO4 + OH−
FeOOH + H2PO4− = Fe(OH)2PO4 + OH−
Iron and aluminum phosphate compound solubil-ity increases with decreasing pH as illustrated inFigure 1.4 for AlPO4·2H2O. Nevertheless, even at apH 5, phosphorus solubility from this compound atequilibrium is only 0.017 mg/L.
Highly leached, acidic soils usually containlarge amounts of iron and aluminum oxides andhydroxides (Lal and Sanchez 1992). Two examplesof such minerals and their dissolution equations areas follows:
Al(OH)3 + 3H+ = Al3+ + 3H2O K = 109
Fe(OH)3 + 3H+ = Fe3+ + 3H2O K = 10−3.54
Iron and aluminum oxides and hydroxides sol-ubility increase with decreasing pH. Phosphateadded to acidic soils will precipitate quickly andbe fixed as highly insoluble iron and aluminumphosphate—especially as aluminum phosphate, be-cause Al(OH)3 is more than five orders of magnitudemore soluble than Fe(OH)3 at the same pH (Boyd1995). The role of Al(OH)3 in controlling phos-phorus concentration in acidic soil is illustrated inExample 1.1.
Phosphate adsorption by iron and aluminum ox-ides and hydroxides decreases with decreasing pH.However, this phenomenon does not diminish phos-phate precipitation as illustrated in Example 1.1.
AIPO4.2H2O
20
10
0
5 6 7
Ca5(PO4)3OH10
Pho
spho
rus
(µg/
L)
5
0
7 8
pH
9
Figure 1.4. Concentration of phosphorus atequilibrium between waters of different pHand aluminum phosphate (AlPO4·2H2O) andcalcium phosphate [Ca5(PO4)3OH].
Example 1.1. Concentration of phosphate inequilibrium with Al(OH)3:
Highly soluble monocalcium phosphate,Ca(H2PO4) is dissolved in water of pH 6 togive a solution 1 mg/L in phosphorus. A few gramssolid phase Al(OH)3 are added to the flask. Thephosphorus concentration remaining in the water atequilibrium will be calculated.
Solution
The Al(OH)3 will dissolve as follows:
Al3+
(H+)3= 109
(Al3+) = (10−6)3(109) = 10−9 M
Al3+ will react with phosphate to formAlHPO4·2H2O, and as Al3+ is precipitated in the re-action, more Al(OH)3 will dissolve so AlPO4·2H2O
P1: SFK/UKS P2: SFK
BLBS105-c01 BLBS105-Mischke March 12, 2012 11:59 Trim: 246mm X 189mm Printer Name: Yet to Come
Nutrient Cycling 7
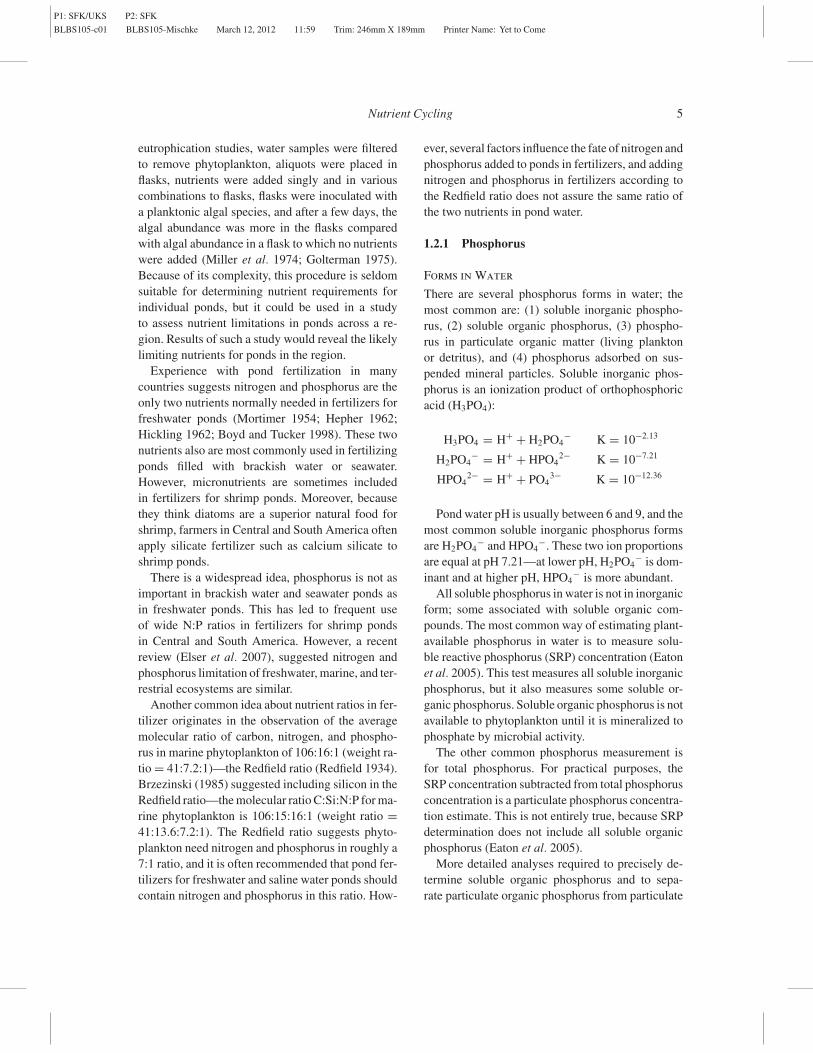
will continue to precipitate. At equilibrium, thephosphorus concentration will be:
(Al3+)(H2PO4−)
(H+)2= 10−2.5
(H2PO4−) = (10−6)2(10−2.5)
(10−9)= 10−14.5
(10−9)= 10−5.5M
(3.16 × 10⁻⁶ M)(30.98 g P/mole)(10−3)
= 0.032 mg P/L
Calcium phosphate compounds are found in neu-tral and basic soils (Brady 2002). The most stablecalcium phosphate compound is the mineral apatitethat occurs in several forms. A representative form,hydroxyapatite, and its dissolution equation are asfollow:
Ca5(PO4)3OH + 7H+ = 5Ca2+ + 3H2PO4− + H2O
K = 1014.46
At the same calcium concentration, phosphorussolubility from hydroxyapatite is low at pH 7 anddecreases with increasing pH (Fig. 1.4). At the samepH, phosphorus concentration will decrease withgreater calcium concentration.
Calculations for preparing Figure 1.4 were basedon the equilibrium constant for pure, crystalline alu-minum and calcium phosphate forms. In pond wa-ters, amorphous aluminum and calcium phosphateforms precipitate. These forms gradually transformto crystalline form, but amorphous forms are moresoluble than crystalline forms (Bennett and Adams1976). Thus, phosphate solubility in water is some-what greater than indicated in Figure 1.4. Concen-trations at equilibrium with amorphous forms, nev-ertheless, will be quite low.
At pH 6.5–7, Al3+, Fe3+, and Ca2+ concentrationsare lowest. Thus, phosphate solubility from mineralsin pond soil will be greatest in this pH range. Putanother way, the tendency for phosphate applied infertilizer to be bound in soil as iron, aluminum, andcalcium phosphates will be lowest at pH 6.5–7.0.Nevertheless, even though bottom soil might have apH 6.5–7.0, most phosphate applied to such pondsin fertilizer will be sequestered in sediment (Masudaand Boyd 1994a).
Phytoplankton absorbs phosphorus, and some ofthis phosphorus is transferred through the food web
to zooplankton, fish, and other organisms. Whenthese organisms die, they settle to the pond bottomand become organic matter containing phosphorus.Thus, pond bottom soils contain organic phospho-rus, but no references to typical concentration rangescould be found. The upper, 20-cm sediment layer inponds at the E. W. Shell Fisheries Center at AuburnUniversity has a dry bulk density 1500 kg/m3 and2% organic matter (Munsiri et al. 1995). If organicmatter phosphorus concentration is about the sameas for dead plankton (around 0.5%), then soil wouldcontain about 100 mg/kg P bound in organic matter.
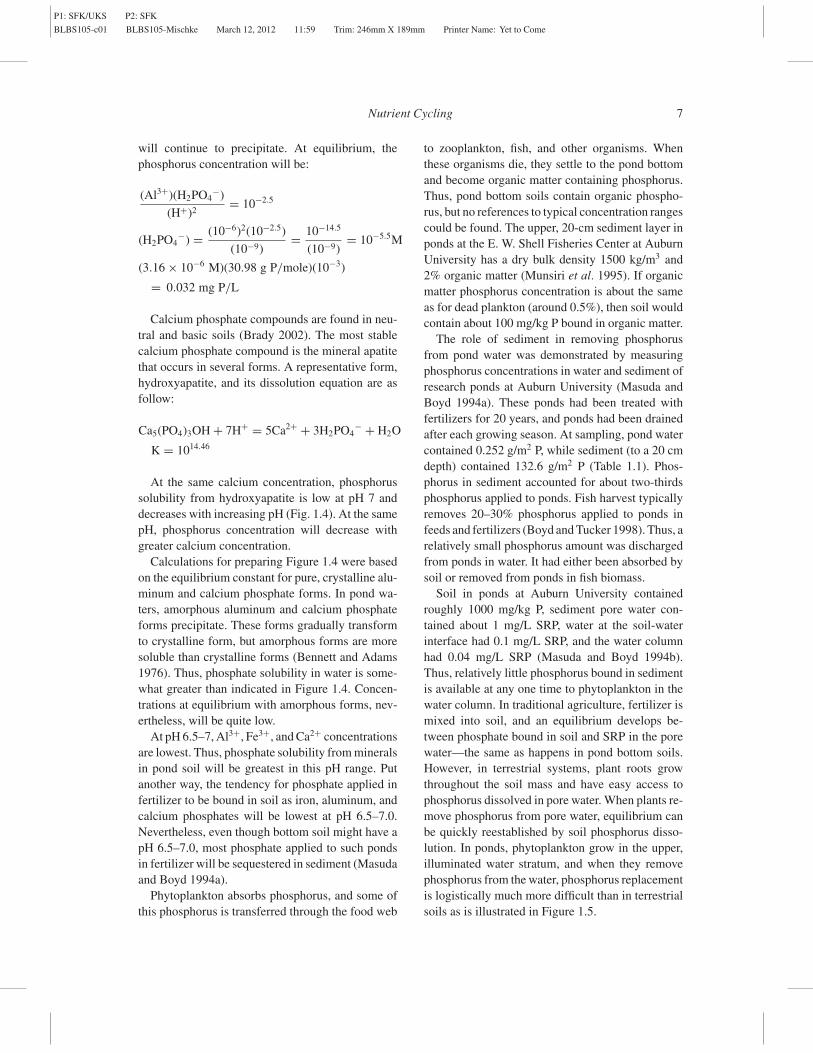
The role of sediment in removing phosphorusfrom pond water was demonstrated by measuringphosphorus concentrations in water and sediment ofresearch ponds at Auburn University (Masuda andBoyd 1994a). These ponds had been treated withfertilizers for 20 years, and ponds had been drainedafter each growing season. At sampling, pond watercontained 0.252 g/m2 P, while sediment (to a 20 cmdepth) contained 132.6 g/m2 P (Table 1.1). Phos-phorus in sediment accounted for about two-thirdsphosphorus applied to ponds. Fish harvest typicallyremoves 20–30% phosphorus applied to ponds infeeds and fertilizers (Boyd and Tucker 1998). Thus, arelatively small phosphorus amount was dischargedfrom ponds in water. It had either been absorbed bysoil or removed from ponds in fish biomass.
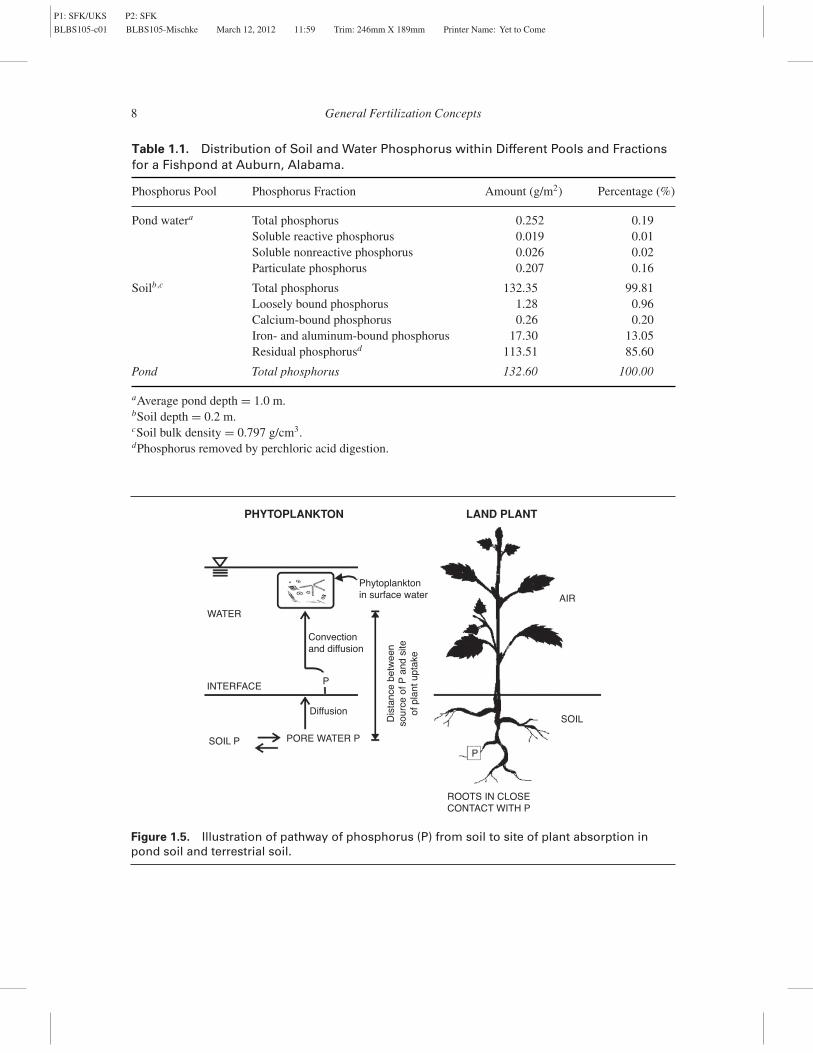
Soil in ponds at Auburn University containedroughly 1000 mg/kg P, sediment pore water con-tained about 1 mg/L SRP, water at the soil-waterinterface had 0.1 mg/L SRP, and the water columnhad 0.04 mg/L SRP (Masuda and Boyd 1994b).Thus, relatively little phosphorus bound in sedimentis available at any one time to phytoplankton in thewater column. In traditional agriculture, fertilizer ismixed into soil, and an equilibrium develops be-tween phosphate bound in soil and SRP in the porewater—the same as happens in pond bottom soils.However, in terrestrial systems, plant roots growthroughout the soil mass and have easy access tophosphorus dissolved in pore water. When plants re-move phosphorus from pore water, equilibrium canbe quickly reestablished by soil phosphorus disso-lution. In ponds, phytoplankton grow in the upper,illuminated water stratum, and when they removephosphorus from the water, phosphorus replacementis logistically much more difficult than in terrestrialsoils as is illustrated in Figure 1.5.
P1: SFK/UKS P2: SFK
BLBS105-c01 BLBS105-Mischke March 12, 2012 11:59 Trim: 246mm X 189mm Printer Name: Yet to Come
8 General Fertilization Concepts
Table 1.1. Distribution of Soil and Water Phosphorus within Different Pools and Fractionsfor a Fishpond at Auburn, Alabama.
Phosphorus Pool Phosphorus Fraction Amount (g/m2) Percentage (%)
Pond watera Total phosphorus 0.252 0.19Soluble reactive phosphorus 0.019 0.01Soluble nonreactive phosphorus 0.026 0.02Particulate phosphorus 0.207 0.16
Soilb ,c Total phosphorus 132.35 99.81Loosely bound phosphorus 1.28 0.96Calcium-bound phosphorus 0.26 0.20Iron- and aluminum-bound phosphorus 17.30 13.05Residual phosphorusd 113.51 85.60
Pond Total phosphorus 132.60 100.00
aAverage pond depth = 1.0 m.bSoil depth = 0.2 m.cSoil bulk density = 0.797 g/cm3.dPhosphorus removed by perchloric acid digestion.
WATER
PHYTOPLANKTON LAND PLANT
INTERFACE
SOIL P PORE WATER P
Diffusion
P
P
ROOTS IN CLOSECONTACT WITH P
Dis
tanc
e be
twee
nso
urce
of P
and
site
of p
lant
upt
ake
Phytoplanktonin surface water AIR
SOIL
Convectionand diffusion
Figure 1.5. Illustration of pathway of phosphorus (P) from soil to site of plant absorption inpond soil and terrestrial soil.

P1: SFK/UKS P2: SFK
BLBS105-c01 BLBS105-Mischke March 12, 2012 11:59 Trim: 246mm X 189mm Printer Name: Yet to Come
Nutrient Cycling 9
When phosphorus fertilizer is applied to a pond,phytoplankton quickly remove some applied phos-phorus, but most is usually adsorbed by sediment(Boyd et al. 1980). Soluble phosphorus concentra-tions reach pretreatment concentrations within a fewdays (Fig. 1.6). Moreover, when phytoplankton die,settle to the bottom, and are decomposed, phos-phorus contained in them is quickly adsorbed bysediment.
Granular phosphorus fertilizers such as triple su-perphosphate and ammonium phosphates used forpond fertilization do not dissolve quickly while set-tling through the water column (Boyd 1981). Ifbroadcast over the water surface, granules mainlydissolve after settling to the pond bottom, and phos-phorus is quickly adsorbed by pond soil. Granularfertilizers should first be mixed in a bucket of waterand allowed to dissolve for 30 minutes to 1 hour be-fore being splashed over the pond surface. By doingthis, a greater phosphorus proportion will dissolve inthe water column increasing opportunity for phos-phorus absorption by phytoplankton (Boyd 1981).Because of their high density (≈1.4 g/mL), liquidfertilizers also should be premixed with water andapplied over the pond surface (Boyd and Hollerman1981).
As frequently recommended, but seldom used, analternative to predissolving granular fertilizers is toapply them on an underwater platform (Fig. 1.7).
Total phosphorus0.5
0.4
0.3
0.2
0.1
0.0J J A S O N
Pho
spho
rus
conc
entr
atio
n (m
g/L)
Particulate phosphorus
Figure 1.6. Average concentrations of totaland particulate phosphorus in two fertilizedfishponds. Vertical arrows indicate fertilizerapplication dates.
20–30 cm Fertilizer
Underwaterplatform
Figure 1.7. Underwater platform for applying fertilizers to ponds.

P1: SFK/UKS P2: SFK
BLBS105-c01 BLBS105-Mischke March 12, 2012 11:59 Trim: 246mm X 189mm Printer Name: Yet to Come
10 General Fertilization Concepts
The fertilizer phosphorus dissolves in water and ismixed throughout the pond by water currents. Usu-ally, one platform is sufficient for 2–3 ha of watersurface area.
Some pond fertilizer vendors offer a highly water-soluble fertilizer containing phosphorus as finelypulverized ammonium or potassium phosphate. Thisfertilizer can be broadcast over pond surfaces, and itwill dissolve before sinking to the bottom (Rushtonand Boyd 2000; Tepe and Boyd 2001). Controlled-release fertilizers can be made by coating fertil-izer granules with a copolymer shell, for example,one product is coated with dicyclopentadiene andglycerol ester (Boyd and Tucker 1998). Water dif-fuses through the shell and fertilizer dissolves inthe moisture inside the shell. Nutrients are gradu-ally released through microscopic pores in the shell.Copolymer is applied in layers; the more layers,the slower the release rate. Initial nutrient releaserate is not great enough to elicit a phytoplanktonbloom. However, if an ordinary fertilizer is used toinitiate the phytoplankton bloom, a single applica-tion of controlled-release fertilizer can maintain aphytoplankton bloom for an entire growing season(Rushton and Boyd 1995; Kastner and Boyd 1996).The main disadvantage to highly water-soluble andcontrolled-release fertilizers is their high cost.
Phosphate fertilizers must be applied to ponds atfairly frequent intervals (usually, every 2–4 weeks)to maintain phytoplankton blooms. Even after yearsof fertilization, phosphorus release from bottomsoils usually is not adequate to maintain phytoplank-ton blooms. For example, an experiment was con-ducted at Auburn University in which fertilizationwas halted in some ponds that had been regularlyfertilized for 15 years (Swingle et al. 1963). Dur-ing the first year without phosphate fertilization,fish production declined to typical levels for un-fertilized ponds. Another study conducted in Israel(Hepher 1966) demonstrated phosphorus releasefrom sediment of fertilized ponds was only about20% of the phosphorus amount needed to maintainenough phytoplankton productivity for desired fishproduction.
Because of strong phosphorus uptake by sedi-ment, water analysis is not a good indicator of phos-phorus that should be applied to ponds in fertilizers.A recent study (Banerjee et al. 2009) demonstrated
pond fertilization rates could be established usingsoil test data for nutrients, but more work is neededto perfect this methodology. At present, the mostreliable technique is to base phosphate fertilizerapplication rates on amounts that have providedgood fish production in previous research. Work atAuburn University (Wudtisin and Boyd 2005) sug-gested periodic applications of about 3 kg P2O5/hawill provide enough phosphorus for good sportfishproduction in ponds that have been limed to neu-tralize soil acidity and provide total alkalinity of30–40 mg/L. Tilapia production about 1000 kg/hawas obtained in ponds at Auburn University treatedwith 9 kg P2O5/ha per application at 2-week inter-vals (Boyd 1976). However, in Israel, pond watercontains much more calcium than ponds at AuburnUniversity, and almost three times as much phospho-rus was needed to obtain similar tilapia production(Hepher 1962).
There are few places in the world where opti-mum fertilizer rates have been determined for ponds,but the nature of the soil and water can providea clue. Ponds with acidic soils that have not beenlimed will require more phosphorus than ponds withacidic soils that have been limed to provide a nearneutral pH. Ponds with soils and waters of basicreaction and high calcium concentration will tendto need more phosphorus than ponds with neutralsoils and moderate calcium concentrations in water.Pond soils with large amounts of iron and aluminumoxides—such as many tropical soils—will tend tostrongly fix phosphorus. Boyd and Munsiri (1996)found the ability of pond soils in Thailand to bindphosphorus increased with increasing clay content.Sandy soils would tend to fix less phosphorus thanclayey soils.
Eren et al. (1977) reported soil P concentrationsincreased over time in fertilized ponds in Israel andsuggested phosphorus application could be loweredin older ponds. Boyd and Munsiri (1996) foundsoils with higher phosphorus concentrations tendedto have higher water-soluble equilibrium concentra-tions. This also suggests phosphorus adsorption bysoil probably will decline as soils accumulate phos-phorus. Nevertheless, most studies have shown pondsoils are a sink for fertilizer phosphorus, and phos-phate must be applied on a regular basis to maintainphytoplankton blooms.

P1: SFK/UKS P2: SFK
BLBS105-c01 BLBS105-Mischke March 12, 2012 11:59 Trim: 246mm X 189mm Printer Name: Yet to Come
Nutrient Cycling 11
Fertilizer
P in plants
P in animals
P in organicmatter andmicrobes
P in outflowand harvestedfish
Inorganic Pin water
InorganicP in soil
P ininflow
Figure 1.8. Phosphorus cycle in a fertilizedpond.
The phosphorus dynamics in fishponds are illus-trated in Figure 1.8.
1.2.2 Nitrogen
Forms in Water
Nitrogen, like phosphorus, occurs in water in severalforms: nitorgen gas (N2), ammonia (NH3), ammo-nium (NH4
+), nitrite (NO2−), nitrate (NO3
−), sol-uble organic nitrogen compounds, and nitrogen inparticulate organic matter. Nitrogen gas concentra-tion is not measured in pond waters, but the con-centration will usually be near saturation (Boyd andTucker 1998). The common procedures for measur-ing ammonia nitrogen do not distinguish betweenNH3 and NH4
+; both are measured together, andresults reported as total ammonia nitrogen (TAN)or ammonia nitrogen (Eaton et al. 2005). Nitriteand nitrate each usually are measured separately.Organic nitrogen is present in soluble and particu-late form, and for pond fertilization purposes, thetwo fractions are not separated. The common wayto measure organic nitrogen in pond water is theKjeldahl nitrogen procedure, one version that mea-sures only organic nitrogen (Eaton et al. 2005).Gross and Boyd (1998) described a method for
measuring total nitrogen—exclusive of N2—that hasbeen used in a few pond fertilization studies. In mostpond fertilization research, analyses have focused onthe plant-available nitrogen forms—ammonia nitro-gen and nitrate nitrogen.
Unionized NH3 is toxic to fish, and the NH3–Nproportion in a sample may be estimated from thefollowing relationship:
NH3 + H2O = NH4+ + OH− K = 10−4.74
Tables giving the proportion of NH3–N to TAN atdifferent water temperatures and pHs are available,for example, see Boyd and Tucker (1998). The NH3
proportion rises with increasing pH, and excessivefertilization with urea or ammonium fertilizers cancause fish toxicity (Boyd et al. 2008). Nitrite also istoxic to fish, but nitrite is not used as a fertilizer, andnatural nitrite sources seldom are elevated enoughto be problematic in fertilized ponds.
Nitrogen fertilizers for ponds include ammoniumand nitrate compounds, urea, and organic matter(Boyd and Tucker 1998). Urea quickly hydrolyzesin water as follows:
CO(NH)2 + H2O −−−−−→Urease
2NH3 + CO2
Organic matter applied as fertilizer is decomposedby saprophytic microorganisms with ammonia nitro-gen release.
Plant Uptake
Phytoplankton and other plants absorb ammoniumand nitrate from water. These ionic nitrogen formsare used by the plant to make amino acids, which areprotein components. To make amino acids, ammo-nia must be combined with organic carbon com-pounds originating from photosynthesis. Thus, ifplants make amino acids using nitrate as the ni-trogen source, nitrate must be reduced to ammonianitrogen via the nitrate reductase pathway (Devlin1969). It is energetically more efficient for plantsto use ammonia rather than nitrate as a nitro-gen source. Nevertheless, most plants, includingphytoplankton, apparently can and do use ammo-nium and nitrate. There is some anecdotal evidencethat, however, brackish water pond fertilization with

P1: SFK/UKS P2: SFK
BLBS105-c01 BLBS105-Mischke March 12, 2012 11:59 Trim: 246mm X 189mm Printer Name: Yet to Come
12 General Fertilization Concepts
nitrate is more effective than fertilization with ureaor ammonium in encouraging diatom production.
Natural Sources
Rainwater contains nitrate because electrical activ-ity oxidizes small amounts of gaseous nitrogen tonitrate, and nitrous oxides from air pollution areoxidized to nitric acid. Rainwater also may con-tain some ammonia resulting from air pollutionand other terrestrial sources (Boyd 2000). Runoffdissolves and suspends nitrogen compounds fromwatersheds before entering ponds. In addition, cer-tain bacteria and blue-green algae species have theability to fix nitrogen. The most well-known nitro-gen fixers in pond waters are blue-green algae ofthe genus Anabaena that contain heterocysts. WhenN-fixing organisms die and decompose, nitrogen inthem is converted to plant-available form. Ammo-nium and nitrate presence will suppress nitrogen fix-ation (Bothe 1982), but nitrogen fixation rates up toabout 60 mg/m2/d have been reported in aquacultureponds (Lin et al. 1988). The nitrogen fixation rateincreases when the N:P ratio is low. At N:P ratiosabove 13, no nitrogen fixation was detected (Findlayet al. 1994).
Organic matter is present in pond sediment re-sulting from organic matter sedimentation enteringponds from watersheds and sedimentation of plank-ton remains (including nitrogen fixing organisms)and other organisms. Sediment organic matter de-composition is an ammonia nitrogen source to thewater column.
Mineralization of Organic Nitrogen
Cycles for carbon and nitrogen are intertwined, andit is not possible to discuss one independently ofthe other. Plants and animals comprise 40–50% car-bon (dry weight basis), but their nitrogen contentmay vary from <1% to >10%, and most nitrogen inbiomass is in protein amino acids (Boyd 1990).
Most animals and bacteria including actino-mycetes, contain 8–12% nitrogen on a dry weightbasis. Higher plants have a large amount of struc-tural material (cellulose, hemicellulose, and lignin);hence, they have lower nitrogen concentrations—usually, about 1–4%. Phytoplankton cells have lessstructural material than found in higher plants, andnitrogen concentration usually is 8–10%. Because
most organisms have similar carbon concentrations,the C:N ratio varies greatly among organisms.
Some organic matter can be decomposed quickerand more completely than others by organisms of de-cay. In general, decomposition rate declines in thefollowing order: sugars and starches > proteins >
cellulose > fats and oils > waxes > hemicellulosesand lignins (Boyd 1995). The protoplasmic fractiondecomposes faster than the structural fraction, andnitrogen is associated mainly with the protoplasmicfraction. Thus, materials with a narrow C:N ratiodecompose faster and more completely than mate-rials with a wide C:N ratio. Moreover, organismsof decay use a portion of the nitrogen from organicresidues to make their biomass, and a narrow C:Nratio favors a greater ammonia nitrogen release tothe environment (nitrogen mineralization) than doesa wide C:N ratio (Boyd 1995). Nitrogen may be re-moved from the environment (immobilized) by mi-croorganisms decomposing a material of wide C:Nratio (see Example 1.2).
Example 1.2. Illustration of mineralization andN immobilization:
Bacteria contain about 50% carbon and 10% ni-trogen, and they convert about 5% organic carbonto carbon in bacterial biomass during decomposi-tion. A highly decomposable organic matter residue(1000 g; 45% C; 1% N) contains 450 g C and 10 g N.The nitrogen amount mineralized during completeresidue decomposition will be calculated.
� 450 g C × 0.05 = 22.5 g bacterial carbon (45 gbacteria)
� 45 g bacteria × 0.1 = 4.5 g bacterial nitrogen� 10 g in residue − 4.5 g bacterial nitrogen =
5.5 g N mineralized.
Suppose residue had only 0.4% nitrogen or 4 gN in 1 kg residue, then residue would contain 0.5 gless nitrogen than needed by the bacteria to quicklydecompose it.
Organic matter decomposition is oversimplifiedin Example 1.2 because all organic residue is as-sumed to decompose. In reality, the most reactiveorganic matter (labile fraction) decomposes within
P1: SFK/UKS P2: SFK
BLBS105-c01 BLBS105-Mischke March 12, 2012 11:59 Trim: 246mm X 189mm Printer Name: Yet to Come
Nutrient Cycling 13
a few weeks or months, while more resistant organicmatter (refractory fraction) decomposes over a muchlonger time (Boyd 1995). The partially decomposedproducts of organic matter, including those fromdead decomposer organisms, and excretions fromdecomposer organisms react to form complex, high-molecular weight compounds known collectively ashumus. The humus fraction is relatively stable anddecomposes at a steady rate over a long time. TheC:N ratio of fresh organic residues may vary greatly,but the C:N ratio in soil that results mainly from thehumus fraction usually is around 8–12 (Brady 2002).
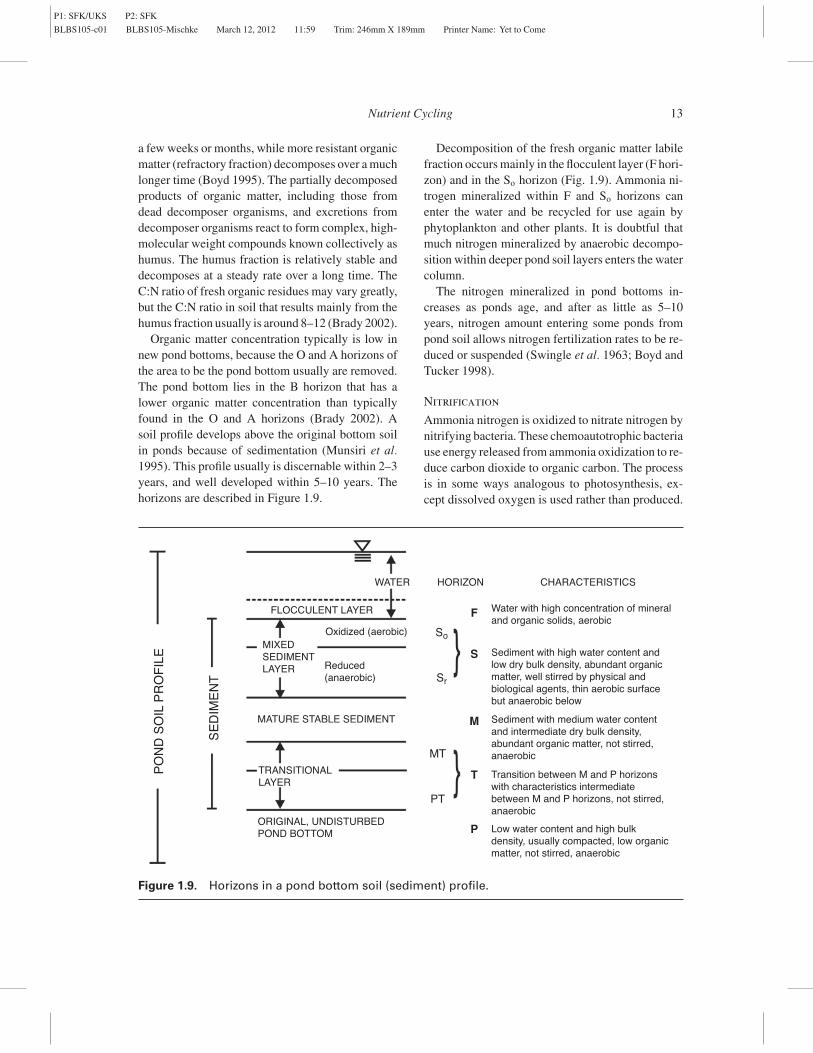
Organic matter concentration typically is low innew pond bottoms, because the O and A horizons ofthe area to be the pond bottom usually are removed.The pond bottom lies in the B horizon that has alower organic matter concentration than typicallyfound in the O and A horizons (Brady 2002). Asoil profile develops above the original bottom soilin ponds because of sedimentation (Munsiri et al.1995). This profile usually is discernable within 2–3years, and well developed within 5–10 years. Thehorizons are described in Figure 1.9.
Decomposition of the fresh organic matter labilefraction occurs mainly in the flocculent layer (F hori-zon) and in the So horizon (Fig. 1.9). Ammonia ni-trogen mineralized within F and So horizons canenter the water and be recycled for use again byphytoplankton and other plants. It is doubtful thatmuch nitrogen mineralized by anaerobic decompo-sition within deeper pond soil layers enters the watercolumn.
The nitrogen mineralized in pond bottoms in-creases as ponds age, and after as little as 5–10years, nitrogen amount entering some ponds frompond soil allows nitrogen fertilization rates to be re-duced or suspended (Swingle et al. 1963; Boyd andTucker 1998).
Nitrification
Ammonia nitrogen is oxidized to nitrate nitrogen bynitrifying bacteria. These chemoautotrophic bacteriause energy released from ammonia oxidization to re-duce carbon dioxide to organic carbon. The processis in some ways analogous to photosynthesis, ex-cept dissolved oxygen is used rather than produced.
WATER
FLOCCULENT LAYER
MIXEDSEDIMENTLAYER
MATURE STABLE SEDIMENT
SE
DIM
EN
T
PO
ND
SO
IL P
RO
FIL
E
TRANSITIONALLAYER
ORIGINAL, UNDISTURBEDPOND BOTTOM
HORIZON
So
F
S
M
T
P
PT
MT
Sr
CHARACTERISTICS
Water with high concentration of mineraland organic solids, aerobic
Sediment with high water content andlow dry bulk density, abundant organicmatter, well stirred by physical andbiological agents, thin aerobic surfacebut anaerobic below
Sediment with medium water contentand intermediate dry bulk density,abundant organic matter, not stirred,anaerobic
Transition between M and P horizonswith characteristics intermediatebetween M and P horizons, not stirred,anaerobic
Low water content and high bulkdensity, usually compacted, low organicmatter, not stirred, anaerobic
Oxidized (aerobic)
Reduced(anaerobic)
Figure 1.9. Horizons in a pond bottom soil (sediment) profile.
P1: SFK/UKS P2: SFK
BLBS105-c01 BLBS105-Mischke March 12, 2012 11:59 Trim: 246mm X 189mm Printer Name: Yet to Come
14 General Fertilization Concepts
Organic carbon yield per unit ammonia nitrogen ox-idized is low; hence, nitrification is not a significantorganic carbon source.
The nitrification process occurs in two steps. In thefirst step, Nitrosomonas bacteria oxidize ammonianitrogen to nitrite:
NH4 + 1.5O2 → NO2− + 2H+ + H2O
In the second step, Nitrobacter bacteria oxidizenitrite to nitrate:
NO2− + 0.5O2 → NO3
−
The combined equation for nitrification is:
NH4+ + 2O2 → NO3
− + 2H+ + 2H2O
Nitrification requires dissolved oxygen—4.57 mgoxygen for 1 mg/L ammonia nitrogen oxidized to ni-trate. Thus, nitrification occurs only in the water col-umn and in the soil F and So horizons. Nitrificationrate may be considerable—amounts of nitrate nitro-gen production by this process have been reportedto reach 0.5 mg/L/d or more in ponds (Hargreaves1998).
Nitrification is an acidic reaction because the hy-drogen ion produced in this process neutralizes al-kalinity. The hydrogen ion resulting from oxidiza-tion of 1 mg/L ammonia nitrogen will neutralize7.14 mg/L total alkalinity (reported as equivalentCaCO3). It follows ammonium-based nitrogen fer-tilizers and urea that hydrolyze to release ammoniathat will have an acidic reaction—they are calledacid-forming fertilizers.
Denitrification
Certain bacteria, called denitrifying bacteria, can useoxygen from nitrate and nitrite as a substitute formolecular oxygen in respiration (organic matter ox-idation). Nitrate and nitrite are reduced to gaseousform, usually N2, but N2O or NH3 also may be den-itrification end products (Metting 1993). The equa-tion most commonly used to describe denitrifica-tion uses nitrate as the oxygen source, methanol
as the carbon source, and N2 as the resultingnitrogenous gas:
6NO3− + 5CH3OH → 5CO2 + 3N2 ↑ +7H2O
+ 6OH−
Of course, organic carbon sources other thanmethanol usually are present in pond soils andwaters.
Denitrification occurs only in the absence ofmolecular oxygen, so it is restricted to thehypolimnion of stratified, eutrophic water bodies orthe anaerobic sediment layer. Gases resulting fromthis process diffuse into the air, but ammonia pro-duced in denitrification is in equilibrium with am-monium remaining in water.
Denitrification is an important process in aquacul-ture ponds, because it removes considerable nitrogen(Hargreaves 1998). Denitrification rates measured inchannel catfish ponds at Auburn University averaged38 mg N/m2/d during summer—equal to a nitrogenloss of 11.48 kg N/ha or about 20% nitrogen inputin feed (Gross et al. 2000). Fertilized ponds usuallyhave much lower nitrogen inputs than channel cat-fish ponds, but the percentage fertilizer nitrogen lossthrough denitrification is likely similar.
Hydroxyl ion from denitrification can react withcarbon dioxide to form bicarbonate (a contributor toalkalinity) as follows:
OH− + CO2− = HCO3
−
Thus, denitrification is a basic reaction. If nitrifi-cation and denitrification are perfectly linked, that is,nitrate for denitrification originated in nitrification,the denitrification process could only restore half thealkalinity consumed in nitrification. This is true be-cause each mole of ammonia nitrogen oxidized in ni-trification results in 2 mol of hydrogen ion, whereasdenitrification produces only 1 mol of hydroxyl ionfor each mole of nitrate nitrogen reduced.
Ammonia Volatilization
Ammonia in water diffuses into the air. The rate thisprocess occurs increases in response to greater wa-ter temperature, TAN concentration, surface waterpH, and turbulence caused by wind or other factors
P1: SFK/UKS P2: SFK
BLBS105-c01 BLBS105-Mischke March 12, 2012 11:59 Trim: 246mm X 189mm Printer Name: Yet to Come
Nutrient Cycling 15
(Hargreaves 1998; Boyd 2000). Gross et al. (1999)reported ammonia volatilization rates 9–71 mgN/m2/d from ponds at the E.W. Shell FisheriesCenter at Auburn University. The greatest rates werereported for ponds with TAN concentrations 4 or5 mg/L on windy days when pH was >8.5 and wa-ter temperature >25◦C. The lowest reported rateof 9 mg N/m2/d is equal to an ammonia diffusionloss of 2.7 kg N/ha in 1 month. Thus, ammoniavolatilization represents an important nitrogen lossfrom aquaculture ponds.
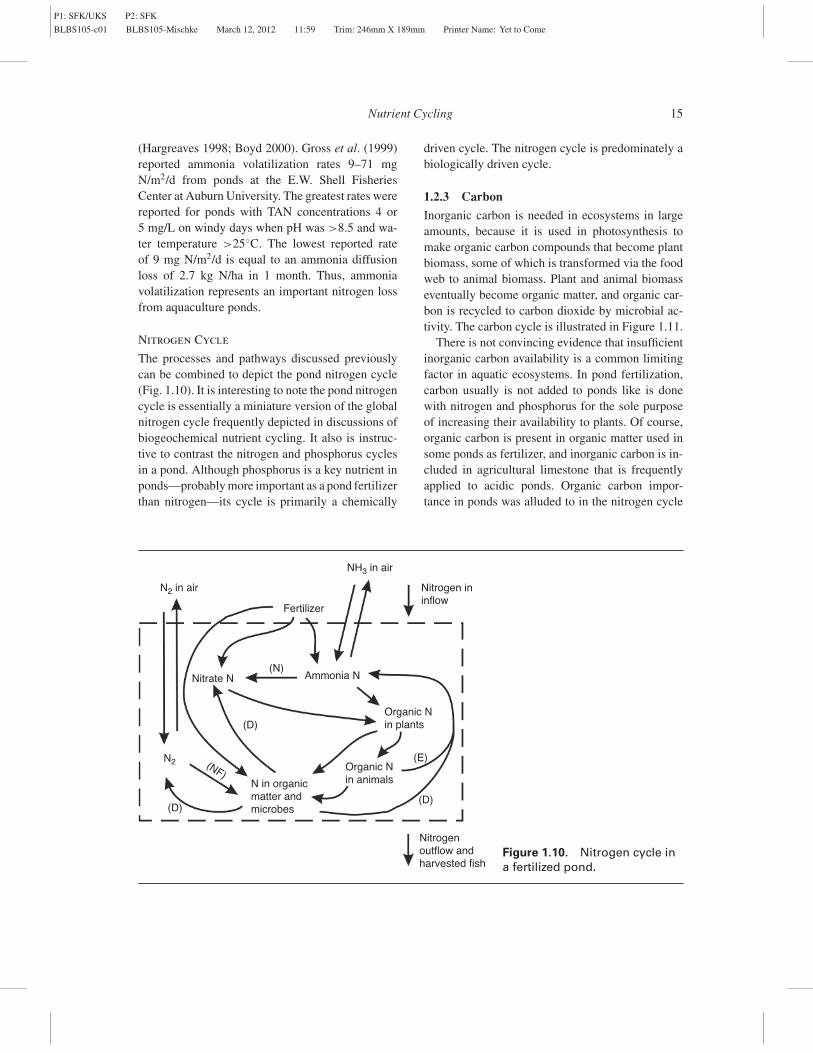
Nitrogen Cycle
The processes and pathways discussed previouslycan be combined to depict the pond nitrogen cycle(Fig. 1.10). It is interesting to note the pond nitrogencycle is essentially a miniature version of the globalnitrogen cycle frequently depicted in discussions ofbiogeochemical nutrient cycling. It also is instruc-tive to contrast the nitrogen and phosphorus cyclesin a pond. Although phosphorus is a key nutrient inponds—probably more important as a pond fertilizerthan nitrogen—its cycle is primarily a chemically
driven cycle. The nitrogen cycle is predominately abiologically driven cycle.
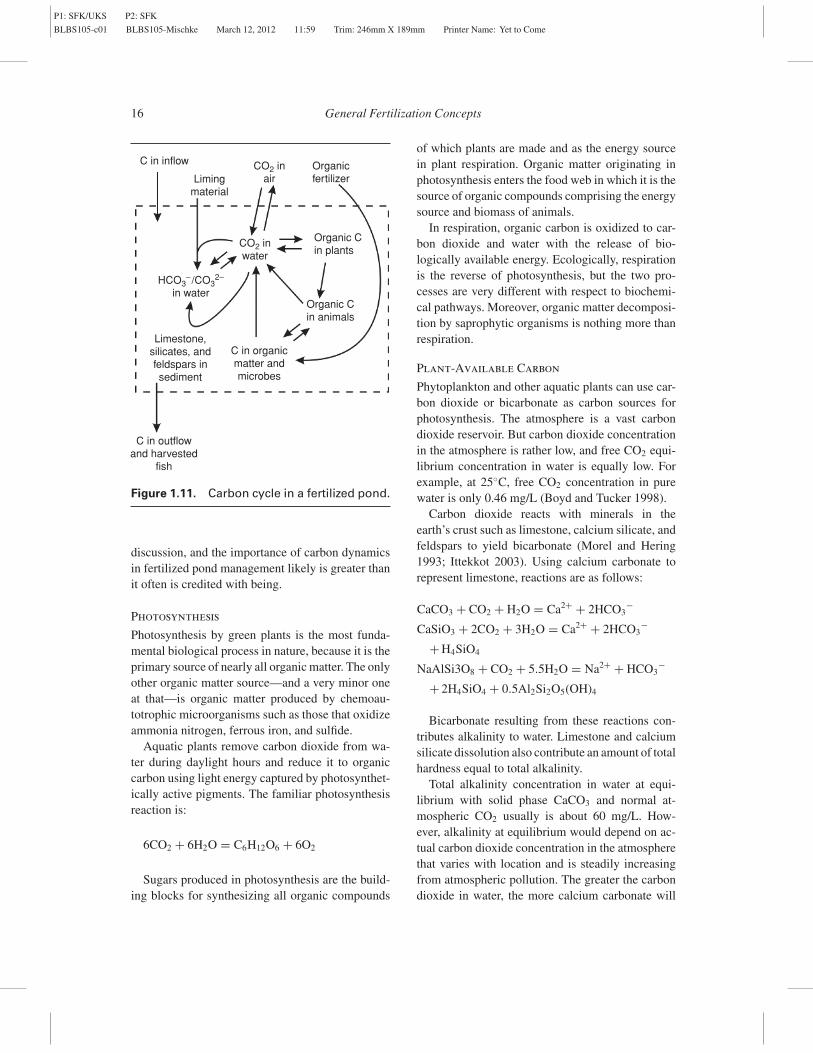
1.2.3 Carbon
Inorganic carbon is needed in ecosystems in largeamounts, because it is used in photosynthesis tomake organic carbon compounds that become plantbiomass, some of which is transformed via the foodweb to animal biomass. Plant and animal biomasseventually become organic matter, and organic car-bon is recycled to carbon dioxide by microbial ac-tivity. The carbon cycle is illustrated in Figure 1.11.
There is not convincing evidence that insufficientinorganic carbon availability is a common limitingfactor in aquatic ecosystems. In pond fertilization,carbon usually is not added to ponds like is donewith nitrogen and phosphorus for the sole purposeof increasing their availability to plants. Of course,organic carbon is present in organic matter used insome ponds as fertilizer, and inorganic carbon is in-cluded in agricultural limestone that is frequentlyapplied to acidic ponds. Organic carbon impor-tance in ponds was alluded to in the nitrogen cycle
Fertilizer
NH3 in air
N2 in air
N2
Nitrate N
(D)
(D)
(E)
(N)
(D)
N in organicmatter andmicrobes
Organic Nin animals
Organic Nin plants
Nitrogen ininflow
Nitrogenoutflow andharvested fish
Ammonia N
(NF)
Figure 1.10. Nitrogen cycle ina fertilized pond.
P1: SFK/UKS P2: SFK
BLBS105-c01 BLBS105-Mischke March 12, 2012 11:59 Trim: 246mm X 189mm Printer Name: Yet to Come
16 General Fertilization Concepts
C in inflow
Limingmaterial
CO2 inwater
HCO3–/CO3
2–
in water
CO2 inair
Organicfertilizer
Organic Cin plants
Organic Cin animals
C in organicmatter andmicrobes
C in outflowand harvested
fish
Limestone,silicates, andfeldspars insediment
Figure 1.11. Carbon cycle in a fertilized pond.
discussion, and the importance of carbon dynamicsin fertilized pond management likely is greater thanit often is credited with being.
Photosynthesis
Photosynthesis by green plants is the most funda-mental biological process in nature, because it is theprimary source of nearly all organic matter. The onlyother organic matter source—and a very minor oneat that—is organic matter produced by chemoau-totrophic microorganisms such as those that oxidizeammonia nitrogen, ferrous iron, and sulfide.
Aquatic plants remove carbon dioxide from wa-ter during daylight hours and reduce it to organiccarbon using light energy captured by photosynthet-ically active pigments. The familiar photosynthesisreaction is:
6CO2 + 6H2O = C6H12O6 + 6O2
Sugars produced in photosynthesis are the build-ing blocks for synthesizing all organic compounds
of which plants are made and as the energy sourcein plant respiration. Organic matter originating inphotosynthesis enters the food web in which it is thesource of organic compounds comprising the energysource and biomass of animals.
In respiration, organic carbon is oxidized to car-bon dioxide and water with the release of bio-logically available energy. Ecologically, respirationis the reverse of photosynthesis, but the two pro-cesses are very different with respect to biochemi-cal pathways. Moreover, organic matter decomposi-tion by saprophytic organisms is nothing more thanrespiration.
Plant-Available Carbon
Phytoplankton and other aquatic plants can use car-bon dioxide or bicarbonate as carbon sources forphotosynthesis. The atmosphere is a vast carbondioxide reservoir. But carbon dioxide concentrationin the atmosphere is rather low, and free CO2 equi-librium concentration in water is equally low. Forexample, at 25◦C, free CO2 concentration in purewater is only 0.46 mg/L (Boyd and Tucker 1998).
Carbon dioxide reacts with minerals in theearth’s crust such as limestone, calcium silicate, andfeldspars to yield bicarbonate (Morel and Hering1993; Ittekkot 2003). Using calcium carbonate torepresent limestone, reactions are as follows:
CaCO3 + CO2 + H2O = Ca2+ + 2HCO3−
CaSiO3 + 2CO2 + 3H2O = Ca2+ + 2HCO3−
+ H4SiO4
NaAlSi3O8 + CO2 + 5.5H2O = Na2+ + HCO3−
+ 2H4SiO4 + 0.5Al2Si2O5(OH)4
Bicarbonate resulting from these reactions con-tributes alkalinity to water. Limestone and calciumsilicate dissolution also contribute an amount of totalhardness equal to total alkalinity.
Total alkalinity concentration in water at equi-librium with solid phase CaCO3 and normal at-mospheric CO2 usually is about 60 mg/L. How-ever, alkalinity at equilibrium would depend on ac-tual carbon dioxide concentration in the atmospherethat varies with location and is steadily increasingfrom atmospheric pollution. The greater the carbondioxide in water, the more calcium carbonate will
P1: SFK/UKS P2: SFK
BLBS105-c01 BLBS105-Mischke March 12, 2012 11:59 Trim: 246mm X 189mm Printer Name: Yet to Come
Nutrient Cycling 17
dissolve. On the other hand, removing carbon diox-ide from the system will cause calcium carbonate toprecipitate.
Natural water total alkalinity varies greatly fromplace to place from differences in types and amountsof source minerals in soils and geological forma-tions. Moreover, water carbon dioxide concentra-tion does not entirely depend on atmospheric carbondioxide concentration—organic matter decomposi-tion is a major carbon dioxide source in water.
Although carbon dioxide reacts with water to formbicarbonate:
CO2 + H2O = HCO3− + H+
This reaction is acidic and forces pH down ratherthan creating alkalinity. There is, however, a rela-tionship between bicarbonate concentration, carbondioxide concentration, and pH that can be expressedas follows:
(H+) (
HCO3−)
(CO2)= 10−6.35
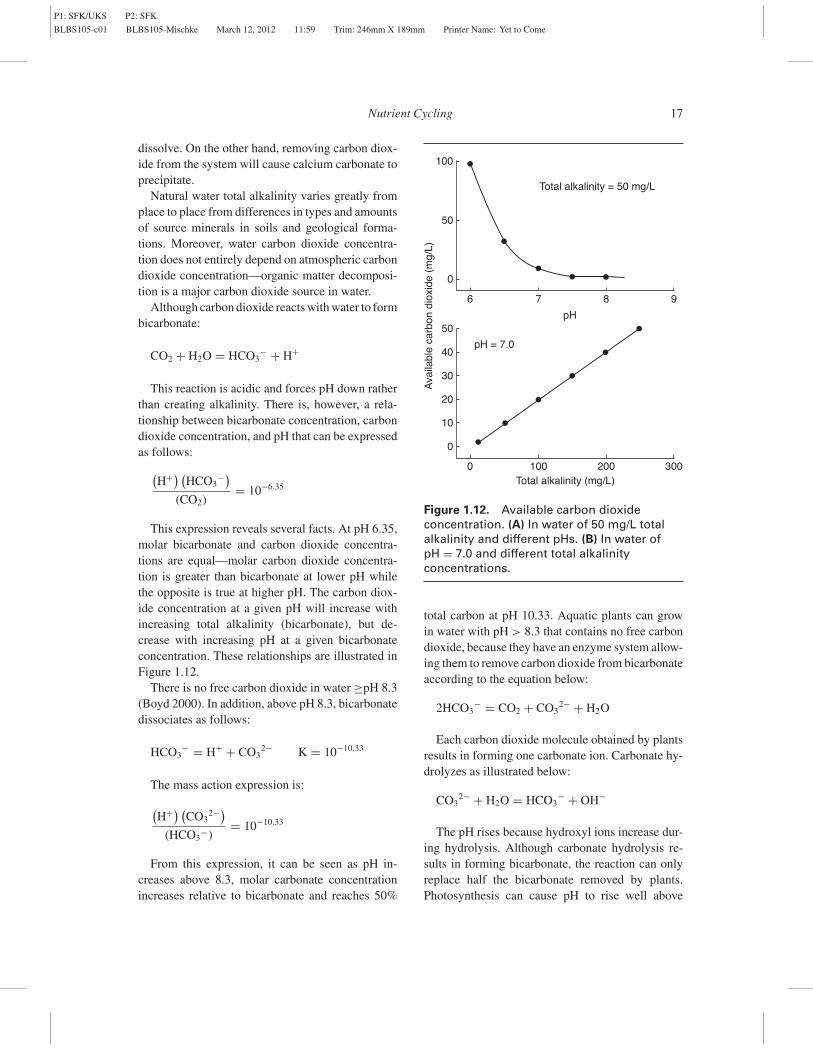
This expression reveals several facts. At pH 6.35,molar bicarbonate and carbon dioxide concentra-tions are equal—molar carbon dioxide concentra-tion is greater than bicarbonate at lower pH whilethe opposite is true at higher pH. The carbon diox-ide concentration at a given pH will increase withincreasing total alkalinity (bicarbonate), but de-crease with increasing pH at a given bicarbonateconcentration. These relationships are illustrated inFigure 1.12.
There is no free carbon dioxide in water ≥pH 8.3(Boyd 2000). In addition, above pH 8.3, bicarbonatedissociates as follows:
HCO3− = H+ + CO3
2− K = 10−10.33
The mass action expression is:
(H+) (
CO32−)
(HCO3−)
= 10−10.33
From this expression, it can be seen as pH in-creases above 8.3, molar carbonate concentrationincreases relative to bicarbonate and reaches 50%
Total alkalinity = 50 mg/L
Total alkalinity (mg/L)
100
50
0
6 87
pH
9
pH = 7.0
50
40
30
20
10
0
0 200100 300
Ava
ilabl
e ca
rbon
dio
xide
(m
g/L)
Figure 1.12. Available carbon dioxideconcentration. (A) In water of 50 mg/L totalalkalinity and different pHs. (B) In water ofpH = 7.0 and different total alkalinityconcentrations.
total carbon at pH 10.33. Aquatic plants can growin water with pH > 8.3 that contains no free carbondioxide, because they have an enzyme system allow-ing them to remove carbon dioxide from bicarbonateaccording to the equation below:
2HCO3− = CO2 + CO3
2− + H2O
Each carbon dioxide molecule obtained by plantsresults in forming one carbonate ion. Carbonate hy-drolyzes as illustrated below:
CO32− + H2O = HCO3
− + OH−
The pH rises because hydroxyl ions increase dur-ing hydrolysis. Although carbonate hydrolysis re-sults in forming bicarbonate, the reaction can onlyreplace half the bicarbonate removed by plants.Photosynthesis can cause pH to rise well above

P1: SFK/UKS P2: SFK
BLBS105-c01 BLBS105-Mischke March 12, 2012 11:59 Trim: 246mm X 189mm Printer Name: Yet to Come
18 General Fertilization Concepts
8.3, and a considerable bicarbonate amount may betransformed to carbonate. Of course, at night, pho-tosynthesis stops, and the carbon dioxide return towater by respiration transforms carbonate back tobicarbonate. When pH drops below 8.3, free carbondioxide will accumulate in water.
Plant-available carbon dioxide is mainly a func-tion of total alkalinity concentration, pH, and watertemperature (Saunders et al. 1962). Table 1.2 pro-vides factors for estimating available carbon dioxidefrom the three variables. At a given pH and temper-ature, available carbon dioxide will increase withgreater total alkalinity. For example, at 20◦C andpH 7.0, available carbon dioxide would be 6 mg/Lat a total alkalinity 20 mg/L, but 15 mg/L at a totalalkalinity 50 mg/L. However, at a pH 9, availablecarbon dioxide concentration would decline to 4.6mg/L and 11.5 mg/L, respectively. Water temper-ature effect on available carbon dioxide is ratherminor compared to pH effect.
Liming is a common practice in pond aquaculture(see Chapter 4). Pulverized limestone or lime madeby burning limestone in a kiln is applied to ponds toneutralize acidity in bottom soil and increase total al-kalinity concentration and available carbon dioxidein water.
1.2.4 Other Nutrients
In addition to nitrogen and phosphorus, potassiumis considered a primary nutrient in fertilizers foragronomic crops (Jones 1979). However, there areno studies revealing a need to include potassiumin fertilizers for freshwater ponds or coastal pondsfilled from estuaries or the sea. However, in inlandshrimp culture in low salinity water, potassium, andsometimes magnesium, concentrations often are solow the resulting major cation imbalance leads tolow shrimp survival and growth (Roy et al. 2010).Potassium fertilizer (muriate of potash (KCl)) anda potassium magnesium sulfate product marketedunder the name K-Mag R© are commonly applied toincrease potassium and magnesium concentrationsin inland shrimp ponds (Boyd et al. 2007; Pine andBoyd 2010).
Potassium fertilization studies to promote phy-toplankton growth do not include potassium defi-ciency investigations in waters with < 2.5 mg/L K(Viriyatum and Boyd 2011). Thus, in some waters,potassium possibly is a limiting factor for phyto-plankton and fish production.
Potassium fertilizers are highly soluble, but potas-sium can be removed from water by bottom soils.Soils can absorb potassium and other cations on
Table 1.2. Factors for Converting Total Alkalinity to Milligrams ofAvailable Carbon per Liter.
Temperature (◦C)
pH 5 10 15 20 25 30a
5.0 8.19 7.16 6.55 6.00 5.61 5.205.5 2.75 2.43 2.24 2.06 1.94 1.846.0 1.03 0.93 0.87 0.82 0.78 0.736.5 0.49 0.46 0.44 0.42 0.41 0.407.0 0.32 0.31 0.30 0.30 0.29 0.297.5 0.26 0.26 0.26 0.26 0.26 0.268.0 0.25 0.25 0.25 0.24 0.24 0.248.5 0.24 0.24 0.24 0.24 0.24 0.249.0 0.23 0.23 0.23 0.23 0.23 0.23
Source: Saunders et al. (1962).Multiply factors by total alkalinity.aEstimated by extrapolation.

P1: SFK/UKS P2: SFK
BLBS105-c01 BLBS105-Mischke March 12, 2012 11:59 Trim: 246mm X 189mm Printer Name: Yet to Come
Nutrient Cycling 19
negatively charged sites of clay minerals and organicparticles. Exchangeable cations that are attracted tocharged sites on soils can be readily exchanged withother cations in water. Some soils, however, can ab-sorb potassium by a noncation exchange process,and potassium will be strongly fixed and unavail-able. These differences result primarily from soilclay mineralogy. Kaolinite and a few other clayminerals (1:1 types) are made up of one tetrahedral(silica) sheet combined with one octahedral (alu-mina) sheet. The structure is fixed, and minerals donot expand when wetted. Cations and water cannotenter between layers of 1:1-type clays (Brady 2002).Smectite, vermiculite, and illite are clays made upof a silica sheet sandwiched between two aluminasheets (2:1-type clay minerals). Smectite and ver-miculite expand when wetted, and cations and watercan enter between layers (Dixon and Nash 1968).Cation exchange capacities of 2:1-type clays aremuch greater than for 1:1-type clays (Brady 2002).Also, 2:1-type clays can fix cations within spaces be-tween layers, and cations retained within the spacesbetween layers are largely unavailable biologically(Sparks 2000).
Boyd et al. (2007) showed a pond soil witha cation exchange capacity of 31 mEq/100 g inwhich most of the clay fraction consisted of smec-tite adsorbed 136 mg/kg K by cation exchange and330 mg/kg K were adsorbed by fixation within theinterlayers of clay minerals over 8 months. How-ever, in a potassium fertilization pond study withsoils having a CEC of 5 mEq/100 g and containingkaolinite clay, only about 70 mg/kg K was removedfrom water by soil over 7 months (Viriyatum andBoyd 2011). Thus, substantial potassium can be re-moved from water even by a soil containing 1:1 clayminerals and with a low cation exchange capacity.Potassium fertilizers would need to be applied atfrequent intervals just as is done with nitrogen andphosphorus fertilizers.
Calcium and magnesium are secondary nutrientsin fertilizers for agronomic crops. Phytoplanktongrowth in pond waters with low calcium and mag-nesium concentrations also could be limited by ashortage of these two nutrients (Boyd and Scars-brook 1974). However, such ponds should be treatedwith liming materials, which are a calcium and mag-nesium source (see Chapter 4).
Micronutrients, and especially iron, may be limit-ing to phytoplankton in brackish water and seawaterponds and possibly in freshwater ponds with highpH. Iron, manganese, zinc, and copper, the com-mon cationic micronutrients are quite insoluble atpH > 5. Thus, adding mineral salts of these cationsis not likely to increase concentrations greatly (Boyd2000). Cationic micronutrients may be chelatedwith citric acid, ethylenediaminetetraacetic acid,triethanolamine, lignin sulfate, or other chelatingagents to make them at least temporarily soluble inwater (Boyd and Tucker 1998). Nevertheless, therehas been little interest in applying cationic micronu-trients to ponds for phytoplankton growth.
Two main anionic micronutrients affecting plantgrowth are boron and silicon (for diatoms in shrimpponds). Sodium borate (borax) is a readily solubleboron source (Boyd and Tucker 1998). Borate ionwould not be appreciably adsorbed by bottom soiland would be lost from ponds primarily in outflow.Silicon can be provided by applying sodium silicateor calcium silicate, but silicon from these sourceswould not be highly soluble in waters of pH < 9(Boyd 2000). Boron has seldom been used in pondfertilization, but shrimp ponds in South and CentralAmerica often are fertilized with silicate.
REFERENCES
Banerjee, A., G.N. Chattopadhyay, and C.E. Boyd.2009. Determination of critical limits of soil nutri-ents for use in optimizing fertilizer rates for fish-ponds in red, lateritic soil zones. Aquacultural Engi-neering 40: 144–148.
Bennett, A.C. and F. Adams. 1976. Solubility and sol-ubility product of dicalcium phosphate dehydrate inaqueous solutions and soil solutions. Soil ScienceSociety of America Proceedings 40: 39–42.
Bothe, H. 1982. Nitrogen fixation. In: N.G. Carr andB.A. Whitton (eds.) The Biology of Cyanobacte-ria. University of California Press, Berkley, CA,pp. 87–104.
Boyd, C.E. 1972. Sources of carbon dioxide for nui-sance blooms of algae. Weed Science 20: 492–497.
Boyd, C.E. 1976. Nitrogen fertilizer effects on produc-tion of tilapia in ponds fertilized with phosphorusand potassium. Aquaculture 7: 385–390.
Boyd, C.E. 1981. Solubility of granular inorganic fer-tilizers for fishponds. Transactions of the AmericanFisheries Society 110: 451–454.
P1: SFK/UKS P2: SFK
BLBS105-c01 BLBS105-Mischke March 12, 2012 11:59 Trim: 246mm X 189mm Printer Name: Yet to Come
20 General Fertilization Concepts
Boyd, C.E. 1990. Water quality in ponds for aqua-culture. Alabama Agricultural Experiment Station,Auburn University, AL.
Boyd, C.E. 1995. Bottom Soils, Sediment, and PondAquaculture. Chapman and Hall, New York.
Boyd, C.E. 2000. Water Quality, An Introduction.Kluwer Academic Publishers, Boston, MA.
Boyd, C.A., C.E. Boyd, and D.B. Rouse. 2007. Potas-sium adsorption by bottom soils in ponds for inlandculture of marine shrimp in Alabama. Journal of theWorld Aquaculture Society 38: 85–91.
Boyd, C.E. and W.D. Hollerman. 1981. Methods of ap-plying liquid fertilizers to fishponds. Proceedings ofthe Annual Conference of the Southeastern Associ-ation of Fish and Wildlife Agencies 35: 525–530.
Boyd, C.E. and P. Munsiri. 1996. Phosphorus adsorp-tion capacity and availability of added phosphorusin soils from aquaculture areas in Thailand. Journalof the World Aquaculture Society 27: 160–167.
Boyd, C.E., Y. Musig, and L. Tucker. 1980. Effects ofthree phosphorus fertilizers on phosphorus concen-trations and phytoplankton production. Aquaculture22: 175–180.
Boyd, C.A., P. Pengseng, and C.E. Boyd. 2008. Newnitrogen fertilization recommendations for bluegillponds in the southeastern United States. North Amer-ican Journal of Aquaculture 70: 308–313.
Boyd, C.E. and E. Scarsbrook. 1974. Effects of agri-cultural limestone on phytoplankton communitiesof fishponds. Archives fur Hydrobiologia 74: 336–349.
Boyd, C.E. and C.S. Tucker. 1998. Pond AquacultureWater Quality Management. Kluwer Academic Pub-lishers, Boston, MA.
Brady, N.C. 2002. The Nature and Properties of Soils.Prentice Hall, Upper Saddle River, NJ.
Brzezinski, M.A. 1985. The Si:C:N ratio of marinediatoms: interspecific variability and the effect ofsome environmental variables. Journal of Phycology21: 347–357.
Devlin, R.M. 1969. Plant Physiology. Van NostrandReinhold Company, New York.
Dixon, J.B. and V.E. Nash. 1968. Chemical, mineralog-ical and engineering properties of Alabama and Mis-sissippi Blackbelt soils. Alabama and MississippiAgricultural Experiment Stations and U. S. SouthernCooperative Series Number 130, Auburn University,AL.
Eaton, A.D., L.S. Clesceri, E.W. Rice, and A.E. Green-berg (eds.) 2005. Standard Methods for the Examina-tion of Water and Wastewater, 21st edition. AmericanPublic Health Association, Washington, DC.
Elser, J.J., M. Bracken, E.E. Cleland, D.S. Gruner, W.S.Harpole, H. Hillebrand, J.T. Ngai, E.W. Seabloom,J.B. Shurin, and J.E. Smith. 2007. Global analysis ofnitrogen and phosphorus limitation of primary pro-ducers in freshwater, marine and terrestrial ecosys-tems. Ecology Letters 10: 1135–1142.
Eren, Y., T. Tsur, and Y. Avnimelech. 1977. Phospho-rus fertilization of fishponds in the Upper Galilee.Bamidgeh 29: 87–92.
Findlay, D.L., R.E. Hecky, L.L. Hendzel, M.P. Stain-ton, and G.W. Regehr. 1994. Relationship betweenN2-fixation and heterocyst abundance and its rel-evance to the nitrogen budget of lake 227. Cana-dian Journal of Fisheries Aquatic Science 51: 2254–2266.
Gerloff, G.C. and F. Skoog. 1954. Cell contents of nitro-gen and phosphorus as a measure of their availabilityfor growth of Microcystis aeruginosa. Ecology 35:348–353.
Gerloff, G.C. and F. Skoog. 1957. Nitrogen as a limit-ing factor for the growth of Microcystis aeruginosa.Wisconsin Lakes Ecology 38: 556–561.
Gross, A. and C.E. Boyd. 1998. A digestion procedurefor the simultaneous determination of total nitrogenand total phosphorus in pond water. Journal of theWorld Aquaculture Society 29: 300–303.
Golterman, H.L. 1975. Physiological Limnology. Else-vier Scientific Publishing Company, Amsterdam.
Gross, A., C.E. Boyd, and C.W. Wood. 1999. Ammo-nia volatilization from freshwater ponds. Journal ofEnvironmental Quality 28: 793–797.
Gross, A., C.E. Boyd, and C.W. Wood. 2000. Nitro-gen transformations and balance in channel catfishponds. Aquacultural Engineering 24: 1–14.
Hargreaves, J.A. 1998. Nitrogen biogeochemistry ofaquaculture ponds. Aquaculture 116: 181–212.
Hepher, B. 1962. Ten years of research in fishpondfertilization in Israel. I. The effect of fertilization onfish yields. Bamidgeh 14: 29–38.
Hepher, B. 1966. Some aspects of the phosphorus cy-cle in fishponds. Verh. Int. Verein Limnology 16:1293–1297.
Hickling, C.F. 1962. Fish Cultures. Faber and Faber,London.
Ittekkot, V. 2003. A new story from the Ol’ Man River.Science 301: 56–58.
Jones, U.S. 1979. Fertilizers and Soil Fertility. RestonPublishing Company, Reston, VA.
Kastner, R.J. and C.E. Boyd. 1996. Production of sun-fish (Lepomis spp.) in ponds treated with controlled-release fertilizers. Journal of the World AquacultureSociety 27: 228–234.

P1: SFK/UKS P2: SFK
BLBS105-c01 BLBS105-Mischke March 12, 2012 11:59 Trim: 246mm X 189mm Printer Name: Yet to Come
Nutrient Cycling 21
Lal, R. and P.A. Sanchez. 1992. Myths and science ofsoils of the tropics. Special Publication Number 29,Soil Science Society of America, Madison, WI.
Lin, C.K., V. Tansakul, and C. Apinhapath. 1988.Biological nitrogen fixation as a source of nitrogeninput in fishponds. In: R.S.V. Pullen, T. Bhukaswan,K. Tonguthai, and J.L. Maclean (eds.) The SecondInternational Symposium on Tilapia in Aquaculture.ICLARM Conference Proceedings 15, Departmentof Fisheries, Bangkok, Thailand and InternationalCenter for Living Resources Management, Manila,Philippines, pp. 53–58.
Masuda, K. and C.E. Boyd. 1994a. Phosphorus frac-tions in soil and water of aquaculture ponds built onclayey, Ultisols at Auburn, Alabama. Journal of theWorld Aquaculture Society 25: 379–395.
Masuda, K. and C.E. Boyd. 1994b. Chemistry of sedi-ment pore water in aquaculture ponds built on clayey,Ultisols at Auburn, Alabama. Journal of the WorldAquaculture Society 25: 396–404.
Metting, F.B., Jr. (ed.) 1993. Soil Microbial Ecology.Marcel Dekker, New York.
Miller, W.E., T.E. Maloney, and J.C. Greene. 1974.Algal productivity in 49 lake waters as determinedby algal assays. Water Research 8: 667–679.
Morel, F.M.M. and J.G. Hering. 1993. Principles andApplications of Aquatic Chemistry. John Wiley &Sons, New York.
Mortimer, C.H. 1954. Fertilizers in fishponds. FisheriesPublication Number 5, Her Majesty’s StationeryOffice, London.
Munsiri, P., C.E. Boyd, and B.F. Hajek. 1995. Physicaland chemical characteristics of bottom soil profilesin ponds at Auburn, Alabama, USA, and a proposedmethod for describing pond soil horizons. Journal ofthe World Aquaculture Society 26: 346–377.
Nadis, S. 1998. Fertilizing the sea. Scientific American277: 33.
Odum, E.P. 1975. Fundamentals of Ecology, 2nd edi-tion. Holt Rinehardt and Winston, New York.
Pais, I. and J.B. Jones, Jr. 1997. The Handbook of TraceElements. Saint Lucie Press, Boca Raton, FL.
Pine, H.J. and C.E. Boyd. 2010. Adsorption of magne-sium by bottom soils in inland brackish water shrimpponds in Alabama. Journal of the World AquacultureSociety 41: 603–609.
Polisini, J.M., C.E. Boyd, and B. Didgeon. 1970. Pro-ductivity and nutrient relationships in an oligotrophicSouth Carolina pond. Oikos 21: 343–346.
Redfield, A.C. 1934. On the proportions of organicdeviations in sea water and their relation to the com-position of plankton. In: R.J. Daniel (ed.) JamesJohnstone Memorial Volume. University Press ofLiverpool, Liverpool, pp. 177–192.
Roy, L.A., D.A. Davis, I.P. Saoud, C.A. Boyd, H.J.Pine, and C.E. Boyd. 2010. Shrimp culture in in-land low salinity waters. Reviews in Aquaculture 2:191–208.
Rushton, Y. and C.E. Boyd. 1995. New opportunitiesfor sportfish pond fertilization. Alabama Agricul-tural Experiment Station, Auburn University, Al-abama. Highlights of Agricultural Research 36:11–12.
Rushton, Y. and C.E. Boyd. 2000. A comparisonof water-soluble fertilizer with liquid fertilizer forsportfish pond fertilization. North American Journalof Aquaculture 62: 212–218.
Saunders, G.W., F.B. Trama, and R.W. Bachmann.1962. Evaluation of a modified C-14 techniquefor shipboard estimation of photosynthesis in largelakes. Great Lakes Research Division, Publica-tion No. 7, University of Michigan, Ann Arbor,MI.
Sparks, D.L. 2000. Bioavailability of soil potassium.In: M.E. Summer (ed.) Handbook of Soil Science.CRC Press, Boca Raton, FL, pp. D38–D53.
Swingle, H.S., B.C. Gooch, and H.R. Rabanal. 1963.Phosphate fertilization of ponds. Proceedings An-nual Conference Southeastern Association Gameand Fish Commission 17: 213–218.
Tepe, Y. and C.E. Boyd. 2001. A sodium nitrate-based, water-soluble fertilizer for sportfish ponds.North American Journal of Aquaculture 63: 328–332.
Viriyatum, R. and C.E. Boyd. 2011. Re-evaluationof potassium fertilization of bluegill, Lepomismacrochirus, ponds. Journal of the World Aquacul-ture Society 42: 332–338.
Wudtisin, W. and C.E. Boyd. 2005. Determination ofthe phosphorus fertilization rate for bluegill pondsusing regression analysis. Aquaculture Research 36:593–599.

P1: SFK/UKS P2: SFK
BLBS105-c01 BLBS105-Mischke March 12, 2012 11:59 Trim: 246mm X 189mm Printer Name: Yet to Come