Secretary Board of Governors of the Federal Reserve … weekly... · Board of Governors of the...
22
March 9, 2017 Via Electronic Mail Mr. Robert deV. Frierson Secretary Board of Governors of the Federal Reserve System 20 th Street & Constitution Avenue, N.W. Washington, D.C. 20551 Re: Supplemental Submission - Risk-based Capital and Other Regulatory Requirements for Activities of Financial Holding Companies Related to Physical Commodities and Risk-based Capital Requirements for Merchant Banking Investments (Docket No. R- 1547; RIN 7100 AE-58) Ladies and Gentlemen: The Clearing House Association L.L.C. 1 is pleased to provide you with the enclosed copy of the results of an empirical data study on merchant banking activities of financial holding companies (“FHCs”), which The Clearing House is filing as a supplement to its letter dated February 21, 2017, submitted jointly with other financial services trade associations 2 in response to the Federal Reserve’s recent notice of proposed rulemaking entitled Risk-based Capital and Other Regulatory Requirements for Activities of FHCs Related to Physical Commodities and Risk-based Capital Requirements for Merchant Banking Investments. 3 1 The Clearing House is a banking association and payments company that is owned by the largest commercial banks and dates back to 1853. The Clearing House Association L.L.C. is a nonpartisan organization that engages in research, analysis, advocacy and litigation focused on financial regulation that supports a safe, sound and competitive banking system. Its affiliate, The Clearing House Payments Company L.L.C., owns and operates core payments system infrastructure in the United States and is currently working to modernize that infrastructure by building a new, ubiquitous, real-time payment system. The Payments Company is the only private-sector ACH and wire operator in the United States, clearing and settling nearly $2 trillion in U.S. dollar payments each day, representing half of all commercial ACH and wire volume. 2 See The Clearing House, the American Bankers Association, the Financial Services Forum, the Financial Services Roundtable and the Institute of International Bankers, Letter to Robert deV. Freierson, Re: Risk- based Capital and Other Regulatory Requirements for Activities of Financial Holding Companies Related to Physical Commodities and Risk-based Capital Requirements for Merchant Banking Investments (Docket No. R-1547; RIN 7100 AE-58) (February 21, 2017), available at https://www.theclearinghouse.org/- /media/tch/documents/tch%20weekly/2017/20170221_tch_aba_fsf_fsr_iib_merchant_banking_comment_l etter.pdf. 3 81 Fed. Reg. 67,220 (Sept. 30, 2016).
-
Upload
truongliem -
Category
Documents
-
view
216 -
download
0
Transcript of Secretary Board of Governors of the Federal Reserve … weekly... · Board of Governors of the...

March 9, 2017
Via Electronic Mail
Mr. Robert deV. Frierson Secretary Board of Governors of the Federal Reserve System 20th Street & Constitution Avenue, N.W. Washington, D.C. 20551
Re: Supplemental Submission - Risk-based Capital and Other Regulatory Requirements for Activities of Financial Holding Companies Related to Physical Commodities and Risk-based Capital Requirements for Merchant Banking Investments (Docket No. R-1547; RIN 7100 AE-58)
Ladies and Gentlemen:
The Clearing House Association L.L.C.1 is pleased to provide you with the enclosed copy of the results of an empirical data study on merchant banking activities of financial holding companies (“FHCs”), which The Clearing House is filing as a supplement to its letter dated February 21, 2017, submitted jointly with other financial services trade associations2 in response to the Federal Reserve’s recent notice of proposed rulemaking entitled Risk-based Capital and Other Regulatory Requirements for Activities of FHCs Related to Physical Commodities and Risk-based Capital Requirements for Merchant Banking Investments.3
1 The Clearing House is a banking association and payments company that is owned by the largest
commercial banks and dates back to 1853. The Clearing House Association L.L.C. is a nonpartisan organization that engages in research, analysis, advocacy and litigation focused on financial regulation that supports a safe, sound and competitive banking system. Its affiliate, The Clearing House Payments Company L.L.C., owns and operates core payments system infrastructure in the United States and is currently working to modernize that infrastructure by building a new, ubiquitous, real-time payment system. The Payments Company is the only private-sector ACH and wire operator in the United States, clearing and settling nearly $2 trillion in U.S. dollar payments each day, representing half of all commercial ACH and wire volume.
2 See The Clearing House, the American Bankers Association, the Financial Services Forum, the Financial Services Roundtable and the Institute of International Bankers, Letter to Robert deV. Freierson, Re: Risk-based Capital and Other Regulatory Requirements for Activities of Financial Holding Companies Related to Physical Commodities and Risk-based Capital Requirements for Merchant Banking Investments (Docket No. R-1547; RIN 7100 AE-58) (February 21, 2017), available at https://www.theclearinghouse.org/-/media/tch/documents/tch%20weekly/2017/20170221_tch_aba_fsf_fsr_iib_merchant_banking_comment_letter.pdf.
3 81 Fed. Reg. 67,220 (Sept. 30, 2016).

Board of Governors of the Federal Reserve System
-2- March 9, 2017
The Clearing House undertook this study in order to develop an empirical basis upon
which to respond to the Federal Reserve’s suggestion in the proposed rulemaking that it may increase risk-based capital requirements for all merchant banking activities to account broadly for corporate veil-piercing risk, as well as the Federal Reserve’s recent recommendation in the Dodd-Frank Act Section 620 Report that Congress repeal merchant banking authority altogether.4
The Clearing House study generally sought to (i) assess the size and scope of merchant banking activities conducted by FHCs, including asset management activities (which were ignored in the Section 620 report); (ii) determine the frequency with which FHCs routinely manage or operate merchant banking portfolio companies (which could introduce veil-piercing risk); (iii) identify any past instances of corporate veil-piercing; and (iv) assess whether current risk-based capital requirements are appropriate in light of historical loss experience.
The key findings of our study are summarized very briefly below, and described in greater detail in the enclosure:
The size and scope of merchant banking activities are significant – for example, at year-end 2015, FHCs relied on merchant banking authority to:
o maintain more than $30 billion of direct capital investments in nonfinancial companies across a range of industries, including more than $11 billion invested in the U.S. renewable energy sector, which accounts for roughly 40% of that market’s annual financing needs; and
o manage more than $200 billion in client assets.
The frequency with which FHCs exercise routine management or operation of merchant banking portfolio companies is extremely limited – of 1,100+ merchant banking investments held by FHCs in 2015, none were subject to routine management or operation by an FHC.
We could find no evidence of corporate veil-piercing – of the 372 investments sold with losses in our data set, zero investments were sold with losses in excess of capital invested, which was our proxy for veil-piercing.
The current risk-based capital requirements are more than sufficient – our results indicate that the current Basel III risk-based capital requirements are approximately 35 percent higher than the 95th percentile of realized losses on merchant banking investments over the past 15 years, which, we note, included the most severe economic downturn in the post-war period, and this does not even account for CCAR, which can impose effective capital requirements multiples higher than the Basel III requirements currently imply.
4 See Federal Reserve, FDIC and OCC, Report pursuant to Section 620 of the Dodd-Frank Act (Sept. 9,
2016) (the “Section 620 Report”).

Board of Governors of the Federal Reserve System
-3- March 9, 2017
* * *
We appreciate your consideration of this supplemental submission. If you have any questions, please do not hesitate to contact John Court at 202-649-4628 or by email at [email protected].
Respectfully submitted,
John Court Managing Director & Deputy General Counsel The Clearing House Association L.L.C.
Enclosure
Merchant Banking Activities Conducted by Financial
Holding Companies:Summary of Results of
Empirical Data Study
March 2017

2 MERCHANT BANKING ACTIVITIES CONDUCTED BY FINANCIAL HOLDING COMPANIES: SUMMARY OF RESULTS OF EMPIRICAL DATA STUDY
I. Executive Summary
The Clearing House Association L.L.C. undertook a data
study on merchant banking activities conducted by
financial holding companies (FHCs) in order to develop
an empirical basis upon which to respond to the Federal
Reserve’s suggestion that it may increase risk-based capital
requirements for all merchant banking activities to account
broadly for corporate veil-piercing risk, as well as the Federal
Reserve’s recent recommendation that Congress repeal
merchant banking authority.1
1 See Federal Reserve, Federal Deposit Insurance Corporation and Office of the Comptroller of the Currency, Report pursuant to Section 620 of the Dodd-Frank Act (Sept. 9, 2016) (the “Section 620 Report”).
Our study sought to assess the size and scope of merchant
banking activities conducted by FHCs, including asset
management activities which were not included in the
Federal Reserve’s own recent assessment. Our study also
sought to determine the frequency with which FHCs
routinely manage or operate merchant banking portfolio
companies, and identify any past instances of corporate
veil-piercing. Finally, our study sought to determine
whether current risk-based capital requirements are
appropriate in light of historical loss experience. Twelve
FHCs participated in our study and provided data on a
best-efforts basis dating back as far as 2001.
THE KEY FINDINGS OF OUR STUDY ARE: » The Size and Scope of Merchant Banking Activities Are Significant
l On-balance-sheet merchant banking investments totaled $30.98 billion in 2015 and $28.05 billion in 2014. Of these totals, ¡ “traditional” portfolio investments in ordinary nonfinancial companies accounted for $19.55 billion in 2015 and $19.56
billion in 2014; and ¡ tax-oriented renewable energy investments, including solar and wind farms, accounted for $11.43 billion in 2015 and
$8.49 billion in 2014. n This represents roughly 40% of the annual renewable energy market’s financing needs in the United States.
l Asset management activities relying on merchant banking authority were substantial. ¡ Total AUM in controlled merchant banking funds was $207.23 billion in 2015 and $146.72 billion in 2014. ¡ Seed or co-investments made by FHCs in these same funds were $7.51 billion in 2015 and $10.53 billion in 2014.
n This shows a “multiplier effect” whereby a limited amount of seed or co-investments can support a much larger amount of capital invested in the marketplace – 28x in 2015 and 14x in 2014.
» The Frequency of Routine Management or Operation is Extremely Limited l Of the 1,142 on-balance-sheet merchant banking investments held at year-end 2015, none had been subject to routine management or operation by an FHC in 2015. A further look-back may have identified more instances.
» We Found No Evidence of Corporate Veil-Piercing l Of the 372 investments sold with losses in our data set, zero investments were sold with losses in excess of capital invested, which was our proxy for veil-piercing. In other words, we were not able to identify any instances of corporate veil-piercing.
» The Current Risk-Based Capital Requirements Are More Than Sufficient to Cover Losses l Our results indicate that the current Basel III risk-based capital requirements are approximately 35 percent higher than the 95th percentile of realized losses on merchant banking investments over the past 15 years, which, we note, included the most severe economic downturn in the post-war period.
¡ Moreover, we estimate that banks subject to the Federal Reserve’s Comprehensive Capital Analysis and Review (CCAR) global market shock are effectively subject to a capital requirement approximately equal to 45 percent on average for private equity merchant banking investments.
l The empirical distribution of realized historical losses identified in our study strongly supports the conclusion that exist-ing capital requirements are more than sufficient to cover losses in merchant banking portfolios.

3 MERCHANT BANKING ACTIVITIES CONDUCTED BY FINANCIAL HOLDING COMPANIES: SUMMARY OF RESULTS OF EMPIRICAL DATA STUDY
II. Purpose & Objectives
The Clearing House sponsored an empirical data
study on the activities conducted by FHCs under
the merchant banking authority provided at
Section 4(k)(4)(H) of the Bank Holding Company
Act. The Clearing House undertook the study
in order to develop an empirical basis upon
which to respond to a proposal by the Federal
Reserve that contemplates increasing risk-based
capital requirements for all merchant banking
activities,2 as well as a recent recommendation
by the Federal Reserve, in the Section 620
Report, that Congress repeal merchant banking
authority altogether.
2 Federal Reserve, Risk-based Capital and Other Regulatory Requirements for Activities of Financial Holding Companies Related to Physical Commodities and Risk-based Capital Requirements for Merchant Banking Investment, 81 Fed. Reg. 67,220 (Sept. 30, 2016).
THE OBJECTIVES OF THE CLEARING
HOUSE STUDY WERE TO:
» measure the size and scope of FHC activ-
ities conducted under merchant banking
authority;
» determine the frequency with which FHCs
exercise routine management or operation
over merchant banking portfolio companies;
» identify any instances in which an FHC was
held legally liable for the operations of a
merchant banking portfolio company (i.e.,
instances of ‘corporate veil piercing’); and
» measure the losses experienced by FHCs
as a result of merchant banking activities
in order to assess whether the current
risk-based minimum capital requirements
are appropriate.
III. Scope & Methodology
Twelve FHCs participated in the study.3 The
Clearing House created a questionnaire and
a data template designed to collect relevant
information dating back as far as 2001. This
information included details about the number
and type of investments held in each year,
the amount of capital invested, the number
of investments sold in each year, whether
any investments were sold with losses and
information about those losses, as well as
information about the amount of capital
3 According to the Federal Reserve, 21 domestic and foreign FHCs conducted merchant banking activities at December 31, 2015. See the Section 620 Report.
held by the FHC for the investments under
the current risk-based capital framework.
Information was also collected about
instances in which the FHC exercised routine
management or operation over the portfolio
company, among other things.4
We also endeavored to collect information
that would allow us to determine the size and
scope of activities conducted by FHCs using
merchant banking authority. Specifically, we
4 The questionnaire and data collection template used in connection with this study are attached as Annex A.

4 MERCHANT BANKING ACTIVITIES CONDUCTED BY FINANCIAL HOLDING COMPANIES: SUMMARY OF RESULTS OF EMPIRICAL DATA STUDY
collected information about on-balance-sheet
merchant banking investments made by FHCs,
which includes both “traditional” portfolio
investments in shares of ordinary nonfinancial
companies as well as tax-oriented investments
in renewable energy projects (e.g., solar and
wind farms). We also collected information
about asset management activities conducted
by FHCs where the activities rely specifically on
merchant banking authority. Typically, these
activities involve off-balance-sheet merchant
banking investments held by funds that the
FHC sponsors or controls. The FHC typically
holds a very limited or de minimis economic
interest in these funds and markets and sells
shares in the funds to customers as a part
of the FHC’s asset management business.
Collecting information on asset management
activities was important to our study because
this was an area completely overlooked by the
Federal Reserve when it scoped the size and
importance of merchant banking activities in
the Section 620 Report.
The Global Association of Risk Professionals
(GARP) administered our study by distributing
the questionnaire and the data template,
collecting the data responses and analyzing/
computing the results on an aggregated,
anonymized and confidential basis. GARP
shared only aggregated results with The
Clearing House and the participating FHCs.
GARP did not share an individual FHC’s data
with The Clearing House or any other FHC.
IV. Data Provided by Participating FHCs
The participating FHCs produced information
on the size and scope of their on- and off-
balance-sheet merchant banking activities.
In addition, the 12 participating FHCs on an
aggregate basis produced data on 2,100+5
individual on-balance-sheet merchant banking
investments (i.e., portfolio investments and tax-
oriented investments) held across the period
as far back as 2001. Of these, 1,011 investments
were sold during the same period. Of these, 372
were sold with losses.
Although this represents a rich data set, there
5 This figure is calculated by adding the total number of on-balance-sheet merchant banking investments that were reported as held by the 12 FHCs at year-end 2015 (1,142 investments) to the total number of investments that were reported as sold in the relevant period (1,011 investments).
were limitations in the ability of the FHCs
to produce complete data across the entire
period within the time allowed by the study
and so our data is admittedly somewhat
incomplete. For example, our data set does not
include every merchant banking investment
ever made nor does it include every investment
ever sold. As noted above, we only had
12 FHCs reporting data, and this does not
represent the current or historical totality of
the universe of FHCs engaged in merchant
banking activity. Even among the 12 FHCs
that did participate in our study, not every FHC
could produce complete data on all merchant
banking activity dating back to 2001. Rather,
the FHCs used their best efforts to submit the
data required that was reasonably available to

5 MERCHANT BANKING ACTIVITIES CONDUCTED BY FINANCIAL HOLDING COMPANIES: SUMMARY OF RESULTS OF EMPIRICAL DATA STUDY
them within the allotted (and admittedly short
two month) time period.6
Notwithstanding these limitations, we believe
the data set upon which our study is based is
6 Some of the 12 FHCs were able to produce comprehensive data dating back to 2001, but most were not. For example, some large FHCs that had extensive merchant banking activities and investments prior to the financial crisis sold or wound down those businesses during or shortly after the crisis, and so they were not able to produce the relevant historical data given that the business has long been sold or shuttered. Other FHCs that have maintained a consistent merchant banking business since the early 2000s were nonetheless unable to produce data pre-2008, and in some cases pre-2013, due to internal limits on data retention and record keeping. Finally, two FHCs were not able to produce any historical loss data for the period.
the most comprehensive publicly-available
data set covering the past performance of
merchant banking investments. It is therefore
the best currently available data upon which
to empirically assess the validity of the Federal
Reserve’s stated concerns in its proposal,
which are that the (1) routine management
or operation of merchant banking portfolio
companies by FHCs poses increased risks of
veil-piercing that could result in excessive and
unexpected losses for FHCs and (2) existing
capital requirements are insufficient to protect
against the risk of loss associated with merchant
banking activities.
V. Data Results
A. MEASURING THE SIZE & SCOPE OF MERCHANT BANKING ACTIVITIES
The first objective of the study was to measure
the size and scope of activities conducted by
FHCs under merchant banking authority.
I. ON-BALANCE-SHEET MERCHANT
BANKING INVESTMENTS
The on-balance-sheet merchant banking
investments made by FHCs include both
“traditional” portfolio investments in shares
of ordinary nonfinancial companies as well as
tax-oriented investments in renewable energy
projects. The total invested capital in on-
balance-sheet merchant banking investments
held by the FHCs in our study was $30.98 billion
as of year-end 2015 and $28.05 billion as of year-
end 2014, as shown in Table 1.
PORTFOLIO INVESTMENTS (PI). This category
includes “traditional” portfolio investments in
shares of ordinary nonfinancial companies held
by FHCs under merchant banking authority
(except renewable energy projects). These are
typically investments made in growth- and
expansion-stage companies for the purpose
of providing alternative forms of financing to
traditional bank loans and other capital markets
instruments, which may be more expensive or
unavailable to such companies. As shown in
Table 1, the study found that the total invested
capital in on-balance-sheet merchant banking
TABLE 1: ON-BALANCE-SHEET MERCHANT BANKING INVESTMENTSYE 2015 YE 2014
Carrying Value No. of Investments Carrying Value No. of Investments
Portfolio Investments
$19.55 BN 861 $19.56 BN 808
Tax-Oriented Investments
$11.43 BN 281 $8.49 BN 202
Total $30.98 BN 1,142 $28.05 BN 1,010

6 MERCHANT BANKING ACTIVITIES CONDUCTED BY FINANCIAL HOLDING COMPANIES: SUMMARY OF RESULTS OF EMPIRICAL DATA STUDY
portfolio investments by participating FHCs was
$19.55 billion as of year-end 2015 and $19.56
billion as of year-end 2014.
TAX-ORIENTED INVESTMENTS (TOI) IN RENEWABLE
ENERGY PROJECTS. This category includes on-
balance-sheet portfolio investments representing
ownership interests in renewable energy
projects, including solar and wind farms, held
under merchant banking authority. The total
capital invested amounts shown here – $11.43
billion as of year-end 2015 and $8.49 billion as of
year-end 2014 – represent a significant portion
of the total amount of financing provided in
support of the renewable energy market in the
United States. As shown in Table 2, we estimate
that the FHCs participating in our study, through
their reliance on merchant banking authority,
facilitate the financing of roughly 40% of the
annual renewable energy market’s financing
needs in the United States. We arrive at this
estimate by calculating the aggregate pro rata
share of the total gigawatts of annual renewable
energy generation capacity of all renewable
energy projects that were financed by our
participating FHCs under merchant banking
authority. This share was 6.7 GW in 2015 and
4.5 GW in 2014. And we then compare those
figures to the estimated total gigawatts of annual
renewable energy generation capacity installed
in the country each year.
II. ASSET MANAGEMENT ACTIVITIES
THAT RELY ON MERCHANT BANKING
AUTHORITY
FHCs often rely on merchant banking authority
to conduct specific types of asset management
activities. These activities typically involve off-
balance-sheet fund structures in which the FHC
sponsors and “controls” a fund (e.g., by acting
as the general partner or managing member of
the fund) that in turn makes merchant banking
investments. Although the FHC will often make
proprietary seed or co-investments in the funds,
the primary purpose behind these structures
is so the FHC can offer interests in the funds to
its customers as a part of conducting an asset
management business.
To measure this activity, our study looked at
the total assets under management (AUM) of
controlled funds that make merchant banking
investments as well as the size of the FHC’s
seed or co-investments, and the results are
shown in Table 3.8
TABLE 3: ASSET MANAGEMENT ACTIVITIES RELYING ON MERCHANT BANKING AUTHORITY
2015 2014
AUM in Funds that Make Merchant Banking Investments
$207.23 BN $146.72 BN
FHC Seed or Co-investments in Same Funds
$7.51 BN $10.53 BN
TABLE 2: U.S. RENEWABLE ENERGY FINANCED UNDER MERCHANT BANKING AUTHORITY
GIGAWATTS FINANCEDBY FHCs UNDER
MERCHANT BANKING AUTHORITY
ESTIMATED TOTAL GIGAWATTS
OF ALL PROJECTS7
% ATTRIBUTABLETO FHCs RELYING ON MERCHANT BANKING
AUTHORITY
2015 6.7 GW 15.9 GW 42.0%
2014 4.5 GW 11.1 GW 40.6%
7 We estimate the total gigawatts of annual renewable energy generation capacity of all renewable energy projects in the country by combining the total installed capacity in gigawatts for both wind and photovoltaic solar during the 2014-2015 period, with the wind information being sourced from the American Wind Energy Association and the photovoltaic solar information being sourced from the Solar Energy Industries Association. We acknowledge that our estimate includes only solar and wind and excludes other renewables (like geo-thermal, etc) but we were unable to source totals for those other categories, and we believe they are materially less significant in their contribution to the total relative to wind and solar. Also, there are admittedly some timing differences in comparing the FHCs’ investment amounts to the total market installations, as in most but not all cases the FHCs are funding projects upon their initial installation (commercial operation), which is why this is an estimate only.
8 Not every investment held by a controlled fund is a merchant banking investment; some such investments may rely on other Bank Holding Company Act authorities, such as Section 4(c)(6) authority.

7 MERCHANT BANKING ACTIVITIES CONDUCTED BY FINANCIAL HOLDING COMPANIES: SUMMARY OF RESULTS OF EMPIRICAL DATA STUDY
The study found that the total fund AUM in
controlled merchant banking funds was $207.23
billion as of year-end 2015 and $146.72 billion as
of year-end 2014. The study also found that the
total capital invested as seed or co-investments
by the participating FHCs into these controlled
funds was $7.51 billion as of year-end 2015
and $10.53 billion as of year-end 2014. As the
data shows, there is a “multiplier effect” at play
here where a limited amount of seed or co-
investments can support a much larger amount
of capital invested in the marketplace – this
multiplier effect is 28x in 2015 and 14x in 2014.
B. FREQUENC Y OF ROUTINE MANAGEMENT OR OPERATION
In the data collection, each participating FHC
was asked to report the number of on-balance-
sheet merchant banking investments held
at year-end 2015 over which the FHC had
exercised routine management or operation at
any point during the 2015 calendar year. Of the
1,142 investments held at year-end 2015, the
FHCs reported that none had been subject to
routine management or operation in 2015.9
C. EVIDENCE OF CORPORATE VEIL-PIERCING
In the data collection, each participating FHC
reported on on-balance-sheet merchant
banking investments that were sold with losses
in each year, as well as whether any individual
investments were sold with losses that exceeded
that amount of capital initially invested. This was
our proxy for corporate veil-piercing as losses
in excess of capital invested would signal that
the FHC investor was liable for operations of a
merchant banking portfolio company. Of the 372
investments sold with losses in our data set, zero
were sold with losses in excess of invested capital.
In other words, we were not able to identify any
instances of corporate veil-piercing.
D. APPROPRIATENESS OF CURRENT RISK-BASED CAPITAL REQUIREMENTS
This section describes the results of the
analysis conducted using historical loss data
on on-balance-sheet merchant banking
investments.10 As set forth below, the analysis
strongly supports the conclusion that existing
risk-based capital requirements are more than
sufficient to cover losses in on-balance-sheet
merchant banking investment portfolios over
the past 15 years, which, it is worth noting,
included the greatest economic downturn in
the post-war period.
In the data collection, each participating FHC
reported historical losses for on-balance-
sheet merchant banking investments.11 These
losses covered the period between 2001
and 2015. The study compares the highest
9 To assess the frequency of routine management or operation exercised by FHCs over portfolio companies, we looked only at the 12-month period of 2015, and we did not look further back. It is possible that a further look-back would have produced more instances of routine management or operation.
10 The study did not analyze loss rates for off-balance-sheet merchant banking investments in controlled merchant banking funds because the information was too difficult to obtain in the time period allotted for our study. At year-end 2015, the FHCs participating in our study had more than 2,600 controlled funds that made merchant banking investments, making a detailed data collection on historical losses associated with such underlying investments not feasible for our study.
11 The study didn’t collect loss data on each individual investment sold with a loss to preserve banks’ proprietary information. Instead, participating banks reported aggregate losses under each on-balance-sheet merchant banking investment type at the end of each year, including only investments sold with a loss.
8 MERCHANT BANKING ACTIVITIES CONDUCTED BY FINANCIAL HOLDING COMPANIES: SUMMARY OF RESULTS OF EMPIRICAL DATA STUDY
historical realized losses on merchant banking
investments to current capital requirements.
For purposes of our study, “current capital
requirements” were calculated using the
requirements in effect as of December 31,
2015, and therefore they did not account
for the fully phased-in Basel III risk weight
increases for certain merchant banking
investments.12 In addition, our study did not
account for the higher capital requirements
that may be imposed on some firms under
CCAR.13 Our results indicate that the “current”
2015 Basel III risk-based capital requirements
are approximately 35 percent higher than the
95th percentile of realized losses on merchant
banking investments over the past 15 years.
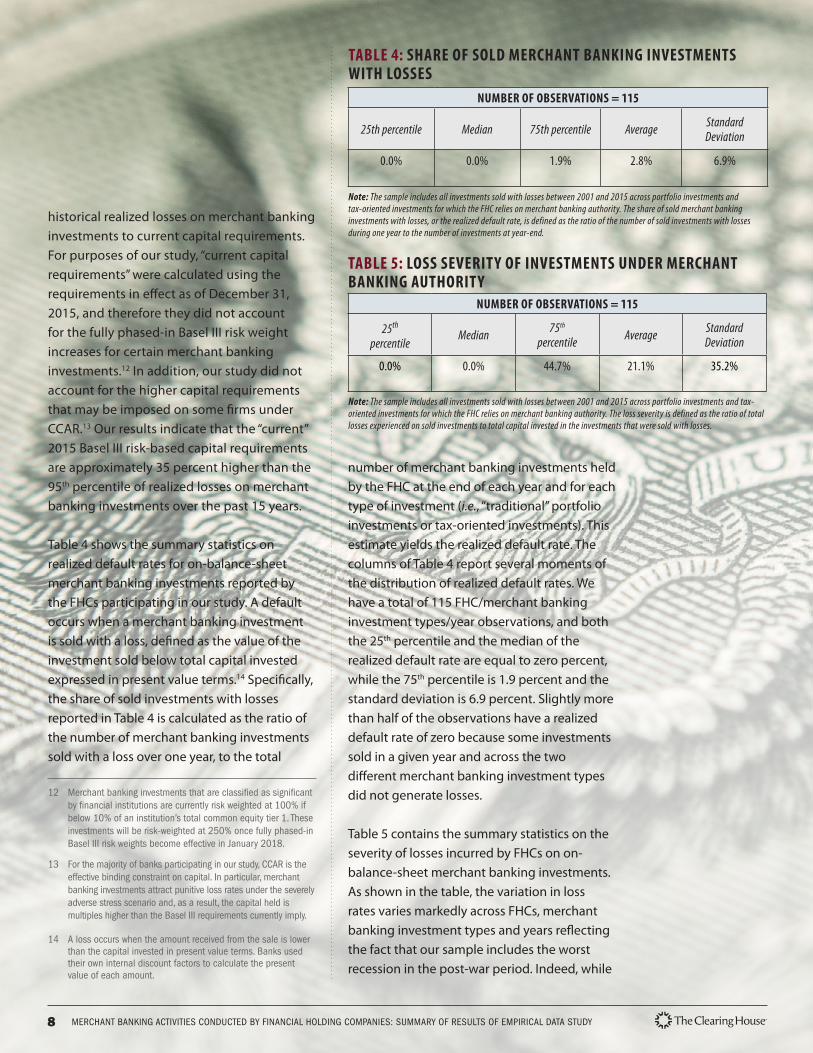
Table 4 shows the summary statistics on
realized default rates for on-balance-sheet
merchant banking investments reported by
the FHCs participating in our study. A default
occurs when a merchant banking investment
is sold with a loss, defined as the value of the
investment sold below total capital invested
expressed in present value terms.14 Specifically,
the share of sold investments with losses
reported in Table 4 is calculated as the ratio of
the number of merchant banking investments
sold with a loss over one year, to the total
number of merchant banking investments held
by the FHC at the end of each year and for each
type of investment (i.e., “traditional” portfolio
investments or tax-oriented investments). This
estimate yields the realized default rate. The
columns of Table 4 report several moments of
the distribution of realized default rates. We
have a total of 115 FHC/merchant banking
investment types/year observations, and both
the 25th percentile and the median of the
realized default rate are equal to zero percent,
while the 75th percentile is 1.9 percent and the
standard deviation is 6.9 percent. Slightly more
than half of the observations have a realized
default rate of zero because some investments
sold in a given year and across the two
different merchant banking investment types
did not generate losses.
Table 5 contains the summary statistics on the
severity of losses incurred by FHCs on on-
balance-sheet merchant banking investments.
As shown in the table, the variation in loss
rates varies markedly across FHCs, merchant
banking investment types and years reflecting
the fact that our sample includes the worst
recession in the post-war period. Indeed, while
12 Merchant banking investments that are classified as significant by financial institutions are currently risk weighted at 100% if below 10% of an institution’s total common equity tier 1. These investments will be risk-weighted at 250% once fully phased-in Basel III risk weights become effective in January 2018.
13 For the majority of banks participating in our study, CCAR is the effective binding constraint on capital. In particular, merchant banking investments attract punitive loss rates under the severely adverse stress scenario and, as a result, the capital held is multiples higher than the Basel III requirements currently imply.
14 A loss occurs when the amount received from the sale is lower than the capital invested in present value terms. Banks used their own internal discount factors to calculate the present value of each amount.
TABLE 5: LOSS SEVERITY OF INVESTMENTS UNDER MERCHANT BANKING AUTHORITY
NUMBER OF OBSERVATIONS = 115
25th
percentileMedian 75th
percentile Average Standard Deviation
0.0% 0.0% 44.7% 21.1% 35.2%
Note: The sample includes all investments sold with losses between 2001 and 2015 across portfolio investments and tax-oriented investments for which the FHC relies on merchant banking authority. The loss severity is defined as the ratio of total losses experienced on sold investments to total capital invested in the investments that were sold with losses.
TABLE 4: SHARE OF SOLD MERCHANT BANKING INVESTMENTS WITH LOSSES
NUMBER OF OBSERVATIONS = 115
25th percentile Median 75th percentile Average Standard Deviation
0.0% 0.0% 1.9% 2.8% 6.9%
Note: The sample includes all investments sold with losses between 2001 and 2015 across portfolio investments and tax-oriented investments for which the FHC relies on merchant banking authority. The share of sold merchant banking investments with losses, or the realized default rate, is defined as the ratio of the number of sold investments with losses during one year to the number of investments at year-end.

9 MERCHANT BANKING ACTIVITIES CONDUCTED BY FINANCIAL HOLDING COMPANIES: SUMMARY OF RESULTS OF EMPIRICAL DATA STUDY
the 25th percentile of losses and the median
were zero percent of capital invested, the 75th
percentile was 44.7 percent of capital invested
and the standard deviation was 35.2 percent.
As was the case for the realized default rate,
the severity of losses is equal to zero if none of
the merchant banking investments sold in a
given year generated losses.
Finally, Table 6 shows the realized loss rates for
merchant banking investments. The realized
loss rate equals the share of investments sold
with a loss (summarized in Table 4) times
the severity of those losses (summarized in
Table 5). The percentiles reported in Table
6 summarize the likelihood of losses of a
certain magnitude for merchant banking
investments. For instance, the 90th percentile of
the realized loss distribution is at 5.5 percent,
that is, there is a 10 percent probability that
losses would exceed 5.5 percent of the size of
the investment over the horizon of one year.
Similarly, the 95th percentile is 8.3 percent,
thus there is a 5 percent chance that losses on
merchant banking investments would exceed
this level over a one-year horizon.
The current Basel III capital requirements for the
aggregate FHCs in our sample as of the fourth
quarter of 2015 was 11.4 percent,15 which is
approximately 35 percent higher than the 95th
percentile of the distribution of realized losses
on merchant banking investments.16 Furthermore,
those banks subject to the global market
shock under CCAR are required to subject their
private equity merchant banking investments
to a shock that decreases the carrying value of
such exposures between 16 percent and 66
percent under the severely adverse scenario,
depending on the industry and geography of such
investments.17 Across all nonfinancial industries
and geographies, the average decline in the
carrying value of private equity investments is
approximately 45 percent.18 Given that the post
stress regulatory capital requirements under
CCAR are typically the binding requirements, the
effective capital requirement for private equity
merchant banking investments is approximately
equal to 45 percent on average for banks subject
to CCAR’s global market shock.
Thus, the empirical distribution of realized
losses strongly supports the conclusion that
existing capital requirements are more than
sufficient to cover losses in merchant banking
portfolios over the past 15 years, which
included the most severe economic downturn
in the post-war period.
TABLE 6: REALIZED LOSS RATES OF MERCHANT BANKING INVESTMENTS
NUMBER OF OBSERVATIONS = 115
75th percentile 90th percentile 95th percentile
1.3% 5.5% 8.3%
Note: The sample includes all investments sold with losses between 2001 and 2015 across portfolio investments and tax-oriented investments for which the FHC relies on merchant banking authority. The realized loss rate is equal to the realized one-year default rate (see Table 4) times loss severity (see Table 5).
15 The aggregate Basel III capital requirement is defined as:
where the index j denotes the number of risk-weighting buckets included in the data collection exercise and the index i represents each of the participating banks.
16 We collected historical loss experience and capital data on the co-investments made by FHCs into their controlled merchant banking funds, but we did not include that data in our overall historical loss analysis because those co-investments are in diversified funds and therefore they do not represent individual investments in merchant banking portfolio companies. If we include the additional 36 historical loss observations associated with these co-investments in our overall analysis, then the capital requirement would rise from 11.4 percent to 14.3 percent and the 95th percentile of realized losses would also increase slightly from 8.3 percent to 8.8 percent. This would result in a Basel III requirement that is approximately 60 percent higher than the 95th percentile of realized losses.
17 See Federal Reserve, CCAR 2017: Severely Adverse Scenario, Private Equity Market Shocks available at https://www.federalreserve.gov/bankinforeg/ccar-2017.htm#data.
18 Forty-five percent represents a simple average of the declines across nonfinancial sectors in all geographies, and is therefore not a weighted average reflecting banks’ actual portfolios.
Annex A
Questionnaire and Data Collection Template

MB uses
Copy of TCH Merchant Banking Data collection template (Dec 5) 1 of 4 3/1/2017 4:39 PM
Merchant Banking Authority UsesShort title Use
1 PI On-balance sheet portfolio investments in equity of non-financial companies
2 TOI Tax-oriented investments in renewable energy projects
3 AM Investments by controlled funds and real estate fund structures into non-financial companies and certain seed or co-investments into controlled fund structures.

PI
Copy of TCH Merchant Banking Data collection template (Dec 5) 2 of 4 3/1/2017 4:39 PM
Item Data fields Dec-15 Dec-14 Dec-13 Dec-01Scale of activity:
1 Total invested capital at year end ($ millions)
2 Co-investment amount at year end ($ millions)
3 Total fund AUM at year end ($ millions)
4 Number of investments at year end (#)
5 Number of investments at year end over which FHC exercised routine management in past 12 months
Loss experience:
6 Number of investments sold in calendar year (#)
7 Number of sold investments with losses (#)
8 Total losses experienced on sold investments ($ millions)
9 Total capital invested in the investments that were sold with losses ($ millions)
10 Number of investments sold where the losses were in excess of the capital invested (proxy for veil-piercing) (#)
11 For investments identified in item 10, provide total losses in excess of capital invested ($ millions)
12 For investments identified in item 10, provide total capital invested ($ millions)
Capital treatment:
13 CCAR 2016 Severely Adverse Scenario Losses ($ millions)
14 Carrying value of investment deducted from CET1 ($ millions)
15 Carrying value risk-weighted at 100% ($ millions)
16 Carrying value risk-weighted at 300% ($ millions)
17 Carrying value risk-weighted at 400% ($ millions)
18 Carrying value risk-weighted at 600% ($ millions)
19 Carrying value risk-weighted at 1250% ($ millions)

TOI
Copy of TCH Merchant Banking Data collection template (Dec 5) 3 of 4 3/1/2017 4:39 PM
Item Data fields Dec-15 Dec-14 Dec-13 Dec-01 NotesScale of activity:
1 Total invested capital at year end ($ millions)
2 Co-investment amount at year end ($ millions)
3 Total fund AUM at year end ($ millions)
4 Number of investments at year end (#)
5 Number of investments at year end over which FHC exercised routine management in past 12 months
Loss experience:
6 Number of investments sold in calendar year (#)
7 Number of sold investments with losses (#)
8 Total losses experienced on sold investments ($ millions)
9 Total capital invested in the investments that were sold with losses ($ millions)
10 Number of investments sold where the losses were in excess of the capital invested (proxy for veil-piercing) (#)
11 For investments identified in item 10, provide total losses in excess of capital invested ($ millions)
12 For investments identified in item 10, provide total capital invested ($ millions)
Capital treatment:
13 CCAR 2016 Severely Adverse Scenario Losses ($ millions)
14 Carrying value of investment deducted from CET1 ($ millions)
15 Carrying value risk-weighted at 100% ($ millions)
16 Carrying value risk-weighted at 300% ($ millions)
17 Carrying value risk-weighted at 400% ($ millions)
18 Carrying value risk-weighted at 600% ($ millions)
19 Carrying value risk-weighted at 1250% ($ millions)
Other items:
20 Total Gigawatts of capacity invested in using MB authority (GW)

AM
Copy of TCH Merchant Banking Data collection template (Dec 5) 4 of 4 3/1/2017 4:39 PM
Item Data fields Dec-15 Dec-14 Dec-13 Dec-01 NotesScale of activity:
1 Total invested capital at year end ($ millions)
2 Co-investment amount at year end ($ millions)
3 Total fund AUM at year end ($ millions)
4 Number of investments at year end (#)
5 Number of investments at year end over which FHC exercised routine management in past 12 months
Loss experience:
6 Number of investments sold in calendar year (#)
7 Number of sold investments with losses (#)
8 Total losses experienced on sold investments ($ millions)
9 Total capital invested in the investments that were sold with losses ($ millions)
10 Number of investments sold where the losses were in excess of the capital invested (proxy for veil-piercing) (#)
11 For investments identified in item 10, provide total losses in excess of capital invested ($ millions)
12 For investments identified in item 10, provide total capital invested ($ millions)
Capital treatment:
13 CCAR 2016 Severely Adverse Scenario Losses ($ millions)
14 Carrying value of investment deducted from CET1 ($ millions)
15 Carrying value risk-weighted at 100% ($ millions)
16 Carrying value risk-weighted at 300% ($ millions)
17 Carrying value risk-weighted at 400% ($ millions)
18 Carrying value risk-weighted at 600% ($ millions)
19 Carrying value risk-weighted at 1250% ($ millions)

In general Instructions
• The purpose of this template is to collect from participating FHCs data on activities conducted, and investments made, under BHC Act Section 4(k)(4)(H) merchant banking authority (“MB authority”). In general, MB authority is used by FHCs to hold investments in nonfinancial companies when the investment represents either more than 5% of the voting shares of the company or “control” of the company under the BHC Act.
• This template collects data across three categories of “uses” of MB authority:
o Portfolio Investments (“PI”)
This category includes on-balance sheet portfolio investments held under MB authority (except renewable energy projects and asset management-related co- investments, which are reported in the TOI and AM categories, respectively).
o Tax-oriented investments (“TOI”)
This category includes on-balance sheet portfolio investments representing ownership interests in renewable energy projects, including solar and wind farms, held under MB authority.
o Asset Management (“AM”)
This category includes both:
• any investment vehicle (including a private equity fund, real estate fund or similar fund-like structure (collectively, a “fund”)) that is controlled by the FHC for BHC Act purposes (e.g., the FHC acts as the general partner or managing member of the fund) and for which the FHC relies at least in part on MB authority for the investment activities conducted by the fund (collectively, “controlled MB funds”); and
• on-balance sheet seed or co-investments made by the FHC into the controlled MB funds for which the FHC relies upon MB authority.
• Report data on a global basis – meaning report data on activities and investments inside and outside the United States where MB authority is relied upon.
• Report data only on activities and investments for which the FHC relies directly on MB authority. Do not report data on activities and investments (i) for which the FHC relies on legal authority other than MB authority (like BHC Act Section 4(c)(6) or 4(c)(7)), or (ii) for which MB authority might be “back-up” authority.
• There may be activities and investments conducted by your firm under MB authority that are not captured by one of the three categories on this template, and that is fine. Do not report data on such activities and investments on this template.
• Provide data on a “best efforts” basis and provide as much historical data as possible. We understand firms will have limitations in this regard.

Scale of Activity
Item 1
• For each of PI and TOI: report the USD figure in millions of the total capital invested by the FHC at the applicable year end. Report the MTM value of all outstanding investments at the applicable year end.
o For TOI only, include off balance sheet commitments such as pay-go’s, which are considered committed capital by the industry.
Item 2
• For AM only: report the USD figure in millions for all seed or co-investments made by the FHC into the controlled MB funds at the applicable year end.
o In this item, also include any amount invested by the FHC ‘alongside’ the fund structures to the extent this ‘alongside investment’ supports the asset management activity and is made relying upon MB authority.
Item 3
• For AM only: report the USD figure in millions of total assets under management (AUM) for all controlled MB funds at the applicable year end.
Item 4
• For each of PI, TOI and AM: report the total number of investments made under MB authority at the applicable year end.
o For AM, count each underlying portfolio company investment held under MB authority by a controlled MB fund. Do not count the controlled MB funds themselves.
Item 5
• For each of PI, TOI and AM: report the total number of investments made under MB authority at December 31, 2015 over which the FHC had exercised routine management or operation at any point during the 2015 calendar year.
Loss Experience
Item 6
• For each of PI, TOI and AM: report the total number of investments held under MB authority that were sold in the applicable calendar year.
Item 7
• For each of PI, TOI and AM: of the investments reported in item 6, report the number that were sold at a loss in the applicable calendar year.
Item 8
• For each of PI, TOI and AM: for the investments reported in item 7 (investments sold at a loss), report the USD figure in millions of the total losses experienced in each calendar year.

Item 9
• For each of PI, TOI and AM: for the investments reported in item 7 (investments sold at a loss in a particular year), report the USD figure in millions for the total capital that the FHC had invested in these entities.
Item 10
• For each of PI, TOI and AM: of the investments reported in item 7 (investments sold at a loss in a particular year), report the number that were sold at a loss that exceeded the amount of capital the FHC had invested in the entity. o We view this is a proxy for instances in which the corporate veil was pierced, thereby
exposing the FHC to liability in excess of the capital it invested.
Item 11
• For each of PI, TOI and AM: for the investments reported in item 10 (veil piercing), report the USD figure in millions for the total losses experienced by the FHC in excess of the capital that the FHC had invested in these entities.
Item 12
• For each of PI, TOI and AM: for the investments reported in item 10 (veil piercing), report the USD figure in millions for the total capital that the FHC had invested in these entities.
Additional notes for the Loss Experience section:
• When tabulating losses, you may account for and include off-sets like ultimately realized escrows and deferred tax assets (DTAs).
• For items 6-9, note that investments that are fully ‘written down’ in a particular year should be considered ‘sold’ in that year.
• Question: If a partial write-down occurs in year 2012, but investment not sold until 2013, then in what year should partial write down be reported – in the year of the partial write down or in the year the investment was fully written down or sold?
• Response: The aggregate losses should be reported in the year in which the investment is no longer on the bank’s balance sheet. The present value of write- downs would be calculated using the bank’s own internal discount rate.
• Similarly, for items 6-9 (and to the extent practicable), note that for investments that are sold off over the course of more than 1 year, please consider the entire investment “sold” in the year in which the final portion is sold and assign any and all losses associated with the investment to that particular final year (and do not assign losses to prior years). This approach is for the sake of simplicity, but if not possible then assign losses in the years in which recognized through partial sales.
• For items 6-12, note that in responding to these items for the AM category, provide data on losses experienced by the FHC only, and do not include losses experienced by

controlled MB funds themselves, unless the funds are consolidated by the FHC for financial reporting purposes.
Capital Treatment
Item 13
• For each of PI, TOI and AM: report the USD figure in millions for losses associated with investments held under MB authority as those losses were reported under the severely adverse scenario in the FHC’s 2016 CCAR filing.
Item 14
• For each of PI, TOI and AM: report the USD figure in millions of the carrying value of investments held under MB authority that were deducted from the FHC’s CET1 for capital calculation purposes at December 31, 2015.
Item 15
• For each of PI, TOI and AM: report the USD figure in millions of the carrying value of investments held under MB authority that were risk-weighted at 100% for capital calculation purposes at December 31, 2015.
Item 16
• For each of PI, TOI and AM: report the USD figure in millions of the carrying value of investments held under MB authority that were risk-weighted at 300% for capital calculation purposes at December 31, 2015.
Item 17
• For each of PI, TOI and AM: report the USD figure in millions of the carrying value of investments held under MB authority that were risk-weighted at 400% for capital calculation purposes at December 31, 2015.
Item 18
• For each of PI, TOI and AM: report the USD figure in millions of the carrying value of investments held under MB authority that were risk-weighted at 600% for capital calculation purposes at December 31, 2015.
Item 19
• For each of PI, TOI and AM: report the USD figure in millions of the carrying value of investments held under MB authority that were risk-weighted at 1,250% for capital calculation purposes at December 31, 2015.
Other items
Item 20
• For TOI only: report the total gigawatts of annual renewable energy generation capacity of all renewable energy projects invested in for each calendar year where the FHC’s

investments were the made using MB authority, but compute this figure by multiplying a particular project’s capacity in GWs by the % of tax equity provided by your firm under MB authority. This computational method will avoid double-counting of two or more firms in the same project.