Secondary Science: Instructional Map for Environmental...
16
Secondary Science: Curriculum Map for Environmental Science Second Nine Weeks 2013 - 2014 Page 1 of 16 Content Embedded Standards Outcomes Adopted Resources Core Ideas Unit 2.1 Ecology/ Aquatic Ecosystems 1 Week CLE 3255.5.3 Examine the major marine and freshwater biomes. . CLE3260.Inq.1 Recognize that science is a progressive endeavor that reevaluates and extends what is already accepted. CLE 3260.Inq.3 Use appropriate tools and technology to collect precise and accurate data. CLE 3260.Inq.2 Design and conduct scientific investigations to explore new phenomena, verify previous results, test how well a theory predicts, and compare opposing theories. CLE 3260.Inq.4 Apply qualitative and quantitative measures to analyze data and draw conclusions that are free of bias. CLE.I 3260 Inq.6 Communicate and defend scientific findings. Research and create a visual to summarize abiotic factors, location, plant adaptations, animal adaptations, and human threats to marine and freshwater biomes. HRW Ch. 7 Interactive Explorations CD Rom *Flood bank www.explorelearning.com *Pond Ecosystem Activities/Labs *Lab: Eutrophication: Too Much of a Good Thing, pp.204-205 *Lab: Estuaries. p.192 *Speaker: Wolf River Conservancy *Case Study: Restoration of the Chesapeake Bay, pp.192-193 *Maps in Action: Wetlands in the United States, 1780's vs. 1980's, p.206 *Society & the Environment: Hurricane Katrina and New Orleans, p.207 Media/Ancillaries *TO-SP .ppt: Sect 7.1, 7.2 *Transparencies: Life Zones in a Lake; Freshwater Wetlands in the United States; The Formation of Estuaries; Coral Reefs of the World; Life Zones of the Ocean. RST.11-12.2.Determine the central ideas or conclusions of a complex process, phenomenon, or concept; provide an accurate summary of the text. NGSS 8. Obtaining, evaluating, and communicating information
Transcript of Secondary Science: Instructional Map for Environmental...

Secondary Science: Curriculum Map for Environmental Science
Second Nine Weeks
2013 - 2014 Page 1 of 16
Content Embedded
Standards
Outcomes Adopted Resources Core Ideas
Unit 2.1 Ecology/ Aquatic Ecosystems 1 Week
CLE 3255.5.3 Examine the major marine and freshwater biomes.
. CLE3260.Inq.1 Recognize that science is a progressive endeavor that reevaluates and extends what is already accepted.
CLE 3260.Inq.3 Use appropriate tools and technology to collect precise and accurate data.
CLE 3260.Inq.2 Design and conduct scientific investigations to explore new phenomena, verify previous results, test how well a theory predicts, and compare opposing theories.
CLE 3260.Inq.4 Apply qualitative and quantitative measures to analyze data and draw conclusions that are free of bias.
CLE.I 3260 Inq.6 Communicate and defend scientific findings.
Research and create a visual to summarize abiotic factors, location, plant adaptations, animal adaptations, and human threats to marine and freshwater biomes.
HRW Ch. 7
Interactive Explorations CD Rom *Flood bank
www.explorelearning.com *Pond Ecosystem
Activities/Labs *Lab: Eutrophication: Too Much ofa Good Thing, pp.204-205 *Lab: Estuaries. p.192*Speaker: Wolf RiverConservancy *Case Study: Restoration of theChesapeake Bay, pp.192-193 *Maps in Action: Wetlands in theUnited States, 1780's vs. 1980's, p.206*Society & the Environment:Hurricane Katrina and New Orleans, p.207
Media/Ancillaries *TO-SP .ppt: Sect 7.1, 7.2*Transparencies: Life Zones in aLake; Freshwater Wetlands in the United States; The Formation of Estuaries; Coral Reefs of the World; Life Zones of the Ocean.
RST.11-12.2.Determine the central ideas or conclusions of a complex process, phenomenon, or concept; provide an accurate summary of the text.
NGSS 8. Obtaining, evaluating, andcommunicating information

Secondary Science: Instructional Map for Environmental Science
Second Nine Weeks
2013 - 2014 Page 2 of 16
Content Embedded
Standards
Outcomes Adopted Resources Core Ideas
CLE 3260.Inq.5 Compare experimental evidence
CLE 3260.T/E.2 Differentiate among elements of the engineering design cycle: design constraints, model building, testing, evaluating, modifying, and retesting.
Student Practice *Section Review 7.1, 7.2; *Chapter Review and *Standardized Test Pre www.scilinks.org *Lakes and Ponds HE 4058 *Estuaries HE 4037

Secondary Science: Instructional Map for Environmental Science
Second Nine Weeks
2013 - 2014 Page 3 of 16
Content Embedded
Standards
Outcomes Adopted Resources Core Ideas
Unit 2.2 Populations/Understanding Populations 2 Weeks CLE 3255.2.1 Cite examples of populations limited by natural factors, humans or both. CLE 3255.3.1 Explain ecological niches within various habitats. CLE 3255.3.2 Relate species interactions such as competition, predation and symbiosis to coevolution. survival.
CLE 3260.Inq.22 Design and conduct scientific investigations to explore new phenomena, verify previous results, test how well a theory predicts and compare opposing theories
Define population and describe several examples of populations in different ecosystems. Identify distribution patterns (random, uniform, clumped with groups random) and populations that exhibit each of these patterns. Evaluate populations based on age structure, distribution, and density. Categorize limiting factors as density dependent or density independent, human influenced or non-human influenced, and biotic or abiotic when given scenarios. Draw and/or label population growth curves representing exponential growth, logistic growth and carrying capacity. Illustrate the type of survivorship curves created by r-strategists and K-strategists. Research case studies (Tasmanian sheep, St. Matthew’s Island reindeer, Isle Royale) to*Describe the difference between a fundamental niche and a realized niche. Distinguish among the following roles and
* HRW Ch 8 www.explorelearning.com * Estimating Population Size *Food Chain *Rabbit Population by Season *Rainfall and Bird Beaks www.NSTA.org www.ti.com www.go.hrw.com Interactive Tutor CD –describing Populations: How Populations Change in Size Populations: How Populations Change in Size Group Activity- Draw an ecosystem and identify the components as biotic or abiotic, note distribution patterns. List factors that would limit populations. *Field Activity: Observing Competition, p.218 *Case Study: Predator-Prey Adaptations, pp.220-221 *Points of View: Where Should the Wolves Roam? pp.232-233
RST.11-12.3.Follow precisely a complex multistep procedure when carrying out experiments, taking measurements, or performing technical tasks, attending to special cases or exceptions defined in the text. NGSS 1. Asking questions (for science) and defining problems (for engineering) 3. Planning and carrying out investigations 4. Analyzing and interpreting data 8. Obtaining, evaluating, and communicating information
Secondary Science: Instructional Map for Environmental Science
Second Nine Weeks
2013 - 2014 Page 4 of 16
Content Embedded
Standards
Outcomes Adopted Resources Core Ideas
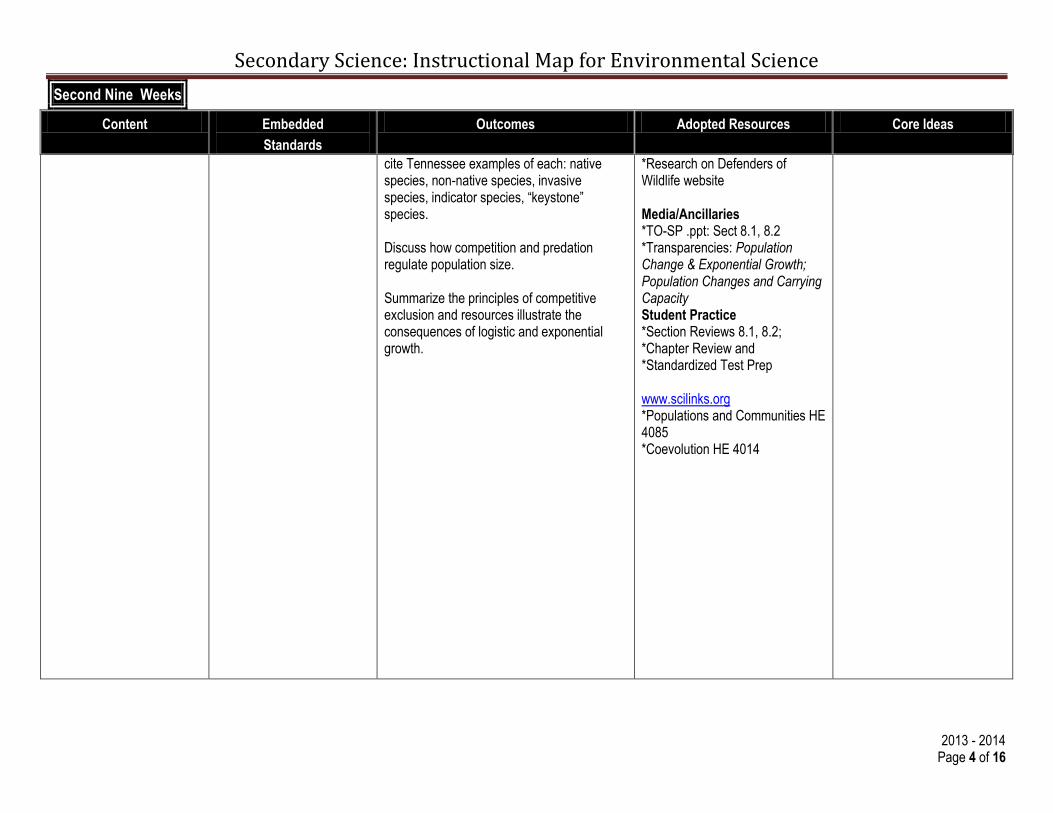
cite Tennessee examples of each: native species, non-native species, invasive species, indicator species, “keystone” species. Discuss how competition and predation regulate population size. Summarize the principles of competitive exclusion and resources illustrate the consequences of logistic and exponential growth.
*Research on Defenders of Wildlife website Media/Ancillaries *TO-SP .ppt: Sect 8.1, 8.2 *Transparencies: Population Change & Exponential Growth; Population Changes and Carrying Capacity Student Practice *Section Reviews 8.1, 8.2; *Chapter Review and *Standardized Test Prep www.scilinks.org *Populations and Communities HE 4085 *Coevolution HE 4014

Secondary Science: Instructional Map for Environmental Science
Second Nine Weeks
2013 - 2014 Page 5 of 16
Content Embedded
Standards
Outcomes Adopted Resources Core Ideas
Unit 2.3 Populations/ The Human Population – 2 Weeks
CLE 3260.3.1 Demonstrate how human population growth over time has been affected by improved food production, healthcare, sanitation and industrial advances. CLE 3260.3.2 Research demographics and economics status of different countries to infer ecological and economic consequences of human population growth. CLE 3260.3.3 Explain how social and economic factors affect the fertility rate and life expectancy of the human population.
. CLE 3260.Inq.5 Compare experimental evidence and conclusions with those drawn by others about the same testable question. CLE 3260.Inq.12 Develop a logical argument about cause-and-effect relationships in an experiment. CLE 3260.T/E.1 Explore the impact of technology on social, political, and economic systems.
Interpret and create graphs depicting human populations. Compare and contrast population growth rates and demographics for countries at various stages of economic development. Analyze age structure diagrams to predict population growth rates. Describe how he U.S. population experienced demographics transition . Use the concept of ecological footprint to predict the ecological consequences of human population growth. Discuss pros and cons of methods used to manage a country’s population growth.
HRW Ch 9 go.hrw.com p. 233B Google Earth www.epa.gov www.nasa.gov www.usda.gov www.newscientist.gov Activities/Labs *Lab Human Population Growth Simulation *Maps in Action Fertility Rates and Female Literacy in Africa *Field Activity, pp. 253 *Case Study: Thailand's Population Challenges *View film The People Bomb Media/Ancillaries
RST.11-12.9. Synthesize information from a range of sources (e.g. texts, experiments, simulations) into a coherent understanding of a process, phenomenon, or concept, resolving conflicting information when possible NGSS 1. Asking questions (for science) and defining problems (for engineering) 4. Analyzing and interpreting data 5. Using mathematics and computational thinking 7. Engaging in argument from evidence 8. Obtaining, evaluating, and communicating information
Secondary Science: Instructional Map for Environmental Science
Second Nine Weeks
2013 - 2014 Page 6 of 16
Content Embedded
Standards
Outcomes Adopted Resources Core Ideas
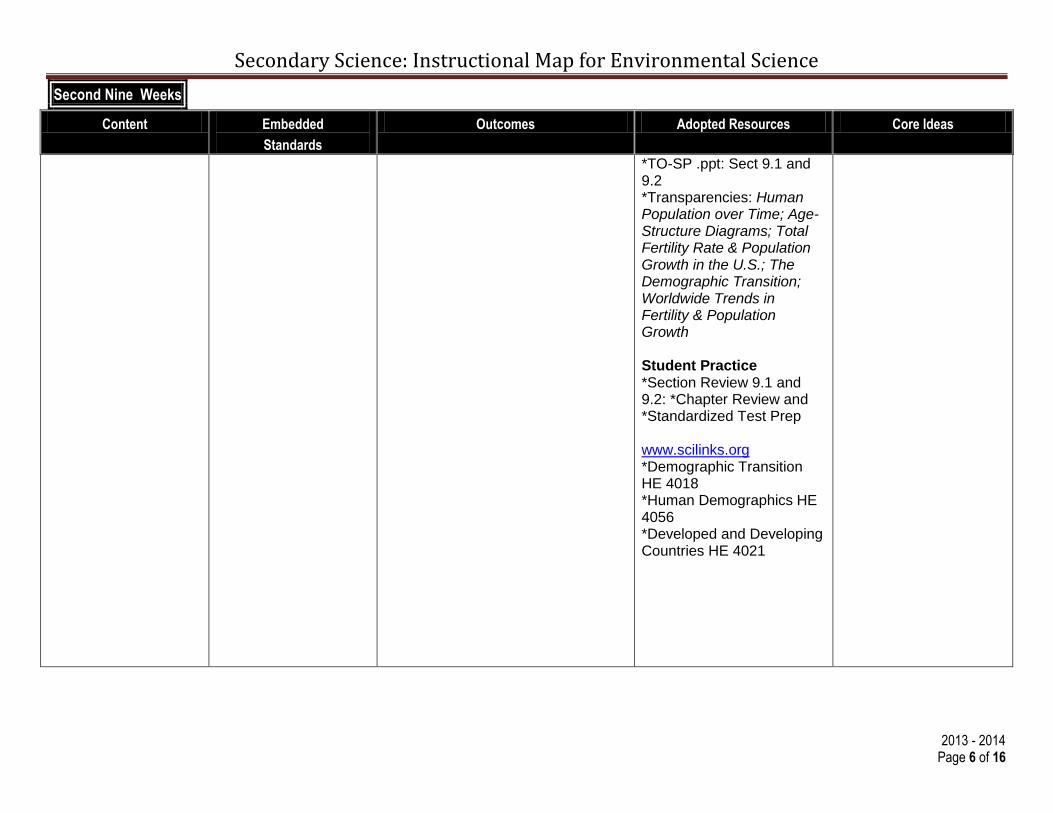
*TO-SP .ppt: Sect 9.1 and 9.2 *Transparencies: Human Population over Time; Age-Structure Diagrams; Total Fertility Rate & Population Growth in the U.S.; The Demographic Transition; Worldwide Trends in Fertility & Population Growth Student Practice *Section Review 9.1 and 9.2: *Chapter Review and *Standardized Test Prep www.scilinks.org *Demographic Transition HE 4018 *Human Demographics HE 4056 *Developed and Developing Countries HE 4021

Secondary Science: Instructional Map for Environmental Science
Second Nine Weeks
2013 - 2014 Page 7 of 16
Content Embedded
Standards
Outcomes Adopted Resources Core Ideas
Unit 2.4 Populations/Biodiversity --- 2 Weeks
CLE 3255.1.4 Investigate various approaches to maintain biodiversity. CLE 3255.4.4 Summarize the human impact on ecosystems. CLE 3255.4.5 Describe how biodiversity relates to stability of an ecosystem CLE 3255.5.4 Infer how organisms in different biomes occupy similar niches. CLE 3255.Inq.5 Compare experimental evidence and conclusions with those drawn by others about the same testable question. CLE 3260.2. Discuss the roles of biodiversity and co-evolution in ecosystems.
CLE 3260.Inq.2 Design and conduct scientific investigations to explore new phenomena, verify previous results, test how well a theory predicts and compare opposing theories CLE 3260.Inq.6 Communicate and defend scientific findings
Compare two or more ecological equivalents and how they are specifically adapted to their particular biome (black/grizzly bears, Asian/African elephants, snowshoe/cottontail/jack rabbit). Describe how species biodiversity relates to ecosystem stability. Choose three endangered species and predict how their removal would affect the ecosystem. Investigate techniques and findings of the All Taxa Biodiversity Inventories (ATBI) underway in the Great Smoky Mountains National Park and Tennessee State Parks. Summarize how disturbance contributes to succession and ecosystem stability. Explore careers in conservation biology and bioinformatics. Present research on current Bio-engineering technologies that advance health and contribute to improvements in our daily lives.
HRW Ch 10: Go.hrw.com p. 257B Interactive Tutor CD – Something’s Fishy www.explorelearning.com *Dichotomous Key Google Earth www.epa.gov www.nasa.gov www.usda.gov www.newscientist.gov Activities/Labs *Lab- Design a Wildlife Preserve, p.272 *Lab- Differences in Diversity, pp.282-283 *Computer Lab: Explore IUCN's Red List website *Group Activity: Research
RST.11-12.3.Follow precisely a complex multistep procedure when carrying out experiments, taking measurements, or performing technical tasks, attending to special cases or exceptions defined in the text. RST.9-10.9.Compare and contrast findings presented in a text to those from other sources (including their own experiments), noting when the findings support or contradict previous explanations or accounts NGSS 1. Asking questions (for science) and defining problems (for engineering) 4. Analyzing and interpreting
Secondary Science: Instructional Map for Environmental Science
Second Nine Weeks
2013 - 2014 Page 8 of 16
Content Embedded
Standards
Outcomes Adopted Resources Core Ideas
ecotourism pros & cons *Group Activity- Computer Research of TABS at http://fwie.fw.vt.edu/TN/ *Computer: Research Cat Drop in Borneo by WHO Media/Ancillaries *TO-SP .ppt: Sect 10.1, 10.2, 10.3 *Transparencies: Biodiversity and Extinction Over Geologic Time; Species Known to Be Threatened or Extinct Worldwide; Global Biodiversity Hotspots; Known and Estimated Numbers of Species on Earth; Sea Otters as an Example of a Keystone Species; A Genetic Bottleneck Student Practice *Section Review 10.1, 10.2, 10.3 *Chapter Review *Standardized Test Prep *Appendix Section-Environmental Careers: pp. 629-642.
data 7. Engaging in argument from evidence 8. Obtaining, evaluating, and communicating information

Secondary Science: Instructional Map for Environmental Science
Second Nine Weeks
2013 - 2014 Page 9 of 16
Content Embedded
Standards
Outcomes Adopted Resources Core Ideas
www.scilinks.org *Biodiversity HE 4005 *Medicines from Plants HE4065 *Endangered Species HE 4031 *Preserving Ecosystems HE4088

Secondary Science: Instructional Map for Environmental Science
Second Nine Weeks
2013 - 2014 Page 10 of 16
Content Embedded
Standards
Outcomes Adopted Resources Core Ideas
Unit 2.5 Water, Air and Land/Water --- 1 Week
CLE3260.6.1 Investigate the causes, environmental effects, and methods for controlling/preventing land, air and water pollution. CLE3260.6.2 Apply case studies to relate land, air, and water pollution to human health issues. CLE3260.6.3 Explore methods used by remediation of land, air, and water pollution.
CLE3260.Inq.12 Formulate and revise scientific explanations and models using logic and evidence. CLE3260.Inq.6 Communicate and defend scientific findings. CLE 3260.Inq.5 Compare experimental evidence and conclusions with those drawn by others about the same testable question.
Differentiate between point and non-point sources of pollution as they apply to air and water. Conduct a watershed analysis of a local stream. Test for chemical and biological (infectious) pollutants include a survey of macro invertebrates. Investigate a state or local environmental issue involving Explore case studies of human health problems related to pollutants. Use an environmentally significant case study (e.g., Oil Exploration in the Alaskan Wildlife Refuge) to explain the difference between preservation and conservation. Summarize the roles of various public and private organizations (e.g., Natural conservancy, Sierra club, National wildlife Federation, world Wildlife Fund, U.S. forest Service, U.S. Fish and Wildlife bureau of Land Management,
HRW Ch 11 Interactive Tutor CD – The Water cycle, Flood Bank go.hrw.com p. 209B Google Earth www.epa.gov www.nasa.gov www.usda..gov www.newscientist.gov www.explorelearning.com *Water Pollution * Greenhouse Effect *Solving Using Trends Lines *Hearing: Frequency and Volume * Effects of Environment on New Life Forms) Activities/Labs *Group Activity: create a model of the Memphis aquifer
RST.9-10.9. Compare and contrast findings presented in a text to those from other sources (including their own experiments), noting when the findings support or contradict previous explanations or accounts. NGSS 1. Asking questions (for science) and defining problems (for engineering) 2. Developing and using models 3. Planning and carrying out investigations 4. Analyzing and interpreting data 5. Using mathematics and computational thinking 6. Constructing explanations (for science) and designing solutions (for engineering) 7. Engaging in argument from evidence 8. Obtaining, evaluating, and communicating information

Secondary Science: Instructional Map for Environmental Science
Second Nine Weeks
2013 - 2014 Page 11 of 16
Content Embedded
Standards
Outcomes Adopted Resources Core Ideas
Department of Environment and Conservation) involved in natural resource protection and use. Research wetlands in your area and write a persuasive letter to a public official concerning the protection of wetlands. Explore how the unintended consequences of new technologies can impact human and non-human communities. Present research on current bioengineering technologies that advance health and contribute to improvements in our daily lives.
*Computer: Research our area at www.epa.gov/watersheds *Case Study: The Ogallala Aquifer *Field Activity: Coastal Cleanups, p.313 *Lab: Groundwater Filters, pp.320-321 *Points of View: The Three Gorges Dam, pp.322-323 Media/Ancillaries *TO-SP .ppt: Sect 11.1, 11.2, 11.3 *Transparencies: Watersheds of the World; Groundwater and the Water Table; Drinking-Water Treatment; The Waterwater Treatment Process; How Pollutants enter Groundwater; Major North American Oil Spills *Film: The Lorax Student Practice *Section Reviews 11.1, 11.2, 11.3 * Chapter Review *Standardized Test Prep

Secondary Science: Instructional Map for Environmental Science
Second Nine Weeks
2013 - 2014 Page 12 of 16
Content Embedded
Standards
Outcomes Adopted Resources Core Ideas
www.scilinks.org *Watersheds HE 4124 *Groundwater HE 4052 *Water Conservation HE 4121 *Pollution HE 4122

Secondary Science: Instructional Map for Environmental Science
Second Nine Weeks
2013 - 2014 Page 13 of 16
TOOLBOX
Unit 2.1 Ecology/ Aquatic Ecosystems 1 Week
Plans
This plan provides an introduction to the concept of a biome with examples. Emphasis is on the relationship between climate, plant life, and animal life. http://www.lessonsnips.com/lesson/biomeworld Teachers can easily include an overview of biomes into their classrooms using some of the ideas for lesson plans at http://suite101.com/article/biome-lesson-plan-a181045
Background for Teachers
Information about the world’s major biomes: http://www.ucmp.berkeley.edu/exhibits/biomes/index.php
Teachers and students can use the following site to learn more about terrestrial and aquatic biomes by clicking on the name of the biomes at http://bioexpedition.com/biomes/
Student Activities
The Biomes Project is an opportunity for you to do your own research on a particular biome. Your teacher may allow you to pick a biome, or he or she may select one for you. You will work in teams to research critical issues of your biome from different points of view. After your research, you will create a project to teach your classmates about the critical issues surrounding your biome. http://www.teachersfirst.com/lessons/biomes/project.php
Your mission, should you choose to accept it, is to investigate biomes, then test your knowledge about the biomes by completing each
mission. http://earthobservatory.nasa.gov/Experiments/Biome/ Other Resources
Click on the name of a biome to learn about it, then explore the additional links to a variety of resources. http://www.worldbiomes.com/default.htm
Unit 2.2 Populations/Understanding Populations 2 Weeks
Plans
Through a mix of modeling and direct instruction, learners are introduced to exponential data. They investigate the population of the United States using the TI-nspire calculator. Multiple data representations are used to explore aspects of the growing population. http://www.lessonplanet.com/teachers/lesson-plan-how-fast-is-the-us-population-growing Students study patterns of population growth in an ecosystem and why populations must remain in balance. They interpret basic
population graphs and suggest scenarios about different population growth patterns in an ecosystem. http://www.lessonplanet.com/teachers/lesson-plan-population-patterns

Secondary Science: Instructional Map for Environmental Science
Second Nine Weeks
2013 - 2014 Page 14 of 16
TOOLBOX
Background for Teachers
Provides a general background on factors affecting population growth rate and some of the problems that may develop if a population grows too quickly. http://www.worldbank.org/depweb/english/modules/social/pgr/
A summary of population distribution patterns with links to related topics is provided at http://www.geography.learnontheinternet.co.uk/topics/popn1.html
Student Activities
You will graph data on the Kaibab deer population of Arizona from 1905 to 1939, determine factors responsible for the changing populations and determine the carrying capacity of the Kaibab Plateau. http://biologycorner.com/worksheets/kaibab.html#.UbX26dibtkQ
Other Resources
A population distribution match-up activity: http://www.geography.learnontheinternet.co.uk/activities/popn_distribution.html
What wiped out St. Matthew’s Island reindeer? http://www.alaskadispatch.com/article/what-wiped-out-st-matthew-islands-reindeer
Unit 2.3 Populations/ The Human Population – 2 Weeks Plans Food for Thought is a spatial graphing activity that uses the participants as part of the graph. The activity helps students develop a
feeling for the similarities and differences between populations. Many measures are used for comparison including population, population density, population growth rates, energy consumption, CO2 emissions, and more. http://www.prb.org/Educators/LessonPlans/2000/FoodforThought.aspx This lesson plan includes three activities that allow students to: develop a working vocabulary for population geography; understand relationships and implications of demographic data; and construct and analyze population pyramids at different scales. Written for advanced high school students or may be adapted for other grade levels. http://www.prb.org/Educators/LessonPlans/2005/PopulationBuildingaFoundation.aspx
Background for Teachers
This article summarizes facts about population growth: http://www.encyclopedia.com/topic/Population_growth.aspx The following site contains links to many articles that focus on the global issue of population growth: http://www.globalissues.org/issue/198/human-population
Student Activities
GeoSim IntlPop is an applet that exposes students to the population growth and age distribution of selected countries and regions of the world. Population projections for each country can be simulated, and students may modify birth and death rates to investigate any resulting effects on the projected populations. http://geosim.cs.vt.edu/Java/IntlPop/IntlPop.html

Secondary Science: Instructional Map for Environmental Science
Second Nine Weeks
2013 - 2014 Page 15 of 16
TOOLBOX
Using Avida-ED freeware, students control a few factors in an environment populated with digital organisms, and then compare how changing these factors affects population growth. They experiment by altering the environment size (similar to what is called carrying capacity, the maximum population size that an environment can normally sustain), the initial organism gestation rate, and the availability of resources. http://www.teachengineering.org/view_activity.php?url=collection/mis_/activities/mis_population/mis_population_activity1.xml
Other Resources
World population reaching seven billion is a great opportunity for you to incorporate environmental education and global studies into your classroom. The following teacher-friendly activities are classroom-ready and will get your students to actively engage in these timely issues. http://www.worldof7billion.org/teacher_resources While population growth in Vietnam in general and migration into this region more specifically played a role in deforestation, the series of events and the causes of deforestation end up being more complex than might first appear. This case study helps you investigate this situation and to make more nuanced conclusions and critiques of the theories presented in the conceptual framework. http://cgge.aag.org/PopulationandNaturalResources1e/CS_Vietnam_Sep10/index.html
Unit 2.4 Populations/Biodiversity --- 2 Weeks Plans The Schoolyard Biodiversity Investigation provides students with the opportunity to learn about biodiversity in a tangible and available
environment – their own schoolyard. Download the teacher’s guide at http://www.fishwildlife.org/files/ConEd-Schoolyard-Biodiversity-Guide.pdf
Background for Teachers
Evidence from multiple ecosystems at a variety of temporal and spatial scales, suggests that biological diversity acts to stabilize ecosystem functioning in the face of environmental fluctuation. Learn more at http://www.nature.com/scitable/knowledge/library/biodiversity-and-ecosystem-stability-17059965
In this unit we see how scientists measure biodiversity, how it benefits our species, and what trends might cause Earth's next mass extinction. Access this online textbook at http://www.learner.org/courses/envsci/unit/text.php?unit=9&secNum=0
Student Activities
This activity illustrates how to use math to calculate the diversity index of a selected habitat. The closer to 1 the diversity index is, the more diverse and healthy the habitat is. This is a very simplified version of diversity index. The more accurate versions are called the Simpson and Shannon Indexes. http://www.accessexcellence.org/AE/ATG/data/released/0534-KathyParis/

Secondary Science: Instructional Map for Environmental Science
Second Nine Weeks
2013 - 2014 Page 16 of 16
TOOLBOX
Other Resources
Examine the role of biodiversity in ecological systems. A 30 minute video can be downloaded or viewed at the following website: http://www.learner.org/courses/biology/textbook/biodiv/index.html Read about biodiversity in a chapter from the online textbook Environmental Decision-Making, Science and Technology at http://telstar.ote.cmu.edu/environ/m3/s5/02biodiversity.shtml
Unit 2.5 Water, Air and Land/Water --- 1 Week Plans This lesson from Clemson University combines classroom work with a field trip to give middle school students hands-on experience in
determining water quality. It may be modified for high school students. Go to the following site, scroll to the bottom of the page, and download Using Biotic and Abiotic Parameters to Monitor Water Quality. http://www.clemson.edu/cafls/sclife/teacher_resources/lesson_plans.html
This module is part of "Exploring the Environment"ª (ETE) from NASA's Classroom of the Futureª. In ETE, high school students are faced with a real life problem and their goal is to use problem solving skills and internet-based data (e.g., remotely sensed satellite images) to propose and defend a solution. A Teacher's Guide is available. This link is to the ETE home page since it gives the easiest access to necessary introductory and teacher information. To access the water quality module, click on then "Water Quality" in the puzzle. http://ete.cet.edu/modules/modules.html
Background for Teachers
How do harmful substances enter the body, and how do they damage cells? Learn how dangers are assessed, what kind of regulations we use to reduce exposures, and how we manage associated human health risks. Learn more at http://www.learner.org/courses/envsci/unit/text.php?unit=6&secNum=0
Student Activities
Examine this plan for controlling pollution of Lake Pontchartrain in Louisiana and use it as a model for making your own plan for a local body of water. http://www.deq.louisiana.gov/portal/Default.aspx?tabid=1982
Other Resources
MWRA's "Water Quality Testing Manual" is a field-based program appropriate middle school and high school students. It contains background information, lesson ideas, procedures, data collection and reporting forms, suggestions for interpreting the results and extension activities. http://www.mwra.state.ma.us/publications/waterqualitytesting/waterqualitymanual.htm