Comenius project “ The Bookworms of Europe ” Doctor Puigvert Secondary School
Upload
lciacob4647Category
view
224download
0
8/3/2019 Secondary Growth Poles in Europe
http://slidepdf.com/reader/full/secondary-growth-poles-in-europe 1/60
ESPON 2013 1
SGPTDSecondary Growth Poles in Territorial
Development in Europe:Performance, Policies and Prospects
Applied Research 2013/1/11
Interim Report | Version 28/02/2011

8/3/2019 Secondary Growth Poles in Europe
http://slidepdf.com/reader/full/secondary-growth-poles-in-europe 2/60
ESPON 2013 2
This report presents the interim results of an
Applied Research Project conducted within the
framework of the ESPON 2013 Programme,
partly financed by the European Regional
Development Fund.
The partnership behind the ESPON Programme
consists of the EU Commission and the Member
States of the EU27, plus Iceland, Liechtenstein,
Norway and Switzerland. Each partner is
represented in the ESPON Monitoring
Committee.
This report does not necessarily reflect the
opinion of the members of the Monitoring
Committee.
Information on the ESPON Programme and
projects can be found on www.espon.eu
The web site provides the possibility to
download and examine the most recent
documents produced by finalised and ongoing
ESPON projects.
This basic report exists only in an electronic
version.
© ESPON & European Insitute for Urban Affairs,
Liverpool John Moores University, 2011.
Printing, reproduction or quotation is authorised
provided the source is acknowledged and a
copy is forwarded to the ESPON Coordination
Unit in Luxembourg.

8/3/2019 Secondary Growth Poles in Europe
http://slidepdf.com/reader/full/secondary-growth-poles-in-europe 3/60

8/3/2019 Secondary Growth Poles in Europe
http://slidepdf.com/reader/full/secondary-growth-poles-in-europe 4/60
CONTENTS
A. EXECUTIVE SUMMARY
B. OUTLINE OF METHODOLOGY
1. INTRODUCTION – WHAT’S IN THIS REPORT 1
2. WHAT ARE OUR PROJECT GOALS AND METHODOLOGY? 2
3. REFINING OUR RESEARCH APPROACH AND HYPOTHESES 3
4. REFINING OUR CLASSIFICATION OF COUNTRIES AND SYSTEMS 55. REVISING THE SELECTION OF SECONDARY CITIES 7
6. REVISING AND SPECIFYING THE DATA 13
C. INITIAL RESULTS
7. PROGRESS AND INITIAL MESSAGES – POPULATION, GDP, EMPLOYMENT
AND PRODUCTIVITY DATA 14
8. REVIEW OF LITERATURE ON NATIONAL TERRITORIAL POLICIES 34
9. THE CASE STUDIES 40
10. QUESTIONNAIRE 43
D. FURTHER PROCEEDINGS
11. NEXT STEPS 44

8/3/2019 Secondary Growth Poles in Europe
http://slidepdf.com/reader/full/secondary-growth-poles-in-europe 5/60
i
EXECUTIVE SUMMARY
1.1 This Interim Report describes the project activities and results during the six months since the Inception Report was
presented in August 31 2010. It:
Outlines what we have done since the Inception Report.
Responds to comments on it from the Monitoring Committee and Sounding Board.
Outlines what information has already been assembled.
Provides some very early messages from some of the work streams.
Outlines our work for the remainder of the project.
1.2 The project is on track.
Process
We have received considerable interest and support from policy makers and researchers.
The Inception report was well received.
Our presentation at the ESPON seminar in Liege was well received.
We had a successful meeting with the Sounding Board, DG Regio and ESPON CU.
Substance
We have made substantial overall progress both in refining the research strategy and methodology.
We are reviewing the literature. It is mixed in quality, territory, focus.
We have made considerable progress on defining boundaries and indicators for secondary cities.
We have collected and done some simple analysis of some of those indicators.
We have undertaken substantial work in 6 case studies and have written initial reports. We have had initial
contacts and support in the other 3.
We have received some interesting responses to the questionnaire.
We have not encountered any substantial difficulties of access to data.
We have not experienced any significant delays to the timetable.
Analytical and methodological revisions
1.3 As requested we have refined our analytical approach and our key hypotheses. We list both below. Our project rests
on the following assumptions. First, we will explore what are the most effective relationships between territory,
governance and economy in an economically challenged, unstable world. Second we adopt an institutional and
evolutionary approach to these issues. So we believe that policy and politics - not only markets - matter to urban
development and the performance of secondary cities. Third we believe that national factors and especially nationalgovernment policies are crucial for urban development generally and secondary cities in particular. Fourth, however,
we also recognise that in a multi-scalar world, local and regional partners and policies also shape the performance
and prospects of places. Fifth, we believe in path dependency models and recognise that places and secondary cities
are constrained by historical and structural factors. But there is substantial scope of manouevre by local actors. Sixth,
we accept that both hard and soft factors matter to city performance. Seventh we recognise that success does not
consist of economic performance alone. To be successful secondary cities need to strive to maximise economic
competitiveness, social cohesion and environmental sustainability.
1.4 From this general view of the world we derive five specific hypotheses which we are exploring in this project.
Deconcentration matters. This hypothesis essentially argues that the benefits of an urban system where public
and private investment and resources are concentrated upon the capital city are smaller than those of a more
deconcentrated, territorially balanced urban system where growth and resources are spread across a range of
different sized cities in a wider territory. National policies - and levels of centralisation - matter . This argues that the performance of secondary cities is
significantly affected by national government policies - implicit or explicit, direct and indirect.
Local factors matter . Secondary cities are path dependent and are constrained by external factors - historical,
cultural, structural, political and institutional. But those factors are not determinant. The economic
performance of cities will depend upon their strategic capacity to manage those constraints.
The key drivers of territorial performance are innovation, human capital, connectivity, place quality, and
governance capacity . Policies on those dimensions are crucial and again should be explored and assessed.
Territory matters. This argues that globalisation makes the governance capacity of place more important. It will
be increasingly multi scalar. Economic governance in secondary cities should be located at the highest
achievable spatial level. Secondary cities need strategies to shape the different territorial roles they play
regionally, nationally and in Europe.

8/3/2019 Secondary Growth Poles in Europe
http://slidepdf.com/reader/full/secondary-growth-poles-in-europe 6/60
ii
What classification of countries?
1.5 The project needs to position secondary cities in their respective national state systems and to identify the
distribution of competences between different administrative levels of government and the degree of
decentralisation of these competences from central to lower tiers of government. The MC and Sounding Board was
not entirely convinced of the original classification in our Inception Report. As a result of a review of a series of key
studies we have revised our original geographical classification of states, which builds in more analysis of policy
making characteristics as well as the geographical dimension. We therefore distinguish between federal and unitary
Member States with the latter further divided into three giving the following broad typology:
STATE SYSTEM
GROUPING
CHARACTERISTICS COUNTRIES
Federalised states Central and regional authorities with independent
legislative & administrative competences recognised
by Constitution
EU 15: Austria Belgium, Germany,
Non-EU: Switzerland
Unitary
‘regionalised’ states
Intermediate government with wide set of
competences and high degree of Regionalisation
EUIS: Italy, Spain
Unitary ‘Northern’
states
Local governments with wide range of
responsibilities for economic development
EU 15: Denmark Finland, Sweden
Non-EU: Norway
EU Candidate Country: Iceland
Other Unitary States Central government dominant. Considerable
variation in terms of decentralisation.
Distinction between ‘old’ and ‘new’ member states
captures state restructuring in former socialist states
EU 15: France, Greece, Ireland, Luxembourg, Netherlands, Portugal, UK
EU12: Bulgaria, Cyprus, Czech Republic, Estonia, Hungary, Latvia,
Lithuania, Malta, Poland, Romania, Slovakia and Slovenia
EU Candidate Country: Croatia
Revising the selection of secondary cities
1.6 The CU response to our Inception Report invited us to revise the selection of secondary cities. We have reviewed the
position and identified a clear set of principles to guide us. We were guided by some key considerations. We
recognise that no system is perfect. Every classification has problems of for example over-bounding, under-
bounding, data gaps. We have tried to not let the best drive out the good. We have tried to balance economic
significance with territorial representation. We have tried to reflect the views of the Monitoring Committee. In
particular we have used the boundaries that best fit the policy agenda. In this respect we have built upon the work
undertaken by the OECD and DG Regio on metro regions since these boundaries are used in the most recent
Cohesion Report. We now have a final list of 31 capitals and 124 secondary cities. It was agreed at our meeting with
the Sounding Board, DG Regio and ESPON CU that there will be no further changes to this list. Therefore we have
used this list for all subsequent data collection and analyses that we have done in the past months.
What data are we using?
1.7 For the 124 secondaries and 31 capital cities we propose to use data that are in principle, if not always in practice,
available for all of them. So we have used data drawn from EUROSTAT, DG Regio and other ESPON studies. We are
assembling data for the following indicators for all 31 Capital and 124 secondaries: population (2000-2007), total
GDP (2000-2007), GDP per capita (2000-2007), GDP per person employed (2001-2007), total employment (2000-
2007), employment by sector (2000-2007), high level of education (2008),employment rate (2008), unemployment
rates (2000-2008), patent applications (2006-7), potential accessibility air, road, rail (2001 & 2006), potential
accessibility multi-modal (2001 & 2006), net migration rates (2007) . In the case studies we propose to collect data at
national, metro region, city and within city for 2000 and 2007 for the above indicators with some ‘softer’ social and
environmental measures including proportion of the population with no qualifications, air quality, average earnings,
crime rates, journeys to work by car/public transport/on foot, poverty or deprivation measures, housing costs and
quality.
What have we done so far?
1.8 So far we have concentrated on collecting the most comprehensive and most widely available data on the recent
economic performance of capital and secondary cities across Europe. To our knowledge this is the first time that
such data have been assembled in this way. We have also undertaken some preliminary analysis. The primary
purpose of the data collection and analysis is to set the scene and agenda and lay the foundations for the other
aspects of our research programme.
Secondary cities – picking up, catching up, staying up?
1.9 The main focus of our analysis so far has been to find out which secondary cities are picking, catching up, and will
stay up with or fall behind their respective capitals. So far we have done this in terms of total GDP and GDP per
capita, and population and employment change data for the years 2000 and 2007 and GDP per person employed
(2001-2007). In addition, we have collected recent data on employment in financial intermediation, real estate
renting and business activities, tertiary level education, patent applications, potential accessibility by air. We have
undertaken some preliminary correlation work which explores whether there are statistically significant

8/3/2019 Secondary Growth Poles in Europe
http://slidepdf.com/reader/full/secondary-growth-poles-in-europe 7/60
iii
relationships between GDP per capita and indicators of some, though not all, of the key drivers of economic
competitiveness –connectivity, human capital and innovation/creativity. We have presented such indicators on a city
by city basis.
Policy literature review
1.10 We are carrying out an extensive review of literature on national territorial policies as a context for the case study
analysis. We have so far explored the following themes:
Governance, Decentralisation: What Are the Patterns? Governance, Decentralisation: What Policy Approaches?
Policies for Balanced Territorial Development: Spatial planning and polycentric development, Regional Policy,
Urban Policy
1.10 In addition to the overall literature review, we are undertaking more detailed reviews of approaches to urban areas
and secondary cities in the 9 countries in which we are conducting case studies. It is difficult to capture briefly the
key messages from that work which is in the main report. But we have found helpful a variety of work especially that
of the OECD which has tried to provide an overall assessment of the direction and priorities of policies.
Case studies
1.11 We have made very good progress with the case study work so far. There is considerable interest in the project and
there has been great willingness to support our work. We have undertaken fieldwork and analysis in 6 of the cities –
Tampere, Katowice, Cork, Munich, Turin, and Barcelona. We have collected documents, conducted initial interviewswith a number of representatives. We have prepared initial reports on those case studies. We reviewed the initial
findings at a project meeting recently. We have had initial contact with Leeds, Lyon and Timisoara and will carry out
fieldwork there in the coming months.
1.12 It is premature to report any major findings from the case studies. Every city has a different narrative and tells us
something different about the themes we are exploring. However, it is clear that our hypotheses are regarded as
relevant and important by those involved in managing cities. There is also a lot of positive support for the policy
implications of those hypotheses. For example, there is evidence that secondary cities can make a contribution to a
more balanced territorial development even though in many countries they lag behind the capital. There are a
variety of relationships across Europe with secondaries making a bigger contribution outside the former socialist
countries. National policies are important to the development of - but are not always sufficiently supportive of -
secondary cities or aligned properly. European policies have played a major role in the development of many
secondary cities especially in terms of their governance and territorial strategies. The key drivers we identified are
important factors in the relative success of those cities. Although cities are path dependent local factors are crucial
to their trajectory – historically and in future. Aligning territory, governance and economy more effectively appears
to be crucial if secondary cities are to flourish and make a bigger contribution. But it is rarely achieved and never
simple.
The questionnaire
1.13 We have devised the questionnaire to get at three related questions: How well are capital and secondaries
performing in different states? What impact have national and/or regional policies had upon the performance and
prospects of secondaries? What should happen differently in future if secondary cities are to improve their relative
performance? We have targeted four groups so far: all members of the Monitoring Committee; all ESPON contact
points; a selection of senior policy makers in different states known to the team members; and a selection of
academics and researchers. We do not regard the questionnaire response in any sense as a representative sample.
Rather we regard it as a valuable source of information from a range of experts which adds richness, complexity and
detail to our review of national polices drawn from academic and policy literature. We have not yet analysed the
questionnaires in any great detail. Nevertheless the weight of opinion so far expressed appears to be the following.
Many do not think that there is a sufficiently explicit or coherent policy for secondary cities in many member states.
Many believe that secondary cities could contribute more if they had more attention, support powers and resources
from national government. There is a general wish for states to develop more coherent, explicit strategies and
increase the powers and resources of secondary cities in future.
Next steps
1.14 We believe this report demonstrates that the project remains on course for successful delivery. We have
encountered no major problems with access to material. We are essentially keeping to the timetable outlined in the
Inception Report with some minor revisions and expect to deliver the final report on time.

8/3/2019 Secondary Growth Poles in Europe
http://slidepdf.com/reader/full/secondary-growth-poles-in-europe 8/60
1
1. INTRODUCTION – WHAT’S IN THIS REPORT?
1.1 This Interim Report describes the project activities and results during the six months since the Inception
Report was presented in August 31 2010. It:
Outlines what we have done since the Inception Report.
Responds to comments on it from the Monitoring Committee and Sounding Board.
Outlines what information has already been assembled. Provides some very early and provisional messages from some of the work streams.
Outlines our work for the remainder of the project.
1.2 This report is responding to two different requests from ESPON CU. The first is the Subsidy Contract. The
second is the more recent comments by the Monitoring Committee and the Sounding Board on our
Inception Report. The Subsidy Contract indicated that the Interim Report should attempt to provide:
A review of concepts and methodology on secondary growth poles.
A quick review of existing national and regional policies.
A review of the positive and negative territorial effects of secondary growth poles.
Preliminary results of territorial indicators, including draft European maps.
Preliminary results of the case studies.
Data collection achieved.
First indications on the conclusions and policy relevant options.
Plan of work for the draft Final Report contents of the Final report.
1.3 The Monitoring Committee and Sounding Board welcomed the Inception Report but asked that:
The conceptual framework be sharpened.
The research hypotheses be sharpened with a focus upon policy impact.
The selection of secondary cities be revised.
There should be more clarity on indicators and data.
A preliminary list of maps at case-study level should be identified.
Some data gaps be filled.
The territorial dimension of secondary cities at different geographical levels be underlined.
1.4 This report responds to these issues. It: Identifies our key analytic assumptions and hypotheses.
Presents our revised classification of state systems.
Presents the revised selection of secondary cities for data analysis.
Identifies the proposed indicators and data both for the project and case studies.
Presents some initial data analysis.
Reviews what we have found on the policy dimensions of the project.
Reports progress on the case studies.
Reports progress on the questionnaire.
Identifies next steps.
Overall progress- where are we?
1.5 We have made substantial overall progress both in refining the research strategy and methodology and incarrying out a series of project tasks. We have not encountered any substantial difficulties of access to
data. We have not experienced any significant delays to the timetable.
Process
We have received considerable interest and support from policy makers and researchers at national
and local level.
The Inception Report was well received.
Our presentation at the ESPON seminar in Liege was well received.
We had a successful meeting with the Sounding Board, DG Regio and ESPON CU.
Substance
We are reviewing the available literature. It is mixed in quality, territory, focus. But we have made
progress.
We have made considerable progress on defining boundaries and indicators for secondary cities.
We have collected and done some simple analysis of some of those indicators.

8/3/2019 Secondary Growth Poles in Europe
http://slidepdf.com/reader/full/secondary-growth-poles-in-europe 9/60
2
We have undertaken substantial work in 6 case studies and have initial reports. We have had initial
contacts and support in the other 3.
We have received some interesting responses to the questionnaire.
1.6 One dilemma in preparing this report six months after the Inception Report is that we are deeply immersed
in a variety of methodological and substantive tasks. We have generated substantial amounts of data. But
we have not yet had time to fully absorb or interpret them yet. Also we are at different stages in the
different tasks. So it is difficult – and indeed dangerous – to attempt to outline key messages at this stage.But the remainder of this report specifies our interim progress on methodological and substantive issues in
the following way.
Section 2: Project goals and overall methodology.
Section 3: Revising our research hypotheses.
Section 4: Revising our classification of countries and systems.
Section 5: Revising the selection of secondary cities.
Section 6: Revising and specifying the data and indicators.
Section 7: Progress and early messages on performance in relation to population, GDP, employment
and productivity.
Section 8: Progress and early messages with national territorial policies.
Section 9: Progress and early messages with case studies.
Section 10: Progress and early messages with the questionnaire.
Section 11: Next steps.
2. WHAT ARE OUR PROJECT GOALS AND METHODOLOGY?
2.1 In order to understand the progress we have made, we restate briefly the key goals of the project. We
were asked to develop a common understanding of the opportunities of and prospects for the territorial
development of secondary cities. So our key objective is to produce clear policy recommendations about
the challenges and opportunities facing secondary cities in Europe, based upon robust analysis of a well
founded evidence base. We intend to identify, measure and explain: (i) the role of secondary cities; (ii)
their actual and potential contribution to territorial economic growth at European, national and regional
level and (iii) the range of European, national, regional and local policies that have been adopted - and
could be adopted in future - to maximise their potential contribution.
2.2 The need for such practical advice will become increasingly important during the next decade as economic
recession and fiscal problems threaten to undermine the real achievements made by many secondary cities
in Europe during the recent period of sustained economic growth. There is a risk that economic and fiscal
problems and the competition for scarce public and private sector resources may limit the growth of
secondary cities and widen gaps between them and the capital cities. If their development is arrested by
recession, the threats to a balanced territorial system across Europe will increase. So developing a good
policy response during the difficult economic period ahead will be absolutely critical.
2.3 Our approach to this project reflects the aspiration recently expressed by the Director of ESPON that its
work in future should be policy focussed and communicate with decision makers to sustain the profile and
relevance of ESPON. The project must not be knowledge for knowledge sake - but to inform the
development of policies to achieve sustainable, balanced urban development in Europe. The project is
primarily interested in policies - exploring their patterns, impacts and implications - rather than simply
mapping the aggregate performance of secondary cities with quantitative data. However we are
undertaking substantial quantitative analysis to contextualise our policy analysis.
2.4 The study aims to identify the range of economic relationships between capital and secondary cities and
the different ways of achieving economic development in cities. This will be important especially in many
new member states where sometimes the capital tends to dominate economic growth and secondary cities
perform less well. The study will explore the different models of economic development and the different
relationships between capital and secondary cities. It will explore whether and where countries need to
think more about their urban hierarchy and their policies which shape that hierarchy. It will explore
whether territorial development is zero sum or whether all places can develop. Different places have
different roles in the national urban system and they can be assessed and measured. It could show that

8/3/2019 Secondary Growth Poles in Europe
http://slidepdf.com/reader/full/secondary-growth-poles-in-europe 10/60
3
although it is not realistic to expect every place to reach the same level of development, it is not sensible to
have one place dominating an economic desert.
2.5 The study has three key elements. First it will collect and assess the empirical evidence on economic
performance and competiveness and the gaps between the capital and secondary cities in different
member states and how this has been changing over time. It will assess their performance on critical
drivers of performance – innovation, human capital, connectivity, place quality and strategic decision-
making capacity. What is their actual and potential development to more balanced territorial developmentat regional, national and European level? What are their territorial prospects? Which cities are and are not
punching their weight nationally in Europe, how and why. Second it will describe the policy debate in
different member states. How is this gap seen? Is the policy debate about improving competiveness or is it
about increasing solidarity? Is the policy debate essentially about economic competitiveness or social
cohesion? Third it will assess the policy impact. It will explore whether and how these trends and policy
discussions in different countries have changed public policy. Do policy makers recognise the nature of the
gap between the capital and other secondary cities? Is a gap seen as a problem for the individual city or
rather as a policy challenge for the national urban system? Are second-tier cities regarded as ‘charity cases’
or as potential locations for making significant contributions to national economic growth? What, if
anything, are governments doing about these issues? Has government begun to target the economic
importance of secondary cities? Has government done anything to increase the capacity and skills of
secondary cities? Has it delegated more powers and more resources and has it placed fewer constraints
upon grants?
What is our overall methodology?
2.6 We have adopted both a qualitative and quantitative approach and wish to achieve both breadth and
depth. We are attempting to integrate primary and secondary data from a diverse range of sources
including:
Research and policy literature on secondaries’ performance, policies, prospects.
Quantitative data for 124 secondaries and 31 capitals.
Interviews with European and national policy makers, researchers, private sector.
E-questionnaire with the ESPON family, policy makers, researchers, EUROCITIES, Core Cities, URBACT,
EUKN.
9 detailed case studies.
3. REFINING OUR RESEARCH APPROACH AND HYPOTHESES
3.1 The next phase of this report outlines progress on a series of methodological issues raised by the MC,
Sounding Board and the work itself. The MC asked us to spell out more explicitly the underlying
assumptions of our work and in particular the key hypotheses we shall be testing. We have done this both
in discussions with the Sounding Board and in presentations to the ESPON internal seminar in Liege. In this
section we identify the ways in which we have revised some of the key aspects of our project and in
particular identified more explicitly our analytical approach and key hypotheses.
What is our analytical approach?
3.2 Our project rests on the following assumptions. First, it must explore what are the most effective
relationships between territory, governance and economy in an economically challenged, unstable world. Itassumes that currently many member states have sub-optimal relationships with often 19
thcentury
boundaries, and 20th
century governance arrangements to manage 21st
century economies. Second we
adopt an institutional and evolutionary approach to these issues. So we believe that policy and politics -
not only markets - matter to urban development and the performance of secondary cities. Third, we
believe that national factors and especially national government policies are crucial for urban development
generally and secondary cities in particular. Their nature, role and impact have to be explored and
explained. Fourth, however, we also recognise that in a multi-scalar world, local and regional partners and
policies also shape the performance and prospects of places. Fifth, we believe in path dependency models
and recognise that places and secondary cities are constrained by historical and structural factors. But
there is substantial scope of maneouvre by local actors. Sixth, we also accept that both hard and soft
factors matter to city performance. Hence physical infrastructure is a driver of success but so are skills,
networks, and social cultural factors. Seventh we recognise that success does not consist of economic
performance alone. We believe that to be successful places and secondary cities need to strive to maximise

8/3/2019 Secondary Growth Poles in Europe
http://slidepdf.com/reader/full/secondary-growth-poles-in-europe 11/60
4
economic competitiveness, social cohesion and environmental sustainability. They are complementary not
mutually exclusive. Eighth, we believe key drivers of territorial performance are innovation, human capital,
connectivity, place quality, and governance capacity. Policies at different spatial levels – European, national,
regional and local – to improve the performance of secondaries on those dimensions are crucial and again
should be explored and assessed. From this general view of the world we derive five specific hypotheses
which we are exploring in this project.
What are our key hypotheses? 3.3 Deconcentration matters. This hypothesis essentially argues that the benefits of an urban system where
public and private investment and resources are concentrated upon the capital city are smaller than those
of a more deconcentrated, territorially balanced urban system where growth and resources are spread
across a range of different sized cities in a wider territory. It implies that: national economies will be more
successful when the gap in economic, social and environmental performance between the capital and
secondary cities is smaller and more successful national economies have more secondary cities performing
well.
3.4 National policies - and levels of centralisation - matter . This argues that the performance of secondary cities
is significantly affected by national government policies - implicit or explicit, direct and indirect. It implies
that institutional and financial decentralisation from national to sub-national (regional and local) levels of
government where these have significant roles, responsibilities and resources will reduce the costs of
overconcentration on the capital and maximise the contribution of secondary cities to nationalcompetitiveness and welfare. In addition, secondary cities will perform better where national and regional
policy making systems are horizontally and vertically aligned to focus upon place making.
3.5 Local factors matter . Secondary cities are path dependent and are constrained by external factors -
historical, cultural, structural, political and institutional. But those factors are not determinant. The
economic performance of cities will depend upon their strategic capacity to manage those constraints.
3.6 The key drivers of territorial performance are innovation, human capital, connectivity, place quality, and
governance capacity . Policies on those dimensions are crucial and again should be explored and assessed.
3.7 Territory matters. This argues that globalisation makes the governance capacity of place more important. It
will be increasingly multi scalar. Economic governance in secondary cities should be located at the highest
achievable spatial level. Secondary cities need strategies to shape the different territorial roles they playregionally, nationally and in Europe.
3.8 So in all our work strands we shall be asking the question: what does this tell us about these hypotheses
and do they confirm, deny or qualify them.
4. REFINING OUR CLASSIFICATION OF COUNTRIES AND SYSTEMS
4.1 The project needs to position secondary cities in their respective national state systems and to identify the
distribution of competences between different administrative levels of government and the degree of
decentralisation of these competences from central to lower tiers of government. The MC Sounding Board
was not entirely convinced of the original classification in our Inception Report. As a result of a review of aseries of key studies we have revised our original geographical classification of states, which builds in more
analysis of policy making characteristics as well as the geographical dimension.
4.2 We found the recent study carried out for DG Regio by Ismeri Europa and Applica to be particularly helpful
in this exercise. It documents the distribution of competences between different administrative levels in
the 27 Member States of the European Union, concentrating on regional development (Ismeri Europa and
Applica, 2010). It distinguishes between four broad typologies of state organisation and thus provides a
grouping of countries according to state system that add an explicit governance dimension to the broad
territorial grouping that we are also using in our research. We intend to pursue this typology in our project.
4.3 We therefore distinguish in Table 4.1 between federal and unitary Member States with the latter further
divided into three giving the following broad typology:

8/3/2019 Secondary Growth Poles in Europe
http://slidepdf.com/reader/full/secondary-growth-poles-in-europe 12/60
5
Federalised states (Austria, Belgium and Germany): characterised by a central government and
regional authorities both with own legislative and administrative competences that are exercised
independently and recognised by the Constitution. For our data analysis, we will also include
Switzerland, a non-EU Member State, in this group as part of the wider ESPON territory.
Unitary ‘regionalised’ states (Italy and Spain): unitary countries that have established an
intermediate level of government with a wide set of competences. What sets them apart from
traditional unitary states is their high degree of regionalisation.
Unitary ‘Northern’ states (Denmark, Finland and Sweden) : unitary countries in which localgovernments have a wide range of responsibilities in relation to regional development. Iceland, an EU
candidate country and Norway, a Non-EU Member State, also fall in this group for our data analysis as
part of the wider ESPON territory.
Unitary States (in both the EU15 - France, Portugal, the UK, Greece, Ireland, The Netherlands and
Luxembourg and the EU12 - Czech Republic, Hungary, Poland, Bulgaria, Cyprus, Estonia, Latvia,
Lithuania, Malta, Romania, Slovakia and Slovenia): where central government is predominant,
although there is considerable historical variation between them, not least in relation to the degree of
decentralisation - which is relatively high in some countries such as the Netherlands, Slovenia and
Lithuania and very limited in others like Ireland, Greece, Bulgaria, Romania and Malta.
4.4 The distinction between ‘old’ and ‘new’ member states captures the state restructuring being experienced
by the former socialist states of Eastern Europe. With the exception of the former GDR, which has been
integrated into Germany’s Federal System, all of these previously highly centralised socialist states have
developed unitary political systems albeit with varying degrees of decentralisation of competences.
Another Unitary State to be included in the data analysis for the ESPON territory as a whole is the former
socialist state and EU candidate country, Croatia (see Map 4.1).
Table 4.1 State system grouping
STATE SYSTEM
GROUPING
CHARACTERISTICS COUNTRIES
Federalised states Central and regional authorities with independent
legislative & administrative competences recognised by
Constitution
EU 15: Austria Belgium, Germany,
Non-EU: Switzerland
Unitary
‘regionalised’ states
Intermediate government with wide set of
competences and high degree of Regionalisation
EU15: Italy, Spain
Unitary ‘Northern’states
Local governments with wide range of responsibilities for economic development
EU 15: Denmark, Finland, Sweden Non-EU: Norway
EU Candidate Country: Iceland
Other Unitary States Central government dominant. Considerable
variation in terms of decentralisation.
Distinction between ‘old’ and ‘new’ member states
captures state restructuring in former socialist states
EU 15: France, Greece, Ireland, Luxembourg,
Netherlands, Portugal, UK
EU12: Bulgaria, Cyprus, Czech Republic,
Estonia, Hungary, Latvia, Lithuania, Malta,
Poland, Romania, Slovakia and Slovenia
EU Candidate Country: Croatia
8/3/2019 Secondary Growth Poles in Europe
http://slidepdf.com/reader/full/secondary-growth-poles-in-europe 13/60
6
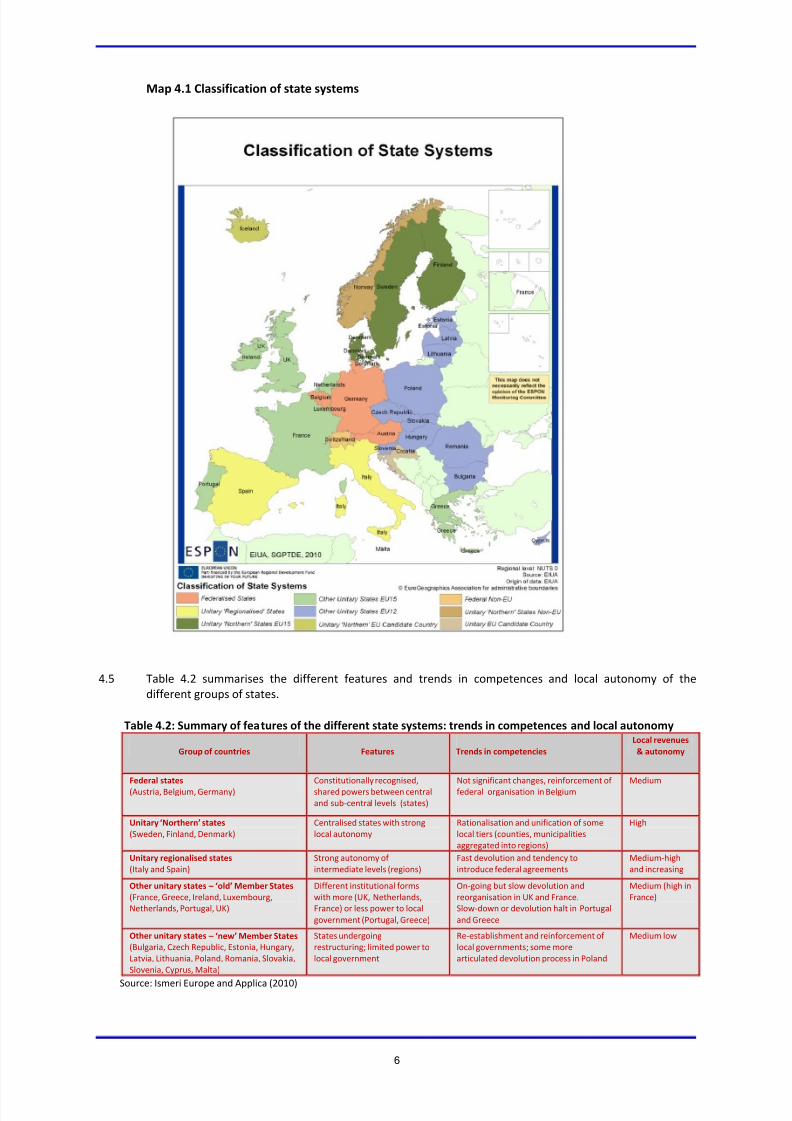
Map 4.1 Classification of state systems
4.5 Table 4.2 summarises the different features and trends in competences and local autonomy of the
different groups of states.
Table 4.2: Summary of features of the different state systems: trends in competences and local autonomy
Group of countries Features Trends in competencies
Local revenues
& autonomy
Federal states
(Austria, Belgium, Germany)
Constitutionally recognised,
shared powers between central
and sub-central levels (states)
Not significant changes, reinforcement of
federal organisation in Belgium
Medium
Unitary ‘Northern’ states
(Sweden, Finland, Denmark)
Centralised states with strong
local autonomy
Rationalisation and unification of some
local tiers (counties, municipalities
aggregated into regions)
High
Unitary regionalised states
(Italy and Spain)
Strong autonomy of
intermediate levels (regions)
Fast devolution and tendency to
introduce federal agreements
Medium-high
and increasing
Other unitary states – ‘old’ Member States
(France, Greece, Ireland, Luxembourg,
Netherlands, Portugal, UK)
Different institutional forms
with more (UK, Netherlands,
France) or less power to local
government (Portugal, Greece)
On-going but slow devolution and
reorganisation in UK and France.
Slow-down or devolution halt in Portugal
and Greece
Medium (high in
France)
Other unitary states – ‘new’ Member States
(Bulgaria, Czech Republic, Estonia, Hungary,
Latvia, Lithuania, Poland, Romania, Slovakia,
Slovenia, Cyprus, Malta)
States undergoing
restructuring; limited power to
local government
Re-establishment and reinforcement of
local governments; some more
articulated devolution process in Poland
Medium low
Source: Ismeri Europe and Applica (2010)

8/3/2019 Secondary Growth Poles in Europe
http://slidepdf.com/reader/full/secondary-growth-poles-in-europe 14/60
7
5. REVISING THE SELECTION OF SECONDARY CITIES
5.1 The CU response to our Inception Report invited us to revise the selection of secondary cities. In particular
it noted that we had not identified any secondary cities in some smaller countries and that in the case of
Italy a number of cities that might have been expected to be included were not.
5.2 We have reviewed the position and identified a clear set of principles which we think should guide us. We
were guided by some key considerations. We recognise that no system is perfect. Every classification has
problems of, for example, over-bounding, under-bounding anddata gaps. We have tried to not let the best
drive out the good. We have tried to balance economic significance with territorial representation. We
have tried to reflect the views of the Monitoring Committee. In particular we have used the boundaries
that best fit the policy agenda. For this reason, we have built upon the work undertaken by the OECD and
DG Regio on metro regions, since these boundaries are used in the most recent Cohesion report. We would
wish our work to complement rather than contradict that approach. The request for a review has
highlighted a series of choices and tensions we are trying to manage
How many are in – more or less?
5.3 On one hand we have been encouraged to focus on places which really matter in functional terms to the
performance of Europe. On the other we have been reminded of the need to have good geographical
representation and balance. The former pushes us to a smaller number of places. The latter pushes us to a
larger number. We have decided in this phase of the analysis to reflect the request for territorial
representation. We have increased the number of places that will be analysed in the quantitative strand of
the project. This complements the fact that, in the case studies where we undertake qualitative work, we
have concentrated on a relatively small number of places.
What selection criteria – population or function?
5.4 In our initial selection we focussed primarily on a population cut-off but adjusted that by informal
judgements of which places at the marginal cut off points were of such significance they had to be included
or whether they could be excluded. On reflection we decided that attempting to use an informal functional
judgement raised too many difficulties. We decided instead to adopt a simple population criterion adapted
by country size and, in the larger countries, the scale of their urban systems.
How many representative places from the larger and smaller countries
5.5 The 22 countries with populations less than 15 million have fewer metro-region areas than the 8 larger
countries with populations up to 85 million. They have five or fewer. We have decided to include all metro
regions in the 22 as they could all be assumed to matter to the national economy. By contrast we have
decided to include only a selection of the metro regions in the 8 larger countries on the basis of their
relative importance in the urban system. We ranked cities in descending order of population size and
grouped them according to cumulative percentage shares of the total metropolitan population excluding
the capital. In this way, we could group secondary cities in terms of their relative importance in their
different national urban systems. We could then apply a common threshold, defined by share of total
metropolitan population - by quintile or quartile - across the larger countries.
What about smaller countries?
5.6 Our initial selection excluded some places due to the absence of defined agreed metro-region boundaries.
This was the case in smaller countries. To address the territorial representation theme we have decided
that every country should have the capital and the next biggest city. We will define the boundaries where
this needs to be done. In some cases however there are no secondary cities of sufficient significance to
include outside of the capital.
Selecting the secondary cities
5.7 In our Inception Report we made the case for using OECD/DG-Regio metro-regions as an approximation for
major secondary cities in Europe. That principle has been accepted so we do not repeat these arguments
here. We proposed a list of 30 capital and 79 secondary city metro-regions. The choice was based on
population data alongside our judgement of the significance of the various places. The Monitoring
Committee proposed the inclusion of a number of additional cities. In considering their suggestions we
decided we needed to construct a more robust coherent and consistent approach to the selection of cities.

8/3/2019 Secondary Growth Poles in Europe
http://slidepdf.com/reader/full/secondary-growth-poles-in-europe 15/60
8
Distinguishing between countries with larger and smaller populations
5.8 Our starting point is the OECD/DG-Regio list of 255 metro-regions across 30 countries. Our first decision
was to include all available metro-regions in the 22 countries with populations of fewer than 15 million
where defined metro-regions numbered five or less. In total this gave us an initial list of 55 places, 22
capitals and 33 secondary cities. These are listed in table 5. 1.
Table 5.1: Metro-regions selected in 22 of the 30 countries
COUNTRY METRO-REGION COUNTRY METRO-REGION COUNTRY METRO-REGION
Austria Vienna Denmark Copenhagen Malta Valletta
Linz Aarhus Norway Oslo
Graz Aalborg Bergen
Salzburg Odense Stavanger
Innsbruck Estonia Tallinn Portugal Lisbon
Belgium Brussels Finland Helsinki Porto
Antwerp Tampere Slovakia Bratislava
Liege Turku Kosice
Gent Greece Athens Slovenia Ljubljana
Charleroi Thessalonica Maribor
Bulgaria Sofia Hungary Budapest Sweden Stockholm
Plovdiv Debrecen Gothenburg
Varna Miskolc Malmo
Croatia Zagreb Ireland Dublin Switzerland Zurich
Cyprus Nicosia Cork Geneva
Czech Republic Prague Latvia Riga Bern
Ostrava Lithuania Vilnius Lausanne
Brno Kaunas
Plzen Luxembourg Luxembourg
5.9 In the eight largest countries – France, Germany, Italy, Netherlands, Poland, Romania, Spain and the UK –
the number of metro-regions was high, 200 in all. Since our focus is on the larger places in each of the
countries, we decided to reduce the number of cities listed. We do it on the basis of population. But we do
it not on a standard population threshold across the eight countries but in terms of the percentage of totalmetropolitan region population. Table 5.2 shows the places which would be included in our sample
depending on whether we include the top 50%, 60%, 66.7%, 75% or 80%. The metro-regions are listed in
size order starting with the largest, excluding the capital.

8/3/2019 Secondary Growth Poles in Europe
http://slidepdf.com/reader/full/secondary-growth-poles-in-europe 16/60
9
Table 5.2: Cities in France, Germany, Italy, Netherlands, Poland, Romania, Spain, UK, at population thresholds from 50%
to 80% of total metropolitan region population (excluding capitals)
FRANCE GERMANY ITALY NETHERLANDS POLAND ROMANIA SPAIN UK
Cumulative
no. of
places
(excl.
capitals)
Capital
citiesParis Berlin Rome
Randstad North
incl. AmsterdamWarsaw Bucharest Madrid London
51
50%
threshold
includes
LilleDüsseldorf-
RuhrgebietMilan Randstad South
Katowice-
ZoryIasi Barcelona Manchester
MarseilleFrankfurt am
MainNaples Eindhoven Krakow Craiova Valencia Birmingham
Lyon Hamburg Turin Arnhem Gdansk Constanta SevilleBradford-
Leeds
Lens - Liévin Köln-Bonn Bari Wroclaw Cluj-Napoca Alicante Glasgow
Bordeaux Stuttgart Palermo Lodz Malaga Sheffield
Rouen Munich Poznan Murcia Portsmouth
Nantes Bielefeld Kielce Liverpool
GrenobleNewcastle
upon Tyne
Toulouse Nottingham
Strasbourg
60%
threshold
includes
Metz Hannover Brescia Heerlen Wloclawek Bilbao Stoke-on-Trent
67
Nice Nuremberg Catania Bydgoszcz Cádiz Cardiff
Toulon Bremen
Mannheim
66.7%
threshold
includes
Montpellier Leipzig Salerno Enschede Szczecin Timisoara Coruña Bristol
82
Rennes Dresden Florence Lublin Oviedo Leicester
Chemnitz
75%
threshold
includes
Brest Saarbrucken Bologna Breda Walbrzych Galati Vigo Coventry
102
Angers Karlsruhe Genoa Kalisz Zaragoza Norwich
Saint-Etienne Heidelberg Caserta Edinburgh
Kiel
Augsburg
80%
threshold
includes
NancyFreiburg im
BreisgauPadua Opole Granada Exeter
117
Mulhouse Erfurt VeronaBielsko-
BialaCórdoba Bournemouth
Aachen
Magdeburg
Osnabruck
5.10 There are a variety of considerations about the selection threshold. For example if we were to use the 50%
rule, we add 51 places to the 33 already identified from the 22 smaller countries. However if we use this
threshold some cities of regional significance would appear to be omitted. We feel that a higher threshold
should be used.
5.11 We have decided to use the 66.7% cut-off. We believe it strikes a good balance between including places
that really matter and territorial coverage. The 66.7% gives us a total of 82 from the 8 largest countries,
which added to the 33 from the 22 smaller countries gives a combined total of 115. This is higher than the
list of 79 we identified in the Inception Report. In addition our analysis will also include the 31 capitals.
5.12 We identified 4 places which were excluded using the strict population rule - but which our own
understanding and the comments from the experts and Monitoring Committee suggested should be

8/3/2019 Secondary Growth Poles in Europe
http://slidepdf.com/reader/full/secondary-growth-poles-in-europe 17/60
10
included. They are Edinburgh and Belfast in the UK - capitals of Scotland and Northern Ireland - and Genoa
and Bologna in Italy. We have added these.
Alternative Boundaries
5.13 A further issue concerns the boundaries that are used in the OECD/DG-Regio metro-region work. We
believe OECD/DG-Regio boundaries are the best agreed boundaries that are available at NUTS 3 level, the
level at which pan-European data are published. We are aware that some over-bounding may occur.
5.14 As a simple way of testing the extent of over-bounding we compared metro-region population data with
Urban Audit Larger Urban Zone (LUZ) population data. We are aware that the two boundary definitions are
based on differing criteria. However we felt the comparison was valuable as the Urban Audit LUZ
definitions are also trying to approximate the functional urban areas of each of the cities. The comparison
was possible for 176 of the 255 places. The table below shows the results.
Table 5.3: Metro-region and LUZ populations compared
METRO-REGION POPULATION COMPARED
WITH LUZ POPULATIONNUMBER OF CITIES % OF CITIES
MR between 3 and 3.5 times size of LUZ 2 1.1
MR between 2 and 3 times size of LUZ 24 13.6
MR between 1.5 and 2 times size of LUZ 35 19.9
MR between 0.8 and 1.5 times size of LUZ 115 65.3
Total 176 100.0
5.15 In about two out of three cases the metro-region and LUZ boundaries both produce population figures that
are broadly similar. In about a third of cases the metro-regions do appear to over-bound if the LUZs are
taken as a better fit than the NUTS 3 metro definitions. In some cases, the over-bounding does influence
the order in which cities appear in countries when cities are ranked by size. In four cases we have taken
into account their size and significance in their respective countries and have chosen to omit these from
our final list.
5.16 In addition to the case of Italy, a number of cities were mentioned by name in the CU’s comments on the
Inception Report: Daugavpils in Latvia; Klaipeda in Lithuania; Tartu in Estonia; Hradec Kralove / Pardubice in
the Czech Republic; and Basel in Switzerland. The Italian cities have all been included in the revised
selection we proposed earlier. We shall consider each of the other places mentioned in turn.
5.17 The argument to include Daugavpils, Klaipeda and Tartu, are in our view well made. They were initially
excluded because we did not have the OECD/DG Regio boundaries. It is not possible to replicate fully the
OECD/DG-Regio methodology in creating metro-regions, due to the unavailability of the two employment
measures – employment by residence and employment by workplace. Nevertheless we propose to include
them by representing them using the NUTS 3 regions that each of these three cities lie within. This will
mean that Latvia and Estonia both gain at least one secondary city, rather than only being represented by
the capital. For the same reason we are also including Split as a second city for Croatia. Four countries in
the study will still only have one city – the capital – each, namely Cyprus, Luxembourg and Malta, and also
Iceland, where we have added Reykjavik. It is not possible to include any secondary cities in these
countries. We have also included Hradec Kralove/Pardubice in the Czech Republic and Basel in Switzerland.
5.18 Table 5.4 shows the final list of 31 capitals and 124 secondary cities. It was agreed at our meeting with the
Sounding Board, DG Regio and ESPON CU that there will be no further changes to this list. Therefore we
have used this list for all subsequent data collection and analyses that we have done in the past months.

8/3/2019 Secondary Growth Poles in Europe
http://slidepdf.com/reader/full/secondary-growth-poles-in-europe 18/60
11
Table 5.4: Capital and secondary cities in study
COUNTRY CITIES COUNTRY CITIES COUNTRY CITIES COUNTRY CITIES COUNTRY CITIES
Austria Vienna France (cont.) Lens - Liévin Hungary (cont.) Gyor Poland (cont.) Krakow Switzerland Zurich
Linz Bordeaux Iceland Reykjavik Gdansk Geneva
Graz Rouen Ireland Dublin Wroclaw Bern
Salzburg Nantes Cork Lodz Lausanne
Innsbruck Grenoble Italy Rome Poznan Basel
Belgium Brussels Toulouse Milan Kielce UK London
Antwerp Strasbourg Naples Wloclawek Manchester
Liege Metz Turin Bydgoszcz Birmingham
Gent Nice Bari Szczecin Bradford-Leeds
Charleroi Toulon Palermo Lublin GlasgowBulgaria Sofia Montpellier Brescia Portugal Lisbon Sheffield
Plovdiv Rennes Catania Porto Liverpool
Varna Germany Berlin Salerno Romania Bucharest Newcastle u Tyne
Croatia Zagreb Düsseldorf-Ruhrgebiet Florence Iasi Nottingham
Split Frankfurt am Main Bologna Craiova Cardiff
Cyprus Nicosia Hamburg Genoa Constanta Bristol
Czech Republic Prague Köln-Bonn Latvia Riga Cluj-Napoca Leicester
Ostrava Stuttgart Daugavpils Timisoara Edinburgh
Brno Munich Lithuania Vilnius Slovakia Bratislava Belfast
Plzen Bielefeld Kaunas Kosice
Hradec Kralove - Pardubice Hannover Klaipeda Slovenia Ljubljana
Denmark Copenhagen Nuremberg Luxembourg Luxembourg Maribor
Aarhus Bremen Malta Valletta Spain Madrid
Aalborg Mannheim Netherlands Randstad North Barcelona
Odense Leipzig Randstad South Valencia
Estonia Tallinn Dresden Eindhoven Seville
Tartu Chemnitz Arnhem Malaga
Finland Helsinki Greece Athens Heerlen MurciaTampere Thessalonica Enschede Bilbao
Turku Hungary Budapest Norway Oslo Cádiz
France Paris Debrecen Bergen Coruña
Lille Miskolc Stavanger Sweden Stockholm
Marseille Szeged Poland Warsaw Gothenburg
Lyon Pecs Katowice-Zory Malmo

8/3/2019 Secondary Growth Poles in Europe
http://slidepdf.com/reader/full/secondary-growth-poles-in-europe 19/60
12
6. REVISING AND SPECIFYING THE DATA
6.1 The Monitoring Committee asked us to specify more precisely the quantitative data we intend to use both
generally and for the case studies. We are attempting to collect robust quantitative evidence which will
paint an accurate picture of the position across all secondary cities and also allow us to tell a coherent story
about the economic, social and environmental trajectories of our case study cities during the past decade
and permit informed assessments of likely future performance. And we want to be able to make sensible
comparisons both within and between our cities. We want to assess their performance on the key drivers
of competiveness in our model, that is – innovation, human capital, connectivity, place quality and strategic
decision-making capacity. The gap between what is desirable and possible in the data field is rather large,
especially when trying to do cross national comparative work. Data are generally better in the harder
economic field and less good in the no less important social and environmental fields.
Proposed data for 124 secondaries and 31 Capitals
6.2 For the 124 secondaries and 31 capital cities we propose to use data that are in principle, if not always in
practice, available for all of them. So we have used data drawn from EUROSTAT, DG Regio and other ESPON
studies. We are assembling data for the following indicators for all 31 Capital and 124 secondaries:
Population, Total GDP, GDP per capita, GDP per person employed, Total employment, Employment
by sector (2000-2007) Employment rate, High level of education (2008)
Unemployment rates (2000-2008)
Patent applications (2006-7)
Potential accessibility: air, road, rail and multi-modal (2001 & 2006)
Net migration rates (2007)
This will give us genuinely comparative data, even though as we have noted the boundaries of some of the
metro regions are large and often include more areas than we are studying in our case study cities. Later in
this report and in the Annex we provide some preliminary description of some of these indicators.
Proposed data for case studies
6.3 In the case studies we will enrich that comparative data with locally generated data. This will allow a more
fine grained analysis of the economic, social and environmental performance and prospects of these places.We want to track performance in quantitative terms on the first four indicators of competiveness –
innovation, human capital, connectivity, and place quality. Strategic decision-making capacity will be
addressed in more qualitative terms through the interviews. We will also want to conduct some internal
comparisons between, for example: the best performing areas of the city, the city region, the region, the
capital and the nation.
6.4 The CU has emphasised the need to focus on the social and environmental performance of our cities so it is
important we try to get as many of those indicators as is possible. We are exploring what is both desirable
and possible in our case study cities. We know that data availability will vary from city to city and country to
country. We will try to collect the most readily available robust data from reliable sources – national
statistical offices, government departments, census, metropolitan development agency, Chamber of
Commerce, research institutes. We recognise that this means the data we get may not always be directly
comparable between cities. But they would serve the purpose of conveying the complexity and richness of
the individual city. We would make the formal comparisons using the metro region data.
6.5 So in the case studies we propose to collect data at national, regional, metro region, city and within city the
following indicators, which combine the ‘harder’ economic ones we are collecting for all the secondaries
with some ‘softer’ social and environmental measures specifically for the case study cities:
Population, Total GDP, GDP per capita, GDP per person employed; Total employment, Employment by
sector, Employment rate, Unemployment rates; High level of education; Patent applications; Potential
accessibility: air, road, rail and multi-modal; Journeys to work by car/public transport/on foot; Net
migration rates; Proportion of the population with no qualifications; Air quality; Average earnings;
Crime rates; Poverty or deprivation measures; Housing costs and quality
6.6 This is a long list and it may not be possible to get all indicators for all spatial levels and time points in all
our case study cities. The position will clearly vary between places. But we can live with such variation. Our
key concern is that the data we collect are accurate, robust, and most important relevant to the key

8/3/2019 Secondary Growth Poles in Europe
http://slidepdf.com/reader/full/secondary-growth-poles-in-europe 20/60
13
questions and issues. The data should be enough to tell the necessary story and illustrate it with
informative maps, tables and diagrams.
6.7 So far this report has reported progress on a series of methodological issues. It next focuses upon what we
have done substantively and reports progress and some early tentative messages from some of our key
blocks of work.
7. PROGRESS AND INITIAL MESSAGES - POPULATION, GDP,
EMPLOYMENT AND PRODUCTIVITY DATA
What have we done so far?
7.1 So far we have concentrated on collecting the most comprehensive and most widely available data on the
recent economic performance of capital and secondary cities across Europe. To our knowledge this is the
first time that such data have been assembled in this way. We have also undertaken some preliminary
analysis. The primary purpose of the data collection and analysis is to set the scene and agenda and lay the
foundations for the other aspects of our research programme.
Secondary cities – picking up , catching up, staying up with capitals?
7.2 The main focus of our analysis so far has been to find out which secondary cities are improving or picking
up, which are catching up and which are falling behind their respective capitals. So far we have done this in
terms of population, GDP and employment change data for the years 2000 and 2007. In addition, we have
collected recent data on employment in financial intermediation, real estate renting and business activities,
tertiary level education, patent applications, potential accessibility by air. We have not yet analysed these
data. But they are presented in the Annex.
7.3 We have undertaken some preliminary correlation work which explores whether there are statistically
significant relationships between GDP per capita and indicators of some, though not all, of the key drivers
of economic competitiveness – connectivity, human capital and innovation/creativity.
7.4 We have also grouped city performance data by type of governmental system and European region to
consider whether the performance of secondary cities is affected either by the degree to which thegovernance system of their respective countries is decentralised or by their location.
Health warnings- nothing’s perfect
7.5 We have prepared separate technical reports on the virtues and limitations of the data that we have used.
Essentially, they make the following key points. The great virtue of using Eurostat/DG Regio NUTS 3 data to
measure leading cities’ performance is that they are available for all leading non-capital cities on a
statistically comparable basis, are up to date and, crucially, match metropolitan region boundaries.
Alternative data sources lack some of these attributes.
7.6 Boundary definitions for our cities are based on harmonised agreed OECD/DG Regio metro-regions, which
represent functional urban areas and the principle of labour market self-containment, using NUTS 3
building blocks. This concept is broader than narrow city definitions. These boundaries are the best
available given the spatial scale at which data are available. They are not perfect. For the majority of citiesthey work well. As already discussed in Section 5, for a minority of cities there may be a degree of over-
bounding and rare occasions of under-bounding, which may create occasional imperfections in accuracy of
performance data for individual cities.
7.7 Drawing the line in determining which non-capital cities to include in order to focus on major places and on
manageability grounds is always controversial as a case can always be made for including or excluding
borderline cases. We have sought, as already noted, to take into account the comments of Monitoring
Committee members by adopting a simple population criterion adjusted by country size (inclusion of cities
which account for 66.7% of the total metropolitan region population in the eight largest - that is most
populous - countries) and ensuring that at the very least we investigate the capital and next largest city in
every member country where this is possible and makes sense. However, this study is primarily about
major places that make a major contribution to overall European prosperity.

8/3/2019 Secondary Growth Poles in Europe
http://slidepdf.com/reader/full/secondary-growth-poles-in-europe 21/60
14
7.8 Occasionally, GDP per capita figures may be over-inflated by heavy in-commuting (e.g. those for
Luxembourg). We have limited comprehensive time series data and are only therefore measuring changes
in comparable performance over a comparatively short period and are not charting cities’ longer term
trajectories. Although GDP data are generally accepted as a rough proxy for prosperity and productivity,
quality of life is much harder to define and measure and comprehensive data relating to this are lacking.
We will be comparing the quality of life in the case study cities with that of their respective capitals and
peers using data about incidence of crime, quality of leisure and cultural facilities.
7.9 We are not yet in a position to provide systematic analysis of the data from this part of the project.
However, since we have collected a lot of data already and have done some very preliminary review and
analysis we thought it would be helpful to provide some analysis of a small number of these: population,
GDP, employment and productivity in terms of GDP per person employed.
Population, Urban Structures and Settlement Systems
7.10 Table 7.1 gives an indication of urban systems across the ESPON territory using Metropolitan Region (NUTS
3) data. It shows the relative sizes, in population terms, of capital and secondary cities. The figures show
the percentage share of each country’s total metropolitan region population accounted for by their capital
and secondary cities. It gives a rough measure of capital city primacy and the relative importance of non-
capital/ secondary cities in the urban hierarchies of the different countries. At one extreme are the
relatively small countries in which the capital dominates and there is no urban hierarchy to speak of – Luxembourg, Cyprus, Malta and Iceland. At the other extreme are the larger countries with relatively
extended urban hierarchies like Germany, Italy, France and the UK.
7.11 The differences between the state groupings are interesting. The Federal countries, with the notable
exception of Germany have a less extended urban hierarchy – with Austria, Belgium and Switzerland each
having just four metropolitan regions in addition to their respective capitals. The Nordic states also have
relatively truncated urban systems with either three (Denmark), two (Finland, Norway and Sweden)
metropolitan regions outside the capital or none in the case of Iceland. Within the former socialist
countries of the new unitary member states, Poland’s extended urban hierarchy also stands out and
contrasts with the more truncated structures in Estonia, Latvia, Slovakia, Slovenia and the EU candidate
country of Croatia.
Primacy
7.12 Differences in the relative dominance of the capital also stand out. Table 7.2 ranks the capital by
percentage share of total metropolitan region population. The capital city with the smallest share (Berlin in
Federal Germany) is in one of the most polycentric countries. The capital of the two regionalised states
and highly polycentric countries of Italy and Spain also have less primate capital cities. Poland, again highly
polycentric, also has a capital with a relatively small share of the country’s urban population
Table 7.1 Urban structure - Share (%) of total metropolitan region population, capital and secondary
cities (in descending order of size) Urban structure -Share (%) of total metropolitan region population, capital and secondary cities (in descending order of size)
State system/
country
Capital 1 2 3 4 5 6 7 8 9 10 11 12 13 14 15 16+
Federal
Austria 58.4 14.6 10.6 8.9 7.6Belgium 57.4 16.3 10.2 8.7 7.3
Germany 9.5 15.5 7.0 5.9 5.7 5.1 4.9 2.5 2.5 2.4 2.4 2.0 1.8 1.7 1.7 1.7 27.7
Switzerland (Non-
EU) 36.4 19.2 16.5 14.9 13.1
Regionalised States
Italy 11.1 22.6 9.4 6.6 4.8 3.8 3.4 3.2 3.2 2.9 2.8 2.7 2.6 2.6 2.5 2.4 13.3
Spain 17.9 15.9 7.3 5.7 4.8 4.3 4.0 3.7 3.7 3.6 3.5 3.0 2.8 2.7 2.5 2.4 12.0
Northern (Nordic) Systems
Denmark 49.4 21.7 15.9 13.0
Finland 60.7 19.9 19.4
Iceland 100.0
Norway (Non-EU) 54.8 24.1 21.1
Sweden 41.4 33.4 25.2
Other Unitary States (EU15)
France 28.3 6.6 4.7 4.1 3.7 3.3 3.2 2.9 2.8 2.7 2.6 2.6 2.6 2.3 2.3 2.2 22.8
Greece 78.2 21.8
Ireland 72.6 27.4
Luxembourg 100.0

8/3/2019 Secondary Growth Poles in Europe
http://slidepdf.com/reader/full/secondary-growth-poles-in-europe 22/60
15
Netherlands 32.4 25.6 6.8 6.4 6.0 5.8 5.7 4.2 3.6 3.4
Portugal 67.8 32.2
United Kingdom 32.8 5.8 5.3 4.9 4.2 3.6 3.4 3.2 2.6 2.5 2.5 2.5 2.3 2.2 1.9 1.9 18.5
Other Unitary States (EU12)
Bulgaria 50.9 30.7 18.4
Cyprus 100.0
Czech Republic 36.4 20.1 18.0 16.8 8.7
Estonia 59.8 40.2
Hungary 52.7 13.7 10.2 8.0 7.9 7.5
Latvia 74.7 25.3
Lithuania 43.8 36.3 19.9
Malta 100.0
Poland 13.8 15.8 6.3 5.4 5.2 5.2 4.9 3.5 3.5 3.4 3.2 3.2 3.1 3.0 2.9 2.8 14.9
Romania 30.6 11.6 10.4 10.2 9.9 9.5 9.0 8.7
Slovakia 44.5 55.5
Slovenia 61.1 38.9
Other Unitary EU Candidate
Country
Croatia 70.0 30.0
Table 7.2 Country rankings by capital city share of total metropolitan region population
Country Capital city (%) share of totalmetropolitan region population
Cyprus 100
Iceland (EU Candidate Country) 100
Malta 100
Luxembourg 100
Greece 78.2
Latvia 74.7
Ireland 72.6
Croatia (EU Candidate Country) 70
Portugal 67.8
Slovenia 61.1
Finland 60.7
Estonia 59.8Austria 58.4
Belgium 57.4
Norway (Non-EU) 54.8
Hungary 52.7
Bulgaria 50.9
Denmark 49.4
Slovakia 44.5
Lithuania 43.8
Sweden 41.4
Switzerland (Non-EU) 36.4
Czech Republic 36.4
United Kingdom 32.8
Netherlands 32.4
Romania 30.6
France 28.3
Spain 17.9
Poland 13.8
Italy 11.1
Germany 9.5
Key
Federal
Regionalised
Northern
Other Unitary (EU 15)
Other Unitary (EU 12) & Croatia
Source: SGPTDE calculations

8/3/2019 Secondary Growth Poles in Europe
http://slidepdf.com/reader/full/secondary-growth-poles-in-europe 23/60
16
7.13 In Table 7.3, we attempt to summarise the key characteristics of the current settlement structures
drawing on Council of Europe, UN-Habitat reports and other sources. It is highly schematic and
understates the complexity of actual structures but it indicates the variation that policy has to address.
7.14 The pattern broadly is:
Federal States Strong growth around metropolitan regions (West Germany) and city regions (Austria and Belgium).
Some urban decline in East Germany although even here some signs of urban renaissance.
Suburbanisation pressures around city-regions (Belgium) and capitals (Austria).
Switzerland also underlines the role of physical geography with development highly concentrated
spatially because of the country’s physical terrain.
Regionalised States
Development balanced across cities with Spain marked by the relative growth of both large and small
to medium cities.
Nordic states
Denmark densely populated with a dominant capital city.
Finland also with a dominant capital but with notably growing secondary cities.
Iceland urbanised with dominant capital city.
Norway less urbanised but with core secondary cities growing rapidly.
Sweden sparsely populated with concentrations in the capital and two secondary cities.
Unitary States (EU15)
Some with development still dominated by capitals (Greece, Ireland, Luxembourg and Portugal).
UK capital city-region dominant but some growth in secondary cites.
France capital city-region again dominant but main secondary cities also growing.
Unitary States (EU 12) and Croatia
Physical geography important for the islands of Cyprus and Malta with growth constrained and
concentrated on capital cities.
Three broad urbanisation patterns in former socialist states:
Slow growth: modest national growth rates mirrored by a slightly faster growth in urban areas
(Croatia, Slovakia, Slovenia and Poland); most of this growth in secondary cites while all capitals,with the exception of Warsaw, lost population.
Slow decline: modest decline in national population mirrored by similar declines in urban
populations (Czech Republic and Hungary) but with particularly marked decline in Hungarian
capital, Budapest standing out.
Fast decline: substantial national population declines with comparable declines in urban and rural
populations (Bulgaria and Baltic States of Estonia, Latvia, Lithuania). The capitals of both Bulgaria
and Latvia lost proportionately more population than secondary cities while the reverse was the
case in Estonia and Lithuania. Romania is the exception with the capital, Bucharest, gaining
population while secondary cities experienced declines.
Table 7.3 Key characteristics of settlement structures
Political
system/
country
Key characteristics of settlement structures
FEDERAL
Austria City regions are becoming the growth poles of the economy.
Issues of suburbanisation around capital city, Vienna.
Belgium Flanders dominated by central urban network of Antwerp-Leuven-Brussels-Ghent (‘Flemish Diamond’)
Wallonia dominated by triangle between Brussels-Charleroi-Liege and cross-border settlements: Charleroi-Lille; Liege-Aachen-
Maastricht (Belgium, Germany, Netherlands); and Arlon-Luxembourg.
Strong suburbanisation pressures.
Germany Polycentric urban structure with an upper tier of economically well-performing (functionally specialised) cities in the west and south
contrasting with still restructuring cities in the east and north.
Growth and innovation areas are mainly the metropolitan regions and other important agglomerations, especially in the western
regions.
Urban system connected to European and global networks of cities with its multi-tiered networks of a regional, national, European and
global nature.
Some signs of urban renaissance even in east.
Switzerland(Non-EU)
Small and densely populated with only thirty-one per cent of the country’s total surface area suitable for human settlement.
Settlements concentrated in the Mittelland between the Jura and the Alps, which has only twenty seven per cent of the country’s
surface area but all the large cities, production and service centres and the main road, rail and air transport arteries.

8/3/2019 Secondary Growth Poles in Europe
http://slidepdf.com/reader/full/secondary-growth-poles-in-europe 24/60
17
REGIONALISED STATES
Italy A number of large cities, by European standards, populate the I talian territory but well-balanced geographical coverage and no urban
area dominates.
No city considered tobe the ‘prime’ city, and in many senses all can be considered ‘secondary’ cities.
Spain Dense urban networks of large and medium-sized cities distributed around the coast with, apart from Madrid, little urbanisation in the
interior.
Madrid a major European metropolis and Barcelona a European one, followed by 6 cities with European potential (inc. Valencia, Seville
and Granada) and then another 6 of consolidated national importance (inc. Cordoba and Santander).
Big cities (the 7 with more than 0.5 million people) have shown the strongest economic performance followed not by the next s izegroup (200,000 to 500,000 people) but the third (100,000 to 2000, 000) - underling the fact that medium-small cities are also
performing strongly alongside the biggest.
Coastal cities performing better than those in the interior.
NORTHERN (NORDIC) SYSTEMS
Denmark Copenhagen is 5-7 times larger than Aarhus, the second largest city. The primacy of the Copenhagen city-region marks Denmark out in
relation to other Scandinavian countries.
Compared to other Scandinavian countries, Denmark is relatively densely populated and has a very urbanised population, with la rger
and medium sized towns distributed evenly throughout the country.
Finland Helsinki is by far the dominant city in Finland – contains a fifth of the population; one fourth of employed persons; & one third of GDP
of the whole country.
Despite this, Finland’s secondary cities have been growing and performing strongly over the past decade or so, in particular Tampere,
Turku, Oulu & Kuopio.
Iceland
(EU
Candidate
Country)
Urban structure dominated by capital, Reykjavík, with the Greater Reykjavík Area in the sout h-western region accounting for just under
two-thirds of the country’s population.
Reykjavík itself is four times the size of the next largest city, Kópavogur.
Norway(Non-EU)
Not highly urbanised by European standards with only 5 cities with population exceeding 100,000, all located in the southern part of thecountry.
All these major urban areas are growing with Oslo, Bergen, Stavanger and Trondheim growing particularly rapidly.
Growth is also spreading towards small and medium-sized towns.
Suburbanisation marked around major cities and small and medium-sized town in central regions.
Sweden Sparsely populated country with most of the population concentrated in a small number of larger urban areas.
Only 3 cities in Sweden have a population above 200,000 – the capital, Stockholm and Gothenburg and Malmo.
UNITARY STATES (EU15)
France Big gap between the French capital, Paris, and other large cities.
“Second” city candidates (Lille, Lyon or Marseille) are about 6-7 times smaller in terms of population and economic weight.
Paris and the large metropolitan areas of Lille, Lyon, Marseille and Strasbourg, Toulouse are growth areas.
Suburbanisation marked in coastal regions of western and southern France and around some large metropolitan areas (Bordeaux,
Montpellier and Toulouse).
Greece Dominated by Athens, the primate capital with approximately 50% of the countr y’s urban population.
Ireland Dominated by Dublin and still a strong gap between it and larger urban centres in south, southeast, west & northwest including the
key secondary cities of Cork, Limerick, Galway & Waterford.
Population share of five gateway cities (the capital, Dublin, and Cork, Limerick, Galway and Waterford) declining.Luxembourg Dominated by the Luxembourg city-region with marked gap between it and the country’s secondary cities in the south and the smaller
towns in the rural areas situated to the north and east of the capital.
Netherlands Highly urbanised and distinguished by a single major metropolitan region covering the four cities of Amsterdam, Rotterdam, The
Hague and Utrecht - the Randstad.
Portugal Lisbon dominates with Porto the main secondary city struggling to develop.
United
Kingdom
Capital city region, Greater London, dominant but second tier of large cities seeing some recent growth (notably Bristol in the south
west and Leeds in the north).
UNITARY STATES (EU12)
Bulgaria Falling urban population closely related to the continuing drop in the national population.
Capital, Bucharest, experiencing slightly more decline than secondary cities.
Cyprus Strongly monocentric with growth dominated by capital city.
Czech
Republic
Fragmented settlement structure with large number of municipalities and dense network of small and medium-sized cities.
Only three cities larger than 250,000 inhabitants – the capital, Prague, and Brno and Ostrava, where growth has largely been
concentrated at the expense of other regional towns.
Depopulation of inner city areas of large agglomerations.
Slow population decline in capital and secondary cities.Estonia Dominated by capital, Tallinn and Tartu and Parnu secondary cities.
Secondary cities experiencing proportionately more population decline than capital.
Suburbanisation of large city agglomerations.
Hungary Strongly monocentric dominated by capital city, Budapest.
Population increase highest in towns located around the Budapest agglomeration.
Population loss in capital (possibly exaggerated by census procedures) and some growth in secondary cities.
Latvia Strongly monocentric dominated by capital city, Riga.
Capital losing proportionality more population than secondary cities.
Suburbanisation accelerating in past decade.
Lithuania Declining population in urban areas but decline less in capital than secondary cities.
Malta Dominated by capital, Valletta.
Poland Little change in the general pattern of population distribution; although Warsaw and its metropolitan area have been growing, both in
absolute terms and in relation to other urban places, on account of internal, as well as international migration.
More polycentric development with growth distributed amongst capital and various secondary cities (Warsaw, Kraków, Wroclaw,
Poznan, the Gornolaska conurbation, Gdansk-Sopot-Gdynia and Lodz).
But there is still a question of overconcentration in the capital-city agglomeration. Suburbanisation affecting capital, Warsaw, and larger cities of Gdansk, Poznan, Wroclaw, Cracow, on the one hand, and the cities of
Rzestow, Lublin, Bialystock and Olsztyn in Eastern Poland on the other.

8/3/2019 Secondary Growth Poles in Europe
http://slidepdf.com/reader/full/secondary-growth-poles-in-europe 25/60
18
Romania Relatively balanced polycentric development with cities housing approximately 55% of the total population (around 22 million
inhabitants).
Capital, Bucharest, gaining population whil e secondary cities experiencing declines.
Slovakia Strongly monocentric dominated by Bratislava-Trnava core area with the capital, Bratislava, at the centre.
Falling population in capital offset by some growth in secondary cities.
‘Concentrated deconcentration’ in urban agglomerations – seeing inflow set against suburbanisation within the vicinity of largest cities.
Suburbanisation strongest around Bratislava and Kosice, the two largest agglomerations.
Slovenia Polycentric development based on 8 regional development centres, although with only two having populations over 100,000 – the
capital, Ljubljana and the second largest city, Maribor. Some population loss in capital offset by some growth in secondary cities.
OTHER UNITARY
Croatia
(EU
Candidate
Country)
Monocentric development but slight population fall in capital, Zagreb, offset by growth in the three conurbations of Split, R ijeka and
Osijek. Zagreb, however, is still four times the size of the second largest city, Split.
The uneven distribution of urban centres is a feature of the country’s urban system, with the largest concentrations of population
around Zagreb in the north-west and Split and Rijeka on the coast in the north and south, respectively.
Source: CEMAT (2010), UN-Habitat (Hirt and Stanilov, 2009) and various others
7.15 It is clear, therefore, that policies for secondary cities have to adapt to existing urban structures and
settlement systems. In the more polycentric and growing urban systems like Germany and Spain, for
example, policy is going with the grain of urban development. In others where monocentricity is ingrained
as, for example, in Ireland it is more of challenge and, in some senses, more about breaking the mould.
Early findings on GDP and productivity
7.16 We present the preliminary results of our data collection and analysis for capital and non-capital cities
under three main headings:
Economic significance – total GDP.
Performance – GDP per capita and GDP change.
Productivity – employment change and GDP per person employed.
We add five caveats to this section. First GDP data at city level are not available from EUROSTAT for
Iceland, Norway and Switzerland so there are gaps for those countries in the tables. We are still
attempting to fill these gaps from national statistical offices. Second, as we indicated in Section 3,
economic, social and environmental issues are equally important and we recognise that GDP is only one
measure of city performance and will be balanced by other measures, especially in the case studies. Third
the indicators are for metro-regions and not for smaller administrative boundaries as explained above.
Fourth, all data are provisional at this stage. Lastly, it is important to note that figures for GDP change overtime have been deflated to convert nominal into real values. This allows us to identify real change. As price
inflation has occurred in all countries over the period, the deflated percentage changes in real GDP are
lower than the nominal changes.
Economic significance – capitals typically lead but secondaries matter
7.17 The total GDP of the selected 28 nation state capitals exceeds that of their leading non-capital
counterparts in all countries except Germany and Italy. Nevertheless the upper echelons of total GDP
rankings also include a number of very significant secondary cities. 12 of the top 28 European cities in
terms of GDP are leading non-capital cities. These cities account for 32 of the top 50 cities. This is partly
because the EU15member states of the EU are more prosperous than the 12 newer members, which is
reflected in the GDP of their respective capitals. All but 8 of the 100 cities with the highest GDP are located
in the EU15 member states. However, the mixture of capital and non-capital cities in the leading total GDP
rankings does show that the performance of ‘secondary’ cities matters a great deal to the EU’s economicweight and prosperity. Map 7.1 maps capital and leading non-capital cities according to total GDP in 2007
and Figures 7.1 to 7.6 divides these cities into six size bands to give an impression of where the most
significant cities are located and where urban systems are weaker in terms of economic weight. This
division stresses the importance of the core ‘pentagon’ area of Europe (London, Paris, Hamburg, Munich
and Milan) together with a limited number of outliers.
7.18 The gap in GDP between the capital and other leading cities is often large. In 19 out of 25 countries the
capital’s total GDP is more than twice that of the largest non-capital city and in some cases it is as much as
eight or nine times greater.
7.19 We grouped together member countries according to the extent of the gap between the GDP of the capital
and the leading non-capital city and found:
Germany and Italy are the only member states where the largest non-capital city has a GDP which
exceeds that of the capital. However, closer examination of their respective urban hierarchies

8/3/2019 Secondary Growth Poles in Europe
http://slidepdf.com/reader/full/secondary-growth-poles-in-europe 26/60
19
suggests that they are rather different cases. Germany contains a relatively balanced urban system
owing to its federalised nature in which seven cities are of major economic importance, four of which
have a higher GDP than Berlin the capital, the growth of which has been historically constrained.
Italy by contrast is dominated by Milan and Rome, while other secondary cities significantly trail
behind in terms of GDP.
Italy has much more in common with Spain, Netherlands, Poland and Sweden where the most
significant secondary centre has a total GDP of between 50-80% that of the capital. In most of thesecountries, the gap between the GDP of the capital and leading one or two secondaries and that of
other major urban centres is as significant as the gap between the capital and the leading secondary.
In ten member countries, the largest group, the largest secondary city has a total GDP between 25
and 50% that of the capital. These include 5 EU15 countries (Ireland, Denmark, Portugal, Belgium and
Austria) and 5 EU12 countries (Lithuania, Slovakia, Slovenia, Estonia and Czech Republic).
The capitals of Croatia, Finland, Bulgaria, Romania and Greece dominate their respective urban
hierarchies since the GDP of the largest non-capital city in those countries is only between 15 and
25% that of the capital.
Capitals dominate most in countries where the largest secondary produced only 10-15% of the GDP
of the capital. These include UK and France where London and Paris hold sway owing to their status
as global financial and cultural centres and also the highly centralised Eastern member states of
Hungary and Latvia.
We were unable to include Luxembourg, Cyprus, Malta, Iceland, Norway and Switzerland in theanalysis owing to either the lack of a significant secondary city or the unavailability of data.
Map 7.1: Capital and Secondary Cities – Total GDP in PPS, 2007

8/3/2019 Secondary Growth Poles in Europe
http://slidepdf.com/reader/full/secondary-growth-poles-in-europe 27/60
20
Figure 7.1: Total GDP in PPS in millions, 2007 – Largest secondary larger than capital: Germany and Italy
0
50,000
100,000
150,000
200,000
250,000
300,000
Total GDP in PPS in
millions, 2007
Figure 7.2: Total GDP in PPS in millions, 2007 – Largest secondary 80% to 50% size of capital: Spain, Netherlands,
Sweden, Poland
0
50,000
100,000
150,000
200,000
250,000
Figure 7.3: Total GDP in PPS in millions, 2007 – Largest secondary 50% - 25% size of capital: Lithuania, Slovakia, Ireland,
Slovenia, Denmark, Portugal, Estonia, Belgium, Czech Republic, Austria
0
20,000
40,000
60,000
80,000
100,000
120,000
140,000

8/3/2019 Secondary Growth Poles in Europe
http://slidepdf.com/reader/full/secondary-growth-poles-in-europe 28/60
21
Figure 7.4: Total GDP in PPS in millions, 2007 – Largest secondary 25% - 15% size of capital: Croatia, Finland, Bulgaria,
Romania, Greece
0
20,000
40,000
60,000
80,000
100,000
120,000
140,000
Figure 7.5: Total GDP in PPS in millions, 2007 – Largest secondary 15% - 10% size of capital: Latvia, France, UK, Hungary
0
100,000
200,000
300,000
400,000
500,000
600,000
700,000
R i g a
D a u g a v
p i l s
P
a r i s
L
y o n
L i l l e
M a r s e i l l e
B o r d e
a u x
T o u l o
u s e
N a n
t e s
R o u e n
L e n s - L i e v i n
G r e n o
b l e
N
i c e
S t r a s b o u r g
R e n
n e s
M o n t p e l l i e r
M
e t z
T o u
l o n
L o n d o n
M a n c h e s t e r
B i r m i n g h
a m
B r a d f o r d - L e
e d s
G l a s g o w
B r i s t o l
S h e f f
i e l d
E d i n b u
r g h
L i v e r p
o o l
N o t t i n g h
a m
N e w c a s t l e - u - T
y n e
L e i c e s t e r
C a r d i f f
B e l f a s t
B u d a p
e s t
G
y o r
M i s k o l c
D e b r e
c e n
S z e
g e d
P
e c s
Total GDP in PPS in
millions, 2007
Figure 7.6: Total GDP in PPS in millions, 2007 – Countries where no secondary included or where city data unavailable:
Luxembourg, Cyprus, Malta, Iceland, Norway, Switzerland
0
5,000
10,000
15,000
20,000
25,000
30,000
35,000
Total GDP in PPS in
millions, 2007
Performance – secondary cities matter but even more in EU15
7.20 Leading non-capitals also feature significantly in the list of the most highly ranked cities in terms of GDP percapita. 16 of the top 28 cities in terms of GDP per capita are leading non-capital cities, as are 34 of the top

8/3/2019 Secondary Growth Poles in Europe
http://slidepdf.com/reader/full/secondary-growth-poles-in-europe 29/60
22
50. All but 10 of the 100 cities with the highest GDP per capita are located in the EU15 member states.
The performance gap between cities in EU12 and EU15 countries is striking – 25 of the 26 lowest ranked
cities of the 146 cities examined were EU12 secondary cities. Map 7.2 shows the location of capital and
leading non-capital cities according to GDP per capita and divides them into five size bands to give an
impression of where the most productive, high value added cities are located and where urban systems are
weaker in this sense. It again stresses the importance of the core area of Europe but shows that there are
some significant outliers.
7.21 As with total GDP, we grouped together member countries according to the extent of the gap between the
GDP per capita of the capital and the leading non-capital city and found (Figures 7.7 to 7.12):
The GDP per capita of the leading non-capital city in Germany, Austria, Italy, Belgium and Ireland
exceeded that of their respective capitals in 2007.
The GDP per capita of the leading non-capital city in Spain, UK, Netherlands and France lagged behind
that of their respective capitals in 2007 to only a modest degree - by between 5 and 20%.
In Denmark, Poland, Sweden, Finland and Portugal, the GDP per capita of the leading non-capital
lagged behind that of the capital by between 20 and 30% in 2007.
Leading non-capital cities in Hungary, Romania, Lithuania, Greece, Czech Republic, Slovenia and
Croatia significantly trail behind their capitals in terms of GDP per capita – by between 30-45%.
In Bulgaria, Estonia, Latvia and Slovakia, the gap in GDP per capita between capital and leading non-
secondary is very large indeed ranging from 50 to 65%. The gap in performance between the capital and leading non-capital cities tends to be much greater in
the EU12 than in the EU15 countries.
Again, we were unable to include Luxembourg, Cyprus, Malta, Iceland, Norway and Switzerland in the
analysis owing to either the lack of a significant secondary city or the unavailability of data.
Map 7.2: Capital and Secondary Cities – GDP per capita in PPS, 2007

8/3/2019 Secondary Growth Poles in Europe
http://slidepdf.com/reader/full/secondary-growth-poles-in-europe 30/60
23
Figure 7.7: Top secondary outperforms capital: Germany, Austria, Italy, Belgium and Ireland
0
5,000
10,000
15,000
20,000
25,000
30,000
35,00040,000
45,000
50,000
B e r l i n
M u n i c h
S t u t t g a r t
H a m b u r g
N u r e m b e r g
M a n n h e i m
C o l o g n e - B o n n
H a n n o v e r
B r e m e n
D u s s e l d o r f -
B i e l e f e l d
D r e s d e n
L e i p z i g
C h e m n i t z
V i e n n a
L i n z
S a l z b u r g
G r a z
I n n s b r u c k
R o m e
B o l o g n a
M i l a n
B r e s c i a
F l o r e n c e
T u r i n
G e n o a
B a r i
S a l e r n o
P a l e r m o
C a t a n i a
N a p l e s
B r u s s e l s
A n t w e r p
G e n t
L i e g e
C h a r l e r o i
D u b l i n
C o r k
GDP per capita PPS, 2007National Secondary City
Figure 7.8: Top secondary lags capital 5%-20%: Spain, UK, Netherlands and France
0
5,00010,000
15,000
20,000
25,000
30,000
35,000
40,000
45,000
M a d r i d
B i l b a o
B a r c e l o n a
V a l e n c i a
C o r u n a
M u r c i a
S e v i l l a
C a d i z
M a l a g a
L o n d o n
E d i n b u r g h
B r i s t o l
B e l f a s t
L e i c e s t e r
G l a s g o w
M a n c h e s t e r
B i r m i n g h a m
B r a d f o r d - L e e d s
N o t t i n g h a m
N e w c a s t l e u T y n e
C a r d i f f
S h e f f i e l d
L i v e r p o o l
R a n d s t a d N o r t h
R a n d s t a d S o u t h
E i n d h o v e n
H e e r l e n
A r n h e m
E n s c h e d e
P a r i s
L y o n
T o u l o u s e
N i c e
B o r d e a u x
N a n t e s
M a r s e i l l e
R e n n e s
S t r a s b o u r g
R o u e n
G r e n o b l e
M o n t p e l l i e r
T o u l o n L i l l e
M e t z
L e n s - L i e v i n
GDP per capita PPS, 2007 National Secondary City
Figure 7.9: Top secondary lags capital by 20-30%: Denmark, Poland, Sweden, Finland & Portugal
0
10,000
20,000
30,000
40,000
50,000
GDP per capita PPS, 2007 National Secondary City

8/3/2019 Secondary Growth Poles in Europe
http://slidepdf.com/reader/full/secondary-growth-poles-in-europe 31/60
24
Figure 7.10: Top secondary lags capital by 30-45%: Hungary, Romania, Lithuania, Greece, Czech Republic, Slovenia and Croatia
0
5,000
10,000
15,000
20,000
25,000
30,000
35,000
B u d a p e s t
G y o r
S z e g e d
P e c s
D e b r e c e n
M i s k o l c
B u c h a r e s t
T i m i s o a r a
C l u j - N a p o c a
C o n s t a n t a
C r a i o v a
I a s i
V i l n i u s
K l a i p e d a
K a u n a s
A t h e n s
T h e s s a l o n i c a
P r a g u e
B r n o
P l z e n
H K / P a r d u b i c e
O s t r a v a
L j u b l j a n a
M a r i b o r
Z a g r e b
S p l i t
GDP per capita PPS,
2007National Secondary City
Figure 7.11: Top secondary lags capital by 50-65%: Bulgaria, Estonia, Latvia and Slovakia
0
10,000
20,000
30,000
40,000
50,000
GDP per capita PPS, 2007 National Secondary City
Figure 7.12: Countries no secondary included or data unavailable: Luxembourg, Cyprus, Malta, Norway,
Switzerland and Iceland
0
20,000
40,000
60,000
80,000GDP per capita in PPS,
2007National Capital city
Recent performance of secondaries– closing the gap with capitals in many but not all countries
7.22 As well as comparing total GDP and GDP per capita data in the 146 selected cities in 2007, we have also
examined the change in total GDP over the period 2000-2007 to establish whether leading non-capital
cities are catching up, holding their own or falling behind their respective capitals. We have deflated thedata and calculated annual percentage change over the period. In 15 of the 25 countries, one or more

8/3/2019 Secondary Growth Poles in Europe
http://slidepdf.com/reader/full/secondary-growth-poles-in-europe 32/60
25
secondary cities recorded higher annual percentage growth in total GDP than their respective capital cities.
This was especially true of Germany, France, Austria, and Spain. It also appeared to be the case in Sweden
and Finland, though in those countries it is important to remember that we are only looking at a limited
number of cities. A significant number of secondary cities in the EU are putting in strong performances (Map 7.3).
7.23 In Central, North and West Europe and the regionalised states in South Europe, some secondary cities areoutperforming their capitals in terms of GDP, although differences in growth rates are often small and in
some countries, such as UK and France, the capitals continue to dominate by a considerable margin
(Figures 7.13 to 7.17). The general picture across the former socialist states in East, Central East and South
East Europe, however, is one in which capitals are pulling away from secondary cities and strengthening
their position (7.19 to 7.21). The relatively few exceptions are: Latvia in the East, where Daugavpils
showed a slightly faster growth rate than Riga (Figure 7.20); and Croatia and Romania in the South East,
where, respectively, Split outperformed Zagreb and Timisoara and Cluj outperformed Bucharest (Figure
7.21).
7.24 In countries with a significant number of major cities, it is noticeable that a considerable number of leading
cities exceeded national growth rates in Germany (seven), France (nine) and Spain (five) (Figures 7.13, 7.16
and 7.17, respectively).
Map 7.3: Total GDP – average annual % change, 2000-7

8/3/2019 Secondary Growth Poles in Europe
http://slidepdf.com/reader/full/secondary-growth-poles-in-europe 33/60
26
Figure 7.13: Total GDP – average annual % change, 2000-7 – Central: Federal states of Austria, Germany and
Switzerland
Source: Eurostat. Swiss city data will be collected from the Swiss national statistical office
Figure 7.14: Total GDP – average annual % change, 2000-7 - Northern ‘Nordic’ Systems: Denmark, Finland, Iceland,
Norway, Sweden
0.0
1.0
2.0
3.0
4.0
5.0
6.0 National City
Source: Eurostat. Norwegian city data will be collected from the Norway national statistical office
Figure 7.15: Total GDP – average annual % change, 2000-7 - West: Unitary states of Ireland and UK
0.0
2.0
4.0
6.0
8.010.0
National Cit
Source: Eurostat

8/3/2019 Secondary Growth Poles in Europe
http://slidepdf.com/reader/full/secondary-growth-poles-in-europe 34/60
27
Figure 7.16: Total GDP – average annual % change, 2000-7 West: Unitary states of Netherlands, France and
Luxembourg and Federal Belgium
Source: Eurostat. 2007 Netherlands data are provisional
Figure 7.17: Total GDP – average annual % change, 2000-7 - South: Regionalised States of Italy and Spain
-1.0
0.0
1.0
2.0
3.0
4.0
5.0
6.0
7.0
Source: Eurostat
Figure 7.18: Total GDP – average annual % change, 2000-7 - South: Unitary states of Cyprus, Greece, Malta and
Portugal
0.0
2.0
4.0
6.0
8.0
National City
Source: Eurostat

8/3/2019 Secondary Growth Poles in Europe
http://slidepdf.com/reader/full/secondary-growth-poles-in-europe 35/60
28
Figure 7.19: Total GDP – average annual % change, 2000-7 - East: Former socialist states of Estonia, Latvia and
Lithuania
0.0
5.0
10.0
15.0
20.0
National Cit
Source: Eurostat
Figure 7.20: Total GDP – average annual % change, 2000-7 - Central East: Former socialist states of Czech Republic,
Hungary, Poland, Slovakia and Slovenia
Source: Eurostat. * We are awaiting data for Slovakia
Figure 7.21: Total GDP – average annual % change, 2000-7 South East: Former Socialist States of Bulgaria, Croatia
and Romania
Source: Eurostat. * Bulgaria figures are for 2000-5 and 2006-7

8/3/2019 Secondary Growth Poles in Europe
http://slidepdf.com/reader/full/secondary-growth-poles-in-europe 36/60
29
Total GDP change – changing balance between capitals and secondaries
7.25 Table 7.4 shows, for each country and regional grouping, the changing shares accounted for by capital and
leading secondary cities of the total GDP that they together produced in both 2000 and 2007. It attempts
to show how the balance between capitals and their secondaries shifted over the period.
7.26 The changes are only slight but they nevertheless give an indication of possible trends. Of the twenty-fourcountries for which we currently have GDP data and which have one or more leading secondary cities, the
change in the share of secondaries remained stable in nine countries, increased in five and fell in ten. The
majority of countries have thus seen secondary cites hold their own or slightly improve their relative
position. There remain, however, notable territorial differences:
Secondary city shares remained stable in all three of the Central Federal states for which we have
data.
In the Nordic states, both Denmark and Finland saw secondary cities slightly increase their share while
it remained stable in Sweden.
The unitary states provide a mixed picture. In West Europe, France and Ireland both saw their
secondary cities increase their relative share while the share remained stable in Netherlands and fell in
the UK.
Of the regionalised states in Southern Europe, the share stayed stable in Spain but fell in Italy. It also
fell in both Greece and Portugal. The relative weakness of some of the secondary cities in the fromer socialist states of Eastern Europe
is underlined. Of the ten countries, only one, Croatia in the South East saw an increase in secondary
city share and only three saw this share remain stable - in Estonia and Latvia in the East and Romania
in the South East. The remaining six - Lithuania in the East, the Czech Republic, Hungary, Poland, and
Slovenia in Central East and Bulgaria in the East – all saw their secondary city shares fall, indicating a
relative weakening of their position.
Table7.4: Share (%) of total GDP - capitals and principal secondary cities, 2000 and 2007
Regional grouping/ political
system/ country
Capital cities
Share (%)
Principal
secondaries
Share (%)
Change in share of principal secondaries
2000-2007
TotalGDP
2000
TotalGDP
2007
TotalGDP
2000
TotalGDP
2007
Increase Stable Decrease
Central: Federal states
Austria 60 60 40 40
Belgium 62 62 38 38
Germany 10 10 90 90
Switzerland n/a n/a n/a n/a Northern (Nordic) Systems
Denmark 57 56 43 44
Finland 70 69 30 31
Iceland n/a n/a n/a n/a Norway n/a n/a n/a n/a Sweden 50 50 50 50
West: Unitary states and
Federal BelgiumFrance 49 48 51 52
Ireland 74 73 26 27
Luxembourg 100 100 0 0
Netherlands1
44 441
56 561
United Kingdom2
53 55 47 45
South: Regionalised states
Italy 17 18 83 82
Spain 34 34 66 66
South: Unitary states
Cyprus 100 100 0 0
Greece 83 85 17 15
Malta 100 100 0 0
Portugal 74 75 26 25
East: Former socialist states)Estonia 77 77 23 23
Latvia 89 89 11 11

8/3/2019 Secondary Growth Poles in Europe
http://slidepdf.com/reader/full/secondary-growth-poles-in-europe 37/60
30
Lithuania 52 56 48 44
Central East: Former socialist
states)
Czech Republic 49 51 51 49
Hungary 67 71 33 29
Poland 29 31 71 69
Slovakia n/a n/a n/a n/a
Slovenia 72 73 28 27
South East: Former socialist
states)
Bulgaria3
64 693
36 313
Croatia 81 80 19 20
Romania 56 56 44 44 Notes: 1 2007 data provisional
2 Excluding BelfastData for 2000 and 2005
Recent employment change - secondaries performing relatively well – but marked territorial differences
7.27 Capital cities dominate employment. In only five European states do individual secondary metropolitan
regions have more employment than their respective capital city regions – Dusseldorf-Ruhrgebeit in
Germany, Milan in Italy, Zurich in Switzerland, Katowice-Zory in Poland and Ko šice in Slovakia (see Annex
for national employment profiles). Looking at recent employment change, however, a more revealing
pattern is visible.
7.28 In the central Federal States of Austria and Germany, four and six secondaries, respectively, outperformed
their capital city (Figures 7.22). In Germany, the difference in performance was not simply a contrast
between former east and west German cities – with Leipzig in the east performing relatively well in relation
to Berlin and, for example, Frankfurt and Stuttgart, in the west, less well.
Figure 7.22: Employment % Change 2001-2007 - Central: Austria, Germany and Switzerland
-4.0
-2.0
0.0
2.0
4.06.0
8.0
10.0
National Cit
Source: Eurostat
7.29 Non-capital cities in the four Nordic states of Denmark, Finland, Norway and Sweden all showed relatively
strong growth in relation to their capital: Aarhus in Denmark, Tampere in Finland, Stavanger and Bergen in
Norway and Malmö and Gothenburg in Sweden (Figure 7.23).

8/3/2019 Secondary Growth Poles in Europe
http://slidepdf.com/reader/full/secondary-growth-poles-in-europe 38/60
31
Figure 7.23: Employment % Change 2001-2007 - North: Denmark, Finland, Iceland, Norway and Sweden
0.0
5.0
10.0
15.0
20.0
25.0
National City
Source: Eurostat
7.30 In West Europe, secondaries also performed relatively well in relation to their capitals with the exception
of Ireland, where employment growth in Cork was below Dublin’s growth rate (Figure 7.24). In the UK, all
the English core cites performed relatively well in relation to the capital, as did Cardiff, Edinburgh andGlasgow (Figure 7.24). In Federal Belgium, all four secondaries outperformed Brussels. In France, ten
secondaries outperformed Paris and three secondaries in the Netherlands outperformed the capital
metropolitan region (Figure 7.25).
Figure 7.24: Employment % Change 2001-2007 - West: Ireland and UK
0.0
5.0
10.0
15.0
20.0
25.0
Source: Eurostat and Nomis (UK data). * Belfast data are unavailable; national data for UK are in fact for Great Britain

8/3/2019 Secondary Growth Poles in Europe
http://slidepdf.com/reader/full/secondary-growth-poles-in-europe 39/60
32
Figure 7.25: Employment % Change 2001-2007 West: Belgium, France, Luxembourg, Netherlands
-10.0
-5.0
0.0
5.0
10.0
15.0
20.0
25.0National City
Source: Eurostat
7.31 In South Europe, the picture is more mixed (Figure 7.26). Greece’s principal non-capital city outperformed
Athens. In Spain performance was evenly spilt with four of its secondaries outperforming and four
underperforming in comparison with Madrid. Italy stands out, with none of its secondaries matching
Rome’s growth rate.
Figure 7.26: Employment % Change 2001-2007 South: Cyprus, Greece, Malta, Italy, Portugal and Spain
-10.0
0.0
10.0
20.0
30.0
40.0
National City
Source: Eurostat
7.32 In the former socialist states of central, eastern and south-eastern Europe the overall performance of
secondary cities, with a few notable exceptions, is markedly much weaker than their western and northerncounterparts (Figures 7.27 to 7.29). In only three of the eleven states did a relatively small number of
secondaries have faster growth rates than their capital cities: Latvia (Daugavpils), Poland (Wroclaw) and,
for a shorter time-period, Bulgaria (Varna and Plovdiv). In the others, the capitals had stronger growth
rates. In polycentric Poland, three of its eleven principal secondaries actually saw employment decline.
Romania also stands out with four of its five secondaries also seeing employment decline while the capital
grew.

8/3/2019 Secondary Growth Poles in Europe
http://slidepdf.com/reader/full/secondary-growth-poles-in-europe 40/60
33
Figure 7.27: Employment % Change 2001-2007 East: Estonia, Latvia, Lithuania
0.05.0
10.0
15.020.025.0
Source: Eurostat
Figure 7.28:: Employment % Change 2001-2007 Central East: Czech Republic, Hungary, Poland, Slovakia, Slovenia
-15.0
-10.0
-5.0
0.0
5.0
10.0
15.0
20.0
25.0
30.0
35.0
National City
Source: Eurostat
Figure 7.29: Employment % Change 2001-2007 South East: Bulgaria, Croatia, Romania
-40.0
-30.0
-20.0
-10.0
0.0
10.0
20.0
30.0
National City
Source: Eurostat. * Bulgaria data are for 2001-5 rather than 2001-7
Productivity – some impressive secondary city growth rates
7.33 The trends in output and employment described above together combine to produce some interesting
patterns in productivity change. Map 7.4 and Figures 7.30 to 7.38 show average annual percentage changes
in GDP per person employed for capital and secondary cities over the 2001 to 2007 period.
7.34 In Central Europe, none of Austria’s secondary cities had faster growth rates than the capital while the
reverse was the case in Germany where all of the secondary cities had growth rates above that of Berlin.
And it is revealing to note that some of the fastest growth rates were recorded in some of the cities from

8/3/2019 Secondary Growth Poles in Europe
http://slidepdf.com/reader/full/secondary-growth-poles-in-europe 41/60
34
the former socialist GDR – Chemnitz, Dresden and Leipzig. This perhaps reflects the integration of these
cities into the already fast-growing West German economy. (Figure 7.30).
Map 7.4: GDP per person employed – average annual % change, 2001-7
Figure 7.30: GDP per person employed - average annual % change, 2001-7 Central: Federalised States of Austria, Germany
and Switzerland
0.0
0.5
1.0
1.5
2.0 National City
Source: Eurostat, Swiss city data will be collected from the Swiss national statistical office
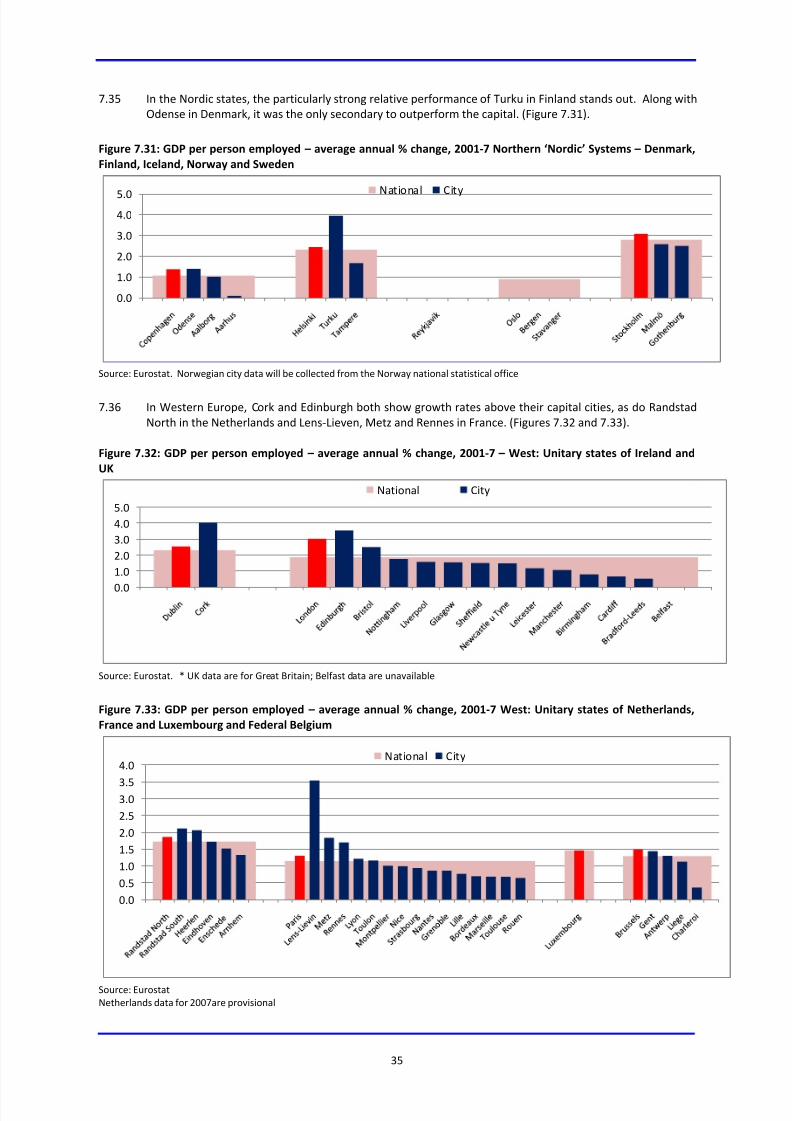
8/3/2019 Secondary Growth Poles in Europe
http://slidepdf.com/reader/full/secondary-growth-poles-in-europe 42/60
35
7.35 In the Nordic states, the particularly strong relative performance of Turku in Finland stands out. Along with
Odense in Denmark, it was the only secondary to outperform the capital. (Figure 7.31).
Figure 7.31: GDP per person employed – average annual % change, 2001-7 Northern ‘Nordic’ Systems – Denmark,
Finland, Iceland, Norway and Sweden
0.0
1.0
2.0
3.0
4.0
5.0National City
Source: Eurostat. Norwegian city data will be collected from the Norway national statistical office
7.36 In Western Europe, Cork and Edinburgh both show growth rates above their capital cities, as do Randstad
North in the Netherlands and Lens-Lieven, Metz and Rennes in France. (Figures 7.32 and 7.33).
Figure 7.32: GDP per person employed – average annual % change, 2001-7 – West: Unitary states of Ireland and
UK
0.0
1.0
2.0
3.0
4.0
5.0
National City
Source: Eurostat. * UK data are for Great Britain; Belfast data are unavailable
Figure 7.33: GDP per person employed – average annual % change, 2001-7 West: Unitary states of Netherlands,
France and Luxembourg and Federal Belgium
0.0
0.5
1.0
1.5
2.0
2.5
3.03.5
4.0National City
Source: Eurostat
Netherlands data for 2007are provisional

8/3/2019 Secondary Growth Poles in Europe
http://slidepdf.com/reader/full/secondary-growth-poles-in-europe 43/60
36
7.37 The regionalised states of Italy and Spain are distinctive for actually seeing real growth rates declining over
the period in both their capitals and some of their leading secondary cities (Figure 7.34). In Italy this
decline also occurred in nine of the country’s eleven leading secondary cities. The notable exception was
Salerno, which recorded a significant growth, albeit from a relatively small base . Three of Spain’s eight
leading secondaries also experienced a decline in productivity.
Figure 7.34: GDP per person employed – average annual % change, 2001-7 – South: Regionalised States of Italy
and Spain
-2.0
-1.5
-1.0
-0.5
0.0
0.5
1.0
1.5
2.0National City
Source: Eurostat
7.38 In Southern Europe, Thessalonica’s growth rate lagged well behind that of Athens while Porto’s almost
matched that of Lisbon (Figure 7.35).
Figure 7.35: GDP per person employed – average annual % change, 2001-7 – South: Unitary states of Cyprus,
Greece, Malta and Portugal
0.0
1.0
2.0
3.0
4.0
National City
Source: Eurostat
7.39 A more differentiated pattern emerges across the former socialist states of East, Central East and South
East Europe. In the East, none of the secondary city growth rates matched or exceeded those of their
respective capitals (Figure 7.36). In Central East, secondaries showed much stronger performances with
growth rates in Ostrava in the Czech Republic, Miskolc, Pecs and Szeged in Hungary and Maribor in Slovenia
all above those of their capital cities. Poland again stands out, with eight of its eleven secondary cities
growing at faster rates than Warsaw (Figure 7.37). In the South East this was also the case for Split in
Croatia and Constanta, Timisoara, Cluj-Napoca and Craiova in Romania (Figure 7.38). In these cities there
are some signs of catching up.

8/3/2019 Secondary Growth Poles in Europe
http://slidepdf.com/reader/full/secondary-growth-poles-in-europe 44/60
37
Figure 7.36: GDP per person employed – average annual % change, 2001-7 – East: Former socialist states of
Estonia, Latvia and Lithuania
0.0
2.0
4.0
6.0
8.0
10.0
National City
Source: Eurostat Figure 7.37: GDP per person employed – average annual % change, 2001-7 – Central East: Former socialist states
of Czech Republic, Hungary, Poland, Slovakia and Slovenia
0.0
1.0
2.0
3.0
4.0
5.0
6.0
7.0
National City
Source: Eurostat. * We are awaiting data for Slovakia
Figure 7.38: GDP per person employed – average annual % change, 2001-7 – South East: Former Socialist States of
Bulgaria, Croatia and Romania
0.0
5.0
10.0
15.0
20.0 National City
Source: Eurostat
* Bulgaria figures are for 2001-5 and 2006-7
Productivity – a European hierarchy?
7.40 Map 7.5 and Figures 7.39 to 7.45 show GDP per person employed in 2007 and provide the most recent
ranking of relative productivity across capital and leading secondary city metropolitan regions. Leading
secondary cities outperform capitals in six of the twenty-five countries for which we currently have data.The pattern is reversed in the remaining nineteen countries.

8/3/2019 Secondary Growth Poles in Europe
http://slidepdf.com/reader/full/secondary-growth-poles-in-europe 45/60
38
Map 7.5: Capital and secondary cities – GDP in PPS per person employed, 2007
7.41 We have grouped countries in six broad performance bands which show secondary city productivity levels
against capital city and national productivity level benchmarks – two where leading secondaries have levels
above their capitals and four where the reverse is the case . The grouping shows:
The distinctiveness of Germany’s metropolitan regions again stands out. Munich, although onlyranked sixth in metropolitan region population, is a clear leader in GDP per person employed, which
exceeds the corresponding figure for the capital Berlin by more than one half. Indeed, eleven of the
country’s metropolitan regions have higher levels of productivity than Berlin, underlining the latter’s
historically conditioned non-primate status. (Figure 7.39).
There is one more group of countries where secondary cities have productivity levels greater than
their capital city counterparts, albeit in this case, by only up to 10 percentage points more: Cork In
Ireland; Bilbao and Barcelona in Spain; Milan and Brescia in Italy; Randstad South and Heerlen in the
Netherlands; and Antwerp in Belgium. (Figure 7.40).
The remaining four bands rank countries by the degree to which the levels of productivity of leading
secondary cites lag behind their respective capitals – by between 10 and 15, 15 and 20, 20 and 30 and
35 and 55 percentage points. Austria, Denmark, the UK and Finland fall in the first of these along with
Croatia, the highest ranking of the former socialist states – with the strongest performing secondaries
being, respectively, Salzburg, Edinburgh, Split and Turku (Figure 7.41). France, Sweden and Poland
come next with secondary cities having productivity levels between 15 and 20 percentage points les

8/3/2019 Secondary Growth Poles in Europe
http://slidepdf.com/reader/full/secondary-growth-poles-in-europe 46/60
39
sthan their capitals and Lyon, Gothenburg and Poznan, respectively, having the highest levels (Figure
7.42). The productivity challenge facing secondary cities in the former socialist states is underlined by their
dominance of the last three bands in which leading secondary city productivity levels are more than 20
percentage points less than their capitals. (Figures 7.43 to 7.45). All but two of the eleven countries in
this grouping – the exceptions being Portugal and Greece – are former socialist states. The widest
gaps are to be found in Romania, Estonia and Latvia (Figure 7.44). Across all the different bandings there are secondaries with productivity levels above national, even in
some of those countries where secondary cities as a whole have levels markedly below those of their
capital cities. 15 of the 25 countries have at least one secondary with productivity levels above
national averages. The polycentric countries again stand out with Germany and Poland having five and
six secondary cities, respectively, having productivity levels above national. In the former socialist
states, Romania has two and Bulgaria, Hungary and Lithuania each have one.
Figure 7.39. Productivity in leading secondary exceeds capital by more than 50%; Germany
020,00040,00060,00080,000
100,000
GDP in PPS per person
employed 2007National City
Source: Eurostat
Figure 7.40: Productivity in leading secondary exceeds capital by up to 10%: Ireland, Spain, Italy, Netherlands, Belgium
0
20,000
40,000
60,000
80,000
100,000
120,000
D u b l i n
C o r k
M a d r i d
B i l b a o
B a r c e
l o n a
C o
r u n a
C
a d i z
V a l e n c i a
S e v i l l a
M a l a g a
M u r c i a
R
o m e
M
i l a n
B r e s c i a
G e n o a
B o l o g n a
T u r i n
F l o r e n c e
P a l e
r m o
S a l e r n o
C a t a n i a
N a p l e s
B a r i
R a n d s t a d N
o r t h
R a n d s t a d S
o u t h
H e e r l e n
E i n d h o v e n
A r n
h e m
E n s c h
e d e
B r u
s s e l s
A n t w e r p
G e n t
C h a r
l e r o i
L i e g e
GDP in PPS per person
employed 2007National City
Source: Eurostat
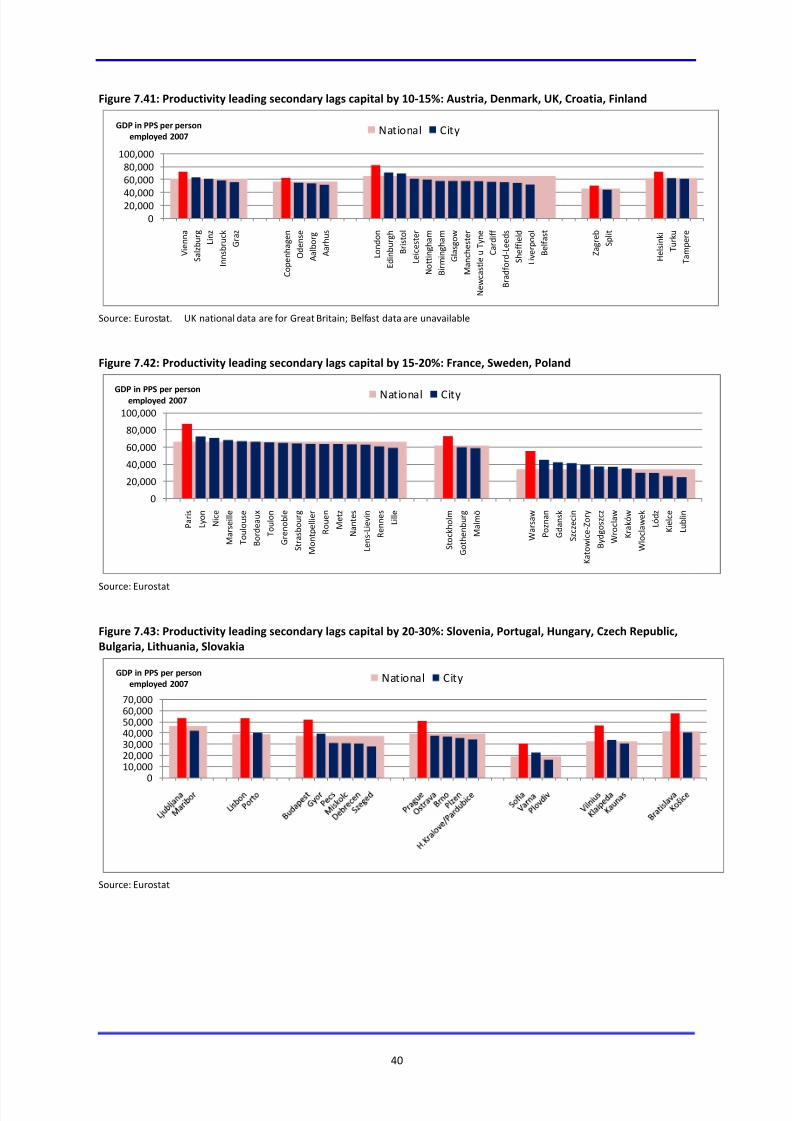
8/3/2019 Secondary Growth Poles in Europe
http://slidepdf.com/reader/full/secondary-growth-poles-in-europe 47/60
40
Figure 7.41: Productivity leading secondary lags capital by 10-15%: Austria, Denmark, UK, Croatia, Finland
0
20,00040,000
60,000
80,000
100,000
V i e n n a
S a l z b u r g
L i n z
I n n s b r u c k
G r a z
C o p e n h a g e n
O d e n s e
A a l b o r g
A a r h u s
L o n d o n
E d i n b u r g h
B r i s t o l
L e i c e s t e r
N o t t i n g h a m
B i r m i n g h a m
G l a s g o w
M a n c h e s t e r
N e w c a s t l e u T y n e
C a r d i f f
B r a d f o r d - L e e d s
S h e f f i e l d
L i v e r p o o l
B e l f a s t
Z a g r e b
S p l i t
H e l s i n k i
T u r k u
T a m p e r e
GDP in PPS per person
employed 2007National City
Source: Eurostat. UK national data are for Great Britain; Belfast data are unavailable
Figure 7.42: Productivity leading secondary lags capital by 15-20%: France, Sweden, Poland
0
20,000
40,000
60,000
80,000
100,000
P a r i s
L y o n
N i c e
M a r s e i l l e
T o u l o u s e
B o r d e a u x
T o u l o n
G r e n o b l e
S t r a s b o u r g
M o n t p e l l i e r
R o u e n
M e t z
N a n t e s
L e n s - L i e v i n
R e n n e s
L i l l e
S t o c k h o l m
G o t h e n b u r g
M a l m ö
W a r s a w
P o z n a n
G d a n s k
S z c z e c i n
K a t o w i c e - Z o r y
B y d g o s z c z
W r o c l a w
K r a k ó w
W l o c l a w e k
L ó d z
K i e l c e
L u b l i n
GDP in PPS per personemployed 2007 National City
Source: Eurostat Figure 7.43: Productivity leading secondary lags capital by 20-30%: Slovenia, Portugal, Hungary, Czech Republic,
Bulgaria, Lithuania, Slovakia
010,00020,00030,00040,00050,00060,00070,000
GDP in PPS per person
employed 2007National City
Source: Eurostat

8/3/2019 Secondary Growth Poles in Europe
http://slidepdf.com/reader/full/secondary-growth-poles-in-europe 48/60
41
Figure 7.44: Productivity leading secondary lags capital by 35-55%: Romania, Greece, Estonia, Latvia
010,00020,00030,00040,000
50,00060,00070,00080,000
GDP in PPS per person
employed 2007National City
Source: Eurostat Figure 7.45: Productivity – countries with no secondary cities or where city data are pending
0
20,000
40,000
60,000
80,000
100,000
120,000
GDP in PPS per person
employed 2007
National City
Source: Eurostat Next steps
7.42 Having assembled basic data on GDP, employment and population, we will systematically compare
whether individual cities are catching up, falling behind or keeping pace with their capitals. We will present
the data by capital and secondary city size, degree of decentralisation of governance in respective nation
states and the European region in which they are located to investigate the extent to which these two
factors account for variation. There is scope to disaggregate some of the data. For example, we intend to
present employment trend data information for the most dynamic sector available within Eurostat’s
classification system (financial intermediation; real estate and business activities) which captures many key
knowledge and business services industries. We will also locate the case study cities in such broader
analysis.
7.43 We will extend early correlation work which worked with our preliminary selection of 109 European citiesso as to include the full complement of 146 cities and incorporate additional core variables relating to the
different competitiveness indicators. Where possible, we will extend the analysis of leading non-capital
cities’ contribution to regional and national economic performance.
7.44 We will also explore whether other data sources might usefully extend our analysis such as international
city rankings data, updated Urban Audit data if these become available and other studies of regional and
urban competitiveness. It will also be important to locate the cities in terms of the settlement structure of
their respective nation states and also their proximity both spatially and in terms of travel times to the
capital and other key urban areas since ‘neighbourhood effects’ and degree of peripherality are also likely
to affect their performance.

8/3/2019 Secondary Growth Poles in Europe
http://slidepdf.com/reader/full/secondary-growth-poles-in-europe 49/60
42
8. REVIEW OF LITERATURE ON NATIONAL TERRITORIAL POLICIES
8.1 We are carrying out an extensive review of literature national urban policies as a context for the case study
analysis. We have so far explored the following themes:
Governance, Decentralisation: What Are the Patterns?
Governance, Decentralisation: What Policy Approaches?
Policies for Balanced Territorial Development: Spatial planning and polycentric development, Regional
Policy, Urban Policy
8.2 In addition to the overall literature review, we are undertaking more detailed reviews of approaches to
urban areas and secondary cities in the 9 countries in which we are conducting case studies. It is difficult to
capture briefly the key messages from that work. But we have found helpful a variety of work especially
that of the OECD which has tried to provide an overall assessment of the direction and priorities of policies.
The following tables based on OECD reviews supplemented by our own work provide a preliminary
synoptic overview of what has emerged. These are simple classifications but do point to some important
differences in approach between different types of states in the ESPON territory. We intend to test this
synoptic review in our more detailed work.
Policies for Balanced Territorial Development: National Regional Policy
8.3 The OECD has identified a paradigmatic shift in regional development policy in recent years because of
previous regional policy failures (Table 8.1). As a result a new paradigm of regional policy has emerged
aimed at helping all regions, whether wealthy or not, to maximise their own comparative advantages in a
positive sum game that contributes to national objectives. Regional policy had shifted from short-term
subsidies into a much broader family of long-term development policies designed to enhance regional
competitiveness. These can be characterised as follows:
a development strategy covering a wide range of direct and indirect factors affecting the performance
of local firms;
a greater focus on endogenous assets rather than exogenous investments and transfers;
an emphasis on opportunity rather than disadvantage;
a collective approach to governance involving national, regional and local government along with
other stakeholders, with the central government less dominant.
Table 8.1: Paradigm shift of regional development policyOld paradigm New paradigm
Problem recognition Regional disparities in income,
infrastructure stock and employment
Lack of regional competitiveness, underused regional potential
Objectives Equity through balanced regional
development
Competitiveness and equity
General policy framework Compensating temporally for location
disadvantages of lagging regions
(Reactive to problems)
Tapping underused regional potential through regional
programming
(Proactive for potential)
- theme coverage Sectoral approach with a limited set
of sectors
Integrated and comprehensive development polices with wider
policy are coverage
- spatial orientation Targeted at lagging regions All-region focus
- unit for policy intervention Administrative areas Functional areas
- time dimension Short term Long term
- approach One-size-fits-all approach Context-specific approach (place-based approach)
- focus Exogenous investments and transfers Endogenous local assets and knowledgeInstruments Subsidies and state aids (often to
individual firms)
Mixed investment for soft and hard capital (business
environment, labour market, infrastructure)
Actors Central government Different levels of government, various stakeholders (public,
private, NGOs)
Source: OECD (2010a)
8.4 It is also clear that such shifts in traditional regional policy have been reflected in policies for other spatial
levels in particular urban policy. In relation to changes in the spatial orientation of regional policy, Yuill et al
(2008) demonstrate how the growing stress on regional growth and competitiveness, on maximising
regional potential, and on programme-based policymaking has meant that, in most countries, significant
aspects of regional policy now have an all-region focus. Moreover, and of particular importance for our
study, in relation to specific spatial targeting, the growing focus on developing regional strengths and
promoting innovation has led to policy changes which promote urban areas and growth centres withexamples in:

8/3/2019 Secondary Growth Poles in Europe
http://slidepdf.com/reader/full/secondary-growth-poles-in-europe 50/60
43
Federal Austria and Germany
All the Nordic countries - Denmark, Finland, Norway and Sweden - with the last three also focusing on
urban areas as part of the increasing policy emphasis on developing viable territorial structures.
Regionalised Italy.
Of the Unitary States: France, Germany, Ireland, the Netherlands, Portugal and the United Kingdom of
the EU15. They also note how the strategic profile of urban areas has also been raised in Greece,
Ireland, the Netherlands, Portugal, and the United Kingdom as a result of growing links betweennational spatial development strategies and regional policies.
Poland and a number of the new Member States of the EU12 under the influence of EU Cohesion
policy, notably Bulgaria, Hungary and Latvia.
Policies for Balanced Territorial Development: National urban policies
8.5 In Table 8.2, based on OECD and a variety of others sources, we present an initial synoptic overview of
national urban policies across Europe. We intend to explore and refine this overview in our more detailed
later primary work.
Table 8.2: National urban policies in Europe - an initial overview Political
system/
country
Urban policy
Federal States
Austria No explicit urban policy at federal or regional (Land) level. The Lander are more driven by concern with the effects of subur banisation
and the ‘weak’ position of regional peripheries rather than ‘strong’ urban centres. Strong fiscal equalisation mechanisms mean that
there is a high degree of ‘home rule’ amongst municipalities and intense inter -municipal competition.
Belgium No specific urban policy until 1990s when t he salience of urban issues rose, reflecting the rise of right wing political parties at local level,
urban rioting and the growth and segregation of minority ethnic urban communities. A strongly federalised governmental system and
the differential economic experiences of Belgium’s three regions has produced a divergence of policy approaches with an initial focus
upon physical urban renewal in Wallonia, urban safety and poverty in Flanders and a mixture of the two in the Brussels region. The
policy focus in the latter two r egions has shifted recently towards an emphasis on quality of life issues (on one hand social control, on
the other the attraction of high income residents and high value firms).
Germany Urban policy developed in a context characterised by a highly federalised governmental structure, strong fiscal equalisation mechanisms,
a deep national commitment to the preservation of a balanced urban system, the need to manage the consequences of German re-
unification and, recently, relatively late (by European standards) processes of de-industrialisation. Urban policies as a result have focused
upon experimental ‘state-down’ and ‘bottom-up’ attempts to improve competitiveness and manage the physical and social
consequences of industrial decline and depopulation through the repositioning of cities and city-regions to attract public and private
funding within a set of well-established institutional relationships that are difficult to reform.
Switzerland
(Non-EU)
A new Article in the Constitution (2001) set the grounds for urban policy stating that "the government shall take into account the
particular situation of the cities and agglomerations" and since then policies have focused on improving urban centres and the
competitiveness of urban centres and agglomerations”. The new federal urban policy has introduced a new vertical dimension of
cooperation between cities, cantons and the Confederation. While cities have gained new influence in the process, the cantons remain
dominant. Nevertheless it is still a move towards multi-level governance and away from the previous hierarchical pattern of co-operative
federalism.
Unitary Regionalised States
Italy No formal urban policy until 1990s. Weakly developed since then as statutes for metropolitan reform remained unimplemented or
partially implemented. Lack of coordination between national, regional and local levels of government means that urban programmes
are piecemeal and dependent upon individual municipal efforts, hence dependent upon unevenly-developed institutional capacities.
Spain Little in the way of formal, national urban policy. Urban initiatives given momentum by EU programmes and, to varying degrees, the
devolution of powers and responsibilities to the regional scale. Complex division of responsibility between national, regional,
metropolitan and municipal levels has meant that recognition of urban potential and problems has been dependent upon the
development of joint programmes of activity between levels of government.
Unitary Northern Systems
Denmark A good example of the importance of implicit rather than explicit urban policies. The latter remain relatively weak, with limited su pport
from national government for programmes of urban renewal focused on tackling neighbourhood decline and social fragmentation. The
former, traditionally based upon redistribution and the development of local government’s role in the national welfare state, began to
shift in the 1990s with a series of initiatives (airport development, strategic use of state land assets, creation of bridge/tunnel link
between Copenhagen and Malmo in southern Sweden) that had the effect of strengthening the competitive position of the capital city-
region.
Finland Little in the way of specific, overt urban policy but urban areas have been seen as key to a strong technology-orientated spatial policy
that has been especially successful in the Helsinki city-region and is now being used to try and promote balanced spatial development
across the country as a whole. Relatively lightly funded. Fits into a system of inter-governmental relations in which there is strong local
authority ‘home rule’
Iceland
(EU Candidate
Country)
No explicit national urban policy although there is a policy for urban development in the capital, Reykjav ík, which dominates the urban
system.
Norway
(Non-EU)
Traditionally urban policy in Norway has focused on environmental problems, quality of life, urban density and urban centres. More
recently urban policy has shifted focus to city competiveness with a strong emphasis on innovation and cluster policies, strongly linked
to the country’s regional policy
Sectoral policies are important with many taking into account urban areas. Innovation policy is a feature of this, involving, for example,
support for science parks and research institutions; a cluster policy involving many of the country’s largest city-region; the location
outside Oslo of public policy institutions for funding and developing innovation activity to encourage growth outside the capital; and an
innovation programme f or the country’s six major cities.

8/3/2019 Secondary Growth Poles in Europe
http://slidepdf.com/reader/full/secondary-growth-poles-in-europe 51/60
44
Sweden First specific national urban policy introduced in 1998, focusing upon problems of social segregation in the country’s three main
metropolitan areas (around Stockholm, Gothenburg, Malmo). 1st phase focused upon housing. 2nd phase focusing upon localised
economic growth and development. Fits into a highly decentralised local government system and a lively, but as yet unresolved, debate
about the extent to which the capital city-region around Stockholm is being ‘drained’, through the operation of fiscal redistribution
mechanism, of resources that could be used to support its development.
Other Unitary States
EU15
France Focus of urban policy has been on institutional innovation and the creation of institutional capacity, in a highly fragmented local
government system, through (a) statutory encouragement of various forms of inter-municipal co-operation, (b) the provision of national
government incentives through central-local contracts, and (c) the development of additional mechanisms for citizen and stakeholder
engagement in local governance. Depending upon local conditions, the strengthening of governance is seen as a means to address issues
of urban unemployment, economic development and segregation. Urban policy innovation has occurred in parallel with a sustained
programme of governmental decentralisation and the progressive abandonment of regional policy initiatives that previously sou ght to
encourage greater economic balance between the capital city-region and provincial centres.
Greece Little in the way of explicit urban policy. Urban programmes dominated mainly by the need to deal with the consequences of poorly-
regulated patterns of market-driven urban development and the demands it generates, e.g. in terms of the provision of infrastructure.
The limited financial capacity of local authorities to support urban development programmes has been eased to some extent by EU
funding.
Ireland Weakly developed explicit urban policy, focusing mainly upon commercial and residential urban renewal. EU programmes have been
instrumental in supporting these efforts but their effects have been overshadowed by high rates of national economic growth, the
impetus this has given to rapid and lightly regulated suburbanisation and associated growth in housing costs, congestion a nd
segregation.
Luxembourg No explicit urban policy but, beginning with the new law on territorial planning in 1999, explicit policies and frameworks have been set
up to address the country’s territorial unba lances. Specifically in relation to urban areas, this approach has included efforts to improve
the performance of the country’s second tier cities in the south of the country and the collection of smaller and more rural towns
located in the north (the NORDSTAD).
Netherlands First formal urban policy developed in mid-1990s in response to de-industrialisation and economic crises/related social difficulties in the
major cities. Initial focus on the ‘gateway’ functions of Randstad cities, especially Amste rdam and Rotterdam. Subsequently extended
both geographically (to other urban centres in the Netherlands) and functionally (to social as well as economic/physical renewal).
Resulted in strengthening of ‘compact city’ strategies of major cities but dilution of spatial focus. Ambitious programme of metropolitan
governance reform failed but push for greater strategic, inter-governmental policy integration carried through. Subsequent national
economic recovery and renaissance of major urban centres, along wit h high profile breakdown of social harmony in Dutch cities resulted
in more recent urban policy focus on social order, integration of minority ethnic communities, education and citizenship
Portugal Urban programmes largely driven by EU funding and priorities. No explicit urban policy until late 1990s and the introduction of the
National Spatial Planning and Urbanism Act and the subsequent establishment of a Ministry of Cities, Territorial Planning and
Environment. Policies for cities nonetheless remain fragmented, horizontally (between different sectoral policy areas and municipal
jurisdictions) and vertically (between different levels of government).
United
Kingdom
Forty-year history of explicit urban policy, initially focused upon ‘filling holes in the welfare net’ but subsequently, from the late 1970s,
concerned primarily with the economic, social and environmental consequences of industrial restructuring. Mainly focused upon
‘problem’ areas within the larger conurbations. Constant changes in area -based initiatives and delivery arrangements; little continuity,
sustained investment. With recent urban renaissance, signs of a longer-term, less problem-focused approach in which inter-
governmental approaches to the development of city-regions may play a larger part.
Other Unitary States
EU 12 Bulgaria No explicit urban policy. Its nascent urban policy is heavily influenced by EU Cohesion Policy. The country’s Regional Development
Operational Programme emphasises the country’s major cities with investments aimed at supporting social infrastructure, local
economic development, infrastructure and transport. Sustainable and integrated urban development is one of five priority axe s in the
Operational Programme and a JESSICA Holding Fund has been established to assist in the rehabilitation of deprived areas in seven of the
country’s large cities.
Cyprus Urban policy is part of regional economic development policy and is based on indicative planning and legally defined in Local Plans and
Area Schemes. National urban policy relates to the Island Plan that has never been published following the political division of the
island in 1974, although the government currently hopes to implement it and introduce a new level of Regional Plans at the sa me time.
Key issues include; transportation, environmental sustainability, land management, affordable housing and quality of life.
Czech Republic No explicit urban policy with emphasis still on broader regional policy with focus on cohesion issues and infrastructure including the
development of new forms of social and health services. Urban policy, however, is evolving as part of national and EU-supported
regional and cohesion policies. There is an urban dimension in the current National Strategic Reference Framework, which emphasises
balanced territorial development and the strengthening of the role of cities as growth poles. All of the Regional Operational
Programmes include urban development through either a specific Urban Priority Axis or a mixed Axis that also includes regional and/or
rural development. Urban development in regional centres requires integrated urban development plans that address deprived zones
and/ or zones with high growth potential in cities.
Estonia Urban policy is heavily conditioned by EU Cohesion Policy funding. The ‘Development of Living Environment’ programme in the current2007-13 programming period includes a strategic priority for the ‘Integral and balanced development of regions’ with a sub– measure
focused on developing urban regions. This measure targets the five largest agglomerations of Tallinn, Tartu, Narva, Pärnu and the
Kohtla –Järve conurbation. Support covers the development of sustainable urban transport, public infrastructure related to child care
and social security provision, public urban space, recreation and green areas.
Hungary No explicit national urban policy with emphasis on broader regional policy. Policies for addressing social polarisation issues are
implemented at regional and micro-regional level rather than at urban level. EU Cohesion Policy, however, is encouraging an urban
dimension to regional policy alongside the National Development Concept, which identifies a growth pole strategy based around
Budapest at the centre and a group of large towns surrounding it. The production of a Manual on Urban Renewal, which promotes an
integrated approach to urban development, is seen as a breakthrough in urban planning policy. And the development of integrated
Urban Development Strategies is a policy requirement for cities to access funding under the Regional Operational Programmes.
Latvia Latvian urban policy has not been clearly defined and, in practice, has focused more on the structural development of the country’s
peripheral areas. EU Cohesion policy, however, currently provides an important context for developing urban policy. The National
Development Plan of Latvia for 2007-2013 aims for polycentric development through utilising the development potential of cities and
the formation of networks of cities. In the negotiations over the 2007-13 EU Cohesion policy, the Commission requested the inclusion
of an urban development priority in the country’s programmes. As a result, urban development was given an additional boost wi th the
creation of a specific urban priority axis in the programme ‘Infrastructure and Services’ that priority focuses on regional growth centres
outside the Riga region and also the most deprived areas of Riga city.

8/3/2019 Secondary Growth Poles in Europe
http://slidepdf.com/reader/full/secondary-growth-poles-in-europe 52/60
45
Lithuania Little in the way of explicit urban policy with emphasis on broader regional policy albeit with an orientation towards more equal
development of growth centres and avoiding overconcentration of investment in current growth centres. EU Cohesion Policy has
introduced a specific urban development field of action focusing on regenerating public spaces, housing, transport, social cohesion and
local community initiatives in urban areas.
Malta Urban policies are implemented at central and local government levels. There is no regional tier of government. Problems include
decaying urban fabric, transport and traffic problems. Social and environmental problems are less marked than in other European states.
Key policies relate to land use, conservation of the urban fabric and transport
Poland Urban policies receive relatively high priority in national spatial development strategies but an explicit metropolitan policy has not yet
been developed. A basic challenge for policy is urban and metropolitan governance and an overarching framework is needed for
harmonising the still fragmented policies for promoting competitiveness and social cohesion in cities. EU Cohesion Policy is encouraging
an urban dimension in regional policy with the National Strategic Reference Framework identifying the need for: building on t he
potential of the largest cities as drivers of regional development, strengthening the relationship between the metropolis and urbanised
and surrounding areas; and promoting the internal cohesion of urban areas and addressing the concentration of economic,
environmental and social problems in major urban centres.
Romania Emphasis in urban policy has been on developing integrated urban development approaches. Some of these have focused on
development of historic centres (such as in Baia Mare, Sibiu and Alba Iulia0 and others have focused on disadvantaged neighbourhoods
within cities. EU Cohesion Policy is supporting an urban dimension in regional policy with the current Regional Operational Programme
emphasising the achievement of a polycentric and more balanced urban structure, the concentration of investments in urban growth
poles and improving the accessibility of cities.
Slovakia Little in the way of explicit urban policy with emphasis on regional policy. EU Cohesion Policy is having an influence, however, and
funding, steered by the National Strategic Reference Framework and the Slovak Spatial Development Perspective, is being targeted
towards towns and municipalities seen as innovation and cohesion growth poles
Slovenia There is no single urban policy document but an approach to urban policy has been developed which attempts to combine an
overarching spatial planning framework in the shape of the country’s Spatial Development Strategy with urban development stra tegies
to promote, amongst other objectives, the polycentric development of cities and their integration into the European urban system; re-
urbanisation processes and the redevelopment of degraded urban areas. The focus in inner cities has been on transforming former
industrial and military areas for commercial development, shopping centres and private housing. Another issue has been constrainingthe development of satellite extensions to existing urban areas. A big issue is the strengthening of urban quality, which is seen as one of
the country’s main competitive assets. EU Cohesion Policy is providing some support for urban development through the current
‘Strengthening Regional Development Potentials’ Operational Programme.
Other Unitary
Croatia (EU Candidate
Country)
No explicit urban policy but concerns over the monocentric development around the capital, Zagreb, have seen polycentric development
polices focussing on decentralisation to strengthen the role of cities, especially the largest cities identified as potential growth centres.
Source: Based principally on OECD (2010a & b), CEMAT (2010), EUKN (2010), Yuill et al (2008 and 2010) and various EU and national policy
documents and academic books and journal articles.
Key messages
8.6 In Table 8.3 below we summarise the pattern of spatial policies that emerges from the literature reviewed -
ranging from spatial planning for polycentric development at national and regional levels, regional policy
with a marked urban dimension and strong urban policy. We would argue that policies for secondary citydevelopment will be stronger where all of these policies are present and are integrated. Only one country –
Federal Germany – appears to have the full hand of policies: national and regional spatial planning, albeit
with the former more informal than formal, regional policy with an urban dimension and strong urban
policy.
Table 8.3: Spatial policies – provisional summaryPolitical system/ country Spatial planning:
polycentric development
main aim
Regional policy with
urban dimension
Strong
Urban Policy
FEDERAL National Regional
Austria ● ●
Belgium ● ●
Germany ●
(Informal)
● ●
Switzerland (Non-EU) ● ●
REGIONALISED STATES
Italy ● ●
Spain ●
NORTHERN (NORDIC) SYSTEMS
Denmark ●
Finland ●
Iceland
Norway (Non-EU) ● ●
Sweden
UNITARY STATES (EU15)
France ● ● ●
Greece ●
Ireland ● ●
Luxembourg ●
Netherlands ● ● ● Portugal ● ●
United Kingdom (●) ● ●

8/3/2019 Secondary Growth Poles in Europe
http://slidepdf.com/reader/full/secondary-growth-poles-in-europe 53/60
46
UNITARY STATES (EU12)
Bulgaria ● ●
Cyprus
Czech Republic ●
Estonia ●
Hungary ● ●
Latvia ●
Lithuania ●
Malta
Poland ● ●
Romania ●
Slovakia
Slovenia ● ●
OTHER UNITARY STATES
Croatia (EU Candidate Country) ●
8.7 The initial broad pattern – which we intend to explore and test further - appears to be:
Federal States
Germany – all strands of spatial policy.
Belgium – regional spatial planning with an urban dimension alongside explicit urban policy but no
national spatial plan seeking a more balanced urban system.
Sweden – national spatial planning and urban policy.
Austria – regional spatial planning and regional policy with an urban dimension but no explicit urban
policy.
Regionalised States
Regionalised spatial planning in both Italy and Spain with regional policy with an urban dimension also
present in the later.
Nordic States
With the exception of Iceland and Sweden, all with national spatial planning frameworks but only
Norway with strong urban policy.
Unitary States (EU15)
France - all three policies but recent concerns that the national spatial planning framework is being
downgraded.
Netherlands – strong in all three policy strands but recent concerns over political shift of urban policy. Ireland and Portugal – national spatial planning and regional policy with an urban dimension but no
explicit urban policy.
United Kingdom – no national spatial planning and recent attempts at regional planning (in the shape
of Integrated Regional Strategies) now under threat given the abolition of Regional Development
Agencies; regional policy with urban dimension added to strong urban policy.
Greece and Luxembourg – national spatial planning but no regional or urban policy (reflecting
concentrated/monocentric settlement structure).
Cyprus and Malta – no spatial planning.
Unitary States (EU12) Former socialist states (inc. Croatia)
With exception of Romania and Slovenia, weakly developed urban policy. For Romania urban policy is
the main strand of spatial policy. Slovenia also has a national spatial planning framework.
Spatial planning at national level important in 7 countries (Bulgaria, Croatia, Czech Republic, Estonia,
Hungary, Lithuania and Poland).
Of these 7, national level spatial planning bolstered by regional policy with an urban dimension in
Bulgaria, Hungary and Poland – encouraged by EU Cohesion Policy funding.
Latvia – regional policy with an urban dimension again encouraged by EU Cohesion Policy funding.
Next steps
8.8 We will test this literature-based review against the forthcoming series of interviews with policy makers at
EU and national levels, the case studies and the findings of the questionnaire. We will investigate whether
the plans are more than simply visions and actually have impact, actual or potential, on secondary city
development. We will also examine how the different planning levels connect and explore actual and
potential governance arrangements for secondary city development.
8.9 We have focused so far on explicit urban policies but we also need to use the policymaker interviews and
workshops to explore implicit policies, national policies that are not urban in focus but that significantly
affect urban development and which have potentially significant effects on urban competitiveness. Key

8/3/2019 Secondary Growth Poles in Europe
http://slidepdf.com/reader/full/secondary-growth-poles-in-europe 54/60
47
policy areas for ‘secondary city-proofing’ in this stage of the research will be: competition; innovation;
education and skills, infrastructure including energy and transport and environment. The aim is not to
carry out detailed evaluations of all policies impacting on secondary city development across the 31 ESPON
countries. Rather the project will aim to analyse what policies are being attempted with what sorts of
effects in the different national case studies and draw out from this analysis the wider policy implications,
identifying whether there are policy levers that can be pulled and that make a difference. It is here where
we will seek to develop a framework for understanding the interplay between the implicit and explicitpolicies that underpin urban competitiveness – an interplay that we will aim to illustrate further in the
individual case study cities.
9. THE CASE STUDIES
The purpose
9.1 The city case studies have been chosen to illustrate the range of contexts, experiences, policies and
prospects of different secondary cities across the ESPON territory. Each is intended to provide answers and
to throw light in a different way on the wider questions underlying our study. Each case study city has its
special characteristics and policies which team members will identify in their reports. However, we do need
rigour, clarity and comparability on the hypotheses, research questions, content and coverage. This will
allow us to compare the results from the different case study content and to integrate these with the
results of the other strands of research.
9.2 The case studies provide the opportunity to explore in a detailed, coherent way the impact of wider factors
– political, economic, and institutional - upon the performance of a series of major cities and to assess their
current and potential role and contribution to territorial development at European, national, regional and
local level. Cities are the places where a wide range of external factors and policies collide and where they
have to be integrated and managed in a coherent way. In particular they are a test bed for the content,
clarity and coherence of national policies and a test bed of local capacity to shape and implement those
policies. The case studies will identify policy messages rather than simply describing the detailed history
of places. They will focus on understanding places and the dynamics, relationships and processes which
initiate and sustain their development at different territorial levels. The significance of the case study
‘stories’ and analysis will be less within the cities themselves and more on their role in and relationships
with their respective regional, national and European territorial systems.
Which places and why?
9.3 We have chosen the case studies to provide a good mix - size, economic performance, national
governance, territorial role, location
North Europe
• Tampere – Finland (Unitary Northern )
West Europe
• Cork – Ireland ( Unitary EU 15)
• Leeds – UK (Unitary EU 15 )
• Lyon – France ( Unitary EU 15)
Central Europe
• Munich- Germany. (Federal)
South Europe• Barcelona – Spain (Unitary Regionalised )
• Turin – Italy (Unitary Regionalised )
East, Central East and South Central Europe
• Katowice – Poland (Unitary EU 12)
• Timisoara – Romania (Unitary EU 12)
C ontribution to the project’s hypotheses
9.4 The case studies will be set within the conceptual framework for the wider study and will thus be used to
test the following hypotheses about performance, policies and territory:
Deconcentration matters.
National policies for secondary cites are crucial and should be aligned.
Places are path dependent but can exploit their assets to shape their trajectory.
The key drivers of success are innovation, human capital, connectivity, place quality. Territory matters and its governance should be at the widest achievable level.

8/3/2019 Secondary Growth Poles in Europe
http://slidepdf.com/reader/full/secondary-growth-poles-in-europe 55/60
48
Scope and content
9.5 The case studies will identify:
the city’s performance and contribution to regional, national and European economies;
the city’s performance on the key drivers of competitiveness - innovation, skills, connectivity, quality
of place and governance capacity;
its relationship with the capital city and other key parts of the urban system; the impact of explicit and implicit national, regional and local policies which most directly affect urban
competitiveness and performance;
the city’s future prospects; and
messages for local, regional, national and European partners on territorial balance.
The evidence base
9.6 Each case study will:
Review the academic and policy literature.
Collect secondary quantitative data on social, economic and environmental performance.
Analyse the economic development governance infrastructure.
Analyse key documents evaluating their relevant strategies and policies.
Undertake interviews with 15 representatives of elected officials, civil servants, researchers,
community groups, the private sector, key firms and representative bodies, the media.
Undertake interviews with national policy makers to underline the national as opposed to simply local
significance of the cities.
Good practice
9.7 The study is looking for particularly good examples of good practice. Interesting exemplary approaches to
maximising urban competitiveness in any of the key areas such as innovation, human capital, connectivity,
quality of place and governance and decision-making capacity, will be identified.
Report Outline
9.8 Each case study report will be supported by appendices containing data, sources and contacts. It will have
the following main sections:
1. What’s the story - setting the scene
How does the case study city relate to the key study hypotheses?
What is its significance in regional, national and international terms?
What are the key issues confronting the city?
2. How well is the city doing - recent and current performance
What has been the city’s development path and key events in its recent history?
How does it perform on the key drivers of competitiveness, cohesion and sustainability compared
with the capital and other secondary cities?
How well has the city competed in regional, national and international terms?
Does it have significant economic relationships nationally and elsewhere?
3. What have policies tried to do? Which policy areas are most critical to its performance and prospects, who is responsible for what?
How much fiscal and decision making autonomy and resources do the city and its key actors have?
Which key players affect the city’s level of economic, social and environmental performance?
How are city regional issues handled by different levels of government and partner organisations?
How well do public, private and voluntary sector bodies work together?
4. Which policies have worked – how and why?
Which European, national, regional and local policies impact most on the city’s performance?
What weight do they place upon competitiveness, cohesion and environmental sustainability?
How effectively have they been implemented and what impact have they had upon the city?
To what extent has policymaking been integrated horizontally and vertically?
How effective has territorial governance been in terms of city regional and cross border issues?
How effective has been joint working between public, private, community and voluntary sectors?
What explains the city’s economic, social and environmental performance relative to the capital and

8/3/2019 Secondary Growth Poles in Europe
http://slidepdf.com/reader/full/secondary-growth-poles-in-europe 56/60
49
how important have policies been?
Which policies have mattered most in terms of helping the city perform at different territorial levels,
act as a counterweight to the capital and helping to create a balanced urban system?
Who needs to do what better or differently and what division of roles, responsibilities, resources
and powers is needed to allow the city to perform to its full potential?
5. What are the city’s prospects? What are the city’s main strengths and weaknesses?
What are the main opportunities, risks and threats it faces?
What are the scenarios for its future role and importance within region, nation state and EU?
6. What are the key findings and policy messages for whom?
To what extent does the case study support our key hypotheses?
What contribution has the city made to competitiveness at different territorial levels?
Which factors have explained its level of performance and success?
Which national policies have mattered most?
What scope has the city had to engineer its own destiny and how successful has it been in this
respect?
How effectively has territorial governance at different spatial levels been handled?
Who needs to do what better or differently to maximise the case study city’s performance in future?
What are the implications for supporting secondary cities in terms of policies and resources at
different territorial levels?
Maps
9.9 In their response to the Inception Report, the Monitoring Committee and Sounding Board asked us to
indicate a preliminary list of maps that might be produced at case-study level. For each of the case studies
we would expect to produce maps positioning the case study cities in their regional, national and
international contexts. We also envisage mapping, at city and city-regional level, key indicators of
economic and social performance including unemployment, health, crime and general measures of
disadvantage. We will make use of existing maps that city municipalities have produced and, where
Geographical Information System (GIS) data are available, our own GIS-based maps. Progress so far
9.10 We have made very good progress with the case study work so far. There is considerable interest in the
project and there has been great willingness to support our work. We have undertaken fieldwork and
analysis in 6 of the cities – Tampere, Katowice, Cork, Munich, Turin, and Barcelona. We have collected
documents, conducted initial interviews with a number of representatives. We have prepared initial
reports on those case studies. We reviewed the initial findings at a project meeting recently. We have had
initial contact with Leeds, Lyon and Timisoara and will carry out fieldwork there in the coming months.
9.11 It is premature to report any major findings from the case studies. We are still collecting as well as
weighing the evidence. It is also clear that every city has a different narrative and tells us something
different about the themes we are exploring. However, it is clear that the hypotheses we are exploring are
regarded as relevant and important by those involved in managing cities. There is also a lot of positive
support for the policy implications of those hypotheses. For example, there is evidence that: secondarycities can make a contribution to a more balanced territorial development even though in many countries
they lag behind the capital. There are a variety of relationships across Europe with secondaries making a
bigger contribution outside the former socialist countries. National policies are important to the
development of - but are not always sufficiently supportive of - secondary cities or aligned properly.
European policies have played a major role in the development of many secondary cities especially in terms
of their governance and territorial strategies. The key drivers we identified are important factors in the
relative success of those cities. Although cities are path dependent local factors are crucial to their
trajectory – historically and in future. Aligning territory, governance and economy more effectively appears
to be crucial if secondary cities are to flourish and make a bigger contribution. But it is rarely achieved and
never simple.

8/3/2019 Secondary Growth Poles in Europe
http://slidepdf.com/reader/full/secondary-growth-poles-in-europe 57/60
50
10. QUESTIONNAIRE
10.1 We have devised the questionnaire below to get at key features of the policy making process in different ESPON
states. It tries to get at three related questions. How well are capital and secondaries performing in different
states? What impact have national and/or regional policies had upon the performance and prospects of
secondaries? What should happen differently in future if secondary cities are to improve their relative
performance?
10.2 We have targeted four groups so far:
all members of the Monitoring Committee;
all ESPON contact points;
a selection of senior policy makers in different states known to the team members; and
a selection of academics and researchers.
1: HOW ARE SECONDARY CITIES PERFORMING NATIONALLY AND IN EUROPE?
1. Which secondary cities do you think are performing well economically in your country? For example, how big a contribution are they making to
national performance – how and why? Do any play important roles in the European economy? How and why?
2.
How would you assess the current balance of economic, territorial and political power between the capital city and secondary cities? Does thecapital dominate or not? What impact does it have on the performance of the urban system and national economy?
3. How effective are secondary cities in promoting balanced territorial and economic development? How coherent and effective are governance
arrangements in secondary cities? How ambitious, strategic and effective is local leadership? Are there ways in which these could be improved?
For example what additional tools or levers of economic growth might be needed in secondary cities?
4. How effective are the working relationships between public, private and community and voluntary partners in secondary cities? Can you provide
an example of good practice? Are there ways in which these relationships could be improved?
5. How effectively do secondary cities work with their sub regional and regional government and partners? Are there examples of economic and
territorial cooperation or competition between them? Does national policy encourage territorial competition or collaboration between
secondary cities and how?
6. What impact has the current economic and financial crisis had upon the territorial and economic performance and prospects of secondary cities
and their relationship with the capital? Are there ways in which this impact might be reduced?
2: IMPACT OF NATIONAL AND REGIONAL POLICIES ON SECONDARY CITIES
7. How much importance does national and/or regional government attach to the contribution of secondary cities to economic and territorial
development? Is there an explicit policy to improve the performance of secondary cities and achieve a more balanced territorial system? Does
territorial development policy help secondary cities enough? Are there ways in which policy has either helped or hindered secondary cities’
contribution to national performance?
8. If there is an economic gap between the capital and secondary cities, what is national government doing to reduce that gap and rebalance
territorial relationships between capital and secondary cities? Is it doing enough?
9. Is the division of responsibilities, roles, resources and powers between national and regional government and secondary cities adequate to
encourage the development of secondary cities? For example, do secondary cities have enough financial and decision making powers? Could the
position be improved in any way?
10. What key factors characterise the relationship between national, regional and local governments? In particular, is national urban and territorial
policy driven by national goals and targets or is it more based on contractual relationships between national government and cities? How could
those relationships be improved?
11. If there is a national policy for cities, does it focus narrowly on urban and territorial policy initiatives or more widely on the full range of
mainstream public programmes which impact upon secondary cities? If there is a national policy, what are its key goals – economic
competitiveness, regeneration, social cohesion, environmental sustainability, governance capacity, more balanced territorial development?
12. Does national government have the right balance between those different goals? For example, should policy be more or less concerned with
economic competitiveness, social cohesion, environmental sustainability and their territorial impact?
13. How have national and regional government priorities for investment in key sectoral economic development policies affected secondary cities?
Do these sectoral policies have an explicit territorial dimension? Has investment in these sectors been distributed evenly across the country or
concentrated in the capital? What have been the results?
14. Is national government sufficiently well integrated and comprehensive in its policies towards secondary cities? Do different departments andbranches of government share the same policy goals and understanding of the urban agenda, or are there differences? What are the results?
How could the position be improved?
15. Are relationships between different levels of government – national, regional, local - sufficiently well integrated to encourage the development of
secondary cities? If not, how could they be improved?
16. What do you think has been your country’s’ most successful policy initiative to improve the performance of secondary cities? What were the key
reasons for its success and what can we learn from i t?
3: FUTURE PROSPECTS & POLICIES FOR SECONDARY CITIES
17. What actions or programmes could local leaders – public, private, and community – take to improve the contribution of secondary cities to
national and European performance? What changes - if any - would you like to see in national government strategies and policies for secondary
cities? Could you comment on the following potential changes - more powers and resources for secondary cities, greater investment in physical
or social infrastructure, education and training, greater focus on the territorial impact of national government policies and more balanced
territorial development, more consistency in national policy priorities for secondary cities, g reater integration of government policies which affect
cities, greater collaboration between national, regional and local governments?
18. What has been the impact of EU policies on secondary cities in your country? Have they helped or hindered their performance? What changes in
policy focus, implementation, or resources, if any, would you recommend?19. Does the Europe 2020 strategy focus enough upon improving the performance and prospects of secondary cities? If not, what els e might it do?

8/3/2019 Secondary Growth Poles in Europe
http://slidepdf.com/reader/full/secondary-growth-poles-in-europe 58/60
51
10.3 We have so far received 29 replies – only one response from the Monitoring Committee, 8 from the ESPON
contact points and the remaining 20 from researchers and national policy makers. There is a reasonable
geographical spread but a number of countries are still not represented. We are currently attempting to
increase the response rate with help from the ESPON CU. We do not regard the questionnaire response in
any sense as a representative sample. Rather we regard it as a valuable source of information from a rangeof experts which adds richness, complexity and detail to our review of national polices drawn from
academic and policy literature. We have not yet analysed the questionnaires in any great detail.
Nevertheless the weight of opinion so far expressed appears to be the following. Many do not think that
there is a sufficiently explicit or coherent policy for secondary cities in many member states. Many believe
that secondary cities could contribute more if they had more attention, support powers and resources from
national government. And there is a general wish for states to develop more coherent, explicit strategies
and increase the powers and resources of secondary cities in future.
11. NEXT STEPS
11.1 We believe this report demonstrates that the project remains on course for successful delivery. We have
encountered no major problems with access to material. We are essentially keeping to the timetable
outlined in the Inception Report with some minor revisions. The revised Timetable is shown in Figure 11.1.
Figure 11.1: Project Timetable
ID Task Name Q2 10 Q3 10 Q4 10 Q1 11 Q2 11 Q3 11 Q4 11 Q1 12 Q2 12 Q3 12 Q4 12
Apr May Jun Jul Aug Sep Oct Nov Dec Jan Feb Mar Apr May Jun Jul Aug Sep Oct Nov Dec Jan Feb Mar Apr May Jun Jul Aug Sep Oct Nov Dec
1
2
3
4
5
6
7
8
9
10
11
12
13
14
15
16
17
18
19
20
21
22
23
24
25
26
27
28
29
30
31
32
33
WP1: Coordination
WP2: Research activities
WP2A: Conceptual framework
Literature review
Expert assessments
Inception report
WP2B: Policy review
EU level:
Overarching strategic policydocuments
Review of operational programmes/
NSRFs across Member States
Interviews with policy makers
Stakeholder survey
Member state level:
Policy review
Expert assessments
WP2C: Developing a typology ofsecondary growth poles
Review of data and existing typologies
Data analysis
Stakeholder survey
Expert assessments
Interim report
WP2D: Regional case studies
Policy stakeholder interviews
Key company interviews
Primary and secondary data analysis
WP2E: Synthesis, analysis andrecommendations
Write up
Draft final report
Final report
WP3: Dissemination
Media & publications
European seminars & workshops
Transnational networking activities

8/3/2019 Secondary Growth Poles in Europe
http://slidepdf.com/reader/full/secondary-growth-poles-in-europe 59/60
52
11.2 Our targets are now until end September 2011:
continue with the literature review;
complete the case studies fieldwork and reports;
undertake analysis of the existing primary data we have collected on secondary and capital cities;
undertake a review of secondary literature on the role of secondary cities in Europe including
consultancies, think tanks, commercial organisations as well as academic on the role of secondaries;
relaunch a shortened version of the questionnaire to go to individual cities with the support of EUROCITIES and Core Cities and analyse results; and
conduct our interviews with policy makers in Brussels during the autumn.
11.3 We propose the following meetings and products to deliver these targets:
Team meeting in Budapest in June 2011 at ESPON seminar.
Team meeting to discuss initial draft of draft report to MC October 2011.
Draft final report to MC by end of February 2012.
11.4 We intend to provide an accessible short final report with key analysis of and policy messages about the
role of secondary cities and their contribution to balanced territorial development regionally, nationally
and in Europe. We will place in Annexes other material like the literature review, the case study reports,
the full data analysis, and the results of the questionnaires. Essentially we are on target to deliver a report
which could have the following sections:1. What policy questions are we trying to answer - why and how?
2. What does the existing literature tell us about the performance, policies and prospects of secondary
cities and their contribution to territorial performance across Europe?
3. How have secondary cities in general performed across Europe?
4. How have individual cities across Europe performed, why and what policy messages?
5. What kinds of policies have national, European and city governments adopted for secondary cities,
what are the key policy messages and what is good practice?
6. What are the prospects for secondary cities in Europe?
7. What works and what are the key policy messages about secondary cities and territorial economic
performance and balance for decision-makers at city-regional, regional, national and European levels?

8/3/2019 Secondary Growth Poles in Europe
http://slidepdf.com/reader/full/secondary-growth-poles-in-europe 60/60
The ESPON 2013 Programme is part-financedby the European Regional Development Fund,the EU Member States and the Partner StatesIceland, Liechtenstein, Norway and Switzerland.It shall support policy development in relation tothe aim of territorial cohesion and a harmoniousdevelopment of the European territory.