
SECOND QUARTER REP ORT TO SHAREH OLDER S
51
2022 QUARTER REPORT TO SHAREHOLDERS Group SECOND Q2
Transcript of SECOND QUARTER REP ORT TO SHAREH OLDER S

2022 QUARTER
REPORT TOSHAREHOLDERS
Just Energy GroupGroup
SECOND
Q2
Management’s discussion and analysis –November 9, 2021
The following management’s discussion and analysis (“MD&A”) is a review of the financial condition and operating results of JustEnergy Group Inc. (“Just Energy” or the “Company”) for the three and six months ended September 30, 2021. This MD&A has beenprepared with all information available up to and including November 9, 2021. This MD&A should be read in conjunction withJust Energy’s unaudited Interim Condensed Consolidated Financial Statements (the “Interim Condensed Consolidated FinancialStatements”) for the three and six months ended September 30, 2021. The financial information contained herein has been preparedin accordance with International Financial Reporting Standards (“IFRS”), as issued by the International Accounting Standards Board(“IASB”). All dollar amounts are expressed in Canadian dollars unless otherwise noted. Quarterly reports, the annual report andsupplementary information can be found on Just Energy’s corporate website at www.investors.justenergy.com. Additionalinformation can be found on SEDAR at www.sedar.com or on the U.S. Securities and Exchange Commission’s (“SEC”) website atwww.sec.gov.
WEATHER EVENT AND CREDITOR PROTECTION FILINGSIn February 2021, the State of Texas experienced extremely cold weather (the “Weather Event”). The Weather Event led to increasedelectricity demand and sustained high prices from February 13, 2021 through February 20, 2021. As a result of the losses sustainedand without sufficient liquidity to pay the corresponding invoices from the Electric Reliability Council of Texas, Inc. (“ERCOT”)when due, and accordingly, on March 9, 2021, Just Energy applied for and received creditor protection under the Companies’Creditors Arrangement Act (Canada) (“CCAA”) from the Ontario Superior Court of Justice (Commercial List) (the “Ontario Court”)and under Chapter 15 (“Chapter 15”) in the United States from the Bankruptcy Court of the Southern District of Texas, HoustonDivision (the “Court Orders” or “CCAA Proceedings”). Protection under the Court Orders allows Just Energy to operate while itrestructures its capital structure.
As part of the CCAA filing, the Company entered into a USD $125 million Debtor-In-Possession (“DIP Facility”) financing with certainaffiliates of Pacific Investment Management Company (“PIMCO”). The Company entered into Qualifying Support Agreements withits largest commodity supplier and ISO services provider. The Company entered into a Lender Support Agreement with the lendersunder its Credit Facility (for details refer to note 8(c) in the Interim Condensed Consolidated Financial Statements). The filings andassociated USD $125 million DIP Facility arranged by the Company, enabled Just Energy to continue all operations withoutinterruption throughout the U.S. and Canada and to continue making payments required by ERCOT and satisfy other regulatoryobligations.
On September 15, 2021, the stay period under the CCAA Proceedings was extended by the Ontario Court to December 17, 2021.
On November 1, 2021, Generac Holdings Inc. (“Generac”) announced the signing of an agreement to acquire all of the issued andoutstanding shares of ecobee Inc. (“ecobee”), including all of the ecobee shares held by the Company. The Company holdsapproximately 8% of the ecobee and at closing anticipates receiving approximately $61 million, comprised of approximately$18 million cash and $43 million of Generac stock. The Company can receive up to an additional approximate CAD $10 million inGenerac stock over calendar 2022 and 2023, provided that certain performance targets are achieved by ecobee. Generac stocktrades on the New York Stock Exchange under the symbol GNRC. The Company has designated these investments at fair valuethrough profit and loss under the IFRS 9, “Financial Instruments” (“IFRS 9”). As a result of the above-mentioned transaction, a fairvalue gain of $29 million has been recorded in the Interim Condensed Consolidated Statement of Income in the three months endedSeptember 30, 2021.
On November 3, 2021, the Company filed an application with the Ontario Court seeking an extension of the maturity date of theDIP Facility until September 30, 2022. The Company also requested that the stay period under the CCAA Proceedings be extendedto February 17, 2022. The Ontario Court scheduled a hearing on November 10, 2021 to consider these matters.
As at September 30, 2021, in connection with the CCAA Proceedings, the Company identified $1,032.4 million of liabilities subjectto compromise (see Note 1 in the Interim Condensed Consolidated Financial Statements). The Company also recorded ReorganizationCosts (defined below in Key Terms) of $38.6 million in the six months ended September 30, 2021 (see Note 13 in the InterimCondensed Consolidated Financial Statements).
On September 15, 2021, the Ontario Court approved the Company’s request to establish a claims process to identify and determineclaims against the Company and its subsidiaries that are subject to the ongoing CCAA Proceedings. As a result of the establishmentof the claims process, additional claims may be made against the Company and ultimately determined that are not currentlyreflected in the Interim Condensed Financial Statements.
The Common Shares, no par value, of the Company (the “Common Shares”) are listed on the TSX Venture Exchange under thesymbol “JE” and on the OTC Pink Market under the symbol “JENGQ”.
2022 SECOND QUARTER REPORT TO SHAREHOLDERS | JUST ENERGY 1

SECURITIZATION UNDER HOUSE BILL 4492On June 16, 2021, Texas House Bill 4492 (“HB 4492”) became law in Texas. HB 4492 provides a mechanism for recovery of (i) ancillaryservice charges above USD $9,000/MWh during the Weather Event; (ii) reliability deployment price adders charged by ERCOTduring the Weather Event; and (iii) amounts owed to ERCOT due to defaults of competitive market participants, which weresubsequently “short-paid” to market participants, including Just Energy, (collectively, the “Costs”), incurred by various parties,including the Company, during the Weather Event, through certain securitization structures.
On July 16, 2021, ERCOT filed the request with the Public Utility Commission of Texas (the “Commission”) and on October 13,2021, the Commission issued its final order (the “PUCT Order”). The ultimate amount of proceeds that Just Energy will receive hasnot been fully determined, as entities eligible to opt-out have until November 29, 2021 to decide pursuant to the PUCT Order.However, Just Energy anticipates that it will recover at least USD $100 million of Costs with such proceeds expected to be receivedin the fourth quarter of fiscal year 2022. The total amount that the Company may recover through the PUCT Order may changematerially based on a number of factors, including the entities that decide to opt-out, the outcome of the dispute resolutionprocess initiated by the Company with ERCOT, and any potential challenges to the PUCT Order. There is no assurance that theCompany will be able to recover all of the Costs.
Forward-looking informationThis MD&A may contain forward-looking statements, including, without limitation, statements with respect to the Company’sstrategic investment in digital marketing, rebound of face-to-face retail channels following the impacts of the COVID-19 pandemic,navigating a challenging margin environment and working closely with the Company's stakeholders towards a successful restructuringplan. These statements are based on current expectations that involve several risks and uncertainties which could cause actualresults to differ from those anticipated. These risks include, but are not limited to, risks with respect to the ability of the Company tocontinue as a going concern; the final amount received by the Company with respect to the implementation of Texas HouseBill 4492 to recover certain costs incurred during the Weather Event; the outcome of any invoice dispute with the Electric ReliabilityCouncil of Texas in connection with the Weather Event; the outcome of any potential litigation with respect to the Weather Event; theoutcome of the Company’s proceedings under the CCAA and similar legislation in the United States; the quantum of the financialloss to the Company from the Weather Event and its impact on the Company’s liquidity; the Company’s restructuring discussions withkey stakeholders regarding the CCAA Proceedings and the outcome thereof; the impact of the evolving COVID-19 pandemic onthe Company’s business, operations and sales; reliance on suppliers; uncertainties relating to the ultimate spread, severity andduration of COVID-19 and related adverse effects on the economies and financial markets of countries in which the Company operates;the ability of the Company to successfully implement its business continuity plans with respect to the COVID-19 pandemic; theCompany’s ability to access sufficient capital to provide liquidity to manage its cash flow requirements; general economic, businessand market conditions; the ability of management to execute its business plan; levels of customer natural gas and electricityconsumption; extreme weather conditions; rates of customer additions and renewals; customer credit risk; rates of customer attrition;fluctuations in natural gas and electricity prices; interest and exchange rates; actions taken by governmental authorities includingenergy marketing regulation; increases in taxes and changes in government regulations and incentive programs; changes in regulatoryregimes; results of litigation and decisions by regulatory authorities; competition; and dependence on certain suppliers. Additionalinformation on these and other factors that could affect Just Energy’s operations or financial results are included in Just Energy’sannual information form and other reports on file with Canadian securities regulatory authorities which can be accessed through theSEDAR website at www.sedar.com on the U.S. Securities and Exchange Commission’s website at www.sec.gov or through JustEnergy’s website at www.investors.justenergy.com.
Company overviewJust Energy is a retail energy provider specializing in electricity and natural gas commodities, energy efficient solutions, carbonoffsets and renewable energy options to customers. Operating in the United States (“U.S.”) and Canada, Just Energy serves bothresidential and commercial customers, providing homes and businesses with a broad range of energy solutions that deliver comfort,convenience and control. Just Energy is the parent company of Amigo Energy, Filter Group Inc. (“Filter Group”), Hudson Energy,Interactive Energy Group, Tara Energy and Terrapass.
MANAGEMENT’S DISCUSSION AND ANALYSIS
2 JUST ENERGY | 2022 SECOND QUARTER REPORT TO SHAREHOLDERS
Continuing operations overviewMASS MARKETS SEGMENTThe Mass Markets segment (formerly referred to as “Consumer Segment”) includes customers acquired and served under the JustEnergy, Tara Energy, Amigo Energy and Terrapass brands. Marketing of the energy products of this segment is primarily done throughdigital and retail sales channels. Mass Market customers make up 74% of Just Energy’s Base Gross Margin (defined below in non-IFRS financial measures), which is currently focused on price-protected and flat-bill product offerings, as well as JustGreen products.To the extent that certain markets are better served by shorter-term or enhanced variable rate products, the Mass Markets segment’ssales channels offer these products.
Just Energy also provides home water filtration systems with its line of consumer product and service offerings through FilterGroup.
COMMERCIAL SEGMENTThe Commercial segment includes customers acquired and served under Hudson Energy, as well as brokerage services managedby Interactive Energy Group. Hudson Energy sales are made through three main channels: brokers, door-to-door commercialindependent contractors and inside commercial sales representatives. Commercial customers make up 26% of Just Energy’s BaseGross Margin. Products offered to Commercial customers range from standard fixed-price offerings to “one off” offerings, tailored tomeet the customer’s specific needs. These products can be fixed or floating rate or a blend of the two, and normally have a term ofless than five years. Gross margin per RCE for this segment is lower than it is for the Mass Markets segment, but customer acquisitioncosts and ongoing customer care costs per RCE are lower as well. Commercial customers also have significantly lower attritionrates than Mass Markets customers.
ABOUT JUST ENERGY’S PRODUCTSJust Energy offers products and services to address customers’ essential needs, including electricity and natural gas commodities,energy efficient solutions, carbon offsets and renewable energy options as well as water quality and filtration devices to customers.
ElectricityJust Energy services various states and territories in U.S. and Canada with electricity. A variety of electricity solutions are offered,including fixed-price, flat-bill and variable-price products on both short-term and longer-term contracts. Most of these productsprovide customers with price-protection programs for the majority of their electricity requirements. Just Energy uses historical usagedata for enrolled customers to predict future customer consumption and to help with long-term supply procurement decisions. Flat-bill products offer customers the ability to pay a fixed amount per period regardless of usage.
Just Energy purchases electricity supply from market counterparties for Mass Markets and Commercial customers based onforecasted customer aggregation. Electricity supply is generally purchased concurrently with the execution of a contract for largerCommercial customers. Historical customer usage is obtained from LDCs (as defined in key terms), which, when normalized toaverage weather, provides Just Energy with expected normal customer consumption. Just Energy mitigates exposure to weathervariations through active management of the electricity portfolio and the purchase of options, including weather derivatives. JustEnergy’s ability to successfully mitigate weather effects is limited by the degree to which weather conditions deviate from normal. Tothe extent that balancing electricity purchases are outside the acceptable forecast, Just Energy bears the financial responsibility forexcess or short supply caused by fluctuations in customer usage. Any supply balancing not fully covered through customer pass-throughs, active management or the options employed may increase or decrease Just Energy’s Base Gross Margin (as definedbelow) depending upon market conditions at the time of balancing.
Natural gasJust Energy offers natural gas customers a variety of products ranging from five-year fixed-price contracts to month-to-monthvariable-price contracts. Gas supply is purchased from market counterparties based on forecasted consumption. For largerCommercial customers, gas supply is generally purchased concurrently with the execution of a contract. Variable rate products allowcustomers to maintain flexibility while retaining the ability to lock into a fixed price at their discretion. Flat-bill products offercustomers the ability to pay a fixed amount per period regardless of usage or changes in the price of the commodity.
The LDCs provide historical customer usage which, when normalized to average weather, enables Just Energy to purchase theexpected normal customer consumption. Just Energy mitigates exposure to weather variations through active management of thegas portfolio, which involves, but is not limited to, the purchase of options, including weather derivatives. Just Energy’s ability tosuccessfully mitigate weather effects is limited by the degree to which weather conditions deviate from normal. To the extent thatbalancing requirements are outside the forecasted purchase, Just Energy bears the financial responsibility for fluctuations in customerusage. To the extent that supply balancing is not fully covered through active management or the options employed, Just Energy’sBase Gross Margin may increase or decrease depending upon market conditions at the time of balancing.
MANAGEMENT’S DISCUSSION AND ANALYSIS
2022 SECOND QUARTER REPORT TO SHAREHOLDERS | JUST ENERGY 3
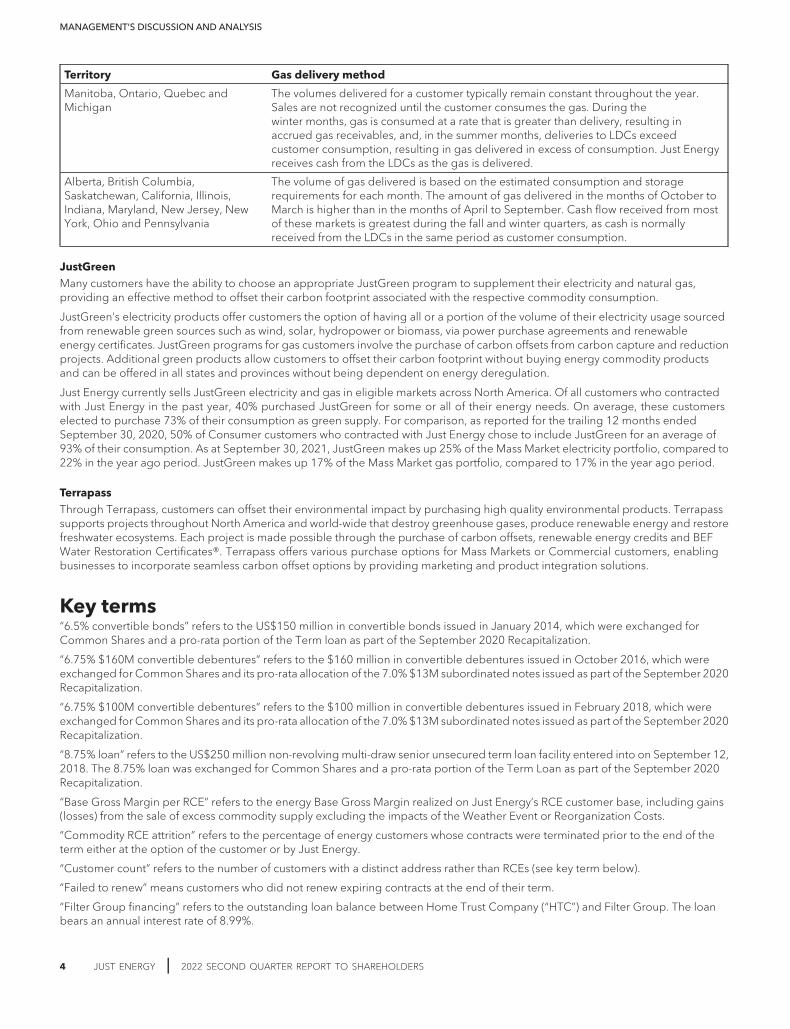
Territory Gas delivery method
Manitoba, Ontario, Quebec andMichigan
The volumes delivered for a customer typically remain constant throughout the year.Sales are not recognized until the customer consumes the gas. During thewinter months, gas is consumed at a rate that is greater than delivery, resulting inaccrued gas receivables, and, in the summer months, deliveries to LDCs exceedcustomer consumption, resulting in gas delivered in excess of consumption. Just Energyreceives cash from the LDCs as the gas is delivered.
Alberta, British Columbia,Saskatchewan, California, Illinois,Indiana, Maryland, New Jersey, NewYork, Ohio and Pennsylvania
The volume of gas delivered is based on the estimated consumption and storagerequirements for each month. The amount of gas delivered in the months of October toMarch is higher than in the months of April to September. Cash flow received from mostof these markets is greatest during the fall and winter quarters, as cash is normallyreceived from the LDCs in the same period as customer consumption.
JustGreenMany customers have the ability to choose an appropriate JustGreen program to supplement their electricity and natural gas,providing an effective method to offset their carbon footprint associated with the respective commodity consumption.
JustGreen’s electricity products offer customers the option of having all or a portion of the volume of their electricity usage sourcedfrom renewable green sources such as wind, solar, hydropower or biomass, via power purchase agreements and renewableenergy certificates. JustGreen programs for gas customers involve the purchase of carbon offsets from carbon capture and reductionprojects. Additional green products allow customers to offset their carbon footprint without buying energy commodity productsand can be offered in all states and provinces without being dependent on energy deregulation.
Just Energy currently sells JustGreen electricity and gas in eligible markets across North America. Of all customers who contractedwith Just Energy in the past year, 40% purchased JustGreen for some or all of their energy needs. On average, these customerselected to purchase 73% of their consumption as green supply. For comparison, as reported for the trailing 12 months endedSeptember 30, 2020, 50% of Consumer customers who contracted with Just Energy chose to include JustGreen for an average of93% of their consumption. As at September 30, 2021, JustGreen makes up 25% of the Mass Market electricity portfolio, compared to22% in the year ago period. JustGreen makes up 17% of the Mass Market gas portfolio, compared to 17% in the year ago period.
TerrapassThrough Terrapass, customers can offset their environmental impact by purchasing high quality environmental products. Terrapasssupports projects throughout North America and world-wide that destroy greenhouse gases, produce renewable energy and restorefreshwater ecosystems. Each project is made possible through the purchase of carbon offsets, renewable energy credits and BEFWater Restoration Certificates®. Terrapass offers various purchase options for Mass Markets or Commercial customers, enablingbusinesses to incorporate seamless carbon offset options by providing marketing and product integration solutions.
Key terms“6.5% convertible bonds” refers to the US$150 million in convertible bonds issued in January 2014, which were exchanged forCommon Shares and a pro-rata portion of the Term loan as part of the September 2020 Recapitalization.
“6.75% $160M convertible debentures” refers to the $160 million in convertible debentures issued in October 2016, which wereexchanged for Common Shares and its pro-rata allocation of the 7.0% $13M subordinated notes issued as part of the September 2020Recapitalization.
“6.75% $100M convertible debentures” refers to the $100 million in convertible debentures issued in February 2018, which wereexchanged for Common Shares and its pro-rata allocation of the 7.0% $13M subordinated notes issued as part of the September 2020Recapitalization.
“8.75% loan” refers to the US$250 million non-revolving multi-draw senior unsecured term loan facility entered into on September 12,2018. The 8.75% loan was exchanged for Common Shares and a pro-rata portion of the Term Loan as part of the September 2020Recapitalization.
“Base Gross Margin per RCE” refers to the energy Base Gross Margin realized on Just Energy’s RCE customer base, including gains(losses) from the sale of excess commodity supply excluding the impacts of the Weather Event or Reorganization Costs.
“Commodity RCE attrition” refers to the percentage of energy customers whose contracts were terminated prior to the end of theterm either at the option of the customer or by Just Energy.
“Customer count” refers to the number of customers with a distinct address rather than RCEs (see key term below).
“Failed to renew” means customers who did not renew expiring contracts at the end of their term.
“Filter Group financing” refers to the outstanding loan balance between Home Trust Company (“HTC”) and Filter Group. The loanbears an annual interest rate of 8.99%.
MANAGEMENT’S DISCUSSION AND ANALYSIS
4 JUST ENERGY | 2022 SECOND QUARTER REPORT TO SHAREHOLDERS

“LDC” means a local distribution company; the natural gas or electricity distributor for a regulatory or governmentally definedgeographic area.
“Liquidity” means cash on hand.
“Maintenance capital expenditures” means the necessary property and equipment and intangible asset capital expendituresrequired to maintain existing operations at functional levels.
“Note Indenture” refers to the $15 million subordinated notes with a six-year maturity and bearing an annual interest rate of 7.0%(payable in kind semi-annually) issued in relation to the September 2020 Recapitalization, which have a maturity date of September 15,2026. The principal amount was reduced through a tender offer for no consideration, on October 19, 2020 to $13.2 million.
“RCE” means residential customer equivalent, which is a unit of measurement equivalent to a customer using 2,815 m3 (or 106 GJsor 1,000 Therms or 1,025 CCFs) of natural gas on an annual basis or 10 MWh (or 10,000 kWh) of electricity on an annual basis, whichrepresents the approximate amount of gas and electricity, respectively, used by a typical household in Ontario, Canada.
“Reorganization Costs” — means the amounts incurred related to the filings under the CCAA Proceedings. These costs includeprofessional and advisory costs, key employee retention plan, contract terminations and prepetition claims, and other costs.
“Selling commission expenses” means customer acquisition costs amortized under IFRS 15, Revenue from contracts with customers,or directly expensed within the current period and consist of commissions paid to independent sales contractors, brokers andsales agents and is reflected on the Interim Condensed Consolidated Statements of Income as part of selling and marketingexpenses.
“Selling non-commission and marketing expenses” means the cost of selling overhead, including digital marketing cost not directlyassociated with the costs of direct customer acquisition costs within the current period and is reflected on the Interim CondensedConsolidated Statements of Income as part of selling and marketing expenses.
“September 2020 Recapitalization” refers to the recapitalization transaction that the Company completed in September 2020.
“Strategic Review” means the Company’s formal review announced on June 6, 2019 to evaluate strategic alternatives available tothe Company. The Company finalized the Strategic Review with the completed September 2020 Recapitalization.
“Term Loan” refers to the US$206 million senior unsecured 10.25% term loan facility entered into on September 28, 2020 pursuantto the September 2020 Recapitalization, which has a maturity date of March 31, 2024.
Non-IFRS financial measuresJust Energy’s Interim Condensed Consolidated Financial Statements are prepared in accordance with IFRS. The financial measuresthat are defined below do not have a standardized meaning prescribed by IFRS and may not be comparable to similar measurespresented by other companies. These financial measures should not be considered as an alternative to, or more meaningful than,net income (loss), cash flow from operating activities and other measures of financial performance as determined in accordance withIFRS; however, the Company believes that these measures are useful in providing relative operational profitability of the Company’sbusiness.
BASE GROSS MARGIN“Base Gross Margin” represents gross margin adjusted to exclude the effect of applying IFRS Interpretation Committee AgendaDecision 11, Physical Settlement of Contracts to Buy or Sell a Non-Financial Item, for realized gains (losses) on derivative instruments,the one-time impact of the Weather Event, and the one-time non-recurring sales tax settlement. Base Gross Margin is a key measureused by management to assess performance and allocate resources. Management believes that these realized gains (losses) onderivative instruments reflect the long-term financial performance of Just Energy and thus have included them in the Base GrossMargin calculation.
EBITDA“EBITDA” refers to earnings before finance costs, income taxes, depreciation and amortization with an adjustment for discontinuedoperations. EBITDA is a non-IFRS measure that reflects the operational profitability of the business.
BASE EBITDA“Base EBITDA” refers to EBITDA adjusted to exclude the impact of unrealized mark to market gains (losses) arising from IFRSrequirements for derivative financial instruments, Reorganization Costs, share-based compensation, impairment of inventory,Strategic Review costs, Restructuring costs, unrealized gain on investment, realized gains (losses) related to gas held in storage untilgas is sold, and non-controlling interest. This measure reflects operational profitability as the impact of the non-cash gains (losses),impairment of inventory and Reorganization Costs are one-time non-recurring events. Non-cash share-based compensation expenseis treated as an equity issuance for the purposes of this calculation as it will be settled in Common Shares; the unrealized mark tomarket gains (losses) are associated with supply already sold in the future at fixed prices; and, the unrealized mark to market gains(losses) of weather derivatives are not related to weather in the current period.
MANAGEMENT’S DISCUSSION AND ANALYSIS
2022 SECOND QUARTER REPORT TO SHAREHOLDERS | JUST ENERGY 5
Just Energy ensures that customer margins are protected by entering into fixed-price supply contracts. Under IFRS, the customercontracts are not marked to market; however, there is a requirement to mark to market the future supply contracts. This createsunrealized and realized gains (losses) depending upon current supply pricing. Management believes that the unrealized mark tomarket gains (losses) do not impact the long-term financial performance of Just Energy and has excluded them from the BaseEBITDA calculation.
Just Energy uses derivative financial instruments to hedge the gas held in storage for future delivery to customers. Under IFRS, thecustomer contracts are not marked to market: however, there is a requirement to report the realized gains (losses) in the currentperiod instead of recognizing them as a cost of inventory until delivery to the customer. Just Energy excludes the realized gains(losses) to EBITDA during the injection season and includes them during the withdrawal season in accordance with the customersreceiving the gas. Management believes that including the realized gains (losses) during the withdrawal season when the customersreceive the gas is more reflective of the operations of the business.
Just Energy recognizes the incremental acquisition costs of obtaining a customer contract as an asset since these costs would nothave been incurred if the contract was not obtained and are recovered through the consideration collected from the contract.Commissions and incentives paid for commodity contracts and value-added products contracts are capitalized and amortized overthe term of the contract. Amortization of these costs with respect to customer contracts is included in the calculation of BaseEBITDA (as selling commission expenses). Amortization of incremental acquisition costs on value-added product contracts isexcluded from the Base EBITDA calculation as value-added products are considered to be a lease asset akin to a fixed asset wherebyamortization or depreciation expenses are excluded from Base EBITDA.
FREE CASH FLOW AND UNLEVERED FREE CASH FLOWFree cash flow represents cash flow from operations less Maintenance capital expenditures. Unlevered free cash flow representsfree cash flows plus finance costs excluding the non-cash portion.
EMBEDDED GROSS MARGIN (“EGM”)EGM is a rolling five-year measure of management’s estimate of future contracted energy and product gross margin. The commodityEGM is the difference between existing energy customer contract prices and the cost of supply for the remainder of the term, withappropriate assumptions for commodity RCE attrition and renewals. The product gross margin is the difference between existing value-added product customer contract prices and the cost of goods sold on a five-year undiscounted basis for such customer contracts,with appropriate assumptions for value-added product attrition and renewals. It is assumed that expiring contracts will be renewed attarget margin renewal rates.
EGM indicates the gross margin expected to be realized over the next five years from existing customers. It is intended only as adirectional measure for future gross margin. It is neither discounted to present value nor is it intended to consider administrative andother costs necessary to realize this margin.
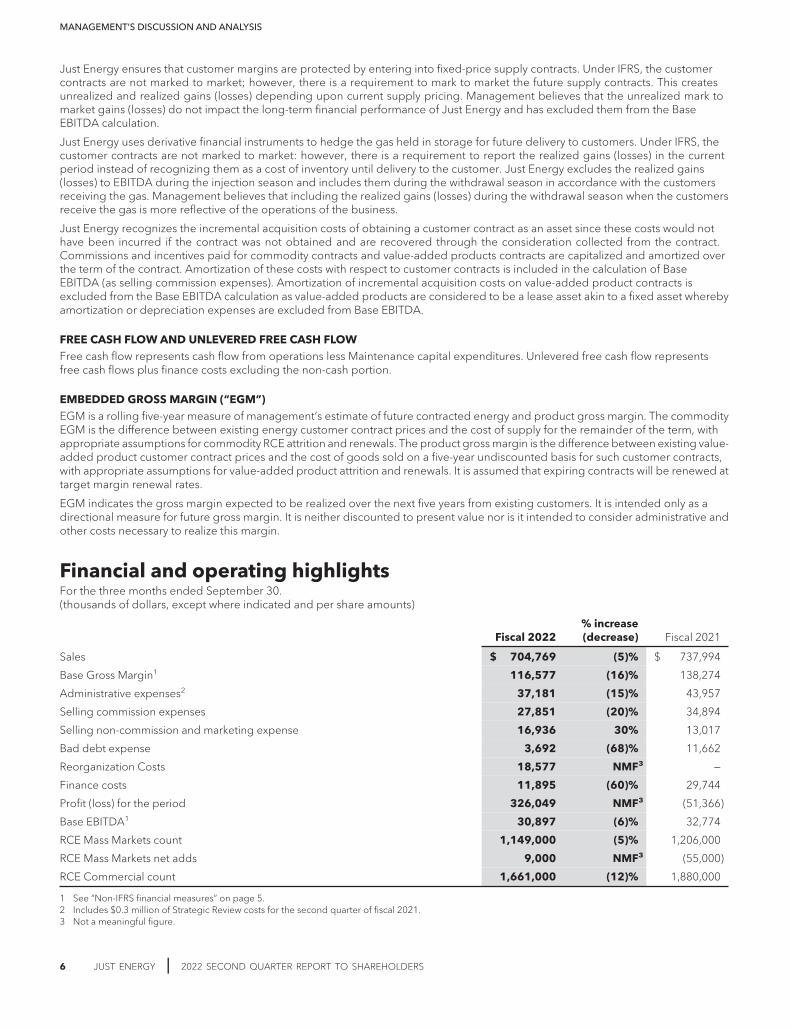
Financial and operating highlightsFor the three months ended September 30.(thousands of dollars, except where indicated and per share amounts)
Fiscal 2022% increase(decrease) Fiscal 2021
Sales $ 704,769 (5)% $ 737,994
Base Gross Margin1 116,577 (16)% 138,274
Administrative expenses2 37,181 (15)% 43,957
Selling commission expenses 27,851 (20)% 34,894
Selling non-commission and marketing expense 16,936 30% 13,017
Bad debt expense 3,692 (68)% 11,662
Reorganization Costs 18,577 NMF3 —
Finance costs 11,895 (60)% 29,744
Profit (loss) for the period 326,049 NMF3 (51,366)
Base EBITDA1 30,897 (6)% 32,774
RCE Mass Markets count 1,149,000 (5)% 1,206,000
RCE Mass Markets net adds 9,000 NMF3 (55,000)
RCE Commercial count 1,661,000 (12)% 1,880,000
1 See “Non-IFRS financial measures” on page 5.2 Includes $0.3 million of Strategic Review costs for the second quarter of fiscal 2021.3 Not a meaningful figure.
MANAGEMENT’S DISCUSSION AND ANALYSIS
6 JUST ENERGY | 2022 SECOND QUARTER REPORT TO SHAREHOLDERS
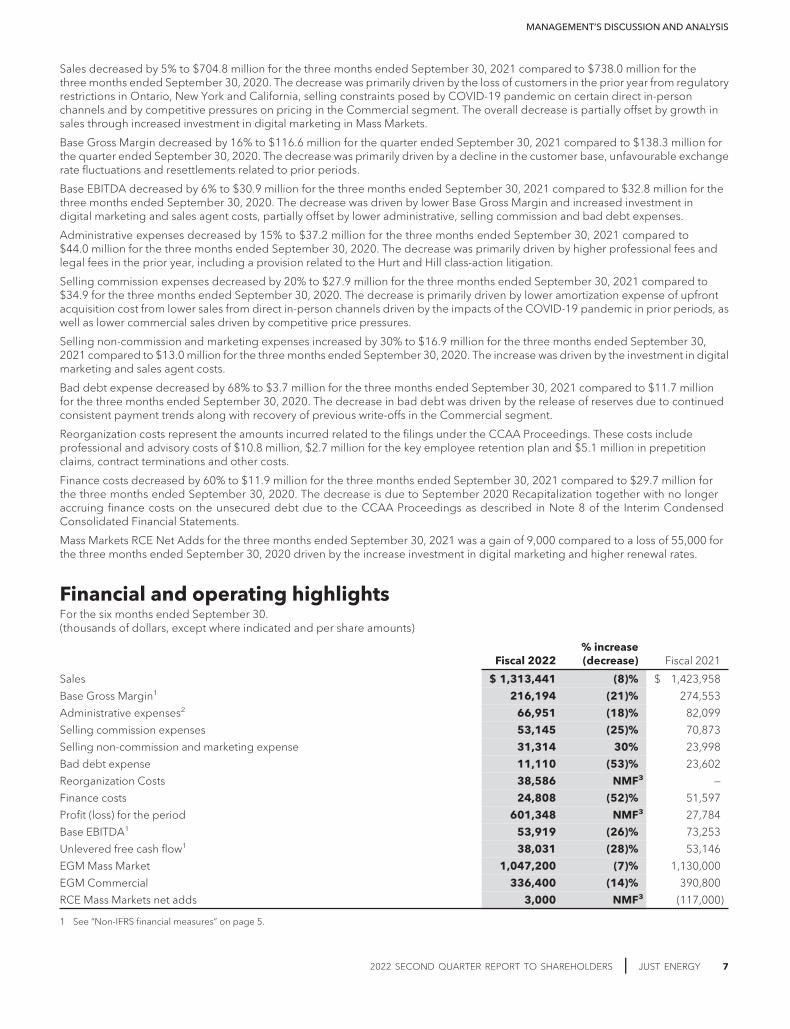
Sales decreased by 5% to $704.8 million for the three months ended September 30, 2021 compared to $738.0 million for thethree months ended September 30, 2020. The decrease was primarily driven by the loss of customers in the prior year from regulatoryrestrictions in Ontario, New York and California, selling constraints posed by COVID-19 pandemic on certain direct in-personchannels and by competitive pressures on pricing in the Commercial segment. The overall decrease is partially offset by growth insales through increased investment in digital marketing in Mass Markets.
Base Gross Margin decreased by 16% to $116.6 million for the quarter ended September 30, 2021 compared to $138.3 million forthe quarter ended September 30, 2020. The decrease was primarily driven by a decline in the customer base, unfavourable exchangerate fluctuations and resettlements related to prior periods.
Base EBITDA decreased by 6% to $30.9 million for the three months ended September 30, 2021 compared to $32.8 million for thethree months ended September 30, 2020. The decrease was driven by lower Base Gross Margin and increased investment indigital marketing and sales agent costs, partially offset by lower administrative, selling commission and bad debt expenses.
Administrative expenses decreased by 15% to $37.2 million for the three months ended September 30, 2021 compared to$44.0 million for the three months ended September 30, 2020. The decrease was primarily driven by higher professional fees andlegal fees in the prior year, including a provision related to the Hurt and Hill class-action litigation.
Selling commission expenses decreased by 20% to $27.9 million for the three months ended September 30, 2021 compared to$34.9 for the three months ended September 30, 2020. The decrease is primarily driven by lower amortization expense of upfrontacquisition cost from lower sales from direct in-person channels driven by the impacts of the COVID-19 pandemic in prior periods, aswell as lower commercial sales driven by competitive price pressures.
Selling non-commission and marketing expenses increased by 30% to $16.9 million for the three months ended September 30,2021 compared to $13.0 million for the three months ended September 30, 2020. The increase was driven by the investment in digitalmarketing and sales agent costs.
Bad debt expense decreased by 68% to $3.7 million for the three months ended September 30, 2021 compared to $11.7 millionfor the three months ended September 30, 2020. The decrease in bad debt was driven by the release of reserves due to continuedconsistent payment trends along with recovery of previous write-offs in the Commercial segment.
Reorganization costs represent the amounts incurred related to the filings under the CCAA Proceedings. These costs includeprofessional and advisory costs of $10.8 million, $2.7 million for the key employee retention plan and $5.1 million in prepetitionclaims, contract terminations and other costs.
Finance costs decreased by 60% to $11.9 million for the three months ended September 30, 2021 compared to $29.7 million forthe three months ended September 30, 2020. The decrease is due to September 2020 Recapitalization together with no longeraccruing finance costs on the unsecured debt due to the CCAA Proceedings as described in Note 8 of the Interim CondensedConsolidated Financial Statements.
Mass Markets RCE Net Adds for the three months ended September 30, 2021 was a gain of 9,000 compared to a loss of 55,000 forthe three months ended September 30, 2020 driven by the increase investment in digital marketing and higher renewal rates.
Financial and operating highlightsFor the six months ended September 30.(thousands of dollars, except where indicated and per share amounts)
Fiscal 2022% increase(decrease) Fiscal 2021
Sales $ 1,313,441 (8)% $ 1,423,958
Base Gross Margin1 216,194 (21)% 274,553
Administrative expenses2 66,951 (18)% 82,099
Selling commission expenses 53,145 (25)% 70,873
Selling non-commission and marketing expense 31,314 30% 23,998
Bad debt expense 11,110 (53)% 23,602
Reorganization Costs 38,586 NMF3 —
Finance costs 24,808 (52)% 51,597
Profit (loss) for the period 601,348 NMF3 27,784
Base EBITDA1 53,919 (26)% 73,253
Unlevered free cash flow1 38,031 (28)% 53,146
EGM Mass Market 1,047,200 (7)% 1,130,000
EGM Commercial 336,400 (14)% 390,800
RCE Mass Markets net adds 3,000 NMF3 (117,000)
1 See “Non-IFRS financial measures” on page 5.
MANAGEMENT’S DISCUSSION AND ANALYSIS
2022 SECOND QUARTER REPORT TO SHAREHOLDERS | JUST ENERGY 7
2 Includes $2.1 million of Strategic Review costs for the second quarter of fiscal 2021.3 Not a meaningful figure.
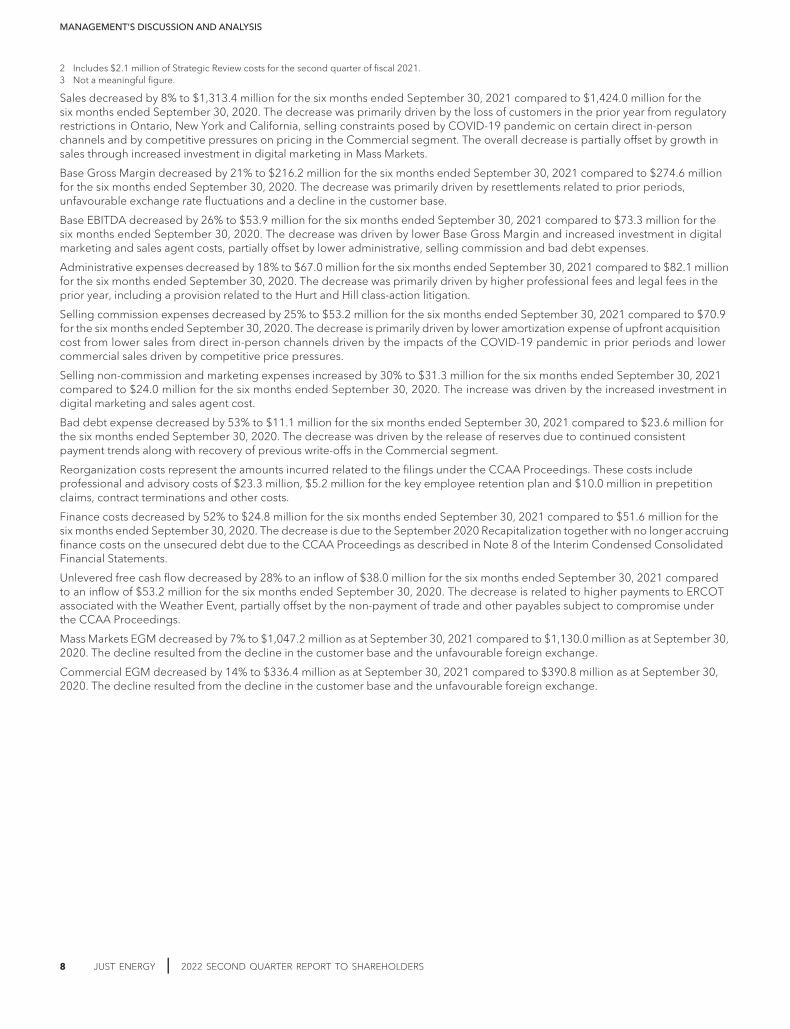
Sales decreased by 8% to $1,313.4 million for the six months ended September 30, 2021 compared to $1,424.0 million for thesix months ended September 30, 2020. The decrease was primarily driven by the loss of customers in the prior year from regulatoryrestrictions in Ontario, New York and California, selling constraints posed by COVID-19 pandemic on certain direct in-personchannels and by competitive pressures on pricing in the Commercial segment. The overall decrease is partially offset by growth insales through increased investment in digital marketing in Mass Markets.
Base Gross Margin decreased by 21% to $216.2 million for the six months ended September 30, 2021 compared to $274.6 millionfor the six months ended September 30, 2020. The decrease was primarily driven by resettlements related to prior periods,unfavourable exchange rate fluctuations and a decline in the customer base.
Base EBITDA decreased by 26% to $53.9 million for the six months ended September 30, 2021 compared to $73.3 million for thesix months ended September 30, 2020. The decrease was driven by lower Base Gross Margin and increased investment in digitalmarketing and sales agent costs, partially offset by lower administrative, selling commission and bad debt expenses.
Administrative expenses decreased by 18% to $67.0 million for the six months ended September 30, 2021 compared to $82.1 millionfor the six months ended September 30, 2020. The decrease was primarily driven by higher professional fees and legal fees in theprior year, including a provision related to the Hurt and Hill class-action litigation.
Selling commission expenses decreased by 25% to $53.2 million for the six months ended September 30, 2021 compared to $70.9for the six months ended September 30, 2020. The decrease is primarily driven by lower amortization expense of upfront acquisitioncost from lower sales from direct in-person channels driven by the impacts of the COVID-19 pandemic in prior periods and lowercommercial sales driven by competitive price pressures.
Selling non-commission and marketing expenses increased by 30% to $31.3 million for the six months ended September 30, 2021compared to $24.0 million for the six months ended September 30, 2020. The increase was driven by the increased investment indigital marketing and sales agent cost.
Bad debt expense decreased by 53% to $11.1 million for the six months ended September 30, 2021 compared to $23.6 million forthe six months ended September 30, 2020. The decrease was driven by the release of reserves due to continued consistentpayment trends along with recovery of previous write-offs in the Commercial segment.
Reorganization costs represent the amounts incurred related to the filings under the CCAA Proceedings. These costs includeprofessional and advisory costs of $23.3 million, $5.2 million for the key employee retention plan and $10.0 million in prepetitionclaims, contract terminations and other costs.
Finance costs decreased by 52% to $24.8 million for the six months ended September 30, 2021 compared to $51.6 million for thesix months ended September 30, 2020. The decrease is due to the September 2020 Recapitalization together with no longer accruingfinance costs on the unsecured debt due to the CCAA Proceedings as described in Note 8 of the Interim Condensed ConsolidatedFinancial Statements.
Unlevered free cash flow decreased by 28% to an inflow of $38.0 million for the six months ended September 30, 2021 comparedto an inflow of $53.2 million for the six months ended September 30, 2020. The decrease is related to higher payments to ERCOTassociated with the Weather Event, partially offset by the non-payment of trade and other payables subject to compromise underthe CCAA Proceedings.
Mass Markets EGM decreased by 7% to $1,047.2 million as at September 30, 2021 compared to $1,130.0 million as at September 30,2020. The decline resulted from the decline in the customer base and the unfavourable foreign exchange.
Commercial EGM decreased by 14% to $336.4 million as at September 30, 2021 compared to $390.8 million as at September 30,2020. The decline resulted from the decline in the customer base and the unfavourable foreign exchange.
MANAGEMENT’S DISCUSSION AND ANALYSIS
8 JUST ENERGY | 2022 SECOND QUARTER REPORT TO SHAREHOLDERS
Base Gross Margin1
For the Three months ended September 30.(thousands of dollars)
Fiscal 2022 Fiscal 2021
Mass Market Commercial Total Mass Market Commercial Total
Gas $ 6,394 $ 652 $ 7,046 $ 14,839 $ 4,042 $ 18,881
Electricity 80,217 29,314 109,531 89,607 29,786 119,393
$ 86,611 $ 29,966 $ 116,577 $ 104,446 $ 33,828 $ 138,274
Decrease (17)% (11)% (16)%
For the six months ended September 30.(thousands of dollars)
Fiscal 2022 Fiscal 2021
Mass Market Commercial Total Mass Market Commercial Total
Gas $ 20,649 $ 2,470 $ 23,119 $ 42,656 $ 10,471 $ 53,127
Electricity 140,937 52,138 193,075 172,816 48,610 221,426
$ 161,586 $ 54,608 $ 216,194 $ 215,472 $ 59,081 $ 274,553
Decrease (25)% (8)% (21)%
1 See “Non-IFRS financial measures” on page 5.
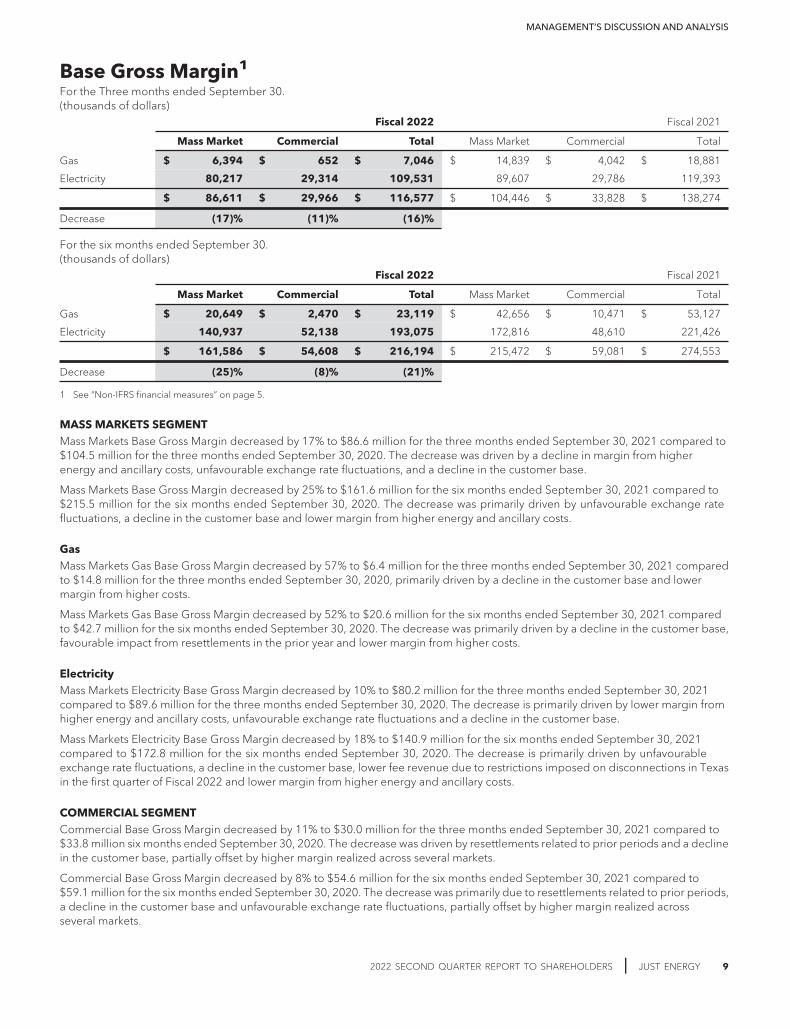
MASS MARKETS SEGMENTMass Markets Base Gross Margin decreased by 17% to $86.6 million for the three months ended September 30, 2021 compared to$104.5 million for the three months ended September 30, 2020. The decrease was driven by a decline in margin from higherenergy and ancillary costs, unfavourable exchange rate fluctuations, and a decline in the customer base.
Mass Markets Base Gross Margin decreased by 25% to $161.6 million for the six months ended September 30, 2021 compared to$215.5 million for the six months ended September 30, 2020. The decrease was primarily driven by unfavourable exchange ratefluctuations, a decline in the customer base and lower margin from higher energy and ancillary costs.
GasMass Markets Gas Base Gross Margin decreased by 57% to $6.4 million for the three months ended September 30, 2021 comparedto $14.8 million for the three months ended September 30, 2020, primarily driven by a decline in the customer base and lowermargin from higher costs.
Mass Markets Gas Base Gross Margin decreased by 52% to $20.6 million for the six months ended September 30, 2021 comparedto $42.7 million for the six months ended September 30, 2020. The decrease was primarily driven by a decline in the customer base,favourable impact from resettlements in the prior year and lower margin from higher costs.
ElectricityMass Markets Electricity Base Gross Margin decreased by 10% to $80.2 million for the three months ended September 30, 2021compared to $89.6 million for the three months ended September 30, 2020. The decrease is primarily driven by lower margin fromhigher energy and ancillary costs, unfavourable exchange rate fluctuations and a decline in the customer base.
Mass Markets Electricity Base Gross Margin decreased by 18% to $140.9 million for the six months ended September 30, 2021compared to $172.8 million for the six months ended September 30, 2020. The decrease is primarily driven by unfavourableexchange rate fluctuations, a decline in the customer base, lower fee revenue due to restrictions imposed on disconnections in Texasin the first quarter of Fiscal 2022 and lower margin from higher energy and ancillary costs.
COMMERCIAL SEGMENTCommercial Base Gross Margin decreased by 11% to $30.0 million for the three months ended September 30, 2021 compared to$33.8 million six months ended September 30, 2020. The decrease was driven by resettlements related to prior periods and a declinein the customer base, partially offset by higher margin realized across several markets.
Commercial Base Gross Margin decreased by 8% to $54.6 million for the six months ended September 30, 2021 compared to$59.1 million for the six months ended September 30, 2020. The decrease was primarily due to resettlements related to prior periods,a decline in the customer base and unfavourable exchange rate fluctuations, partially offset by higher margin realized acrossseveral markets.
MANAGEMENT’S DISCUSSION AND ANALYSIS
2022 SECOND QUARTER REPORT TO SHAREHOLDERS | JUST ENERGY 9
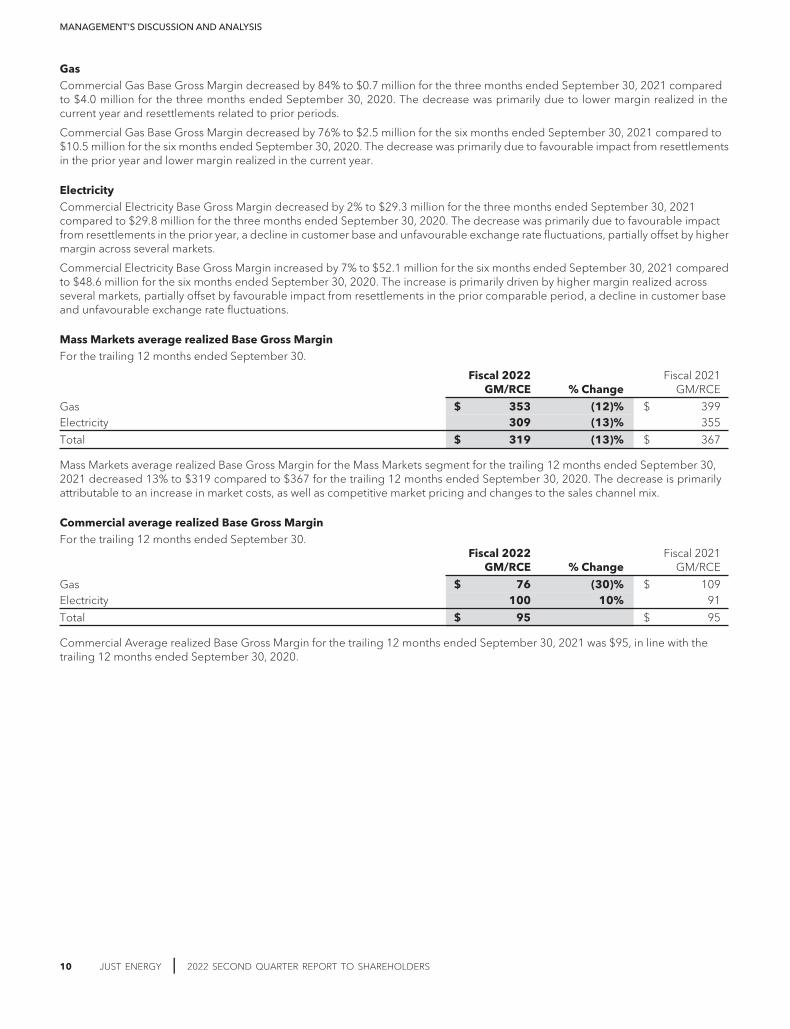
GasCommercial Gas Base Gross Margin decreased by 84% to $0.7 million for the three months ended September 30, 2021 comparedto $4.0 million for the three months ended September 30, 2020. The decrease was primarily due to lower margin realized in thecurrent year and resettlements related to prior periods.
Commercial Gas Base Gross Margin decreased by 76% to $2.5 million for the six months ended September 30, 2021 compared to$10.5 million for the six months ended September 30, 2020. The decrease was primarily due to favourable impact from resettlementsin the prior year and lower margin realized in the current year.
ElectricityCommercial Electricity Base Gross Margin decreased by 2% to $29.3 million for the three months ended September 30, 2021compared to $29.8 million for the three months ended September 30, 2020. The decrease was primarily due to favourable impactfrom resettlements in the prior year, a decline in customer base and unfavourable exchange rate fluctuations, partially offset by highermargin across several markets.
Commercial Electricity Base Gross Margin increased by 7% to $52.1 million for the six months ended September 30, 2021 comparedto $48.6 million for the six months ended September 30, 2020. The increase is primarily driven by higher margin realized acrossseveral markets, partially offset by favourable impact from resettlements in the prior comparable period, a decline in customer baseand unfavourable exchange rate fluctuations.
Mass Markets average realized Base Gross MarginFor the trailing 12 months ended September 30.
Fiscal 2022GM/RCE % Change
Fiscal 2021GM/RCE
Gas $ 353 (12)% $ 399Electricity 309 (13)% 355
Total $ 319 (13)% $ 367
Mass Markets average realized Base Gross Margin for the Mass Markets segment for the trailing 12 months ended September 30,2021 decreased 13% to $319 compared to $367 for the trailing 12 months ended September 30, 2020. The decrease is primarilyattributable to an increase in market costs, as well as competitive market pricing and changes to the sales channel mix.
Commercial average realized Base Gross MarginFor the trailing 12 months ended September 30.
Fiscal 2022GM/RCE % Change
Fiscal 2021GM/RCE
Gas $ 76 (30)% $ 109Electricity 100 10% 91
Total $ 95 $ 95
Commercial Average realized Base Gross Margin for the trailing 12 months ended September 30, 2021 was $95, in line with thetrailing 12 months ended September 30, 2020.
MANAGEMENT’S DISCUSSION AND ANALYSIS
10 JUST ENERGY | 2022 SECOND QUARTER REPORT TO SHAREHOLDERS
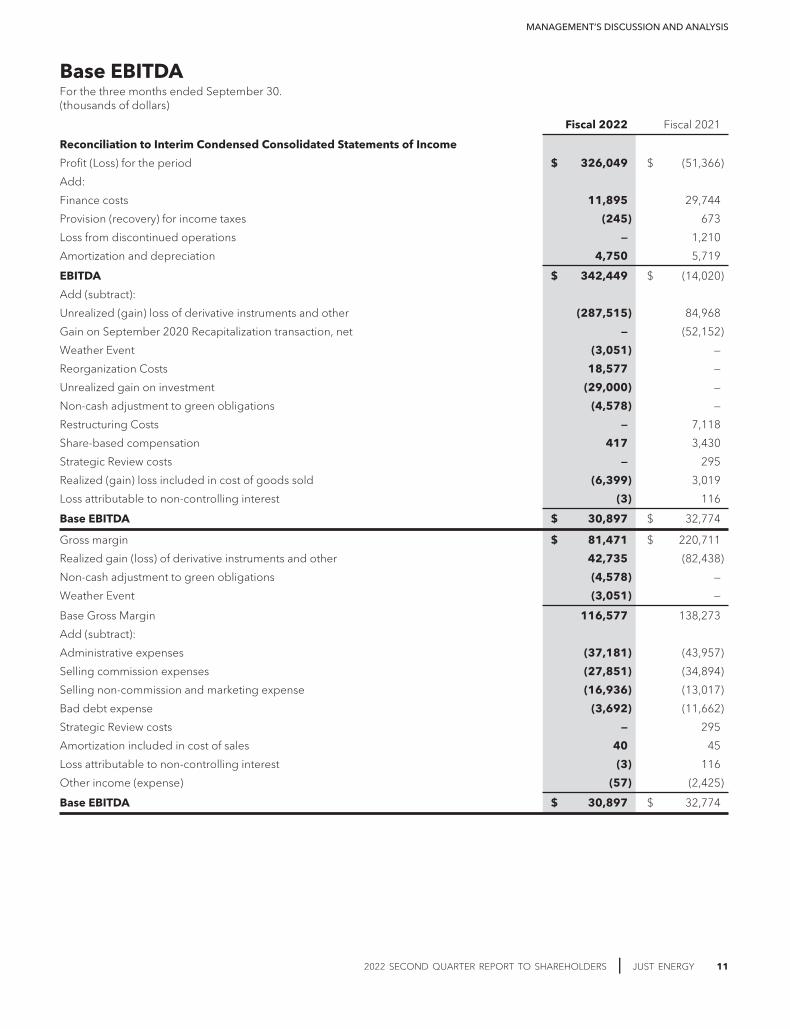
Base EBITDAFor the three months ended September 30.(thousands of dollars)
Fiscal 2022 Fiscal 2021
Reconciliation to Interim Condensed Consolidated Statements of Income
Profit (Loss) for the period $ 326,049 $ (51,366)
Add:
Finance costs 11,895 29,744
Provision (recovery) for income taxes (245) 673
Loss from discontinued operations — 1,210
Amortization and depreciation 4,750 5,719
EBITDA $ 342,449 $ (14,020)
Add (subtract):
Unrealized (gain) loss of derivative instruments and other (287,515) 84,968
Gain on September 2020 Recapitalization transaction, net — (52,152)
Weather Event (3,051) —
Reorganization Costs 18,577 —
Unrealized gain on investment (29,000) —
Non-cash adjustment to green obligations (4,578) —
Restructuring Costs — 7,118
Share-based compensation 417 3,430
Strategic Review costs — 295
Realized (gain) loss included in cost of goods sold (6,399) 3,019
Loss attributable to non-controlling interest (3) 116
Base EBITDA $ 30,897 $ 32,774
Gross margin $ 81,471 $ 220,711
Realized gain (loss) of derivative instruments and other 42,735 (82,438)
Non-cash adjustment to green obligations (4,578) —
Weather Event (3,051) —
Base Gross Margin 116,577 138,273
Add (subtract):
Administrative expenses (37,181) (43,957)
Selling commission expenses (27,851) (34,894)
Selling non-commission and marketing expense (16,936) (13,017)
Bad debt expense (3,692) (11,662)
Strategic Review costs — 295
Amortization included in cost of sales 40 45
Loss attributable to non-controlling interest (3) 116
Other income (expense) (57) (2,425)
Base EBITDA $ 30,897 $ 32,774
MANAGEMENT’S DISCUSSION AND ANALYSIS
2022 SECOND QUARTER REPORT TO SHAREHOLDERS | JUST ENERGY 11
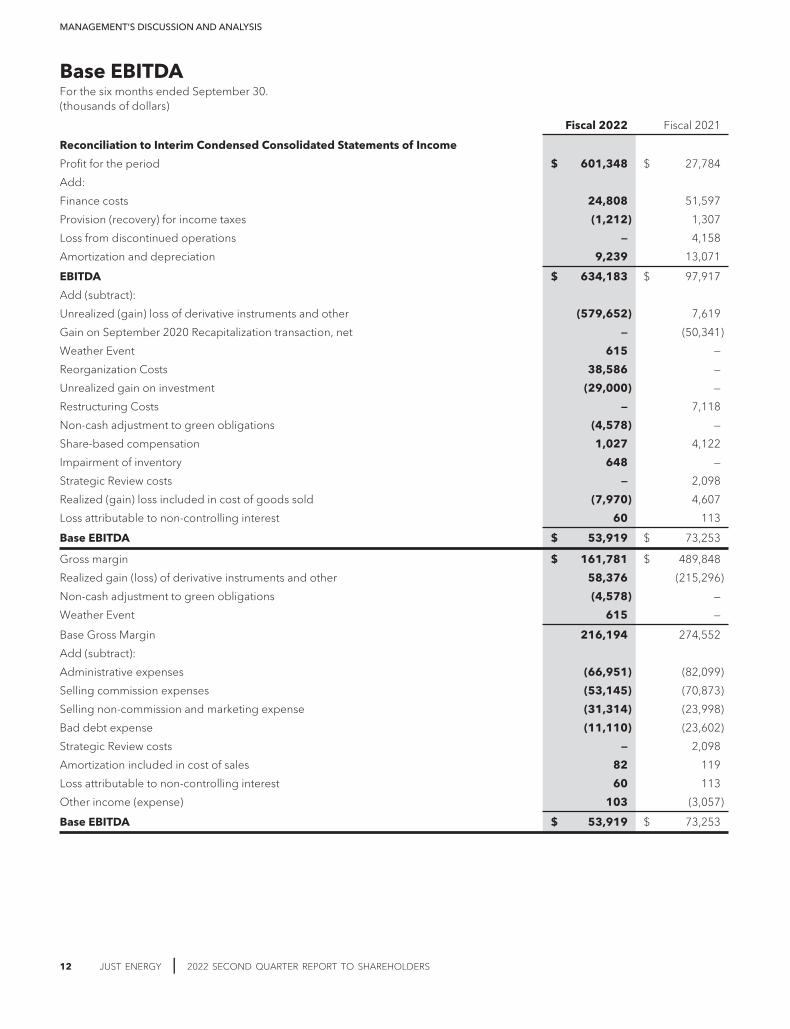
Base EBITDAFor the six months ended September 30.(thousands of dollars)
Fiscal 2022 Fiscal 2021
Reconciliation to Interim Condensed Consolidated Statements of Income
Profit for the period $ 601,348 $ 27,784
Add:
Finance costs 24,808 51,597
Provision (recovery) for income taxes (1,212) 1,307
Loss from discontinued operations — 4,158
Amortization and depreciation 9,239 13,071
EBITDA $ 634,183 $ 97,917
Add (subtract):
Unrealized (gain) loss of derivative instruments and other (579,652) 7,619
Gain on September 2020 Recapitalization transaction, net — (50,341)
Weather Event 615 —
Reorganization Costs 38,586 —
Unrealized gain on investment (29,000) —
Restructuring Costs — 7,118
Non-cash adjustment to green obligations (4,578) —
Share-based compensation 1,027 4,122
Impairment of inventory 648 —
Strategic Review costs — 2,098
Realized (gain) loss included in cost of goods sold (7,970) 4,607
Loss attributable to non-controlling interest 60 113
Base EBITDA $ 53,919 $ 73,253
Gross margin $ 161,781 $ 489,848
Realized gain (loss) of derivative instruments and other 58,376 (215,296)
Non-cash adjustment to green obligations (4,578) —
Weather Event 615 —
Base Gross Margin 216,194 274,552
Add (subtract):
Administrative expenses (66,951) (82,099)
Selling commission expenses (53,145) (70,873)
Selling non-commission and marketing expense (31,314) (23,998)
Bad debt expense (11,110) (23,602)
Strategic Review costs — 2,098
Amortization included in cost of sales 82 119
Loss attributable to non-controlling interest 60 113
Other income (expense) 103 (3,057)
Base EBITDA $ 53,919 $ 73,253
MANAGEMENT’S DISCUSSION AND ANALYSIS
12 JUST ENERGY | 2022 SECOND QUARTER REPORT TO SHAREHOLDERS
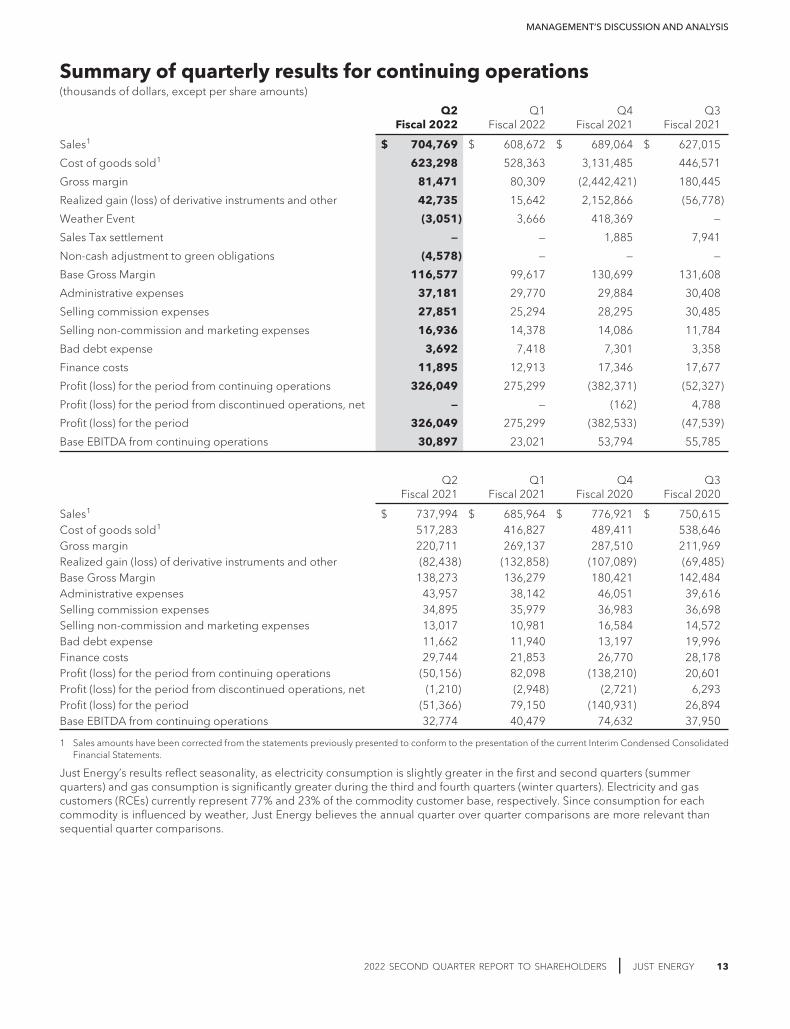
Summary of quarterly results for continuing operations(thousands of dollars, except per share amounts)
Q2Fiscal 2022
Q1Fiscal 2022
Q4Fiscal 2021
Q3Fiscal 2021
Sales1 $ 704,769 $ 608,672 $ 689,064 $ 627,015
Cost of goods sold1 623,298 528,363 3,131,485 446,571
Gross margin 81,471 80,309 (2,442,421) 180,445
Realized gain (loss) of derivative instruments and other 42,735 15,642 2,152,866 (56,778)
Weather Event (3,051) 3,666 418,369 —
Sales Tax settlement — — 1,885 7,941
Non-cash adjustment to green obligations (4,578) — — —
Base Gross Margin 116,577 99,617 130,699 131,608
Administrative expenses 37,181 29,770 29,884 30,408
Selling commission expenses 27,851 25,294 28,295 30,485
Selling non-commission and marketing expenses 16,936 14,378 14,086 11,784
Bad debt expense 3,692 7,418 7,301 3,358
Finance costs 11,895 12,913 17,346 17,677
Profit (loss) for the period from continuing operations 326,049 275,299 (382,371) (52,327)
Profit (loss) for the period from discontinued operations, net — — (162) 4,788
Profit (loss) for the period 326,049 275,299 (382,533) (47,539)
Base EBITDA from continuing operations 30,897 23,021 53,794 55,785
Q2Fiscal 2021
Q1Fiscal 2021
Q4Fiscal 2020
Q3Fiscal 2020
Sales1 $ 737,994 $ 685,964 $ 776,921 $ 750,615Cost of goods sold1 517,283 416,827 489,411 538,646Gross margin 220,711 269,137 287,510 211,969Realized gain (loss) of derivative instruments and other (82,438) (132,858) (107,089) (69,485)Base Gross Margin 138,273 136,279 180,421 142,484Administrative expenses 43,957 38,142 46,051 39,616Selling commission expenses 34,895 35,979 36,983 36,698Selling non-commission and marketing expenses 13,017 10,981 16,584 14,572Bad debt expense 11,662 11,940 13,197 19,996Finance costs 29,744 21,853 26,770 28,178Profit (loss) for the period from continuing operations (50,156) 82,098 (138,210) 20,601Profit (loss) for the period from discontinued operations, net (1,210) (2,948) (2,721) 6,293Profit (loss) for the period (51,366) 79,150 (140,931) 26,894Base EBITDA from continuing operations 32,774 40,479 74,632 37,950
1 Sales amounts have been corrected from the statements previously presented to conform to the presentation of the current Interim Condensed ConsolidatedFinancial Statements.
Just Energy’s results reflect seasonality, as electricity consumption is slightly greater in the first and second quarters (summerquarters) and gas consumption is significantly greater during the third and fourth quarters (winter quarters). Electricity and gascustomers (RCEs) currently represent 77% and 23% of the commodity customer base, respectively. Since consumption for eachcommodity is influenced by weather, Just Energy believes the annual quarter over quarter comparisons are more relevant thansequential quarter comparisons.
MANAGEMENT’S DISCUSSION AND ANALYSIS
2022 SECOND QUARTER REPORT TO SHAREHOLDERS | JUST ENERGY 13
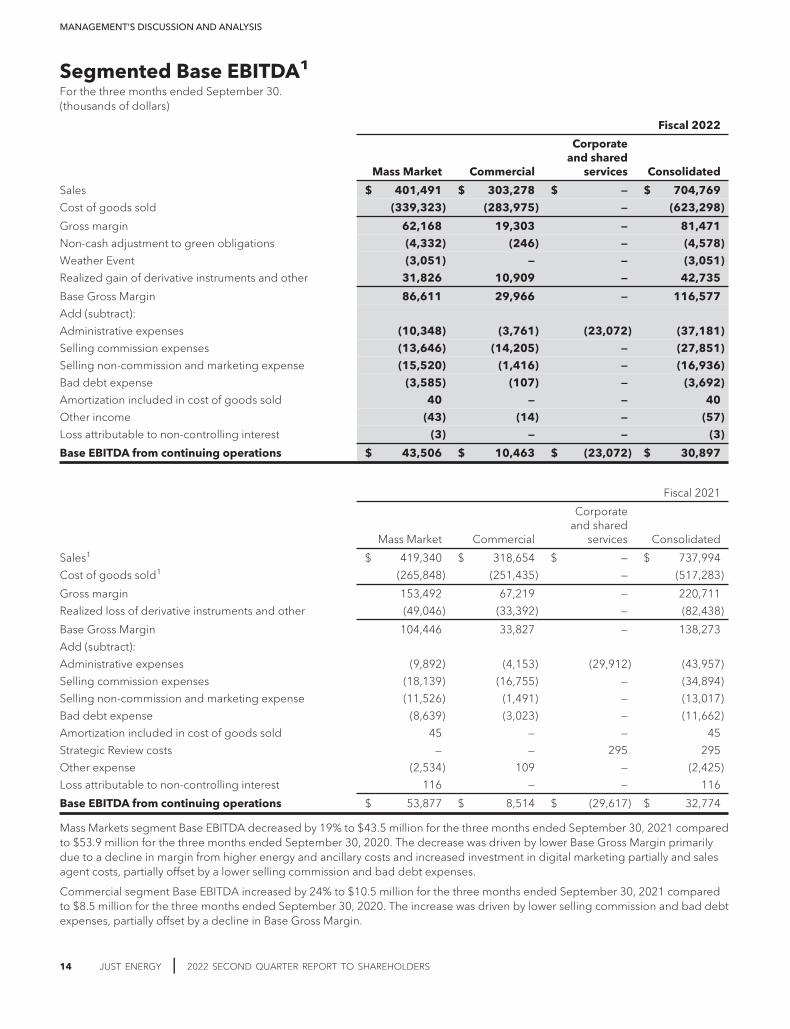
Segmented Base EBITDA1
For the three months ended September 30.(thousands of dollars)
Fiscal 2022
Mass Market Commercial
Corporateand shared
services Consolidated
Sales $ 401,491 $ 303,278 $ — $ 704,769
Cost of goods sold (339,323) (283,975) — (623,298)
Gross margin 62,168 19,303 — 81,471
Non-cash adjustment to green obligations (4,332) (246) — (4,578)
Weather Event (3,051) — — (3,051)
Realized gain of derivative instruments and other 31,826 10,909 — 42,735
Base Gross Margin 86,611 29,966 — 116,577
Add (subtract):
Administrative expenses (10,348) (3,761) (23,072) (37,181)
Selling commission expenses (13,646) (14,205) — (27,851)
Selling non-commission and marketing expense (15,520) (1,416) — (16,936)
Bad debt expense (3,585) (107) — (3,692)
Amortization included in cost of goods sold 40 — — 40
Other income (43) (14) — (57)
Loss attributable to non-controlling interest (3) — — (3)
Base EBITDA from continuing operations $ 43,506 $ 10,463 $ (23,072) $ 30,897
Fiscal 2021
Mass Market Commercial
Corporateand shared
services Consolidated
Sales1 $ 419,340 $ 318,654 $ — $ 737,994
Cost of goods sold1 (265,848) (251,435) — (517,283)
Gross margin 153,492 67,219 — 220,711
Realized loss of derivative instruments and other (49,046) (33,392) — (82,438)
Base Gross Margin 104,446 33,827 — 138,273
Add (subtract):
Administrative expenses (9,892) (4,153) (29,912) (43,957)
Selling commission expenses (18,139) (16,755) — (34,894)
Selling non-commission and marketing expense (11,526) (1,491) — (13,017)
Bad debt expense (8,639) (3,023) — (11,662)
Amortization included in cost of goods sold 45 — — 45
Strategic Review costs — — 295 295
Other expense (2,534) 109 — (2,425)
Loss attributable to non-controlling interest 116 — — 116
Base EBITDA from continuing operations $ 53,877 $ 8,514 $ (29,617) $ 32,774
Mass Markets segment Base EBITDA decreased by 19% to $43.5 million for the three months ended September 30, 2021 comparedto $53.9 million for the three months ended September 30, 2020. The decrease was driven by lower Base Gross Margin primarilydue to a decline in margin from higher energy and ancillary costs and increased investment in digital marketing partially and salesagent costs, partially offset by a lower selling commission and bad debt expenses.
Commercial segment Base EBITDA increased by 24% to $10.5 million for the three months ended September 30, 2021 comparedto $8.5 million for the three months ended September 30, 2020. The increase was driven by lower selling commission and bad debtexpenses, partially offset by a decline in Base Gross Margin.
MANAGEMENT’S DISCUSSION AND ANALYSIS
14 JUST ENERGY | 2022 SECOND QUARTER REPORT TO SHAREHOLDERS
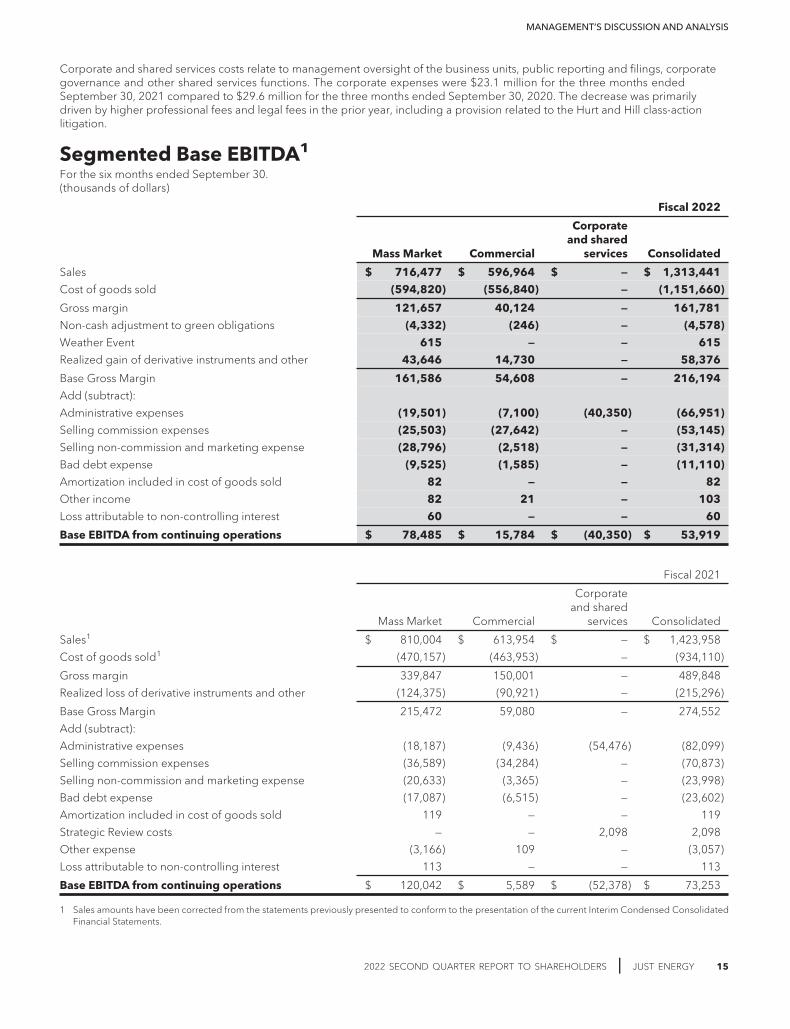
Corporate and shared services costs relate to management oversight of the business units, public reporting and filings, corporategovernance and other shared services functions. The corporate expenses were $23.1 million for the three months endedSeptember 30, 2021 compared to $29.6 million for the three months ended September 30, 2020. The decrease was primarilydriven by higher professional fees and legal fees in the prior year, including a provision related to the Hurt and Hill class-actionlitigation.
Segmented Base EBITDA1
For the six months ended September 30.(thousands of dollars)
Fiscal 2022
Mass Market Commercial
Corporateand shared
services Consolidated
Sales $ 716,477 $ 596,964 $ — $ 1,313,441
Cost of goods sold (594,820) (556,840) — (1,151,660)
Gross margin 121,657 40,124 — 161,781
Non-cash adjustment to green obligations (4,332) (246) — (4,578)
Weather Event 615 — — 615
Realized gain of derivative instruments and other 43,646 14,730 — 58,376
Base Gross Margin 161,586 54,608 — 216,194
Add (subtract):
Administrative expenses (19,501) (7,100) (40,350) (66,951)
Selling commission expenses (25,503) (27,642) — (53,145)
Selling non-commission and marketing expense (28,796) (2,518) — (31,314)
Bad debt expense (9,525) (1,585) — (11,110)
Amortization included in cost of goods sold 82 — — 82
Other income 82 21 — 103
Loss attributable to non-controlling interest 60 — — 60
Base EBITDA from continuing operations $ 78,485 $ 15,784 $ (40,350) $ 53,919
Fiscal 2021
Mass Market Commercial
Corporateand shared
services Consolidated
Sales1 $ 810,004 $ 613,954 $ — $ 1,423,958
Cost of goods sold1 (470,157) (463,953) — (934,110)
Gross margin 339,847 150,001 — 489,848
Realized loss of derivative instruments and other (124,375) (90,921) — (215,296)
Base Gross Margin 215,472 59,080 — 274,552
Add (subtract):
Administrative expenses (18,187) (9,436) (54,476) (82,099)
Selling commission expenses (36,589) (34,284) — (70,873)
Selling non-commission and marketing expense (20,633) (3,365) — (23,998)
Bad debt expense (17,087) (6,515) — (23,602)
Amortization included in cost of goods sold 119 — — 119
Strategic Review costs — — 2,098 2,098
Other expense (3,166) 109 — (3,057)
Loss attributable to non-controlling interest 113 — — 113
Base EBITDA from continuing operations $ 120,042 $ 5,589 $ (52,378) $ 73,253
1 Sales amounts have been corrected from the statements previously presented to conform to the presentation of the current Interim Condensed ConsolidatedFinancial Statements.
MANAGEMENT’S DISCUSSION AND ANALYSIS
2022 SECOND QUARTER REPORT TO SHAREHOLDERS | JUST ENERGY 15

2 The segment definitions are provided on page 3.
Consolidated Base EBITDA decreased by 26% to $53.9 million for the six months ended September 30, 2021 compared to$73.3 million for the six months ended September 30, 2020. The decrease was driven by lower Base Gross Margin and increasedinvestment in digital marketing and sales agent costs, partially offset by lower selling commission, administrative and bad debtexpenses.
Mass Markets segment Base EBITDA decreased by 35% to $78.5 million for the six months ended September 30, 2021 comparedfrom $120.0 million for the six months ended September 30, 2020. The decrease was driven by a lower Base Gross Margin andincreased investment in digital marketing and sales agent costs, partially offset by lower bad debt and selling commission expenses.
Commercial segment Base EBITDA increased by 182% to $15.8 million for the six months ended September 30, 2021 comparedto $5.6 million for the six months ended September 30, 2020. The increase was driven by selling commission expenses and bad debtexpenses, partially offset by lower Base Gross Margin from favourable resettlements in the prior year and a decline in the customerbase.
Corporate and shared services costs relate to management oversight of the business units, public reporting and filings, corporategovernance and other shared services functions. The corporate expenses were $40.4 million for the six months ended September 30,2021 compared to $52.4 million for the six months ended September 30, 2020. The decrease was primarily driven by higherprofessional and legal fees in the prior year, including a provision related to the Hurt and Hill class-action litigation. The Corporateexpenses exclude Strategic Review costs in the six months ended September 30, 2020, because the costs are non-recurring andtherefore excluded from Base EBITDA.
Acquisition CostsThe acquisition costs per customer for the trailing twelve months for Mass Market customers signed by sales agents including salesthrough digital channel and the Commercial customers signed by brokers were as follows:
Fiscal 2022 Fiscal 2021
Mass Markets $ 235/RCE $ 241/RCE
Commercial $ 44/RCE $ 42/RCE
The Mass Markets average acquisition cost decreased by 2% to $235/RCE for the twelve months ended September 30, 2021compared to $241/RCE reported for the twelve months ended September 30, 2020, primarily from lower exchange rate and achange in channel mix towards lower cost channels.
The Commercial average customer acquisition cost increased by 5% to $44/RCE for the twelve months ended September 30, 2021compared to $42/RCE for the twelve months ended September 30, 2020.
Customer summaryCUSTOMER COUNT
As atSeptember 30,
2021
As atSeptember 30,
2020%
decrease
Mass Markets 840,000 906,000 (7)%
Commercial 96,000 108,000 (11)%
Total customer count 936,000 1,014,000 (8)%
The Mass Markets customer count decreased 7% to 840,000 compared to September 30, 2020. The decline in Mass Marketscustomers is due to regulatory restrictions in Ontario, New York and California; and selling constraints in direct in-person channelspreviously posed by the COVID-19 pandemic in prior periods.
MANAGEMENT’S DISCUSSION AND ANALYSIS
16 JUST ENERGY | 2022 SECOND QUARTER REPORT TO SHAREHOLDERS
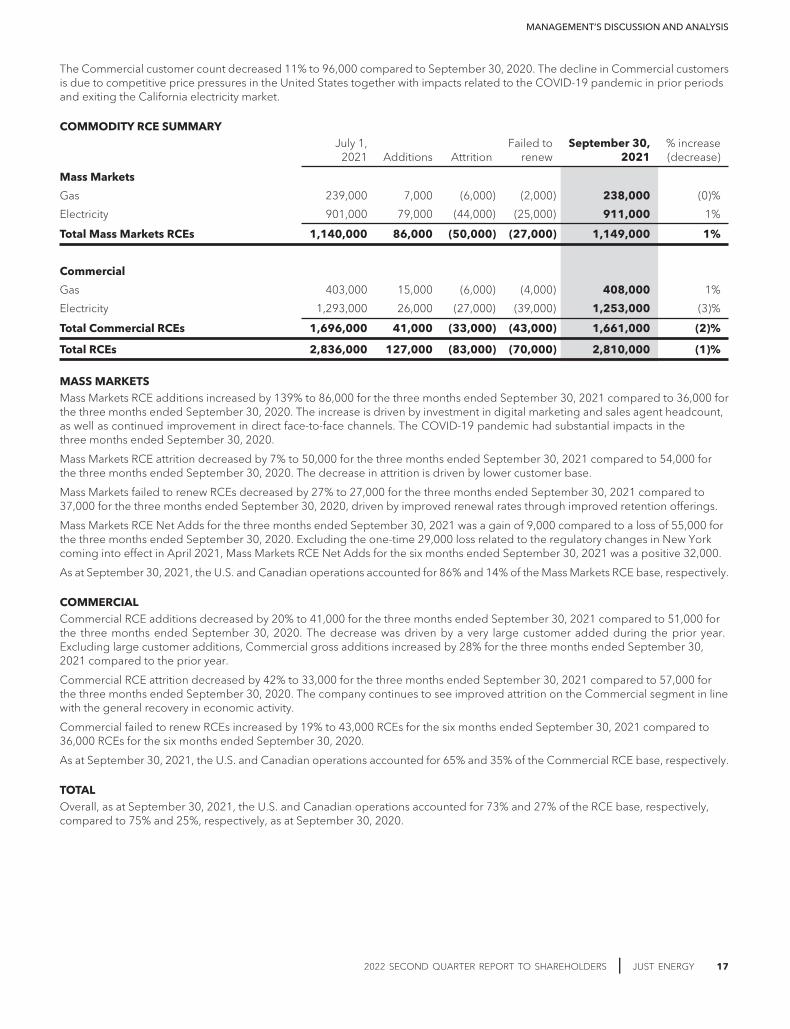
The Commercial customer count decreased 11% to 96,000 compared to September 30, 2020. The decline in Commercial customersis due to competitive price pressures in the United States together with impacts related to the COVID-19 pandemic in prior periodsand exiting the California electricity market.
COMMODITY RCE SUMMARYJuly 1,
2021 Additions AttritionFailed to
renewSeptember 30,
2021% increase(decrease)
Mass Markets
Gas 239,000 7,000 (6,000) (2,000) 238,000 (0)%
Electricity 901,000 79,000 (44,000) (25,000) 911,000 1%
Total Mass Markets RCEs 1,140,000 86,000 (50,000) (27,000) 1,149,000 1%
Commercial
Gas 403,000 15,000 (6,000) (4,000) 408,000 1%
Electricity 1,293,000 26,000 (27,000) (39,000) 1,253,000 (3)%
Total Commercial RCEs 1,696,000 41,000 (33,000) (43,000) 1,661,000 (2)%
Total RCEs 2,836,000 127,000 (83,000) (70,000) 2,810,000 (1)%
MASS MARKETSMass Markets RCE additions increased by 139% to 86,000 for the three months ended September 30, 2021 compared to 36,000 forthe three months ended September 30, 2020. The increase is driven by investment in digital marketing and sales agent headcount,as well as continued improvement in direct face-to-face channels. The COVID-19 pandemic had substantial impacts in thethree months ended September 30, 2020.
Mass Markets RCE attrition decreased by 7% to 50,000 for the three months ended September 30, 2021 compared to 54,000 forthe three months ended September 30, 2020. The decrease in attrition is driven by lower customer base.
Mass Markets failed to renew RCEs decreased by 27% to 27,000 for the three months ended September 30, 2021 compared to37,000 for the three months ended September 30, 2020, driven by improved renewal rates through improved retention offerings.
Mass Markets RCE Net Adds for the three months ended September 30, 2021 was a gain of 9,000 compared to a loss of 55,000 forthe three months ended September 30, 2020. Excluding the one-time 29,000 loss related to the regulatory changes in New Yorkcoming into effect in April 2021, Mass Markets RCE Net Adds for the six months ended September 30, 2021 was a positive 32,000.
As at September 30, 2021, the U.S. and Canadian operations accounted for 86% and 14% of the Mass Markets RCE base, respectively.
COMMERCIALCommercial RCE additions decreased by 20% to 41,000 for the three months ended September 30, 2021 compared to 51,000 forthe three months ended September 30, 2020. The decrease was driven by a very large customer added during the prior year.Excluding large customer additions, Commercial gross additions increased by 28% for the three months ended September 30,2021 compared to the prior year.
Commercial RCE attrition decreased by 42% to 33,000 for the three months ended September 30, 2021 compared to 57,000 forthe three months ended September 30, 2020. The company continues to see improved attrition on the Commercial segment in linewith the general recovery in economic activity.
Commercial failed to renew RCEs increased by 19% to 43,000 RCEs for the six months ended September 30, 2021 compared to36,000 RCEs for the six months ended September 30, 2020.
As at September 30, 2021, the U.S. and Canadian operations accounted for 65% and 35% of the Commercial RCE base, respectively.
TOTALOverall, as at September 30, 2021, the U.S. and Canadian operations accounted for 73% and 27% of the RCE base, respectively,compared to 75% and 25%, respectively, as at September 30, 2020.
MANAGEMENT’S DISCUSSION AND ANALYSIS
2022 SECOND QUARTER REPORT TO SHAREHOLDERS | JUST ENERGY 17
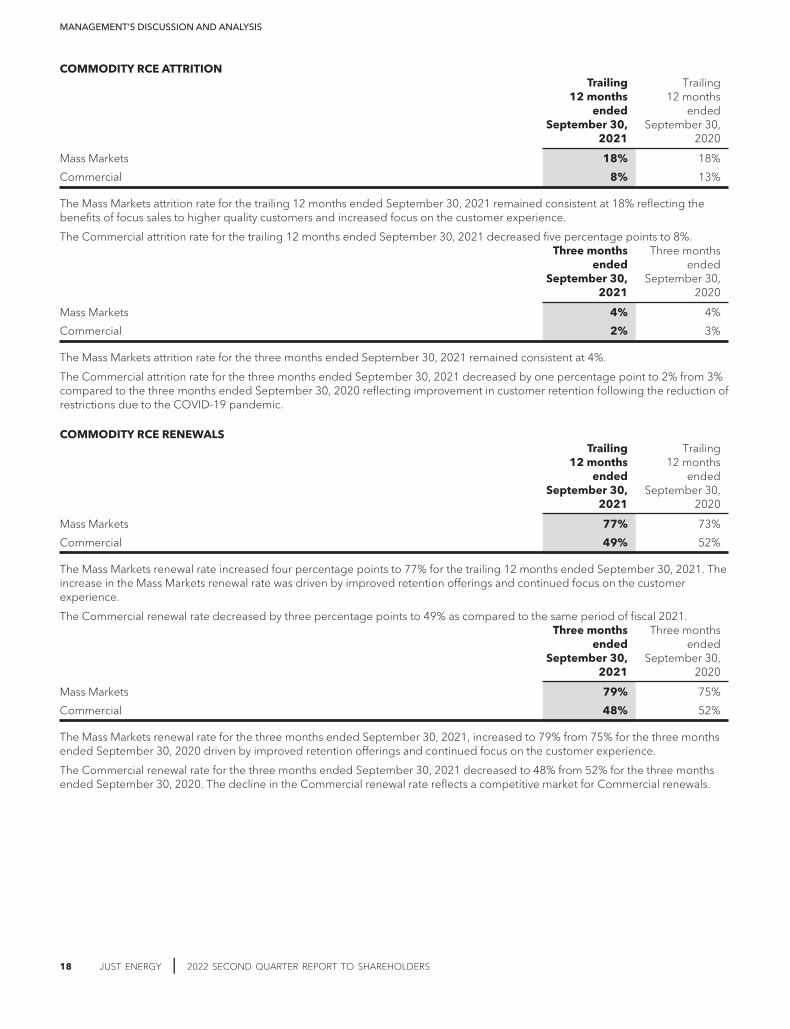
COMMODITY RCE ATTRITIONTrailing
12 monthsended
September 30,2021
Trailing12 months
endedSeptember 30,
2020
Mass Markets 18% 18%
Commercial 8% 13%
The Mass Markets attrition rate for the trailing 12 months ended September 30, 2021 remained consistent at 18% reflecting thebenefits of focus sales to higher quality customers and increased focus on the customer experience.
The Commercial attrition rate for the trailing 12 months ended September 30, 2021 decreased five percentage points to 8%.Three months
endedSeptember 30,
2021
Three monthsended
September 30,2020
Mass Markets 4% 4%
Commercial 2% 3%
The Mass Markets attrition rate for the three months ended September 30, 2021 remained consistent at 4%.
The Commercial attrition rate for the three months ended September 30, 2021 decreased by one percentage point to 2% from 3%compared to the three months ended September 30, 2020 reflecting improvement in customer retention following the reduction ofrestrictions due to the COVID-19 pandemic.
COMMODITY RCE RENEWALSTrailing
12 monthsended
September 30,2021
Trailing12 months
endedSeptember 30,
2020
Mass Markets 77% 73%
Commercial 49% 52%
The Mass Markets renewal rate increased four percentage points to 77% for the trailing 12 months ended September 30, 2021. Theincrease in the Mass Markets renewal rate was driven by improved retention offerings and continued focus on the customerexperience.
The Commercial renewal rate decreased by three percentage points to 49% as compared to the same period of fiscal 2021.Three months
endedSeptember 30,
2021
Three monthsended
September 30,2020
Mass Markets 79% 75%
Commercial 48% 52%
The Mass Markets renewal rate for the three months ended September 30, 2021, increased to 79% from 75% for the three monthsended September 30, 2020 driven by improved retention offerings and continued focus on the customer experience.
The Commercial renewal rate for the three months ended September 30, 2021 decreased to 48% from 52% for the three monthsended September 30, 2020. The decline in the Commercial renewal rate reflects a competitive market for Commercial renewals.
MANAGEMENT’S DISCUSSION AND ANALYSIS
18 JUST ENERGY | 2022 SECOND QUARTER REPORT TO SHAREHOLDERS

AVERAGE GROSS MARGIN PER RCEThe table below depicts the annual design margins on new and renewed contracts signed during the three months endedSeptember 30, 2021 compared to three months ended September 30, 2020 for standard commodities, which does not include non-recurring non-commodity fees.
Q2 Fiscal2022
Number ofRCEs
Q2 Fiscal2021
Number ofRCEs
Mass Markets added or renewed $ 266 178,000 $ 309 118,000
Commercial added or renewed1 88 86,000 88 73,000
1 Annual gross margin per RCE excludes margins from Interactive Energy Group and large Commercial and Industrial customers.
For the three months ended September 30, 2021, the average gross margin per RCE for the customers added or renewed by theMass Markets segment was $266, a decrease of 14% from $309 for the three months ended September 30, 2020 due to change inchannel mix including lower cost of acquisition channels and overall margin pressure related to increasing commodity prices.
For the Commercial segment there was no change in average gross margin per RCE for the three months ended September 30,2021 compared to the three months ended September 30, 2020.
Liquidity and capital resources from continuing operationsSUMMARY OF CASH FLOWSFor the six months ended September 30.(thousands of dollars)
Fiscal 2022 Fiscal 2021
Operating activities from continuing operations $ 22,376 $ 22,798
Investing activities from continuing operations (4,837) (4,673)
Financing activities from continuing operations (34,782) 37,426
Effect of foreign currency translation 1,206 (3,679)
Increase (decrease) in cash (16,037) 51,872
Cash and cash equivalents – beginning of period 215,989 26,093
Cash and cash equivalents – end of period $ 199,952 $ 77,965
OPERATING ACTIVITIESCash flow from operating activities was an inflow of $22.4 million for the six months ended September 30, 2021 compared to aninflow of $22.8 million for the six months ended September 30, 2020. September 30, 2021 cash flow from operating activitiesbenefited from lower cash financing costs due to the September 2020 Recapitalization offset by higher payments to ERCOT associatedwith the Weather Event, partially offset by the non-payment of trade and other payables subject to compromise.
INVESTING ACTIVITIESCash flow from investing activities was an outflow of $4.8 million for the six months ended September 30, 2021 compared to anoutflow of $4.7 million for the six months ended September 30, 2020.
FINANCING ACTIVITIESCash flow from financing activities was an outflow of $34.8 million for the six months ended September 30, 2021 compared to aninflow of $37.4 million for the six months ended September 30, 2020. The outflow is primarily driven by payments of $63.3 millionunder the Credit Facility to allow the issuance of Letters of Credit partially offset by proceeds from DIP Facility.
Free cash flow and unlevered free cash flow1
For the six months ended September 30.(thousands of dollars)
Fiscal 2022 Fiscal 2021
Cash flows from operating activities $ 22,376 $ 22,798
Subtract: Maintenance capital expenditures (4,837) (4,673)
Free cash flow 17,539 18,125
Finance costs, cash portion 20,492 35,021
Unlevered free cash flow $ 38,031 $ 53,146
MANAGEMENT’S DISCUSSION AND ANALYSIS
2022 SECOND QUARTER REPORT TO SHAREHOLDERS | JUST ENERGY 19
1 See “Non-IFRS financial measures” on page 5.
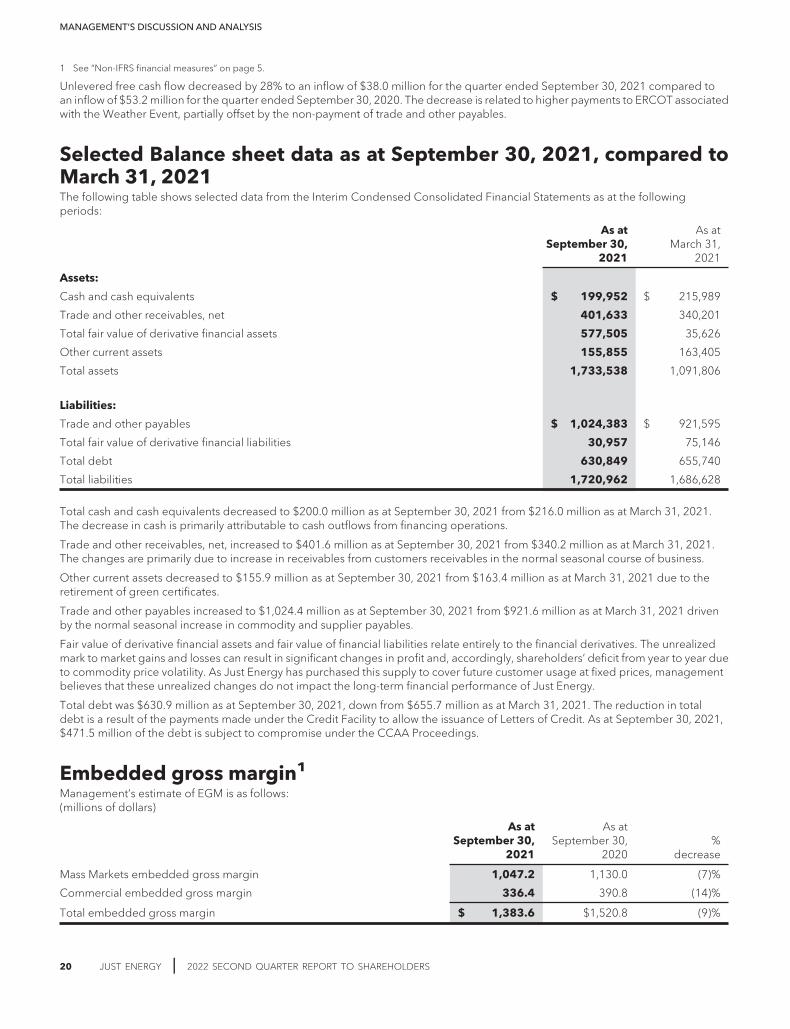
Unlevered free cash flow decreased by 28% to an inflow of $38.0 million for the quarter ended September 30, 2021 compared toan inflow of $53.2 million for the quarter ended September 30, 2020. The decrease is related to higher payments to ERCOT associatedwith the Weather Event, partially offset by the non-payment of trade and other payables.
Selected Balance sheet data as at September 30, 2021, compared toMarch 31, 2021The following table shows selected data from the Interim Condensed Consolidated Financial Statements as at the followingperiods:
As atSeptember 30,
2021
As atMarch 31,
2021
Assets:
Cash and cash equivalents $ 199,952 $ 215,989
Trade and other receivables, net 401,633 340,201
Total fair value of derivative financial assets 577,505 35,626
Other current assets 155,855 163,405
Total assets 1,733,538 1,091,806
Liabilities:
Trade and other payables $ 1,024,383 $ 921,595
Total fair value of derivative financial liabilities 30,957 75,146
Total debt 630,849 655,740
Total liabilities 1,720,962 1,686,628
Total cash and cash equivalents decreased to $200.0 million as at September 30, 2021 from $216.0 million as at March 31, 2021.The decrease in cash is primarily attributable to cash outflows from financing operations.
Trade and other receivables, net, increased to $401.6 million as at September 30, 2021 from $340.2 million as at March 31, 2021.The changes are primarily due to increase in receivables from customers receivables in the normal seasonal course of business.
Other current assets decreased to $155.9 million as at September 30, 2021 from $163.4 million as at March 31, 2021 due to theretirement of green certificates.
Trade and other payables increased to $1,024.4 million as at September 30, 2021 from $921.6 million as at March 31, 2021 drivenby the normal seasonal increase in commodity and supplier payables.
Fair value of derivative financial assets and fair value of financial liabilities relate entirely to the financial derivatives. The unrealizedmark to market gains and losses can result in significant changes in profit and, accordingly, shareholders’ deficit from year to year dueto commodity price volatility. As Just Energy has purchased this supply to cover future customer usage at fixed prices, managementbelieves that these unrealized changes do not impact the long-term financial performance of Just Energy.
Total debt was $630.9 million as at September 30, 2021, down from $655.7 million as at March 31, 2021. The reduction in totaldebt is a result of the payments made under the Credit Facility to allow the issuance of Letters of Credit. As at September 30, 2021,$471.5 million of the debt is subject to compromise under the CCAA Proceedings.
Embedded gross margin1
Management’s estimate of EGM is as follows:(millions of dollars)
As atSeptember 30,
2021
As atSeptember 30,
2020%
decrease
Mass Markets embedded gross margin 1,047.2 1,130.0 (7)%
Commercial embedded gross margin 336.4 390.8 (14)%
Total embedded gross margin $ 1,383.6 $1,520.8 (9)%
MANAGEMENT’S DISCUSSION AND ANALYSIS
20 JUST ENERGY | 2022 SECOND QUARTER REPORT TO SHAREHOLDERS

1 See “Non-IFRS financial measures” on page 5
Management’s estimate of the Mass Markets EGM decreased by 7% to $1,047 million as at September 30, 2021 compared to$1,130 million as at September 30, 2020. The decline resulted from the lower customer base and the unfavourable foreign exchange.
Management’s estimate of the Commercial EGM decreased by 14% to $336 million as at September 30, 2021 compared to$391 million as at September 30, 2020. The decline resulted from the decline in the customer base and the unfavourable foreignexchange.
Provision for (Recovery of) income and deferred tax(thousands of dollars)
For the three monthsended September 30,
For the six monthsended September 30,
2021 2020 2021 2020
Current income tax expense (recovery) $ (245) $ 493 $ (1,357) $ 1,366
Deferred income tax expense (recovery) — 180 145 (59)
Provision for (recovery of) income tax $ (245) $ 673 $ (1,212) $ 1,307
Just Energy recorded a current income tax recovery of $0.2 million for the three months ended September 30, 2021, compared to$0.5 million expense in the three months ended September 30, 2020. A current income tax recovery of $1.4 million for the six monthsended September 30, 2021, compared to $1.4 million expense in the six months ended September 30, 2020. Just Energy continuesto have a current tax expense from profitability in taxable jurisdictions however during the second quarter of fiscal 2022 a recoverywas recognized due to the benefit of a current year loss carried back.
During the three months ended September 30, 2021, a deferred tax expense of nil was recorded as compared to a deferred taxexpense of $0.2 million during the three months ended September 30, 2020.
OTHER OBLIGATIONSIn the opinion of management, Just Energy has no material pending actions, claims or proceedings that have not been includedeither in its accrued liabilities or in the Interim Condensed Consolidated Financial Statements. In the normal course of business, JustEnergy could be subject to certain contingent obligations that become payable only if certain events were to occur. The inherentuncertainty surrounding the timing and financial impact of any events prevents any meaningful measurement, which is necessary toassess any material impact on future liquidity. Such obligations include potential judgments, settlements, fines and other penaltiesresulting from actions, claims or proceedings.
Transactions with related partiesParties are considered to be related if one party has the ability to control the other party or exercise influence over the other party inmaking financial or operating decisions. The definition includes subsidiaries and other persons.
PIMCO through certain affiliates became a 28.9% shareholder of the Company as part of the September 2020 Recapitalization. OnMarch 9, 2021, certain PIMCO affiliates entered into the DIP Facility with the Company as discussed in the Interim CondensedConsolidated Financial Statements.
Off balance sheet itemsThe Company has issued letters of credit in accordance with its credit facility totaling $160.5 million as at September 30, 2021 tovarious counterparties, primarily utilities in the markets it operates in, as well as suppliers.
Pursuant to separate arrangements with multiple insurance and surety bond providers. Just Energy has issued surety bonds tovarious counterparties including States, regulatory bodies, utilities and various other surety bond holders in return for a fee and/ormeeting certain collateral posting requirements. Such surety bond postings are required in order to operate in certain states ormarkets. Total surety bonds issued as at September 30, 2021 was $46.3 million and are backed by letters of credit or cash collateral.
Critical accounting estimates and judgmentsThe Interim Condensed Consolidated Financial Statements of Just Energy have been prepared in accordance with IFRS. Certainaccounting policies require management to make estimates and judgments that affect the reported amounts of assets, liabilities,sales, cost of goods sold, administrative expenses, selling and marketing expenses, and other operating expenses. Estimates arebased on historical experience, current information and various other assumptions that are believed to be reasonable under thecircumstances. The emergence of new information and changed circumstances may result in actual results or changes to estimatedamounts that differ materially from current estimates.
MANAGEMENT’S DISCUSSION AND ANALYSIS
2022 SECOND QUARTER REPORT TO SHAREHOLDERS | JUST ENERGY 21
The following assessment of critical accounting estimates is not meant to be exhaustive. Just Energy might realize different resultsfrom the application of new accounting standards promulgated, from time to time, by various rule-making bodies.
COVID-19 IMPACTAs a result of the continued coronavirus disease (“COVID-19”) pandemic, we have reviewed the estimates, judgments andassumptions used in the preparation of the Interim Condensed Consolidated Financial Statements and determined that no significantrevisions to such estimates, judgments or assumptions were required for the three months ended September 30, 2021.
FAIR VALUE OF FINANCIAL INSTRUMENTS AND RISK MANAGEMENTJust Energy has entered into a variety of derivative financial instruments as part of the business of purchasing and selling gas,electricity and JustGreen supply and as part of the risk management practice. In addition, Just Energy uses derivative financialinstruments to manage foreign exchange, interest rate and other risks.
Just Energy enters into contracts with customers to provide electricity and gas at fixed prices and provide comfort to certaincustomers that a specified amount of energy will be derived from green generation or carbon destruction. These customer contractsexpose Just Energy to changes in market prices to supply these commodities. To reduce its exposure to commodity market pricechanges, Just Energy uses derivative financial and physical contracts to secure fixed-price commodity supply to cover its estimatedfixed-price delivery or green commitment. Certain derivative contracts were purchased to manage ERCOT collateral requirements.
Just Energy’s objective is to minimize commodity risk, other than consumption changes, usually attributable to weather. Accordingly,it is Just Energy’s policy to hedge the estimated fixed-price requirements of its customers with offsetting hedges of natural gas andelectricity at fixed prices for terms equal to those of the customer contracts. The cash flow from these supply contracts is expected tobe effective in offsetting Just Energy’s price exposure and serves to fix acquisition costs of gas and electricity to be delivered underthe fixed-price or price-protected customer contracts; however, hedge accounting under IFRS 9 is not applied. Just Energy’s policy isnot to use derivative instruments for speculative purposes.
Just Energy’s U.S. operations introduce foreign exchange-related risks. Just Energy enters into foreign exchange forwards in orderto hedge its exposure to fluctuations in cross border cash flows, however, hedge accounting under IFRS 9 is not applied.
The Interim Financial Statements are in compliance with IAS 32, “Financial Instruments: Presentation”; IFRS 9; and IFRS 7, “FinancialInstruments: Disclosure”. Due to commodity volatility and to the size of Just Energy, the swings in mark to market on these positionswill increase the volatility in Just Energy’s earnings.
The Company’s financial instruments are valued based on the following fair value hierarchy:
Level 1 — Unadjusted quoted prices in active markets for identical assets or liabilities;
Level 2 — Inputs other than quoted prices that are observable for the asset or liability either directly or indirectly; and
Level 3 — Inputs that are not based on observable market data.
The main cause of changes in the fair value of derivative instruments is changes in the forward curve prices used for the fair valuecalculations. For a sensitivity analysis of these forward curves, see Note 6 of the Interim Condensed Consolidated Financial Statements.Other inputs, including volatility and correlations, are driven off historical settlements.
RECEIVABLES AND LIFETIME EXPECTED CREDIT LOSSESThe lifetime expected credit loss reflects Just Energy’s best estimate of losses on the accounts receivable and unbilled revenuebalances. Just Energy determines the lifetime expected credit loss by using historical loss rates and forward-looking factors ifapplicable. Just Energy is exposed to customer credit risk on its continuing operations in Alberta, Texas, Illinois (gas), California (gas)and Ohio (electricity) and for certain Commercial customers in dual-billing markets including Illinois (power), Pennsylvania (power),Massachusetts (power), New York and New Jersey. Credit review processes have been implemented to perform credit evaluations ofcustomers and manage customer default. In addition, the Company may from time to time change the criteria that it uses todetermine the creditworthiness of its customers, including RCEs, and such changes could result in decreased creditworthiness of itscustomers and/or result in increased customer defaults. If a significant number of customers were to default on their payments,including as a result of any changes to the Company’s credit criteria, it could have a material adverse effect on the operations andcash flows of Just Energy. Management factors default from credit risk in its margin expectations for all of the above markets, SeeNote 4 of the Interim Condensed Consolidated Financial Statements.
Revenues related to the sale of energy are recorded when energy is delivered to customers. The determination of energy sales toindividual customers is based on systematic readings of customer meters generally on a monthly basis. At the end of each month,amounts of energy delivered to customers since the date of the last meter reading are estimated, and corresponding unbilled revenueis recorded. The measurement of unbilled revenue is affected by the following factors: daily customer usage, losses of energyduring delivery to customers and applicable customer rates.
MANAGEMENT’S DISCUSSION AND ANALYSIS
22 JUST ENERGY | 2022 SECOND QUARTER REPORT TO SHAREHOLDERS

Increases in volumes delivered to the utilities’ customers and favourable rate mix due to changes in usage patterns in the periodcould be significant to the calculation of unbilled revenue. Changes in the timing of meter reading schedules and the number andtype of customers scheduled for each meter reading date would also have an effect on the measurement of unbilled revenue; however,total operating revenues would remain materially unchanged.
The measurement of the expected credit loss allowance for accounts receivable requires the use of management judgment inestimation techniques, building models, selecting key inputs and making significant assumptions about future economic conditionsand credit behaviour of the customers, including the likelihood of customers defaulting and the resulting losses. The Company’scurrent significant estimates include the historical collection rates as a percentage of revenue and the use of the Company’s historicalrates of recovery across aging buckets. Both of these inputs are sensitive to the number of months or years of history included inthe analysis, which is a key input and judgment made by management.
Just Energy common sharesJust Energy is authorized to issue an unlimited number of common shares with no par value and up to 50,000,000 preferred shares.Shares outstanding have no preferences, rights or restrictions attached to them.
As at September 30, 2021, there were 48,078,637 Common Shares and no preferred shares of Just Energy outstanding.
Legal proceedingsJust Energy’s subsidiaries are party to a number of legal proceedings. Other than as set out below, Just Energy believes that eachproceeding constitutes legal matters that are incidental to the business conducted by Just Energy and that the ultimate dispositionof the proceedings will not have a material adverse effect on its consolidated earnings, cash flows or financial position.
On March 9, 2021, Just Energy filed for and received creditor protection pursuant to the Court Order under the CCAA and similarprotection under Chapter 15 of the Bankruptcy Code in the United States in connection with the Weather Event. On September 15,2021, the Ontario Court approved the Company’s request to establish a claims process to identify and determine claims againstthe Company and its subsidiaries that are subject to the ongoing CCAA Proceedings. As a result of the establishment of the claimsprocess, additional claims may be made against the Company and ultimately determined that are not currently reflected in the InterimCondensed Financial Statements.
In May 2015, Kia Kordestani, a former door-to-door independent contractor sales representative for Just Energy Corp., filed alawsuit against Just Energy Corp., Just Energy Ontario L.P. and the Company (collectively referred to as “Just Energy”) in the SuperiorCourt of Justice, Ontario, claiming status as an employee and seeking benefits and protections of the Employment Standards Act,2000, such as minimum wage, overtime pay, and vacation and public holiday pay on his own behalf and similarly situated door-to-door sales representatives who sold in Ontario. On Just Energy’s request, Mr. Kordestani was removed as a plaintiff but replaced withHaidar Omarali, also a former door-to-door sales representative. On July 27, 2016, the Court granted Omarali’s request forcertification, but refused to certify Omarali’s request for damages on an aggregate basis and refused to certify Omarali’s request forpunitive damages. Omarali’s motion for summary judgment was dismissed in its entirety on June 21, 2019. The matter was set fortrial in November 2021. However, pursuant to the CCAA Proceedings, these proceedings have been stayed. Just Energy denies theallegations and will vigorously defend against these claims, if they proceed.
On July 23, 2019, Just Energy announced that, as part of its Strategic Review process, management identified customer enrolmentand non-payment issues, primarily in Texas. In response to this announcement, and in some cases in response to this and othersubsequent related announcements, putative class action lawsuits were filed in the United States District Court for the SouthernDistrict of New York, in the United States District Court for the Southern District of Texas and in the Ontario Court, on behalf ofinvestors that purchased Just Energy Group Inc. securities during various periods, ranging from November 9, 2017 through August 19,2019. The U.S. lawsuits have been consolidated in the United States District Court for the Southern District of Texas with one leadplaintiff and the Ontario lawsuits have been consolidated with one lead plaintiff. The U.S. lawsuit seeks damages allegedly arising fromviolations of the United States Securities Exchange Act. The Ontario lawsuit seeks damages allegedly arising from violations ofCanadian securities legislation and of common law. The Ontario lawsuit was subsequently amended to, among other things, extendthe period to July 7, 2020. On September 2, 2020, pursuant to Just Energy’s plan of arrangement, the Superior Court of Justice(Ontario) ordered that all existing equity class action claimants shall be irrevocably and forever limited solely to recovery from theproceeds of the insurance policies payable on behalf of Just Energy or its directors and officers in respect of any such existing equityclass action claims, and such existing equity class action claimants shall have no right to, and shall not, directly or indirectly, makeany claim or seek any recoveries from any of the released parties or any of their respective current or former officers and directors inrespect of any existing equity class action claims, other than enforcing their rights to be paid by the applicable insurer(s) from theproceeds of the applicable insurance policies. Pursuant to the CCAA Proceedings, these proceedings have been stayed. Just Energydenies the allegations and will vigorously defend against these claims if they proceed.
MANAGEMENT’S DISCUSSION AND ANALYSIS
2022 SECOND QUARTER REPORT TO SHAREHOLDERS | JUST ENERGY 23

Controls and proceduresDISCLOSURE CONTROLS AND PROCEDURESBoth the chief executive officer (“CEO”) and chief financial officer (“CFO”) have designed, or caused to be designed under theirsupervision, the Company’s disclosure controls and procedures which provide reasonable assurance that: (i) material informationrelating to the Company is made known to management by others, particularly during the period in which the annual and interimfilings are being prepared; and (ii) information required to be disclosed by the Company in its annual and interim filings or otherreports filed or submitted under securities legislation is recorded, processed, summarized and reported within the time periodspecified in securities legislation. The CEO and CFO are assisted in this responsibility by a Disclosure Committee composed of seniormanagement. The Disclosure Committee has established procedures so that it becomes aware of any material information affectingJust Energy to evaluate and communicate this information to management, including the CEO and CFO as appropriate, anddetermine the appropriateness and timing of any required disclosure. Based on the foregoing evaluation, conducted by or underthe supervision of the CEO and CFO of the Company’s Internal Control over Financial Reporting (“ICFR”) in connection with theCompany’s financial year-end, it was concluded that because of the material weakness described below, the Company’s disclosurecontrols and procedures were not effective.
INTERNAL CONTROL OVER FINANCIAL REPORTINGManagement used the criteria set forth by the Committee of Sponsoring Organizations of the Treadway Commission (“COSO”) inInternal Control-Integrated Framework (2013) to evaluate the effectiveness of its ICFR as at March 31, 2021. The COSO frameworksummarizes each of the components of a company’s internal control system, including the: (i) control environment; (ii) control activities(process-level controls); (iii) risk assessment; (iv) information and communication; and (v) monitoring activities. The COSO frameworkdefines a material weakness as a deficiency, or combination of deficiencies, that results in a reasonable possibility that a materialmisstatement of the annual or Interim Condensed Consolidated Financial Statements will not be prevented or detected on a timelybasis.
Identification and ongoing remediation of material weakness within financial statement close processManagement’s evaluation of ICFR identified an ongoing material weakness resulting from the failure to operate several controlswithin the financial statement close process that allowed errors to manifest, and, the failure to detect them for an extended periodof time, as follows:
Previous Identification of control activities material weakness within financial statement close processThe Company did not design or maintain effective control activities to prevent or detect misstatements during the operation of thefinancial statement close process, including from finalization of the trial balance to the preparation of financial statements.
Ongoing remediation of previously identified control activities material weakness associated with financial statement closeprocessManagement remains committed to the planning and implementation of remediation efforts to address the material weaknesses,as well as to foster improvement in the Company’s internal controls. These remediation efforts continue and are intended to addressthis identified material weakness and enhance the overall financial control environment. During the year ended March 31, 2021,management further increased the amount of personnel to perform the financial statement close process, including the hiring of aCFO and a controller, both with significant financial reporting and retail energy industry experience, promoting individuals within theteam and training those individuals to perform their enhanced roles, and strengthening the managerial review process of thefinancial statement preparation. Management will continue to enhance the control environment and assess if the Company requiresadditional control and accounting individuals to operate the controls as designed, and provide additional training as required.These enhancements remain ongoing, and management continues strengthening the design and operational effectiveness of thefinancial statement preparation process; however, not enough time has elapsed to complete remediation efforts of this materialweakness.
No assurance can be provided at this time that the actions and remediation efforts the Company has taken or will implement willeffectively remediate the material weaknesses described above or prevent the incidence of other significant deficiencies or materialweaknesses in the Company’s internal controls over financial reporting in the future. The design of any system of controls is basedin part upon certain assumptions about the likelihood of future events, and there can be no assurance that any design will succeed inachieving the stated goals under all potential future conditions.
Other changes in internal control over financial reportingOther than as described above, there were no changes in ICFR during the last fiscal quarter that materially affected, or are reasonablylikely to materially affect, ICFR.
MANAGEMENT’S DISCUSSION AND ANALYSIS
24 JUST ENERGY | 2022 SECOND QUARTER REPORT TO SHAREHOLDERS

INHERENT LIMITATIONSA control system, no matter how well conceived and operated, can only provide reasonable, not absolute, assurance that itsobjectives are met. Due to these inherent limitations in such systems, no evaluation of controls can provide absolute assurance thatall control issues within any company have been detected. Accordingly, Just Energy’s disclosure controls and procedures are designedto provide reasonable, not absolute, assurance that the Company’s disclosure control and procedure objectives are met.
Corporate governanceJust Energy is committed to maintaining transparency in its operations and ensuring its approach to governance meets allrecommended standards. Full disclosure of Just Energy’s compliance with existing corporate governance rules is available atinvestors.justenergy.com https://investors.justenergy.com/and is included in Just Energy’s Management Proxy Circular. Just Energyactively monitors the corporate governance and disclosure environment to ensure timely compliance with current and futurerequirements.
MANAGEMENT’S DISCUSSION AND ANALYSIS
2022 SECOND QUARTER REPORT TO SHAREHOLDERS | JUST ENERGY 25

Interim condensed consolidated statementsof financial position(unaudited in thousands of Canadian dollars)
Notes
As atSeptember 30,
2021(Unaudited)
As atMarch 31,
2021(Audited)
ASSETSCurrent assets
Cash and cash equivalents $ 199,952 $ 215,989Restricted cash 3,265 1,139Trade and other receivables, net 4(a) 401,633 340,201Gas in storage 26,005 2,993Fair value of derivative financial assets 6 461,899 25,026Income taxes recoverable 10,626 8,238Other current assets 5(a) 155,855 163,405
1,259,235 756,991Non-current assets
Investments 16(a) 61,889 32,889Property and equipment, net 15,732 17,827Intangible assets, net 68,026 70,723Goodwill 163,945 163,770Fair value of derivative financial assets 6 115,606 10,600Deferred income tax assets 7,599 3,744Other non-current assets 5(b) 41,506 35,262
474,303 334,815TOTAL ASSETS $ 1,733,538 $ 1,091,806LIABILITIESCurrent liabilities
Trade and other payables 7 $ 1,024,383 $ 921,595Deferred revenue 9,373 1,408Income taxes payable 3,637 4,126Fair value of derivative financial liabilities 6 17,695 13,977Provisions 835 6,786Current portion of long-term debt 8 630,491 654,180
1,686,414 1,602,072Non-current liabilities
Long-term debt 8 358 1,560Fair value of derivative financial liabilities 6 13,262 61,169Deferred income tax liabilities 6,773 2,749Other non-current liabilities 14,155 19,078
34,548 84,556TOTAL LIABILITIES $ 1,720,962 $ 1,686,628SHAREHOLDERS’ EQUITY (DEFICIT)
Shareholders’ capital 11 $ 1,537,863 $ 1,537,863Contributed deficit (10,607) (11,634)Accumulated deficit (1,610,320) (2,211,728)Accumulated other comprehensive income 96,030 91,069Non-controlling interest (390) (392)
TOTAL SHAREHOLDERS’ EQUITY (DEFICIT) 12,576 (594,822)TOTAL LIABILITIES AND SHAREHOLDERS’ EQUITY (DEFICIT) $ 1,733,538 $ 1,091,806
Basis of presentation (Note 3)
Commitments and contingencies (Note 15)
See accompanying notes to the Interim Condensed Consolidated Financial Statements
Scott GahnChief Executive Officer and President
Stephen SchaeferCorporate Director
F-1 JUST ENERGY | 2022 SECOND QUARTER REPORT TO SHAREHOLDERS
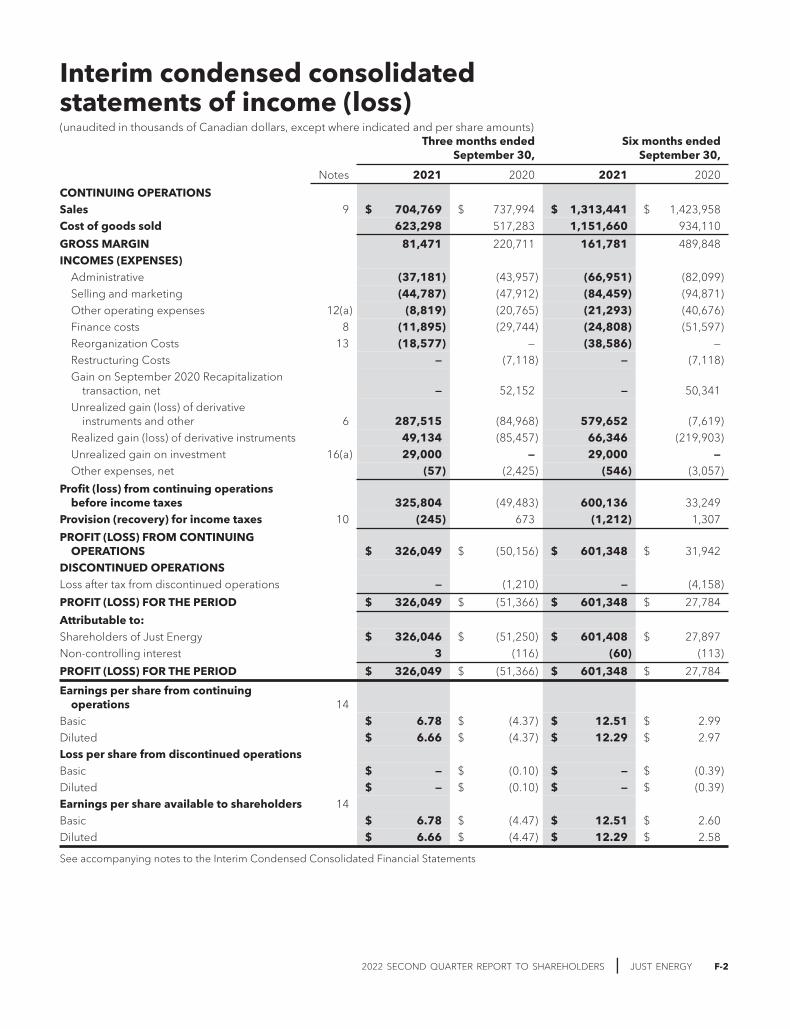
Interim condensed consolidatedstatements of income (loss)(unaudited in thousands of Canadian dollars, except where indicated and per share amounts)
Three months endedSeptember 30,
Six months endedSeptember 30,
Notes 2021 2020 2021 2020
CONTINUING OPERATIONSSales 9 $ 704,769 $ 737,994 $ 1,313,441 $ 1,423,958Cost of goods sold 623,298 517,283 1,151,660 934,110
GROSS MARGIN 81,471 220,711 161,781 489,848INCOMES (EXPENSES)
Administrative (37,181) (43,957) (66,951) (82,099)Selling and marketing (44,787) (47,912) (84,459) (94,871)Other operating expenses 12(a) (8,819) (20,765) (21,293) (40,676)Finance costs 8 (11,895) (29,744) (24,808) (51,597)Reorganization Costs 13 (18,577) — (38,586) —Restructuring Costs — (7,118) — (7,118)Gain on September 2020 Recapitalization
transaction, net — 52,152 — 50,341Unrealized gain (loss) of derivative
instruments and other 6 287,515 (84,968) 579,652 (7,619)Realized gain (loss) of derivative instruments 49,134 (85,457) 66,346 (219,903)Unrealized gain on investment 16(a) 29,000 — 29,000 —Other expenses, net (57) (2,425) (546) (3,057)
Profit (loss) from continuing operationsbefore income taxes 325,804 (49,483) 600,136 33,249
Provision (recovery) for income taxes 10 (245) 673 (1,212) 1,307
PROFIT (LOSS) FROM CONTINUINGOPERATIONS $ 326,049 $ (50,156) $ 601,348 $ 31,942
DISCONTINUED OPERATIONSLoss after tax from discontinued operations — (1,210) — (4,158)
PROFIT (LOSS) FOR THE PERIOD $ 326,049 $ (51,366) $ 601,348 $ 27,784
Attributable to:Shareholders of Just Energy $ 326,046 $ (51,250) $ 601,408 $ 27,897Non-controlling interest 3 (116) (60) (113)
PROFIT (LOSS) FOR THE PERIOD $ 326,049 $ (51,366) $ 601,348 $ 27,784
Earnings per share from continuingoperations 14
Basic $ 6.78 $ (4.37) $ 12.51 $ 2.99Diluted $ 6.66 $ (4.37) $ 12.29 $ 2.97Loss per share from discontinued operationsBasic $ — $ (0.10) $ — $ (0.39)Diluted $ — $ (0.10) $ — $ (0.39)Earnings per share available to shareholders 14Basic $ 6.78 $ (4.47) $ 12.51 $ 2.60Diluted $ 6.66 $ (4.47) $ 12.29 $ 2.58
See accompanying notes to the Interim Condensed Consolidated Financial Statements
2022 SECOND QUARTER REPORT TO SHAREHOLDERS | JUST ENERGY F-2
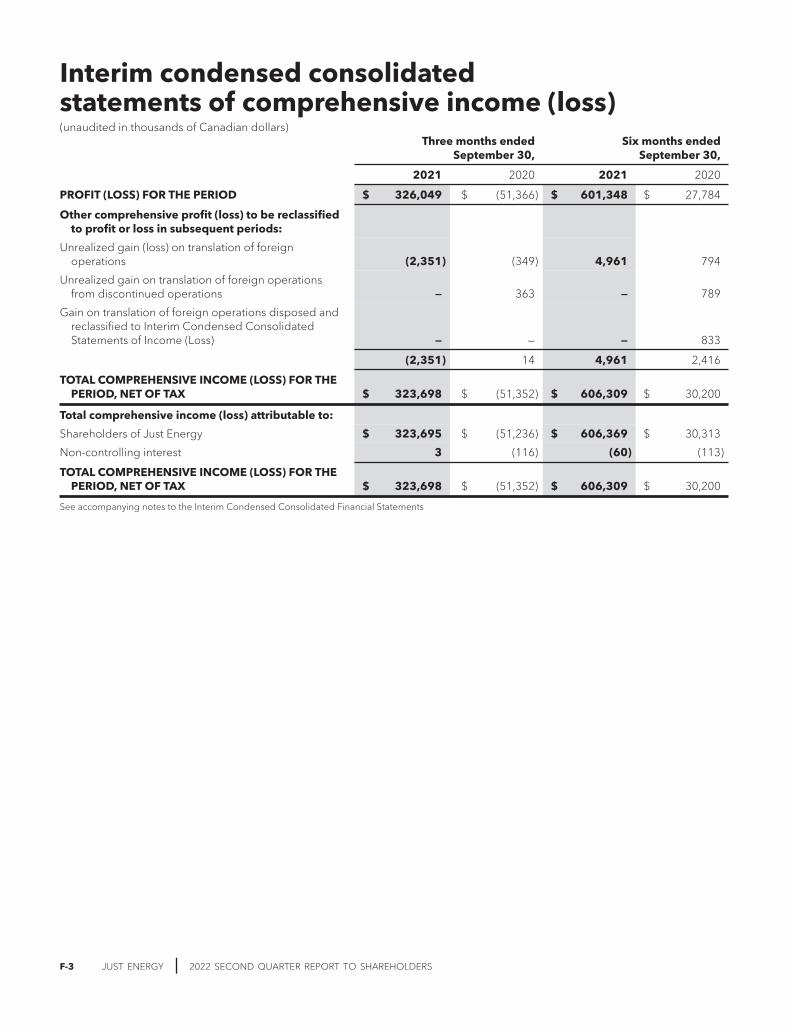
Interim condensed consolidatedstatements of comprehensive income (loss)(unaudited in thousands of Canadian dollars)
Three months endedSeptember 30,
Six months endedSeptember 30,
2021 2020 2021 2020
PROFIT (LOSS) FOR THE PERIOD $ 326,049 $ (51,366) $ 601,348 $ 27,784
Other comprehensive profit (loss) to be reclassifiedto profit or loss in subsequent periods:
Unrealized gain (loss) on translation of foreignoperations (2,351) (349) 4,961 794
Unrealized gain on translation of foreign operationsfrom discontinued operations — 363 — 789
Gain on translation of foreign operations disposed andreclassified to Interim Condensed ConsolidatedStatements of Income (Loss) — — — 833
(2,351) 14 4,961 2,416
TOTAL COMPREHENSIVE INCOME (LOSS) FOR THEPERIOD, NET OF TAX $ 323,698 $ (51,352) $ 606,309 $ 30,200
Total comprehensive income (loss) attributable to:
Shareholders of Just Energy $ 323,695 $ (51,236) $ 606,369 $ 30,313
Non-controlling interest 3 (116) (60) (113)
TOTAL COMPREHENSIVE INCOME (LOSS) FOR THEPERIOD, NET OF TAX $ 323,698 $ (51,352) $ 606,309 $ 30,200
See accompanying notes to the Interim Condensed Consolidated Financial Statements
F-3 JUST ENERGY | 2022 SECOND QUARTER REPORT TO SHAREHOLDERS

Interim condensed consolidated statementsof changes in shareholders’ deficit(unaudited in thousands of Canadian dollars)
Six months endedSeptember 30,
2021 2020
ATTRIBUTABLE TO THE SHAREHOLDERSAccumulated earningsAccumulated earnings (loss), beginning of period $ (261,702) $ 140,446Profit for the period as reported, attributable to shareholders 601,408 27,897
Accumulated earnings, end of period $ 339,706 $ 168,343
DIVIDENDS AND DISTRIBUTIONSDividends and distributions, beginning of period (1,950,026) (1,950,003)Dividends and distributions declared and paid — (23)
Dividends and distributions, end of period $(1,950,026) $(1,950,026)
ACCUMULATED DEFICIT $(1,610,320) $(1,781,683)
ACCUMULATED OTHER COMPREHENSIVE INCOMEAccumulated other comprehensive income, beginning of period $ 91,069 $ 84,651Other comprehensive income 4,961 2,416
Accumulated other comprehensive income, end of period $ 96,030 $ 87,067
SHAREHOLDERS’ CAPITALCommon sharesCommon shares, beginning of period 11 $ 1,537,863 $ 1,099,864Issuance of shares-September 2020 Recapitalization — 438,642Issuance cost associated with September 2020 Recapitalization — (1,572)Share-based units exercised — 176
Common shares, end of period $ 1,537,863 $ 1,537,110
Preferred sharesPreferred shares, beginning of period 11 $ — $ 146,965Settled with common shares — (146,965)
Preferred shares, end of period $ — $ —
SHAREHOLDERS’ CAPITAL $ 1,537,863 $ 1,537,110
EQUITY COMPONENT OF CONVERTIBLE DEBENTURESBalance, beginning of period $ — $ 13,029Settled with common share — (13,029)
Balance, end of period $ — $ —
CONTRIBUTED DEFICITBalance, beginning of period $ (11,634) $ (29,826)Add: Share-based compensation expense 12(a) 1,027 4,122
Transferred from equity component — 13,029Less: Share-based units exercised — (176)
Non-cash deferred share grants — 23
Balance, end of period $ (10,607) $ (12,828)
NON-CONTROLLING INTERESTBalance, beginning of period $ (392) $ (414)Foreign exchange impact on non-controlling interest 62 112Loss attributable to non-controlling interest (60) (113)
Balance, end of period $ (390) $ (415)
TOTAL SHAREHOLDERS’ EQUITY (DEFICIT) $ 12,576 $ (170,749)
See accompanying notes to the Interim Condensed Consolidated Financial Statements
2022 SECOND QUARTER REPORT TO SHAREHOLDERS | JUST ENERGY F-4
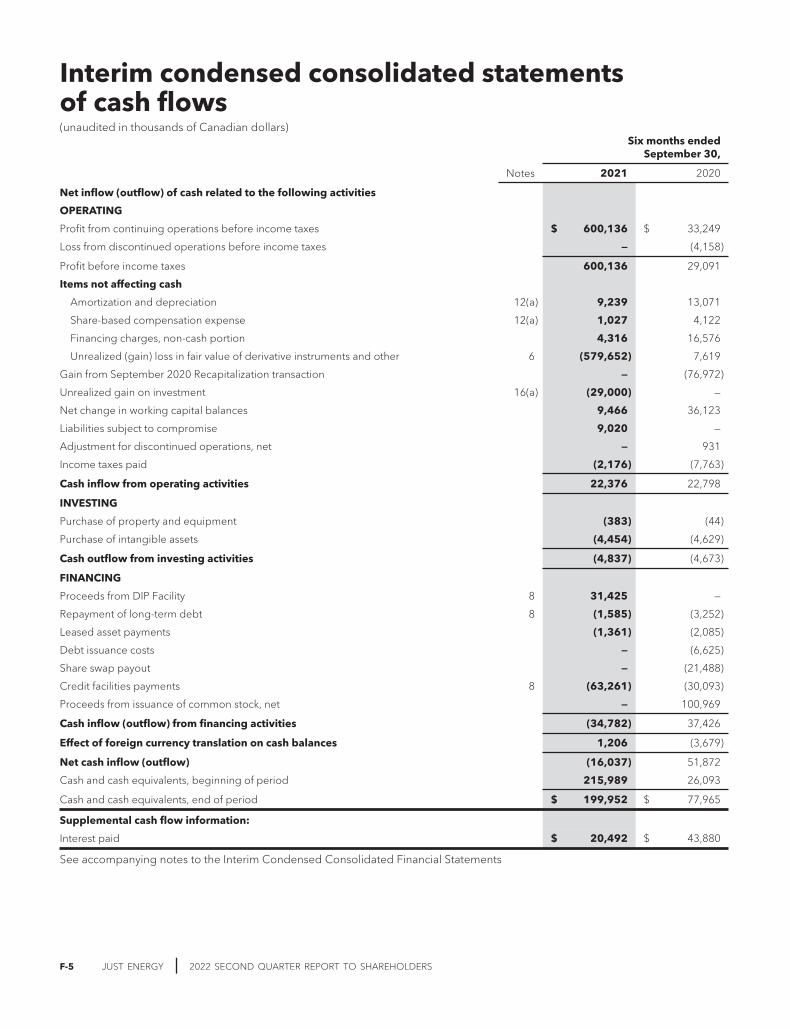
Interim condensed consolidated statementsof cash flows(unaudited in thousands of Canadian dollars)
Six months endedSeptember 30,
Notes 2021 2020
Net inflow (outflow) of cash related to the following activities
OPERATING
Profit from continuing operations before income taxes $ 600,136 $ 33,249
Loss from discontinued operations before income taxes — (4,158)
Profit before income taxes 600,136 29,091
Items not affecting cash
Amortization and depreciation 12(a) 9,239 13,071
Share-based compensation expense 12(a) 1,027 4,122
Financing charges, non-cash portion 4,316 16,576
Unrealized (gain) loss in fair value of derivative instruments and other 6 (579,652) 7,619
Gain from September 2020 Recapitalization transaction — (76,972)
Unrealized gain on investment 16(a) (29,000) —
Net change in working capital balances 9,466 36,123
Liabilities subject to compromise 9,020 —
Adjustment for discontinued operations, net — 931
Income taxes paid (2,176) (7,763)
Cash inflow from operating activities 22,376 22,798
INVESTING
Purchase of property and equipment (383) (44)
Purchase of intangible assets (4,454) (4,629)
Cash outflow from investing activities (4,837) (4,673)
FINANCING
Proceeds from DIP Facility 8 31,425 —
Repayment of long-term debt 8 (1,585) (3,252)
Leased asset payments (1,361) (2,085)
Debt issuance costs — (6,625)
Share swap payout — (21,488)
Credit facilities payments 8 (63,261) (30,093)
Proceeds from issuance of common stock, net — 100,969
Cash inflow (outflow) from financing activities (34,782) 37,426
Effect of foreign currency translation on cash balances 1,206 (3,679)
Net cash inflow (outflow) (16,037) 51,872
Cash and cash equivalents, beginning of period 215,989 26,093
Cash and cash equivalents, end of period $ 199,952 $ 77,965
Supplemental cash flow information:
Interest paid $ 20,492 $ 43,880
See accompanying notes to the Interim Condensed Consolidated Financial Statements
F-5 JUST ENERGY | 2022 SECOND QUARTER REPORT TO SHAREHOLDERS

Notes to the interim condensed consolidatedfinancial statements(unaudited in thousands of Canadian dollars, except where indicated and per share amounts)
1. ORGANIZATIONJust Energy Group Inc. (“Just Energy” or the “Company”) is a corporation established under the laws of Canada to hold securitiesof its directly or indirectly owned operating subsidiaries and affiliates. The registered office of Just Energy is First CanadianPlace, 100 King Street West, Toronto, Ontario, Canada. The Interim Condensed Consolidated Financial Statements consist ofJust Energy and its subsidiaries and affiliates. The Interim Condensed Consolidated Financial Statements were approved by theBoard of Directors on November 9, 2021.
In February 2021, the State of Texas experienced extremely cold weather (the “Weather Event”). The Weather Event led toincreased electricity demand and sustained high prices from February 13, 2021 through February 20, 2021. As a result of thelosses sustained and without sufficient liquidity to pay the corresponding invoices from the Electric Reliability Council of Texas, Inc.(“ERCOT”) when due, and accordingly, on March 9, 2021, Just Energy applied for and received creditor protection under theCompanies’ Creditors Arrangement Act (Canada) (“CCAA”) from the Ontario Superior Court of Justice (Commercial List) (the“Ontario Court”) and under Chapter 15 (“Chapter 15”) of the Bankruptcy Code in the United States from the Bankruptcy Court ofthe Southern District of Texas, Houston Division (the “Court Orders” or “CCAA Proceedings”). Protection under the CourtOrders allows Just Energy to operate while it restructures its capital structure.
As part of the CCAA filing, the Company entered into a USD $125 million Debtor-In-Possession (“DIP Facility”) financing withcertain affiliates of Pacific Investment Management Company (“PIMCO”). The Company entered into Qualifying SupportAgreements with its largest commodity supplier and ISO services provider. The Company entered a Lender Support Agreementwith the lenders under its Credit Facility (refer to Note 8(c)). The filings and associated USD $125 million DIP Facility arrangedby the Company, enabled Just Energy to continue all operations without interruption throughout the United States (“U.S.”) andCanada and to continue making payments required by ERCOT and satisfy other regulatory obligations.
On September 15, 2021, the stay period under the CCAA Proceedings was extended by the Ontario Court to December 17,2021.
In connection with the CCAA Proceedings, the Company identified the following obligations that are subject to compromise:
Amounts in000’s
Trade and other payables $ 551,076
Other non-current liabilities 9,815
Current portion of long-term debt 471,542
Total liabilities subject to compromise $ 1,032,433
On September 15, 2021, the Ontario Court approved the Company’s request to establish a claims process to identify anddetermine claims against the Company and its subsidiaries that are subject to the ongoing CCAA Proceedings. As a result ofthe establishment of the claims process, additional claims may be made against the Company and ultimately determined that arenot currently reflected in the Interim Condensed Financial Statements.
The common shares of the Company are listed on the TSX Venture Exchange, under the symbol “JE” and on the OTC PinkMarket under the symbol “JENGQ”.
On June 16, 2021, Texas House Bill 4492 (“HB 4492”) became law in Texas. HB 4492 provides a mechanism for recovery of(i) ancillary service charges above USD $9,000/MWh during the Weather Event; (ii) reliability deployment price adders chargedby the ERCOT during the Weather Event; and (iii) amounts owed to ERCOT due to defaults of competitive market participants,which were subsequently “short-paid” to market participants, including Just Energy, (collectively, the “Costs”), incurred by variousparties, including the Company, during the Weather Event, through certain securitization structures.
On July 16, 2021, ERCOT filed the request with the Public Utility Commission of Texas (the “Commission”) and on October 13,2021, the Commission issued its final order (the “PUCT Order”). The ultimate amount of proceeds that Just Energy will receive hasnot been fully determined, as entities eligible to opt-out have until November 29, 2021 to decide pursuant to the PUCT Order.However, Just Energy anticipates that it will recover at least USD $100 million of Costs with such proceeds expected to be receivedin the fourth quarter of fiscal year 2022. The total amount that the Company may recover through the PUCT Order may changematerially based on a number of factors, including the entities that decide to opt-out, the outcome of the dispute resolutionprocess initiated by the Company with ERCOT, and any potential challenges to the PUCT Order. There is no assurance thatthe Company will be able to recover all of the Costs.
2022 SECOND QUARTER REPORT TO SHAREHOLDERS | JUST ENERGY F-6

2. OPERATIONSJust Energy is a retail energy provider specializing in electricity and natural gas commodities and bringing energy efficientsolutions, carbon offsets and renewable energy options to customers. Operating in the U.S. and Canada, Just Energy servesboth residential and commercial customers, providing homes and businesses with a broad range of energy solutions that delivercomfort, convenience and control. Just Energy is the parent company of Amigo Energy, Filter Group Inc. (“Filter Group”),Hudson Energy, Interactive Energy Group, Tara Energy and Terrapass.
Just Energy’s current commodity product offerings include fixed, variable, index and flat rate options. By fixing the price ofelectricity or natural gas under its fixed-price or price-protected program contracts for a period of up to five years, Just Energy’scustomers offset their exposure to changes in the price of these essential commodities. Variable rate products allow customersto maintain flexibility while retaining the ability to lock into a fixed price at their discretion. Flat-bill products allow customers to paya flat rate each month regardless of usage. Just Energy derives its gross margin from the difference between the price at whichit is able to sell the commodities to its customers and the related price at which it purchases the associated volumes from itssuppliers.
Just Energy offers green products through Terrapass and its JustGreen program. Green products offered through Terrapassallow customers to offset their carbon footprint without buying energy commodity products and can be offered in all states andprovinces without being dependent on energy deregulation. The JustGreen electricity product offers customers the option ofhaving all or a portion of their electricity sourced from renewable green sources such as wind, solar, hydropower or biomass, viapower purchase agreements and renewable energy certificates. The JustGreen gas product offers carbon offset credits thatallow customers to reduce or eliminate the carbon footprint of their homes or businesses. Through the Filter Group, Just Energyprovides subscription-based home water filtration systems to residential customers, including under-counter and whole-homewater filtration solutions. Just Energy markets its product offerings through multiple sales channels including digital, retail, door-to-door, brokers and affinity relationships.
3. FINANCIAL STATEMENT PRESENTATION
(a) Compliance with IFRSThese Interim Condensed Consolidated Financial Statements have been prepared in accordance with International AccountingStandard (“IAS”) 34, Interim Financial Reporting, as issued by the International Accounting Standards Board (“IASB”), utilizingthe accounting policies Just Energy outlined in its March 31, 2021 annual audited consolidated financial statements, except theadoption of new International Financial Reporting Standards (“IFRS”). Accordingly, certain information and footnote disclosuresnormally included in the March 31, 2021 annual audited consolidated financial statements prepared in accordance with IFRS, asissued by the IASB, have been omitted or condensed.
(b) Basis of presentation and interim reportingThese Interim Condensed Consolidated Financial Statements should be read in conjunction with and follow the same accountingpolicies and methods of application as those used in the March 31, 2021 annual audited consolidated financial statements.
The comparative Interim Condensed Consolidated Financial Statements have been corrected from the interim statementspreviously presented to conform to the presentation of the current Interim Condensed Consolidated Financial Statements.
The Interim Condensed Consolidated Financial Statements are presented in Canadian dollars, the functional currency of JustEnergy, and all values are rounded to the nearest thousands, except where otherwise indicated. The Interim CondensedConsolidated Financial Statements are prepared on a going concern basis under the historical cost convention, except forcertain financial assets and liabilities that are stated at fair value.
The interim operating results are not necessarily indicative of the results that may be expected for the full fiscal year endingMarch 31, 2022, due to seasonal variations resulting in fluctuations in quarterly results. Gas consumption by customers is typicallyhighest in October through March and lowest in April through September. Electricity consumption is typically highest inJanuary through March and July through September and lowest in October through December and April through June.
Principles of consolidationThe Interim Condensed Consolidated Financial Statements include the accounts of Just Energy and its directly or indirectlyowned subsidiaries and affiliates as at September 30, 2021. Subsidiaries and affiliates are consolidated from the date ofacquisition and control and continue to be consolidated until the date that such control ceases. The financial statements of thesubsidiaries and affiliates are prepared for the same reporting period as Just Energy using consistent accounting policies. Allintercompany balances, sales, expenses and unrealized gains and losses resulting from intercompany transactions areeliminated on consolidation.
NOTES TO THE INTERIM CONDENSED CONSOLIDATED FINANCIAL STATEMENTS
F-7 JUST ENERGY | 2022 SECOND QUARTER REPORT TO SHAREHOLDERS

Going ConcernDue to the Weather Event and associated CCAA filing, the Company’s ability to continue as a going concern for the next12 months is dependent on the Company emerging from CCAA protection, maintain liquidity, complying with DIP Facilitycovenants and extending the DIP Facility maturity. The material uncertainties arising from the CCAA filings cast substantial doubtupon the Company’s ability to continue as a going concern and, accordingly the ultimate appropriateness of the use ofaccounting principles applicable to a going concern. These Interim Condensed Consolidated Financial Statements do notreflect the adjustments to carrying values of assets and liabilities and the reported expenses and Interim Condensed ConsolidatedStatements of Financial Position classifications that would be necessary if the going concern assumption was deemedinappropriate. These adjustments could be material. There can be no assurance that the Company will be successful in emergingfrom CCAA as a going concern.
(c) Significant accounting judgments, estimates, and assumptionsThe preparation of the Interim Condensed Consolidated Financial Statements requires the use of estimates and assumptions tobe made in applying the accounting policies that affect the reported amount of assets, liabilities, income and expenses. Theestimates and related assumptions based on previous experience and other factors are considered reasonable under thecircumstances, the results of which form the basis for making the assumptions about carrying values of assets and liabilities thatare not readily apparent from other sources. There have been no material changes from the disclosures from the March 31,2021 annual audited consolidated financial statements and notes to the March 31, 2021 annual audited consolidated financialstatements with respect to significant accounting judgments, estimates and assumptions.
4. TRADE AND OTHER RECEIVABLES, NET
(a) Trade and other receivables, netAs at
September 30,2021
As atMarch 31,
2021
Trade account receivables, net $ 192,502 $ 189,250
Unbilled revenue, net 108,499 103,986
Accrued gas receivable — 833
Other 100,632 46,132
$ 401,633 $ 340,201
(b) Aging of accounts receivable
Customer credit riskThe lifetime expected credit loss (“ECL”) reflects Just Energy’s best estimate of losses on the accounts receivable and unbilledrevenue balances. Just Energy determines the ECL by using historical loss rates and forward-looking factors, if applicable. JustEnergy is exposed to customer credit risk on its continuing operations in Alberta, Texas, Illinois (gas), California (gas) and Ohio(electricity) and for certain Commercial customers in dual-billing markets including Illinois (power), Pennsylvania (power),Massachusetts (power), New York and New Jersey. Credit review processes have been implemented to perform creditevaluations of customers and manage customer default. If a significant number of customers were to default on their payments,it could have a material adverse effect on the operations and cash flows of Just Energy. Management factors default fromcredit risk in its margin expectations for all of the above markets.
In the remaining markets, the LDCs provide collection services and assume the risk of any bad debts owing from Just Energy’scustomers for a fee that is recorded in cost of goods sold. Although there is no assurance that the LDCs providing these serviceswill continue to do so in the future, management believes that the risk of the LDCs failing to deliver payment to Just Energy isminimal.
NOTES TO THE INTERIM CONDENSED CONSOLIDATED FINANCIAL STATEMENTS
2022 SECOND QUARTER REPORT TO SHAREHOLDERS | JUST ENERGY F-8
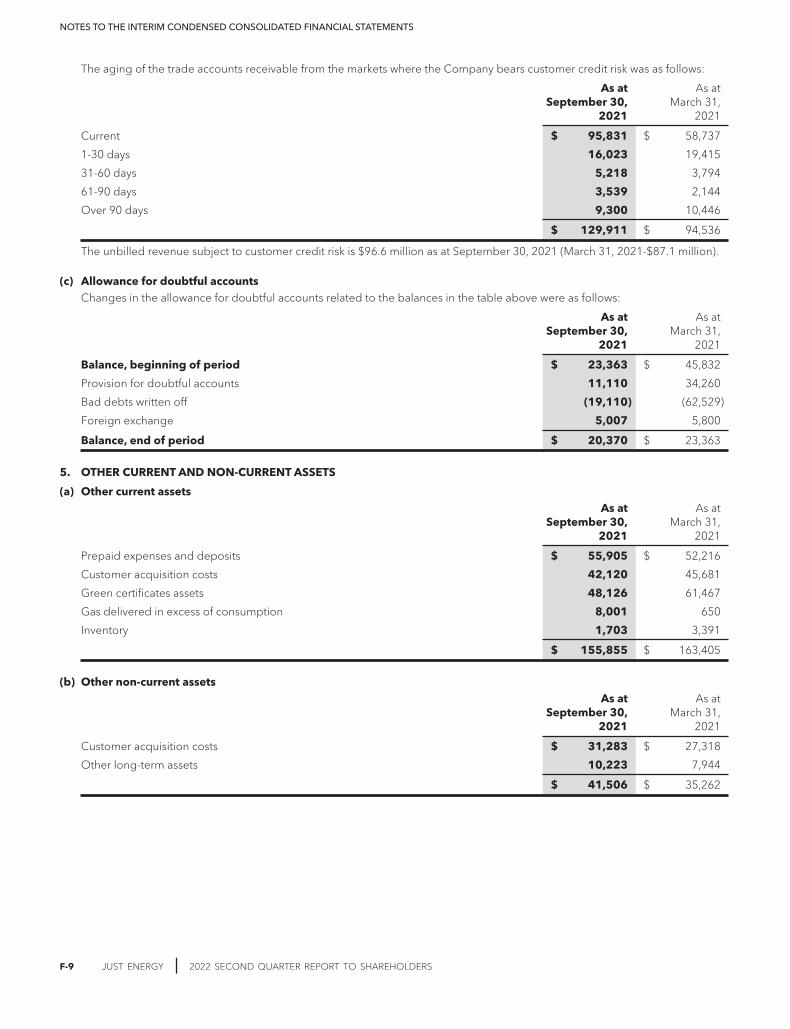
The aging of the trade accounts receivable from the markets where the Company bears customer credit risk was as follows:
As atSeptember 30,
2021
As atMarch 31,
2021
Current $ 95,831 $ 58,737
1-30 days 16,023 19,415
31-60 days 5,218 3,794
61-90 days 3,539 2,144
Over 90 days 9,300 10,446
$ 129,911 $ 94,536
The unbilled revenue subject to customer credit risk is $96.6 million as at September 30, 2021 (March 31, 2021-$87.1 million).
(c) Allowance for doubtful accountsChanges in the allowance for doubtful accounts related to the balances in the table above were as follows:
As atSeptember 30,
2021
As atMarch 31,
2021
Balance, beginning of period $ 23,363 $ 45,832
Provision for doubtful accounts 11,110 34,260
Bad debts written off (19,110) (62,529)
Foreign exchange 5,007 5,800
Balance, end of period $ 20,370 $ 23,363
5. OTHER CURRENT AND NON-CURRENT ASSETS
(a) Other current assetsAs at
September 30,2021
As atMarch 31,
2021
Prepaid expenses and deposits $ 55,905 $ 52,216
Customer acquisition costs 42,120 45,681
Green certificates assets 48,126 61,467
Gas delivered in excess of consumption 8,001 650
Inventory 1,703 3,391
$ 155,855 $ 163,405
(b) Other non-current assetsAs at
September 30,2021
As atMarch 31,
2021
Customer acquisition costs $ 31,283 $ 27,318
Other long-term assets 10,223 7,944
$ 41,506 $ 35,262
NOTES TO THE INTERIM CONDENSED CONSOLIDATED FINANCIAL STATEMENTS
F-9 JUST ENERGY | 2022 SECOND QUARTER REPORT TO SHAREHOLDERS

6. FINANCIAL INSTRUMENTS
(a) Fair value of derivative financial instruments and otherThe fair value of financial instruments is the price that would be received to sell an asset or paid to transfer a liability in anorderly transaction between market participants at the measurement date (i.e., an exit price). Management has estimated thevalue of financial swaps, physical forwards and option contracts for electricity, natural gas, carbon offsets and renewable energycertificates (“RECs”), and generation and transmission capacity contracts using a discounted cash flow method, which employsmarket forward curves that are either directly sourced from third parties or developed internally based on third-party market data.These curves can be volatile, thus leading to volatility in the mark to market with no immediate impact to cash flows. Gasoptions and green power options have been valued using the Black option pricing model using the applicable market forwardcurves and the implied volatility from other market traded options. Management periodically uses non-exchange-traded swapagreements based on cooling degree days (“CDDs”) and heating degree days (“HDDs”) measured in its utility service territoriesto reduce the impact of weather volatility on Just Energy’s electricity and natural gas volumes, commonly referred to as “weatherderivatives”. The fair value of these swaps on a given measurement station indicated in the derivative contract is determinedby calculating the difference between the agreed strike and expected variable observed at the same station.
The following table illustrates unrealized gains (losses) related to Just Energy’s derivative financial instruments classified as fairvalue through profit or loss and recorded on the Interim Condensed Consolidated Statements of Financial Position as fair valueof derivative financial assets and fair value of derivative financial liabilities, with their offsetting values recorded in unrealizedgain (loss) in fair value of derivative instruments and other on the Interim Condensed Consolidated Statements of Income.
Three months endedSeptember 30,
Six months endedSeptember 30,
2021 2020 2021 2020
Physical forward contracts and options (i) $ 133,822 $ (115,147) $ 359,128 $ (66,767)
Financial swap contracts and options (ii) 155,093 42,544 221,487 70,665
Foreign exchange forward contracts 597 (3,028) 1,702 (9,079)
Unrealized foreign exchange on Term Loan (6,393) — (2,245) —
Unrealized foreign exchange on the 6.5%convertible bond and 8.75% loan transferred torealized foreign exchange resulting from theSeptember 2020 Recapitalization — (12,218) — —
Weather derivatives (iii) (192) 1,769 (1,896) (612)
Other derivative options 4,588 1,112 1,476 (1,826)
Unrealized gain of derivative instruments andother $ 287,515 $ (84,968) $ 579,652 $ (7,619)
The following table summarizes certain aspects of the fair value of derivative financial assets and liabilities recorded in theInterim Condensed Consolidated Statements of Financial Position as at September 30, 2021:
Financialassets
(current)
Financialassets
(non-current)
Financialliabilities(current)
Financialliabilities
(non-current)
Physical forward contracts and options (i) $ 291,433 $ 56,555 $ 16,403 $ 11,861
Financial swap contracts and options (ii) 166,201 58,940 1,292 1,397
Foreign exchange forward contracts 1,414 16 — —
Other derivative options 2,851 95 — 4
As at September 30, 2021 $ 461,899 $ 115,606 $ 17,695 $ 13,262
NOTES TO THE INTERIM CONDENSED CONSOLIDATED FINANCIAL STATEMENTS
2022 SECOND QUARTER REPORT TO SHAREHOLDERS | JUST ENERGY F-10
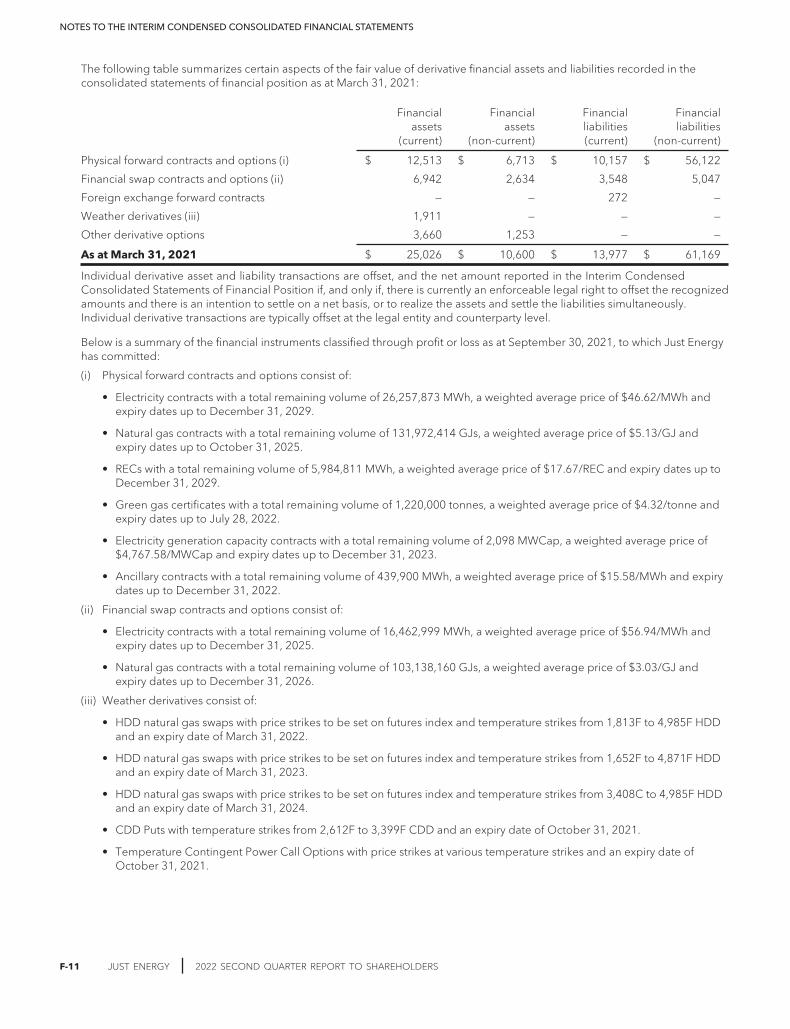
The following table summarizes certain aspects of the fair value of derivative financial assets and liabilities recorded in theconsolidated statements of financial position as at March 31, 2021:
Financialassets
(current)
Financialassets
(non-current)
Financialliabilities(current)
Financialliabilities
(non-current)
Physical forward contracts and options (i) $ 12,513 $ 6,713 $ 10,157 $ 56,122
Financial swap contracts and options (ii) 6,942 2,634 3,548 5,047
Foreign exchange forward contracts — — 272 —
Weather derivatives (iii) 1,911 — — —
Other derivative options 3,660 1,253 — —
As at March 31, 2021 $ 25,026 $ 10,600 $ 13,977 $ 61,169
Individual derivative asset and liability transactions are offset, and the net amount reported in the Interim CondensedConsolidated Statements of Financial Position if, and only if, there is currently an enforceable legal right to offset the recognizedamounts and there is an intention to settle on a net basis, or to realize the assets and settle the liabilities simultaneously.Individual derivative transactions are typically offset at the legal entity and counterparty level.
Below is a summary of the financial instruments classified through profit or loss as at September 30, 2021, to which Just Energyhas committed:
(i) Physical forward contracts and options consist of:
• Electricity contracts with a total remaining volume of 26,257,873 MWh, a weighted average price of $46.62/MWh andexpiry dates up to December 31, 2029.
• Natural gas contracts with a total remaining volume of 131,972,414 GJs, a weighted average price of $5.13/GJ andexpiry dates up to October 31, 2025.
• RECs with a total remaining volume of 5,984,811 MWh, a weighted average price of $17.67/REC and expiry dates up toDecember 31, 2029.
• Green gas certificates with a total remaining volume of 1,220,000 tonnes, a weighted average price of $4.32/tonne andexpiry dates up to July 28, 2022.
• Electricity generation capacity contracts with a total remaining volume of 2,098 MWCap, a weighted average price of$4,767.58/MWCap and expiry dates up to December 31, 2023.
• Ancillary contracts with a total remaining volume of 439,900 MWh, a weighted average price of $15.58/MWh and expirydates up to December 31, 2022.
(ii) Financial swap contracts and options consist of:
• Electricity contracts with a total remaining volume of 16,462,999 MWh, a weighted average price of $56.94/MWh andexpiry dates up to December 31, 2025.
• Natural gas contracts with a total remaining volume of 103,138,160 GJs, a weighted average price of $3.03/GJ andexpiry dates up to December 31, 2026.
(iii) Weather derivatives consist of:
• HDD natural gas swaps with price strikes to be set on futures index and temperature strikes from 1,813F to 4,985F HDDand an expiry date of March 31, 2022.
• HDD natural gas swaps with price strikes to be set on futures index and temperature strikes from 1,652F to 4,871F HDDand an expiry date of March 31, 2023.
• HDD natural gas swaps with price strikes to be set on futures index and temperature strikes from 3,408C to 4,985F HDDand an expiry date of March 31, 2024.
• CDD Puts with temperature strikes from 2,612F to 3,399F CDD and an expiry date of October 31, 2021.
• Temperature Contingent Power Call Options with price strikes at various temperature strikes and an expiry date ofOctober 31, 2021.
NOTES TO THE INTERIM CONDENSED CONSOLIDATED FINANCIAL STATEMENTS
F-11 JUST ENERGY | 2022 SECOND QUARTER REPORT TO SHAREHOLDERS

These derivative financial instruments create a credit risk for Just Energy since they have been transacted with a limited numberof counterparties. Should any counterparty be unable to fulfill its obligations under the contracts, Just Energy may not be ableto realize the financial assets’ balance recognized in the Interim Condensed Consolidated Financial Statements.
Fair value (“FV”) hierarchy of derivatives
Level 1The fair value measurements are classified as Level 1 in the FV hierarchy if the fair value is determined using quoted unadjustedmarket prices. Currently there are no derivatives carried in this level.
Level 2Fair value measurements that require observable inputs other than quoted prices in Level 1, either directly or indirectly, areclassified as Level 2 in the FV hierarchy. This could include the use of statistical techniques to derive the FV curve from observablemarket prices. However, in order to be classified under Level 2, significant inputs must be directly or indirectly observable inthe market. Just Energy values its New York Mercantile Exchange (“NYMEX”) financial gas fixed-for-floating swaps under Level 2.
Level 3Fair value measurements that require unobservable market data or use statistical techniques to derive forward curves fromobservable market data and unobservable inputs are classified as Level 3 in the FV hierarchy. For the electricity supply contracts,Just Energy uses quoted market prices as per available market forward data and applies a price-shaping profile to calculatethe monthly prices from annual strips and hourly prices from block strips for the purposes of mark to market calculations. Theprofile is based on historical settlements with counterparties or with the system operator and is considered an unobservable inputfor the purposes of establishing the level in the FV hierarchy.
For the natural gas supply contracts, Just Energy uses three different market observable curves: (i) commodity (predominatelyNYMEX), (ii) basis and (iii) foreign exchange. NYMEX curves extend for over five years (thereby covering the length of Just Energy’scontracts); however, most basis curves extend only 12 to 15 months into the future. In order to calculate basis curves for theremaining years, Just Energy uses extrapolation, which leads natural gas supply contracts to be classified under Level 3.
Weather derivatives are non-exchange-traded financial instruments used as part of a risk management strategy to mitigate theimpact adverse weather conditions have on gross margin. The fair values of the derivatives are determined using an internallydeveloped model that relies upon both observable inputs and significant unobservable inputs. Accordingly, the fair values ofthese derivatives are classified as Level 3. Market and contractual inputs to these models vary by contract type and would typicallyinclude notional amounts, reference weather stations, strike prices, temperature strike values, terms to expiration, historicalweather data and historical commodity prices. The historical weather data and commodity prices were utilized to value theexpected payouts with respect to weather derivatives and, as a result, are the most significant assumptions contributing to thedetermination of fair value estimates, and changes in these inputs can result in a significantly higher or lower fair valuemeasurement.
Just Energy’s accounting policy is to recognize transfers between levels of the fair value hierarchy on the date of the event orchange in circumstances that caused the transfer.
Fair value measurement input sensitivityThe main cause of changes in the fair value of derivative instruments is changes in the forward curve prices used for the fairvalue calculations. Just Energy provides a sensitivity analysis of these forward curves under the “Market risk” section of this note.Other inputs, including volatility and correlations, are driven off historical settlements.
The following table illustrates the classification of derivative financial assets (liabilities) in the FV hierarchy as at September 30,2021:
Level 1 Level 2 Level 3 Total
Derivative financial assets $ — $ 124,859 $ 452,646 $ 577,505
Derivative financial liabilities — — (30,957) (30,957)
Total net derivative financial assets $ — $ 124,859 $ 421,689 $ 546,548
The following table illustrates the classification of derivative financial assets (liabilities) in the FV hierarchy as at March 31, 2021:
Level 1 Level 2 Level 3 Total
Derivative financial assets $ — $ 682 $ 34,944 $ 35,626
Derivative financial liabilities — — (75,146) (75,146)
Total net derivative financial liabilities $ — $ 682 $ (40,202) $ (39,520)
NOTES TO THE INTERIM CONDENSED CONSOLIDATED FINANCIAL STATEMENTS
2022 SECOND QUARTER REPORT TO SHAREHOLDERS | JUST ENERGY F-12
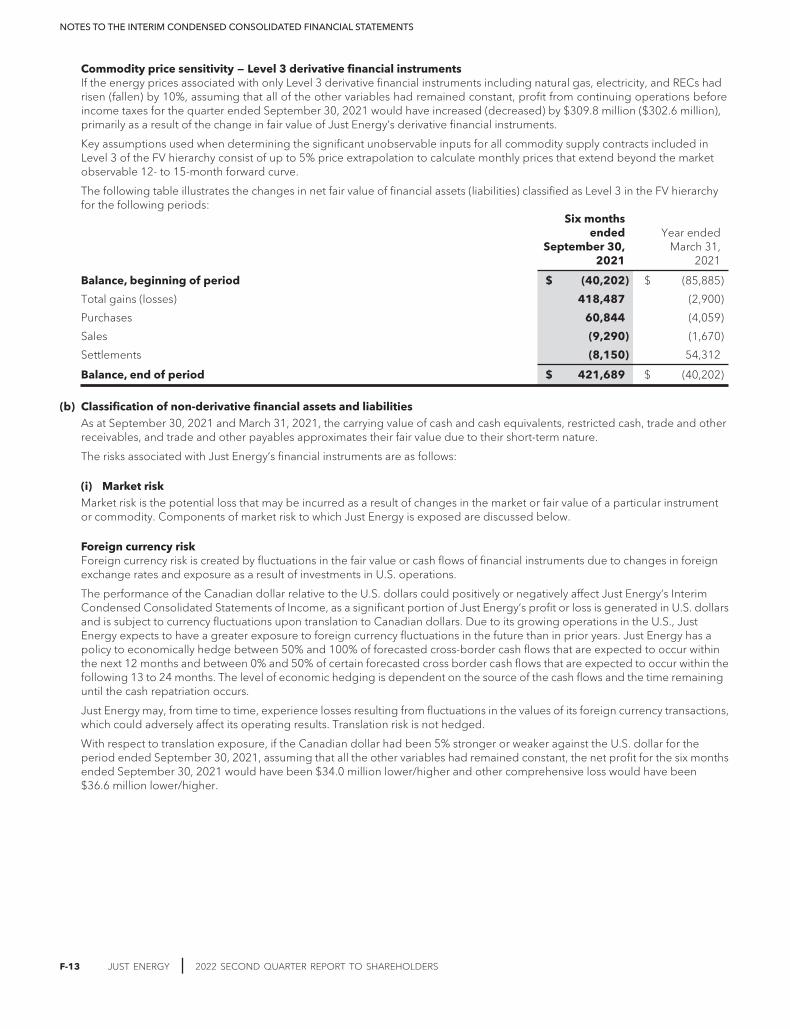
Commodity price sensitivity — Level 3 derivative financial instrumentsIf the energy prices associated with only Level 3 derivative financial instruments including natural gas, electricity, and RECs hadrisen (fallen) by 10%, assuming that all of the other variables had remained constant, profit from continuing operations beforeincome taxes for the quarter ended September 30, 2021 would have increased (decreased) by $309.8 million ($302.6 million),primarily as a result of the change in fair value of Just Energy’s derivative financial instruments.
Key assumptions used when determining the significant unobservable inputs for all commodity supply contracts included inLevel 3 of the FV hierarchy consist of up to 5% price extrapolation to calculate monthly prices that extend beyond the marketobservable 12- to 15-month forward curve.
The following table illustrates the changes in net fair value of financial assets (liabilities) classified as Level 3 in the FV hierarchyfor the following periods:
Six monthsended
September 30,2021
Year endedMarch 31,
2021
Balance, beginning of period $ (40,202) $ (85,885)
Total gains (losses) 418,487 (2,900)
Purchases 60,844 (4,059)
Sales (9,290) (1,670)
Settlements (8,150) 54,312
Balance, end of period $ 421,689 $ (40,202)
(b) Classification of non-derivative financial assets and liabilitiesAs at September 30, 2021 and March 31, 2021, the carrying value of cash and cash equivalents, restricted cash, trade and otherreceivables, and trade and other payables approximates their fair value due to their short-term nature.
The risks associated with Just Energy’s financial instruments are as follows:
(i) Market riskMarket risk is the potential loss that may be incurred as a result of changes in the market or fair value of a particular instrumentor commodity. Components of market risk to which Just Energy is exposed are discussed below.
Foreign currency riskForeign currency risk is created by fluctuations in the fair value or cash flows of financial instruments due to changes in foreignexchange rates and exposure as a result of investments in U.S. operations.
The performance of the Canadian dollar relative to the U.S. dollars could positively or negatively affect Just Energy’s InterimCondensed Consolidated Statements of Income, as a significant portion of Just Energy’s profit or loss is generated in U.S. dollarsand is subject to currency fluctuations upon translation to Canadian dollars. Due to its growing operations in the U.S., JustEnergy expects to have a greater exposure to foreign currency fluctuations in the future than in prior years. Just Energy has apolicy to economically hedge between 50% and 100% of forecasted cross-border cash flows that are expected to occur withinthe next 12 months and between 0% and 50% of certain forecasted cross border cash flows that are expected to occur within thefollowing 13 to 24 months. The level of economic hedging is dependent on the source of the cash flows and the time remaininguntil the cash repatriation occurs.
Just Energy may, from time to time, experience losses resulting from fluctuations in the values of its foreign currency transactions,which could adversely affect its operating results. Translation risk is not hedged.
With respect to translation exposure, if the Canadian dollar had been 5% stronger or weaker against the U.S. dollar for theperiod ended September 30, 2021, assuming that all the other variables had remained constant, the net profit for the six monthsended September 30, 2021 would have been $34.0 million lower/higher and other comprehensive loss would have been$36.6 million lower/higher.
NOTES TO THE INTERIM CONDENSED CONSOLIDATED FINANCIAL STATEMENTS
F-13 JUST ENERGY | 2022 SECOND QUARTER REPORT TO SHAREHOLDERS
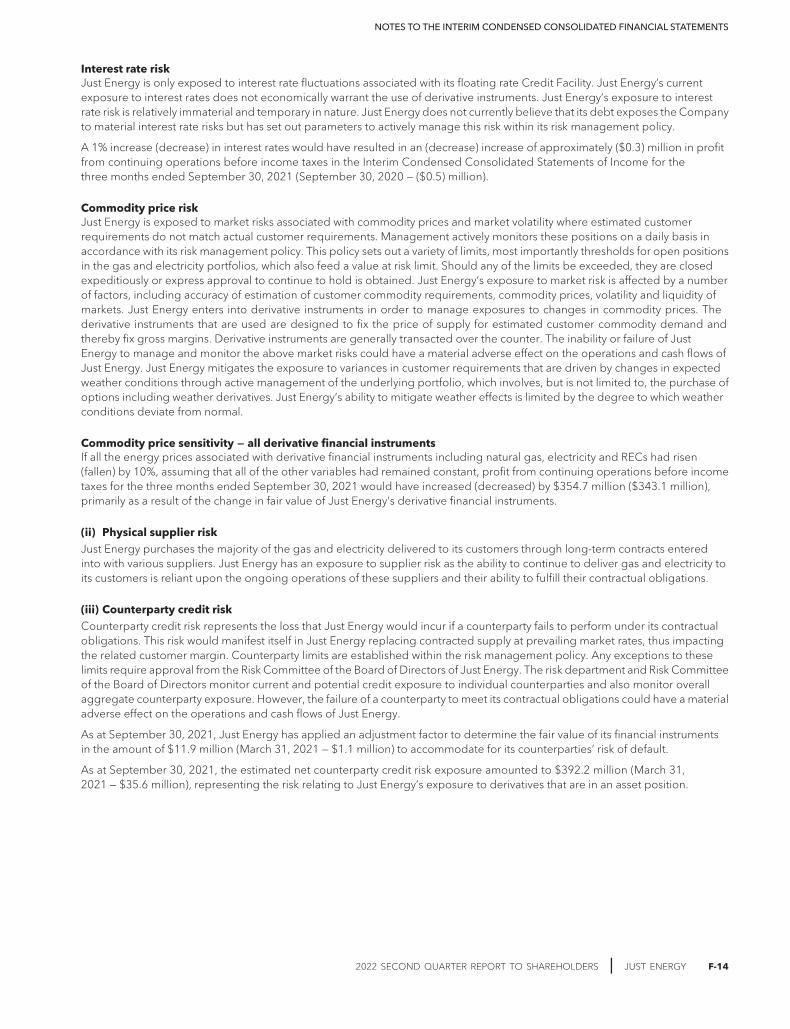
Interest rate riskJust Energy is only exposed to interest rate fluctuations associated with its floating rate Credit Facility. Just Energy’s currentexposure to interest rates does not economically warrant the use of derivative instruments. Just Energy’s exposure to interestrate risk is relatively immaterial and temporary in nature. Just Energy does not currently believe that its debt exposes the Companyto material interest rate risks but has set out parameters to actively manage this risk within its risk management policy.
A 1% increase (decrease) in interest rates would have resulted in an (decrease) increase of approximately ($0.3) million in profitfrom continuing operations before income taxes in the Interim Condensed Consolidated Statements of Income for thethree months ended September 30, 2021 (September 30, 2020 — ($0.5) million).
Commodity price riskJust Energy is exposed to market risks associated with commodity prices and market volatility where estimated customerrequirements do not match actual customer requirements. Management actively monitors these positions on a daily basis inaccordance with its risk management policy. This policy sets out a variety of limits, most importantly thresholds for open positionsin the gas and electricity portfolios, which also feed a value at risk limit. Should any of the limits be exceeded, they are closedexpeditiously or express approval to continue to hold is obtained. Just Energy’s exposure to market risk is affected by a numberof factors, including accuracy of estimation of customer commodity requirements, commodity prices, volatility and liquidity ofmarkets. Just Energy enters into derivative instruments in order to manage exposures to changes in commodity prices. Thederivative instruments that are used are designed to fix the price of supply for estimated customer commodity demand andthereby fix gross margins. Derivative instruments are generally transacted over the counter. The inability or failure of JustEnergy to manage and monitor the above market risks could have a material adverse effect on the operations and cash flows ofJust Energy. Just Energy mitigates the exposure to variances in customer requirements that are driven by changes in expectedweather conditions through active management of the underlying portfolio, which involves, but is not limited to, the purchase ofoptions including weather derivatives. Just Energy’s ability to mitigate weather effects is limited by the degree to which weatherconditions deviate from normal.
Commodity price sensitivity — all derivative financial instrumentsIf all the energy prices associated with derivative financial instruments including natural gas, electricity and RECs had risen(fallen) by 10%, assuming that all of the other variables had remained constant, profit from continuing operations before incometaxes for the three months ended September 30, 2021 would have increased (decreased) by $354.7 million ($343.1 million),primarily as a result of the change in fair value of Just Energy’s derivative financial instruments.
(ii) Physical supplier riskJust Energy purchases the majority of the gas and electricity delivered to its customers through long-term contracts enteredinto with various suppliers. Just Energy has an exposure to supplier risk as the ability to continue to deliver gas and electricity toits customers is reliant upon the ongoing operations of these suppliers and their ability to fulfill their contractual obligations.
(iii) Counterparty credit riskCounterparty credit risk represents the loss that Just Energy would incur if a counterparty fails to perform under its contractualobligations. This risk would manifest itself in Just Energy replacing contracted supply at prevailing market rates, thus impactingthe related customer margin. Counterparty limits are established within the risk management policy. Any exceptions to theselimits require approval from the Risk Committee of the Board of Directors of Just Energy. The risk department and Risk Committeeof the Board of Directors monitor current and potential credit exposure to individual counterparties and also monitor overallaggregate counterparty exposure. However, the failure of a counterparty to meet its contractual obligations could have a materialadverse effect on the operations and cash flows of Just Energy.
As at September 30, 2021, Just Energy has applied an adjustment factor to determine the fair value of its financial instrumentsin the amount of $11.9 million (March 31, 2021 — $1.1 million) to accommodate for its counterparties’ risk of default.
As at September 30, 2021, the estimated net counterparty credit risk exposure amounted to $392.2 million (March 31,2021 — $35.6 million), representing the risk relating to Just Energy’s exposure to derivatives that are in an asset position.
NOTES TO THE INTERIM CONDENSED CONSOLIDATED FINANCIAL STATEMENTS
2022 SECOND QUARTER REPORT TO SHAREHOLDERS | JUST ENERGY F-14
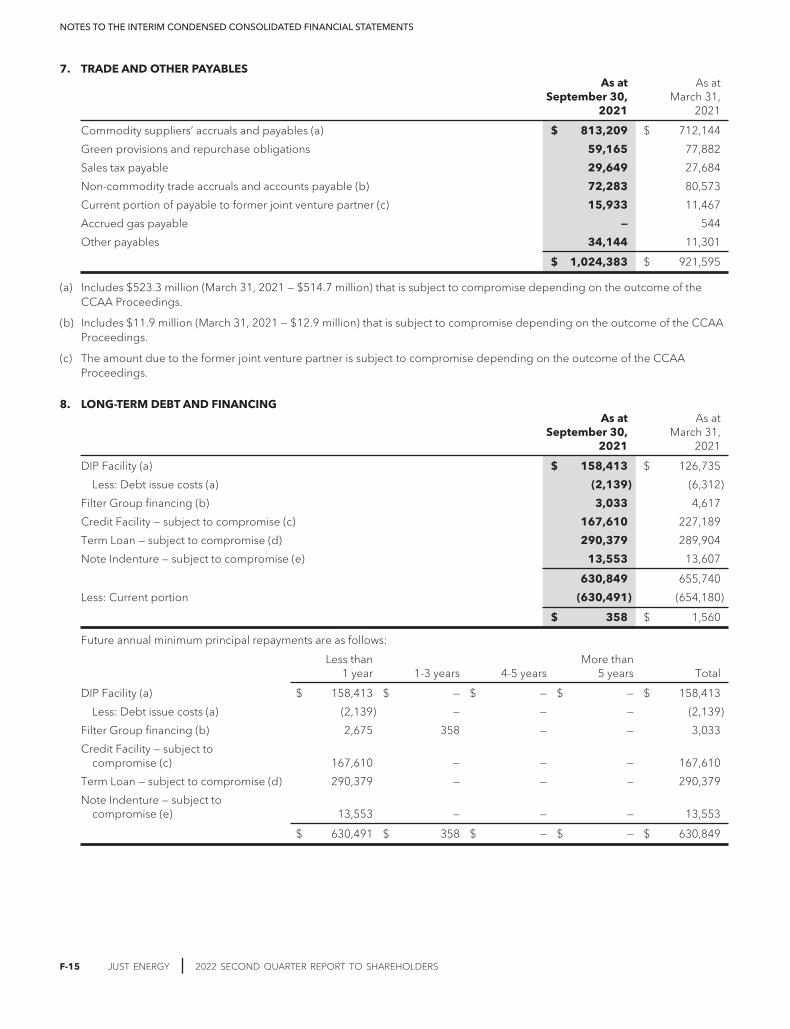
7. TRADE AND OTHER PAYABLESAs at
September 30,2021
As atMarch 31,
2021
Commodity suppliers’ accruals and payables (a) $ 813,209 $ 712,144
Green provisions and repurchase obligations 59,165 77,882
Sales tax payable 29,649 27,684
Non-commodity trade accruals and accounts payable (b) 72,283 80,573
Current portion of payable to former joint venture partner (c) 15,933 11,467
Accrued gas payable — 544
Other payables 34,144 11,301
$ 1,024,383 $ 921,595
(a) Includes $523.3 million (March 31, 2021 — $514.7 million) that is subject to compromise depending on the outcome of theCCAA Proceedings.
(b) Includes $11.9 million (March 31, 2021 — $12.9 million) that is subject to compromise depending on the outcome of the CCAAProceedings.
(c) The amount due to the former joint venture partner is subject to compromise depending on the outcome of the CCAAProceedings.
8. LONG-TERM DEBT AND FINANCINGAs at
September 30,2021
As atMarch 31,
2021
DIP Facility (a) $ 158,413 $ 126,735
Less: Debt issue costs (a) (2,139) (6,312)
Filter Group financing (b) 3,033 4,617
Credit Facility — subject to compromise (c) 167,610 227,189
Term Loan — subject to compromise (d) 290,379 289,904
Note Indenture — subject to compromise (e) 13,553 13,607
630,849 655,740
Less: Current portion (630,491) (654,180)
$ 358 $ 1,560
Future annual minimum principal repayments are as follows:
Less than1 year 1-3 years 4-5 years
More than5 years Total
DIP Facility (a) $ 158,413 $ — $ — $ — $ 158,413
Less: Debt issue costs (a) (2,139) — — — (2,139)
Filter Group financing (b) 2,675 358 — — 3,033
Credit Facility — subject tocompromise (c) 167,610 — — — 167,610
Term Loan — subject to compromise (d) 290,379 — — — 290,379
Note Indenture — subject tocompromise (e) 13,553 — — — 13,553
$ 630,491 $ 358 $ — $ — $ 630,849
NOTES TO THE INTERIM CONDENSED CONSOLIDATED FINANCIAL STATEMENTS
F-15 JUST ENERGY | 2022 SECOND QUARTER REPORT TO SHAREHOLDERS

The following table details the finance costs for the period ended September 30. Interest is expensed based on the effectiveinterest rate.
Three months endedSeptember 30,
Six months endedSeptember 30,
2021 2020 2021 2020
DIP Facility (a) $ 7,298 $ — $ 14,398 $ —
Filter Group financing (b) 80 169 176 375
Credit Facility (c) 4,517 5,382 10,234 10,517
8.75% term loan (f) — 8,791 — 18,055
6.75% $100M convertible debentures (g) — 2,354 — 4,762
6.75% $160M convertible debentures (h) — 3,452 — 6,948
6.5% convertible bonds (i) — 261 — 536
Supplier finance and others — 9,335 — 10,404
$ 11,895 $ 29,744 $ 24,808 $ 51,597
(a) As discussed in Note 1, Just Energy filed and received the Court Order under the CCAA on March 9, 2021. In conjunction withthe CCAA filing, the Company entered into the DIP Facility for USD $125 million. Just Energy Ontario L.P., Just Energy Group Inc.and Just Energy (U.S.) Corp. are the borrowers under the DIP Facility and are supported by guarantees of certain subsidiariesand affiliates and secured by a super-priority charge against and attaching to the property that secures the obligations arisingunder the Credit Facility, created by the Court Order. The DIP Facility has an interest rate of 13%, paid quarterly in arrears. The DIPFacility terminates at the earlier of: (a) December 31, 2021 (further described in note 16), (b) the implementation date of theCCAA plan, (c) the lifting of the stay in the CCAA proceedings or (d) the termination of the CCAA proceedings. For considerationfor making the DIP Facility available, Just Energy paid a 1% origination fee and a 1% commitment fee.
(b) Filter Group has a $3.0 million outstanding loan payable to Home Trust Company (“HTC”). The loan is a result of factoringreceivables to finance the cost of rental equipment that matures no later than October 2023 with HTC and bears interest at8.99% per annum. Principal and interest are payable monthly. Filter Group did not file under the CCAA and accordingly, thestay does not apply to Filter Group and any amounts outstanding under the loan payable to Home Trust Company.
(c) On March 18, 2021, Just Energy Ontario L.P, Just Energy (U.S.) Corp. and Just Energy Group Inc. entered into an Accommodationand Support Agreement (the “Lender Support Agreement”) with the lenders under the Credit Facility. Under the LenderSupport Agreement, the lenders agreed to allow issuance or renewals of Letters of Credit under the Credit Facility during thependency of the CCAA proceedings within certain restrictions. In return, the Company has agreed to continue paying interest andfees at the non-default rate on the outstanding advances and Letters of Credit under the Credit Facility. The amount of Lettersof Credit that may be issued is limited to the lesser of $46.1 million (excluding the Letters of Credit guaranteed by ExportDevelopment Canada under its Account Performance Security Guarantee Program), plus any amount the Company has repaidand $125 million. As at September 30, 2021, the Company had repaid $64.6 million and had a total of $107.8 million ofLetters of Credit outstanding.
Certain amounts outstanding under the Letter of Credit Facility (“LC Facility”) are guaranteed by Export Development Canadaunder its Account Performance Security Guarantee Program. As at September 30, 2021, the Company had $52.7 million of Lettersof Credit outstanding and Letter of Credit capacity of $6.2 million available under the LC Facility. Just Energy’s obligationsunder the Credit Facility are supported by guarantees of certain subsidiaries and affiliates and secured by a general securityagreement and a pledge of the assets and securities of Just Energy and the majority of its operating subsidiaries and affiliatesexcluding, primarily the Filter Group. Just Energy has also entered into an inter-creditor agreement in which certain commodityand hedge providers are also secured by the same collateral. As a result of the CCAA filing, the borrowers are in defaultunder the Credit Facility. However, any potential actions by the lenders have been stayed pursuant to the Court Order.
The outstanding Advances are all Prime rate advances at a rate of bank prime (Canadian bank prime rate or U.S. prime rate)plus 4.25% and letters of credit are at a rate of 5.25%.
As at September 30, 2021, the Canadian prime rate was 2.45% and the U.S. prime rate was 3.25%.
As a result of the CCAA filing, the Credit Facility has been reclassified to short-term reflecting the potential acceleration of thedebt allowed under the Credit Facility.
NOTES TO THE INTERIM CONDENSED CONSOLIDATED FINANCIAL STATEMENTS
2022 SECOND QUARTER REPORT TO SHAREHOLDERS | JUST ENERGY F-16

(d) As part of the recapitalization transaction that the Company completed in September 2020 (“September 2020 Recapitalization”),Just Energy issued a USD $205.9 million principal note (the “Term Loan”) maturing on March 31, 2024. The note bears interestat 10.25%. The balance at September 30, 2021 includes an accrual of $13.4 million for interest payable on the notes. As a result ofthe CCAA filing, the Company is in default under the Term Loan. However, any potential actions by the lenders under theTerm Loan have been stayed pursuant to the Court Order, and the Company is not issuing additional notes equal to thecapitalized interest. Given this acceleration option, the Term Loan has been classified as current.
(e) As part of the September 2020 Recapitalization, Just Energy issued $15 million principal amount of 7.0% subordinated notes(“Note Indenture”) to holders of the subordinated convertible debentures, which has a six-year maturity. The principal amount wasreduced through a tender offer for no consideration on October 19, 2020 to $13.2 million. The Note Indenture bears anannual interest rate of 7.0% payable in kind. The balance at September 30, 2021 includes an accrual of $0.4 million for interestpayable on the notes. As a result of the CCAA filing, the Company is in default under the Note Indenture’s Trust Indentureagreement. However, any potential actions by the lenders under the Note Indenture have been stayed pursuant to the CourtOrder and the Company is not issuing additional notes equal to the capitalized interest. Given this acceleration option, theNote Indenture has been classified as current.
(f) As part of the September 2020 Recapitalization, the 8.75% loan was exchanged for its pro-rata share of the Term Loan and786,982 common shares. At the time of the September 2020 Recapitalization, the 8.75% loan had USD $207.0 million outstandingplus accrued interest.
(g) As part of the September 2020 Recapitalization, the 6.75% $100M convertible debentures were exchanged for 3,592,069common shares along with its pro-rata share of the Note Indenture and the payment of accrued interest.
(h) As part of the September 2020 Recapitalization, the 6.75% $160M convertible debentures were exchanged for 5,747,310common shares along with its pro-rata share of the Note Indenture and the payment of accrued interest.
(i) As part of the September 2020 Recapitalization, the 6.5% convertible bonds were exchanged for its pro-rata share of the TermLoan and 35,737 common shares. At the time of the September 2020 Recapitalization, $9.2 million of the 6.5% convertible bondswere outstanding plus accrued interest.
9. REPORTABLE BUSINESS SEGMENTSJust Energy’s reportable segments are the Mass Market (formerly called Consumer) and the Commercial segments.
The chief operating decision maker monitors the operational results of the Mass Market and Commercial segments for thepurpose of making decisions about resource allocation and performance assessment. Segment performance is evaluated basedon certain non-IFRS measures such as Base EBITDA, Base Gross Margin and Embedded Gross Margin as defined in theCompany’s Management Discussion and Analysis.
Transactions between segments are in the normal course of operations and are recorded at the exchange amount.
Corporate and shared services report the costs related to management oversight of the business units, public reporting andfilings, corporate governance and other shared services functions such as Human Resources, Finance and Information Technology.
For the three months ended September 30, 2021:
Mass Market Commercial
Corporateand shared
services Consolidated
Sales $ 401,491 $ 303,278 $ — $ 704,769Cost of goods sold 339,323 283,975 — 623,298Gross margin 62,168 19,303 — 81,471Depreciation and amortization 3,882 828 — 4,710Administrative expenses 10,348 3,761 23,072 37,181Selling and marketing expenses 29,167 15,620 — 44,787Other operating expenses 3,995 114 — 4,109Segment profit (loss) $ 14,776 $ (1,020) $ (23,072) $ (9,316)Finance costs (11,895)Unrealized gain of derivative instruments and other 287,515Realized gain of derivative instruments 49,134Other expense, net (57)Unrealized gain on investment 29,000Reorganization Costs (18,577)Provision for income taxes 245Profit for the period $ 326,049Capital expenditures $ 2,567 $ 461 $ — $ 3,028As at September 30, 2021Total goodwill $ 163,945 $ — $ — $ 163,945
NOTES TO THE INTERIM CONDENSED CONSOLIDATED FINANCIAL STATEMENTS
F-17 JUST ENERGY | 2022 SECOND QUARTER REPORT TO SHAREHOLDERS

For the three months ended September 30, 2020:
Mass Market Commercial
Corporateand shared
services Consolidated
Sales $ 419,340 $ 318,654 $ — $ 737,994Cost of goods sold 265,848 251,435 — 517,283Gross margin 153,492 67,219 — 220,711Depreciation and amortization 4,773 900 — 5,673Administrative expenses 9,892 4,153 29,912 43,957Selling and marketing expenses 29,666 18,246 — 47,912Other operating expenses 11,954 3,138 — 15,092Segment profit (loss) $ 97,207 $ 40,782 $ (29,912) $ 108,077Finance costs (29,744)Restructuring Costs (7,118)Gain on September 2020 Recapitalization
transaction, net 52,152Unrealized loss of derivative instruments and other (84,968)Realized loss of derivative instruments (85,457)Other expense, net (2,425)Provision for income taxes (673)Loss from continuing operations $ (50,156)Loss from discontinued operations (1,210)Loss for the period (51,366)Capital expenditures $ 2,695 $ 292 $ — $ 2,987
For the six months ended September 30, 2021:
Mass Market Commercial
Corporateand shared
services Consolidated
Sales $ 716,477 $ 596,964 $ — $ 1,313,441Cost of goods sold 594,820 556,840 — 1,151,660Gross margin 121,657 40,124 — 161,781Depreciation and amortization 7,521 1,635 — 9,156Administrative expenses 19,501 7,100 40,350 66,951Selling and marketing expenses 54,299 30,160 — 84,459Other operating expenses 11,033 1,104 — 12,137Segment profit for the period $ 29,303 $ 125 $ (40,350) $ (10,922)Finance costs (24,808)Unrealized gain of derivative instruments and other 579,652Realized gain of derivative instruments 66,346Other expense, net (546)Unrealized gain on investment 29,000Reorganization Costs (38,586)Provision for income taxes 1,212Profit for the period $ 601,348Capital expenditures $ 4,341 $ 496 $ — $ 4,837As at September 30, 2021Total goodwill $ 163,945 $ — $ — $ 163,945
NOTES TO THE INTERIM CONDENSED CONSOLIDATED FINANCIAL STATEMENTS
2022 SECOND QUARTER REPORT TO SHAREHOLDERS | JUST ENERGY F-18

For the six months ended September 30, 2020:
Mass Market Commercial
Corporateand shared
services Consolidated
Sales $ 810,004 $ 613,954 $ — $ 1,423,958Cost of goods sold 470,157 463,953 — 934,110Gross margin 339,847 150,001 — 489,848Depreciation and amortization 11,138 1,814 — 12,952Administrative expenses 18,187 9,436 54,476 82,099Selling and marketing expenses 57,222 37,649 — 94,871Other operating expenses 21,069 6,655 — 27,724Segment profit (loss) $ 232,231 $ 94,447 $ (54,476) $ 272,202Finance costs (51,597)Restructuring Costs (7,118)Gain on September 2020 Recapitalization
transaction, net 50,341Unrealized loss of derivative instruments and other (7,619)Realized loss of derivative instruments (219,903)Other expense, net (3,057)Provision for income taxes (1,307)Profit from continuing operations $ 31,942Loss from discontinued operations (4,158)Profit for the period 27,784Capital expenditures $ 4,216 $ 457 $ — $ 4,673
As at September 30, 2020Total goodwill $ 171,352 $ 96,654 $ — $ 268,006
Sales from external customersSales based on the location of the customer.
Three months endedSeptember 30,
Six months endedSeptember 30,
2021 2020 2021 2020
Canada $ 128,088 $ 106,873 $ 268,566 $ 211,328
United States 576,681 631,121 1,044,875 1,212,630
Total $ 704,769 $ 737,994 $ 1,313,441 $ 1,423,958
Non-current assetsNon-current assets by geographic segment consist of goodwill, property and equipment and intangible assets and aresummarized as follows:
As atSeptember 30,
2021
As atMarch 31,
2021
Canada $ 177,690 $ 178,802
United States 70,013 73,518
Total $ 247,703 $ 252,320
NOTES TO THE INTERIM CONDENSED CONSOLIDATED FINANCIAL STATEMENTS
F-19 JUST ENERGY | 2022 SECOND QUARTER REPORT TO SHAREHOLDERS

10. INCOME TAXESThree months ended
September 30,Six months ended
September 30,
2021 2020 2021 2020
Current income tax expense $ (245) $ 493 $ (1,357) $ 1,366
Deferred income tax recovery — 180 145 (59)
Provision for (recovery of) income taxes $ (245) $ 673 $ (1,212) $ 1,307
11. SHAREHOLDERS’ CAPITALJust Energy is authorized to issue an unlimited number of common shares with no par value and up to 50,000,000 preferredshares. The common shares outstanding have no preferences, rights or restrictions attached to them and there are no preferredshares outstanding.
Details of issued and outstanding shareholders’ capital are as follows:
Six months endedSeptember 30, 2021
Year endedMarch 31, 2021
Shares Amount Shares Amount
Common shares:
Issued and outstanding
Balance, beginning of period 48,078,637 $ 1,537,863 4,594,371 $ 1,099,864
Share-based awards exercised — — 91,854 929
Issuance of shares due to September 2020Recapitalization — — 43,392,412 438,642
Issuance cost — — — (1,572)
Balance, end of period 48,078,637 $ 1,537,863 48,078,637 $ 1,537,863
Preferred shares:
Issued and outstanding
Balance, beginning of period — $ — 4,662,165 $ 146,965
Exchanged to common shares — — (4,662,165) (146,965)
Shareholders’ capital 48,078,637 $ 1,537,863 48,078,637 $ 1,537,863
The above table reflects the impacts of the September 2020 Recapitalization including the extinguished convertible debentures,the settlement of the preferred shares and the issuance of new common shares. The common shares have been adjustedretrospectively to reflect the 33:1 share consolidation as part of the September 2020 Recapitalization.
NOTES TO THE INTERIM CONDENSED CONSOLIDATED FINANCIAL STATEMENTS
2022 SECOND QUARTER REPORT TO SHAREHOLDERS | JUST ENERGY F-20
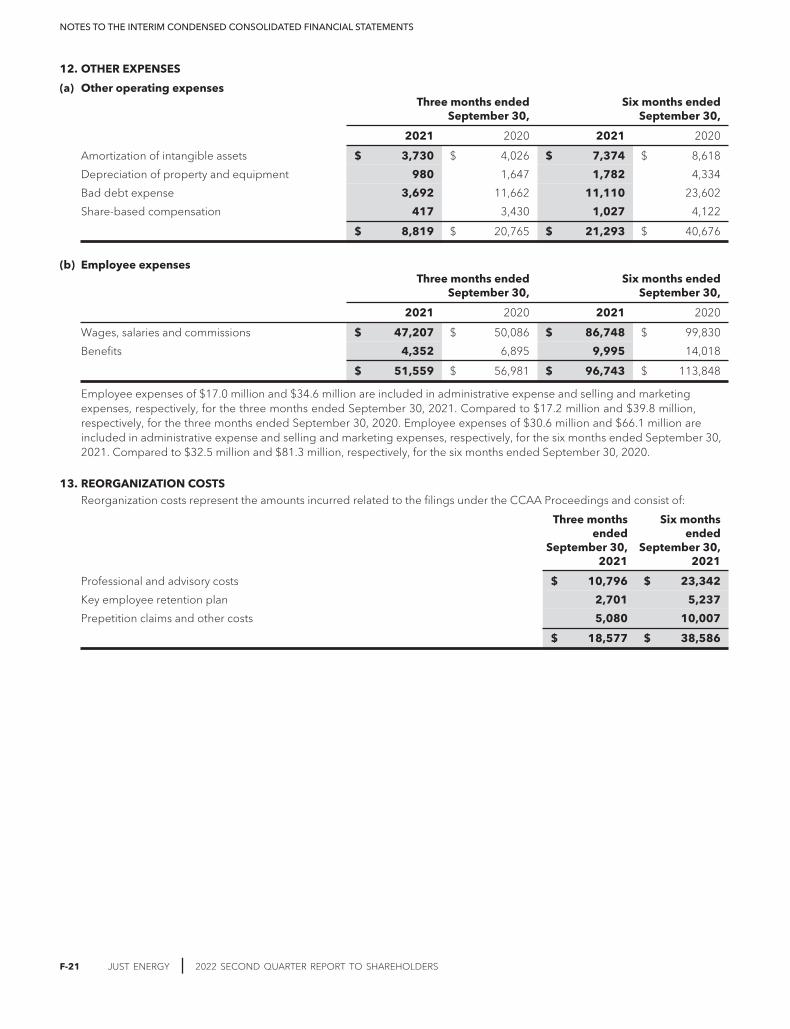
12. OTHER EXPENSES
(a) Other operating expensesThree months ended
September 30,Six months ended
September 30,
2021 2020 2021 2020
Amortization of intangible assets $ 3,730 $ 4,026 $ 7,374 $ 8,618
Depreciation of property and equipment 980 1,647 1,782 4,334
Bad debt expense 3,692 11,662 11,110 23,602
Share-based compensation 417 3,430 1,027 4,122
$ 8,819 $ 20,765 $ 21,293 $ 40,676
(b) Employee expensesThree months ended
September 30,Six months ended
September 30,
2021 2020 2021 2020
Wages, salaries and commissions $ 47,207 $ 50,086 $ 86,748 $ 99,830
Benefits 4,352 6,895 9,995 14,018
$ 51,559 $ 56,981 $ 96,743 $ 113,848
Employee expenses of $17.0 million and $34.6 million are included in administrative expense and selling and marketingexpenses, respectively, for the three months ended September 30, 2021. Compared to $17.2 million and $39.8 million,respectively, for the three months ended September 30, 2020. Employee expenses of $30.6 million and $66.1 million areincluded in administrative expense and selling and marketing expenses, respectively, for the six months ended September 30,2021. Compared to $32.5 million and $81.3 million, respectively, for the six months ended September 30, 2020.
13. REORGANIZATION COSTSReorganization costs represent the amounts incurred related to the filings under the CCAA Proceedings and consist of:
Three monthsended
September 30,2021
Six monthsended
September 30,2021
Professional and advisory costs $ 10,796 $ 23,342
Key employee retention plan 2,701 5,237
Prepetition claims and other costs 5,080 10,007
$ 18,577 $ 38,586
NOTES TO THE INTERIM CONDENSED CONSOLIDATED FINANCIAL STATEMENTS
F-21 JUST ENERGY | 2022 SECOND QUARTER REPORT TO SHAREHOLDERS
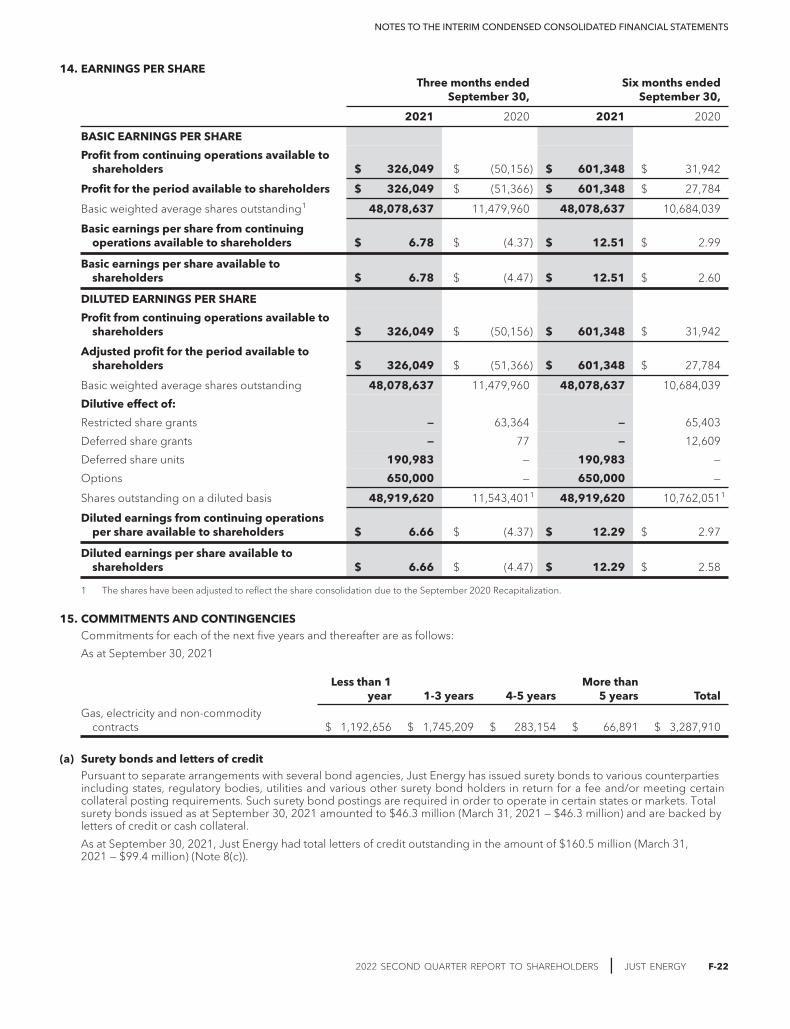
14. EARNINGS PER SHAREThree months ended
September 30,Six months ended
September 30,
2021 2020 2021 2020
BASIC EARNINGS PER SHARE
Profit from continuing operations available toshareholders $ 326,049 $ (50,156) $ 601,348 $ 31,942
Profit for the period available to shareholders $ 326,049 $ (51,366) $ 601,348 $ 27,784
Basic weighted average shares outstanding1 48,078,637 11,479,960 48,078,637 10,684,039
Basic earnings per share from continuingoperations available to shareholders $ 6.78 $ (4.37) $ 12.51 $ 2.99
Basic earnings per share available toshareholders $ 6.78 $ (4.47) $ 12.51 $ 2.60
DILUTED EARNINGS PER SHARE
Profit from continuing operations available toshareholders $ 326,049 $ (50,156) $ 601,348 $ 31,942
Adjusted profit for the period available toshareholders $ 326,049 $ (51,366) $ 601,348 $ 27,784
Basic weighted average shares outstanding 48,078,637 11,479,960 48,078,637 10,684,039
Dilutive effect of:
Restricted share grants — 63,364 — 65,403
Deferred share grants — 77 — 12,609
Deferred share units 190,983 — 190,983 —
Options 650,000 — 650,000 —
Shares outstanding on a diluted basis 48,919,620 11,543,4011 48,919,620 10,762,0511
Diluted earnings from continuing operationsper share available to shareholders $ 6.66 $ (4.37) $ 12.29 $ 2.97
Diluted earnings per share available toshareholders $ 6.66 $ (4.47) $ 12.29 $ 2.58
1 The shares have been adjusted to reflect the share consolidation due to the September 2020 Recapitalization.
15. COMMITMENTS AND CONTINGENCIESCommitments for each of the next five years and thereafter are as follows:
As at September 30, 2021
Less than 1year 1-3 years 4-5 years
More than5 years Total
Gas, electricity and non-commoditycontracts $ 1,192,656 $ 1,745,209 $ 283,154 $ 66,891 $ 3,287,910
(a) Surety bonds and letters of creditPursuant to separate arrangements with several bond agencies, Just Energy has issued surety bonds to various counterpartiesincluding states, regulatory bodies, utilities and various other surety bond holders in return for a fee and/or meeting certaincollateral posting requirements. Such surety bond postings are required in order to operate in certain states or markets. Totalsurety bonds issued as at September 30, 2021 amounted to $46.3 million (March 31, 2021 — $46.3 million) and are backed byletters of credit or cash collateral.
As at September 30, 2021, Just Energy had total letters of credit outstanding in the amount of $160.5 million (March 31,2021 — $99.4 million) (Note 8(c)).
NOTES TO THE INTERIM CONDENSED CONSOLIDATED FINANCIAL STATEMENTS
2022 SECOND QUARTER REPORT TO SHAREHOLDERS | JUST ENERGY F-22
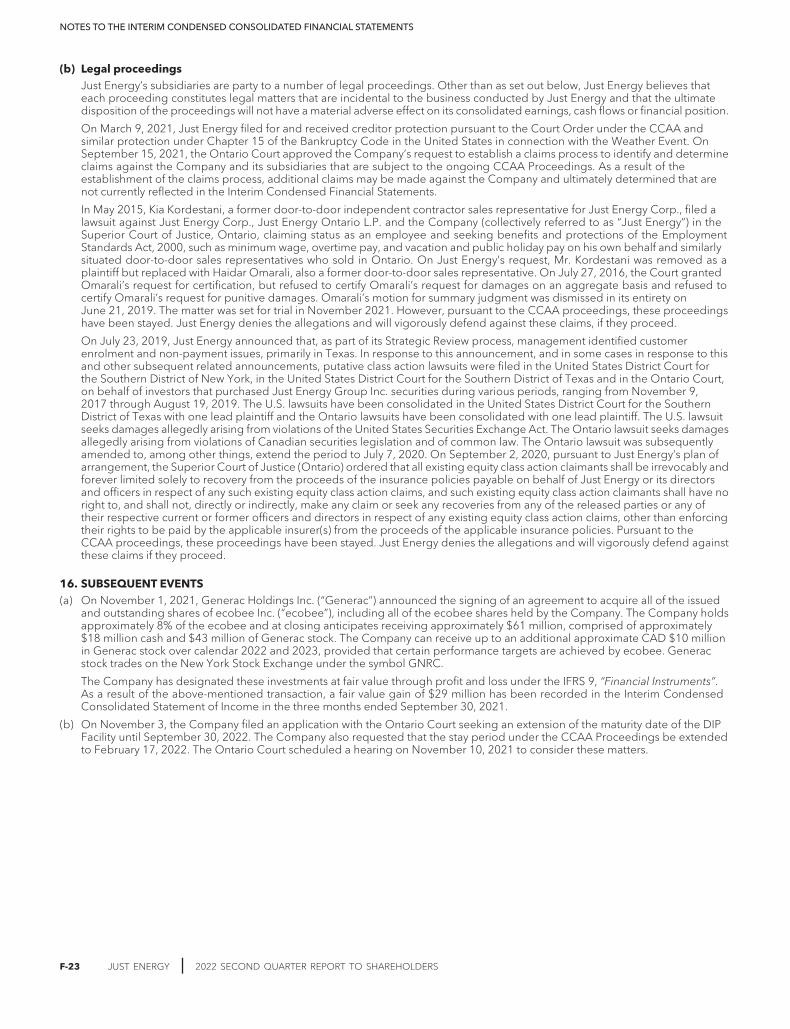
(b) Legal proceedingsJust Energy’s subsidiaries are party to a number of legal proceedings. Other than as set out below, Just Energy believes thateach proceeding constitutes legal matters that are incidental to the business conducted by Just Energy and that the ultimatedisposition of the proceedings will not have a material adverse effect on its consolidated earnings, cash flows or financial position.
On March 9, 2021, Just Energy filed for and received creditor protection pursuant to the Court Order under the CCAA andsimilar protection under Chapter 15 of the Bankruptcy Code in the United States in connection with the Weather Event. OnSeptember 15, 2021, the Ontario Court approved the Company’s request to establish a claims process to identify and determineclaims against the Company and its subsidiaries that are subject to the ongoing CCAA Proceedings. As a result of theestablishment of the claims process, additional claims may be made against the Company and ultimately determined that arenot currently reflected in the Interim Condensed Financial Statements.
In May 2015, Kia Kordestani, a former door-to-door independent contractor sales representative for Just Energy Corp., filed alawsuit against Just Energy Corp., Just Energy Ontario L.P. and the Company (collectively referred to as “Just Energy”) in theSuperior Court of Justice, Ontario, claiming status as an employee and seeking benefits and protections of the EmploymentStandards Act, 2000, such as minimum wage, overtime pay, and vacation and public holiday pay on his own behalf and similarlysituated door-to-door sales representatives who sold in Ontario. On Just Energy’s request, Mr. Kordestani was removed as aplaintiff but replaced with Haidar Omarali, also a former door-to-door sales representative. On July 27, 2016, the Court grantedOmarali’s request for certification, but refused to certify Omarali’s request for damages on an aggregate basis and refused tocertify Omarali’s request for punitive damages. Omarali’s motion for summary judgment was dismissed in its entirety onJune 21, 2019. The matter was set for trial in November 2021. However, pursuant to the CCAA proceedings, these proceedingshave been stayed. Just Energy denies the allegations and will vigorously defend against these claims, if they proceed.
On July 23, 2019, Just Energy announced that, as part of its Strategic Review process, management identified customerenrolment and non-payment issues, primarily in Texas. In response to this announcement, and in some cases in response to thisand other subsequent related announcements, putative class action lawsuits were filed in the United States District Court forthe Southern District of New York, in the United States District Court for the Southern District of Texas and in the Ontario Court,on behalf of investors that purchased Just Energy Group Inc. securities during various periods, ranging from November 9,2017 through August 19, 2019. The U.S. lawsuits have been consolidated in the United States District Court for the SouthernDistrict of Texas with one lead plaintiff and the Ontario lawsuits have been consolidated with one lead plaintiff. The U.S. lawsuitseeks damages allegedly arising from violations of the United States Securities Exchange Act. The Ontario lawsuit seeks damagesallegedly arising from violations of Canadian securities legislation and of common law. The Ontario lawsuit was subsequentlyamended to, among other things, extend the period to July 7, 2020. On September 2, 2020, pursuant to Just Energy’s plan ofarrangement, the Superior Court of Justice (Ontario) ordered that all existing equity class action claimants shall be irrevocably andforever limited solely to recovery from the proceeds of the insurance policies payable on behalf of Just Energy or its directorsand officers in respect of any such existing equity class action claims, and such existing equity class action claimants shall have noright to, and shall not, directly or indirectly, make any claim or seek any recoveries from any of the released parties or any oftheir respective current or former officers and directors in respect of any existing equity class action claims, other than enforcingtheir rights to be paid by the applicable insurer(s) from the proceeds of the applicable insurance policies. Pursuant to theCCAA proceedings, these proceedings have been stayed. Just Energy denies the allegations and will vigorously defend againstthese claims if they proceed.
16. SUBSEQUENT EVENTS(a) On November 1, 2021, Generac Holdings Inc. (“Generac”) announced the signing of an agreement to acquire all of the issued
and outstanding shares of ecobee Inc. (“ecobee”), including all of the ecobee shares held by the Company. The Company holdsapproximately 8% of the ecobee and at closing anticipates receiving approximately $61 million, comprised of approximately$18 million cash and $43 million of Generac stock. The Company can receive up to an additional approximate CAD $10 millionin Generac stock over calendar 2022 and 2023, provided that certain performance targets are achieved by ecobee. Generacstock trades on the New York Stock Exchange under the symbol GNRC.
The Company has designated these investments at fair value through profit and loss under the IFRS 9, “Financial Instruments”.As a result of the above-mentioned transaction, a fair value gain of $29 million has been recorded in the Interim CondensedConsolidated Statement of Income in the three months ended September 30, 2021.
(b) On November 3, the Company filed an application with the Ontario Court seeking an extension of the maturity date of the DIPFacility until September 30, 2022. The Company also requested that the stay period under the CCAA Proceedings be extendedto February 17, 2022. The Ontario Court scheduled a hearing on November 10, 2021 to consider these matters.
NOTES TO THE INTERIM CONDENSED CONSOLIDATED FINANCIAL STATEMENTS
F-23 JUST ENERGY | 2022 SECOND QUARTER REPORT TO SHAREHOLDERS

Corporate Information
Corporate OfficeJust Energy Group Inc.First Canadian Place100 King Street WestSuite 2630, P.O. Box 355Toronto, ON M5X 1E1
Investor RelationsAlpha IR [email protected]
AuditorsErnst & Young LLPToronto, ON Canada
Transfer Agent and RegistrarComputershare Investor Services Inc.100 University AvenueToronto, ON M5J 2Y1
Shares Listed
Trading symbol: JETSX Ventur e Exchange
OTC Pink MarketTrading symbol: JENGQQQQQ

investors.justenergy.com


![CIC-14Ri=oRT Co~LEGTION . REP-]cTION - FAS](https://static.fdocuments.us/doc/165x107/618ab005b224763916444389/cic-14riort-colegtion-rep-ction-fas.jpg)


![W. · Workshop, pp 128-145, Cam bridge, Mass., 1982. The Pro ceedings ha v e b een published as BBN Rep ort No. 4842 and F airc hild T ec hnical Rep ort No. 618. [35] E. H. Lum, An](https://static.fdocuments.us/doc/165x107/5f8ff3e8f19ea657470899d4/w-workshop-pp-128-145-cam-bridge-mass-1982-the-pro-ceedings-ha-v-e-b-een.jpg)