Second Quarter 2021 Financial Presentation Materials
25
Second Quarter 2021 Financial Presentation Materials August 3, 2021
Transcript of Second Quarter 2021 Financial Presentation Materials
Second Quarter 2021Financial Presentation Materials
August 3, 2021

Safe HarborForward-Looking StatementsCertain statements in this document regarding anticipated financial, business, legal or other outcomes including business and market conditions, outlook and othersimilar statements relating to Rayonier Advanced Materials’ future events, developments, or financial or operational performance or results, are “forward-lookingstatements” made pursuant to the safe harbor provisions of the Private Securities Litigation Reform Act of 1995 and other federal securities laws. These forward-looking statements are identified by the use of words such as “may,” “will,” “should,” “expect,” “estimate,” “believe,” “intend,” “forecast,” “anticipate,” “guidance,”and other similar language. However, the absence of these or similar words or expressions does not mean a statement is not forward-looking. While we believe theseforward-looking statements are reasonable when made, forward-looking statements are not guarantees of future performance or events and undue reliance shouldnot be placed on these statements. Although we believe the expectations reflected in any forward-looking statements are based on reasonable assumptions, we cangive no assurance these expectations will be attained and it is possible actual results may differ materially from those indicated by these forward-looking statementsdue to a variety of risks and uncertainties.
Our operations are subject to a number of risks and uncertainties including, but not limited to, those listed below. When considering an investment in our securities,you should carefully read and consider these risks, together with all other information in our Annual Report on Form 10-K and our other filings and submissions to theSEC, which provide much more information and detail on the risks described below. If any of the events described in the following risk factors actually occur, ourbusiness, financial condition or operating results, as well as the market price of our securities, could be materially adversely affected. These risks and events include,without limitation:Epidemic and Pandemic Risks Our businesses are subject to risks associated with epidemics and pandemics, including the COVID-19 pandemic and related impacts.The nature and extent of ongoing and future impacts of the pandemic are highly uncertain and unpredictable.Macroeconomic and Industry Risks The businesses we operate are highly competitive and many of them are cyclical, which may result in fluctuations in pricing andvolume that can adversely impact our business, financial condition and results of operations; Changes in raw material and energy availability and prices could affectour business, financial condition and results of operations; We are subject to risks associated with doing business outside of the United States; Currency fluctuationsmay have a negative impact on our business, financial condition and results of operations; Restrictions on trade through tariffs, countervailing and anti-dumpingduties, quotas and other trade barriers, in the United States and internationally, could adversely affect our ability to access certain markets.Business and Operating Risks Our ten largest customers represent approximately 31 percent of our 2020 sales, and the loss of all or a substantial portion of ourrevenue from these large customers could have a material adverse effect on our business; A material disruption at one of our major manufacturing facilities couldprevent us from meeting customer demand, reduce our sales and profitability, increase our cost of production and capital needs, or otherwise adversely affect ourbusiness, financial condition and results of operation; The availability of, and prices for, wood fiber could materially impact our business, results of operations andfinancial condition; Our operations require substantial capital; We depend on third parties for transportation services and increases in costs and the availability oftransportation could adversely affect our business; Our failure to maintain satisfactory labor relations could have a material adverse effect on our business; We aredependent upon attracting and retaining key personnel, the loss of whom could adversely affect our business; Failure to develop new products or discover newapplications for our existing products, or our inability to protect the intellectual property underlying such new products or applications, could have a negative impacton our business; The risk of loss of the Company’s intellectual property and sensitive business information, or disruption of its manufacturing operations, in each casedue to cyberattacks or cybersecurity breaches, could adversely impact the Company
2

Safe HarborRegulatory Risks Our business is subject to extensive environmental laws, regulations and permits that may restrict or adversely affect our financial results and howwe conduct business; The potential longer-term impacts of climate-related risks remain uncertain at this time.Financial Risks We may need to make significant additional cash contributions to our retirement benefit plans if investment returns on pension assets are lower thanexpected or interest rates decline, and/or due to changes to regulatory, accounting and actuarial requirements; We have significant debt obligations that couldadversely affect our business and our ability to meet our obligations; The phase-out of LIBOR as an interest rate benchmark in 2023 may impact our borrowing costs;Challenges in the commercial and credit environments may materially adversely affect our future access to capital; We may need additional financing in the future tomeet our capital needs or to make acquisitions, and such financing may not be available on favorable terms, if at all, and may be dilutive to existing stockholders.Company’s Common Stock and Certain Corporate Matters Risks Your percentage of ownership in the Company may be diluted in the future; Certain provisions in ouramended and restated certificate of incorporation and bylaws, and of Delaware law, could prevent or delay an acquisition of the Company, which could decrease theprice of our common stock.Merger and Acquisition Risks Failure to consummate the closing of the sale of the lumber and newsprint facilities and related assets to GreenFirst as contemplatedunder the binding asset purchase agreement could negatively impact the Company’s future earnings volatility and ability to reduce its leverage and invest in its corebusiness; Fifteen percent (15%) of the purchase price for the GreenFirst transaction is payable in the common shares of the capital of GreenFirst (to be held by theCompany for a minimum of six (6) months following transaction closing), and the Company’s ability to ultimately realize the benefit of this consideration is subject tomarket conditions and GreenFirst’s future performance.
Other important factors that could cause actual results or events to differ materially from those expressed in forward-looking statements that may have been made inthis document are described or will be described in our filings with the U.S. Securities and Exchange Commission, including our Annual Report on Form 10-K andQuarterly Reports on Form 10-Q. Rayonier Advanced Materials assumes no obligation to update these statements except as is required by law.
All statements made in this earnings release are made only as of the date set forth at the beginning of this release. The Company undertakes no obligation to updatethe information made in this release in the event facts or circumstances subsequently change after the date of this release. The Company has not filed its Form 8-K forthe quarter ended June 26, 2021. As a result, all financial results described in this earnings release should be considered preliminary, and are subject to change toreflect any necessary adjustments or changes in accounting estimates, that are identified prior to the time the Company files its Form 8-K.
3

These presentation materials contain certain non-GAAP financial measures, including EBITDA, adjusted EBITDA, adjustedfree cash flows, adjusted operating income, adjusted income (loss) from continuing operations and adjusted net debt.These non-GAAP measures are reconciled to each of their respective most directly comparable GAAP financial measuresin the appendix of these presentation materials.
We believe these non-GAAP measures provide useful information to our board of directors, management and investorsregarding certain trends relating to our financial condition and results of operations. Our management uses these non-GAAP measures to compare our performance to that of prior periods for trend analyses, purposes of determiningmanagement incentive compensation and budgeting, forecasting and planning purposes.
We do not consider these non-GAAP measures an alternative to financial measures determined in accordance withGAAP. The principal limitations of these non-GAAP financial measures are that they may exclude significant expensesand income items that are required by GAAP to be recognized in our consolidated financial statements. In addition, theyreflect the exercise of management’s judgment about which expenses and income items are excluded or included indetermining these non-GAAP financial measures. In order to compensate for these limitations, management providesreconciliations of the non-GAAP financial measures we use to their most directly comparable GAAP measures. Non-GAAP financial measures should not be relied upon, in whole or part, in evaluating the financial condition, results ofoperations or future prospects of the Company.
Non-GAAP Financial Measures
4

45%
10%6%2%
37%
Combined Revenue*
$553million
High-Yield PulpNewsprint**
High Purity Cellulose
Paperboard
High-Yield Pulp
Q2’21 Financial Highlights
Total Adjusted EBITDA
*Combined Revenue excludes eliminations**Discontinued Operations
$ millionsHigh Purity Cellulose 38Paperboard 6High-Yield 2Corporate (13)Cont. Ops. Subtotal 33Forest Products** 118Newsprint** (1)Corporate/Other** (1)Total 149
5
Revenue of $341 million from continuing operations & $212 million from discontinued operations
Operating Income of $1 million from continuing operations & $115 million from discontinued operations
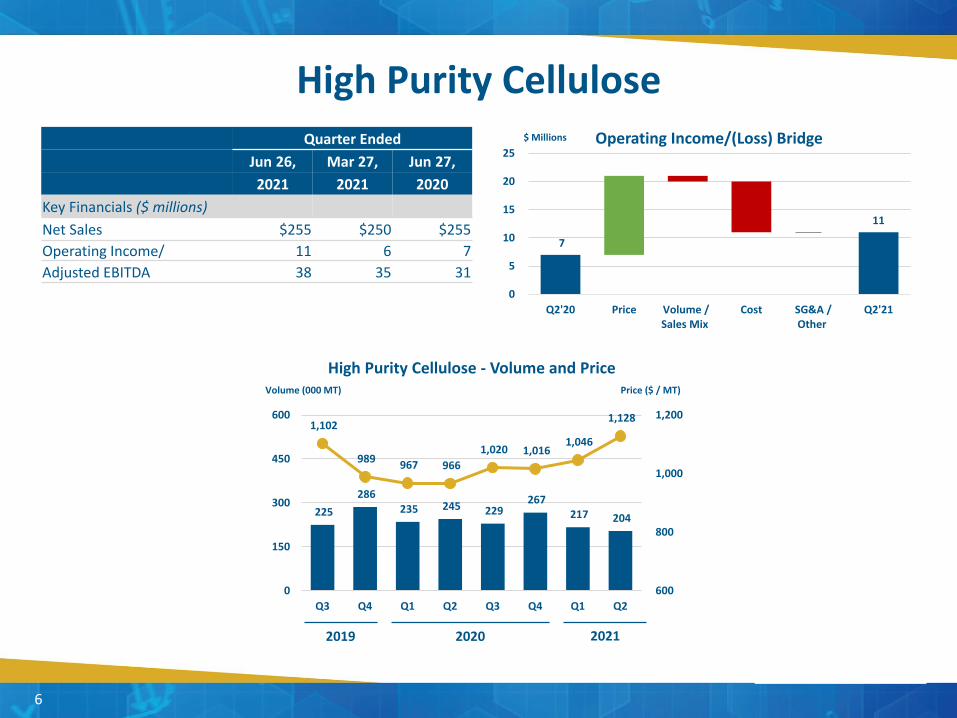
Total Adjusted EBITDA of $149 million Includes $33 million from continuing operations— High Purity Cellulose improved $7 million on higher commodity
prices and stronger CS volumes— Paperboard declined $3 million driven by higher raw material
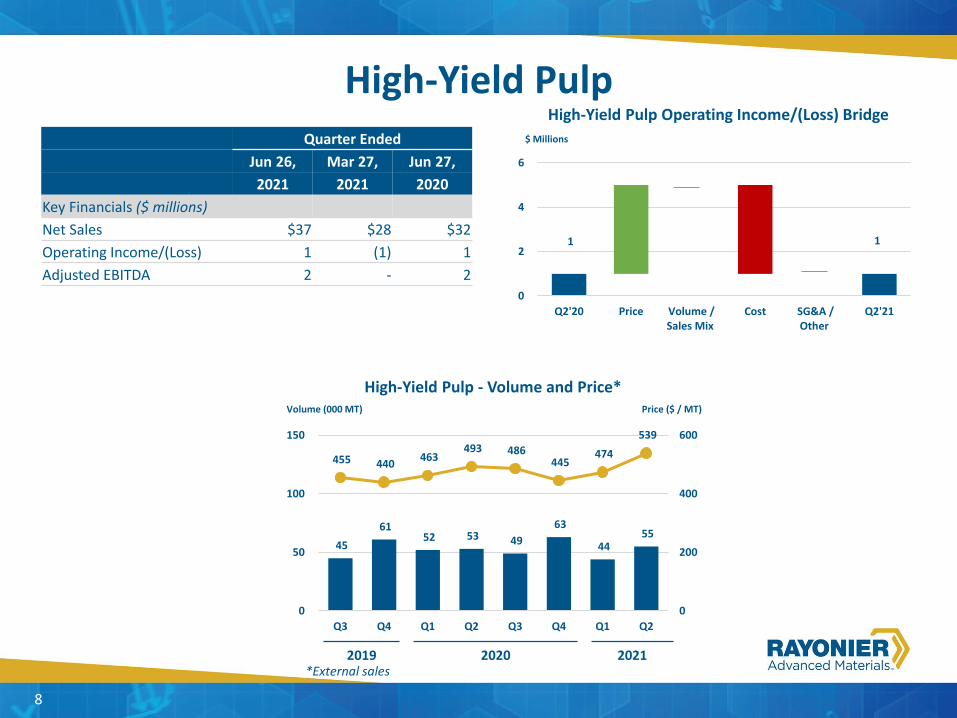
costs partially offset by increased prices and volumes— High-Yield Pulp held flat as improved prices were offset by
higher operational costs and logistic constraints— Corporate costs improved $4 million due to favorable FX and
lower variable compensation expense Discontinued operations, Forest Products and Newsprint, improved $121 million driven by record lumber prices
YTD Consolidated Adjusted Free Cash Flow of $141 million Includes $3 million continuing operations
Expect sale of discontinued operations to close August 28, 2021
Forest Products**
High Purity Cellulose
6
Operating Income/(Loss) Bridge$ Millions
7
11
0
5
10
15
20
25
Q2'20 Price Volume /Sales Mix
Cost SG&A /Other
Q2'21
Volume (000 MT)
High Purity Cellulose - Volume and PricePrice ($ / MT)
20202019
Quarter EndedJun 26, Mar 27, Jun 27,2021 2021 2020
Key Financials ($ millions)Net Sales $255 $250 $255Operating Income/ 11 6 7Adjusted EBITDA 38 35 31
2021
225 286
235 245 229 267
217 204
1,102
989 967 966 1,020 1,016
1,046
1,128
600
800
1,000
1,200
0
150
300
450
600
Q3 Q4 Q1 Q2 Q3 Q4 Q1 Q2

Paperboard
7
Paperboard - Volume and PriceVolume (000 MT) Price ($ / MT)
Operating Income/(Loss) Bridge$ Millions
6
2
02468
10121416
Q2'20 Price Volume /Sales Mix
Cost SG&A /Other
Q2'21
49 44 46 40 45 47 43 49
1,097 1,098 1,107 1,091 1,048 1,061 1,111 1,150
0
200
400
600
800
1,000
1,200
1,400
0
50
100
150
Q3 Q4 Q1 Q2 Q3 Q4 Q1 Q2
20202019 2021
Quarter EndedJun 26, Mar 27, Jun 27,2021 2021 2020
Key Financials ($ millions)Net Sales $57 $48 $43Operating Income/(Loss) 2 6 6Adjusted EBITDA 7 10 10
High-Yield Pulp
Volume (000 MT)
High-Yield Pulp - Volume and Price*Price ($ / MT)
High-Yield Pulp Operating Income/(Loss) Bridge$ Millions
1 1
0
2
4
6
Q2'20 Price Volume /Sales Mix
Cost SG&A /Other
Q2'21
8
Quarter EndedJun 26, Mar 27, Jun 27,2021 2021 2020
Key Financials ($ millions)Net Sales $37 $28 $32Operating Income/(Loss) 1 (1) 1Adjusted EBITDA 2 - 2
45 61
52 53 49 63
44 55
455 440 463 493 486
445 474
539
0
200
400
600
0
50
100
150
Q3 Q4 Q1 Q2 Q3 Q4 Q1 Q2
20202019 2021*External sales

Operating Income of $1 million; up $7 million from prior year Improved prices across commodity High Purity Cellulose, Paperboard and High-Yield Pulp Volume improvements driven by Paperboard sales Cost impacts from higher raw material costs in Paperboard, inflation and higher maintenance and logistics
costs in High Purity Cellulose SG&A/other cost improvements from favorable FX and lower variable compensation expense
Consolidated Operating Income/(Loss) from Continuing Operations
9
($ Millions) Bridge Q2 2020 to Q2 2021
(6) 1
(10)
(5)
0
5
10
15
20
25
Q2'20 Price Volume /Sales Mix
Cost SG&A /Other
Q2'21
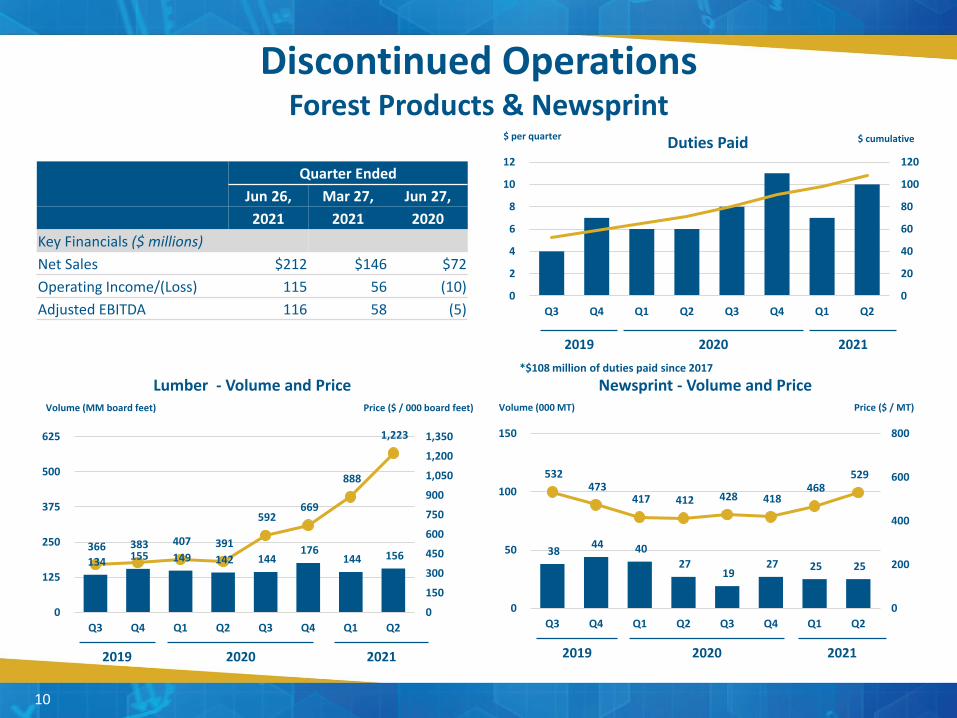
Discontinued Operations Forest Products & Newsprint
10
Lumber - Volume and PriceVolume (MM board feet) Price ($ / 000 board feet)
*$108 million of duties paid since 2017
Duties Paid$ per quarter $ cumulative
0
20
40
60
80
100
120
0
2
4
6
8
10
12
Q3 Q4 Q1 Q2 Q3 Q4 Q1 Q2
20202019
20202019
Quarter EndedJun 26, Mar 27, Jun 27,2021 2021 2020
Key Financials ($ millions)Net Sales $212 $146 $72Operating Income/(Loss) 115 56 (10)Adjusted EBITDA 116 58 (5)
134 155 149 142 144 176
144 156 366 383 407 391
592 669
888
1,223
0
150
300
450
600
750
900
1,050
1,200
1,350
0
125
250
375
500
625
Q3 Q4 Q1 Q2 Q3 Q4 Q1 Q2
2021
2021
Volume (000 MT)
Newsprint - Volume and PricePrice ($ / MT)
38 44 40 27
19 27 25 25
532 473
417 412 428 418 468
529
0
200
400
600
800
0
50
100
150
Q3 Q4 Q1 Q2 Q3 Q4 Q1 Q2
20202019 2021

1,081
0
200
400
600
800
1,000
Total Debt Cash Net Debt Proceedsfrom Asset
Sale
Cash TaxRefunds
Cash Valueof GFPShares
Free CashFlow
StrategicInvestment
Near-TermDebt Target
SoftwoodLumber
DutyDeposits
Long-TermDebt Ratio
877
~650
Net Debt
11
$ millions
Near-term Goal of ~$650 million
Target 2.5x
EBITDA

Disciplined and Balanced Capital Allocation
Maintain Assets ~$100 million of annual capex
Adjusted Free Cash Flow
Return of Capital to Shareholders
Stock buybacks and dividends to maximize long-term shareholder
returns
External Strategic Investments
Acquisitions and other investments to
complement core business
Investment in the Company
High-return projects designed to enhance competitive
position and drive EBITDA growth
Reduce Leverage Target 2.5x Net Leverage
Value Driven Approach focused on Risk Adjusted Returns on Invested Capital
Cash Flow From Operations
12
2021 Future
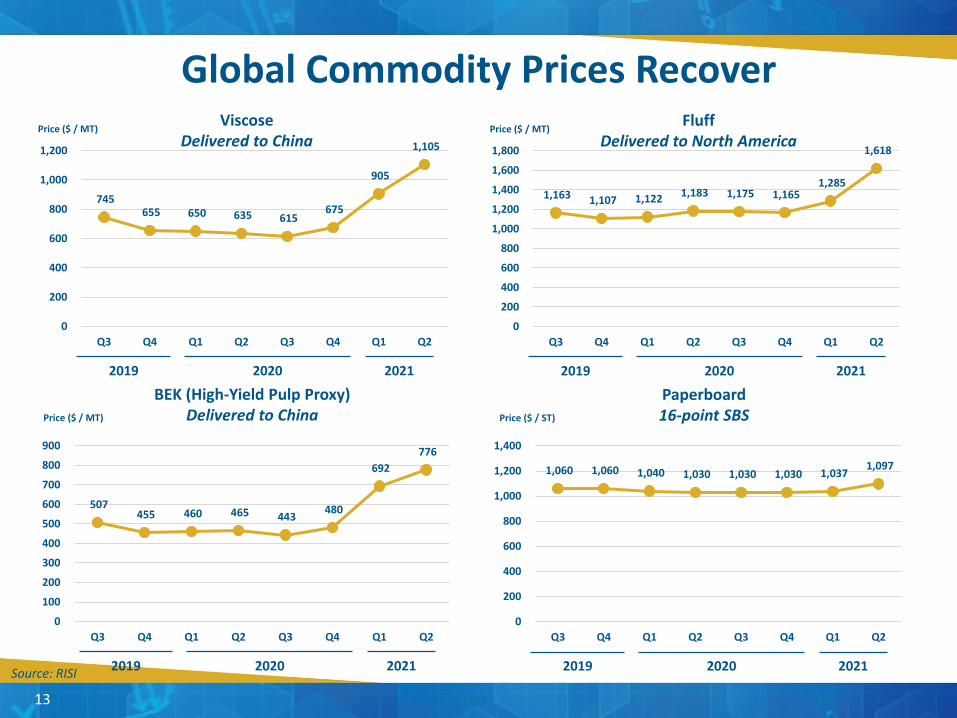
Global Commodity Prices Recover
13
BEK (High-Yield Pulp Proxy)Delivered to ChinaPrice ($ / MT)
20202019
507 455 460 465 443 480
692 776
0
100
200
300
400
500
600
700
800
900
Q3 Q4 Q1 Q2 Q3 Q4 Q1 Q2
2021
ViscoseDelivered to China
Price ($ / MT)
20202019
745 655 650 635 615
675
905
1,105
0
200
400
600
800
1,000
1,200
Q3 Q4 Q1 Q2 Q3 Q4 Q1 Q2
2021
Paperboard16-point SBSPrice ($ / ST)
20202019
1,060 1,060 1,040 1,030 1,030 1,030 1,037 1,097
0
200
400
600
800
1,000
1,200
1,400
Q3 Q4 Q1 Q2 Q3 Q4 Q1 Q2
2021
FluffDelivered to North America
Price ($ / MT)
20202019
1,163 1,107 1,122 1,183 1,175 1,165 1,285
1,618
0
200
400
600
800
1,000
1,200
1,400
1,600
1,800
Q3 Q4 Q1 Q2 Q3 Q4 Q1 Q2
2021
Source: RISI

Demand for Cellulose Specialties strengthening Commodity viscose and fluff prices continue to trend upward Total volumes expected increase in back half of 2021 Aggressively target margin improvements for CS in 2022 Accelerated interest in sustainable, renewable natural solutions Paperboard prices increasing to offset raw material costs Expect further prices improvement as demand increases and supply is
constrained with raw material costs expected to subside Expect to recognize higher High-Yield Pulp prices in Q3’21 Prices expected to decline later in the year Capitalized on strong lumber prices and generated significant cash flow Expect to close on lumber and newsprint sale on August 28, 2021 Concludes Portfolio Optimization program
Well-Positioned in Current Market
High Purity Cellulose
Paperboard
High-Yield Pulp
14
Discontinued Operations
Strong cash position and improved outlook provide financial flexibility to invest in business and reduce debt

Key Investment Highlights
Leader in High-Value Cellulose Specialties
Broad and Diversified Portfolio of Cellulose-based Products
Leading R&D Platform with New Product & BioFuture Opportunities
Proven Ability to Control Costs and Manage Cash Flows
Well Positioned to Capitalize on Markets Conditions
Solid Liquidity and Financial Flexibility with No Significant Near-term Maturities
15

Appendix

EBITDA is defined as net income (loss) before interest, taxes, depreciation and amortization. EBITDA is a non-GAAPmeasure used by our Chief Operating Decision Maker, existing stockholders and potential stockholders to measurehow the Company is performing relative to the assets under management.
Adjusted EBITDA is defined as EBITDA adjusted for items management believes do not represent core operations.Management believes this measure is useful to evaluate the Company's performance.
EBITDA by Segment – Continuing Operations is defined as income from continuing operations before interest, taxes,depreciation and amortization.
EBITDA by Segment – Discontinued Operations is defined as income from discontinued operations before interest,taxes, depreciation and amortization.
Adjusted Free Cash Flows is defined as cash provided by operating activities adjusted for capital expendituresexcluding strategic capital. Adjusted free cash flows is a non-GAAP measure of cash generated during a period whichis available for dividend distribution, debt reduction, strategic acquisitions and repurchase of our common stock.Adjusted free cash flows is not necessarily indicative of the adjusted free cash flows that may be generated in futureperiods.
Adjusted Free Cash Flows – Continuing Operations is defined as cash provided by operating activities from continuingoperations adjusted for capital expenditures excluding strategic capital. Adjusted free cash flows is a non-GAAPmeasure of cash generated during a period which is available for dividend distribution, debt reduction, strategicacquisitions and repurchase of our common stock. Adjusted free cash flows is not necessarily indicative of theadjusted free cash flows that may be generated in future periods.
Definitions of Non-GAAP Measures
17
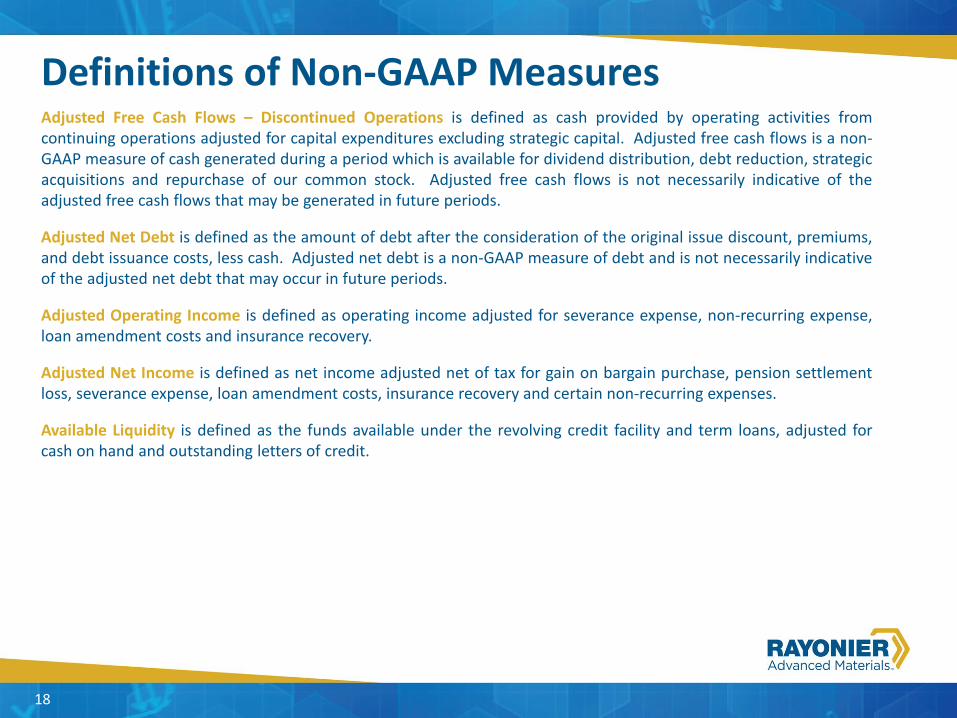
Adjusted Free Cash Flows – Discontinued Operations is defined as cash provided by operating activities fromcontinuing operations adjusted for capital expenditures excluding strategic capital. Adjusted free cash flows is a non-GAAP measure of cash generated during a period which is available for dividend distribution, debt reduction, strategicacquisitions and repurchase of our common stock. Adjusted free cash flows is not necessarily indicative of theadjusted free cash flows that may be generated in future periods.
Adjusted Net Debt is defined as the amount of debt after the consideration of the original issue discount, premiums,and debt issuance costs, less cash. Adjusted net debt is a non-GAAP measure of debt and is not necessarily indicativeof the adjusted net debt that may occur in future periods.
Adjusted Operating Income is defined as operating income adjusted for severance expense, non-recurring expense,loan amendment costs and insurance recovery.
Adjusted Net Income is defined as net income adjusted net of tax for gain on bargain purchase, pension settlementloss, severance expense, loan amendment costs, insurance recovery and certain non-recurring expenses.
Available Liquidity is defined as the funds available under the revolving credit facility and term loans, adjusted forcash on hand and outstanding letters of credit.
Definitions of Non-GAAP Measures
18

Reconciliation of Consolidated EBITDA($ Millions)
19
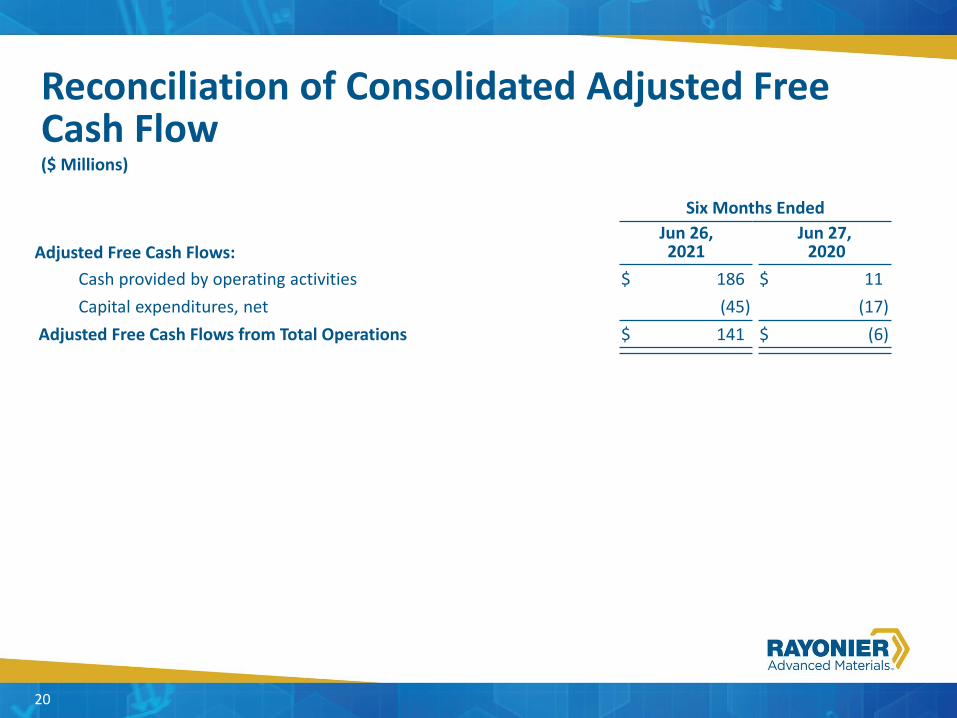
Reconciliation of Consolidated Adjusted Free Cash Flow($ Millions)
Six Months Ended
Adjusted Free Cash Flows:Jun 26, 2021
Jun 27,2020
Cash provided by operating activities $ 186 $ 11Capital expenditures, net (45) (17)
Adjusted Free Cash Flows from Total Operations $ 141 $ (6)
20

Reconciliation of EBITDA by Segment($ Millions)
21

Reconciliation of EBITDA by Segment (continued)($ Millions)
22
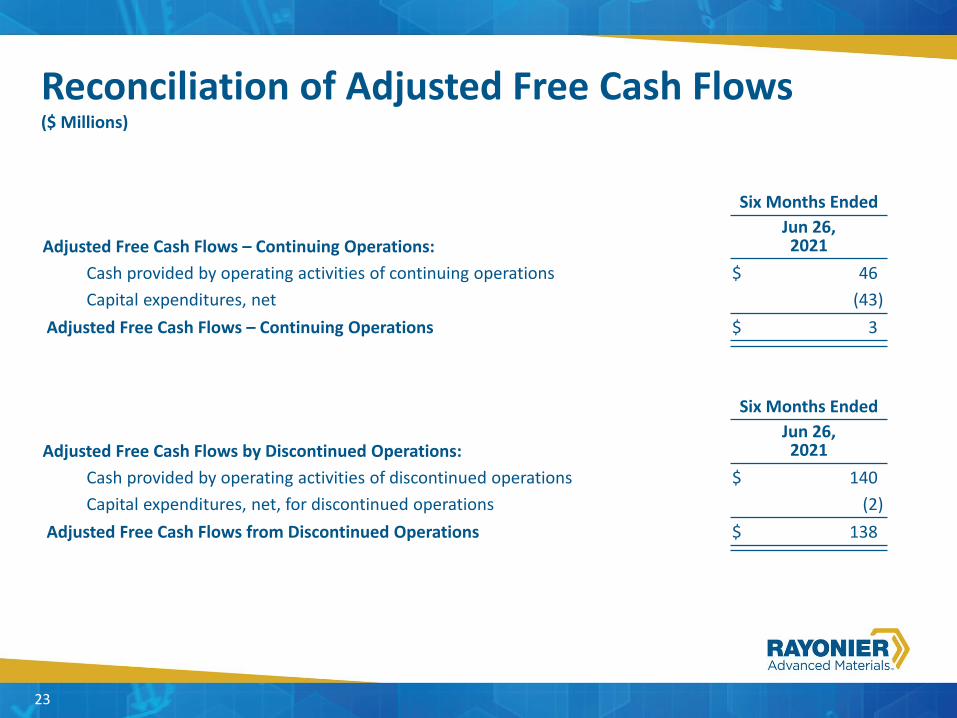
Reconciliation of Adjusted Free Cash Flows($ Millions)
Six Months Ended
Adjusted Free Cash Flows by Discontinued Operations:Jun 26, 2021
Cash provided by operating activities of discontinued operations $ 140Capital expenditures, net, for discontinued operations (2)
Adjusted Free Cash Flows from Discontinued Operations $ 138
23
Six Months Ended
Adjusted Free Cash Flows – Continuing Operations:Jun 26, 2021
Cash provided by operating activities of continuing operations $ 46Capital expenditures, net (43)
Adjusted Free Cash Flows – Continuing Operations $ 3

Reconciliation of EBITDA by Discontinued Segment($ Millions)
24
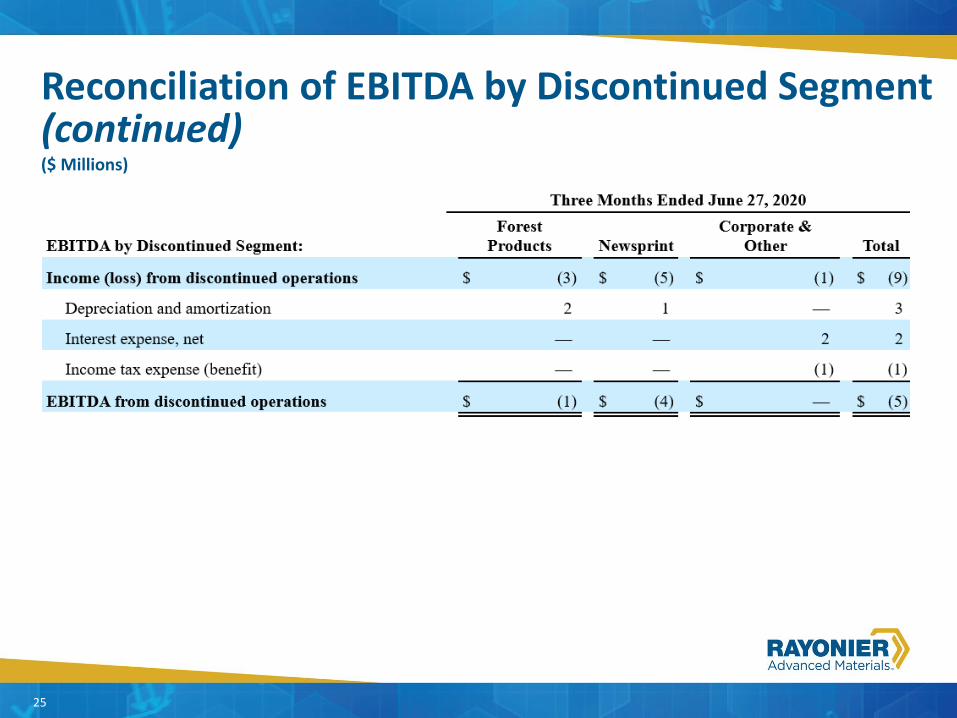
Reconciliation of EBITDA by Discontinued Segment (continued) ($ Millions)
25