Second Quarter 2019 Financial Results · Rom adopted on a modified retrospective basis beginning in...
35
Second Quarter 2019 Financial Results April 26, 2019
Transcript of Second Quarter 2019 Financial Results · Rom adopted on a modified retrospective basis beginning in...
Second Quarter 2019 Financial Results
April 26, 2019
Page 2
© 2019 Hill-Rom Services, Inc. ALL RIGHTS RESERVED
This presentation contains forward-looking statements, within the meaning of the Private Securities Litigation Reform Act of 1995. All statements included herein that are not historical facts are forward-looking statements, including without limitation statements regarding Hill-Rom’s ability to drive sustainable profitable growth and shareholder value, the timing and success of new product launches and portfolio expansion, the achievement of long-range financial objectives, the continuation of stable customer demand trends, a stable U.S. capital environment, the timing and success of M&A and business optimization initiatives, our ability to reduce debt, any change to the one-time impact from U.S. tax reform legislation, and all other statements concerning future strategy, plans, objectives, projections, expectations and intentions. Such forward-looking statements involve a number of risks and uncertainties and are subject to change at any time. In the event such risks or uncertainties materialize, Hill-Rom’s results could be materially adversely affected. For a more in-depth discussion of factors that could cause actual results to differ from those contained in forward-looking statements, see the discussions under the heading “Risk Factors” in the company's previously filed most recent Annual Report on Form 10-K and subsequent Quarterly Reports on Form 10-Q. Hill-Rom assumes no obligation to update or revise any forward-looking statements.
Certain financial figures presented herein have been presented on an adjusted basis (non-GAAP). Reconciliation between non-GAAP financial measures and reported GAAP financial measures are included in the appendices to this slide deck.
Hill-Rom’s results contained herein reflect the new revenue recognition accounting standard, ASC 606, which Hill-Rom adopted on a modified retrospective basis beginning in the fiscal first quarter 2019. All comparisons contained herein will include the new standard for the current and prior year periods.
Page 3
© 2019 Hill-Rom Services, Inc. ALL RIGHTS RESERVED
Q2 2019 Highlights

Page 5
© 2019 Hill-Rom Services, Inc. ALL RIGHTS RESERVED
InnovationAdvancing category leadership with healthcare solutions
LeadershipGlobal medical technology leader with a diversified portfolio
2018 Revenue by BusinessUS$ Billions
New Product RevenueUS$ Millions
Patient Support SystemsFront
Line Care
Surgical Solutions
$2.8BFY 2018
Key Valuation MetricsAs of 3/31/2019
Market Capitalization
2017 2018 2019Outlook
$150M+
$7.1B
$8.9B
+23%
$106M
LTM Total Shareholder Return
Enterprise Value
Fiscal Year-to-Date 2019 Returned to Shareholders*
ValueTransforming to drive sustainable profitable growth and shareholder value
Note: Hill-Rom fiscal year end is September 30 *Includes dividends and share repurchases
$300M+
$400M+

Page 6
© 2019 Hill-Rom Services, Inc. ALL RIGHTS RESERVED
Driving operational execution and strong financial performance• Exceeding guidance with +6% core revenue* growth and adjusted EPS of $1.14 (growth of +12%)
• Driving fourth consecutive quarter of mid-single digit core revenue* growth; margin expansion continues
Expanding internationally and penetrating emerging markets• Enhancing penetration with Hill-Rom’s global presence, brand and “One Hill-Rom” approach
• Stabilizing commercial operations in Latin America and Asia Pac with mid-single digit growth in 1H 2019
Transforming the portfolio with select M&A and optimization initiatives• Building leadership position in mobile healthcare communications with the acquisition of Voalte
• Optimizing portfolio by actively exiting lower-growth and lower-margin non-strategic assets
Advancing category leadership with differentiated solutions and innovation• Capitalizing on new product momentum with revenue of $200M+ in 1H 2019
• Increasing R&D investments in innovation, connectivity and data
Note: Adjusted gross margin, operating margin and EPS are non-GAAP measures. See reconciliation to reported GAAP numbers in the appendix to this presentation *Core revenue excludes foreign currency, divestitures and non-strategic assets the company may exit, including Surgical Solutions international OEM business
Enhancing Shareholder Value By Executing Our Strategy
Page 7
© 2019 Hill-Rom Services, Inc. ALL RIGHTS RESERVED
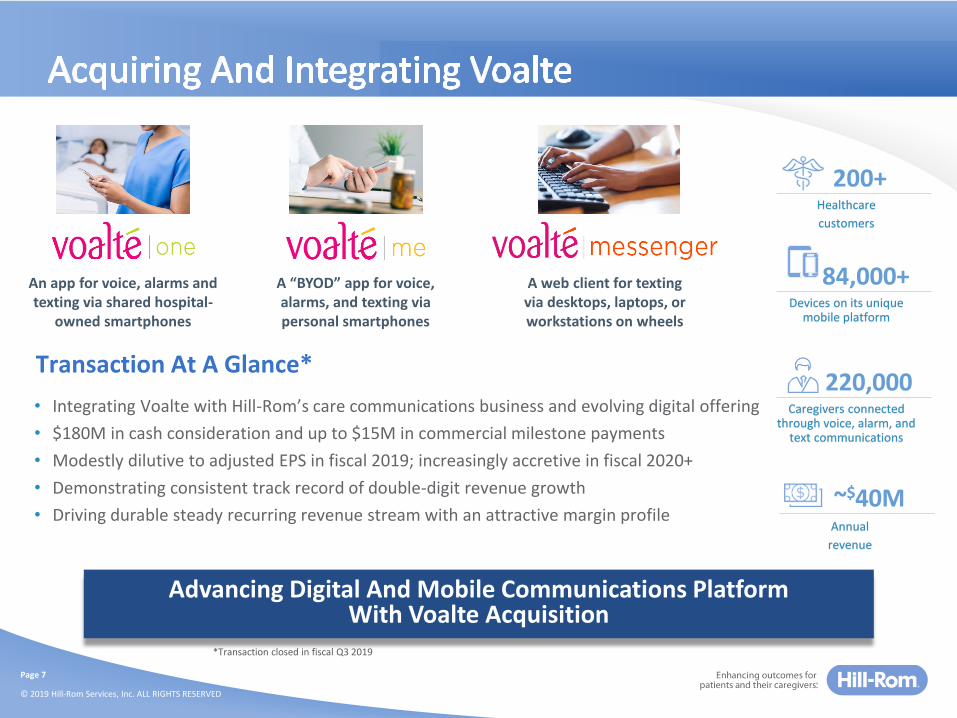
200+Healthcare
customers
An app for voice, alarms and texting via shared hospital-
owned smartphones
A “BYOD” app for voice, alarms, and texting via personal smartphones
A web client for texting via desktops, laptops, or workstations on wheels
Advancing Digital And Mobile Communications PlatformWith Voalte Acquisition
84,000+Devices on its unique
mobile platform
220,000Caregivers connected
through voice, alarm, and text communications
~$40MAnnual
revenue
• Integrating Voalte with Hill-Rom’s care communications business and evolving digital offering
• $180M in cash consideration and up to $15M in commercial milestone payments
• Modestly dilutive to adjusted EPS in fiscal 2019; increasingly accretive in fiscal 2020+
• Demonstrating consistent track record of double-digit revenue growth
• Driving durable steady recurring revenue stream with an attractive margin profile
Transaction At A Glance*
*Transaction closed in fiscal Q3 2019
Q2 2019 Financial Summary
Page 9
© 2019 Hill-Rom Services, Inc. ALL RIGHTS RESERVED
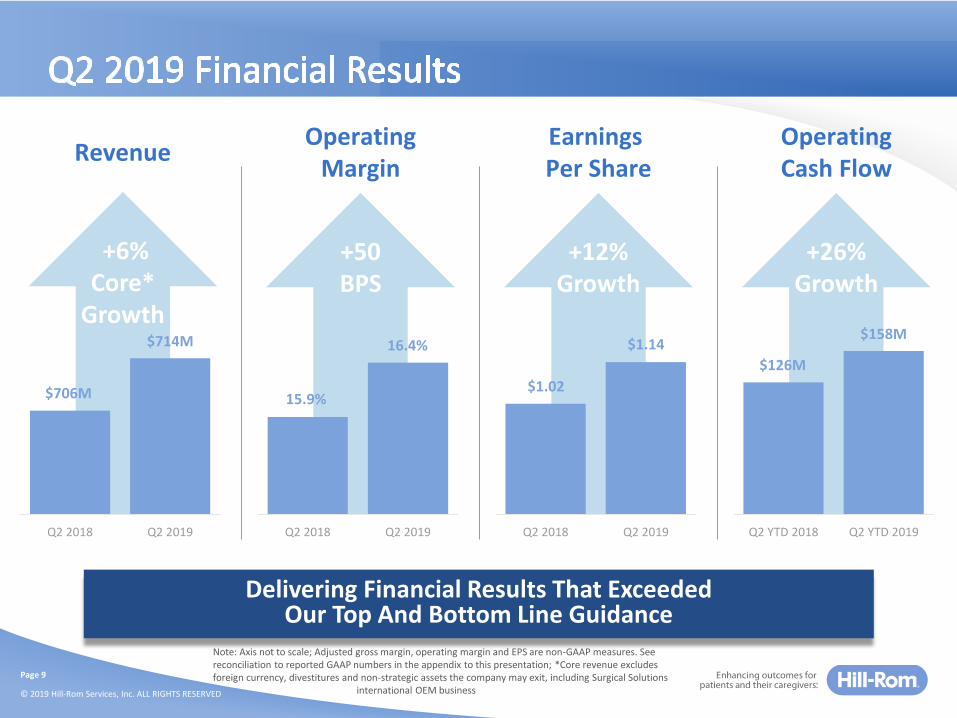
Note: Axis not to scale; Adjusted gross margin, operating margin and EPS are non-GAAP measures. See reconciliation to reported GAAP numbers in the appendix to this presentation; *Core revenue excludes foreign currency, divestitures and non-strategic assets the company may exit, including Surgical Solutions
international OEM business
+12%Growth
Q2 2018 Q2 2019
$1.02
+6%Core*
Growth
Q2 2018 Q2 2019
+26%Growth
+50BPS
Q2 2018 Q2 2019
Delivering Financial Results That Exceeded Our Top And Bottom Line Guidance
$706M 15.9%
Q2 YTD 2018 Q2 YTD 2019
OperatingMargin
RevenueEarnings Per Share
OperatingCash Flow
$714M 16.4% $1.14
$126M
$158M

Page 10
© 2019 Hill-Rom Services, Inc. ALL RIGHTS RESERVED
Fiscal Second Quarter
Adjusted P&L 2018 2019YOY
Change
Revenue $706M $714M
Gross Margin 49.2% 49.4% +20 bps
Operating Margin 15.9% 16.4% +50 bps
Adjusted EPS $1.02 $1.14 +12%
+6%core*
growth
Driving 15th Consecutive Quarter Of Double-Digit Adjusted EPS Growth
+3%constant currency
Note: Adjusted gross margin, operating margin and EPS are non-GAAP measures. See reconciliation to reported GAAP numbers in the appendix to this presentation *Core revenue excludes foreign currency, divestitures and non-strategic assets the company may exit, including Surgical Solutions international OEM
business

Page 11
© 2019 Hill-Rom Services, Inc. ALL RIGHTS RESERVED
*Core revenue excludes foreign currency, divestitures and non-strategic assets the company may exit, including Surgical Solutions international OEM business
Accelerating Core Revenue With FOUR CONSECUTIVE QUARTERS Of Mid-Single Digit Growth
Q1 2018 Q2 2018 Q3 2018 Q4 2018 Q1 2019 Q2 2019
+2%
+4%
+6%
+2%
+4%
+6%

Page 12
© 2019 Hill-Rom Services, Inc. ALL RIGHTS RESERVED
Delivering highest quarterly U.S. core growth in three years
Generating double-digit growth in U.S. Med-Surg, CWS, and patient handling
Benefiting from strong U.S. Med-Surg bed system orders and backlog
Divesting and winding down lower-margin third-party businesses
Delivering +30% growth of Integrated Table Motion
Driving strong growth in U.S. operating room, patient positioning equipment
Advancing innovation and partnerships to drive future growth
Exiting lower-growth and lower-margin international OEM businesses
Driving sustainable growth with new products
Delivering balanced U.S. and international growth
Continuing momentum in Respiratory Care portfolio with double-digit growth
Benefiting from expansion into new markets and channels
Patient Support Systems Surgical SolutionsFront Line Care
Note: All revenue growth rates are constant currency *Core revenue excludes foreign currency, divestitures and non-strategic assets the company may exit, including Surgical Solutions international OEM business
Q2 2019 YTD 2019 Q2 2019 YTD 2019 Q2 2019 YTD 2019
Page 13
© 2019 Hill-Rom Services, Inc. ALL RIGHTS RESERVED
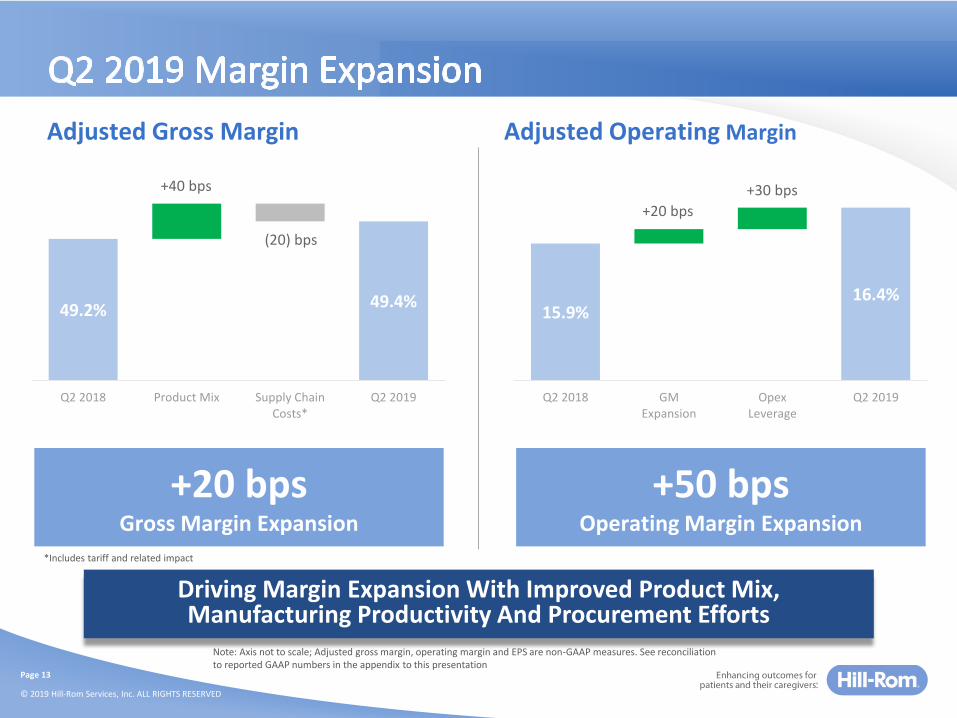
15.9%16.4%
Q2 2018 GMExpansion
OpexLeverage
Q2 2019
+20 bpsGross Margin Expansion
Driving Margin Expansion With Improved Product Mix, Manufacturing Productivity And Procurement Efforts
49.2% 49.4%
Q2 2018 Product Mix Supply ChainCosts*
Q2 2019
Adjusted Gross Margin Adjusted Operating Margin
+40 bps
+20 bps
+50 bpsOperating Margin Expansion
Note: Axis not to scale; Adjusted gross margin, operating margin and EPS are non-GAAP measures. See reconciliation to reported GAAP numbers in the appendix to this presentation
+30 bps
(20) bps
*Includes tariff and related impact
Page 14
© 2019 Hill-Rom Services, Inc. ALL RIGHTS RESERVED
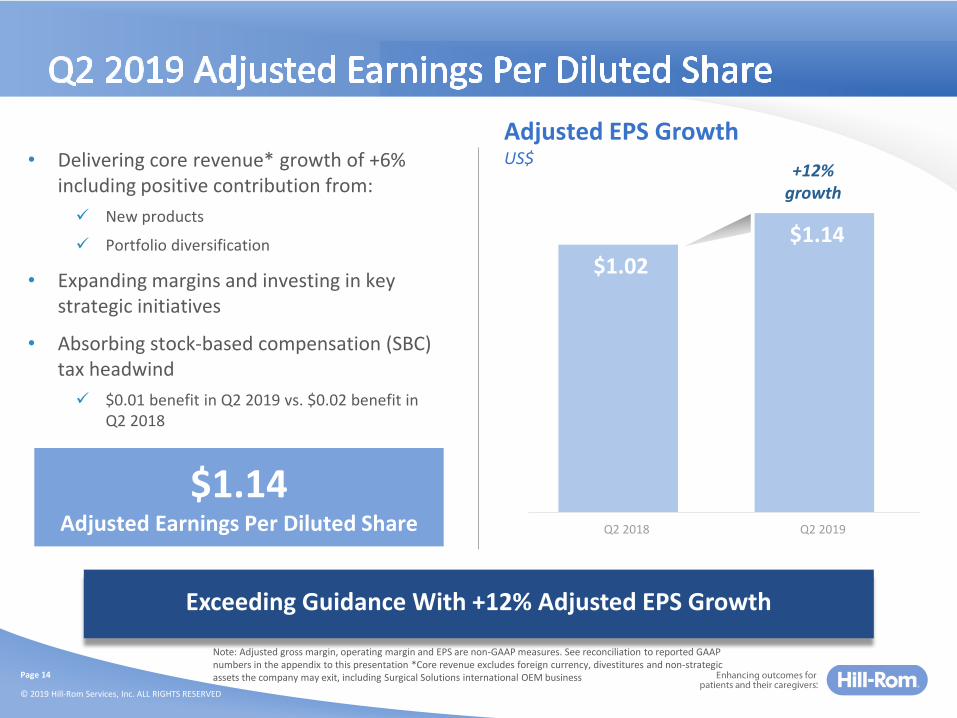
$1.02
$1.14
Q2 2018 Q2 2019
$1.14Adjusted Earnings Per Diluted Share
Exceeding Guidance With +12% Adjusted EPS Growth
Adjusted EPS GrowthUS$
Note: Adjusted gross margin, operating margin and EPS are non-GAAP measures. See reconciliation to reported GAAP numbers in the appendix to this presentation *Core revenue excludes foreign currency, divestitures and non-strategic assets the company may exit, including Surgical Solutions international OEM business
+12%growth
• Delivering core revenue* growth of +6% including positive contribution from:
✓ New products
✓ Portfolio diversification
• Expanding margins and investing in key strategic initiatives
• Absorbing stock-based compensation (SBC) tax headwind
✓ $0.01 benefit in Q2 2019 vs. $0.02 benefit in Q2 2018

Page 15
© 2019 Hill-Rom Services, Inc. ALL RIGHTS RESERVED
Balanced Capital Allocation
• Reducing debt levels
• Re-investing in business (R&D and CapEx)
• Sustaining quarterly dividend
• Improved ability to deploy capital with disciplined M&A strategy✓ Accelerated growth with diversified revenue
streams; attractive financial returns
✓ Strengthening clinical and economic value with customers
✓ Adding experienced business resources
Cash FlowUS$ Millions
$126
$74
$158
$127
OperatingCash Flow
FreeCash Flow
Q2 YTD 2018
Q2 YTD 2019
~4.5x → ~3.2x
Generating Strong Operating And Free Cash Flow
Peak Leverage FY 2018 Leverage
Note: Leverage calculated as Total Debt divided by EBITDA as defined in Hill-Rom’s compliance certificate under its existing credit facility
Operating Cash Flow Growth
+71%Free Cash Flow
Growth
+26%

2019 Financial Outlook

Page 17
© 2019 Hill-Rom Services, Inc. ALL RIGHTS RESERVED
Updating FY 2019 Outlook For 1H Performance And Voalte Acquisition
Note: Adjusted gross margin, operating margin and EPS are non-GAAP measures. See reconciliation to reported GAAP numbers in the appendix to this presentation *Core revenue includes the Voalte acquisition but excludes foreign currency, divestitures and non-strategic assets the company may exit, including Surgical Solutions
international OEM business
+80 - 100 bpsOperating Margin
Expansion
5% - 6%Core Revenue*
Growth
Adjusted P&L
2019 Prior Outlook
2019 Current Outlook
Revenue Growth
(reported) 1% - 2% 2% - 3%
Gross Margin +50 bps +50 - 70 bps
Operating Margin +100 bps +80 - 100 bps
Adjusted EPS $4.98 - $5.06 $5.02 - $5.06
Operating Cash Flow ~$420M ~$420M
Capital Expenditures ~$90M ~$90M
8% - 9%Adjusted EPS Growth
Adjusted EPS Growth Excluding SBC
13% - 14%
Page 18
© 2019 Hill-Rom Services, Inc. ALL RIGHTS RESERVED
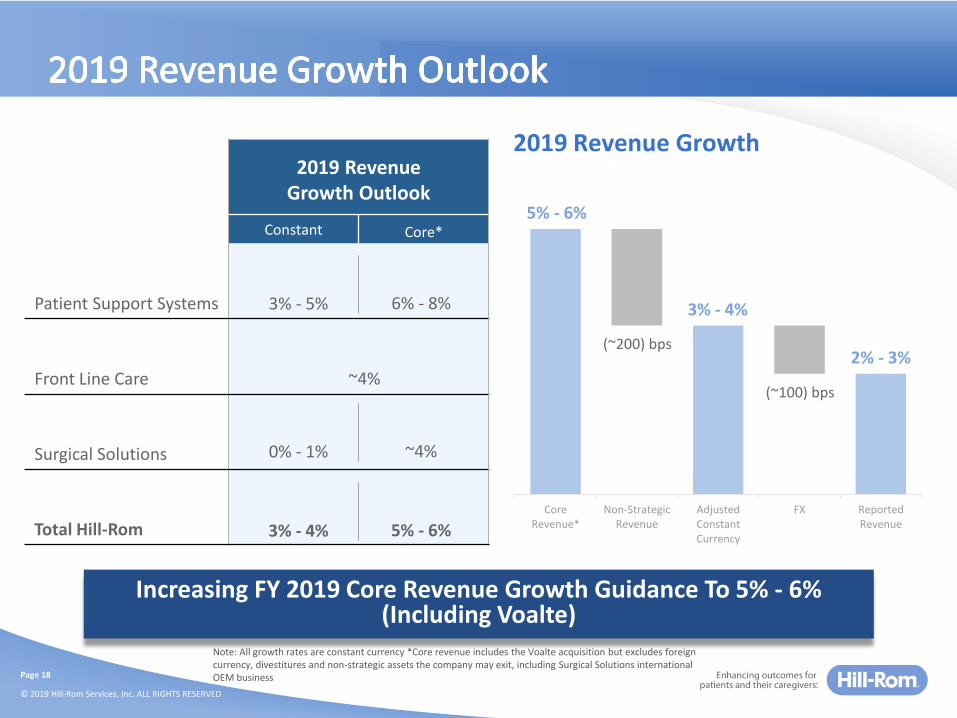
CoreRevenue*
Non-StrategicRevenue
AdjustedConstantCurrency
FX ReportedRevenue
Increasing FY 2019 Core Revenue Growth Guidance To 5% - 6% (Including Voalte)
2019 Revenue Growth
5% - 6%
2% - 3%
2019 Revenue Growth Outlook
Constant Core*
Patient Support Systems
Front Line Care ~4%
Surgical Solutions
Total Hill-Rom
3% - 5% 6% - 8%
3% - 4% 5% - 6%
3% - 4%
Note: All growth rates are constant currency *Core revenue includes the Voalte acquisition but excludes foreign currency, divestitures and non-strategic assets the company may exit, including Surgical Solutions international OEM business
0% - 1% ~4%
(~200) bps
(~100) bps

Page 19
© 2019 Hill-Rom Services, Inc. ALL RIGHTS RESERVED
Q3 2019 Outlook Reflects:
• Incorporating Voalte acquisition
• Sustaining core business momentum
• Benefiting from new products
• Investing in key strategic initiatives to drive future growth
• Absorbing $0.02 per diluted share headwind from Q3 2018 SBC
• Realizing modest dilution associated with Voalte acquisition
Adjusted P&L
Q3 2019Outlook
Revenue Growth ~2%Reported
Revenue Growth
Adjusted EPS $1.20 - $1.22
Driving Core Revenue Growth While InvestingIn Key Strategic Growth Initiatives
~3%Constant
4% - 5%Core*
*Core revenue includes the Voalte acquisition but excludes foreign currency, divestitures and non-strategic assets the company may exit, including Surgical Solutions international OEM business
Page 20
© 2019 Hill-Rom Services, Inc. ALL RIGHTS RESERVED
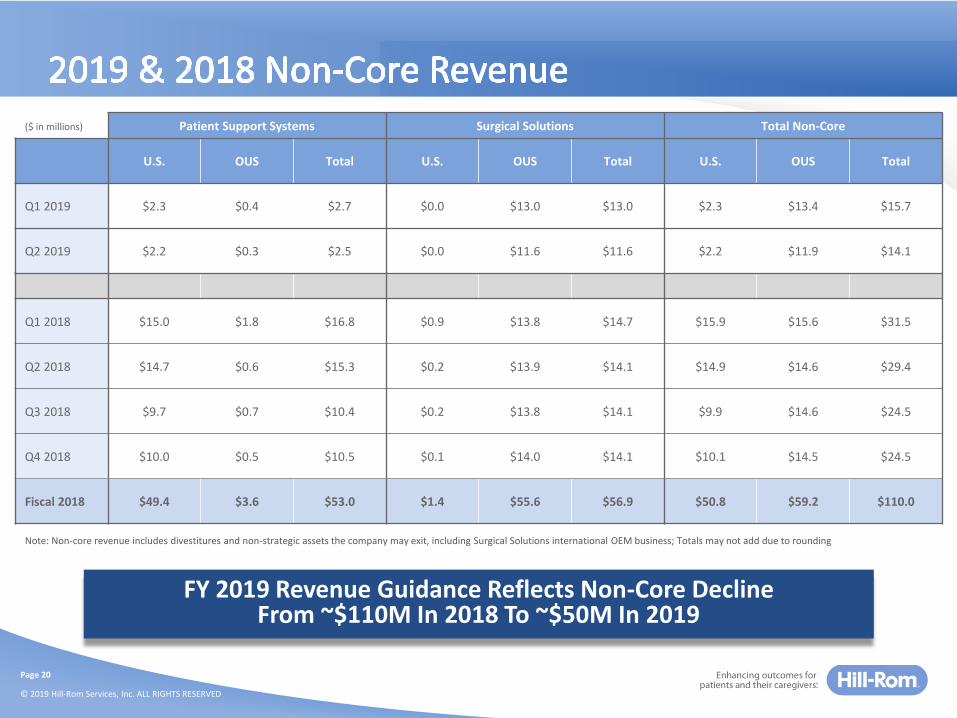
Note: Non-core revenue includes divestitures and non-strategic assets the company may exit, including Surgical Solutions international OEM business; Totals may not add due to rounding
FY 2019 Revenue Guidance Reflects Non-Core Decline From ~$110M In 2018 To ~$50M In 2019
Patient Support Systems Surgical Solutions Total Non-Core
U.S. OUS Total U.S. OUS Total U.S. OUS Total
Q1 2019 $2.3 $0.4 $2.7 $0.0 $13.0 $13.0 $2.3 $13.4 $15.7
Q2 2019 $2.2 $0.3 $2.5 $0.0 $11.6 $11.6 $2.2 $11.9 $14.1
($ in millions)
Q1 2018 $15.0 $1.8 $16.8 $0.9 $13.8 $14.7 $15.9 $15.6 $31.5
Q2 2018 $14.7 $0.6 $15.3 $0.2 $13.9 $14.1 $14.9 $14.6 $29.4
Q3 2018 $9.7 $0.7 $10.4 $0.2 $13.8 $14.1 $9.9 $14.6 $24.5
Q4 2018 $10.0 $0.5 $10.5 $0.1 $14.0 $14.1 $10.1 $14.5 $24.5
Fiscal 2018 $49.4 $3.6 $53.0 $1.4 $55.6 $56.9 $50.8 $59.2 $110.0

ASC 606Supplemental Schedules

Page 22
© 2019 Hill-Rom Services, Inc. ALL RIGHTS RESERVED
Q2 Adjusted P&L Under ASC 606
Q2 2018 Q2 2019 Growth
ASC 606 ASC 606 vs. PY
Revenue $705.5 $714.2 1.2%
Gross Profit $346.9 $352.6 1.6%% of Sales 49.2% 49.4% 20 bps
Research & Dev $34.7 $36.6 5.5%% of Sales 4.9% 5.1%
Sales, Gen & Admin $200.3 $199.0 -0.6%% of Sales 28.4% 27.9%
Operating Income $112.0 $117.0 4.5%% of Sales 15.9% 16.4% 50 bps
Interest $24.6 $20.6 -16.3%
Pretax $87.4 $96.4 10.3%
Tax Expense $18.5 $19.7 6.6%Tax Rate 21.1% 20.4%
Net Income $68.9 $76.7 11.3%
Diluted Shares 67.6 67.3
EPS $1.02 $1.14 11.8%
($ in millions)
Note: Adjusted gross margin, operating margin and EPS are non-GAAP measures. See reconciliation of non-GAAP disclosures in the appendix to this presentation

Page 23
© 2019 Hill-Rom Services, Inc. ALL RIGHTS RESERVED
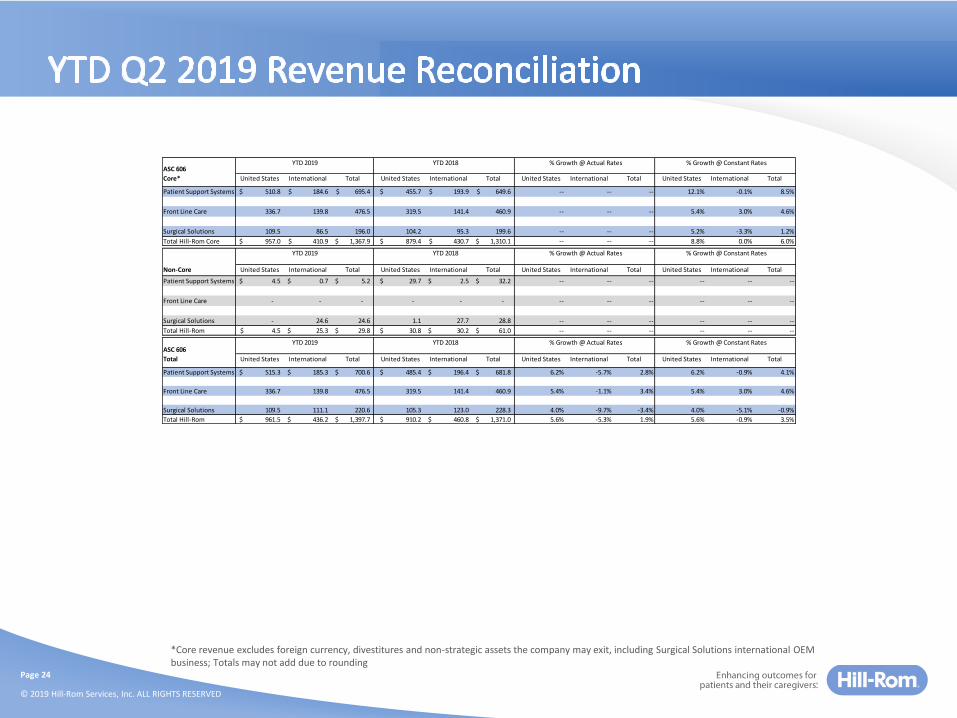
*Core revenue excludes foreign currency, divestitures and non-strategic assets the company may exit, including Surgical Solutions international OEM business; Totals may not add due to rounding
ASC 606
Core* United States International Total United States International Total United States International Total United States International Total
Patient Support Systems 245.8$ 92.5$ 338.3$ 226.8$ 88.4$ 315.2$ -- -- -- 8.3% 8.4% 8.3%
Front Line Care 166.5 66.9 233.4 156.4 66.4 222.8 -- -- -- 6.5% 3.3% 5.5%
Surgical Solutions 53.9 42.2 96.1 50.0 46.1 96.0 -- -- -- 7.4% -4.1% 2.0%
Total Hill-Rom Core 466.2$ 201.6$ 667.8$ 433.2$ 200.9$ 634.0$ -- -- -- 7.5% 3.6% 6.3%
Non-Core United States International Total United States International Total United States International Total United States International Total
Patient Support Systems 2.3$ 0.4$ 2.7$ 15.0$ 1.8$ 16.8$ -- -- -- -- -- --
Front Line Care - - - - - - -- -- -- -- -- --
Surgical Solutions - 13.0 13.0 0.9 13.8 14.7 -- -- -- -- -- --
Total Hill-Rom 2.3$ 13.4$ 15.7$ 15.9$ 15.6$ 31.5$ -- -- -- -- -- --
ASC 606
Total United States International Total United States International Total United States International Total United States International Total
Patient Support Systems 248.1$ 92.9$ 341.0$ 241.8$ 90.2$ 332.0$ 2.6% 3.0% 2.7% 2.6% 6.4% 3.6%
Front Line Care 166.5 66.9 233.4 156.4 66.4 222.8 6.5% 0.7% 4.7% 6.5% 3.3% 5.5%
Surgical Solutions 53.9 55.2 109.1 50.9 59.8 110.7 5.9% -7.7% -1.5% 5.9% -5.1% 0.0%
Total Hill-Rom 468.5$ 215.0$ 683.5$ 449.1$ 216.4$ 665.5$ 4.3% -0.7% 2.7% 4.3% 2.3% 3.7%
ASC 606
Core* United States International Total United States International Total United States International Total United States International Total
Patient Support Systems 265.0$ 92.1$ 357.1$ 228.9$ 105.6$ 334.5$ -- -- -- 15.8% -7.4% 8.7%
Front Line Care 170.2 72.9 243.1 163.1 75.0 238.1 -- -- -- 4.4% 2.7% 3.8%
Surgical Solutions 55.6 44.3 99.9 54.3 49.3 103.5 -- -- -- 3.1% -2.6% 0.5%
Total Hill-Rom Core 490.8$ 209.3$ 700.1$ 446.2$ 229.8$ 676.1$ -- -- -- 10.0% -3.3% 5.6%
Non-Core United States International Total United States International Total United States International Total United States International Total
Patient Support Systems 2.2$ 0.3$ 2.5$ 14.7$ 0.6$ 15.3$ -- -- -- -- -- --
Front Line Care - - - - - - -- -- -- -- -- --
Surgical Solutions - 11.6 11.6 0.2 13.9 14.1 -- -- -- -- -- --
Total Hill-Rom 2.2$ 11.9$ 14.1$ 14.9$ 14.6$ 29.4$ -- -- -- -- -- --
ASC 606
Total United States International Total United States International Total United States International Total United States International Total
Patient Support Systems 267.2$ 92.4$ 359.6$ 243.6$ 106.2$ 349.8$ 9.7% -13.0% 2.8% 9.7% -7.2% 4.6%
Front Line Care 170.2 72.9 243.1 163.1 75.0 238.1 4.4% -2.8% 2.1% 4.4% 2.7% 3.8%
Surgical Solutions 55.6 55.9 111.5 54.4 63.2 117.6 2.2% -11.6% -5.2% 2.2% -5.2% -1.8%
Total Hill-Rom 493.0$ 221.2$ 714.2$ 461.1$ 244.4$ 705.5$ 6.9% -9.5% 1.2% 6.9% -3.6% 3.3%
Q1 2019 Q1 2018 % Growth @ Actual Rates % Growth @ Constant Rates
Q1 2019 Q1 2018 % Growth @ Actual Rates % Growth @ Constant Rates
Q1 2019 Q1 2018 % Growth @ Actual Rates % Growth @ Constant Rates
Q2 2019 Q2 2018 % Growth @ Actual Rates % Growth @ Constant Rates
Q2 2019 Q2 2018 % Growth @ Actual Rates % Growth @ Constant Rates
Q2 2019 Q2 2018 % Growth @ Actual Rates % Growth @ Constant Rates
Page 24
© 2019 Hill-Rom Services, Inc. ALL RIGHTS RESERVED
*Core revenue excludes foreign currency, divestitures and non-strategic assets the company may exit, including Surgical Solutions international OEM business; Totals may not add due to rounding
ASC 606
Core* United States International Total United States International Total United States International Total United States International Total
Patient Support Systems 510.8$ 184.6$ 695.4$ 455.7$ 193.9$ 649.6$ -- -- -- 12.1% -0.1% 8.5%
Front Line Care 336.7 139.8 476.5 319.5 141.4 460.9 -- -- -- 5.4% 3.0% 4.6%
Surgical Solutions 109.5 86.5 196.0 104.2 95.3 199.6 -- -- -- 5.2% -3.3% 1.2%
Total Hill-Rom Core 957.0$ 410.9$ 1,367.9$ 879.4$ 430.7$ 1,310.1$ -- -- -- 8.8% 0.0% 6.0%
Non-Core United States International Total United States International Total United States International Total United States International Total
Patient Support Systems 4.5$ 0.7$ 5.2$ 29.7$ 2.5$ 32.2$ -- -- -- -- -- --
Front Line Care - - - - - - -- -- -- -- -- --
Surgical Solutions - 24.6 24.6 1.1 27.7 28.8 -- -- -- -- -- --
Total Hill-Rom 4.5$ 25.3$ 29.8$ 30.8$ 30.2$ 61.0$ -- -- -- -- -- --
ASC 606
Total United States International Total United States International Total United States International Total United States International Total
Patient Support Systems 515.3$ 185.3$ 700.6$ 485.4$ 196.4$ 681.8$ 6.2% -5.7% 2.8% 6.2% -0.9% 4.1%
Front Line Care 336.7 139.8 476.5 319.5 141.4 460.9 5.4% -1.1% 3.4% 5.4% 3.0% 4.6%
Surgical Solutions 109.5 111.1 220.6 105.3 123.0 228.3 4.0% -9.7% -3.4% 4.0% -5.1% -0.9%
Total Hill-Rom 961.5$ 436.2$ 1,397.7$ 910.2$ 460.8$ 1,371.0$ 5.6% -5.3% 1.9% 5.6% -0.9% 3.5%
YTD 2019 YTD 2018 % Growth @ Actual Rates % Growth @ Constant Rates
YTD 2019 YTD 2018 % Growth @ Actual Rates % Growth @ Constant Rates
YTD 2019 YTD 2018 % Growth @ Actual Rates % Growth @ Constant Rates

Page 25
© 2019 Hill-Rom Services, Inc. ALL RIGHTS RESERVED
Q1 Q2 Q3 Q4 FY Q1 Q2 Q3 Q4 FY
17 Act 17 Act 17 Act 17 Act 17 Act 18 Act 18 Act 18 Act 18 Act 18 Act
Revenue $635.8 $682.7 $686.8 $731.0 $2,736.3 $665.5 $705.5 $703.5 $759.2 $2,833.7
Gross Profit $302.0 $328.6 $330.3 $357.7 $1,318.7 $316.6 $346.9 $343.7 $376.9 $1,384.2% of Sales 47.5% 48.1% 48.1% 48.9% 48.2% 47.6% 49.2% 48.9% 49.6% 48.8%
Research & Dev $32.0 $35.3 $34.9 $31.5 $133.7 $32.3 $34.7 $33.6 $35.0 $135.6% of Sales 5.0% 5.2% 5.1% 4.3% 4.9% 4.9% 4.9% 4.8% 4.6% 4.8%
Sales, Gen & Admin $214.7 $225.6 $255.9 $218.3 $914.4 $235.3 $269.4 $235.8 $228.9 $969.4% of Sales 33.8% 33.0% 37.3% 29.9% 33.4% 35.4% 38.2% 33.5% 30.2% 34.2%
Operating Income $55.3 $67.8 $39.6 $107.9 $270.6 $49.0 $42.9 $74.3 $113.0 $279.2% of Sales 8.7% 9.9% 5.8% 14.8% 9.9% 7.4% 6.1% 10.6% 14.9% 9.9%
Interest $20.7 $22.3 $24.3 $23.1 $90.4 $21.3 $24.6 $23.1 $23.3 $92.3
Pretax $34.6 $45.5 $15.3 $84.8 $180.2 $27.7 $18.3 $51.3 $89.7 $186.9
Tax Expense $11.4 $8.0 $9.9 $19.4 $48.7 ($57.9) ($7.9) $9.2 ($1.6) ($58.2)Tax Rate 32.9% 17.5% 64.9% 22.9% 27.0% 208.9% 43.3% 17.9% 1.8% 31.1%
Net Income $23.2 $37.5 $5.4 $65.4 $131.5 $85.6 $26.2 $42.1 $91.3 $245.1
Non-Controlling Interests ($0.3) ($0.4) ($0.3) ($0.3) ($1.3) $0.0 $0.0 $0.0 $0.0 $0.0
Net Income - Attributed to HRC $23.5 $37.9 $5.7 $65.7 $132.8 $85.6 $26.2 $42.1 $91.3 $245.1
Diluted Shares 66.9 67.1 67.7 67.4 67.2 67.4 67.6 67.6 67.8 67.6
EPS $0.35 $0.56 $0.08 $0.98 $1.98 $1.27 $0.39 $0.62 $1.35 $3.63
($ in millions)
Note: Totals may not add due to rounding

Page 26
© 2019 Hill-Rom Services, Inc. ALL RIGHTS RESERVED
($ in millions)
Note: Adjusted gross margin, operating margin and EPS are non-GAAP measures. See reconciliation of non-GAAP disclosures in the appendix to this presentation; Totals may not add due to rounding
Q1 Q2 Q3 Q4 FY Q1 Q2 Q3 Q4 FY
17 Act 17 Act 17 Act 17 Act 17 Act 18 Act 18 Act 18 Act 18 Act 18 Act
Revenue $635.8 $682.7 $686.8 $731.0 $2,736.3 $665.5 $705.5 $703.5 $759.2 $2,833.7
Gross Profit $302.2 $330.0 $332.1 $359.3 $1,323.5 $316.6 $346.9 $343.7 $376.9 $1,384.2% of Sales 47.5% 48.3% 48.3% 49.1% 48.4% 47.6% 49.2% 48.9% 49.6% 48.8%
Research & Dev $32.0 $35.3 $34.9 $31.5 $133.7 $32.3 $34.7 $33.6 $35.0 $135.6% of Sales 5.0% 5.2% 5.1% 4.3% 4.9% 4.9% 4.9% 4.8% 4.6% 4.8%
Sales, Gen & Admin $177.5 $188.7 $187.2 $190.9 $744.4 $188.7 $200.3 $191.7 $185.8 $766.5% of Sales 27.9% 27.6% 27.3% 26.1% 27.2% 28.4% 28.4% 27.3% 24.5% 27.0%
Operating Income $92.7 $106.0 $109.9 $136.9 $445.5 $95.6 $112.0 $118.4 $156.1 $482.1% of Sales 14.6% 15.5% 16.0% 18.7% 16.3% 14.4% 15.9% 16.8% 20.6% 17.0%
Interest $21.7 $22.3 $24.3 $23.1 $91.4 $22.3 $24.6 $23.1 $23.4 $93.3
Pretax $71.0 $83.7 $85.6 $113.8 $354.0 $73.3 $87.4 $95.4 $132.7 $388.9
Tax Expense $21.2 $21.4 $25.1 $29.0 $96.7 $14.2 $18.5 $20.5 $21.6 $74.8Tax Rate 29.8% 25.6% 29.3% 25.4% 27.3% 19.3% 21.1% 21.5% 16.3% 19.2%
Net Income $49.8 $62.2 $60.6 $84.9 $257.3 $59.2 $68.9 $74.9 $111.1 $314.1
Non-Controlling Interests ($0.3) ($0.4) ($0.3) ($0.3) ($1.3) $0.0 $0.0 $0.0 $0.0 $0.0
Net Income - Attributed to HRC $50.1 $62.6 $60.9 $85.1 $258.6 $59.2 $68.9 $74.9 $111.1 $314.1
Diluted Shares 66.9 67.1 67.7 67.4 67.2 67.4 67.6 67.6 67.8 67.6
EPS $0.75 $0.93 $0.90 $1.26 $3.85 $0.88 $1.02 $1.11 $1.64 $4.65
2018 Reconciliation Of ASC 605 To ASC 606

Page 28
© 2019 Hill-Rom Services, Inc. ALL RIGHTS RESERVED
Q1 2018 Adjusted P&L - Reconciliation Q1 2019 Adjusted P&L - Reconciliation
Q1 2018 ASC 606 Q1 2018
ASC 605 Impact ASC 606
Revenue $669.7 ($4.2) $665.5
Gross Profit $319.6 ($3.0) $316.6% of Sales 47.7% 47.6%
Research & Dev $32.3 $0.0 $32.3% of Sales 4.8% 4.9%
Sales, Gen & Admin $188.6 $0.1 $188.7% of Sales 28.2% 28.4%
Operating Income $98.7 ($3.1) $95.6% of Sales 14.7% 14.4%
Interest $22.3 $0.0 $22.3
Pretax $76.4 ($3.1) $73.3
Tax Expense $14.6 ($0.4) $14.2Tax Rate 19.1% 19.3%
Net Income $61.8 ($2.7) $59.2
Diluted Shares 67.4 67.4
EPS $0.92 ($0.04) $0.88
Q2 2018 Adjusted P&L - Reconciliation Q2 2019 Adjusted P&L - Reconciliation
Q2 2018 ASC 606 Q2 2018
ASC 605 Impact ASC 606
Revenue $710.5 ($5.0) $705.5
Gross Profit $350.4 ($3.5) $346.9% of Sales 49.3% 49.2%
Research & Dev $34.7 $0.0 $34.7% of Sales 4.9% 4.9%
Sales, Gen & Admin $200.5 ($0.2) $200.3% of Sales 28.2% 28.4%
Operating Income $115.2 ($3.2) $112.0% of Sales 16.2% 15.9%
Interest $24.6 $0.0 $24.6
Pretax $90.6 ($3.2) $87.4
Tax Expense $19.4 ($0.9) $18.5Tax Rate 21.4% 21.1%
Net Income $71.2 ($2.3) $68.9
Diluted Shares 67.6 67.6
EPS $1.05 ($0.03) $1.02
($ in millions) ($ in millions)
Note: Adjusted gross margin, operating margin and EPS are non-GAAP measures. See reconciliation of non-GAAP disclosures in the appendix to this presentation
Page 29
© 2019 Hill-Rom Services, Inc. ALL RIGHTS RESERVED
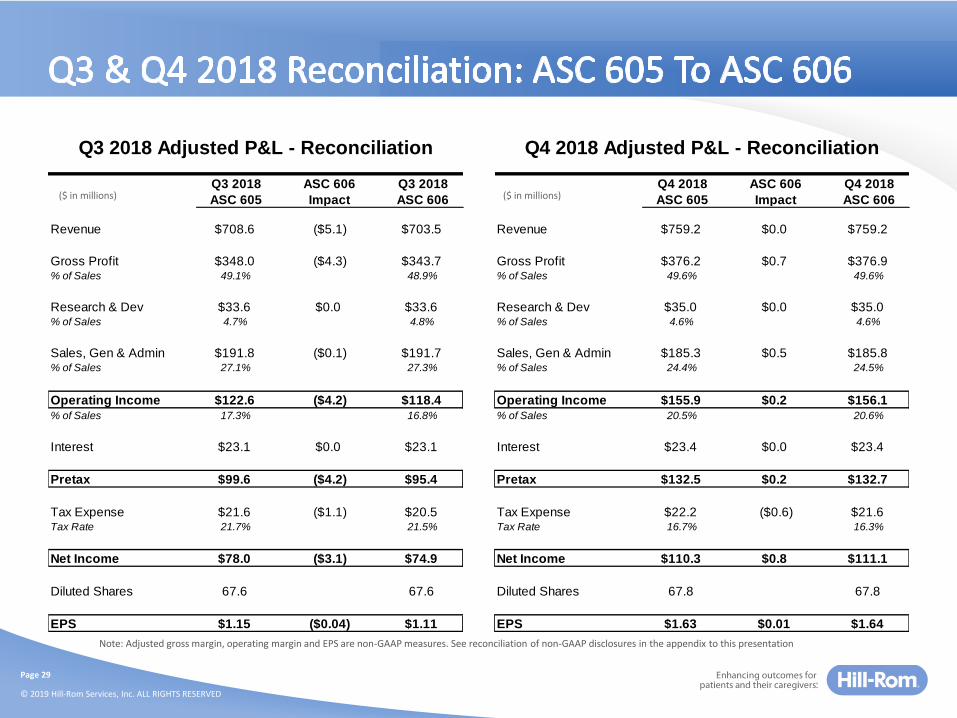
Q4 2018 Adjusted P&L - Reconciliation Q4 2019 Adjusted P&L - Reconciliation
Q4 2018 ASC 606 Q4 2018
ASC 605 Impact ASC 606
Revenue $759.2 $0.0 $759.2
Gross Profit $376.2 $0.7 $376.9% of Sales 49.6% 49.6%
Research & Dev $35.0 $0.0 $35.0% of Sales 4.6% 4.6%
Sales, Gen & Admin $185.3 $0.5 $185.8% of Sales 24.4% 24.5%
Operating Income $155.9 $0.2 $156.1% of Sales 20.5% 20.6%
Interest $23.4 $0.0 $23.4
Pretax $132.5 $0.2 $132.7
Tax Expense $22.2 ($0.6) $21.6Tax Rate 16.7% 16.3%
Net Income $110.3 $0.8 $111.1
Diluted Shares 67.8 67.8
EPS $1.63 $0.01 $1.64
Q3 2018 Adjusted P&L - Reconciliation Q3 2019 Adjusted P&L - Reconciliation
Q3 2018 ASC 606 Q3 2018
ASC 605 Impact ASC 606
Revenue $708.6 ($5.1) $703.5
Gross Profit $348.0 ($4.3) $343.7% of Sales 49.1% 48.9%
Research & Dev $33.6 $0.0 $33.6% of Sales 4.7% 4.8%
Sales, Gen & Admin $191.8 ($0.1) $191.7% of Sales 27.1% 27.3%
Operating Income $122.6 ($4.2) $118.4% of Sales 17.3% 16.8%
Interest $23.1 $0.0 $23.1
Pretax $99.6 ($4.2) $95.4
Tax Expense $21.6 ($1.1) $20.5Tax Rate 21.7% 21.5%
Net Income $78.0 ($3.1) $74.9
Diluted Shares 67.6 67.6
EPS $1.15 ($0.04) $1.11
($ in millions) ($ in millions)
Note: Adjusted gross margin, operating margin and EPS are non-GAAP measures. See reconciliation of non-GAAP disclosures in the appendix to this presentation

Page 30
© 2019 Hill-Rom Services, Inc. ALL RIGHTS RESERVED
FY 2018 Adjusted P&L - Reconciliation FY 2019 Adjusted P&L - Reconciliation
FY 2018 ASC 606 FY 2018
ASC 605 Impact ASC 606
Revenue $2,848.0 ($14.3) $2,833.7
Gross Profit $1,394.2 ($10.0) $1,384.2% of Sales 49.0% 48.8%
Research & Dev $135.6 $0.0 $135.6% of Sales 4.8% 4.8%
Sales, Gen & Admin $766.1 $0.3 $766.4% of Sales 26.9% 27.0%
Operating Income $492.5 ($10.3) $482.1% of Sales 17.3% 17.0%
Interest $93.3 $0.0 $93.3
Pretax $399.2 ($10.3) $388.9
Tax Expense $77.8 ($3.0) $74.8Tax Rate 19.5% 19.2%
Net Income $321.4 ($7.3) $314.1
Diluted Shares 67.6 67.6
EPS $4.75 ($0.10) $4.65
($ in millions)
Note: Adjusted gross margin, operating margin and EPS are non-GAAP measures. See reconciliation of non-GAAP disclosures in the appendix to this presentation
AppendixReconciliations Of Non-GAAP Disclosures
Page 32
© 2019 Hill-Rom Services, Inc. ALL RIGHTS RESERVED
Gross
Margin
Operating
Margin1
Income
Before
Income
Taxes
Income
Tax
Expense
Diluted
EPS1
Gross
Margin
Operating
Margin1
Income
Before
Income
Taxes
Income
Tax
Expense Diluted EPS
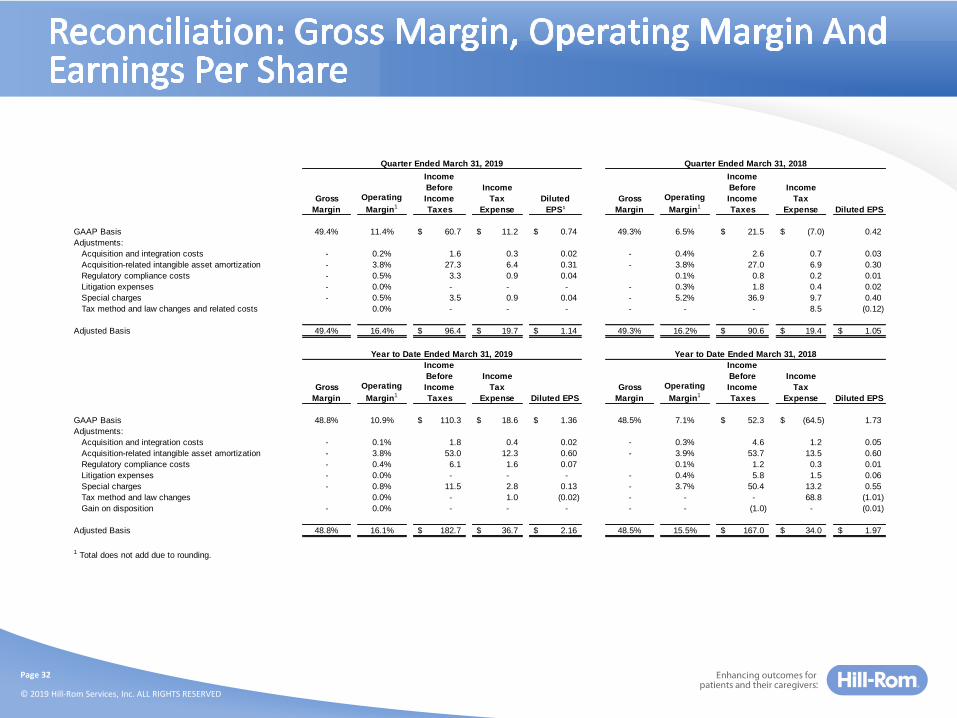
GAAP Basis 49.4% 11.4% 60.7$ 11.2$ 0.74$ 49.3% 6.5% 21.5$ (7.0)$ 0.42
Adjustments:
Acquisition and integration costs - 0.2% 1.6 0.3 0.02 - 0.4% 2.6 0.7 0.03
Acquisition-related intangible asset amortization - 3.8% 27.3 6.4 0.31 - 3.8% 27.0 6.9 0.30
Regulatory compliance costs - 0.5% 3.3 0.9 0.04 0.1% 0.8 0.2 0.01
Litigation expenses - 0.0% - - - - 0.3% 1.8 0.4 0.02
Special charges - 0.5% 3.5 0.9 0.04 - 5.2% 36.9 9.7 0.40
Tax method and law changes and related costs 0.0% - - - - - - 8.5 (0.12)
Adjusted Basis 49.4% 16.4% 96.4$ 19.7$ 1.14$ 49.3% 16.2% 90.6$ 19.4$ 1.05$
Gross
Margin
Operating
Margin1
Income
Before
Income
Taxes
Income
Tax
Expense Diluted EPS
Gross
Margin
Operating
Margin1
Income
Before
Income
Taxes
Income
Tax
Expense Diluted EPS
GAAP Basis 48.8% 10.9% 110.3$ 18.6$ 1.36$ 48.5% 7.1% 52.3$ (64.5)$ 1.73
Adjustments:
Acquisition and integration costs - 0.1% 1.8 0.4 0.02 - 0.3% 4.6 1.2 0.05
Acquisition-related intangible asset amortization - 3.8% 53.0 12.3 0.60 - 3.9% 53.7 13.5 0.60
Regulatory compliance costs - 0.4% 6.1 1.6 0.07 0.1% 1.2 0.3 0.01
Litigation expenses - 0.0% - - - - 0.4% 5.8 1.5 0.06
Special charges - 0.8% 11.5 2.8 0.13 - 3.7% 50.4 13.2 0.55
Tax method and law changes 0.0% - 1.0 (0.02) - - - 68.8 (1.01)
Gain on disposition - 0.0% - - - - - (1.0) - (0.01)
Adjusted Basis 48.8% 16.1% 182.7$ 36.7$ 2.16$ 48.5% 15.5% 167.0$ 34.0$ 1.97$
1 Total does not add due to rounding.
Quarter Ended March 31, 2019 Quarter Ended March 31, 2018
Year to Date Ended March 31, 2019 Year to Date Ended March 31, 2018

Page 33
© 2019 Hill-Rom Services, Inc. ALL RIGHTS RESERVED
Gross
Margin
Operating
Margin
Income
Before
Income
Taxes
Income
Tax
Expense Diluted EPS
Gross
Margin
Operating
Margin1
Income
Before
Income
Taxes¹
Income
Tax
Expense Diluted EPS
GAAP Basis 49.3% 6.5% 21.5$ (7.0)$ 0.42$ 47.8% 9.4% 41.3$ 7.3$ 0.51$
Adjustments:
Acquisition and integration costs - 0.4% 2.6 0.7 0.03 0.1% 1.1% 7.2 3.4 0.06
Acquisition-related intangible asset amortization - 3.8% 27.0 6.9 0.30 - 3.9% 26.6 9.0 0.26
Field corrective actions - - - - - 0.1% 0.1% 0.5 (0.1) 0.01
Litigation expenses - 0.3% 1.8 0.4 0.02 0.0% 0.1% 0.9 0.3 0.01
Special charges - 5.2% 36.9 9.7 0.40 - 0.5% 3.1 0.9 0.03
Tax method and law changes and related costs - 0.8 8.7 (0.12) 0.0% - - - -
Adjusted Basis 49.3% 16.2% 90.6$ 19.4$ 1.05$ 48.0% 15.0% 79.6$ 20.8$ 0.88$ 3.4$ 69.9$ (66.5)$
Impacts of ASC 606 Adoption 2 -0.1% -0.3% (3.2)$ (0.9)$ (0.03)$ 0.3% 0.5% 4.0$ 0.6$ 0.05$
Adjusted Basis - ASC 606 49.2% 15.9% 87.4$ 18.5$ 1.02$ 48.3% 15.5% 83.7$ 21.4$ 0.93$
1 Total does not add due to rounding.
2 The Company adopted ASC 606 as of October 1, 2018. This adjustment is to present our adjusted diluted EPS in earlier periods on the same basis as the new Accounting Standard, ASC 606.
Quarter Ended March 31, 2018 Quarter Ended March 31, 2017
Gross
Margin
Operating
Margin1
Income
Before
Income
Taxes
Income
Tax
Expense
Diluted
EPS1
Gross
Margin
Operating
Margin
Income
Before
Income
Taxes¹
Income
Tax
Expense
Diluted
EPS1
GAAP Basis 47.7% 7.9% 30.8$ (57.5)$ 1.31$ 47.5% 8.8% 35.3$ 11.8$ 0.36$
Adjustments:
Acquisition and integration costs - 0.4% 2.4 0.6 0.03 - 0.9% 6.0 2.2 0.06
Acquisition-related intangible asset amortization - 4.0% 26.7 6.6 0.30 - 4.0% 25.5 8.3 0.26
Litigation settlements and expenses - 0.6% 4.0 1.1 0.04 - - - - -
Special charges - 2.0% 13.5 3.5 0.15 - 0.9% 5.8 1.9 0.06
Tax law changes - - - 60.3 (0.89) - - - (2.2) 0.03
Gain on disposition - - (1.0) - (0.01) - - (1.0) (0.4) (0.01)
Adjusted Basis 47.7% 14.7% 76.4$ 14.6$ 0.92$ 47.5% 14.6% 71.6$ 21.6$ 0.75$ -$ 60.3$ (60.3)$
Impacts of ASC 606 Adoption 2 -0.1% -0.3% (3.1)$ (0.4)$ (0.04)$ - - (0.7)$ (0.4)$ -$
Adjusted Basis - ASC 606 47.6% 14.4% 73.3$ 14.2$ 0.88$ 47.5% 14.6% 71.0$ 21.2$ 0.75$
1 Total does not add due to rounding.
2 The Company adopted ASC 606 as of October 1, 2018. This adjustment is to present our adjusted diluted EPS in earlier periods on the same basis as the new Accounting Standard, ASC 606.
Quarter Ended December 31, 2017 Quarter Ended December 31, 2016
Page 34
© 2019 Hill-Rom Services, Inc. ALL RIGHTS RESERVED
Gross
Margin
Operating
Margin
Income
Before
Income
Taxes
Income
Tax
Expense Diluted EPS
Gross
Margin
Operating
Margin1
Income
Before
Income
Taxes
Income
Tax
Expense Diluted EPS
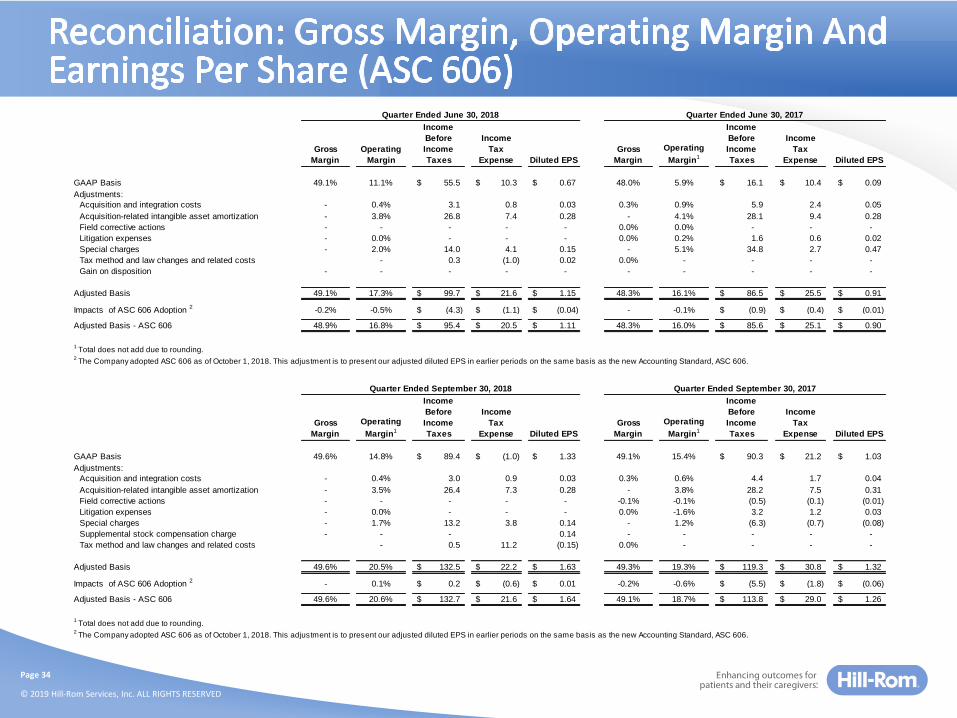
GAAP Basis 49.1% 11.1% 55.5$ 10.3$ 0.67$ 48.0% 5.9% 16.1$ 10.4$ 0.09$
Adjustments:
Acquisition and integration costs - 0.4% 3.1 0.8 0.03 0.3% 0.9% 5.9 2.4 0.05
Acquisition-related intangible asset amortization - 3.8% 26.8 7.4 0.28 - 4.1% 28.1 9.4 0.28
Field corrective actions - - - - - 0.0% 0.0% - - -
Litigation expenses - 0.0% - - - 0.0% 0.2% 1.6 0.6 0.02
Special charges - 2.0% 14.0 4.1 0.15 - 5.1% 34.8 2.7 0.47
Tax method and law changes and related costs - 0.3 (1.0) 0.02 0.0% - - - -
Gain on disposition - - - - - - - - - -
Adjusted Basis 49.1% 17.3% 99.7$ 21.6$ 1.15$ 48.3% 16.1% 86.5$ 25.5$ 0.91$ 44.2$ 11.3$ 32.9$
Impacts of ASC 606 Adoption 2 -0.2% -0.5% (4.3)$ (1.1)$ (0.04)$ - -0.1% (0.9)$ (0.4)$ (0.01)$
Adjusted Basis - ASC 606 48.9% 16.8% 95.4$ 20.5$ 1.11$ 48.3% 16.0% 85.6$ 25.1$ 0.90$
1 Total does not add due to rounding.
2 The Company adopted ASC 606 as of October 1, 2018. This adjustment is to present our adjusted diluted EPS in earlier periods on the same basis as the new Accounting Standard, ASC 606.
Quarter Ended June 30, 2018 Quarter Ended June 30, 2017
Gross
Margin
Operating
Margin1
Income
Before
Income
Taxes
Income
Tax
Expense Diluted EPS
Gross
Margin
Operating
Margin1
Income
Before
Income
Taxes
Income
Tax
Expense Diluted EPS
GAAP Basis 49.6% 14.8% 89.4$ (1.0)$ 1.33$ 49.1% 15.4% 90.3$ 21.2$ 1.03$
Adjustments:
Acquisition and integration costs - 0.4% 3.0 0.9 0.03 0.3% 0.6% 4.4 1.7 0.04
Acquisition-related intangible asset amortization - 3.5% 26.4 7.3 0.28 - 3.8% 28.2 7.5 0.31
Field corrective actions - - - - - -0.1% -0.1% (0.5) (0.1) (0.01)
Litigation expenses - 0.0% - - - 0.0% -1.6% 3.2 1.2 0.03
Special charges - 1.7% 13.2 3.8 0.14 - 1.2% (6.3) (0.7) (0.08)
Supplemental stock compensation charge - - - 0.14 - - - - -
Tax method and law changes and related costs - 0.5 11.2 (0.15) 0.0% - - - -
Adjusted Basis 49.6% 20.5% 132.5$ 22.2$ 1.63$ 49.3% 19.3% 119.3$ 30.8$ 1.32$ 43.1$ 23.2$ 19.9$
Impacts of ASC 606 Adoption 2 - 0.1% 0.2$ (0.6)$ 0.01$ -0.2% -0.6% (5.5)$ (1.8)$ (0.06)$
Adjusted Basis - ASC 606 49.6% 20.6% 132.7$ 21.6$ 1.64$ 49.1% 18.7% 113.8$ 29.0$ 1.26$
1 Total does not add due to rounding.
2 The Company adopted ASC 606 as of October 1, 2018. This adjustment is to present our adjusted diluted EPS in earlier periods on the same basis as the new Accounting Standard, ASC 606.
Quarter Ended September 30, 2018 Quarter Ended September 30, 2017

Page 35
© 2019 Hill-Rom Services, Inc. ALL RIGHTS RESERVED
Gross
Margin
Operating
Margin
Income
Before
Income
Taxes¹
Income
Tax
Expense Diluted EPS
Gross
Margin
Operating
Margin1
Income
Before
Income
Taxes¹
Income
Tax
Expense Diluted EPS
GAAP Basis 49.0% 10.2% 197.2$ (55.2)$ 3.73$ 48.1% 10.0% 183.0$ 50.7$ 1.99$
Adjustments:
Acquisition and integration costs - 0.4% 11.1 3.0 0.12 0.2% 0.9% 23.5 9.7 0.21
Acquisition-related intangible asset amortization - 3.8% 106.9 28.2 1.16 - 4.0% 108.4 34.2 1.10
Field corrective actions - - - - - - - - (0.2) -
Litigation expenses - 0.2% 5.8 1.5 0.06 - -0.3% 5.7 2.1 0.05
Special charges - 2.7% 77.6 21.1 0.84 - 1.9% 37.4 4.8 0.49
Tax method and law changes and related costs - 1.6 79.2 (1.15) - - - (2.2) 0.03
Gain on disposition - - (1.0) - (0.01) - - (1.0) (0.4) (0.01)
Adjusted Basis 49.0% 17.3% 399.2$ 77.8$ 4.75$ 48.3% 16.3% 357.0$ 98.7$ 3.86$
Impacts of ASC 606 Adoption 2 -0.2% -0.3% (10.4)$ (3.0)$ (0.10)$ 0.1% - (2.9)$ (2.0)$ (0.01)$
Adjusted Basis - ASC 606 48.8% 17.0% 388.9$ 74.8$ 4.65$ 48.4% 16.3% 354.0$ 96.7$ 3.85$
1 Total does not add due to rounding.
2 The Company adopted ASC 606 as of October 1, 2018. This adjustment is to present our adjusted diluted EPS in earlier periods on the same basis as the new Accounting Standard, ASC 606.
Year Ended September 30, 2018 Year Ended September 30, 2017