SECARB “Early Test” at Cranfield Library/Events/2017/carbon-storage... · SECARB “Early...
35
SECARB “Early Test” at Cranfield DE-FC26-05NT42590 Susan D. Hovorka Gulf Coast Carbon Center Bureau of Economic geology Jackson School of Geoscience The University of Texas at Austin . Mastering the Subsurface through Technology Innovation, Partnerships and Collaboration: Carbon Storage and Oil and Natural Gas Technologies Review Meeting, August 1–3, 2017, Pittsburgh, Pennsylvania
Transcript of SECARB “Early Test” at Cranfield Library/Events/2017/carbon-storage... · SECARB “Early...

SECARB “Early Test” at CranfieldDE-FC26-05NT42590
Susan D. HovorkaGulf Coast Carbon Center
Bureau of Economic geologyJackson School of Geoscience
The University of Texas at Austin.
Mastering the Subsurface through Technology Innovation, Partnerships and Collaboration: Carbon Storage and Oil
and Natural Gas Technologies Review Meeting, August 1–3, 2017, Pittsburgh, Pennsylvania
Team Structure
2
Gulf Coast Carbon CenterBureau of Economic Geology
Jackson School of GeosciencesThe University of Texas at Austin
Sandia Technologies
Monitoring Systems Design, Installation,
HS&E
Denbury Resources
Field owner and injection system
design, management, 4-D
survey, HS&E
LBNLWell-based geophysics, U-tube and lab design
and fabrication
LLNLERT
Groundwater controlled releaseAWWA
NETLRock-water interaction
USGSGeochemistry
SSEB
50 Vendorse.g. SchlumbergerVendors
e.g. well drilling, landmen
MSU & UMissHydro & hydrochem
Core LabUT DoG
Anchor QEA
NRAPVSP deployment & analysis
SECARB Anthropogenic Test At Plant Barry/Citronelle
Curtin University3-D Seismic processing
Model comparisonsLBNL SIM SEQ study
Separately funded
Federal collaboratorsVia FWP
4-D Seismic analysisK. Spikes UT DoGS
Rock MechanicsCFSES Sandia NL
Microseismic deploymentRITE, Japan
IPARS Modeling CFSES M. Wheeler

Recent progress- Knowledge Transfer to Industry
Separately-funded work monitoring large scale commercial projects based on SECARB early test experience
Air Products Port Arthur industrial capture from SMRI at 1 MMT/year transported to Denbury’s Hastings Field.
Petra Nova and NRG /Hillcorp/JX capture up to 1.6 MMT/ year and use for EOR at West Ranch field
3

Commercialization of Monitoring
4
Mas
s ba
lanc
e
soil
gas
grou
ndw
ater
che
mAZ
MI c
hem
AZM
I pre
ssur
e3D
sei
smic
VSP
ERT
EMgr
avity
u-tu
be
IZ c
hem
trace
rs
Frio x x x x x x x x x
SECARB Early test at Cranfield x x x x x x x x x x x x
Industrial captureAir Products -Hastings x x x x x x
Clean Coal Power initiative Petra Nova/ West Ranch
x x x x x

Synergies
5
Field data collectionMicroseismic --RITECO2 Geothermal-- LBNLPIDAS – SunCCP-BP gravityMicrobes – U KYNRAP 3-D VSPBorehole seismic –
Groundmetrics NoblesU. Edinburgh Fluid Chem--Ohio StateWell integrity -Schlum/Battelle
Modeling effortsSIMSEQ –LBNL
15 teamsCFSES – UT/ SNLIPARS --WheelerNRAPNCNOLBNLCCP3UT- LBNL Zhang
LLNL (yesterday)
Additional analysisNETL- EOR accountingMei/DilmoreNETL- Rock-water reactionBES - LLNL
119 history match efforts

No detectable seismic
6
Makiko Takagishi, RITEMagnitude 0.4 horizontal and .07 vertical
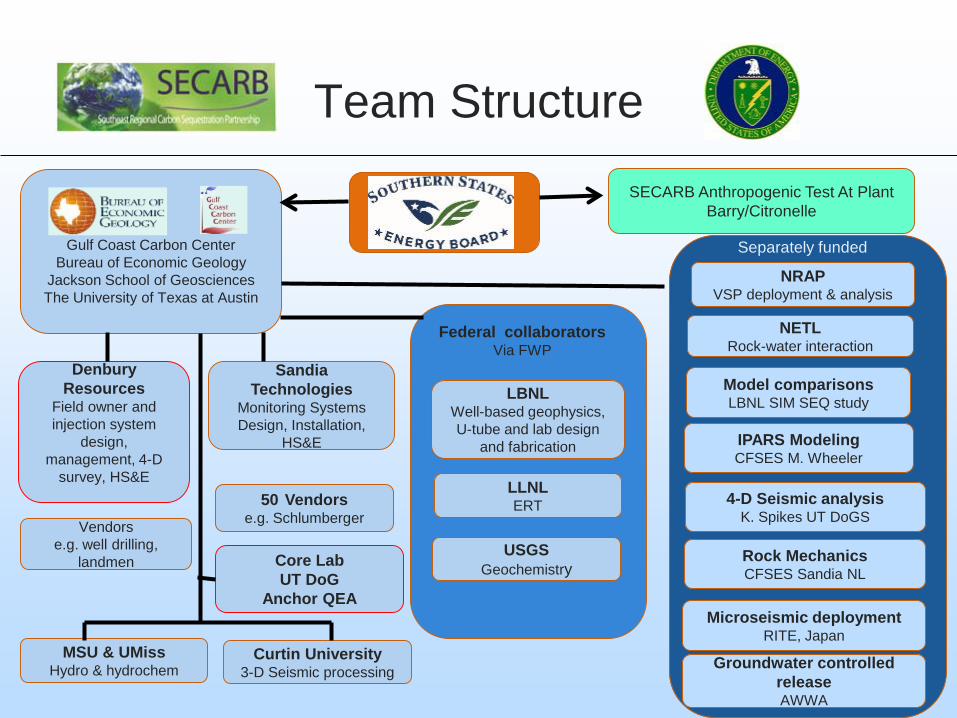
Early Test Motivation
• MIT report “Future of Coal” 2007– Set 1 MMT injection goal “proceed .. as soon as possible.
Several integrated large-scale demonstrations with appropriate measurement, monitoring and verification are needed. ... establish public confidence for future.”
• In 2007 scale and timing of large-scale capture in region still uncertain– SECARB anthropogenic test (2011)– >1 MMT Commercial Capture in region (2014, 2017)
• Early Test design to progress in the gap – Piggy-back on soon-to-start EOR project – Permits, source and infrastructure in place– Direct injection – relevant to large scale saline CCS 7
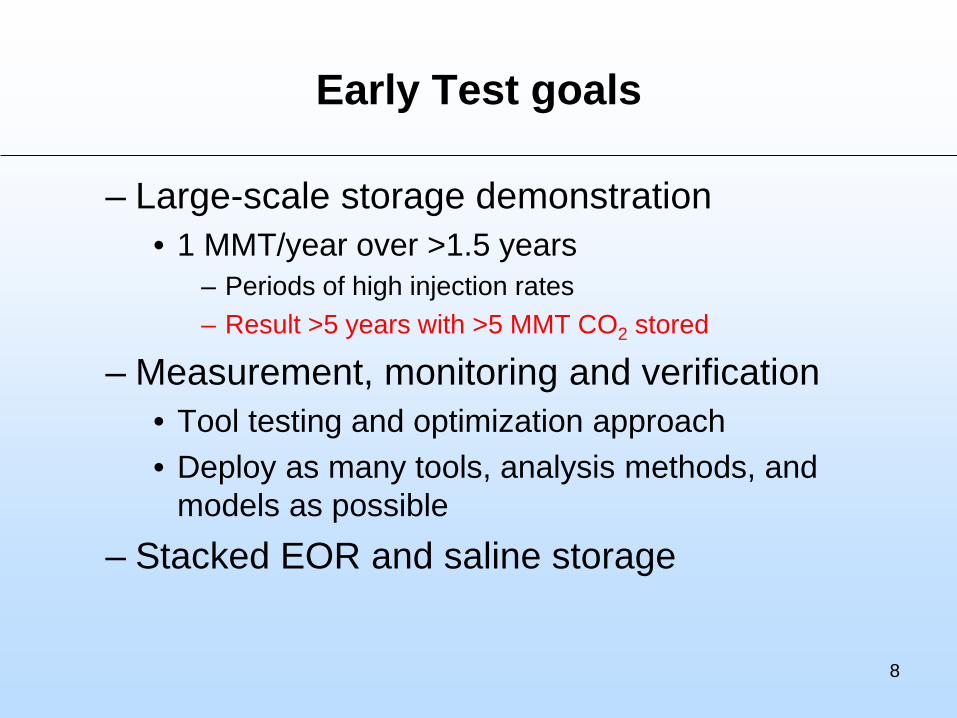
Early Test goals
– Large-scale storage demonstration • 1 MMT/year over >1.5 years
– Periods of high injection rates– Result >5 years with >5 MMT CO2 stored
– Measurement, monitoring and verification• Tool testing and optimization approach• Deploy as many tools, analysis methods, and
models as possible– Stacked EOR and saline storage
8
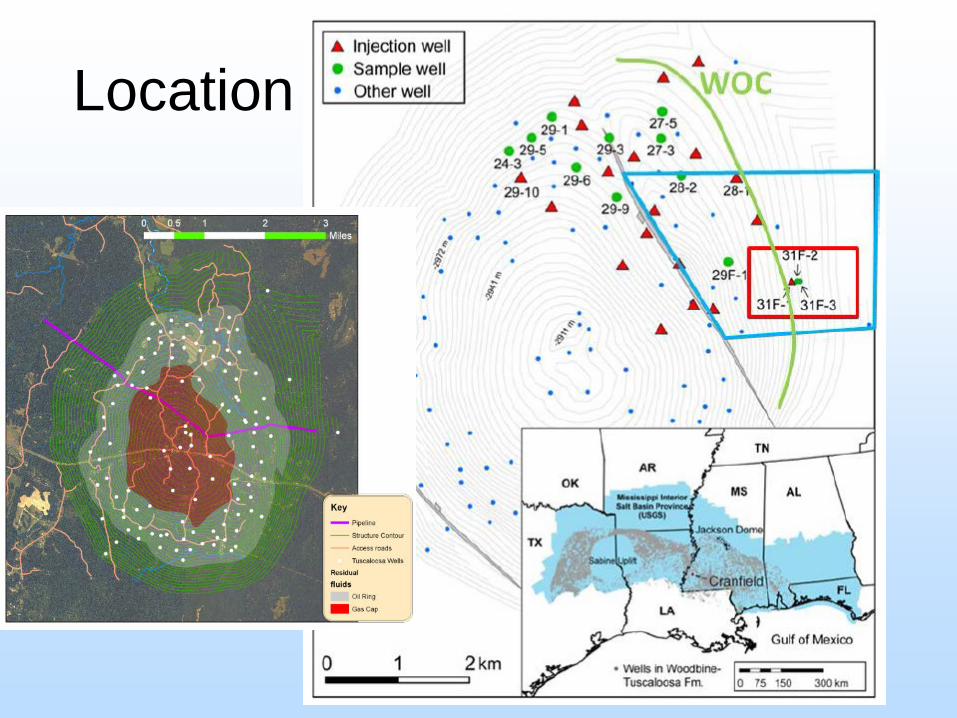
Location

Major Contributions
• Early Test Developed monitoring approaches for later commercial projects– Process-based soil gas method– Effectiveness of groundwater surveillance– Pressure and fluid chemistry monitoring in
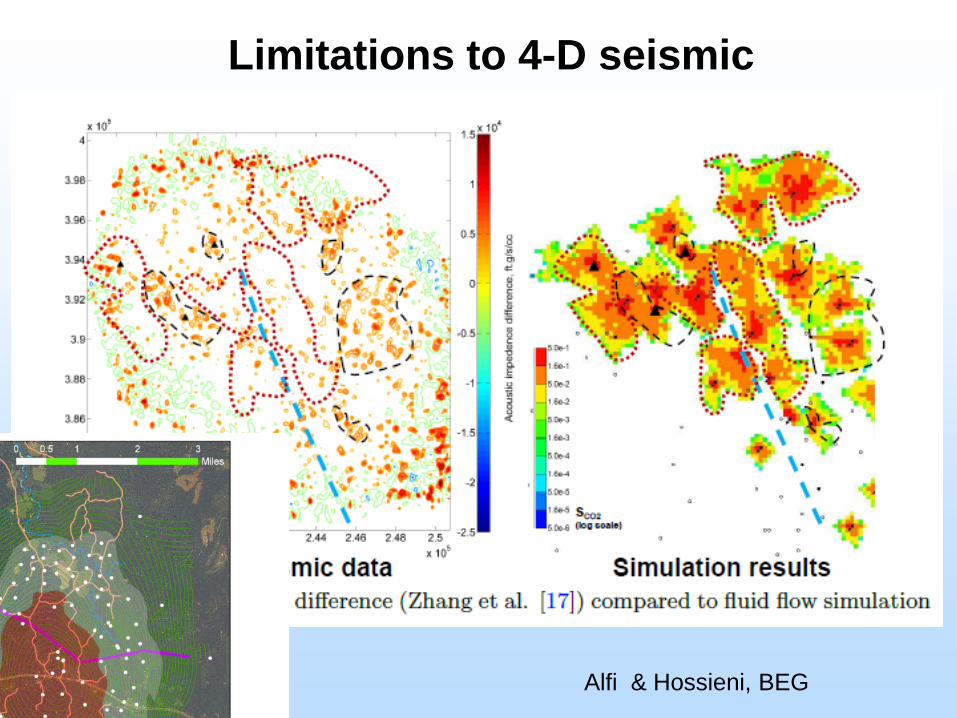
Above-Zone Monitoring Interval (AZMI)– ERT for deep CO2 plume– Limitations of 4-D seismic
• Published and propagated techniques for widespread application 10

Knowledge Transfer to Industry
93 publicationsSite visitsTalks, workshopsexchanges
11
PBS News hour – Miles O’Brien
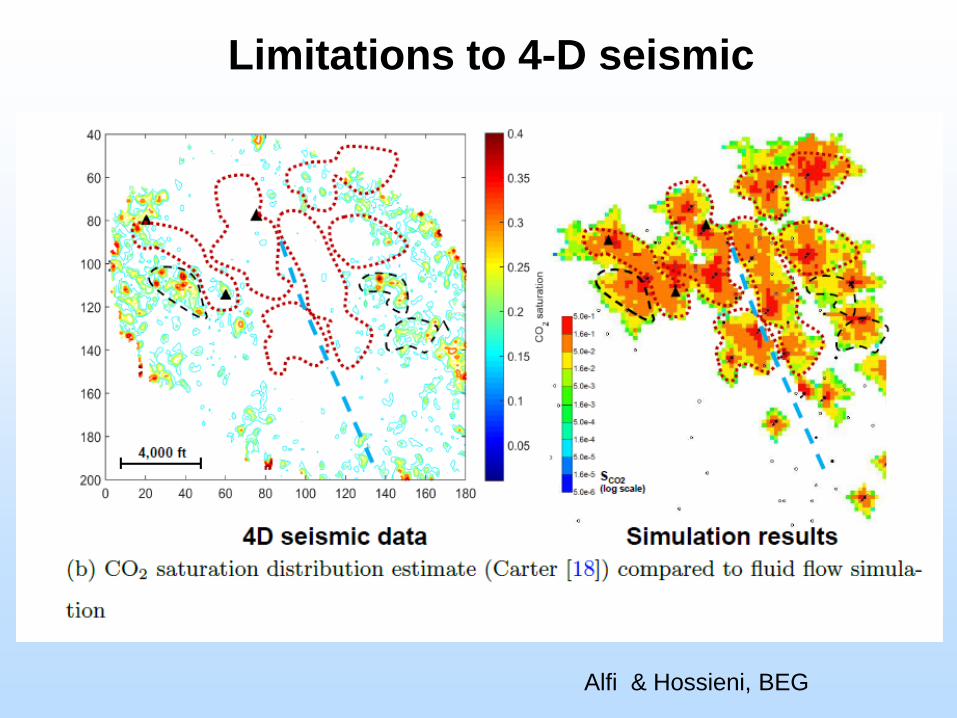
Limitations to 4-D seismic
Alfi & Hossieni, BEG

Limitations to 4-D seismic
Alfi & Hossieni, BEG
Limitations to 4-D seismic
Alfi & Hossieni, BEG

EARTH AND ENVIRONMENTAL SCIENCES • LAWRENCE BERKELEY NATIONAL LABORATORY
Calculate time shifts resulting from CO2 emplacement for reflections just below the reservoir.
Smoothed Time-Shifts
D. W. Vasco, Tom Daley, Jonathan Ajo-Franklin, LBL

EARTH AND ENVIRONMENTAL SCIENCES • LAWRENCE BERKELEY NATIONAL LABORATORY
Largest seismic time shifts in area with greatest velocity changes
D. W. Vasco, Tom Daley, Jonathan Ajo-Franklin, LBL

EARTH AND ENVIRONMENTAL SCIENCES • LAWRENCE BERKELEY NATIONAL LABORATORY
Biggest velocity changes due to the injection of carbon dioxide are in the water leg
Compressional Velocity Changes
D. W. Vasco, Tom Daley, Jonathan Ajo-Franklin, LBL

LLNL Electrical Resistance Tomography-changes in response with saturation
F2 F3
C. Carrigan, X Yang, LLNLD. LaBrecque Multi-Phase Technologies
F1

Site Characterization Approach
19
Detail Area Study DAS
H Zeng, BEG10cm
5km
Seismically non-unique interpreted form lines

Modeling Approach's
Single phase pressure Relative permeablities Multi phase pressure
Reservoir characterization
Probabilistic realizations of reservoir architecture
Hosseini and others, 2013Cranfield
Breakthrough time

Modeling
• Multiple models (119)– I-PARS– SIM-SEQ model approach comparison
• CGM GEM– Probabilistic approaches– Match 100 realizations to subset of modeled data– Forward model scenarios
21
Breakthrough time at F2
0
0.1
0.2
0.3
0.4
12/1/09
12/3/09
12/5/09
12/7/09
12/9/09
12/11/09
12/13/09
12/15/09
12/17/09
12/19/09
12/21/09
12/23/09
12/25/09
12/27/09
12/29/09
12/31/09
1/2/10
1/4/10
1/6/10
Date
Gas
sat
urat
ion
Set #1 at Ly14 (12/16/2009)
Set #2 at Ly17(12/20/2009)
Set #3 at Ly17(12/8/2009)
Set #4 at Ly10(12/15/2009)
Set #5 at Ly19(12/29/2009)
Set #6 at Ly10(12/23/2009)
Set #7 at Ly10(12/23/2009)
Set #8 at Ly10(12/7/2009)
Set #9 at Ly7(12/7/2009)
Set #10 at Ly10(12/11/2009)
Pre-injection forward model breakthrough times to design geochemical sampling
Jong Won Choi BEG
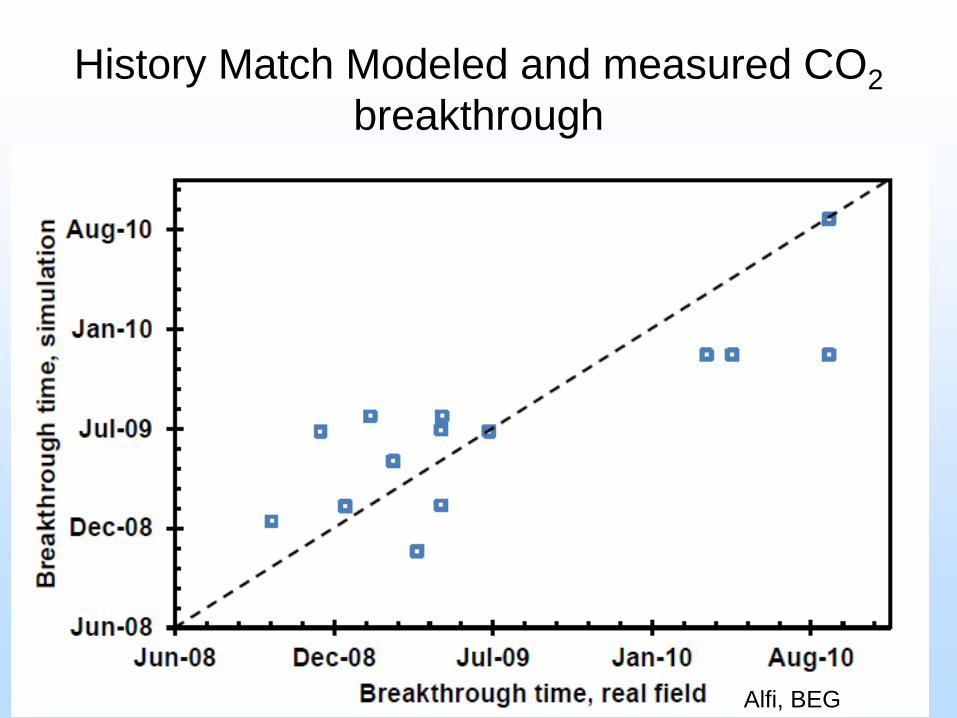
History Match Modeled and measured CO2breakthrough
Alfi, BEG
100
200
300
400
500
600
8.E-21
1.E-06
2.E-06
3.E-06
4.E-06
5.E-06
4/12 4/17 4/22 4/27 5/2 5/7 5/12 5/17 5/22 5/27
Kg/m
in
Inj. rate
SF6
0
100
200
300
400
500
600
-1.E-06
0.E+00
1.E-06
2.E-06
3.E-06
4.E-06
4/12 4/17 4/22 4/27 5/2 5/7 5/12 5/17 5/22 5/27
Kg/m
in
SF6
Inj. rate
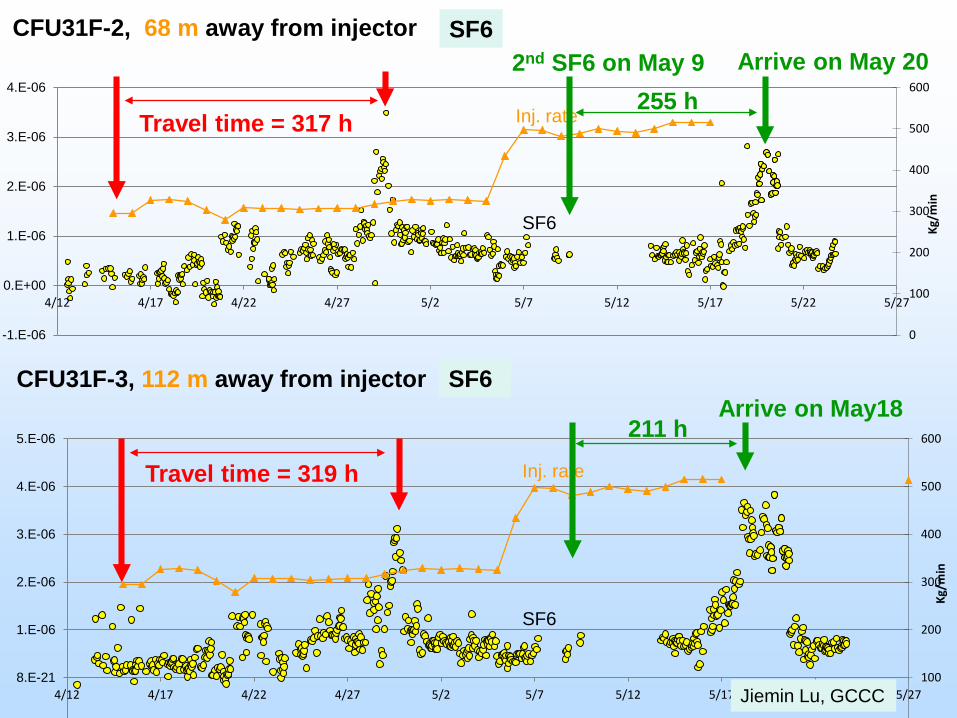
CFU31F-2, 68 m away from injector
CFU31F-3, 112 m away from injector
Travel time = 317 h
Travel time = 319 h
SF6
SF6
2nd SF6 on May 9255 h
Arrive on May 20
Arrive on May18211 h
Jiemin Lu, GCCC
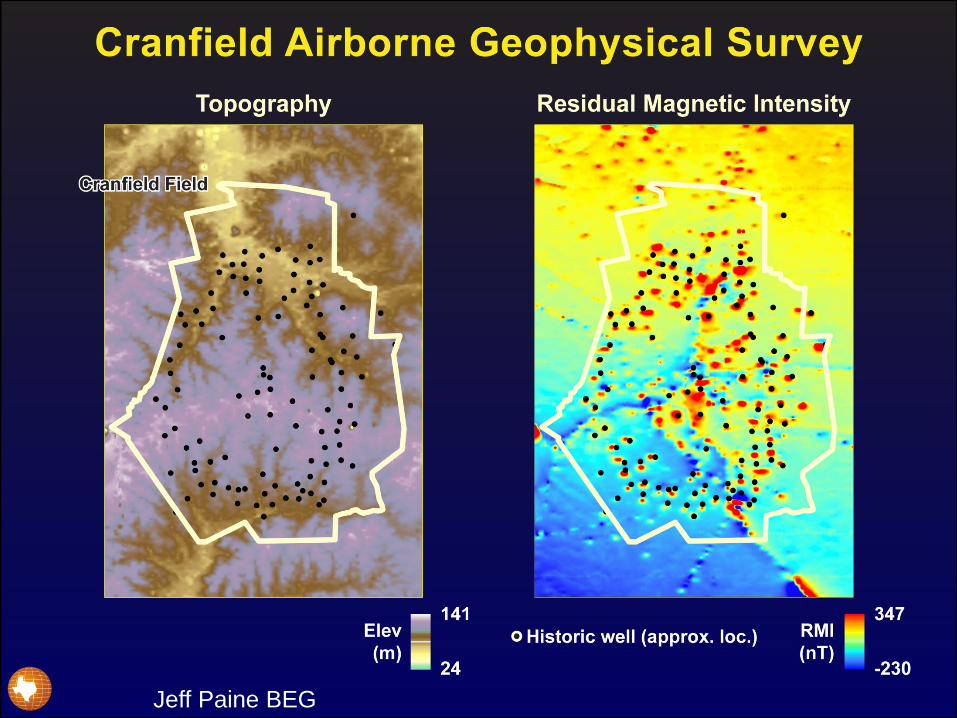
Jeff Paine BEG
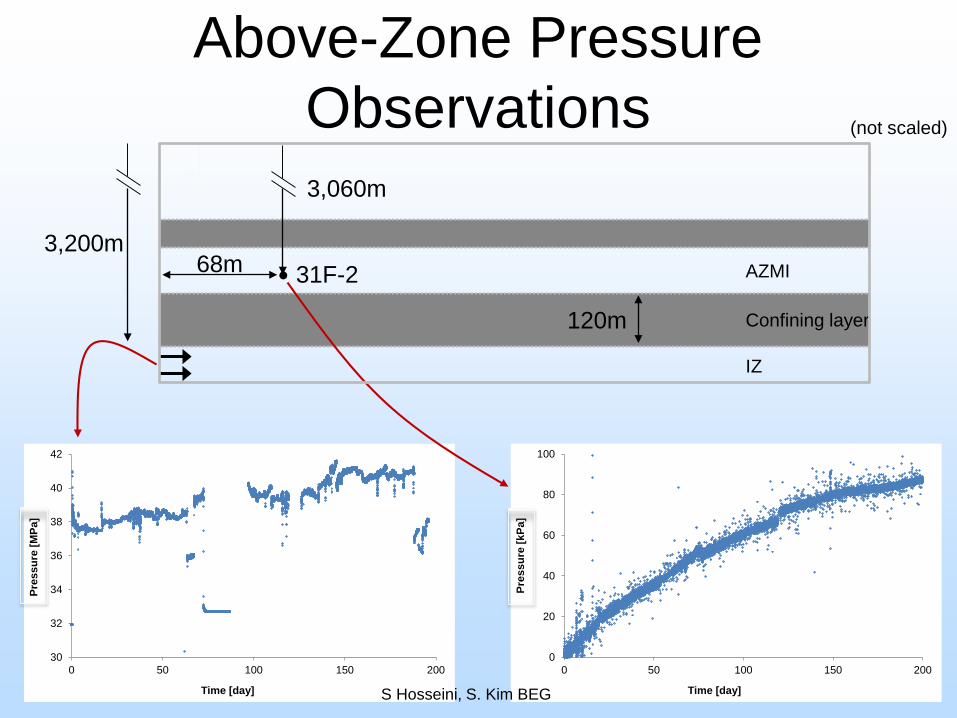
Above-Zone Pressure Observations
IZ
Confining layer
AZMI31F-2
0
20
40
60
80
100
0 50 100 150 200
Pres
sure
[kPa
]
Time [day]
3,200m
3,060m
68m
30
32
34
36
38
40
42
0 50 100 150 200
Pres
sure
[MPa
]
Time [day]
120m
(not scaled)
S Hosseini, S. Kim BEG
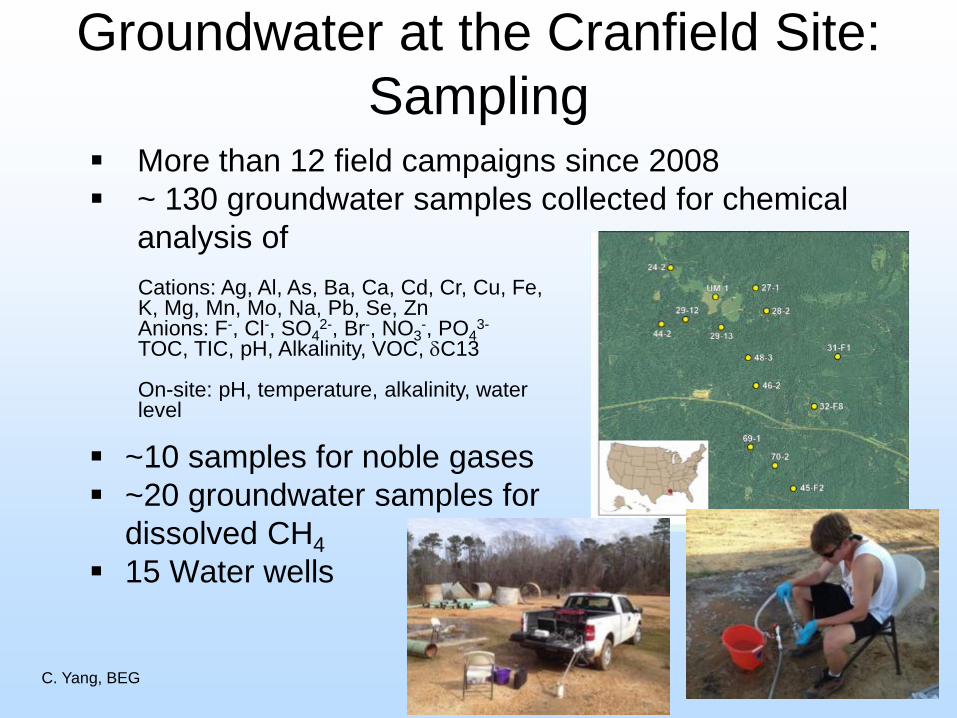
Cations: Ag, Al, As, Ba, Ca, Cd, Cr, Cu, Fe, K, Mg, Mn, Mo, Na, Pb, Se, ZnAnions: F-, Cl-, SO4
2-, Br-, NO3-, PO4
3-
TOC, TIC, pH, Alkalinity, VOC, δC13
On-site: pH, temperature, alkalinity, water level
~10 samples for noble gases ~20 groundwater samples for
dissolved CH4 15 Water wells
More than 12 field campaigns since 2008 ~ 130 groundwater samples collected for chemical
analysis of
C. Yang, BEG
Groundwater at the Cranfield Site:Sampling

Testing well
• Maximum concentrations of trace metals observed, such as and Pb, are much less than the EPA contamination levels;
• Single well push-pull test appears to be a convenient field controlled-release test for assessing potential impacts of CO2 leakage on drinking groundwater resources;
Results were summarized in the following paper
Groundwater at the Cranfield SiteSingle-Well Push-Pull Test
C. Yang, BEG

• 20/151=0.13 by 4 years• 50/151=0.33 by 15 years• 58/151=0.38 by 35 years
𝑀𝑀𝑀𝑀 = 𝑊𝑊𝑑𝑑
𝑊𝑊𝑇𝑇
Groundwater Monitoring Network Efficiency
CO2 leakage from a P&A well is detected by a monitoring net work if change in DIC, dissolved CO2, or pH in any one of wells of the monitoring network is higher than one standard deviation of the groundwater chemistry data collected in the shallow aquifer over the last 6 years. Changbing Yang

Process-Based Soil Gas Monitoring • No need for years of background
measurements.• Promptly identifies leakage signal
over background noise.• Uses simple gas ratios
(CO2, CH4, N2, O2) • Can discern many CO2 sources
and sinks – Biologic respiration– CO2 dissolution– Oxidation of CH4 into CO2
(Important at CCUS sites)– Influx air into sediments– CO2 leakage
Katherine Romanak BEG
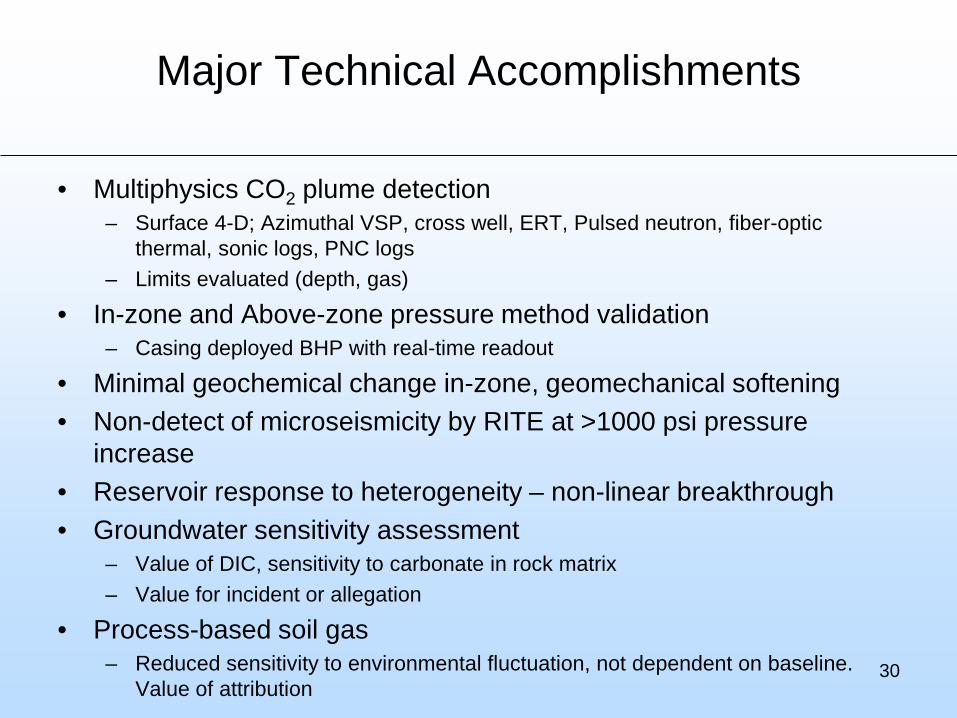
Major Technical Accomplishments
• Multiphysics CO2 plume detection– Surface 4-D; Azimuthal VSP, cross well, ERT, Pulsed neutron, fiber-optic
thermal, sonic logs, PNC logs– Limits evaluated (depth, gas)
• In-zone and Above-zone pressure method validation– Casing deployed BHP with real-time readout
• Minimal geochemical change in-zone, geomechanical softening• Non-detect of microseismicity by RITE at >1000 psi pressure
increase• Reservoir response to heterogeneity – non-linear breakthrough• Groundwater sensitivity assessment
– Value of DIC, sensitivity to carbonate in rock matrix– Value for incident or allegation
• Process-based soil gas– Reduced sensitivity to environmental fluctuation, not dependent on baseline.
Value of attribution30
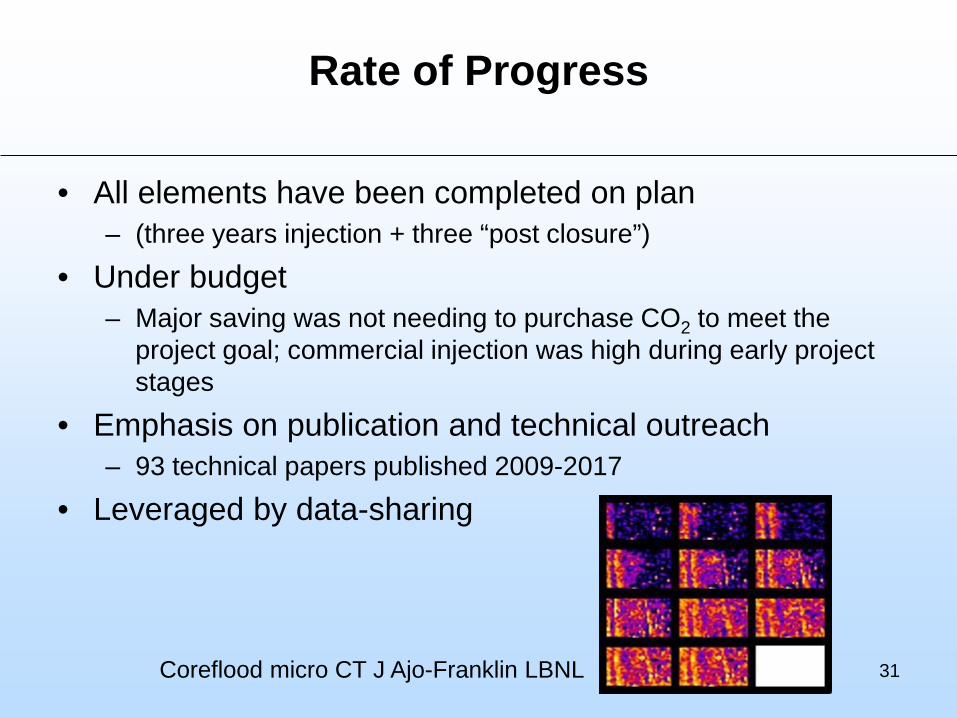
Rate of Progress
• All elements have been completed on plan– (three years injection + three “post closure”)
• Under budget– Major saving was not needing to purchase CO2 to meet the
project goal; commercial injection was high during early project stages
• Emphasis on publication and technical outreach– 93 technical papers published 2009-2017
• Leveraged by data-sharing
31Coreflood micro CT J Ajo-Franklin LBNL

32

Lessons Learned (where is improvement needed?)
• Simplified AZMI completions• Improved high temperature and pressure equipment• Simplified ERT deep installation• Remote tools for water and soil gas surveillance• Maturation of monitoring design planning
• Interaction with international community
33
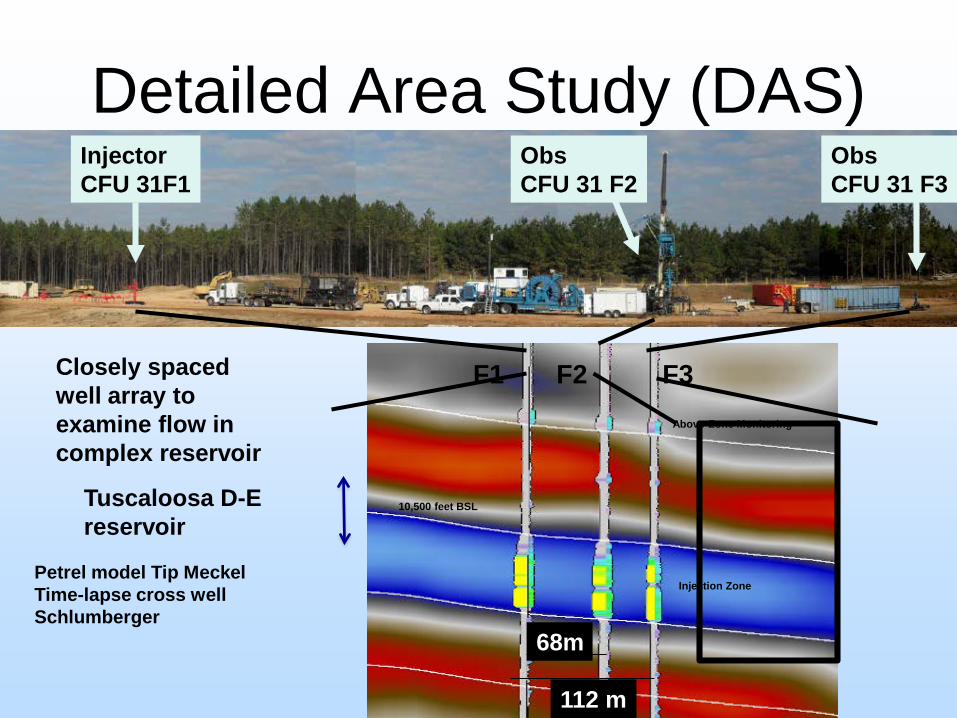
Detailed Area Study (DAS)InjectorCFU 31F1
Obs CFU 31 F2
Obs CFU 31 F3
Above-zonemonitoringF1 F2 F3
Injection Zone
Above Zone Monitoring
10,500 feet BSL
Closely spaced well array to examine flow in complex reservoir
68m
112 m
Petrel model Tip MeckelTime-lapse cross well Schlumberger
Tuscaloosa D-E reservoir

Project StatusM
illion
met
ric
tons
CO
2
Baseline 3-D
Start injection
Logging
Real-time monitoring – BHP, BHT, AZMI, DTS
2008
2009
2010
2011
2012
Repeat 3-DVSPCross well
BaselineVSPCross well
Start DAS injection
Geochemical monitoring
Surface monitoring
5
4
3
2
1
0
6
2013