SEB report: Commodity prices remain under pressure
20
Commodities Monthly Will the Saudis get their way? 8 MAY 2012
Transcript of SEB report: Commodity prices remain under pressure
8/2/2019 SEB report: Commodity prices remain under pressure
http://slidepdf.com/reader/full/seb-report-commodity-prices-remain-under-pressure 1/20
Commodities MonthlyWill the Saudis get their way? 8 MAY 2012
8/2/2019 SEB report: Commodity prices remain under pressure
http://slidepdf.com/reader/full/seb-report-commodity-prices-remain-under-pressure 2/20
2
Commodities Monthly
Will the Saudis get their way?
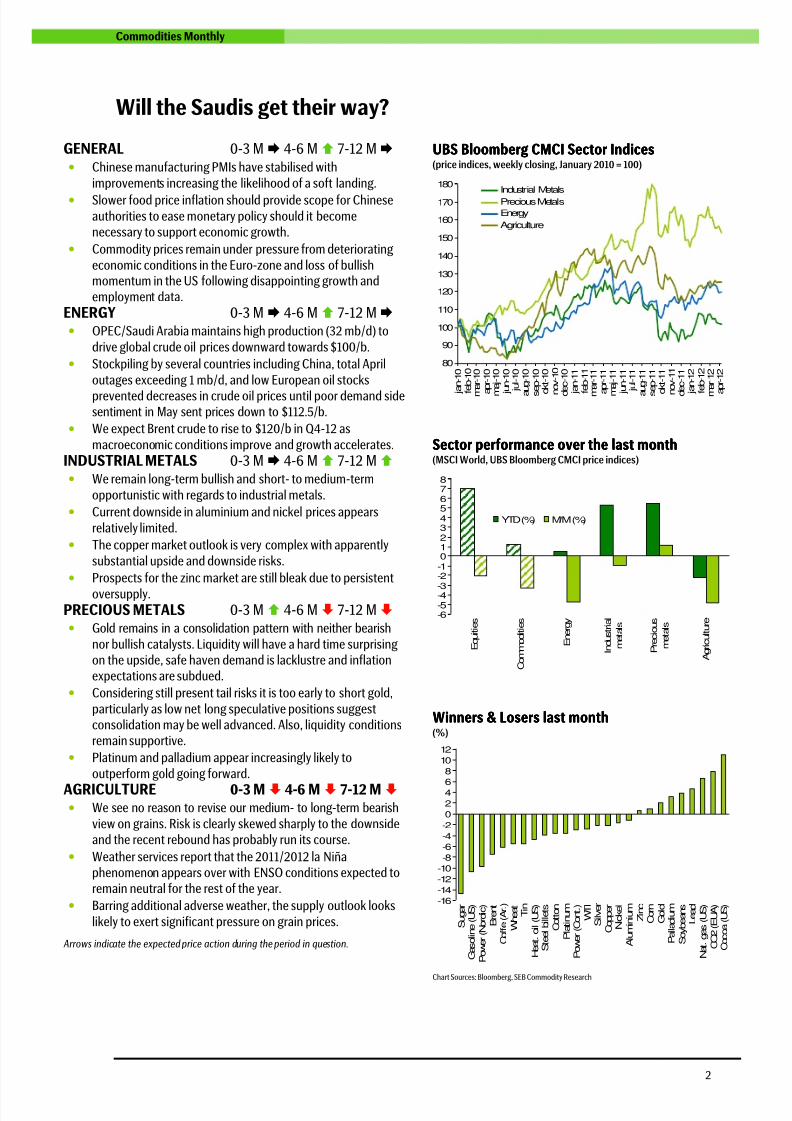
GENERAL 0-3 M 4-6 M 7-12 M • Chinese manufacturing PMIs have stabilised with
improvements increasing the likelihood of a soft landing.
• Slower food price inflation should provide scope for Chineseauthorities to ease monetary policy should it becomenecessary to support economic growth.
• Commodity prices remain under pressure from deteriorating
economic conditions in the Euro-zone and loss of bullishmomentum in the US following disappointing growth andemployment data.
ENERGY 0-3 M 4-6 M 7-12 M • OPEC/Saudi Arabia maintains high production (32 mb/d) to
drive global crude oil prices downward towards $100/b.
• Stockpiling by several countries including China, total April
outages exceeding 1 mb/d, and low European oil stocks
prevented decreases in crude oil prices until poor demand sidesentiment in May sent prices down to $112.5/b.
• We expect Brent crude to rise to $120/b in Q4-12 as
macroeconomic conditions improve and growth accelerates.
INDUSTRIAL METALS 0-3 M 4-6 M 7-12 M • We remain long-term bullish and short- to medium-term
opportunistic with regards to industrial metals.
• Current downside in aluminium and nickel prices appears
relatively limited.
• The copper market outlook is very complex with apparently
substantial upside and downside risks.
• Prospects for the zinc market are still bleak due to persistent
oversupply.PRECIOUS METALS 0-3 M 4-6 M 7-12 M • Gold remains in a consolidation pattern with neither bearish
nor bullish catalysts. Liquidity will have a hard time surprisingon the upside, safe haven demand is lacklustre and inflationexpectations are subdued.
• Considering still present tail risks it is too early to short gold,
particularly as low net long speculative positions suggestconsolidation may be well advanced. Also, liquidity conditionsremain supportive.
• Platinum and palladium appear increasingly likely to
outperform gold going forward.
AGRICULTURE 0-3 M 4-6 M 7-12 M • We see no reason to revise our medium- to long-term bearish
view on grains. Risk is clearly skewed sharply to the downsideand the recent rebound has probably run its course.
• Weather services report that the 2011/2012 la Niñaphenomenon appears over with ENSO conditions expected toremain neutral for the rest of the year.
• Barring additional adverse weather, the supply outlook looks
likely to exert significant pressure on grain prices.
Arrows indicate the expected price action during the period in question.
UBS Bloomberg CMCI Sector IndicesUBS Bloomberg CMCI Sector IndicesUBS Bloomberg CMCI Sector IndicesUBS Bloomberg CMCI Sector Indices(price indices, weekly closing, January 2010 = 100)
80
90
100
110
120
130
140
150
160
170
180
j a n - 1 0
f e b - 1 0
m
a r - 1 0
a
p r - 1 0
m
a j - 1 0
j u n - 1 0
j u l - 1 0
a u g - 1 0
s e p - 1 0
o
k t - 1 0
n o v - 1 0
d e c - 1 0
j a n - 1 1
f e b - 1 1
m
a r - 1 1
a
p r - 1 1
m
a j - 1 1
j u n - 1 1
j u l - 1 1
a u g - 1 1
s e p - 1 1
o
k t - 1 1
n o v - 1 1
d e c - 1 1
j a n - 1 2
f e b - 1 2
m
a r - 1 2
a
p r - 1 2
Industrial Metals
Precious Metals
Energy
Agriculture
Sector performanceSector performanceSector performanceSector performance over theover theover theover the last monthlast monthlast monthlast month(MSCI World, UBS Bloomberg CMCI price indices)
-6-5-4-3
-2-1012345678
E q u i t i e s
C o m m o d i t i e s
E n e r g y
I n d u s t r i a l
m e t a l s
P r e c i o u s
m e t a l s
A g r i c u l t u r e
YTD (%) M/M(%)
Winners & Losers last monthWinners & Losers last monthWinners & Losers last monthWinners & Losers last month(%)
-16-14-12-10-8-6-4-2
0246
81012
S u g a r
G a s o l i n e ( U S )
P o w e r ( N o r d i c )
B r e n t
C o f f e ( A r . )
W h e a t T i n
H e a t . o i l ( U S )
S t e e l b i l l e t s
C o t t o n
P l a t i n u m
P o w e r ( C o n t . ) W T I
S i l v e r
C o p p e r
N i c k e l
A l u m i n i u m Z i n c
C o r n G o l d
P a l l a d i u m
S o y b e a n s
L e a d
N a t . g a s ( U S )
C O 2 ( E U A )
C o c o a ( U S )
Chart Sources: Bloomberg, SEB Commodity Research

8/2/2019 SEB report: Commodity prices remain under pressure
http://slidepdf.com/reader/full/seb-report-commodity-prices-remain-under-pressure 3/20
3
Commodities Monthly
General
China appears to be heading for a soft landingaccording to the latest economic data which show astable to stronger PMI. Food prices remain
unaffected by the drought in South America apartfrom a 35% increase in soybean prices since lastDecember. We continue to expect lower wheat andcorn prices, easing food-related inflation inemerging markets generally, especially in China.Consequently, Chinese authorities should havescope to ease monetary policy should it becomenecessary to support economic growth. We see littledownside in industrial metals prices with manyalready close to their respective marginalproduction costs.
However, the deteriorating economic situation in Europe
combined with a weaker US outlook since Q1-12 issubstantially reducing risk appetite, exacerbatingnegative price pressure on commodities generally, asituation compounded by the knowledge that China islikely to post slower growth in coming years. Still, webelieve current energy and metals prices should enjoyattractive upside potential from the end of this year asthe Chinese economy improves and the Europeansituation stabilizes.
Since our previous Commodities Monthly report onMarch 27 this year, the CMCI Commodity price index has
fallen by 3.6% due to the deteriorating situation inEurope and less optimism in the US. All commoditysectors have fallen back almost uniformly. Industrialmetals have declined least (-2.7%) supported bygradually improving sentiment in China where equitiesrose 4% over the same period. At the same time,precious metals fell by 3.2 per cent and energy andagricultural products by 3.7 per cent.
OECD Composite Leading Indicators released at thebeginning of April still suggested continued positivemomentum and above trend growth in both Japan andthe US over the next six months. The outlook for Chinaswitched from below trend and deteriorating to abovetrend and improving, a development reflected in localequity market performance during April. However, Euro-zone developments were more mixed.
Recent PMI Manufacturing data published at the start ofMay suggest the Chinese economy should stabilize,confirming the likelihood of a local soft landing.Conversely, European PMIs have continued todeteriorate, particularly in southern Europe. USmanufacturing activity still improved in April while USlabour market developments have created major
concerns.
UBS Bloomberg CMCIUBS Bloomberg CMCIUBS Bloomberg CMCIUBS Bloomberg CMCI(price index, weekly closing)
300
400
500
600
700
800
900
1000
1100
1200
1300
1400
15001600
1700
1800
2
0 0 2
2
0 0 3
2
0 0 4
2
0 0 5
2
0 0 6
2
0 0 7
2
0 0 8
2
0 0 9
2
0 1 0
2
0 1 1
2
0 1 2
JPM global manufacturing PMIJPM global manufacturing PMIJPM global manufacturing PMIJPM global manufacturing PMI(monthly, PMIs >50 expansive)
30
35
40
45
50
55
60
65
2 0 0 5
2 0 0 6
2 0 0 7
2 0 0 8
2 0 0 9
2 0 1 0
2 0 1 1
2 0 1 2
OECD composite leading indicatorsOECD composite leading indicatorsOECD composite leading indicatorsOECD composite leading indicators(monthly, 100 corresponds to long term trend growth in industrial production)
93
94
95
96
97
98
99
100
101
102
103
104
2 0 0 5
2 0 0 6
2 0 0 7
2 0 0 8
2 0 0 9
2 0 1 0
2 0 1 1
2 0 1 2
ChinaEurozone
OECD
USAReference
Chart Sources: Bloomberg, SEB Commodity Research
8/2/2019 SEB report: Commodity prices remain under pressure
http://slidepdf.com/reader/full/seb-report-commodity-prices-remain-under-pressure 4/20
4
Commodities Monthly
Crude oil
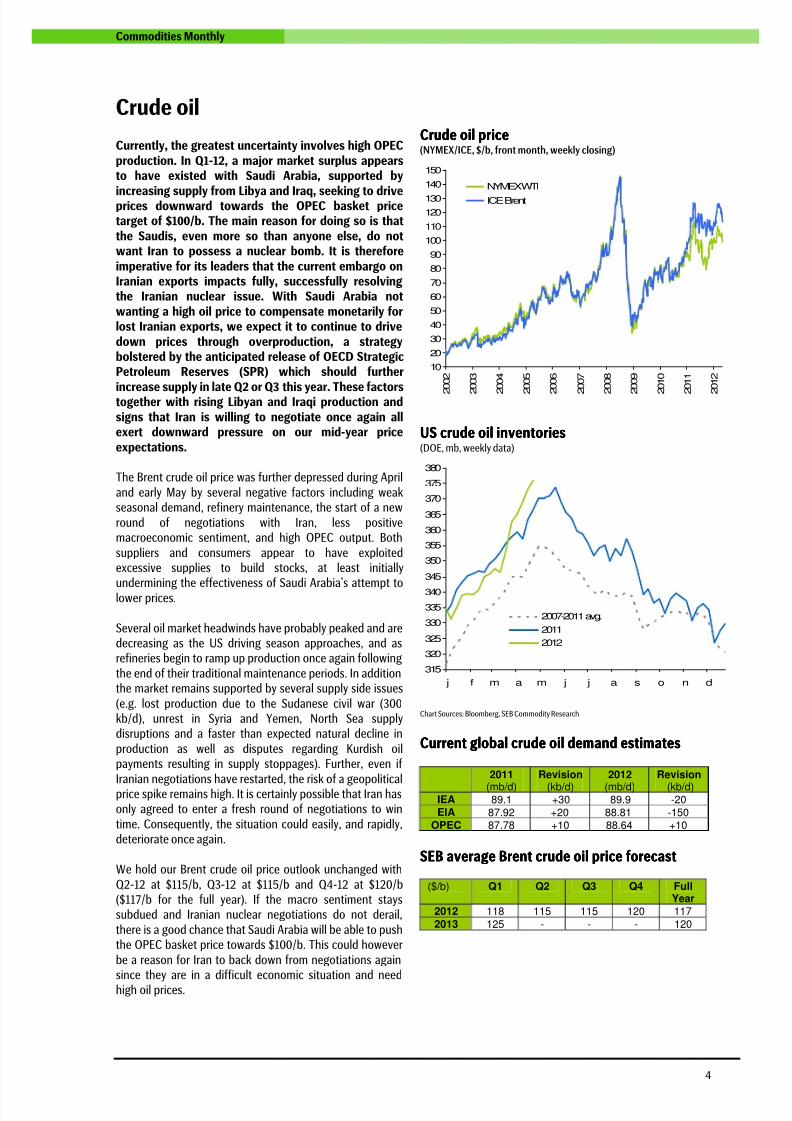
Currently, the greatest uncertainty involves high OPECproduction. In Q1-12, a major market surplus appearsto have existed with Saudi Arabia, supported by
increasing supply from Libya and Iraq, seeking to driveprices downward towards the OPEC basket pricetarget of $100/b. The main reason for doing so is thatthe Saudis, even more so than anyone else, do notwant Iran to possess a nuclear bomb. It is thereforeimperative for its leaders that the current embargo onIranian exports impacts fully, successfully resolvingthe Iranian nuclear issue. With Saudi Arabia notwanting a high oil price to compensate monetarily forlost Iranian exports, we expect it to continue to drivedown prices through overproduction, a strategybolstered by the anticipated release of OECD StrategicPetroleum Reserves (SPR) which should further
increase supply in late Q2 or Q3 this year. These factorstogether with rising Libyan and Iraqi production andsigns that Iran is willing to negotiate once again allexert downward pressure on our mid-year priceexpectations.
The Brent crude oil price was further depressed during April
and early May by several negative factors including weakseasonal demand, refinery maintenance, the start of a new
round of negotiations with Iran, less positivemacroeconomic sentiment, and high OPEC output. Both
suppliers and consumers appear to have exploitedexcessive supplies to build stocks, at least initially
undermining the effectiveness of Saudi Arabia’s attempt tolower prices.
Several oil market headwinds have probably peaked and aredecreasing as the US driving season approaches, and asrefineries begin to ramp up production once again following
the end of their traditional maintenance periods. In additionthe market remains supported by several supply side issues
(e.g. lost production due to the Sudanese civil war (300kb/d), unrest in Syria and Yemen, North Sea supplydisruptions and a faster than expected natural decline in
production as well as disputes regarding Kurdish oilpayments resulting in supply stoppages). Further, even if
Iranian negotiations have restarted, the risk of a geopoliticalprice spike remains high. It is certainly possible that Iran hasonly agreed to enter a fresh round of negotiations to win
time. Consequently, the situation could easily, and rapidly,deteriorate once again.
We hold our Brent crude oil price outlook unchanged with
Q2-12 at $115/b, Q3-12 at $115/b and Q4-12 at $120/b($117/b for the full year). If the macro sentiment stayssubdued and Iranian nuclear negotiations do not derail,
there is a good chance that Saudi Arabia will be able to pushthe OPEC basket price towards $100/b. This could however
be a reason for Iran to back down from negotiations againsince they are in a difficult economic situation and needhigh oil prices.
Crude oil priceCrude oil priceCrude oil priceCrude oil price(NYMEX/ICE, $/b, front month, weekly closing)
10
20
30
40
50
60
70
80
90
100
110
120
130
140
150
2
0 0 2
2
0 0 3
2
0 0 4
2
0 0 5
2
0 0 6
2
0 0 7
2
0 0 8
2
0 0 9
2
0 1 0
2
0 1 1
2
0 1 2
NYMEXWTI
ICE Brent
US crude oil inventoriesUS crude oil inventoriesUS crude oil inventoriesUS crude oil inventories(DOE, mb, weekly data)
315
320
325
330
335
340
345
350
355
360
365
370
375
380
j f m a m j j a s o n d
2007-2011 avg.
2011
2012
Chart Sources: Bloomberg, SEB Commodity Research
Current global crude oil demand estimatesCurrent global crude oil demand estimatesCurrent global crude oil demand estimatesCurrent global crude oil demand estimates
2011
(mb/d)
Revision
(kb/d)
2012
(mb/d)
Revision
(kb/d)IEA 89.1 +30 89.9 -20EIA 87.92 +20 88.81 -150
OPEC 87.78 +10 88.64 +10
SEB average Brent crude oil price forecastSEB average Brent crude oil price forecastSEB average Brent crude oil price forecastSEB average Brent crude oil price forecast
($/b) Q1 Q2 Q3 Q4 FullYear
2012 118 115 115 120 1172013 125 - - - 120
8/2/2019 SEB report: Commodity prices remain under pressure
http://slidepdf.com/reader/full/seb-report-commodity-prices-remain-under-pressure 5/20
5
Commodities Monthly
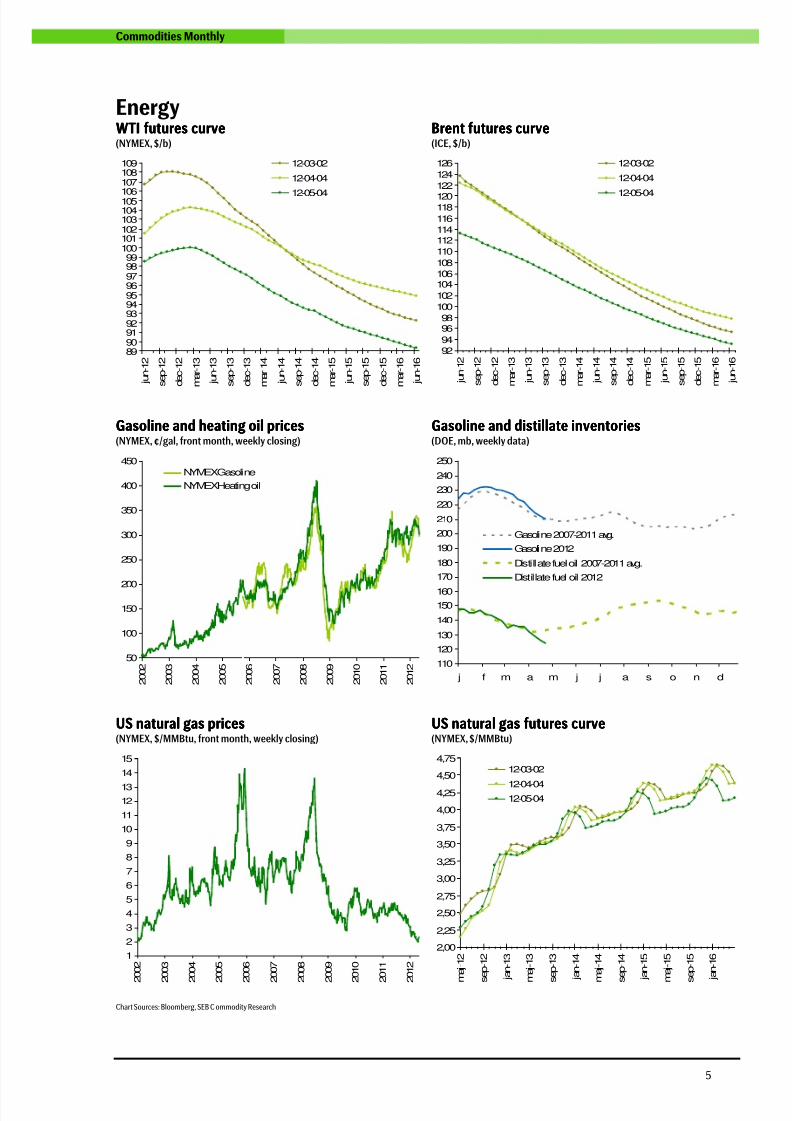
EnergyWTIWTIWTIWTI futures curvefutures curvefutures curvefutures curve(NYMEX, $/b)
Brent futures curveBrent futures curveBrent futures curveBrent futures curve(ICE, $/b)
8990919293949596979899
100101102103104105106
107108109
j u n - 1 2
s e p - 1 2
d e c - 1 2
m a r - 1 3
j u n - 1 3
s e p - 1 3
d e c - 1 3
m a r - 1 4
j u n - 1 4
s e p - 1 4
d e c - 1 4
m a r - 1 5
j u n - 1 5
s e p - 1 5
d e c - 1 5
m a r - 1 6
j u n - 1 6
12-03-02
12-04-04
12-05-04
9294
9698
100102
104106108
110112114116
118120
122124
126
j u n - 1 2
s e p - 1 2
d e c - 1 2
m a r - 1 3
j u n - 1 3
s e p - 1 3
d e c - 1 3
m a r - 1 4
j u n - 1 4
s e p - 1 4
d e c - 1 4
m a r - 1 5
j u n - 1 5
s e p - 1 5
d e c - 1 5
m a r - 1 6
j u n - 1 6
12-03-02
12-04-04
12-05-04
Gasoline and heating oil pricesGasoline and heating oil pricesGasoline and heating oil pricesGasoline and heating oil prices(NYMEX, ¢/gal, front month, weekly closing)
Gasoline and distillate inventoriesGasoline and distillate inventoriesGasoline and distillate inventoriesGasoline and distillate inventories(DOE, mb, weekly data)
50
100
150
200
250
300
350
400
450
2 0 0 2
2 0 0 3
2 0 0 4
2 0 0 5
2 0 0 6
2 0 0 7
2 0 0 8
2 0 0 9
2 0 1 0
2 0 1 1
2 0 1 2
NYMEXGasoline
NYMEXHeating oil
110
120
130
140
150
160
170
180
190
200
210
220
230
240
250
j f m a m j j a s o n d
Gasoline 2007-2011 avg.
Gasoline 2012
Distillate fuel oil 2007-2011 avg.
Distillate fuel oil 2012
US natural gas pricesUS natural gas pricesUS natural gas pricesUS natural gas prices(NYMEX, $/MMBtu, front month, weekly closing)
US natural gasUS natural gasUS natural gasUS natural gas futures curvefutures curvefutures curvefutures curve(NYMEX, $/MMBtu)
1
2
3
4
5
6
7
8
9
10
11
12
13
14
15
2
0 0 2
2
0 0 3
2
0 0 4
2
0 0 5
2
0 0 6
2
0 0 7
2
0 0 8
2
0 0 9
2
0 1 0
2
0 1 1
2
0 1 2
2,00
2,25
2,50
2,75
3,00
3,25
3,50
3,75
4,00
4,25
4,50
4,75
m
a j - 1 2
s
e p - 1 2
j a n - 1 3
m
a j - 1 3
s
e p - 1 3
j a n - 1 4
m
a j - 1 4
s
e p - 1 4
j a n - 1 5
m
a j - 1 5
s
e p - 1 5
j a n - 1 6
12-03-02
12-04-0412-05-04
Chart Sources: Bloomberg, SEB C ommodity Research

8/2/2019 SEB report: Commodity prices remain under pressure
http://slidepdf.com/reader/full/seb-report-commodity-prices-remain-under-pressure 6/20
6
Commodities Monthly
Nordic power
The Nordic power market remains bearish with allfundamentals soft. In addition, the longer datedcontracts are now also being influenced by very weak
thermal coal prices. In particular, the API-2 referencecoal contract recently gave way due to the weakEuropean economic outlook, lower Chinese growthexpectations, and rapidly increasing green powerproduction, especially in Germany. The nuclear powerstation maintenance season has begun with Swedishfacilities currently operating at 70% capacity. Meanwhile,the hydro balance has improved to around +22 TWh,very bearish in our view given the present weakmacroeconomic outlook. We forecast hydrogenerationpricing at several points in coming weeks.
The April system spot price averaged EUR 31.71/MWh. Byprice area, Helsinki averaged EUR 36.48/MWh, MalmöEUR 33.80/MWh and Stockholm EUR 31.51, slightlybelow system price.
The forward curve remains under pressure.Although in our previous report we saw limiteddownside based on the current fundamentals, wenow believe the weak development in fossil fuelsand restricted upside potential in CO2 may implymore remains. For now, we see virtually no bullishfactors. Q3-12 is currently changing hands at29.50/MWh and Cal-13 at EUR 37.80/MWh. Forward
prices for the Finnish price area, having tradedearlier this spring at a substantial premium to thesystem price, have begun falling with the marketexpecting less stress going forward.
Nordic power priceNordic power priceNordic power priceNordic power price(Nord Pool, €/MWh, front quarter, weekly closing)
20
25
30
35
40
45
50
55
60
65
70
75
80
2 0 0 6
2 0 0 7
2 0 0 8
2 0 0 9
2 0 1 0
2 0 1 1
2 0 1 2
Continental power priceContinental power priceContinental power priceContinental power price(EEX, €/MWh, front quarter, weekly closing)
20
25
30
35
40
45
50
55
60
65
70
75
80
85
90
95
2 0 0 6
2 0 0 7
2 0 0 8
2 0 0 9
2 0 1 0
2 0 1 1
2 0 1 2
EUA priceEUA priceEUA priceEUA price(ECX ICE, €/t, Dec. 12, weekly closing)
5
10
15
20
25
30
35
2 0 0 6
2 0 0 7
2 0 0 8
2 0 0 9
2 0 1 0
2 0 1 1
2 0 1 2
Chart Sources: Bloomberg, SEB Commodity Research

8/2/2019 SEB report: Commodity prices remain under pressure
http://slidepdf.com/reader/full/seb-report-commodity-prices-remain-under-pressure 7/20
7
Commodities Monthly
Industrial metals
We remain long term bullish on industrial metals butcontinue to recommend an opportunistic approachin the short- to medium-turn. Being premature, the
early 2012 rally was followed by falling pricesthroughout February, March and most of April. Asmacroeconomic sentiment stabilized and prices ofseveral metals began to be supported by marginalproduction costs buyers returned once again andprices tried to rebound during the second half of themonth. As unstable dynamics are likely to persistuntil the Chinese economy shows more tangiblesigns of stabilizing, we recommend buyers (sellers)capitalize on bearish (bullish) macroeconomicsentiment and support from marginal costs (rallyingprices). Investors aiming to build long termpositions should buy metals gradually andselectively once prices fall significantly below theircorresponding marginal production costs. We seegood long term value in aluminium and nickel whilecopper carries more risk (see below). Zinc stillsuffers from oversupply.
At least, the slowdown in the Chinese economy does notappear to be accelerating. Growth in industrialproduction has slowed to a standstill and GDP to justover 8% y/y in Q4-11. Meanwhile other indicators arestabilizing with some even turning more positive onceagain. For example, the OECD leading indicator has
rebounded and the manufacturing PMI has begun toincrease. Still, several major issues remain unresolved.Firstly, while authorities are working hard toprogressively slow real estate sector growth, it stillthreatens the overall economy. Less controllable ispresent export weakness driven by various externalfactors including, for example, the European debt crisis.It would certainly be more bullish if China decided tostimulate domestic infrastructure construction activity tocompensate for lost export demand.
The present copper market position merits attention.
Anecdotal but credible evidence suggests that the lion’spart of global copper inventories are currently located inChina, either in the country itself or in bonded dockwarehouses. Meanwhile, LME warehouse stocks havereached multi-year lows and continue to decrease.However, unlike the situation earlier this year SHFEwarehouse stocks have levelled out and now also showsigns of decreasing. If Chinese copper were to beconsumed and imports continue going forward themarket, particularly outside China, could become verytight. Conversely, if China is imports decrease goingforward, or worse, if the metal is re-exported, the marketcould become oversupplied. Consequently, the copper
market faces considerable risk at present, both upsideand downside.
LME indexLME indexLME indexLME index(weekly closing)
900110013001500170019002100230025002700290031003300350037003900
4100430045004700
2 0 0 2
2 0 0 3
2 0 0 4
2 0 0 5
2 0 0 6
2 0 0 7
2 0 0 8
2 0 0 9
2 0 1 0
2 0 1 1
2 0 1 2
Industrial metal pricesIndustrial metal pricesIndustrial metal pricesIndustrial metal prices(LME, indexed, weekly closing, January 2010 = 100)
60
70
80
90100
110
120
130
140
150
160
170
180
190
200
j a n - 1 0
f e b - 1 0
m a r - 1 0
a p r - 1 0
m a j - 1 0
j u n - 1 0
j u l - 1 0
a u g - 1 0
s e p - 1 0
o k t - 1 0
n o v - 1 0
d e c - 1 0
j a n - 1 1
f e b - 1 1
m a r - 1 1
a p r - 1 1
m a j - 1 1
j u n - 1 1
j u l - 1 1
a u g - 1 1
s e p - 1 1
o k t - 1 1
n o v - 1 1
d e c - 1 1
j a n - 1 2
f e b - 1 2
m a r - 1 2
a p r - 1 2
m a j - 1 2
CopperNickel
Aluminium
Zinc
Lead
Tin
PPPPrice and inventory changesrice and inventory changesrice and inventory changesrice and inventory changes over theover theover theover the last montlast montlast montlast monthhhh(LME)
-18
-16
-14
-12
-10
-8
-6
-4
-2
0
24
6
8
10
A l u m i n i u m
C o p p e r
N i c k e l
Z i n c
L e a d T i
n
S t e e l
Price (%) Inventories (%)
Chart Sources: Bloomberg, SEB Commodity Research

8/2/2019 SEB report: Commodity prices remain under pressure
http://slidepdf.com/reader/full/seb-report-commodity-prices-remain-under-pressure 8/20
8
Commodities Monthly
Industrial metalsAluminiumAluminiumAluminiumAluminium LME aluminium price and inventoriesLME aluminium price and inventoriesLME aluminium price and inventoriesLME aluminium price and inventories
(weekly data)
• LME aluminium inventories remain very high. High levels
of cancelled warrants, however, due to new rules
allowing higher load-out rates from warehouses, werebeginning to show in early May.
• Chinese aluminium imports were relatively strong in Q1-
12, indicating that local high cost producers are cuttingproduction as prices fall well below their productioncosts.
• Outside China also, current prices are tempting
producers to maintain production cut-backs.
• Financial warehousing deals remain attractive as the
aluminium futures curve contango continues to steepen.
0
500000
1000000
1500000
2000000
2500000
3000000
3500000
4000000
4500000
5000000
5500000
2 0 0 2
2 0 0 3
2 0 0 4
2 0 0 5
2 0 0 6
2 0 0 7
2 0 0 8
2 0 0 9
2 0 1 0
2 0 1 1
2 0 1 2
1000
1250
1500
1750
2000
2250
2500
2750
3000
3250
3500LME inventoris (t, left axis)
LME price ($/t, right axis)
CopperCopperCopperCopper LME copper price and inventoriesLME copper price and inventoriesLME copper price and inventoriesLME copper price and inventories(weekly data)
• LME copper inventories have continued to fall and print
new post 2008 lows while SHFE inventories havestopped rising and even begun to decrease slightly.
• Speculators hold almost neutral COMEX copper
positions, emphasizing the difficulty in devising accuratecopper market predictions going forward.
• ICSG data for FY-11 report unchanged output of 16.0 mt,
a 3.3% increase in refined production to 19.6 mt and a
3.2% rise in refined consumption to 20.0 mt.Consequently, the full year deficit decreased to 358 ktfrom 377 kt in 2010.
• Unlike other forecasters the ICSG initial estimatesuggests a 360 kt refined copper market surplus ispossible in 2013 due to stronger expected mineproduction growth. However, a seasonally adjusteddeficit of 92 kt was reported in January 2012.
0
100000
200000
300000
400000
500000
600000
700000
800000
900000
1000000
2 0 0 2
2 0 0 3
2 0 0 4
2 0 0 5
2 0 0 6
2 0 0 7
2 0 0 8
2 0 0 9
2 0 1 0
2 0 1 1
2 0 1 2
1000
2000
3000
4000
5000
6000
7000
8000
9000
10000
11000LME inventoris (t, left axis)
LME price ($/t, right axis)
NickelNickelNickelNickel LME nickel price and inventoriesLME nickel price and inventoriesLME nickel price and inventoriesLME nickel price and inventories(weekly data)
• Chinese import of refined nickel and nickel ore has
slowed in Q1-12 compared to Q4-11.
• Faster than expected implementation of Indonesian
nickel ore export restrictions (May 6) could tighten futureChinese NPI supply and support the refined market.
• With prices near post-2009 lows, nickel price downside
is restricted by marginal production costs. Consequently,downward price movements from this level will probablybe temporary.
• The biggest cause for concern regarding the outlook for
nickel is the recent sharp decrease to near stagnant year-on-year growth in Chinese stainless steel production.
• Though several HPAL project delays have been reported,
according to the INSG supply increased significantly inearly 2012, most particularly in China.
0
20000
40000
60000
80000
100000
120000
140000
160000
180000
2 0
0 2
2 0
0 3
2 0
0 4
2 0
0 5
2 0
0 6
2 0
0 7
2 0
0 8
2 0
0 9
2 0
1 0
2 0
1 1
2 0
1 20
5000
10000
15000
20000
25000
30000
35000
40000
45000
5000055000
60000LME inventoris (t, left axis)
LME price ($/t, right axis)
Chart Sources: Bloomberg, SEB Commodity Research

8/2/2019 SEB report: Commodity prices remain under pressure
http://slidepdf.com/reader/full/seb-report-commodity-prices-remain-under-pressure 9/20
9
Commodities Monthly
Industrial metalsZinZinZinZincccc LME zinc price and inventoriesLME zinc price and inventoriesLME zinc price and inventoriesLME zinc price and inventories
(weekly data)
• With LME zinc inventories currently at 17-year highs, the
zinc market remains the weakest in the industrial metals
sector with financial warehousing deals providing one ofonly a limited number of supportive elements.
• We expect the current market surplus to persist into
2014, significantly restricting zinc price upside potential.The ILZSG forecasts a 2012 refined market surplus of249 kt, unchanged compared to last year.
• In particular, this year the ILZSG projects a 4.4%
increase in demand for refined zinc to 13.41 mt andgrowth of 4.4% in refined production to 13.66 mt, bothdriven by activity in China.
0
100000
200000
300000
400000
500000
600000
700000
800000
900000
1000000
2 0 0 2
2 0 0 3
2 0 0 4
2 0 0 5
2 0 0 6
2 0 0 7
2 0 0 8
2 0 0 9
2 0 1 0
2 0 1 1
2 0 1 2
500
1000
1500
2000
2500
3000
3500
4000
4500
5000LME inventoris (t, left axis)
LME price ($/t, right axis)
Ferrous metalsFerrous metalsFerrous metalsFerrous metals LME steel billet price and inventoriesLME steel billet price and inventoriesLME steel billet price and inventoriesLME steel billet price and inventories
(weekly data)
• Steel prices trended lower in both March and April with
LME billets falling almost 5% to $490/t.
• Raw materials showed a fairly neutral development withTurkish scrap prices decreasing only slightly to $449/tand iron ore (Fe 62%) increasing marginally to $145/t.
• China reported record annualized crude steel output in
March of 739 mt due to strong export demand (59 mtpa)and an increased local inventory. During the sameperiod, end user demand declined 1.5% y/y.
• With seasonal peak consumption imminent, Chinesemanufacturing data picking up, property transactionsrecovering, and further signs of liquidity improvements,domestic steel demand should increase, providingadditional support for iron ore prices at around $140/t.
0
10000
20000
30000
40000
50000
60000
70000
80000
90000
j u l - 0 8
o k t - 0 8
j a n - 0 9
a p r - 0 9
j u l - 0 9
o k t - 0 9
j a n - 1 0
a p r - 1 0
j u l - 1 0
o k t - 1 0
j a n - 1 1
a p r - 1 1
j u l - 1 1
o k t - 1 1
j a n - 1 2
a p r - 1 2
200
300
400
500
600
700
800
900
1000
1100
1200
1300LME inventoris (t, left axis)
LME price ($/t, right axis)
LME lead price and inventoriesLME lead price and inventoriesLME lead price and inventoriesLME lead price and inventories(weekly data)
LME tin price and inventoriesLME tin price and inventoriesLME tin price and inventoriesLME tin price and inventories(weekly data)
0
25000
50000
75000
100000
125000
150000
175000
200000
225000
250000
275000
300000
325000
350000
375000
400000
2 0 0 2
2 0 0 3
2 0 0 4
2 0 0 5
2 0 0 6
2 0 0 7
2 0 0 8
2 0 0 9
2 0 1 0
2 0 1 1
2 0 1 2
0
500
1000
1500
2000
2500
3000
3500
4000LME inventoris (t, left axis)
LME price ($/t, right axis)
0
5000
10000
15000
20000
25000
30000
35000
40000
2 0 0 2
2 0 0 3
2 0 0 4
2 0 0 5
2 0 0 6
2 0 0 7
2 0 0 8
2 0 0 9
2 0 1 0
2 0 1 1
2 0 1 2
3000
6000
9000
12000
15000
18000
21000
24000
27000
30000
33000
36000LME inventoris (t, left axis)
LME price ($/t, right axis)
Chart Sources: Bloomberg, SEB C ommodity Research
8/2/2019 SEB report: Commodity prices remain under pressure
http://slidepdf.com/reader/full/seb-report-commodity-prices-remain-under-pressure 10/20
10
Commodities Monthly
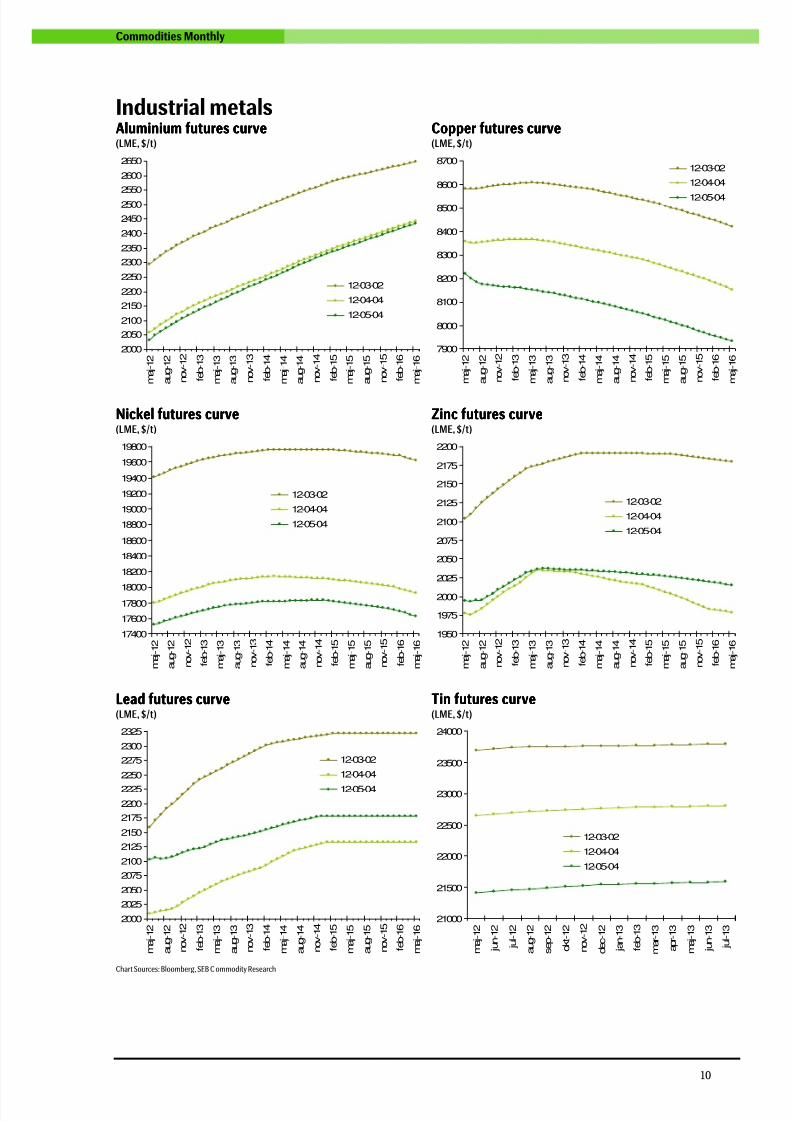
Industrial metalsAluminiumAluminiumAluminiumAluminium futures curvefutures curvefutures curvefutures curve(LME, $/t)
Copper futures curveCopper futures curveCopper futures curveCopper futures curve(LME, $/t)
2000
2050
2100
2150
2200
2250
2300
2350
2400
2450
2500
2550
2600
2650
m a j - 1 2
a u g - 1 2
n o v - 1 2
f e b - 1 3
m a j - 1 3
a u g - 1 3
n o v - 1 3
f e b - 1 4
m a j - 1 4
a u g - 1 4
n o v - 1 4
f e b - 1 5
m a j - 1 5
a u g - 1 5
n o v - 1 5
f e b - 1 6
m a j - 1 6
12-03-02
12-04-04
12-05-04
7900
8000
8100
8200
8300
8400
8500
8600
8700
m a j - 1 2
a u g - 1 2
n o v - 1 2
f e b - 1 3
m a j - 1 3
a u g - 1 3
n o v - 1 3
f e b - 1 4
m a j - 1 4
a u g - 1 4
n o v - 1 4
f e b - 1 5
m a j - 1 5
a u g - 1 5
n o v - 1 5
f e b - 1 6
m a j - 1 6
12-03-02
12-04-04
12-05-04
Nickel futures curveNickel futures curveNickel futures curveNickel futures curve(LME, $/t)
Zinc futures curveZinc futures curveZinc futures curveZinc futures curve(LME, $/t)
17400
17600
1780018000
18200
18400
18600
18800
19000
19200
19400
19600
19800
m a j - 1 2
a u g - 1 2
n o v - 1 2
f e b - 1 3
m a j - 1 3
a u g - 1 3
n o v - 1 3
f e b - 1 4
m a j - 1 4
a u g - 1 4
n o v - 1 4
f e b - 1 5
m a j - 1 5
a u g - 1 5
n o v - 1 5
f e b - 1 6
m a j - 1 6
12-03-02
12-04-04
12-05-04
1950
1975
2000
2025
2050
2075
2100
2125
2150
2175
2200
m a j - 1 2
a u g - 1 2
n o v - 1 2
f e b - 1 3
m a j - 1 3
a u g - 1 3
n o v - 1 3
f e b - 1 4
m a j - 1 4
a u g - 1 4
n o v - 1 4
f e b - 1 5
m a j - 1 5
a u g - 1 5
n o v - 1 5
f e b - 1 6
m a j - 1 6
12-03-02
12-04-04
12-05-04
Lead futures curveLead futures curveLead futures curveLead futures curve(LME, $/t)
Tin futures curveTin futures curveTin futures curveTin futures curve(LME, $/t)
2000
2025
2050
2075
2100
2125
2150
2175
2200
2225
2250
2275
2300
2325
m a j - 1 2
a u g - 1 2
n o v - 1 2
f e b - 1 3
m a j - 1 3
a u g - 1 3
n o v - 1 3
f e b - 1 4
m a j - 1 4
a u g - 1 4
n o v - 1 4
f e b - 1 5
m a j - 1 5
a u g - 1 5
n o v - 1 5
f e b - 1 6
m a j - 1 6
12-03-02
12-04-04
12-05-04
21000
21500
22000
22500
23000
23500
24000
m a j - 1 2
j u n - 1 2
j u l - 1 2
a u g - 1 2
s e p - 1 2
o k t - 1 2
n o v - 1 2
d e c - 1 2
j a n - 1 3
f e b - 1 3
m a r - 1 3
a p r - 1 3
m a j - 1 3
j u n - 1 3
j u l - 1 3
12-03-02
12-04-04
12-05-04
Chart Sources: Bloomberg, SEB C ommodity Research
8/2/2019 SEB report: Commodity prices remain under pressure
http://slidepdf.com/reader/full/seb-report-commodity-prices-remain-under-pressure 11/20
11
Commodities Monthly
Precious metals
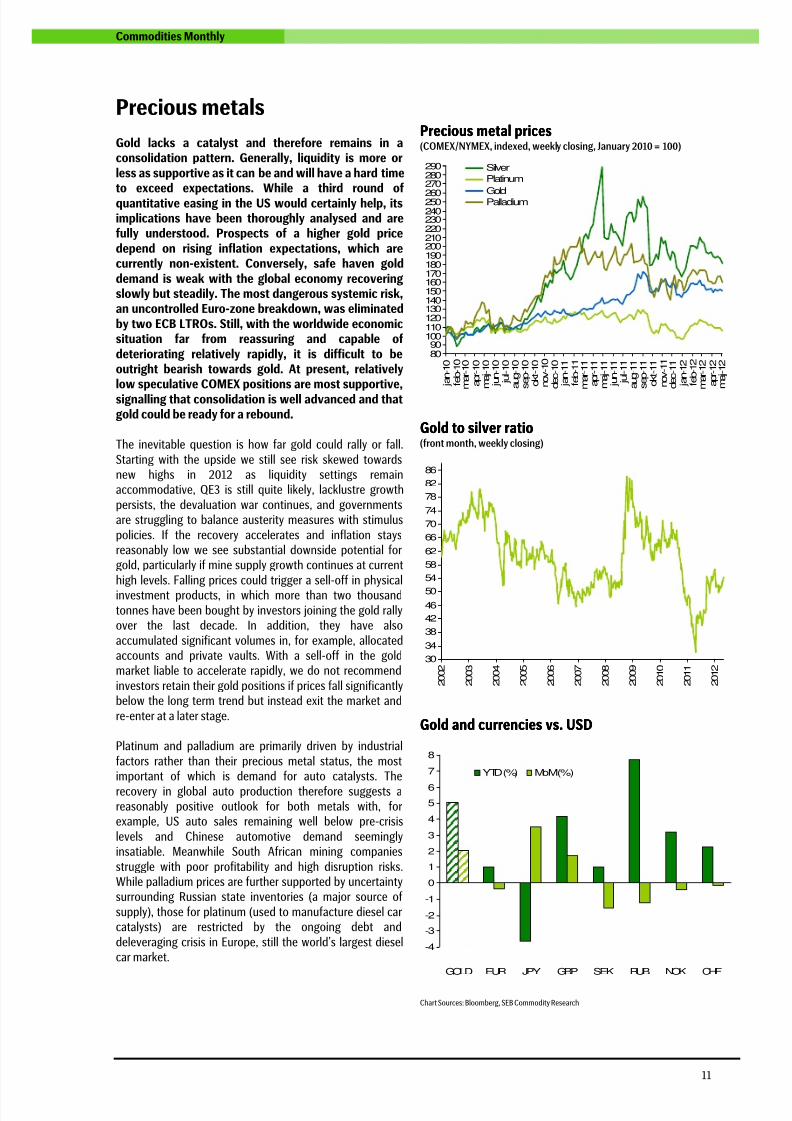
Gold lacks a catalyst and therefore remains in aconsolidation pattern. Generally, liquidity is more orless as supportive as it can be and will have a hard timeto exceed expectations. While a third round ofquantitative easing in the US would certainly help, itsimplications have been thoroughly analysed and arefully understood. Prospects of a higher gold pricedepend on rising inflation expectations, which arecurrently non-existent. Conversely, safe haven golddemand is weak with the global economy recoveringslowly but steadily. The most dangerous systemic risk,an uncontrolled Euro-zone breakdown, was eliminatedby two ECB LTROs. Still, with the worldwide economicsituation far from reassuring and capable ofdeteriorating relatively rapidly, it is difficult to beoutright bearish towards gold. At present, relativelylow speculative COMEX positions are most supportive,signalling that consolidation is well advanced and thatgold could be ready for a rebound.
The inevitable question is how far gold could rally or fall.
Starting with the upside we still see risk skewed towardsnew highs in 2012 as liquidity settings remainaccommodative, QE3 is still quite likely, lacklustre growth
persists, the devaluation war continues, and governmentsare struggling to balance austerity measures with stimulus
policies. If the recovery accelerates and inflation staysreasonably low we see substantial downside potential forgold, particularly if mine supply growth continues at current
high levels. Falling prices could trigger a sell-off in physicalinvestment products, in which more than two thousand
tonnes have been bought by investors joining the gold rallyover the last decade. In addition, they have also
accumulated significant volumes in, for example, allocatedaccounts and private vaults. With a sell-off in the goldmarket liable to accelerate rapidly, we do not recommend
investors retain their gold positions if prices fall significantlybelow the long term trend but instead exit the market and
re-enter at a later stage.
Platinum and palladium are primarily driven by industrial
factors rather than their precious metal status, the mostimportant of which is demand for auto catalysts. The
recovery in global auto production therefore suggests areasonably positive outlook for both metals with, forexample, US auto sales remaining well below pre-crisis
levels and Chinese automotive demand seeminglyinsatiable. Meanwhile South African mining companies
struggle with poor profitability and high disruption risks.While palladium prices are further supported by uncertaintysurrounding Russian state inventories (a major source of
supply), those for platinum (used to manufacture diesel carcatalysts) are restricted by the ongoing debt and
deleveraging crisis in Europe, still the world’s largest dieselcar market.
Precious metal pricesPrecious metal pricesPrecious metal pricesPrecious metal prices(COMEX/NYMEX, indexed, weekly closing, January 2010 = 100)
8090
100110120130140150160170180190200210220230240250260
270280290
j a n - 1 0
f e b - 1 0
m a r - 1 0
a p r - 1 0
m a j - 1 0
j u n - 1 0
j u l - 1 0
a u g - 1 0
s e p - 1 0
o k t - 1 0
n o v - 1 0
d e c - 1 0
j a n - 1 1
f e b - 1 1
m a r - 1 1
a p r - 1 1
m a j - 1 1
j u n - 1 1
j u l - 1 1
a u g - 1 1
s e p - 1 1
o k t - 1 1
n o v - 1 1
d e c - 1 1
j a n - 1 2
f e b - 1 2
m a r - 1 2
a p r - 1 2
m a j - 1 2
SilverPlatinum
GoldPalladium
Gold to silver ratioGold to silver ratioGold to silver ratioGold to silver ratio(front month, weekly closing)
30
34
38
42
46
50
54
58
62
66
70
74
78
82
86
2 0 0 2
2 0 0 3
2 0 0 4
2 0 0 5
2 0 0 6
2 0 0 7
2 0 0 8
2 0 0 9
2 0 1 0
2 0 1 1
2 0 1 2
Gold and currencies vs. USDGold and currencies vs. USDGold and currencies vs. USDGold and currencies vs. USD
-4
-3
-2
-1
0
1
2
3
4
5
6
7
8
GOLD EUR JPY GBP SEK RUB NOK CHF
YTD (%) MoM(%)
Chart Sources: Bloomberg, SEB Commodity Research

8/2/2019 SEB report: Commodity prices remain under pressure
http://slidepdf.com/reader/full/seb-report-commodity-prices-remain-under-pressure 12/20
12
Commodities Monthly
Precious metalsGoldGoldGoldGold Gold priceGold priceGold priceGold price
(COMEX, $/ozt, front month, weekly closing)
• After printing new highs in March at 2410.2 tonnes,
physical ETF holdings have been decreasing slowly to
currently 2381.5 tonnes.• Net speculative long COMEX gold positions are back at
multi-year lows, approximately 50% below their level inmid-2011, after trending lower during March and April.
• April US Mint gold coin sales were even weaker than in
February, with a first tertial total of 230.5 kozt, downfrom 407.5 kozt during the corresponding period lastyear.
• Latest gold mining data show production growth was
almost zero last month after appearing to strengthenearlier this year. In absolute terms output remains at nearrecord highs.
200300400
500600700
800900
10001100
1200
130014001500
16001700
18001900
2000
2 0 0 2
2 0 0 3
2 0 0 4
2 0 0 5
2 0 0 6
2 0 0 7
2 0 0 8
2 0 0 9
2 0 1 0
2 0 1 1
2 0 1 2
SilverSilverSilverSilver SilverSilverSilverSilver pricepricepriceprice(COMEX, $/ozt, front month, weekly closing)
• Physical silver ETF holdings have retreated slowly since
early March and currently stand at 17,539 tonnes, wellbelow the 2011 record high of 18,639 tonnes.
• Net speculative long COMEX positions have decreasedover the past two months due to fewer long- and moreshort positions.
• US Mint silver coin sales have been weaker than last year
with 11.7 mozt sold during the first four months of this
year compared with 15.2 mozt during the same period in2011.
• After falling below 50 in February, the gold to silver ratio
has trended higher to current 54.4. However, we do notexpect it to exceed 60 before market conditions turningfrom liquidity to growth orientation starts favouringsilver and the ratio starts trending lower again.
2468
101214161820
222426283032343638404244464850
2 0 0 2
2 0 0 3
2 0 0 4
2 0 0 5
2 0 0 6
2 0 0 7
2 0 0 8
2 0 0 9
2 0 1 0
2 0 1 1
2 0 1 2
Platinum & PalladiumPlatinum & PalladiumPlatinum & PalladiumPlatinum & Palladium Platinum and palladium pricesPlatinum and palladium pricesPlatinum and palladium pricesPlatinum and palladium prices(NYMEX, $/ozt, front month, weekly closing)
• Physical platinum ETF holdings have remained near
record highs since early 2011 while tending to drift lower
during the past two months to 42.4 tonnes. Unlike otherprecious metals, palladium holdings have increased to60.9 tonnes so far this year after falling back from all-time highs in early 2011 (73.1 tonnes).
• Speculative long NYMEX platinum positions have
slumped to multi-year lows over the past two monthsdue to fewer long- and record high short positions.Palladium has reported a similar development althoughnot as extreme.
• We expect the platinum to palladium ratio to fall further,as discussed earlier.
100
200
300
400
500
600
700
800
900
1000
1100
2
0 0 2
2
0 0 3
2
0 0 4
2
0 0 5
2
0 0 6
2
0 0 7
2
0 0 8
2
0 0 9
2
0 1 0
2
0 1 1
2
0 1 2
300
550
800
1050
1300
1550
1800
2050
2300Palladium (left axis)
Platinum(right axis)
Chart Sources: Bloomberg, SEB Commodity Research
8/2/2019 SEB report: Commodity prices remain under pressure
http://slidepdf.com/reader/full/seb-report-commodity-prices-remain-under-pressure 13/20
13
Commodities Monthly
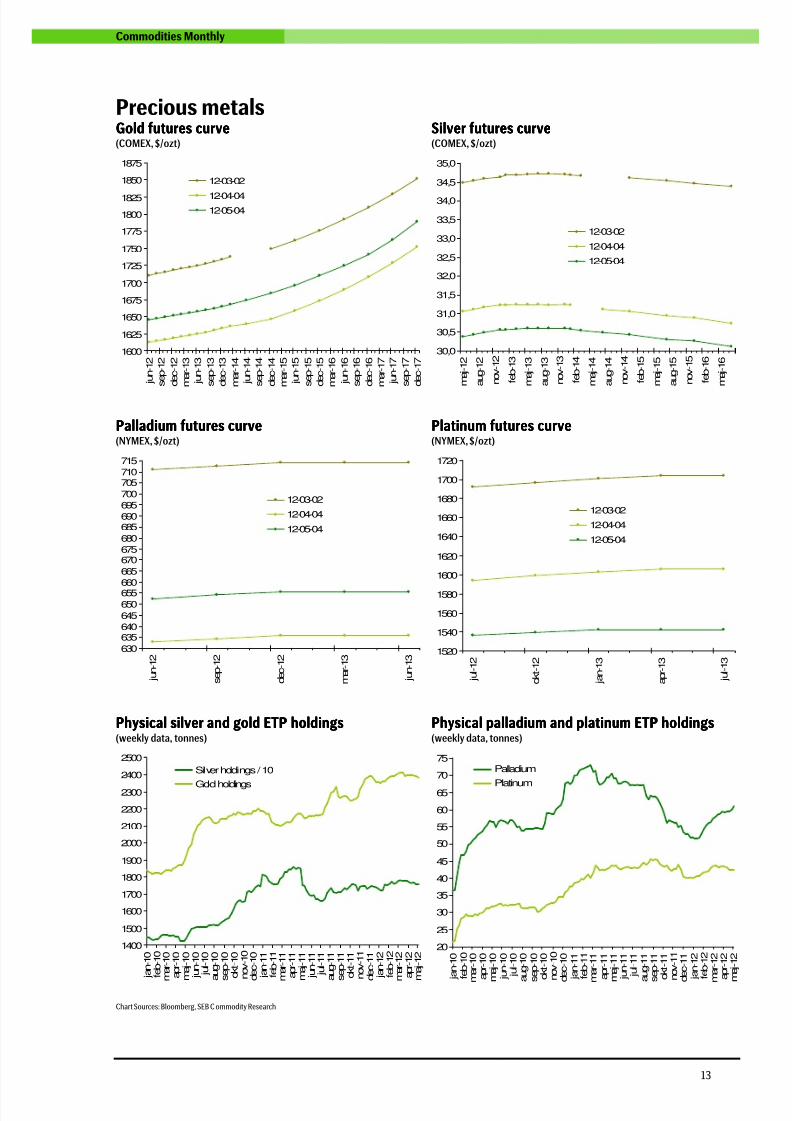
Precious metalsGoldGoldGoldGold futures curvefutures curvefutures curvefutures curve(COMEX, $/ozt)
SilverSilverSilverSilver futures curvefutures curvefutures curvefutures curve(COMEX, $/ozt)
1600
1625
1650
1675
1700
1725
1750
1775
1800
1825
1850
1875
j u n - 1 2
s e p - 1 2
d e c - 1 2
m a r - 1 3
j u n - 1 3
s e p - 1 3
d e c - 1 3
m a r - 1 4
j u n - 1 4
s e p - 1 4
d e c - 1 4
m a r - 1 5
j u n - 1 5
s e p - 1 5
d e c - 1 5
m a r - 1 6
j u n - 1 6
s e p - 1 6
d e c - 1 6
m a r - 1 7
j u n - 1 7
s e p - 1 7
d e c - 1 7
12-03-02
12-04-0412-05-04
30,0
30,5
31,0
31,5
32,0
32,5
33,0
33,5
34,0
34,5
35,0
m a j - 1 2
a u g - 1 2
n o v - 1 2
f e b - 1 3
m a j - 1 3
a u g - 1 3
n o v - 1 3
f e b - 1 4
m a j - 1 4
a u g - 1 4
n o v - 1 4
f e b - 1 5
m a j - 1 5
a u g - 1 5
n o v - 1 5
f e b - 1 6
m a j - 1 6
12-03-02
12-04-04
12-05-04
Palladium futures curvePalladium futures curvePalladium futures curvePalladium futures curve(NYMEX, $/ozt)
Platinum futures curvePlatinum futures curvePlatinum futures curvePlatinum futures curve(NYMEX, $/ozt)
630
635640645
650655660665
670675680
685690695700
705710715
j u n - 1 2
s e p - 1 2
d e c - 1 2
m a r - 1 3
j u n - 1 3
12-03-02
12-04-04
12-05-04
1520
1540
1560
1580
1600
1620
1640
1660
1680
1700
1720
j u l - 1 2
o k t - 1 2
j a n - 1 3
a p r - 1 3
j u l - 1 3
12-03-02
12-04-04
12-05-04
Physical sPhysical sPhysical sPhysical silver and goldilver and goldilver and goldilver and gold ETPETPETPETP holdingsholdingsholdingsholdings(weekly data, tonnes)
Physical pPhysical pPhysical pPhysical palladium and platinumalladium and platinumalladium and platinumalladium and platinum ETPETPETPETP holdingsholdingsholdingsholdings(weekly data, tonnes)
1400
1500
1600
1700
1800
1900
2000
2100
2200
2300
2400
2500
j a n - 1 0
f e b - 1 0
m a r - 1 0
a p r - 1 0
m a j - 1 0
j u n - 1 0
j u l - 1 0
a u g - 1 0
s e p - 1 0
o k t - 1 0
n o v - 1 0
d e c - 1 0
j a n - 1 1
f e b - 1 1
m a r - 1 1
a p r - 1 1
m a j - 1 1
j u n - 1 1
j u l - 1 1
a u g - 1 1
s e p - 1 1
o k t - 1 1
n o v - 1 1
d e c - 1 1
j a n - 1 2
f e b - 1 2
m a r - 1 2
a p r - 1 2
m a j - 1 2
Silver holdings / 10
Gold holdings
20
25
30
35
40
45
50
55
60
65
70
75
j a n - 1 0
f e b - 1 0
m
a r - 1 0
a p r - 1 0
m a j - 1 0
j u n - 1 0
j u l - 1 0
a u g - 1 0
s e p - 1 0
o k t - 1 0
n o v - 1 0
d e c - 1 0
j a n - 1 1
f e b - 1 1
m
a r - 1 1
a p r - 1 1
m a j - 1 1
j u n - 1 1
j u l - 1 1
a u g - 1 1
s e p - 1 1
o k t - 1 1
n o v - 1 1
d e c - 1 1
j a n - 1 2
f e b - 1 2
m
a r - 1 2
a p r - 1 2
m a j - 1 2
Palladium
Platinum
Chart Sources: Bloomberg, SEB C ommodity Research
8/2/2019 SEB report: Commodity prices remain under pressure
http://slidepdf.com/reader/full/seb-report-commodity-prices-remain-under-pressure 14/20
14
Commodities Monthly
Agriculture
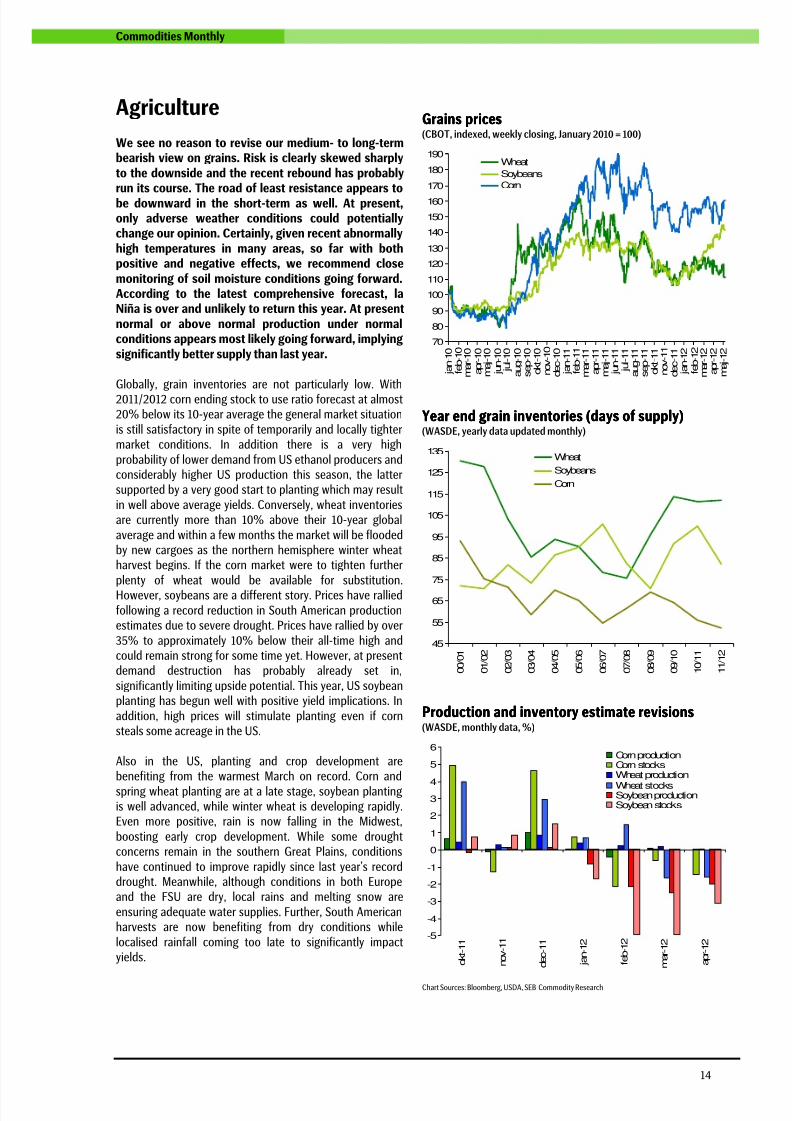
We see no reason to revise our medium- to long-termbearish view on grains. Risk is clearly skewed sharplyto the downside and the recent rebound has probablyrun its course. The road of least resistance appears tobe downward in the short-term as well. At present,only adverse weather conditions could potentiallychange our opinion. Certainly, given recent abnormallyhigh temperatures in many areas, so far with bothpositive and negative effects, we recommend closemonitoring of soil moisture conditions going forward.According to the latest comprehensive forecast, laNiña is over and unlikely to return this year. At presentnormal or above normal production under normalconditions appears most likely going forward, implyingsignificantly better supply than last year.
Globally, grain inventories are not particularly low. With2011/2012 corn ending stock to use ratio forecast at almost20% below its 10-year average the general market situation
is still satisfactory in spite of temporarily and locally tightermarket conditions. In addition there is a very high
probability of lower demand from US ethanol producers andconsiderably higher US production this season, the lattersupported by a very good start to planting which may result
in well above average yields. Conversely, wheat inventoriesare currently more than 10% above their 10-year global
average and within a few months the market will be floodedby new cargoes as the northern hemisphere winter wheatharvest begins. If the corn market were to tighten further
plenty of wheat would be available for substitution.However, soybeans are a different story. Prices have rallied
following a record reduction in South American productionestimates due to severe drought. Prices have rallied by over
35% to approximately 10% below their all-time high andcould remain strong for some time yet. However, at presentdemand destruction has probably already set in,
significantly limiting upside potential. This year, US soybeanplanting has begun well with positive yield implications. In
addition, high prices will stimulate planting even if cornsteals some acreage in the US.
Also in the US, planting and crop development arebenefiting from the warmest March on record. Corn and
spring wheat planting are at a late stage, soybean plantingis well advanced, while winter wheat is developing rapidly.Even more positive, rain is now falling in the Midwest,
boosting early crop development. While some droughtconcerns remain in the southern Great Plains, conditions
have continued to improve rapidly since last year’s recorddrought. Meanwhile, although conditions in both Europeand the FSU are dry, local rains and melting snow are
ensuring adequate water supplies. Further, South Americanharvests are now benefiting from dry conditions while
localised rainfall coming too late to significantly impactyields.
Grains priGrains priGrains priGrains pricescescesces(CBOT, indexed, weekly closing, January 2010 = 100)
70
80
90
100
110
120
130
140
150
160
170
180
190
j a n - 1 0
f e b - 1 0
m a r - 1 0
a p r - 1 0
m a j - 1 0
j u n - 1 0
j u l - 1 0
a u g - 1 0
s e p - 1 0
o k t - 1 0
n o v - 1 0
d e c - 1 0
j a n - 1 1
f e b - 1 1
m a r - 1 1
a p r - 1 1
m a j - 1 1
j u n - 1 1
j u l - 1 1
a u g - 1 1
s e p - 1 1
o k t - 1 1
n o v - 1 1
d e c - 1 1
j a n - 1 2
f e b - 1 2
m a r - 1 2
a p r - 1 2
m a j - 1 2
Wheat
Soybeans
Corn
Year end grain inventories (days of supply)Year end grain inventories (days of supply)Year end grain inventories (days of supply)Year end grain inventories (days of supply)(WASDE, yearly data updated monthly)
45
55
65
75
85
95
105
115
125
135
0 0 / 0 1
0 1 / 0 2
0 2 / 0 3
0 3 / 0 4
0 4 / 0 5
0 5 / 0 6
0 6 / 0 7
0 7 / 0 8
0 8 / 0 9
0 9 / 1 0
1 0 / 1 1
1 1 / 1 2
Wheat
Soybeans
Corn
Production and inventory estimate revisionsProduction and inventory estimate revisionsProduction and inventory estimate revisionsProduction and inventory estimate revisions(WASDE, monthly data, %)
-5
-4
-3
-2
-1
0
1
2
34
5
6
o k t - 1 1
n o v - 1 1
d e c - 1 1
j a n - 1 2
f e b - 1 2
m a r - 1 2
a p r - 1 2
Corn productionCorn stocksWheat production
Wheat stocksSoybean productionSoybean stocks
Chart Sources: Bloomberg, USDA, SEB Commodity Research

8/2/2019 SEB report: Commodity prices remain under pressure
http://slidepdf.com/reader/full/seb-report-commodity-prices-remain-under-pressure 15/20
15
Commodities Monthly
AgricultureCornCornCornCorn Corn priceCorn priceCorn priceCorn price
(CBOT, ¢/bu, front month, weekly closing)
• Net speculative long positions in CBOT corn fell
significantly in April, primarily due to an unusual build-up
in short positions.• Exceptionally favourable weather conditions have
resulted in abnormally quick progress in US planting. Inaddition, early crop development is positive with soilmoisture levels increased by recent rains, implying anabove average yield, unlike last year’s dismal outcomedue to a combination of drought and excessive rainfall.
• US ethanol prices are being affected by several
headwinds including further rises in record highinventories, Brazilian ethanol production and exportsramping up seasonally and corn prices remaining highcompared to ethanol prices. The only supportive factor isthe fact that high gasoline prices encourage blending.
100
200
300
400
500
600
700
800
2 0 0 2
2 0 0 3
2 0 0 4
2 0 0 5
2 0 0 6
2 0 0 7
2 0 0 8
2 0 0 9
2 0 1 0
2 0 1 1
2 0 1 2
WheatWheatWheatWheat Wheat priceWheat priceWheat priceWheat price(CBOT, ¢/bu, front month, weekly closing)
• Net speculative long positions in CBOT wheat have
remained negative at just above record low levels sinceQ3-11. Concurrently, both long and short positions haveincreased in tandem.
• Abnormally warm temperatures in the northern
hemisphere, particularly in March, have decisively endedwinter wheat dormancy with crops now developingrapidly. Absent unforeseen disruption, the harvest could
start early this year. Spring wheat planting is alsoprogressing rapidly in the US.
• So far warm conditions in both the US and Europe havenot yet resulted in serious drought conditions althoughthey may and should be monitored accordingly.
• US wheat prices were temporarily supported by
abnormally high export demand during the second halfof April.
200
300
400
500
600
700
800
900
1000
1100
1200
2 0 0 2
2 0 0 3
2 0 0 4
2 0 0 5
2 0 0 6
2 0 0 7
2 0 0 8
2 0 0 9
2 0 1 0
2 0 1 1
2 0 1 2
SoybeansSoybeansSoybeansSoybeans Soybean prSoybean prSoybean prSoybean priceiceiceice(CBOT, ¢/bu, front month, weekly closing)
• Net speculative long positions in CBOT soybeans rosesharply to record highs during February and Marchbefore stabilizing in April. Previously, short positions haddecreased from relatively high levels as long positionsincreased. However, during April, short positions beganaccumulating once again.
• A favourable start to corn planting usually exertspressure on soybean acreage, although the currentsoybean to corn ratio suggests allowing this to happenwould be irrational. Indeed, soybean planting has startedwell, implying eventually high yields.
• Chinese import demand remains strong, increasing
pressure on a market already adversely affected by weaksupply. Still, with the market already fully aware of both
these factors, they should already be fully discounted incurrent prices.
400
600
800
1000
1200
1400
1600
1800
2 0 0 2
2 0 0 3
2 0 0 4
2 0 0 5
2 0 0 6
2 0 0 7
2 0 0 8
2 0 0 9
2 0 1 0
2 0 1 1
2 0 1 2
Chart Sources: Bloomberg, SEB Commodity Research

8/2/2019 SEB report: Commodity prices remain under pressure
http://slidepdf.com/reader/full/seb-report-commodity-prices-remain-under-pressure 16/20
16
Commodities Monthly
AgricultureCorn futures curveCorn futures curveCorn futures curveCorn futures curve(CBOT, ¢/bu)
Wheat futures curveWheat futures curveWheat futures curveWheat futures curve(CBOT, ¢/bu)
520
530
540
550
560
570
580
590
600
610
620
630
640
650
660
670
m a j - 1 2
a u g - 1 2
n o v - 1 2
f e b - 1 3
m a j - 1 3
a u g - 1 3
n o v - 1 3
f e b - 1 4
m a j - 1 4
a u g - 1 4
12-03-02
12-04-04
12-05-04
600
625
650
675
700
725
750
775
m a j - 1 2
a u g - 1 2
n o v - 1 2
f e b - 1 3
m a j - 1 3
a u g - 1 3
n o v - 1 3
f e b - 1 4
12-03-02
12-04-0412-05-04
Soybean futures curveSoybean futures curveSoybean futures curveSoybean futures curve(CBOT, ¢/bu)
SugarSugarSugarSugar(NYBOT, ¢/lb)
1200
1225
1250
12751300
1325
1350
1375
1400
1425
1450
1475
1500
m a j - 1 2
a u g - 1 2
n o v - 1 2
f e b - 1 3
m a j - 1 3
a u g - 1 3
n o v - 1 3
f e b - 1 4
m a j - 1 4
12-03-02
12-04-04
12-05-04
0
5
10
15
20
25
30
35
40
2 0 0 2
2 0 0 3
2 0 0 4
2 0 0 5
2 0 0 6
2 0 0 7
2 0 0 8
2 0 0 9
2 0 1 0
2 0 1 1
2 0 1 2
CottonCottonCottonCotton(NYBOT, ¢/lb)
CocoaCocoaCocoaCocoa(NYBOT, $/t)
20
40
60
80
100
120
140
160
180
200
220
2
0 0 2
2
0 0 3
2
0 0 4
2
0 0 5
2
0 0 6
2
0 0 7
2
0 0 8
2
0 0 9
2
0 1 0
2
0 1 1
2
0 1 2
1200
1400
1600
1800
2000
2200
2400
2600
2800
3000
3200
3400
3600
3800
2
0 0 2
2
0 0 3
2
0 0 4
2
0 0 5
2
0 0 6
2
0 0 7
2
0 0 8
2
0 0 9
2
0 1 0
2
0 1 1
2
0 1 2
Chart Sources: Bloomberg, SEB C ommodity Research

8/2/2019 SEB report: Commodity prices remain under pressure
http://slidepdf.com/reader/full/seb-report-commodity-prices-remain-under-pressure 17/20
17
Commodities Monthly
Commodity related economic indicatorsEUROZONE Current Date Previous Date NextIndustrial production (%, YoY) -1,9 2012-02-29 -1,7 2012-01-31 2012-05-14
Industrial production (%, MoM) 0,4 2012-02-29 2012-01-31 2012-05-14
Capacity utilization (%, sa) 79,6 2012-06-30 79,8 2012-03-31
Manufacturing PMI 45,9 2012-04-30 47,7 2012-03-31 2012-05-24
Real GDP (%, YoY) 0,7 2011-12-31 1,3 2011-09-30 2012-05-15
Real GDP (%, QoQ, sa) -0,3 2011-12-31 0,1 2011-09-30 2012-05-15
CPI (%, YoY) 2,7 2012-03-31 2,7 2012-02-29 2012-05-16
CPI (%, MoM) 1,3 2012-03-31 0,5 2012-02-29 2012-05-16
Consumer confidence -19,9 2012-04-30 -19,1 2012-03-31 2012-05-22
USA
Industrial production (%, YoY) 3,8 2012-03-31 4,6 2012-02-29
Industrial production (%, MoM) 0,0 2012-03-31 0,0 2012-02-29 2012-05-16
Capacity utilization (%) 78,6 2012-03-31 78,7 2012-02-29 2012-05-16
Manufacturing PMI 54,8 2012-04-30 53,4 2012-03-31 2012-06-01
Real GDP (%, YoY) 2,1 2012-03-31 1,6 2011-12-31
Real GDP (%, QoQ, saar) 2,2 2012-03-31 3,0 2011-12-31 2012-05-31
CPI (%, MoM) 2,7 2012-03-31 2,9 2012-02-29 2012-05-15
CPI (%, MoM, sa) 0,3 2012-03-31 0,4 2012-02-29 2012-05-15
OECD Composite Leading Indicator 103,4 2011-03-31 103,1 2011-02-28
Consumer confidence (Michigan) 76,4 2012-04-30 76,2 2012-03-31 2012-05-11
Nonfarm payrolls (net change, sa, ‘000) 115 2012-04-30 154 2012-03-31 2012-06-01
JAPAN
Industrial production (%, YoY, nsa) 13,9 2012-03-31 1,5 2012-02-29 2012-05-17
Industrial production (%, MoM, sa) 1,0 2012-03-31 -1,6 2012-02-29 2012-05-17
Capacity utilization (%, sa) 91,2 2012-02-29 92,8 2012-01-31
Manufacturing PMI 50,7 2012-04-30 51,1 2012-03-31
Real GDP (%, YoY) -0,6 2011-12-31 -0,4 2011-09-30
Real GDP (%, QoQ, sa) -0,2 2011-12-31 1,7 2011-09-30 2012-05-17
CPI (%, YoY) -0,3 2012-04-30 -0,1 2012-03-31 2012-05-25
CPI (%, MoM) 0,5 2012-03-31 0,2 2012-02-29
OECD Composite Leading Indicator 104,9 2011-02-28 104,2 2011-01-31
Consumer confidence 40,1 2012-03-31 39,1 2012-02-29
CHINAIndustrial production (%, YoY) 11,9 2012-03-31 12,8 2011-12-31 2012-05-11
Manufacturing PMI 53,3 2012-04-30 53,1 2012-03-31 2012-06-01
Real GDP (%, YoY) 8,1 2012-03-31 8,9 2011-12-31 2012-07-13
CPI (%, YoY) 3,6 2012-03-31 3,2 2012-02-29 2012-05-11
OECD Composite Leading Indicator 102,3 2011-03-31 102,1 2011-02-28
Consumer confidence 100,0 2012-03-31 105,0 2012-02-29
Bank lending (%, YoY) 15,7 2012-03-31 15,2 2012-02-29
Fixed asset investment (%, YoY) 20,9 2012-03-31 23,8 2011-12-31
OTHER
OECD Area Comp. Leading Indicator 103,2 2011-03-31 103,0 2011-02-28
Global manufacturing PMI 51,4 2012-04-30 51,1 2012-03-31
Sources: Bloomberg, SEB Commodity Research

8/2/2019 SEB report: Commodity prices remain under pressure
http://slidepdf.com/reader/full/seb-report-commodity-prices-remain-under-pressure 18/20
18
Commodities Monthly
PerformanceClosing
last weekYTD(%)
1 m(%)
1 q(%)
1 y(%)
5 y(%)
UBS Bloomberg CMCI Index (TR) 1279,56 0,9 -13,3 -4,4 -12,0 11,7
UBS Bloomberg CMCI Index (ER) 1203,22 0,9 -13,3 -4,4 -12,0 6,7
UBS Bloomberg CMCI Index (PI) 1539,12 1,2 -12,4 -4,3 -10,9 35,8
UBS B. CMCI Energy Index (PI) 1498,49 0,4 -12,1 -2,3 -13,1 28,2
UBS B. CMCI Industrial Metals Index (PI) 1100,10 5,3 -16,7 -7,0 -15,9 -14,6
UBS B. CMCI Precious Metals Index (PI) 2437,13 5,4 9,3 -6,3 3,5 129,5
UBS B. CMCI Agriculture Index (PI) 1707,87 -2,2 -15,3 -3,8 -10,2 73,4
Baltic Dry Index 1157,00 -35,5 -22,8 78,8 -11,1 -81,7
Crude Oil (NYMEX, WTI, $/b) 98,49 -0,3 -9,2 0,7 -9,8 59,0
Crude Oil (ICE, Brent, $/b) 113,18 5,4 -6,5 -1,2 -6,6 73,3
Aluminum (LME, $/t) 2066,50 2,3 -21,5 -8,0 -24,9 -28,5
Copper (LME, $/t) 8175,00 7,6 -12,4 -4,6 -10,4 -1,7
Nickel (LME, $/t) 17575,00 -6,1 -31,1 -17,5 -31,9 -65,9
Zinc (LME, $/t) 1995,00 8,1 -17,5 -7,4 -8,9 -52,2
Steel (LME, Mediterranean, $/t) 490,00 -7,5 -9,7 -4,9 -13,3 N/A!
Gold (COMEX, $/ozt) 1645,20 5,0 14,9 -5,3 8,6 138,5
Corn (CBOT, ¢/bu) 662,25 2,4 -12,9 2,8 -8,8 73,7
Wheat (CBOT, ¢/bu) 603,75 -7,5 -23,6 -8,6 -18,5 25,3
Soybeans (CBOT, ¢/bu) 1475,00 23,1 6,6 19,7 9,2 101,1Sources: Bloomberg, SEB Commodity Research
Major upcoming commodity eventsDate Source
Department of Energy, US inventory data Wednesdays, 16:30 CET www.eia.doe.gov
American Petroleum Institute, US inventory data Tuesdays, 22:30 CET www.api.org
CFTC, Commitment of Traders Fridays, 21:30 CET www.cftc.gov
US Department of Agriculture, Crop Progress Mondays, 22.00 CET (season) www.usda.gov
International Energy Agency, Oil Market Report May 11 www.oilmarketreport.com
OPEC, Oil Market Report May 10 www.opec.org
Department of Energy, Short Term Energy Outlook May 8 www.eia.doe.gov
US Department of Agriculture, WASDE May 10 www.usda.gov
International Grains Council, Grain Market Report May 24 www.igc.org.uk
OPEC ordinary meeting, Vienna, Austria June 14 www.opec.orgSources: Bloomberg, SEB Commodity Research
Contact listCOMMODITIES Position E-mail Phone MobileTorbjörn Iwarson Global Head of
[email protected] +46 8 506 234 01
RESEARCH
Bjarne Schieldrop Chief analyst [email protected] +47 22 82 72 53 +47 92 48 92 30
Filip Petersson Strategist [email protected] +46 8 506 230 47 +46 70 996 08 84
SALES SWEDEN
Pär Melander Corporate [email protected] +46 8 506 234 75 +46 70 714 90 79Karin Almgren Institutional [email protected] +46 8 506 230 51 +46 73 642 31 76
SALES NORWAY
Maximilian Brodin Corporate/Institutional [email protected] +47 22 82 72 73 +47 92 45 67 27
SALES FINLAND
Jussi Lepistö Corporate/Institutional [email protected] +358 9 616 285 21 +358 40 844 187 7
SALES DENMARK
Peter Lauridsen Corporate/Institutional [email protected] +45 331 777 34 +45 616 211 59
TRADING
Niclas Egmar Corporate/Institutional [email protected] +46 8 506 234 55 +46 70-618 560 4

8/2/2019 SEB report: Commodity prices remain under pressure
http://slidepdf.com/reader/full/seb-report-commodity-prices-remain-under-pressure 19/20
19
Commodities Monthly
DISCLAIMER & CONFIDENTIALITY NOTICE
The information in this document has been compiled by SEB Merchant Banking, a division within Skandinaviska EnskildaBanken AB (publ) (“SEB”).
Opinions contained in this report represent the bank’s present opinion only and are subject to change without notice. All
information contained in this report has been compiled in good faith from sources believed to be reliable. However, norepresentation or warranty, expressed or implied, is made with respect to the completeness or accuracy of its contents andthe information is not to be relied upon as authoritative. Anyone considering taking actions based upon the content of thisdocument is urged to base his or her investment decisions upon such investigations as he or she deems necessary. Thisdocument is being provided as information only, and no specific actions are being solicited as a result of it; to the extentpermitted by law, no liability whatsoever is accepted for any direct or consequential loss arising from use of this documentor its contents.
SEB is a public company incorporated in Stockholm, Sweden, with limited liability. It is a participant at major Nordic andother European Regulated Markets and Multilateral Trading Facilities (as well as some non-European equivalent markets)for trading in financial instruments, such as markets operated by NASDAQ OMX, NYSE Euronext, London Stock Exchange,Deutsche Börse, Swiss Exchanges, Turquoise and Chi-X. SEB is authorized and regulated by Finansinspektionen in Sweden;
it is authorized and subject to limited regulation by the Financial Services Authority for the conduct of designatedinvestment business in the UK, and is subject to the provisions of relevant regulators in all other jurisdictions where SEBconducts operations.
SEB Merchant Banking. All rights reserved.
SEB Commodity Research
Bjarne Schieldrop, Chief Commodity [email protected]
+47 9248 9230
Filip Petersson, Commodity [email protected]
+46 8 506 230 47

8/2/2019 SEB report: Commodity prices remain under pressure
http://slidepdf.com/reader/full/seb-report-commodity-prices-remain-under-pressure 20/20
www.seb.se