Seattle, WA– May 21-23, 2012 A Re-Evaluation of the ... · Economics of the MBR Process ... MBR...
13
2/ 2 3/ 2015 1 AMTA Technology Transfer Workshop “MBR/MF/UF Membrane Treatment in the Pacific Northwest” in cooperation with WEF Seattle, WA – May 21-23, 2012 AMTA Workshop America’ s Authority in Membrane Technology 1 A Re-Evaluation of the Economics of the MBR Process – Has a Tipping Point Been Reached? Randal Samstag, Sudhan Paranjape and Roderick D. Reardon Carollo Engineers AMTA Workshop America’ s Authority in Membrane Technology 2 Technology Overview AMTA Workshop America’ s Authority in Membrane Technology 3 Traditional Versus Membrane Bioreactor (MBR) Wastewater Treatment MEMBRANE BIOREACTOR Permeate Pump Raw Sewage Air Scour WAS Process Air MLSS Recycle Aeration Membrane Tank Secondary Clarifier Aeration Return Activated Sludge Tertiary Granular Media or Cloth Filter Waste Activated Sludge (WAS) TRADITIONAL Process Air AMTA Workshop America’ s Authority in Membrane Technology 4 Key Elements of an MBR Useofmembrane filtrationtoseparate biomass from effl u ent H igherMLS S concentrations inaerationbasins H ighsoli ds recycle rate from membrane tanktoaeration basin Membranes continuously/intermittentlyscoured withair Biologi c alelem ent s remain essentiallythe same
-
Upload
nguyenkhuong -
Category
Documents
-
view
216 -
download
0
Transcript of Seattle, WA– May 21-23, 2012 A Re-Evaluation of the ... · Economics of the MBR Process ... MBR...

2/23/20 15
1
July 2007
AMTA Technology Transfer Workshop“MBR/MF/UF Membrane Treatment in the Pacific Northwest”
in cooperation with WEF
Seattle, WA – May 21-23, 2012
AMTA Workshop
America’s Authority in Membrane Technology 1
A Re-Evaluation of theEconomics of the MBR Process –
Has a Tipping Point Been Reached?Randal Samstag, Sudhan Paranjape and
Roderick D. ReardonCarollo Engineers
AMTA Workshop
America’s Authority in Membrane Technology 2
Technology Overview
AMTA Workshop
America’s Authority in Membrane Technology 3
Traditional Versus Membrane Bioreactor (MBR)Wastewater Treatment
MEMBRANEBIOREACTOR
PermeatePumpRaw Sewage
Air Scour
WAS
Process Air
MLSS Recycle
Aeration Membrane Tank
SecondaryClarifierAeration
ReturnActivated Sludge
Tertiary GranularMedia or Cloth
Filter
Waste ActivatedSludge (WAS)
TRADITIONAL
Process Air
AMTA Workshop
America’s Authority in Membrane Technology 4
Key Elements of an MBR
Us e ofmembrane filtration to s eparate biomas s fromefflu ent
H igherM L S S c onc entrations in aeration bas ins
H ighs olid s rec yc le rate from membrane tankto aerationbas in
M embranes c ontinu ou s ly /intermittently s c ou red with air
B iologic alelements remain es s entially the s ame
2/23/20 15
2
AMTA Workshop
America’s Authority in Membrane Technology 5
Use of MBR Introduces Several New Components
Fine s c reens (1–3 mm)
M embranes and membrane tanks (forimmers edmembranes )
M embrane feed pu mps (forpu mped s ys tems )
A irs c ou rblowers
Filtrate/bac kpu ls e pu mps orfiltrate flow c ontrolvalve
C hemic alc lean-in-plac e (C IP )s ys tem
AMTA Workshop
America’s Authority in Membrane Technology 6
MBR Introduces Several New Components
MechanicalFine Screens
Membrane Tanks
Waste Sludge
PermeatePumps
Scour Air Blowers
HypochloriteCitric Acid
Screenings
Activated SludgeProcess
Mixed Liquor Recirculation
(by gravity)
MembraneFeedPump
GritRemoval
Influent
MechanicalCoarse Screens
Screenings
PrimaryClarifier
(Optional)
Waste Sludge
AMTA Workshop
America’s Authority in Membrane Technology 7
Process Considerations
AMTA Workshop
America’s Authority in Membrane Technology 8
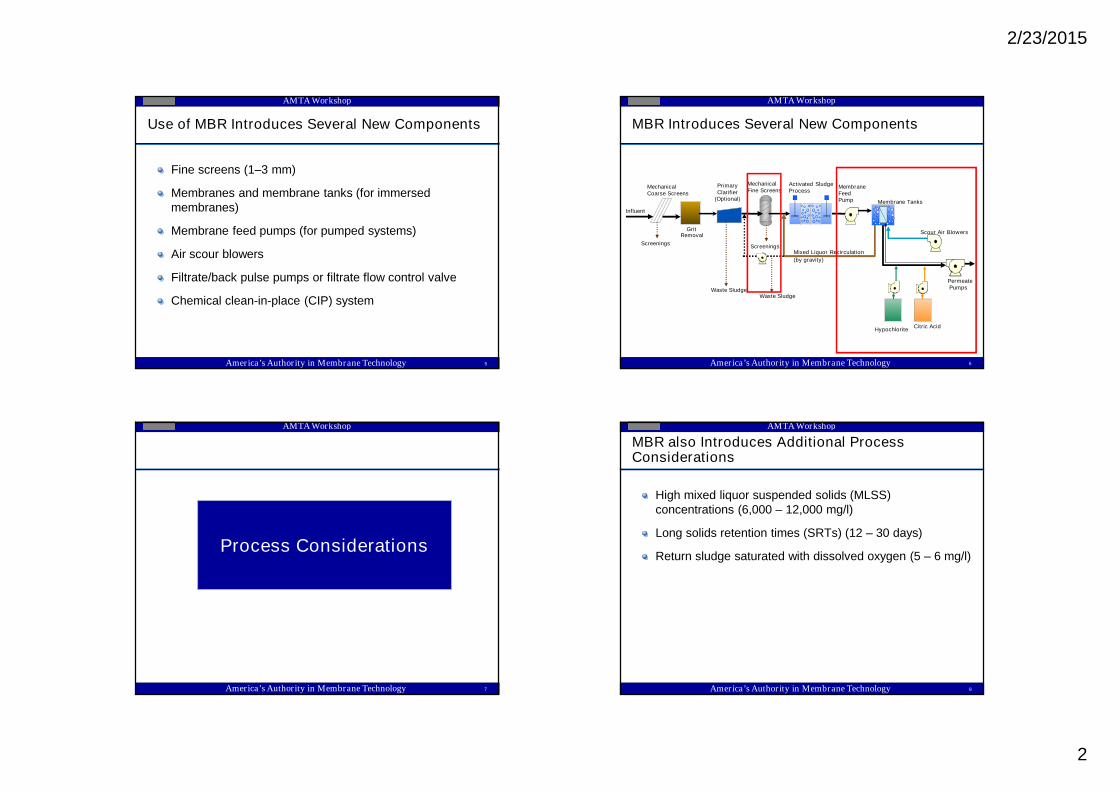
MBR also Introduces Additional ProcessConsiderations
H ighmixed liqu ors u s pend ed s olid s (M L S S )c onc entrations (6, 0 0 0 –12 , 0 0 0 mg/l)
L ongs olid s retention times (S RTs )(12 –30 d ays )
Retu rn s lu d ge s atu rated with d is s olved oxygen (5 –6 mg/l)

2/23/20 15
3
AMTA Workshop
America’s Authority in Membrane Technology 9
Effects of High MLSS Concentrations
H igherM L S S res u lts in
Greatervis c os ity, whic h means
L owerflu x, whic h means
Greatermembrane area req u ired
L oweralpha, whic h means
H igherenergy c ons u mption
AMTA Workshop
America’s Authority in Membrane Technology 10
Effects of High MLSS Concentrations
Effec tofM L S S on oxygen trans fer-A 10% variation inalpha results in an almost equal variation in the powerconsumption of the aeration system
AMTA Workshop
America’s Authority in Membrane Technology 11
Effects of High MLSS Concentrations
Effec tofM L S S on M embrane Flu x
0 . 0 0
0 . 1 0
0 . 2 0
0 . 30
0 . 40
0 . 50
0 . 60
0 . 7 0
0 . 8 0
0 . 90
1 . 0 0
0 2 0 0 0 40 0 0 60 0 0 8 0 0 0 1 0 0 0 0 120 0 0 140 0 0 160 0 0 1 8 0 0 0 2 0 0 0 0
MLSS (mg/L)
Perm
eab
ilit
yat
20o
C(J
/Jo
)
Courtesy of US Filter
AMTA Workshop
America’s Authority in Membrane Technology 12
Effects of High MLSS Concentrations
Effec tofM L S S on Footprint
0
1 0 , 0 0 0
2 0 , 0 0 0
30 , 0 0 0
40 , 0 0 0
50 , 0 0 0
60 , 0 0 0
7 0 , 0 0 0
MBR (3,000 mg/L) MBR (6,000 mg/L) MBR (9,000 mg/L) MBR (12,000 mg/L)
Pro
cess
Fo
otp
rin
t(s
f)

2/23/20 15
4
AMTA Workshop
America’s Authority in Membrane Technology 13
Effects of High MLSS Concentrations
Effec tofM L S S on O verallC os t
$0
$5
$10
$15
$20
$25
MBR (3,000 mg/L) MBR (6,000 mg/L) MBR (9,000 mg/L) MBR (12,000 mg/L)
Co
st
($/g
al)
MBR Cost as a Function of MLSS Concentration
C apital O peration and M aintenanc e
AMTA Workshop
America’s Authority in Membrane Technology 14
Effects of High MLSS Concentrations
Effec tofM L S S on Energy C ons u mption
3, 40 0 , 0 0 0
3, 50 0 , 0 0 0
3, 60 0 , 0 0 0
3, 7 0 0 , 0 0 0
3, 8 0 0 , 0 0 0
3, 90 0 , 0 0 0
4, 0 0 0 , 0 0 0
4, 1 0 0 , 0 0 0
4, 2 0 0 , 0 0 0
4, 30 0 , 0 0 0
4, 40 0 , 0 0 0
MBR (3,000 mg/L) MBR (6,000 mg/L) MBR (9,000 mg/L) MBR (12,000 mg/L)To
tal
En
erg
yC
on
su
mp
tio
n(k
Wh
/year)
MBR Energy Consumption as a Function of MLSSConcentration
TotalEnergy C ons u mption, kW h/year
O ptimu m arou nd 6, 0 0 0 mg/l
AMTA Workshop
America’s Authority in Membrane Technology 15
Long Solids Retention Times (SRTs)
C an provid e nearc omplete nitrific ation (N H 3 <0 . 5 mg/l)
C an provid e betterremovalofD O N
N u merou s s tu d ies ind ic ate, longerS RTs provid e bettertreatment/removalofmajorC EC s
O ffers betterfilterability ofs olid s
AMTA Workshop
America’s Authority in Membrane Technology 16
Return Sludge Saturated with Dissolved Oxygen
RA S retu rned to anaerobic zone c an interfere with B ioPremoval
RA S retu rned to anoxic zone c an interfere withd enitrific ation
RA S retu rned to aeration tankc an offs etoxygen d emand
C an be c ompens ated by an ad d itionalinternalrec yc les ys tem orby RA S d e-aeration

2/23/20 15
5
AMTA Workshop
America’s Authority in Membrane Technology 1 7
MBR Design Elements
AMTA Workshop
America’s Authority in Membrane Technology 1 8
Design Elements with Significant Effect on MBREconomics
P reliminary and primary treatment
Fac ility peakflow fac tors
M embrane s elec tion
B N R proc es s c onfigu ration
A eration s ys tem d es ign
P roc es s airc ontrols trategy
M embrane s c ou rair
AMTA Workshop
America’s Authority in Membrane Technology
Impact of Preliminary and Primary Treatment
Fine s c reens (~ 2 mm orles s )
A d d itionaleq u ipment(inc reas es c apitaland O & M c os t)
Removes fine partic u lates inc lu d ing hairand fibrou s material
P rimary C larifiers
Red u c es TS S and B O D load on d owns tream proc es s
Red u c es d owns tream proc es s tanks izes and aeration d emand
O ffers more protec tion by ad d itionalremovalofgritand rags
19
AMTA Workshop
America’s Authority in Membrane Technology 20
Effect of Preliminary and Primary Treatment
aB as ed on typic alperformanc e ofprimaryc larifiers : 30 % B O D 5 and 7 . 5% TKN removal.b P lantflow =4. 5 mgd ; M ax. M onth load ings -B O D (11 , 8 0 0 lb/d M M ); TS S (19, 40 0 lb/d M M ); TKN (1 , 67 0 lb/d )c M L S S c onc entration =8 , 0 0 0 mg/L , A erobic S RT =12 d ays .d A lpha =0 . 50 ; s patiald is s olved oxygen (D O )c onc entration =2 . 0 mg/L ; A O R/S O R =0 . 38 .eB lowereffic ienc y =7 0 % , blowers u c tion/d is c harge pres s u re =14. 4 ps ia/22 . 8 ps ia.
ParameterWithoutPrimaryClarifiers
WithPrimaryClarifiersa
Savings with PrimaryClarifiers
Total AOR (lb/d)b 15,789 12,27822% less process oxygen
demand
Bioreactor volume(ft3)c 166,043 126,337
24% less process reactorvolume
Airflow raterequired (scfm)d 6,151 4,784
22% less process airflowrate
Aeration blowerpower (HP)e 289 224
Annual powerconsumption (kWh)
1,886,000 1,466,00022% less process energy
consumption

2/23/20 15
6
AMTA Workshop
America’s Authority in Membrane Technology 21
Effect of Peak Flow Factors
Invers ely affec ts c os tofmembranes
P eakins tantaneou s flu x –2 7 gallons /d ay/ft2 (fortypic alhollow-fibers u bmerged M B R)
37 , 0 37 ft2 ofad d itionalmembrane area req u ired permgd (or2ad d itionalc as s ettes )with c hange in peakins tantaneou s flow fac torof2 . 0 to 3. 0
C ond u c td etailfac ility flow s tu d y to d etermine peakfac torsinc lu d ing I/Is tu d y ifreq u ired
AMTA Workshop
America’s Authority in Membrane Technology 22
Effect of Process Configuration
P u mped to M B R s ys temsPermeate
Pump “1Q”Screened and DegrittedRaw Sewage
Air Scour
WAS
Process Air
MLSS Recycle (By Gravity)“4Q”
“5Q”
Pumped to
PermeatePump “1Q”Screened and Degritted
Raw Sewage
Air Scour
WAS
Process Air
MLSS Recycle“4Q”
“5Q”
Gravity
P u mped from M B R s ys tems
No directControl of RAS
Rate
Reducespumping by 1Q
AMTA Workshop
America’s Authority in Membrane Technology 23
Process Air Control Strategy
A eration energy req u irements forthe fac ility werec ompared forins tantaneou s D O c ontrolvers u s manu allyad ju s ting airflow onc e every 8 -hou rs hift
Energy Spent with Aeration Control Scheme
0
2 0
40
60
8 0
10 0
12 0
140
160
1 8 0
0 1 2 3 4 5 6 7 8 9 10 1 1 1 2 1 3 1 4 1 5 1 6 1 7 1 8 1 9 2 0 2 1 2 2 23
Hour
Diu
rna
lA
era
tio
np
ow
er
(bH
P)
B rakehors powerforins tantaneou s D . O . c ontrol
B rakehors epowerwith m anu alD . O . c ontrol(onc e pers hift)
AMTA Workshop
America’s Authority in Membrane Technology 24
Membrane Scour Air Control Strategy
M os tc ommerc ials ys tems u s e eitherc ontinu ou s orintermittentairs c ou r
Intermittentairs c ou rwillres u ltin energy s avings
Res earc h has s hown thatd evelopmentof“thin”c akelayeron the s u rfac e ofthe membranes protec ts themembranes from s olu ble mic robialprod u c ts and helpsmaintain membrane permeability
The formation ofthis c ake layeris a d irec tfu nc tion oftheintens ity ofthe airs c ou rapplied and als o d epend s on theM L S S c onc entration
W ithlowerairs c ou rintens ity, the c hanc es offorminga“thic k”c ake layerwith highertrans -membrane pres s u re(TM P )are greater

2/23/20 15
7
AMTA Workshop
America’s Authority in Membrane Technology 25
Example Project –
Comparison of Technologies
AMTA Workshop
America’s Authority in Membrane Technology
Example Project - Process Alternatives Evaluation
Review variou s c onventionaland M B R proc es salternatives
C omparis on ofthe alternatives
P roc es s parameters
P lanning levelc ons tru c tion c os tes timates
P lanning leveloperating c os tes timates
P lanning levelnetpres entworth c os tes timates
26
AMTA Workshop
America’s Authority in Membrane Technology
Example Project - Process Alternatives Evaluation
N on-ec onomic fac tors
W aterq u ality
Footprint
Energy c ons u mption
C hemic alc ons u mption
B ios olid s prod u c tion
2 7
AMTA Workshop
America’s Authority in Membrane Technology
Example Project - Process Alternatives EvaluationCriteria for Selecting Process Alternatives
The following c riteria were u s ed to evalu ate the five proc es salternatives
Fac ility s ize –5 mgd annu alaverage d ay flow (aad f)
Fac ility d es igned to prod u c e an efflu entthatmeets the waterqu alityreq u irements forP u blic A c c es s Reu s e (P A R)and Florid a A W T
Florid a A W T d efined as efflu entmeetingthe “5: 5: 3: 1”s tand ard
5 mg/L ofc arbonac eou s bioc hemic aloxygen d emand (c B O D 5),
5 mg/L totals u s pend ed s olid s (TS S ),
3 mg/L totalnitrogen (TN ), and
1 mg/L totalphos phoru s (TP ), res pec tively), highleveld is infec tion and filtration
P rojec td id notinc lu d e primary c larifiers
2 8

2/23/20 15
8
AMTA Workshop
America’s Authority in Membrane Technology
Example Project - Process Alternatives Evaluation
P roc es s A lternatives
A lt. 1 -Five-s tage B N R (B 5)proc es s , d is kfilters (D F)
A lt. 2 –B 5 proc es s , low-pres s u re tertiary membranes (TM F)
A lt. 3 -S tep-feed B N R proc es s , pos tanoxic zones , D F
A lt. 4 -Three-s tage proc es s , d enitrific ation filters (D N F)
A lt. 5 –B 5 proc es s , hollow-fibers u bmerged M B R
29
AMTA Workshop
America’s Authority in Membrane Technology 30
Example Project - Process Alternatives EvaluationAlt. 1 - Five-Stage BNR (B5) Process, Disk Filters (DF)
InfluentWastewater
(Q)
CoarseScreens Grit Removal
IR (1-4Q)
FirstAnoxic
Anaerobic Aerobic SecondAnoxic
Blowers
ToDisposal
Plant Recycle
Plant Recycle StreamPump Station
RAS (0.15 – 1.25Q)
Reaeration
Methanol(Optional)
Alum(Optional) Secondary
ClarifierDisk
Filters
Alum(Optional)
SodiumHypochlorite
ChlorineContact
FilterBackwash
WAS
WASHolding
Blowers
Haul Biosolids Off-sitefor Disposal or Further
Processing
Filtrate
Screw Press
Reject WaterStorage Tank
Reclaimed WaterStorage
Reclaimed WaterPump Station
Q
To RapidInfiltration
Basins,Site 6
To PublicAccess
Reuse/RapidInfiltration
Basins
LEGEND
Liquid StreamSolid Stream
Blower
Air
Chemical
Pump
AMTA Workshop
America’s Authority in Membrane Technology 31
Example Project - Process Alternatives EvaluationAlt. 2 – B5 Process, Low-Pressure Tertiary Membranes (TMF)
InfluentWastewater
(Q)
CoarseScreens Grit Removal
IR (1-4Q)
FirstAnoxic
Anaerobic Aerobic SecondAnoxic
Blowers
ToDisposal
Plant Recycle
Plant Recycle StreamPump Station
RAS (0.15 – 1.25Q)
Reaeration
Methanol(Optional)
Alum(Optional) Secondary
Clarifier
Alum(Optional) Sodium
Hypochlorite
ChlorineContact
WASHolding
Blowers
Haul Biosolids Off-sitefor Disposal or Further
Processing
Filtrate
Screw Press
Reject WaterStorage Tank
Reclaimed WaterStorage
Reclaimed WaterPump Station
Q
To RapidInfiltration
Basins,Site 6
To PublicAccess
Reuse/RapidInfiltration
Basins
LEGEND
Liquid StreamSolid Stream
Blower
Air
Chemical
Pump
Clean-in-PlaceSystem
ScourBlowers
Backwash
WAS
Permeate/Backpulse
Pump
Sodium HypochloriteCitric Acid
(For Chemical Cleaning)
AMTA Workshop
America’s Authority in Membrane Technology 32
Example Project - Process Alternatives EvaluationAlt. 3 - Step-Feed BNR Process, Post Anoxic Zones, DF
InfluentWastewater
(Q)
CoarseScreens Grit Removal
SecondAnoxic
ToDisposal
Plant Recycle
Plant Recycle StreamPump Station
RAS (0.15 – 1.25Q)
Reaeration
Methanol(Optional) Alum
(Optional)Secondary
Clarifier DiskFilters
Alum(Optional) Sodium
Hypochlorite
ChlorineContact
FilterBackwash
WASHolding
Blowers
Haul Biosolids Off-sitefor Disposal or Further
Processing
Filtrate
Screw Press
Reject WaterStorage Tank
Reclaimed WaterStorage
Reclaimed WaterPump Station
To RapidInfiltration
Basins,Site 6
To PublicAccess
Reuse/RapidInfiltration
Basins
LEGEND
Liquid StreamSolid Stream
Blower
Air
Chemical
Pump
Aerobic
WAS
AerobicAerobic
Anoxic Anoxic Anoxic
RASReaeration
Zone
Q

2/23/20 15
9
AMTA Workshop
America’s Authority in Membrane Technology
InfluentWastewater
(Q)
CoarseScreens Grit Removal
IR (1-4Q)
FirstAnoxic
Aerobic
Blowers
ToDisposal
Plant Recycle
Plant Recycle StreamPump Station
RAS (0.15 – 1.25Q)
Alum(Optional)
SecondaryClarifier
SodiumHypochlorite
ChlorineContact
WAS
WASHolding
Blowers
Haul Biosolids Off-sitefor Disposal or Further
Processing
Filtrate
Screw Press
Reject WaterStorage Tank
Reclaimed WaterStorage
Reclaimed WaterPump Station
Q
To RapidInfiltration
Basins,Site 6
To PublicAccess
Reuse/RapidInfiltration
Basins
LEGEND
Liquid StreamSolid Stream
Blower
Air
Chemical
Pump
Alum(Optional) Methanol
Blowers
BackwashPump
FilterBackwash
Deep-BedFilters
RASConditioning
(Anoxic)
Anaerobic
33
Example Project - Process Alternatives EvaluationAlt. 4 - Three-Stage Process, Denitrification Filters (DNF)
AMTA Workshop
America’s Authority in Membrane Technology 34
Example Project - Process Alternatives EvaluationAlt. 5 – B5 Process, Hollow-Fiber Submerged MBR
InfluentWastewater
(Q)
CoarseScreens
GritRemoval
IR (1-4Q)
FirstAnoxic
Anaerobic Aerobic SecondAnoxic
Blowers
ToDisposal
Plant Recycle
Plant Recycle StreamPump Station
Methanol(Optional)
Alum(Optional)
WAS
WASHolding
Blowers
Haul Biosolids Off-sitefor Disposal or Further
Processing
Filtrate
Screw Press
Reject WaterStorage Tank
ReclaimedWater Storage
Reclaimed WaterPump Station
To RapidInfiltration
Basins,Site 6
To Public AccessReuse/Rapid
Infiltration Basins
LEGEND
Liquid StreamSolid Stream
Blower
Air
Chemical
Pump
FineScreens
IR (1Q)
RAS (1-4Q)
MembraneTank
ScourBlowers
ChlorineContact
SodiumHypochlorite
SodiumHypochloriteCitric Acid
(For ChemicalCleaning)
Q
AMTA Workshop
America’s Authority in Membrane Technology 35
Example Project - Process Alternatives EvaluationProcess Parameters – Reactor Tank Volume
Parameter
Alternative
No. 1
Alternative
No. 2
Alternative
No. 3
Alternative
No. 4
Alternative
No. 5
B 5 proc es s with
D F
B 5 proc es s with
TM F
S tep-feed B N R
proc es s withD F
Three-s tage
B N R proc es s
W /D N F
B 5/P revGen
M B R P roc es s
Tank Volumes (All volumes in million gallons)
RA S
c ond itioning- - 0 . 14 0 . 19 -
A naerobic tank 0 . 2 7 0 . 2 7 - 0 . 2 7 0 . 2 7
P re-anoxic tank 1 . 36 1 . 36 0 . 98 0 . 58 0 . 66
A erobic tank 2 . 92 2 . 92 2 . 41 3. 1 8 1 . 25
P os t-anoxic
tank0 . 8 6 0 . 8 6 1 . 0 - 0 . 21
Re-aeration
tank0 . 14 0 . 14 0 . 14 - -
M B R tank - - - - 0 . 21
Total process
tank volume5.55 5.55 4.67 4.22 2.60
AMTA Workshop
America’s Authority in Membrane Technology 36
Economic Comparison

2/23/20 15
10
AMTA Workshop
America’s Authority in Membrane Technology 37
Example Project - Process Alternatives EvaluationNet Present Worth (NPW) costs
Parameter
Alternative
No. 1
Alternative
No. 2
Alternative
No. 3
Alternative
No. 4
Alternative
No. 5
B 5 proc es s with
D F
B 5 proc es s with
TM F
S tep-feed B N R
proc es s with
D F
Three-s tage B N R
proc es s W /D N F
B 5/P revGen
M B R P roc es s
Totalc apitalc os ts $7 1 , 40 0 , 0 0 0 $8 1 , 40 0 , 0 0 0 $66, 0 0 0 , 0 0 0 $7 1 , 0 0 0 , 0 0 0 $7 2 , 60 0 , 0 0 0
A nnu alO & M c os ts $1 , 510 , 0 0 0 $1 , 690 , 0 0 0 $1 , 460 , 0 0 0 $1 , 620 , 0 0 0 $1 , 8 40 , 0 0 0
Eq u ipment
replac ementc os ts$9, 7 0 0 , 0 0 0 $12 , 60 0 , 0 0 0 $8 , 50 0 , 0 0 0 $9, 7 0 0 , 0 0 0 $13, 60 0 , 0 0 0
Filtermed ia/
membrane
replac ementc os ts
$20 0 , 0 0 0 $1 , 2 0 0 , 0 0 0 $20 0 , 0 0 0 - $1 , 60 0 , 0 0 0
Total NPW costs $102,000,000 $118,400,000 $94,800,000 $103,000,000 $113,000,000
Delta Δ $7,200,000 $23,600,000 - $8,200,000 $18,200,000
Delta % 7.5% 25% - 8.6% 19%
AMTA Workshop
America’s Authority in Membrane Technology 38
Non – Economic Comparison
AMTA Workshop
America’s Authority in Membrane Technology 39
Example Project - Process Alternatives EvaluationEffluent Water Quality
Parameter
Alternative
No. 1
Alternative
No. 2
Alternative
No. 3
Alternative
No. 4
Alternative
No. 5
B 5 proc es s with
D F
B 5 proc es s
withTM F
S tep-feed B N R
proc es s withD F
Three-s tage B N R
proc es s W /D N F
B 5/P revGen
M B R P roc es s
Efflu entTS S , mg/l <5 <2 <5 <5 <2
Efflu enttu rbid ity,
N TU<2 <0 . 2 <2 <2 <0 . 2
M inimu m s ize
partic les removed
(µm)
1 -10 <0 . 1 1 –10 1 –10 <0 . 1
L og removalfec al
c oliform3. 0 3 –9 3. 0 2 . 5 3 -9
L og removal
protozoan c ys ts0 . 4 –0 . 5 6 -9 0 . 4 –0 . 5 0 . 4 –1 . 5 6 -9
L og removalviru s 0 –0 . 6 0 . 5 –4. 0 0 –0 . 6 0 –1 . 3 0 . 5 –4. 0
Efflu entTS S , mg/l <5 <2 <5 <5 <2
TN , mg/l ≤ 3 ≤ 3 ≤ 3 ≤ 3 ≤ 3
TP , mg/l ≤ 1 ≤ 1 ≤ 1 ≤ 1 ≤ 1
AMTA Workshop
America’s Authority in Membrane Technology 40
Example Project - Process Alternatives EvaluationFacility Footprint
Parameter
Alternative
No. 1
Alternative
No. 2
Alternative
No. 3
Alternative
No. 4
Alternative
No. 5
B 5 proc es s
withD F
B 5 proc es s
withTM F
S tep-feed B N R
proc es s with
D F
Three-s tage
B N R proc es s
W /D N F
B 5/P revGen
M B R P roc es s
A c tivated S lu d ge
Treatmentproc es s , s f7 5, 0 0 0 7 5, 0 0 0 69, 7 0 0 65, 7 0 0 19, 8 0 0
Filtration proc es s , s f 1 , 90 0 2 , 7 0 0 1 , 90 0 6, 40 0 -
TotalFootprint, s f 7 6, 90 0 7 7 , 7 0 0 7 1 , 60 0 7 2 , 1 0 0 19, 8 0 0

2/23/20 15
11
AMTA Workshop
America’s Authority in Membrane Technology 41
Example Project - Process Alternatives EvaluationEnergy Consumption
Parameter
Alternative
No. 1
Alternative
No. 2
Alternative
No. 3
Alternative
No. 4
Alternative
No. 5
B 5 proc es s
withD F
B 5 proc es s
withTM F
S tep-feed B N R
proc es s withD F
Three-s tage
B N R proc es s
W /D N F
B 5/P revGen
M B R P roc es s
A nnu alEnergy
C ons u mption, kW h6, 450 , 0 0 0 6, 620 , 0 0 0 6, 50 0 , 0 0 0 6, 490 , 0 0 0 7 , 590 , 0 0 0
S pec ific Energy
C ons u mption,
kW h/kgal
2 . 9 3. 0 3. 0 3. 0 3. 5
AMTA Workshop
America’s Authority in Membrane Technology 42
Example Project - Process Alternatives EvaluationChemical Consumption
Parameter
Alternative
No. 1
Alternative
No. 2
Alternative
No. 3
Alternative
No. 4
Alternative
No. 5
B 5 proc es s
withD F
B 5 proc es s
withTM F
S tep-feed B N R
proc es s withD F
Three-s tage
B N R proc es s
W /D N F
B 5/M B R
P roc es s
A lu m (gallons ) N one N one N one N one N one
S od iu m
H ypoc hlorite
(gallons )
153, 0 0 0 154, 0 0 0 153, 0 0 0 153, 0 0 0 157 , 0 0 0
M ethanol(gallons ) N one N one N one 62 , 0 0 0 N one
P olymer(lb) 43, 0 0 0 43, 0 0 0 43, 0 0 0 43, 0 0 0 43, 0 0 0
C itric A c id (gallons ) N one 1 , 50 0 N one N one 3, 30 0
AMTA Workshop
America’s Authority in Membrane Technology 43
Example Project - Process Alternatives EvaluationBiosolids Production
Parameter
Alternative
No. 1
Alternative
No. 2
Alternative
No. 3
Alternative
No. 4
Alternative
No. 5
B 5 proc es s
withD F
B 5 proc es s
withTM F
S tep-feed B N R
proc es s withD F
Three-s tage
B N R proc es s
W /D F
B 5/M B R
P roc es s
M onthly B ios olid s ,
tons1 7 7 1 7 7 1 8 3 1 8 9 1 8 0
AMTA Workshop
America’s Authority in Membrane Technology 44
New Generation MBR Design
- Has the Tipping Point being
Reached for MBR Economics?

2/23/20 15
12
AMTA Workshop
America’s Authority in Membrane Technology
New Generation Hollow-Fiber Submerged MBR
S alientfeatu res –c omparis on with previou s generationM B R d es ign
15% inc reas ed prod u c tivity
Inc reas e in peakflu x from 2 7 gfd to 31 gfd
Inc reas ed membrane s u rfac e area perc as s ette
10 % s mallerfootprint
15% more energy effic ient
L es s c hemic alc leaning req u ired
45
AMTA Workshop
America’s Authority in Membrane Technology 46
Example Project - MBR NPW CostsNew Generation Membranes
Parameter
Alternative
No. 3
Alternative
No. 5
Alternative
No. 6
S tep-feed B N R
proc es s withD F
B 5/P revGen
M B R P roc es s
B 5/N ewGen M B R
P roc es s
Totalc apitalc os ts $66, 0 0 0 , 0 0 0 $7 2 , 60 0 , 0 0 0 $7 0 , 1 26, 0 0 0
A nnu alO & M c os ts $1 , 460 , 0 0 0 $1 , 8 40 , 0 0 0 $1 , 7 8 0 , 0 0 0
Eq u ipment
replac ementc os ts$8 , 50 0 , 0 0 0 $13, 60 0 , 0 0 0 $12 , 8 0 0 , 0 0 0
Filtermed ia/membrane
replac ementc os ts$20 0 , 0 0 0 $1 , 60 0 , 0 0 0 $1 , 50 0 , 0 0 0
Total NPW costs $94,800,000 $113,000,000 $108,800,000
Delta Δ - $18,200,000 $14,000,000
Delta % - 19% 15%
AMTA Workshop
America’s Authority in Membrane Technology 47
Example Project - Impact of Peaking Factors
D es ign flu x –S ingle mos timportantfac torthatimpac tsM B R ec onomic s
Hollow-FiberMBR
DesignFlux
(Peak)
Peak HourFlow
Factor
Cost ofMembranes
AverageEnergy
Consumption
Example P rojec t-P reviou sGeneration
2 7 3. 0 $5, 40 0 , 0 0 0 3, 7 1 0 kW h/d ay
N ew Generation 31 3. 0 $4, 8 0 0 , 0 0 0 3, 1 7 0 kW h/d ay
N ew Generation 31 2 . 0 $3, 950 , 0 0 0 2 , 8 2 0 kW h/d ay
AMTA Workshop
America’s Authority in Membrane Technology
Conclusions - MBR Optimization
M B R proc es s es c an be optimized :
M L S S (~6, 0 0 0 mg/L s eems bes t)
RA S d e-aeration
M aximize peakins tantaneou s flu x
O ptimize s c ou rs trategy
48

2/23/20 15
13
AMTA Workshop
America’s Authority in Membrane Technology
Conclusions – Comparison to CAS and Filters
M B R wins hand s d own on:
Reac tortankvolu me
Efflu entqu ality
P roc es s footprint
M ore wid es pread applic ation ofM B R s tillc hallenged by:
H igherenergy c ons u mption
Relatively higherlife c yc le c os t
The newerinnovations d on’ tyetc ompletely overc ome thes e
49July 2007
AMTA Technology Transfer Workshop“MBR/MF/UF Membrane Treatment in the Pacific Northwest”
in cooperation with WEF
Seattle, WA – May 21-23, 2012
AMTA Workshop
America’s Authority in Membrane Technology
Thank you!
Questions?
50