Seattle Public Utilities 2014 Residential Waste …spu/@garbage/documents/web...Seattle Public...
114
Seattle Public Utilities 2014 Residential Waste Stream Composition Study FINAL Report prepared by Cascadia Consulting Group March 2015
Transcript of Seattle Public Utilities 2014 Residential Waste …spu/@garbage/documents/web...Seattle Public...

Seattle Public Utilities
2014 Residential Waste Stream
Composition Study FINAL Report
prepared by
Cascadia Consulting Group
March 2015

Previous reports on Seattle’s Residential Recycling and Waste Streams are available on the Seattle Public Utilities website.
Waste Composition Reports 1
2010 Residential Waste Stream Composition Study
2006 Residential Waste Stream Composition Study
2002 Residential Waste Stream Composition Study
1998-1999 Residential Waste Stream Composition Study
1994-1995 Residential Waste Stream Composition Study
Recycling Composition Reports 2
2010 Residential Recycling Composition Study
2005 Residential Recycling Composition Study
2000-01 Residential Recycling Composition Study
1998/1999 Residential Recycling Composition Study3
1993 Residential Recycling Composition Study4
1 http://www.seattle.gov/util/About_SPU/Garbage_System/Reports/Waste_Composition_Reports/index.asp 2 http://www.seattle.gov/util/About_SPU/Recycling_System/Reports/Recycling_Composition_Study/index.asp 3 This report is not available online. 4 This report is not available online.
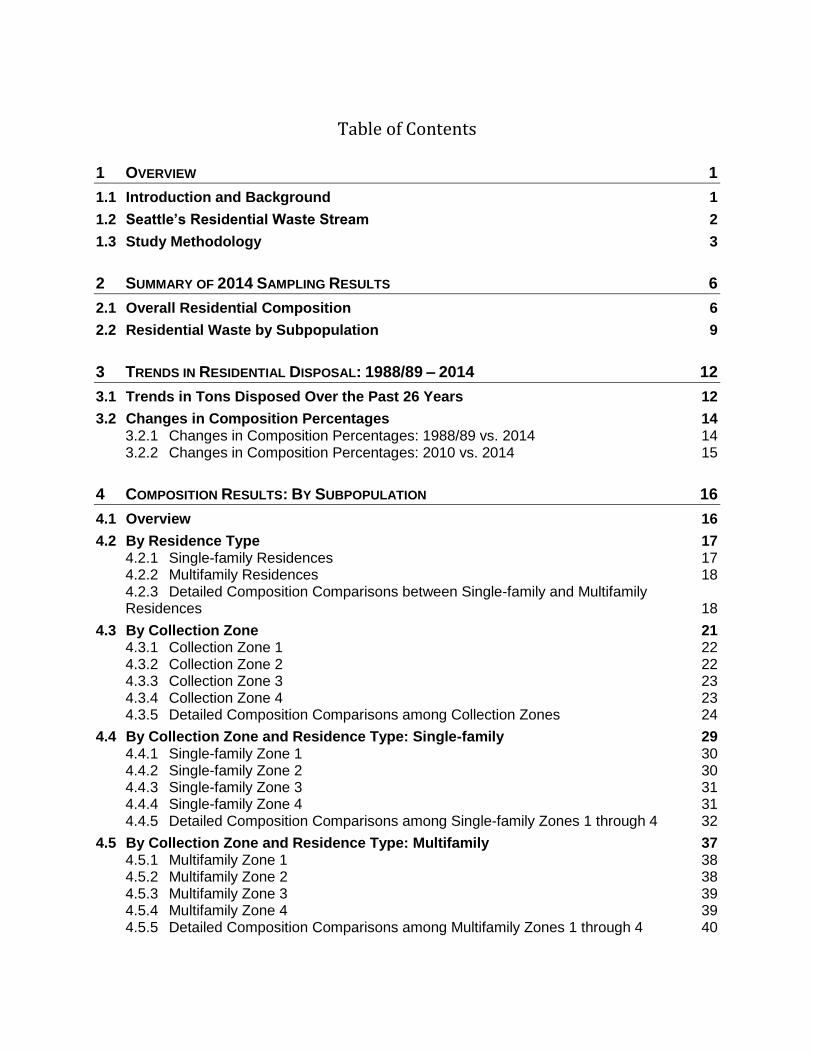
Table of Contents
1 OVERVIEW 1
1.1 Introduction and Background 1
1.2 Seattle’s Residential Waste Stream 2
1.3 Study Methodology 3
2 SUMMARY OF 2014 SAMPLING RESULTS 6
2.1 Overall Residential Composition 6
2.2 Residential Waste by Subpopulation 9
3 TRENDS IN RESIDENTIAL DISPOSAL: 1988/89 – 2014 12
3.1 Trends in Tons Disposed Over the Past 26 Years 12
3.2 Changes in Composition Percentages 14 3.2.1 Changes in Composition Percentages: 1988/89 vs. 2014 14 3.2.2 Changes in Composition Percentages: 2010 vs. 2014 15
4 COMPOSITION RESULTS: BY SUBPOPULATION 16
4.1 Overview 16
4.2 By Residence Type 17 4.2.1 Single-family Residences 17 4.2.2 Multifamily Residences 18 4.2.3 Detailed Composition Comparisons between Single-family and Multifamily Residences 18
4.3 By Collection Zone 21 4.3.1 Collection Zone 1 22 4.3.2 Collection Zone 2 22 4.3.3 Collection Zone 3 23 4.3.4 Collection Zone 4 23 4.3.5 Detailed Composition Comparisons among Collection Zones 24
4.4 By Collection Zone and Residence Type: Single-family 29 4.4.1 Single-family Zone 1 30 4.4.2 Single-family Zone 2 30 4.4.3 Single-family Zone 3 31 4.4.4 Single-family Zone 4 31 4.4.5 Detailed Composition Comparisons among Single-family Zones 1 through 4 32
4.5 By Collection Zone and Residence Type: Multifamily 37 4.5.1 Multifamily Zone 1 38 4.5.2 Multifamily Zone 2 38 4.5.3 Multifamily Zone 3 39 4.5.4 Multifamily Zone 4 39 4.5.5 Detailed Composition Comparisons among Multifamily Zones 1 through 4 40

4.6 By Season 45 4.6.1 Spring 46 4.6.2 Summer 46 4.6.3 Fall 47 4.6.4 Winter 47 4.6.5 Detailed Composition Comparisons among Seasons 48
4.7 By Demographics 53 4.7.1 By Household Income 53 4.7.2 By Household Size 58 4.7.3 Detailed Composition Comparisons between Small and Large Households 60
Appendix A: Waste Components Appendix B: Sampling Methodology Appendix C: Comments on Monthly Sampling Events Appendix D: Waste Composition Calculations Appendix E: Comparison Calculations Appendix F: Analytical Database Description Appendix G: Field Forms

Table of Tables
Table 1-1: Samples per Study Period, by Substream 1
Table 2-1: Top Ten Components – Overall Residential 7
Table 2-2: Composition by Weight – Overall Residential 8
Table 2-3: Largest Waste Components, by Subpopulation 10
Table 3-1: Changes in Composition Percentages – 1988/99 and 2014 Study Periods 14
Table 3-2: Changes in Composition Percentages – 2010 and 2014 Study Periods 15
Table 4-1: Sampling Information, by Subpopulation 16
Table 4-2: Top Ten Components – Single-family 17
Table 4-3: Top Ten Components – Multifamily 18
Table 4-4: Composition by Weight – Single-family 19
Table 4-5: Composition by Weight – Multifamily 20
Table 4-6: Top Ten Components – Zone 1 22
Table 4-7: Top Ten Components – Zone 2 22
Table 4-8: Top Ten Components – Zone 3 23
Table 4-9: Top Ten Components – Zone 4 23
Table 4-10: Composition by Weight – Zone 1 25
Table 4-11: Composition by Weight – Zone 2 26
Table 4-12: Composition by Weight – Zone 3 27
Table 4-13: Composition by Weight – Zone 4 28
Table 4-14: Top Ten Components – Single-family Zone 1 30
Table 4-15: Top Ten Components – Single-family Zone 2 30
Table 4-16: Top Ten Components – Single-family Zone 3 31
Table 4-17: Top Ten Components – Single-family Zone 4 31
Table 4-18: Composition by Weight – Single-family Zone 1 33
Table 4-19: Composition by Weight – Single-family Zone 2 34
Table 4-20: Composition by Weight – Single-family Zone 3 35
Table 4-21: Composition by Weight – Single-family Zone 4 36
Table 4-22: Top Ten Components – Multifamily Zone 1 38
Table 4-23: Top Ten Components – Multifamily Zone 2 39
Table 4-24: Top Ten Components – Multifamily Zone 3 39
Table 4-25: Top Ten Components – Multifamily Zone 4 40
Table 4-26: Composition by Weight – Multifamily Zone 1 41
Table 4-27: Composition by Weight – Multifamily Zone 2 42

Table 4-28: Composition by Weight – Multifamily Zone 3 43
Table 4-29: Composition by Weight – Multifamily Zone 4 44
Table 4-30: Top Ten Components – Spring 46
Table 4-31: Top Ten Components – Summer 46
Table 4-32: Top Ten Components – Fall 47
Table 4-33: Top Ten Components – Winter 48
Table 4-34: Composition by Weight – Spring 49
Table 4-35: Composition by Weight – Summer 50
Table 4-36: Composition by Weight – Fall 51
Table 4-37: Composition by Weight – Winter 52
Table 4-38: Top Ten Components – High-income Households 54
Table 4-39: Top Ten Components – Low-income Households 54
Table 4-40: Composition by Weight – High-income Households 56
Table 4-41: Composition by Weight – Low-income Households 57
Table 4-42: Top Ten Components – Small Households 59
Table 4-43: Top Ten Components – Large Households 59
Table 4-44: Composition by Weight – Small Households 61
Table 4-45: Composition by Weight – Large Households 62
Table of Figures
Figure 1-1: Seattle’s Collection Zones 2
Figure 1-2: Sampling Groups, by Residence Type and Collection Zone 3
Figure 2-1: Composition Summary – Overall Residential 6
Figure 3-1: Trends in Disposed Tons – 1988/89 to 2014 13
Figure 4-1: Composition Summary, by Residence Type 17
Figure 4-2: Composition Summary, by Zone 21
Figure 4-3: Composition Summary, Single-family 29
Figure 4-4: Composition Summary, Multifamily 37
Figure 4-5: Composition Summary, by Season 45
Figure 4-6: Composition Summary, by Household Income 53
Figure 4-7: Composition Summary, by Household Size 58

Cascadia Consulting Group, Inc. 1 Waste Stream Composition Study: 2014 FINAL Report
1 Overview
1.1 Introduction and Background
Seattle Public Utilities (SPU) provides for the collection, transfer, and disposal of municipal solid waste (MSW) from within the City of Seattle. As part of this responsibility, SPU designs and implements programs intended to achieve a 70% recycling goal by 2025. SPU has conducted waste composition studies since 1988 to better understand the types and quantities of MSW disposed, to assess the city's recycling potential, and to aid the evaluation of existing programs. These studies have analyzed the residential, commercial, and self-haul waste streams at intervals of about four years. Table 1-1 shows the number of waste samples sorted by these three waste streams from 1988 through the current study in 2014.
Table 1-1: Samples per Study Period, by Substream
Year Commercial Residential Self-Haul Total
1988-89 121 212 217 550 1990 0 114 203 317 1992 251 0 197 448
1994-95 0 368 0 368 1996 348 0 199 547
1998-99 0 360 0 360 2000 347 0 200 547 2002 0 309 0 309 2004 270 0 216 486 2006 0 356 0 356 2008 271 0 216 487 2010 0 361 0 361 2012 259 0 216 476 2014 0 362 0 362
All of these studies share three common objectives:
Obtain information about the city’s residential, commercial, and self-haul waste streams to estimate the recycling potential for each.
Understand differences among these three streams to help design, implement, and monitor targeted recycling programs for each stream.
Establish a baseline for continued long-term measurement of system performance.
This report presents the results of the 2014 residential waste study in four sections. Section 1 briefly introduces the project and the methodology, and Section 2 summarizes the findings. In Section 3, the 2014 findings are compared to those from the 1988/89, 1994/95, 1998/99, 2002, 2006, and 2010 residential studies. Detailed results of the 2014 residential waste composition study are presented in Section 4. Appendices follow the main body of the report and provide material definitions, study methodology, comments on sampling events, waste composition calculations, year-to-year comparison calculations, and copies of field forms.

Cascadia Consulting Group, Inc. 2 Waste Stream Composition Study: 2014 FINAL Report
1.2 Seattle’s Residential Waste Stream
This study examined waste disposed by two types of residences: single-family and multifamily.5 In Seattle, the single-family and multifamily waste streams are defined as follows:
Single-family: Primarily detached single-family, duplex, triplex, and four-plex homes. Waste is collected from garbage cans.
Multifamily: Primarily apartments and condominiums with five or more units. Waste is collected from dumpsters.6
The contract haulers collect and deliver both single-family and multifamily residential waste to Seattle’s two transfer stations. Self-hauled residential waste was not addressed by this study. Self-hauled waste is delivered to a transfer station by the individual homeowner or renter as opposed to a city-contracted hauler.7
Contract haulers collect Seattle’s residential waste from four collection zones (Zones 1, 2, 3, and 4) shown in Figure 1-1 below.
Figure 1-1: Seattle’s Collection Zones
Using these two characteristics—residence type and zone—eight sampling groups were established to provide a more detailed and precise analysis. Figure 1-2 depicts these eight residential waste stream sampling groups.
5 This study measured waste disposal, not generation. Waste generation equals the sum of disposed, recycled, and composted amounts. 6Through the Clear Alleys Program, multifamily waste from approximately 24 downtown buildings is collected in bags. This waste was excluded from the study due to the difficulty of segregating and obtaining representative samples of this material. 7 The most recent study on Seattle’s self-haul waste was conducted in 2012.

Cascadia Consulting Group, Inc. 3 Waste Stream Composition Study: 2014 FINAL Report
Figure 1-2: Sampling Groups, by Residence Type and Collection Zone
Generator Type Single-family Multifamily
Wa
ste
Co
lle
cti
on
Zo
nes
On
e
Single-family Zone One
Multifamily Zone One
Tw
o
Single-family Zone Two
Multifamily Zone Two
Thre
e
Single-family Zone Three
Multifamily Zone Three
Four
Single-family Zone Four
Multifamily Zone Four
1.3 Study Methodology
The following section provides an overview of the 2014 study methodology. As shown, this waste composition study was conducted in four major steps, presented according to the order in which they occurred during the course of the study. Appendix B contains a detailed description of the methodology.

Cascadia Consulting Group, Inc. 4 Waste Stream Composition Study: 2014 FINAL Report
Step 1: Develop Sampling Plan
Samples were allocated among the eight residential sampling groups: about half to single-family residential waste and half to multifamily residential waste. Both single-family and multifamily samples were evenly split among the four service zones.
A sampling schedule was constructed for the 2014 calendar year, consisting of five consecutive sampling days (Monday-Friday) every other month. Sampling days were randomly selected and then adjusted to assure a representative distribution across the days of the week and weeks of the month.
A complete list of Seattle’s residential routes was assembled in conjunction with the City’s contracted waste haulers.
Step 2: Schedule and Collect Waste Samples
Prior to each month’s sampling, vehicle routes were randomly selected from each of the eight sampling groups.
The contract haulers were sent a list of the routes chosen for each day of sampling.
Waste was collected from the designated routes and delivered to the
appropriate transfer station for sampling.
Step 3: Capture and Sort Samples
As each vehicle entered the facility, the sampling crew supervisor verified information with the driver about the waste collected and then directed the front loader operator to scoop a portion of the waste being tipped out of the vehicle. About 250 pounds of this waste was placed on a tarpaulin for sorting.
For this study, a total of 362 samples were sorted into 115 distinct component categories, such as newspaper or PET plastic bottles. Refer to Appendix A for component definitions and a detailed description of the changes made to the component categories from the 2010 study.

Cascadia Consulting Group, Inc. 5 Waste Stream Composition Study: 2014 FINAL Report
Step 4: Analyze Data and Prepare Report
Each month all sort data were double-entered into a customized database to eliminate data entry errors. At the conclusion of the study, waste composition estimates were calculated by aggregating sampling data using a weighted average procedure. SPU provided annual waste tonnages to perform these calculations. Refer to Appendix D for a description of the calculation methodology.
This report was prepared based on this data analysis.

Cascadia Consulting Group, Inc. 6 Waste Stream Composition Study: 2014 FINAL Report
2 Summary of 2014 Sampling Results
This report presents composition results in the following order. First, a pie chart reflects the composition percentages of the nine broad material categories. Following that, a table lists the top ten components, by weight.8 Lastly, a detailed table presents the full composition results of all 115 components. Percentages may not add up to 100% in tables throughout the report due to rounding.
2.1 Overall Residential Composition
A total of 362 residential waste loads were sampled between January and December 2014. Seattle residents disposed a total of 112,238 tons of waste during this time. The composition estimates were applied to these tons to estimate the amount of waste disposed in 2014 for each component category. As shown in Figure 2-1, organics accounted for more than half of the residential tonnage, while paper composed approximately 20% of the residential waste.
Figure 2-1: Composition Summary – Overall Residential9 (January – December 2014)
8 Since the 1998/99 report, tables listing the largest components (greater than 5% by weight) have been replaced with tables listing the top ten components by weight. 9 CDL wastes includes construction debris components, such as clean dimensional lumber, demo gypsum scrap, and asphalt shingles. Fines and miscellaneous materials includes four material components: sand/soil/dirt, nondistinct fines, miscellaneous fines, and miscellaneous inorganics.
Material Designations
For the sake of clarity, broad
categories such as paper, glass, and
metal are bolded while material
components such as newspaper,
clear glass bottles, and steel food
cans are italicized.

Cascadia Consulting Group, Inc. 7 Waste Stream Composition Study: 2014 FINAL Report
The top ten components of Seattle’s overall residential waste are listed in Table 2-1. When summed, they account for over 73% of the overall residential tonnage. Making up nearly 30%, food was the largest single component of this waste. In addition, animal by-products, disposable diapers, compostable/soiled paper, and other film each account for at least 5% of the overall residential waste stream. Table 2-2 lists the composition percentages, by weight, of each component in Seattle’s residential substream.10
Table 2-1: Top Ten Components – Overall Residential
(January – December 2014)
Est. Cum. Est.
Material Percent Percent Tons
Food 29.5% 29.5% 33,113
Animal By-products 10.7% 40.2% 12,054
Disposable Diapers 7.4% 47.6% 8,313
Compostable/Soiled Paper 6.4% 54.0% 7,169
Other Film 5.7% 59.7% 6,383
Mixed Low-grade Paper 4.3% 64.0% 4,806
Textiles/Clothing 2.9% 66.9% 3,207
Mixed/Other Paper 2.4% 69.3% 2,727
Newspaper 2.2% 71.5% 2,478
Miscellaneous Organics 1.7% 73.2% 1,899
Total 73.2% 82,147
10 All waste composition results were derived using a 90% confidence level. This means that there is a 90% certainty that the actual composition is within the calculated range. In charts throughout this report, the values graphed represent the mean component percentage, not the range.

Cascadia Consulting Group, Inc. 8 Waste Stream Composition Study: 2014 FINAL Report
Table 2-2: Composition by Weight – Overall Residential (January – December 2014)
Est. Est. Est. Est.
Material Percent + / - Tons Percent + / - Tons
Paper 20.3% 22,728 Appliances and Electronics 0.9% 1,052
Newspaper 2.2% 0.2% 2,478 Furniture 0.3% 0.2% 338
Plain OCC/Kraft 1.2% 0.1% 1,372 Mattresses 0.1% 0.1% 120
Waxed OCC 0.2% 0.1% 176 Small Appliances 0.3% 0.1% 333
Grocery/Shopping Bags 0.7% 0.1% 814 Cell Phones 0.0% 0.0% 4
High-grade Paper 1.4% 0.2% 1,568 Audio/Visual Equipment 0.1% 0.0% 62
Mixed Low-grade Paper 4.3% 0.2% 4,806 CRT Monitors 0.0% 0.0% 0
Polycoated Containers 0.5% 0.2% 534 CRT Televisions 0.0% 0.0% 24
Compostable/Soiled 6.4% 0.3% 7,169 Other Electronics 0.2% 0.1% 171
Pot. Comp. Single-use Food Service 0.6% 0.1% 697
Non-Comp. Single-use Food Service 0.3% 0.1% 389 CDL Wastes 4.6% 5,213
Mixed/Other Paper 2.4% 0.2% 2,727 Clean Dimension Lumber 0.2% 0.1% 268
Clean Engineered Wood 0.2% 0.1% 203
Plastic 11.5% 12,945 Pallets 0.0% 0.0% 9
#1 PET Bottles 0.6% 0.0% 690 Crates 0.0% 0.0% 2
#2 HDPE Natural Bottles 0.2% 0.0% 216 Other Untreated Wood 0.3% 0.1% 331
#2 HDPE Colored Bottles 0.3% 0.0% 288 New Painted Wood 0.3% 0.1% 363
Other Bottles 0.1% 0.0% 146 Old Painted Wood 0.4% 0.2% 446
Tubs 0.4% 0.0% 443 Creosote-treated Wood 0.0% 0.0% 42
Expanded Poly. Non-food 0.2% 0.0% 171 Other Treated Wood 0.2% 0.1% 180
Expanded Poly. Food-grade 0.2% 0.0% 223 Contaminated Wood 0.5% 0.2% 599
Rigid Poly. Foam Insulation 0.1% 0.0% 80 New Gypsum Scrap 0.1% 0.1% 75
Pot. Comp. Single-use Food Service 0.2% 0.0% 192 Demo Gypsum Scrap 0.3% 0.1% 381
Non-Comp. Single-use Food Service 0.3% 0.0% 291 Carpet 1.0% 0.3% 1,167
Other Rigid Packaging 1.1% 0.1% 1,195 Felt Carpet Pad 0.0% 0.0% 23
Shopping/Dry Cleaning Bags 0.2% 0.0% 248 Fiberglass Insulation 0.1% 0.1% 70
Stretch Wrap 0.0% 0.0% 52 Concrete 0.2% 0.1% 171
Clean Polyethylene Film 0.2% 0.1% 223 Asphalt Paving 0.0% 0.0% 21
Other Film 5.7% 0.2% 6,383 Other Aggregates 0.0% 0.0% 6
Plastic Pipe 0.0% 0.0% 33 Rock 0.0% 0.0% 54
Foam Carpet Padding 0.2% 0.1% 184 Asphalt Shingles 0.0% 0.0% 42
Durable Plastic Products 1.0% 0.1% 1,069 Other Asphaltic Roofing 0.0% 0.0% 14
Plastic/Other Materials 0.7% 0.1% 818 Ceramics 0.3% 0.1% 317
Cement Fiber Board 0.0% 0.0% 15
Glass 2.3% 2,598 Single-ply Roofing Membranes 0.0% 0.0% 13
Clear Bottles 0.6% 0.1% 723 Ceiling Tiles 0.0% 0.0% 23
Green Bottles 0.4% 0.1% 470 Other Construction 0.3% 0.1% 373
Brown Bottles 0.5% 0.1% 591
Container Glass 0.3% 0.0% 360 Hazardous 0.5% 594
Fluorescent Tubes 0.0% 0.0% 24 Dried Latex Paint 0.1% 0.0% 80
CFLs 0.0% 0.0% 8 Liquid Latex Paint 0.1% 0.0% 110
Flat Glass 0.1% 0.0% 67 Solvent-based Adhesives 0.0% 0.0% 6
Automotive Glass 0.0% 0.0% 14 Water-based Adhesives 0.0% 0.0% 16
Other Glass 0.3% 0.1% 341 Oil-based Paint/Thinners 0.0% 0.0% 20
Caustic Cleaners 0.0% 0.0% 21
Metal 3.1% 3,522 Pesticides/Herbicides 0.0% 0.0% 22
Aluminum Beverage Cans 0.4% 0.0% 412 Rechargeable Batteries 0.0% 0.0% 3
Aluminum Foil/Containers 0.3% 0.0% 281 Other Dry-cell Batteries 0.0% 0.0% 30
Other Aluminum 0.1% 0.0% 117 Wet-cell Batteries 0.0% 0.0% 3
Other Nonferrous 0.3% 0.1% 307 Gasoline/Kerosene 0.0% 0.0% 0
Steel Food Cans 0.6% 0.1% 672 Motor Oil/Diesel Oil 0.0% 0.0% 5
Empty Aerosol Cans 0.1% 0.0% 125 Asbestos 0.0% 0.0% 0
Other Ferrous 0.5% 0.1% 518 Explosives 0.0% 0.0% 0
Oil filters 0.0% 0.0% 5 Medical Wastes 0.0% 0.0% 55
Mixed Metals/Material 1.0% 0.1% 1,084 Other Cleaners/Chemicals 0.0% 0.0% 29
Pharmaceuticals/Vitamins 0.0% 0.0% 30
Organics 53.8% 60,416 Cosmetics 0.1% 0.0% 113
Leaves and Grass 1.2% 0.3% 1,375 Other Potentially Harmful Waste 0.0% 0.0% 49
Prunings 0.3% 0.1% 379
Food 29.5% 0.6% 33,113 Fines and Misc Materials 2.8% 3,170
Fats, Oils, Grease 0.1% 0.0% 73 Sand/Soil/Dirt 0.7% 0.2% 777
Textiles/Clothing 2.9% 0.2% 3,207 Non-distinct Fines 0.3% 0.1% 286
Mixed Textiles 1.2% 0.1% 1,326 Miscellaneous Organics 1.7% 0.2% 1,899
Disposable Diapers 7.4% 0.4% 8,313 Miscellaneous Inorganics 0.2% 0.1% 208
Animal By-products 10.7% 0.6% 12,054
Rubber Products 0.5% 0.1% 541
Tires 0.0% 0.0% 37 Totals 100% 112,238
Sample Count 362
Confidence intervals calculated at the 90% confidence level. Percentages for material types may not total 100% due to rounding.

Cascadia Consulting Group, Inc. 9 Waste Stream Composition Study: 2014 FINAL Report
2.2 Residential Waste by Subpopulation
In addition to the overall residential substream, waste composition estimates were calculated for the following subpopulations:
Residence type: single-family and multifamily
Collection zone: Zones 1, 2, 3, and 4
Residence type and collection zone: single-family Zone 1, single-family Zone 2, single-family Zone 3, single family Zone 4, multifamily Zone 1, multifamily Zone 2, multifamily Zone 3, and multifamily Zone 4
Season: spring, summer, autumn, and winter
Household income: low and high
Household size: small and large As with the overall estimates, a weighted average procedure was employed to calculate composition estimates by residence type and service area; see Appendix D for more detail on weighted averages. Several additional steps were needed to calculate composition by household income and household size; see the Demographic Calculations section in Appendix D for more detail. The largest components for each subpopulation are shown in Table 2-3 (each accounting for more than 5%).

Cascadia Consulting Group, Inc. 10 Waste Stream Composition Study: 2014 FINAL Report
Table 2-3: Largest Waste Components, by Subpopulation11 (January – December 2014)
The following conclusions can be drawn from the waste composition estimates of the overall residential substream and for each subpopulation.
Food typically accounted for about a third of each subpopulation’s waste, by weight.
Animal by-products and food were among the largest components for all subpopulations.
Subpopulations share many of the same largest material components, particularly food as the most commonly disposed material in all subpopulations; however, the main differences appear to include:12
11 A map showing Seattle’s residential waste collection zones can be found in Figure 1-1 on page 2. 12 No statistical tests were performed to identify differences among subpopulations. Therefore, the comparisons may not be statistically significant.
Plastic
SubpopulationCompostable/
Soiled
Mixed Low-
gradeFood
Animal By-
products
Disposable
DiapersOther Film
Residence Type
Single-family 6.7% 28.4% 12.5% 9.0% 6.2%
Multifamily 6.1% 30.7% 8.7% 5.5% 5.1%
Collection Zone
Zone 1 6.3% 27.5% 11.3% 7.3% 5.9%
Zone 2 6.1% 28.8% 10.2% 7.8% 6.3%
Zone 3 6.4% 30.3% 10.6% 6.6% 5.3%
Zone 4 6.6% 30.6% 10.8% 8.2% 5.6%
Residence Type and Zone
Single-family Zone 1 6.5% 27.2% 12.2% 8.5% 6.1%
Single-family Zone 2 6.3% 27.8% 12.1% 9.0% 6.5%
Single-family Zone 3 6.5% 29.3% 13.2% 8.8% 6.1%
Single-family Zone 4 7.2% 29.1% 12.4% 9.6% 6.3%
Multifamily Zone 1 6.2% 27.9% 9.8% 5.1% 5.4%
Multifamily Zone 2 5.9% 5.2% 29.9% 7.8% 6.3% 6.0%
Multifamily Zone 3 6.3% 30.8% 9.0% 5.3%
Multifamily Zone 4 5.6% 5.1% 33.4% 8.1% 5.7%
Season
Spring 6.0% 32.2% 11.7% 7.9% 5.5%
Summer 6.4% 26.7% 10.9% 7.2% 5.8%
Fall 7.0% 23.2% 10.9% 8.9%
Winter 6.2% 5.4% 36.1% 9.5% 5.6% 7.1%
Demographics
Low Income 6.9% 28.9% 12.2% 7.9% 6.6%
High Income 6.3% 28.8% 13.0% 9.6% 6.3%
Small Households 6.6% 28.2% 14.6% 8.6% 6.3%
Large Households 6.9% 30.7% 11.4% 9.1% 6.7%
Overall Residential 6.4% 29.5% 10.7% 7.4% 5.7%
Paper Organics

Cascadia Consulting Group, Inc. 11 Waste Stream Composition Study: 2014 FINAL Report
o Single-family residents discarded a greater percentage of disposable diapers and animal by-products than did multifamily residents. Conversely, multifamily residents disposed of a greater portion of food.
o The percentage of food disposed was highest in winter (36.1%) and lowest in fall (23.2%).
o Low-income households discarded relatively fewer disposable diapers than high-income households. Other large components contributed similar portions to both low and high-income households.
o Large households disposed of a lower percentage of animal by-products and a higher percentage of compostable/soiled paper, food, and disposable diapers than small households.

Cascadia Consulting Group, Inc. 12 Waste Stream Composition Study: 2014 FINAL Report
3 Trends in Residential Disposal: 1988/89 – 2014
The overall residential results for the 2014 study were compared to previous studies of the residential waste stream to identify trends over time.13 Seattle’s curbside recycling program began in 1988, and the yard waste program followed in 1989. In 2000, the commingled recycling program began.14 Seattle enacted mandatory recycling in January 2005, and enforcement began in January 2006. Soon after, in mid-2006, the yard waste program expanded to accept vegetative food waste and compostable paper. In April 2009, organics collection frequency increased to weekly citywide and the program was expanded to allow all food waste and compostable paper. In addition, universal organics service was implemented, requiring residents to subscribe to organics collection unless they received an exemption for back yard composting. All six of the previous residential studies followed the same basic methodology as the present 2014 study.15 Results were compared year-to-year by examining the changes in the total amount of waste disposed and in composition percentages for each of the eight broad material categories.16 Statistical t-tests were used to analyze differences in the composition percentages. Section 3.1 provides an overview of the changes in disposed tons over the last 26 years. Section 3.2 compares 2014 composition percentages with earlier studies. See Appendix E for details about year-to-year comparison calculations.
3.1 Trends in Tons Disposed Over the Past 26 Years
Figure 3-1 illustrates the changes in disposed tons since the 1988/89 study for each of the eight broad material categories: paper, plastic, glass, metals, organics, other materials, CDL wastes, and hazardous. The total amount of waste disposed decreased dramatically from 179,968 tons in 1988/89 to 145,591 tons in 1994/95. Residential waste tonnage remained relatively consistent until 2002, then decreased from 142,910 tons to 133,774 tons in 2006 and dropped again in 2010 to 114,134 tons. This decrease is likely due to the economic recession and the new organics program described above. Residential waste tonnage declined slightly in 2014 to 112,238 tons. Between 2010 and 2014, the broad material categories of paper, organics, and other materials (which includes animal by-products, disposable diapers, furniture, and carpet) showed the greatest changes.
13 The composition and tonnage figures presented in this section were calculated using an unweighted analytical process. Thus, they may not be equal to the composition percentages (and associated tonnages) presented in Section 4 as these are derived using a weighted process. Appendix D provides more detail on weighted averages, while Appendix E outlines year-to-year comparison calculations. 14 The commingled recycling program started in 2000 allowed residents to combine plastic and paper recyclable materials. Glass was still collected in a separate bin. Materials added to the recycling program in 2000 included polycoated paper, aseptic packaging, plastic jars, tubs, and bottles, and clean plastic film bags. 15 See Appendix B for more detail regarding the methodology. 16 The material components for each season have been adjusted to match a uniform material list for two reasons: (1) the materials list has changed from 52 material components in 1988/89 to 115 materials in 2014 and (2) several components have been moved to different broad material categories to better reflect new policies in recycling and composting. Therefore, the percentages of broad material categories in Section 3 will not necessarily match the percentages of broad material categories presented in Section 4. This is explained in greater depth in Appendix E.

Cascadia Consulting Group, Inc. 13 Waste Stream Composition Study: 2014 FINAL Report
Figure 3-1: Trends in Disposed Tons – 1988/89 to 2014
Figure 3-1 graphically shows the following changes in tonnage for each material category over the study years since 1988/89:
Paper. The tonnage of paper increased slightly in 2014 for the first time since 1988/89, but overall has dropped by over 60% since 1988/89 to 21,981 tons. The overall decrease is due to noticeable decreases in newsprint, unwaxed OCC/Kraft, mixed low-grade paper, and mixed/other paper between the two study periods.
Plastic. The tonnage of plastic increased between 2010 and 2014 by over 1,200 tons. Contributing to this increase, other plastic film rose from 4,428 tons to 6,383 tons, and other rigid packaging increased from 714 tons to 1,195 tons. When comparing across all study years prior to 2014, plastic tonnage was lowest in 2010.
Glass. Between 1988/89 and 2010, glass tonnage decreased by 80%, from 11,537 tons to 2,368 tons. In the following four year period, from 2010 to 2014, glass tonnage increased slightly, reaching 2,627 tons last year.
Metal. The tonnage of metal in the waste stream has declined steadily from 9,491 tons in 1988/89 to 3,701 tons in 2014.
Organics. Between 2006 and 2010, organics decreased by about 12,000 tons. Organics decreased again between 2010 and 2014, though by a smaller amount - about 1,400 tons.
Other Materials. The tonnage of other materials in the waste stream has increased every study year since 1988/89. This category decreased slightly for the first time between 2010 and 2014, falling from 31,866 tons to 30,380 tons.
CDL Wastes. The tonnage of CDL wastes decreased by about half between 1988/89 and 1998/99 from 15,830 tons to 7,280 tons, followed by an increase in
-
10,000
20,000
30,000
40,000
50,000
60,000
70,000
To
ns
Dis
po
se
d
Year of Study
Organics
Other Materials
Paper
Plastic
CDL Wastes
Metal
Glass
Hazardous

Cascadia Consulting Group, Inc. 14 Waste Stream Composition Study: 2014 FINAL Report
2002 to 8,469 tons. Between 2006 and 2010, the amount of CDL waste remained relatively consistent, and then fell to 5,336 tons in 2014.
Hazardous. The tonnage of hazardous materials has remained fairly steady since 1994/95. In 2014, tonnage decreased slightly from 979 tons to 707 tons.
3.2 Changes in Composition Percentages
This section first presents a comparison of composition percentages between the current study and the 1988/89 study, and then a comparison between the current study and the 2010 study.
3.2.1 Changes in Composition Percentages: 1988/89 vs. 2014
The bolded broad material categories in Table 3-1 showed statistically significant changes between 1988/89 and 2014. Paper, glass, metal, organics, and CDL wastes decreased significantly, while plastic and other materials increased significantly. The portion of other materials disposed in the waste stream showed the greatest change, increasing from 6.1% in 1988/89 to 27.1% in 2014, but some of this increase is due to changes in material categorization.17
Table 3-1: Changes in Composition Percentages – 1988/99 and 2014 Study Periods
17 Part of this increase is due to adding several material types to the other materials category, such as furniture, small appliances, and AV equipment; in the 1988/89 study these were classified according to their dominant material type (such as metal or plastic). See Appendix A for a table outlining changes in material categories across study periods. The change in sorting categories may have also affected the estimated proportions of plastic, metal, and glass, causing them to be slightly higher in the 1988/89 study. The exact amount of this difference cannot be calculated.
Percent Change Disposed Tons
in
1988/89 2014 Composition % 1988/89 2014
Paper 31.2% 19.6% -11.7% 56,220 21,981
Plastic 8.1% 11.6% 3.6% 14,508 13,050
Glass 6.4% 2.3% -4.1% 11,537 2,627
Metal 5.3% 3.3% -2.0% 9,491 3,701
Organics 33.4% 30.7% -2.7% 60,145 34,456
Other Materials 6.1% 27.1% 20.9% 11,046 30,380
CDL Wastes 8.8% 4.8% -4.0% 15,830 5,336
Hazardous 0.7% 0.6% 0.0% 1,192 707
Total 100% 100% 179,968 112,238
Note: Bold type indicates statistically significant changes.

Cascadia Consulting Group, Inc. 15 Waste Stream Composition Study: 2014 FINAL Report
3.2.2 Changes in Composition Percentages: 2010 vs. 2014
In Table 3-2, bolded broad material categories differed by a statistically significant amount between the 2010 and 2014 study periods. Paper and plastic increased significantly while the other broad material categories did not show significant differences between study years.
Table 3-2: Changes in Composition Percentages – 2010 and 2014 Study Periods
Percent Change Disposed Tons
in
2010 2014 Composition % 2010 2014
Paper 17.7% 19.6% 1.9% 20,197 21,981
Plastic 10.4% 11.6% 1.3% 11,835 13,050
Glass 2.1% 2.3% 0.3% 2,368 2,627
Metal 4.0% 3.3% -0.7% 4,522 3,701
Organics 31.4% 30.7% -0.7% 35,863 34,456
Other Materials 27.9% 27.1% -0.9% 31,866 30,380
CDL Wastes 5.7% 4.8% -0.9% 6,505 5,336
Hazardous 0.9% 0.6% -0.2% 979 707
Total 100% 100% 114,135 112,238
Note: Bold type indicates statistically significant changes.

Cascadia Consulting Group, Inc. 16 Waste Stream Composition Study: 2014 FINAL Report
4 Composition Results: By Subpopulation
4.1 Overview
A total of 362 loads from the residential waste stream were sampled from January to December 2014. Table 4-1 summarizes the sample information for each residential subpopulation as well as the associated tons disposed. The average sample weight for the 362 residential samples was approximately 318 pounds. Seattle Public Utilities and the City’s authorized waste haulers provided the total 2014 disposal tonnages presented in this section of the report.
Table 4-1: Sampling Information, by Subpopulation (January – December 2014)
Subpopulation Code
Total
Sample
(lbs)
Sample
Count
Total
Disposal
(Tons)
Number of
Households
Residence Type
Single-family SF 56,592.1 182 60,106.21 163,971
Multifamily MF 58,566.8 180 52,131.31 142,235
Collection Zone
Zone 1 1 29,757.6 92 23,898.73 70,749
Zone 2 2 28,421.8 90 20,110.87 51,647
Zone 3 3 28,909.0 91 36,512.92 109,872
Zone 4 4 28,070.6 89 31,714.99 73,938
Residence Type and Zone
Single-family Zone 1 SF1 14,553.6 47 15,114.61 45,958
Single-family Zone 2 SF2 14,277.9 45 11,160.45 30,665
Single-family Zone 3 SF3 14,119.5 45 13,468.03 34,401
Single-family Zone 4 SF4 13,641.2 45 20,363.12 52,947
Mulifamily Zone 1 MF1 15,204.0 45 8,784.12 24,791
Mulifamily Zone 2 MF2 14,143.9 45 8,950.42 20,982
Mulifamily Zone 3 MF3 14,789.5 46 23,044.89 75,471
Mulifamily Zone 4 MF4 14,429.4 44 11,351.87 20,991
Overall Residential 115,159.0 362 112,237.51 306,206

Cascadia Consulting Group, Inc. 17 Waste Stream Composition Study: 2014 FINAL Report
4.2 By Residence Type
As shown in Figure 4-1, organics and paper composed the bulk of waste from both single and multifamily residences. Organics made up a larger portion of single-family waste (55.5%) than multifamily waste (51.9%). In contrast, paper was slightly higher for multifamily compared to single-family residences: over 21% compared to slightly above 19%. Plastic, the third largest material category, made up around 11% of the waste for both single and multifamily residences.
Figure 4-1: Composition Summary, by Residence Type (January – December 2014)
Single-family Multifamily
4.2.1 Single-family Residences
A total of 182 samples were sorted from single-family loads during the 2014 study period. Single-family residences disposed of approximately 60,106 tons of waste. As shown in Table 4-2, food was the largest component, accounting for over 28% of the total tons disposed by single-family residences in 2014. When added together, all of the top ten components summed to about 76% of the total, by weight. The full single-family composition results are presented in Table 4-4.
Table 4-2: Top Ten Components – Single-family (January – December 2014)
Est. Cum. Est.
Material Percent Percent Tons
Food 28.4% 28.4% 17,091
Animal By-products 12.5% 40.9% 7,501
Disposable Diapers 9.0% 50.0% 5,439
Compostable/Soiled Paper 6.7% 56.6% 4,014
Other Film 6.2% 62.9% 3,742
Mixed Low-grade Paper 3.9% 66.7% 2,333
Textiles/Clothing 2.9% 69.7% 1,767
Mixed/Other Paper 2.4% 72.1% 1,462
Newspaper 2.1% 74.2% 1,256
Miscellaneous Organics 1.9% 76.1% 1,121
Total 76.1% 45,726

Cascadia Consulting Group, Inc. 18 Waste Stream Composition Study: 2014 FINAL Report
4.2.2 Multifamily Residences
From loads of multifamily waste, 180 samples were captured and sorted between January and December 2014. In 2014, Seattle’s multifamily residents disposed of 52,131 tons of waste. Table 4-3 lists the top ten components disposed by multifamily residences. Food alone accounted for almost 31%, by weight. Animal by-products and compostable/soiled paper were also large components. The top ten components, listed in Table 4-3, summed to about 70% of the total waste disposed by multifamily residences. The full multifamily composition results are listed in Table 4-5.
Table 4-3: Top Ten Components – Multifamily (January – December 2014)
Est. Cum. Est.
Material Percent Percent Tons
Food 30.7% 30.7% 16,022
Animal By-products 8.7% 39.5% 4,553
Compostable/Soiled Paper 6.1% 45.5% 3,154
Disposable Diapers 5.5% 51.0% 2,874
Other Film 5.1% 56.1% 2,640
Mixed Low-grade Paper 4.7% 60.8% 2,473
Textiles/Clothing 2.8% 63.6% 1,440
Mixed/Other Paper 2.4% 66.0% 1,264
Newspaper 2.3% 68.4% 1,222
Plain OCC/Kraft 1.7% 70.1% 893
Total 70.1% 36,536
4.2.3 Detailed Composition Comparisons between Single-family and Multifamily Residences
As the largest component of both single-family and multifamily waste, food made up almost 30% of waste for each. Compostable/soiled paper, animal by-products, disposable diapers, mixed low-grade paper, other plastic film, and textiles/clothing were top ten components of waste from both residence types. Single-family and multifamily waste streams were substantially similar with a few notable differences. Disposable diapers accounted for considerably more waste from single-family residences (9.0%) than from multifamily residences (5.5%). In addition, miscellaneous organics were a top ten component only for single-family waste. Plain OCC/Kraft was a top ten component for multifamily waste only.

Cascadia Consulting Group, Inc. 19 Waste Stream Composition Study: 2014 FINAL Report
Table 4-4: Composition by Weight – Single-family (January – December 2014)
Est. Est. Est. Est.
Material Percent + / - Tons Percent + / - Tons
Paper 19.2% 11,569 Appliances and Electronics 0.5% 284
Newspaper 2.1% 0.2% 1,256 Furniture 0.1% 0.1% 89
Plain OCC/Kraft 0.8% 0.1% 479 Mattresses 0.0% 0.1% 24
Waxed OCC 0.1% 0.1% 51 Small Appliances 0.2% 0.1% 120
Grocery/Shopping Bags 0.6% 0.1% 347 Cell Phones 0.0% 0.0% 3
High-grade Paper 1.2% 0.2% 711 Audio/Visual Equipment 0.0% 0.0% 10
Mixed Low-grade Paper 3.9% 0.3% 2,333 CRT Monitors 0.0% 0.0% 0
Polycoated Containers 0.6% 0.4% 350 CRT Televisions 0.0% 0.0% 0
Compostable/Soiled 6.7% 0.3% 4,014 Other Electronics 0.1% 0.0% 38
Pot. Comp. Single-use Food Service 0.6% 0.1% 368
Non-Comp. Single-use Food Service 0.3% 0.1% 198 CDL Wastes 4.5% 2,729
Mixed/Other Paper 2.4% 0.3% 1,462 Clean Dimension Lumber 0.2% 0.1% 127
Clean Engineered Wood 0.1% 0.1% 86
Plastic 11.7% 7,049 Pallets 0.0% 0.0% 0
#1 PET Bottles 0.5% 0.0% 286 Crates 0.0% 0.0% 0
#2 HDPE Natural Bottles 0.2% 0.0% 92 Other Untreated Wood 0.2% 0.1% 126
#2 HDPE Colored Bottles 0.2% 0.0% 142 New Painted Wood 0.3% 0.2% 206
Other Bottles 0.1% 0.0% 84 Old Painted Wood 0.5% 0.3% 296
Tubs 0.4% 0.1% 225 Creosote-treated Wood 0.0% 0.0% 18
Expanded Poly. Non-food 0.2% 0.0% 102 Other Treated Wood 0.2% 0.1% 93
Expanded Poly. Food-grade 0.3% 0.0% 155 Contaminated Wood 0.4% 0.2% 238
Rigid Poly. Foam Insulation 0.1% 0.0% 51 New Gypsum Scrap 0.1% 0.1% 54
Pot. Comp. Single-use Food Service 0.2% 0.1% 108 Demo Gypsum Scrap 0.4% 0.2% 216
Non-Comp. Single-use Food Service 0.2% 0.0% 142 Carpet 1.0% 0.3% 595
Other Rigid Packaging 1.1% 0.1% 654 Felt Carpet Pad 0.0% 0.0% 12
Shopping/Dry Cleaning Bags 0.2% 0.0% 136 Fiberglass Insulation 0.0% 0.0% 20
Stretch Wrap 0.0% 0.0% 14 Concrete 0.1% 0.1% 66
Clean Polyethylene Film 0.1% 0.1% 51 Asphalt Paving 0.0% 0.1% 21
Other Film 6.2% 0.3% 3,742 Other Aggregates 0.0% 0.0% 2
Plastic Pipe 0.0% 0.0% 6 Rock 0.0% 0.0% 13
Foam Carpet Padding 0.1% 0.1% 70 Asphalt Shingles 0.1% 0.1% 42
Durable Plastic Products 1.0% 0.2% 589 Other Asphaltic Roofing 0.0% 0.0% 14
Plastic/Other Materials 0.7% 0.1% 400 Ceramics 0.3% 0.1% 172
Cement Fiber Board 0.0% 0.0% 0
Glass 1.9% 1,147 Single-ply Roofing Membranes 0.0% 0.0% 13
Clear Bottles 0.5% 0.1% 329 Ceiling Tiles 0.0% 0.0% 22
Green Bottles 0.3% 0.1% 177 Other Construction 0.5% 0.2% 274
Brown Bottles 0.4% 0.1% 236
Container Glass 0.3% 0.1% 195 Hazardous 0.6% 386
Fluorescent Tubes 0.0% 0.0% 3 Dried Latex Paint 0.1% 0.1% 60
CFLs 0.0% 0.0% 6 Liquid Latex Paint 0.1% 0.1% 80
Flat Glass 0.1% 0.0% 34 Solvent-based Adhesives 0.0% 0.0% 2
Automotive Glass 0.0% 0.0% 0 Water-based Adhesives 0.0% 0.0% 12
Other Glass 0.3% 0.1% 167 Oil-based Paint/Thinners 0.0% 0.0% 10
Caustic Cleaners 0.0% 0.0% 16
Metal 3.0% 1,786 Pesticides/Herbicides 0.0% 0.0% 21
Aluminum Beverage Cans 0.3% 0.0% 153 Rechargeable Batteries 0.0% 0.0% 1
Aluminum Foil/Containers 0.2% 0.0% 144 Other Dry-cell Batteries 0.0% 0.0% 21
Other Aluminum 0.1% 0.0% 81 Wet-cell Batteries 0.0% 0.0% 0
Other Nonferrous 0.2% 0.2% 138 Gasoline/Kerosene 0.0% 0.0% 0
Steel Food Cans 0.6% 0.1% 333 Motor Oil/Diesel Oil 0.0% 0.0% 2
Empty Aerosol Cans 0.1% 0.0% 77 Asbestos 0.0% 0.0% 0
Other Ferrous 0.5% 0.1% 285 Explosives 0.0% 0.0% 0
Oil filters 0.0% 0.0% 1 Medical Wastes 0.0% 0.0% 22
Mixed Metals/Material 1.0% 0.2% 573 Other Cleaners/Chemicals 0.0% 0.0% 10
Pharmaceuticals/Vitamins 0.0% 0.0% 17
Organics 55.5% 33,372 Cosmetics 0.1% 0.0% 79
Leaves and Grass 0.8% 0.3% 498 Other Potentially Harmful Waste 0.1% 0.0% 32
Prunings 0.2% 0.1% 96
Food 28.4% 0.8% 17,091 Fines and Misc Materials 3.0% 1,785
Fats, Oils, Grease 0.0% 0.0% 20 Sand/Soil/Dirt 0.7% 0.3% 443
Textiles/Clothing 2.9% 0.3% 1,767 Non-distinct Fines 0.2% 0.1% 124
Mixed Textiles 1.1% 0.2% 662 Miscellaneous Organics 1.9% 0.3% 1,121
Disposable Diapers 9.0% 0.6% 5,439 Miscellaneous Inorganics 0.2% 0.1% 97
Animal By-products 12.5% 0.8% 7,501
Rubber Products 0.5% 0.1% 291
Tires 0.0% 0.0% 6 Totals 100% 60,106
Sample Count 182
Confidence intervals calculated at the 90% confidence level. Percentages for material types may not total 100% due to rounding.

Cascadia Consulting Group, Inc. 20 Waste Stream Composition Study: 2014 FINAL Report
Table 4-5: Composition by Weight – Multifamily (January – December 2014)
Est. Est. Est. Est.
Material Percent + / - Tons Percent + / - Tons
Paper 21.4% 11,159 Appliances and Electronics 1.5% 768
Newspaper 2.3% 0.2% 1,222 Furniture 0.5% 0.3% 249
Plain OCC/Kraft 1.7% 0.3% 893 Mattresses 0.2% 0.3% 96
Waxed OCC 0.2% 0.1% 126 Small Appliances 0.4% 0.2% 213
Grocery/Shopping Bags 0.9% 0.1% 467 Cell Phones 0.0% 0.0% 0
High-grade Paper 1.6% 0.3% 857 Audio/Visual Equipment 0.1% 0.1% 52
Mixed Low-grade Paper 4.7% 0.3% 2,473 CRT Monitors 0.0% 0.0% 0
Polycoated Containers 0.4% 0.1% 183 CRT Televisions 0.0% 0.1% 24
Compostable/Soiled 6.1% 0.4% 3,154 Other Electronics 0.3% 0.2% 133
Pot. Comp. Single-use Food Service 0.6% 0.1% 329
Non-Comp. Single-use Food Service 0.4% 0.1% 191 CDL Wastes 4.8% 2,484
Mixed/Other Paper 2.4% 0.3% 1,264 Clean Dimension Lumber 0.3% 0.1% 141
Clean Engineered Wood 0.2% 0.1% 117
Plastic 11.3% 5,897 Pallets 0.0% 0.0% 9
#1 PET Bottles 0.8% 0.1% 404 Crates 0.0% 0.0% 2
#2 HDPE Natural Bottles 0.2% 0.0% 124 Other Untreated Wood 0.4% 0.2% 205
#2 HDPE Colored Bottles 0.3% 0.0% 146 New Painted Wood 0.3% 0.2% 157
Other Bottles 0.1% 0.0% 62 Old Painted Wood 0.3% 0.1% 150
Tubs 0.4% 0.1% 218 Creosote-treated Wood 0.0% 0.1% 25
Expanded Poly. Non-food 0.1% 0.0% 69 Other Treated Wood 0.2% 0.1% 87
Expanded Poly. Food-grade 0.1% 0.0% 68 Contaminated Wood 0.7% 0.3% 361
Rigid Poly. Foam Insulation 0.1% 0.0% 29 New Gypsum Scrap 0.0% 0.0% 21
Pot. Comp. Single-use Food Service 0.2% 0.0% 84 Demo Gypsum Scrap 0.3% 0.2% 165
Non-Comp. Single-use Food Service 0.3% 0.1% 149 Carpet 1.1% 0.4% 572
Other Rigid Packaging 1.0% 0.2% 542 Felt Carpet Pad 0.0% 0.0% 11
Shopping/Dry Cleaning Bags 0.2% 0.0% 112 Fiberglass Insulation 0.1% 0.2% 50
Stretch Wrap 0.1% 0.1% 39 Concrete 0.2% 0.2% 106
Clean Polyethylene Film 0.3% 0.3% 172 Asphalt Paving 0.0% 0.0% 0
Other Film 5.1% 0.3% 2,640 Other Aggregates 0.0% 0.0% 4
Plastic Pipe 0.1% 0.1% 27 Rock 0.1% 0.1% 40
Foam Carpet Padding 0.2% 0.2% 114 Asphalt Shingles 0.0% 0.0% 0
Durable Plastic Products 0.9% 0.1% 480 Other Asphaltic Roofing 0.0% 0.0% 0
Plastic/Other Materials 0.8% 0.2% 417 Ceramics 0.3% 0.1% 145
Cement Fiber Board 0.0% 0.0% 15
Glass 2.8% 1,450 Single-ply Roofing Membranes 0.0% 0.0% 0
Clear Bottles 0.8% 0.1% 394 Ceiling Tiles 0.0% 0.0% 1
Green Bottles 0.6% 0.1% 292 Other Construction 0.2% 0.1% 99
Brown Bottles 0.7% 0.2% 355
Container Glass 0.3% 0.1% 165 Hazardous 0.4% 208
Fluorescent Tubes 0.0% 0.1% 21 Dried Latex Paint 0.0% 0.0% 20
CFLs 0.0% 0.0% 2 Liquid Latex Paint 0.1% 0.1% 29
Flat Glass 0.1% 0.0% 32 Solvent-based Adhesives 0.0% 0.0% 4
Automotive Glass 0.0% 0.0% 14 Water-based Adhesives 0.0% 0.0% 4
Other Glass 0.3% 0.2% 174 Oil-based Paint/Thinners 0.0% 0.0% 10
Caustic Cleaners 0.0% 0.0% 5
Metal 3.3% 1,736 Pesticides/Herbicides 0.0% 0.0% 1
Aluminum Beverage Cans 0.5% 0.0% 259 Rechargeable Batteries 0.0% 0.0% 2
Aluminum Foil/Containers 0.3% 0.0% 138 Other Dry-cell Batteries 0.0% 0.0% 9
Other Aluminum 0.1% 0.0% 36 Wet-cell Batteries 0.0% 0.0% 3
Other Nonferrous 0.3% 0.2% 169 Gasoline/Kerosene 0.0% 0.0% 0
Steel Food Cans 0.7% 0.1% 339 Motor Oil/Diesel Oil 0.0% 0.0% 3
Empty Aerosol Cans 0.1% 0.0% 47 Asbestos 0.0% 0.0% 0
Other Ferrous 0.4% 0.1% 234 Explosives 0.0% 0.0% 0
Oil filters 0.0% 0.0% 3 Medical Wastes 0.1% 0.0% 33
Mixed Metals/Material 1.0% 0.2% 511 Other Cleaners/Chemicals 0.0% 0.0% 19
Pharmaceuticals/Vitamins 0.0% 0.0% 13
Organics 51.9% 27,045 Cosmetics 0.1% 0.0% 35
Leaves and Grass 1.7% 0.7% 877 Other Potentially Harmful Waste 0.0% 0.0% 16
Prunings 0.5% 0.2% 282
Food 30.7% 1.0% 16,022 Fines and Misc Materials 2.7% 1,385
Fats, Oils, Grease 0.1% 0.1% 52 Sand/Soil/Dirt 0.6% 0.3% 334
Textiles/Clothing 2.8% 0.3% 1,440 Non-distinct Fines 0.3% 0.1% 162
Mixed Textiles 1.3% 0.2% 664 Miscellaneous Organics 1.5% 0.3% 778
Disposable Diapers 5.5% 0.5% 2,874 Miscellaneous Inorganics 0.2% 0.1% 111
Animal By-products 8.7% 0.8% 4,553
Rubber Products 0.5% 0.1% 250
Tires 0.1% 0.1% 31 Totals 100% 52,131
Sample Count 180
Confidence intervals calculated at the 90% confidence level. Percentages for material types may not total 100% due to rounding.

Cascadia Consulting Group, Inc. 21 Waste Stream Composition Study: 2014 FINAL Report
4.3 By Collection Zone
For all four collection zones, the broad material categories organics and paper accounted for the highest percentages of waste. Combined, these two categories accounted for nearly three-quarters of the waste from each collection zone. Plastic made up around 11% or 12% in each zone. Other than fines and miscellaneous materials, which was slightly greater in Zone 1 than in Zones 2, 3, and 4, very few differences existed in other broad material categories.18
Figure 4-2: Composition Summary, by Zone (January – December 2014)
Zone 1 Zone 2
Zone 3 Zone 4
18 In April 2000, Seattle implemented a new citywide commingled recycling program. Prior to 2000, larger differences existed between areas of the city because recycling collection containers, separation requirements, and pick-up frequencies varied by area in previous years. As a result, tracking disposal composition by collection area was important when evaluating the curbside program and obtaining accurate overall composition results.

Cascadia Consulting Group, Inc. 22 Waste Stream Composition Study: 2014 FINAL Report
4.3.1 Collection Zone 1
From Zone 1, 92 samples were sorted between January and December 2014. Seattle’s Zone 1 residents disposed of an estimated 23,899 tons of waste in 2014. Table 4-6 lists the top ten components from Zone 1. Food accounted for about 28% of this waste. Animal by-products, disposable diapers, and compostable/soiled paper were also large components, each greater than 6% of the total. The top ten components listed in Table 4-6 summed to approximately 72% of the total waste disposed in Zone 1. The full composition results for Zone 1 are listed in Table 4-10.
Table 4-6: Top Ten Components – Zone 1 (January – December 2014)
Est. Cum. Est.
Material Percent Percent Tons
Food 27.5% 27.5% 6,565
Animal By-products 11.3% 38.8% 2,705
Disposable Diapers 7.3% 46.0% 1,735
Compostable/Soiled Paper 6.3% 52.4% 1,517
Other Film 5.9% 58.2% 1,399
Mixed Low-grade Paper 4.3% 62.6% 1,032
Mixed/Other Paper 2.5% 65.0% 590
Textiles/Clothing 2.4% 67.5% 585
Miscellaneous Organics 2.0% 69.5% 483
Newspaper 2.0% 71.5% 478
Total 71.5%
17,087
4.3.2 Collection Zone 2
During the calendar year 2014, 90 loads were sampled in Zone 2. Seattle’s Zone 2 residents disposed of approximately 20,111 tons in 2014. Food accounted for nearly 29% of this waste, by weight. Animal by-products, disposable diapers, other film, and compostable/soiled paper each accounted for more than 6% of the total disposed waste for Zone 2. The top ten components summed to over 73% of the total waste disposed in this zone and represented about 14,695 tons in 2014. The full composition results for Zone 2 are listed in Table 4-11.
Table 4-7: Top Ten Components – Zone 2 (January – December 2014)
Est. Cum. Est.
Material Percent Percent Tons
Food 28.8% 28.8% 5,785
Animal By-products 10.2% 39.0% 2,050
Disposable Diapers 7.8% 46.7% 1,563
Other Film 6.3% 53.0% 1,261
Compostable/Soiled Paper 6.1% 59.1% 1,225
Mixed Low-grade Paper 4.4% 63.5% 880
Mixed/Other Paper 2.8% 66.3% 571
Textiles/Clothing 2.8% 69.1% 558
Newspaper 2.1% 71.2% 429
Carpet 1.8% 73.1% 371
Total 73.1% 14,695

Cascadia Consulting Group, Inc. 23 Waste Stream Composition Study: 2014 FINAL Report
4.3.3 Collection Zone 3
During the calendar year 2014, 91 loads were sampled in Zone 3. Seattle’s Zone 3 residents disposed of approximately 36,513 tons in 2014. Food accounted for over 30% of this waste, by weight. Animal by-products, disposable diapers, and compostable/soiled paper each accounted for 6% or more of the total disposed waste for Zone 3. The top ten components summed to nearly 73% and represented 26,578 tons of the annual waste disposed. The full composition results for Zone 3 are listed in Table 4-12.
Table 4-8: Top Ten Components – Zone 3 (January – December 2014)
Est. Cum. Est.
Material Percent Percent Tons
Food 30.3% 30.3% 11,050
Animal By-products 10.6% 40.8% 3,864
Disposable Diapers 6.6% 47.4% 2,405
Compostable/Soiled Paper 6.4% 53.8% 2,336
Other Film 5.3% 59.1% 1,931
Mixed Low-grade Paper 4.3% 63.4% 1,581
Textiles/Clothing 3.0% 66.4% 1,088
Newspaper 2.4% 68.9% 891
Mixed/Other Paper 2.4% 71.2% 865
Miscellaneous Organics 1.6% 72.8% 568
Total 72.8%
26,578
4.3.4 Collection Zone 4
During the calendar year 2014, 89 loads were sampled from Zone 4. Seattle’s Zone 4 residents disposed of approximately 31,715 tons in 2014. Food accounted for about 31% of this waste, by weight. Animal by-products, disposable diapers, and compostable/soiled paper each accounted for more than 6% of the total disposed waste for Zone 4. The top ten components summed to more than 75% and represented 23,823 tons of the annual waste disposed. The full composition results for Zone 4 are listed in Table 4-13.
Table 4-9: Top Ten Components – Zone 4 (January – December 2014)
Est. Cum. Est.
Material Percent Percent Tons
Food 30.6% 30.6% 9,713
Animal By-products 10.8% 41.5% 3,435
Disposable Diapers 8.2% 49.7% 2,611
Compostable/Soiled Paper 6.6% 56.3% 2,091
Other Film 5.6% 61.9% 1,792
Mixed Low-grade Paper 4.1% 66.1% 1,313
Textiles/Clothing 3.1% 69.1% 976
Mixed/Other Paper 2.2% 71.4% 701
Newspaper 2.1% 73.5% 679
Miscellaneous Organics 1.6% 75.1% 513
Total 75.1% 23,823

Cascadia Consulting Group, Inc. 24 Waste Stream Composition Study: 2014 FINAL Report
4.3.5 Detailed Composition Comparisons among Collection Zones
In all four collection zones, food, animal by-products, and disposable diapers were the first, second, and third largest (respectively) components of waste. While other film was the fourth largest component for Zone 2, compostable/soiled paper was the fourth largest component for Zones 1, 2, and 4. Seven of the components were common to the top ten lists from all four zones: food, animal by-products, disposable diapers, compostable/soiled paper, mixed low-grade paper, other plastic film, and textiles/clothing. Three of the zones (Zones 1, 3, and 4) also shared miscellaneous organics as a top ten component. Zone 2 was the only area in which carpet made the top ten list.

Cascadia Consulting Group, Inc. 25 Waste Stream Composition Study: 2014 FINAL Report
Table 4-10: Composition by Weight – Zone 1 (January – December 2014)
Est. Est. Est. Est.
Material Percent + / - Tons Percent + / - Tons
Paper 20.5% 4,904 Appliances and Electronics 0.9% 210
Newspaper 2.0% 0.3% 478 Furniture 0.2% 0.3% 52
Plain OCC/Kraft 1.3% 0.4% 303 Mattresses 0.1% 0.2% 24
Waxed OCC 0.1% 0.1% 34 Small Appliances 0.3% 0.2% 65
Grocery/Shopping Bags 0.6% 0.1% 142 Cell Phones 0.0% 0.0% 1
High-grade Paper 1.5% 0.4% 356 Audio/Visual Equipment 0.1% 0.1% 17
Mixed Low-grade Paper 4.3% 0.4% 1,032 CRT Monitors 0.0% 0.0% 0
Polycoated Containers 1.0% 1.0% 236 CRT Televisions 0.0% 0.0% 0
Compostable/Soiled 6.3% 0.5% 1,517 Other Electronics 0.2% 0.1% 51
Pot. Comp. Single-use Food Service 0.6% 0.1% 139
Non-Comp. Single-use Food Service 0.3% 0.1% 78 CDL Wastes 5.1% 1,227
Mixed/Other Paper 2.5% 0.4% 590 Clean Dimension Lumber 0.4% 0.2% 88
Clean Engineered Wood 0.2% 0.1% 47
Plastic 11.6% 2,781 Pallets 0.0% 0.0% 7
#1 PET Bottles 0.5% 0.1% 118 Crates 0.0% 0.0% 0
#2 HDPE Natural Bottles 0.2% 0.1% 42 Other Untreated Wood 0.4% 0.2% 89
#2 HDPE Colored Bottles 0.3% 0.0% 67 New Painted Wood 0.3% 0.1% 65
Other Bottles 0.2% 0.1% 41 Old Painted Wood 0.5% 0.3% 121
Tubs 0.4% 0.1% 88 Creosote-treated Wood 0.0% 0.0% 8
Expanded Poly. Non-food 0.2% 0.1% 41 Other Treated Wood 0.1% 0.1% 28
Expanded Poly. Food-grade 0.2% 0.1% 51 Contaminated Wood 0.6% 0.3% 155
Rigid Poly. Foam Insulation 0.1% 0.1% 21 New Gypsum Scrap 0.0% 0.0% 4
Pot. Comp. Single-use Food Service 0.2% 0.1% 41 Demo Gypsum Scrap 0.2% 0.2% 46
Non-Comp. Single-use Food Service 0.2% 0.1% 57 Carpet 1.1% 0.5% 258
Other Rigid Packaging 1.0% 0.2% 229 Felt Carpet Pad 0.0% 0.0% 2
Shopping/Dry Cleaning Bags 0.2% 0.0% 41 Fiberglass Insulation 0.0% 0.0% 6
Stretch Wrap 0.0% 0.0% 7 Concrete 0.2% 0.2% 39
Clean Polyethylene Film 0.1% 0.1% 27 Asphalt Paving 0.0% 0.0% 0
Other Film 5.9% 0.4% 1,399 Other Aggregates 0.0% 0.0% 2
Plastic Pipe 0.0% 0.1% 11 Rock 0.1% 0.1% 21
Foam Carpet Padding 0.2% 0.2% 43 Asphalt Shingles 0.2% 0.2% 41
Durable Plastic Products 1.2% 0.2% 278 Other Asphaltic Roofing 0.0% 0.1% 8
Plastic/Other Materials 0.8% 0.2% 180 Ceramics 0.3% 0.1% 72
Cement Fiber Board 0.0% 0.0% 0
Glass 2.0% 485 Single-ply Roofing Membranes 0.1% 0.1% 13
Clear Bottles 0.5% 0.1% 126 Ceiling Tiles 0.1% 0.1% 15
Green Bottles 0.4% 0.1% 98 Other Construction 0.4% 0.3% 91
Brown Bottles 0.4% 0.1% 94
Container Glass 0.3% 0.1% 60 Hazardous 0.7% 158
Fluorescent Tubes 0.0% 0.0% 1 Dried Latex Paint 0.0% 0.0% 11
CFLs 0.0% 0.0% 2 Liquid Latex Paint 0.1% 0.1% 29
Flat Glass 0.1% 0.1% 29 Solvent-based Adhesives 0.0% 0.0% 3
Automotive Glass 0.0% 0.0% 0 Water-based Adhesives 0.0% 0.0% 4
Other Glass 0.3% 0.1% 75 Oil-based Paint/Thinners 0.0% 0.0% 6
Caustic Cleaners 0.0% 0.0% 10
Metal 3.6% 856 Pesticides/Herbicides 0.0% 0.0% 7
Aluminum Beverage Cans 0.3% 0.1% 79 Rechargeable Batteries 0.0% 0.0% 0
Aluminum Foil/Containers 0.2% 0.0% 56 Other Dry-cell Batteries 0.0% 0.0% 10
Other Aluminum 0.1% 0.0% 29 Wet-cell Batteries 0.0% 0.0% 1
Other Nonferrous 0.4% 0.4% 101 Gasoline/Kerosene 0.0% 0.0% 0
Steel Food Cans 0.6% 0.2% 141 Motor Oil/Diesel Oil 0.0% 0.0% 1
Empty Aerosol Cans 0.1% 0.0% 29 Asbestos 0.0% 0.0% 0
Other Ferrous 0.4% 0.1% 97 Explosives 0.0% 0.0% 0
Oil filters 0.0% 0.0% 2 Medical Wastes 0.0% 0.0% 11
Mixed Metals/Material 1.3% 0.3% 321 Other Cleaners/Chemicals 0.1% 0.1% 18
Pharmaceuticals/Vitamins 0.0% 0.0% 5
Organics 52.3% 12,493 Cosmetics 0.1% 0.0% 21
Leaves and Grass 1.2% 0.9% 297 Other Potentially Harmful Waste 0.1% 0.1% 20
Prunings 0.3% 0.3% 72
Food 27.5% 1.4% 6,565 Fines and Misc Materials 3.3% 784
Fats, Oils, Grease 0.2% 0.2% 46 Sand/Soil/Dirt 0.9% 0.4% 214
Textiles/Clothing 2.4% 0.4% 585 Non-distinct Fines 0.3% 0.2% 64
Mixed Textiles 1.3% 0.3% 300 Miscellaneous Organics 2.0% 0.5% 483
Disposable Diapers 7.3% 0.9% 1,735 Miscellaneous Inorganics 0.1% 0.1% 24
Animal By-products 11.3% 1.1% 2,705
Rubber Products 0.8% 0.3% 185
Tires 0.0% 0.0% 4 Totals 100% 23,899
Sample Count 92
Confidence intervals calculated at the 90% confidence level. Percentages for material types may not total 100% due to rounding.

Cascadia Consulting Group, Inc. 26 Waste Stream Composition Study: 2014 FINAL Report
Table 4-11: Composition by Weight – Zone 2 (January – December 2014)
Est. Est. Est. Est.
Material Percent + / - Tons Percent + / - Tons
Paper 20.6% 4,135 Appliances and Electronics 1.1% 224
Newspaper 2.1% 0.4% 429 Furniture 0.7% 0.6% 132
Plain OCC/Kraft 1.0% 0.2% 207 Mattresses 0.0% 0.0% 0
Waxed OCC 0.1% 0.1% 20 Small Appliances 0.2% 0.1% 35
Grocery/Shopping Bags 0.7% 0.1% 134 Cell Phones 0.0% 0.0% 1
High-grade Paper 1.5% 0.4% 309 Audio/Visual Equipment 0.0% 0.0% 5
Mixed Low-grade Paper 4.4% 0.5% 880 CRT Monitors 0.0% 0.0% 0
Polycoated Containers 0.4% 0.1% 84 CRT Televisions 0.0% 0.0% 0
Compostable/Soiled 6.1% 0.6% 1,225 Other Electronics 0.3% 0.3% 51
Pot. Comp. Single-use Food Service 0.9% 0.3% 189
Non-Comp. Single-use Food Service 0.4% 0.1% 87 CDL Wastes 5.3% 1,059
Mixed/Other Paper 2.8% 0.5% 571 Clean Dimension Lumber 0.2% 0.1% 35
Clean Engineered Wood 0.2% 0.1% 38
Plastic 12.1% 2,429 Pallets 0.0% 0.0% 0
#1 PET Bottles 0.6% 0.1% 126 Crates 0.0% 0.0% 0
#2 HDPE Natural Bottles 0.2% 0.0% 32 Other Untreated Wood 0.3% 0.2% 56
#2 HDPE Colored Bottles 0.3% 0.0% 50 New Painted Wood 0.3% 0.2% 63
Other Bottles 0.1% 0.0% 18 Old Painted Wood 0.1% 0.1% 19
Tubs 0.4% 0.1% 76 Creosote-treated Wood 0.1% 0.2% 25
Expanded Poly. Non-food 0.2% 0.1% 36 Other Treated Wood 0.1% 0.1% 26
Expanded Poly. Food-grade 0.2% 0.0% 38 Contaminated Wood 0.5% 0.3% 93
Rigid Poly. Foam Insulation 0.1% 0.0% 11 New Gypsum Scrap 0.0% 0.0% 4
Pot. Comp. Single-use Food Service 0.3% 0.1% 54 Demo Gypsum Scrap 0.7% 0.5% 140
Non-Comp. Single-use Food Service 0.2% 0.1% 42 Carpet 1.8% 0.9% 371
Other Rigid Packaging 1.2% 0.2% 232 Felt Carpet Pad 0.0% 0.1% 7
Shopping/Dry Cleaning Bags 0.2% 0.0% 37 Fiberglass Insulation 0.0% 0.0% 3
Stretch Wrap 0.0% 0.0% 5 Concrete 0.0% 0.0% 8
Clean Polyethylene Film 0.1% 0.1% 26 Asphalt Paving 0.0% 0.0% 0
Other Film 6.3% 0.5% 1,261 Other Aggregates 0.0% 0.0% 3
Plastic Pipe 0.0% 0.0% 1 Rock 0.0% 0.0% 2
Foam Carpet Padding 0.2% 0.2% 47 Asphalt Shingles 0.0% 0.0% 0
Durable Plastic Products 1.1% 0.3% 218 Other Asphaltic Roofing 0.0% 0.0% 0
Plastic/Other Materials 0.6% 0.1% 120 Ceramics 0.3% 0.1% 58
Cement Fiber Board 0.0% 0.0% 0
Glass 2.4% 478 Single-ply Roofing Membranes 0.0% 0.0% 0
Clear Bottles 0.6% 0.1% 117 Ceiling Tiles 0.0% 0.1% 8
Green Bottles 0.2% 0.1% 50 Other Construction 0.5% 0.4% 103
Brown Bottles 0.5% 0.1% 97
Container Glass 0.3% 0.1% 68 Hazardous 0.7% 133
Fluorescent Tubes 0.0% 0.0% 2 Dried Latex Paint 0.1% 0.1% 13
CFLs 0.0% 0.0% 1 Liquid Latex Paint 0.1% 0.1% 28
Flat Glass 0.1% 0.1% 21 Solvent-based Adhesives 0.0% 0.0% 0
Automotive Glass 0.1% 0.1% 14 Water-based Adhesives 0.0% 0.0% 4
Other Glass 0.5% 0.4% 107 Oil-based Paint/Thinners 0.0% 0.0% 7
Caustic Cleaners 0.0% 0.0% 1
Metal 2.9% 591 Pesticides/Herbicides 0.0% 0.0% 2
Aluminum Beverage Cans 0.3% 0.0% 55 Rechargeable Batteries 0.0% 0.0% 1
Aluminum Foil/Containers 0.3% 0.0% 52 Other Dry-cell Batteries 0.0% 0.0% 6
Other Aluminum 0.1% 0.0% 24 Wet-cell Batteries 0.0% 0.0% 2
Other Nonferrous 0.1% 0.1% 27 Gasoline/Kerosene 0.0% 0.0% 0
Steel Food Cans 0.6% 0.1% 113 Motor Oil/Diesel Oil 0.0% 0.0% 1
Empty Aerosol Cans 0.1% 0.1% 22 Asbestos 0.0% 0.0% 0
Other Ferrous 0.5% 0.1% 95 Explosives 0.0% 0.0% 0
Oil filters 0.0% 0.0% 0 Medical Wastes 0.1% 0.0% 13
Mixed Metals/Material 1.0% 0.3% 202 Other Cleaners/Chemicals 0.0% 0.0% 3
Pharmaceuticals/Vitamins 0.0% 0.0% 6
Organics 52.4% 10,545 Cosmetics 0.2% 0.1% 33
Leaves and Grass 1.1% 0.6% 214 Other Potentially Harmful Waste 0.1% 0.0% 13
Prunings 0.4% 0.3% 75
Food 28.8% 1.2% 5,785 Fines and Misc Materials 2.6% 516
Fats, Oils, Grease 0.1% 0.1% 14 Sand/Soil/Dirt 0.3% 0.2% 70
Textiles/Clothing 2.8% 0.3% 558 Non-distinct Fines 0.3% 0.2% 59
Mixed Textiles 1.0% 0.3% 196 Miscellaneous Organics 1.7% 0.5% 336
Disposable Diapers 7.8% 0.8% 1,563 Miscellaneous Inorganics 0.3% 0.1% 52
Animal By-products 10.2% 0.8% 2,050
Rubber Products 0.4% 0.2% 88
Tires 0.0% 0.0% 1 Totals 100% 20,111
Sample Count 90
Confidence intervals calculated at the 90% confidence level. Percentages for material types may not total 100% due to rounding.

Cascadia Consulting Group, Inc. 27 Waste Stream Composition Study: 2014 FINAL Report
Table 4-12: Composition by Weight – Zone 3 (January – December 2014)
Est. Est. Est. Est.
Material Percent + / - Tons Percent + / - Tons
Paper 20.7% 7,549 Appliances and Electronics 0.7% 250
Newspaper 2.4% 0.4% 891 Furniture 0.1% 0.2% 40
Plain OCC/Kraft 1.4% 0.3% 499 Mattresses 0.3% 0.4% 96
Waxed OCC 0.2% 0.1% 59 Small Appliances 0.3% 0.2% 93
Grocery/Shopping Bags 1.0% 0.2% 365 Cell Phones 0.0% 0.0% 0
High-grade Paper 1.5% 0.3% 559 Audio/Visual Equipment 0.0% 0.0% 7
Mixed Low-grade Paper 4.3% 0.4% 1,581 CRT Monitors 0.0% 0.0% 0
Polycoated Containers 0.3% 0.0% 94 CRT Televisions 0.0% 0.0% 0
Compostable/Soiled 6.4% 0.4% 2,336 Other Electronics 0.0% 0.0% 15
Pot. Comp. Single-use Food Service 0.6% 0.1% 202
Non-Comp. Single-use Food Service 0.3% 0.1% 99 CDL Wastes 4.4% 1,594
Mixed/Other Paper 2.4% 0.4% 865 Clean Dimension Lumber 0.2% 0.1% 81
Clean Engineered Wood 0.1% 0.1% 54
Plastic 11.7% 4,268 Pallets 0.0% 0.0% 1
#1 PET Bottles 0.7% 0.1% 239 Crates 0.0% 0.0% 2
#2 HDPE Natural Bottles 0.2% 0.1% 84 Other Untreated Wood 0.3% 0.1% 102
#2 HDPE Colored Bottles 0.3% 0.1% 101 New Painted Wood 0.2% 0.2% 81
Other Bottles 0.2% 0.0% 56 Old Painted Wood 0.3% 0.2% 100
Tubs 0.4% 0.1% 164 Creosote-treated Wood 0.0% 0.0% 5
Expanded Poly. Non-food 0.1% 0.0% 47 Other Treated Wood 0.3% 0.2% 99
Expanded Poly. Food-grade 0.1% 0.0% 54 Contaminated Wood 0.4% 0.2% 145
Rigid Poly. Foam Insulation 0.1% 0.0% 21 New Gypsum Scrap 0.0% 0.0% 10
Pot. Comp. Single-use Food Service 0.1% 0.0% 43 Demo Gypsum Scrap 0.3% 0.2% 92
Non-Comp. Single-use Food Service 0.3% 0.1% 115 Carpet 1.1% 0.6% 401
Other Rigid Packaging 1.2% 0.2% 427 Felt Carpet Pad 0.0% 0.0% 0
Shopping/Dry Cleaning Bags 0.2% 0.0% 86 Fiberglass Insulation 0.2% 0.2% 57
Stretch Wrap 0.1% 0.1% 33 Concrete 0.3% 0.4% 113
Clean Polyethylene Film 0.4% 0.4% 153 Asphalt Paving 0.0% 0.0% 0
Other Film 5.3% 0.4% 1,931 Other Aggregates 0.0% 0.0% 0
Plastic Pipe 0.0% 0.1% 17 Rock 0.1% 0.1% 30
Foam Carpet Padding 0.2% 0.2% 81 Asphalt Shingles 0.0% 0.0% 1
Durable Plastic Products 0.9% 0.2% 312 Other Asphaltic Roofing 0.0% 0.0% 6
Plastic/Other Materials 0.8% 0.2% 304 Ceramics 0.4% 0.2% 133
Cement Fiber Board 0.0% 0.1% 15
Glass 2.7% 973 Single-ply Roofing Membranes 0.0% 0.0% 0
Clear Bottles 0.8% 0.1% 285 Ceiling Tiles 0.0% 0.0% 0
Green Bottles 0.6% 0.1% 205 Other Construction 0.2% 0.2% 66
Brown Bottles 0.7% 0.2% 260
Container Glass 0.3% 0.1% 115 Hazardous 0.3% 122
Fluorescent Tubes 0.1% 0.1% 20 Dried Latex Paint 0.0% 0.0% 7
CFLs 0.0% 0.0% 2 Liquid Latex Paint 0.1% 0.1% 20
Flat Glass 0.0% 0.0% 6 Solvent-based Adhesives 0.0% 0.0% 2
Automotive Glass 0.0% 0.0% 0 Water-based Adhesives 0.0% 0.0% 5
Other Glass 0.2% 0.1% 78 Oil-based Paint/Thinners 0.0% 0.0% 6
Caustic Cleaners 0.0% 0.0% 8
Metal 3.3% 1,214 Pesticides/Herbicides 0.0% 0.0% 3
Aluminum Beverage Cans 0.4% 0.1% 163 Rechargeable Batteries 0.0% 0.0% 1
Aluminum Foil/Containers 0.3% 0.1% 104 Other Dry-cell Batteries 0.0% 0.0% 7
Other Aluminum 0.1% 0.0% 28 Wet-cell Batteries 0.0% 0.0% 0
Other Nonferrous 0.3% 0.2% 111 Gasoline/Kerosene 0.0% 0.0% 0
Steel Food Cans 0.5% 0.1% 199 Motor Oil/Diesel Oil 0.0% 0.0% 3
Empty Aerosol Cans 0.1% 0.0% 38 Asbestos 0.0% 0.0% 0
Other Ferrous 0.6% 0.2% 212 Explosives 0.0% 0.0% 0
Oil filters 0.0% 0.0% 1 Medical Wastes 0.1% 0.0% 19
Mixed Metals/Material 1.0% 0.3% 359 Other Cleaners/Chemicals 0.0% 0.0% 3
Pharmaceuticals/Vitamins 0.0% 0.0% 10
Organics 53.6% 19,578 Cosmetics 0.1% 0.0% 25
Leaves and Grass 1.0% 0.4% 383 Other Potentially Harmful Waste 0.0% 0.0% 4
Prunings 0.4% 0.2% 149
Food 30.3% 1.0% 11,050 Fines and Misc Materials 2.6% 964
Fats, Oils, Grease 0.0% 0.0% 1 Sand/Soil/Dirt 0.6% 0.4% 228
Textiles/Clothing 3.0% 0.5% 1,088 Non-distinct Fines 0.2% 0.2% 89
Mixed Textiles 1.3% 0.2% 473 Miscellaneous Organics 1.6% 0.3% 568
Disposable Diapers 6.6% 0.6% 2,405 Miscellaneous Inorganics 0.2% 0.1% 79
Animal By-products 10.6% 1.1% 3,864
Rubber Products 0.4% 0.1% 161
Tires 0.0% 0.0% 5 Totals 100% 36,513
Sample Count 91
Confidence intervals calculated at the 90% confidence level. Percentages for material types may not total 100% due to rounding.

Cascadia Consulting Group, Inc. 28 Waste Stream Composition Study: 2014 FINAL Report
Table 4-13: Composition by Weight – Zone 4 (January – December 2014)
Est. Est. Est. Est.
Material Percent + / - Tons Percent + / - Tons
Paper 19.4% 6,140 Appliances and Electronics 1.2% 367
Newspaper 2.1% 0.3% 679 Furniture 0.4% 0.3% 114
Plain OCC/Kraft 1.1% 0.3% 364 Mattresses 0.0% 0.0% 0
Waxed OCC 0.2% 0.1% 64 Small Appliances 0.4% 0.3% 140
Grocery/Shopping Bags 0.5% 0.1% 173 Cell Phones 0.0% 0.0% 2
High-grade Paper 1.1% 0.3% 345 Audio/Visual Equipment 0.1% 0.1% 33
Mixed Low-grade Paper 4.1% 0.5% 1,313 CRT Monitors 0.0% 0.0% 0
Polycoated Containers 0.4% 0.2% 120 CRT Televisions 0.1% 0.1% 24
Compostable/Soiled 6.6% 0.5% 2,091 Other Electronics 0.2% 0.1% 54
Pot. Comp. Single-use Food Service 0.5% 0.1% 167
Non-Comp. Single-use Food Service 0.4% 0.1% 124 CDL Wastes 4.2% 1,332
Mixed/Other Paper 2.2% 0.4% 701 Clean Dimension Lumber 0.2% 0.1% 64
Clean Engineered Wood 0.2% 0.1% 65
Plastic 10.9% 3,467 Pallets 0.0% 0.0% 1
#1 PET Bottles 0.7% 0.1% 207 Crates 0.0% 0.0% 0
#2 HDPE Natural Bottles 0.2% 0.0% 58 Other Untreated Wood 0.3% 0.3% 84
#2 HDPE Colored Bottles 0.2% 0.0% 70 New Painted Wood 0.5% 0.3% 154
Other Bottles 0.1% 0.1% 31 Old Painted Wood 0.6% 0.5% 205
Tubs 0.4% 0.1% 115 Creosote-treated Wood 0.0% 0.0% 4
Expanded Poly. Non-food 0.2% 0.0% 48 Other Treated Wood 0.1% 0.1% 28
Expanded Poly. Food-grade 0.3% 0.0% 80 Contaminated Wood 0.7% 0.4% 206
Rigid Poly. Foam Insulation 0.1% 0.1% 27 New Gypsum Scrap 0.2% 0.2% 58
Pot. Comp. Single-use Food Service 0.2% 0.1% 55 Demo Gypsum Scrap 0.3% 0.3% 104
Non-Comp. Single-use Food Service 0.2% 0.1% 77 Carpet 0.4% 0.2% 136
Other Rigid Packaging 1.0% 0.1% 307 Felt Carpet Pad 0.0% 0.1% 15
Shopping/Dry Cleaning Bags 0.3% 0.1% 84 Fiberglass Insulation 0.0% 0.0% 4
Stretch Wrap 0.0% 0.0% 7 Concrete 0.0% 0.0% 11
Clean Polyethylene Film 0.1% 0.0% 18 Asphalt Paving 0.1% 0.1% 21
Other Film 5.6% 0.5% 1,792 Other Aggregates 0.0% 0.0% 1
Plastic Pipe 0.0% 0.0% 5 Rock 0.0% 0.0% 1
Foam Carpet Padding 0.0% 0.0% 14 Asphalt Shingles 0.0% 0.0% 1
Durable Plastic Products 0.8% 0.2% 261 Other Asphaltic Roofing 0.0% 0.0% 0
Plastic/Other Materials 0.7% 0.2% 213 Ceramics 0.2% 0.1% 54
Cement Fiber Board 0.0% 0.0% 0
Glass 2.1% 661 Single-ply Roofing Membranes 0.0% 0.0% 0
Clear Bottles 0.6% 0.1% 194 Ceiling Tiles 0.0% 0.0% 0
Green Bottles 0.4% 0.1% 116 Other Construction 0.4% 0.3% 113
Brown Bottles 0.4% 0.1% 140
Container Glass 0.4% 0.1% 117 Hazardous 0.6% 181
Fluorescent Tubes 0.0% 0.0% 1 Dried Latex Paint 0.2% 0.2% 49
CFLs 0.0% 0.0% 2 Liquid Latex Paint 0.1% 0.1% 32
Flat Glass 0.0% 0.0% 10 Solvent-based Adhesives 0.0% 0.0% 0
Automotive Glass 0.0% 0.0% 0 Water-based Adhesives 0.0% 0.0% 3
Other Glass 0.3% 0.1% 81 Oil-based Paint/Thinners 0.0% 0.0% 2
Caustic Cleaners 0.0% 0.0% 2
Metal 2.7% 861 Pesticides/Herbicides 0.0% 0.1% 10
Aluminum Beverage Cans 0.4% 0.1% 115 Rechargeable Batteries 0.0% 0.0% 1
Aluminum Foil/Containers 0.2% 0.0% 68 Other Dry-cell Batteries 0.0% 0.0% 8
Other Aluminum 0.1% 0.0% 35 Wet-cell Batteries 0.0% 0.0% 0
Other Nonferrous 0.2% 0.3% 68 Gasoline/Kerosene 0.0% 0.0% 0
Steel Food Cans 0.7% 0.1% 220 Motor Oil/Diesel Oil 0.0% 0.0% 1
Empty Aerosol Cans 0.1% 0.0% 36 Asbestos 0.0% 0.0% 0
Other Ferrous 0.4% 0.1% 115 Explosives 0.0% 0.0% 0
Oil filters 0.0% 0.0% 1 Medical Wastes 0.0% 0.0% 13
Mixed Metals/Material 0.6% 0.2% 202 Other Cleaners/Chemicals 0.0% 0.0% 5
Pharmaceuticals/Vitamins 0.0% 0.0% 9
Organics 56.1% 17,800 Cosmetics 0.1% 0.1% 34
Leaves and Grass 1.5% 0.8% 481 Other Potentially Harmful Waste 0.0% 0.0% 11
Prunings 0.3% 0.2% 83
Food 30.6% 1.3% 9,713 Fines and Misc Materials 2.9% 906
Fats, Oils, Grease 0.0% 0.0% 12 Sand/Soil/Dirt 0.8% 0.5% 266
Textiles/Clothing 3.1% 0.4% 976 Non-distinct Fines 0.2% 0.2% 74
Mixed Textiles 1.1% 0.3% 357 Miscellaneous Organics 1.6% 0.4% 513
Disposable Diapers 8.2% 0.7% 2,611 Miscellaneous Inorganics 0.2% 0.1% 53
Animal By-products 10.8% 1.2% 3,435
Rubber Products 0.3% 0.1% 107
Tires 0.1% 0.1% 26 Totals 100% 31,715
Sample Count 89
Confidence intervals calculated at the 90% confidence level. Percentages for material types may not total 100% due to rounding.
Cascadia Consulting Group, Inc. 29 Waste Stream Composition Study: 2014 FINAL Report
4.4 By Collection Zone and Residence Type: Single-family
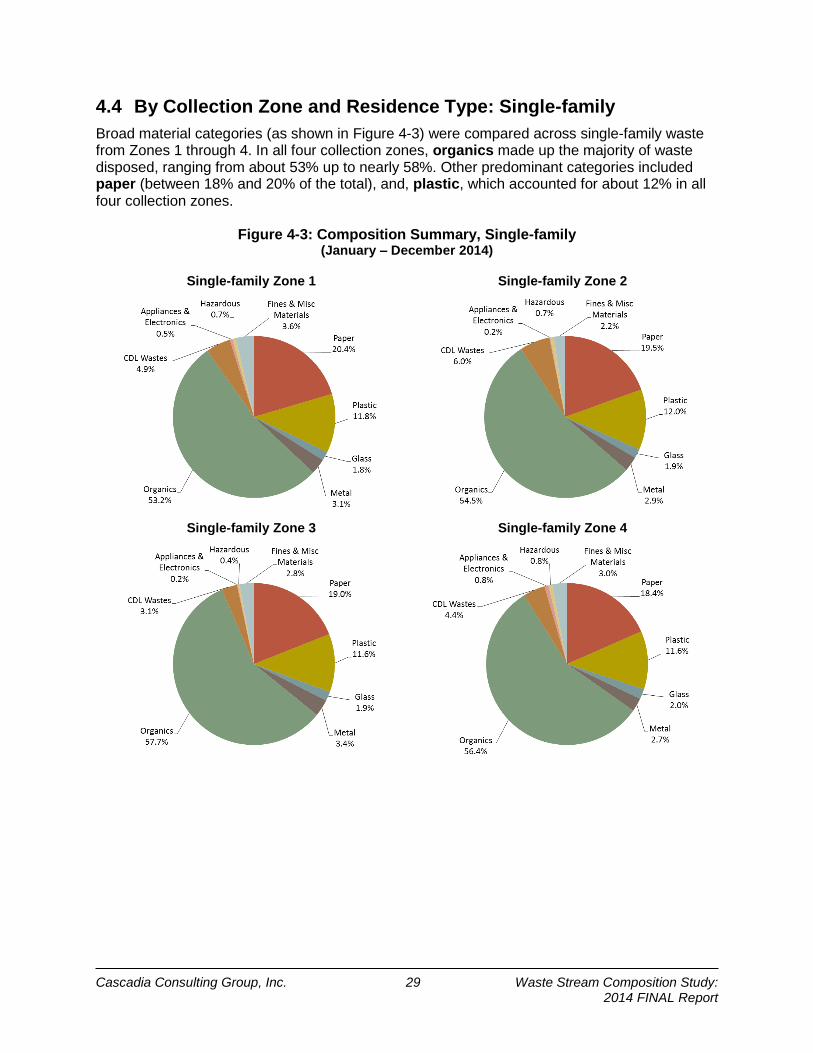
Broad material categories (as shown in Figure 4-3) were compared across single-family waste from Zones 1 through 4. In all four collection zones, organics made up the majority of waste disposed, ranging from about 53% up to nearly 58%. Other predominant categories included paper (between 18% and 20% of the total), and, plastic, which accounted for about 12% in all four collection zones.
Figure 4-3: Composition Summary, Single-family (January – December 2014)
Single-family Zone 1 Single-family Zone 2
Single-family Zone 3 Single-family Zone 4

Cascadia Consulting Group, Inc. 30 Waste Stream Composition Study: 2014 FINAL Report
4.4.1 Single-family Zone 1
A total of 47 samples were sorted from single-family Zone 1 waste loads. This subpopulation disposed of approximately 15,115 tons during the calendar year 2014. The top ten components for the single-family Zone 1 subpopulation accounted for about 74%, or 11,226 tons, of the annual waste disposed. Food was the largest component, at about 27% of the waste stream. Animal by-products (12.2%), disposable diapers (8.5%), compostable/soiled paper (6.5%), and other film (6.1%) were also large components. Table 4-18 details the full composition results for the single-family Zone 1 subpopulation.
Table 4-14: Top Ten Components – Single-family Zone 1 (January – December 2014)
Est. Cum. Est.
Material Percent Percent Tons
Food 27.2% 27.2% 4,116
Animal By-products 12.2% 39.4% 1,845
Disposable Diapers 8.5% 48.0% 1,290
Compostable/Soiled Paper 6.5% 54.4% 976
Other Film 6.1% 60.6% 926
Mixed Low-grade Paper 4.3% 64.9% 655
Textiles/Clothing 2.6% 67.5% 390
Miscellaneous Organics 2.4% 69.9% 366
Mixed/Other Paper 2.3% 72.2% 353
Newspaper 2.0% 74.3% 308
Total 74.3%
11,226
4.4.2 Single-family Zone 2
A total of 45 samples of waste were sorted from single-family Zone 2 loads. This subpopulation disposed of 11,160 tons of waste between January and December 2014. The top ten components for the single-family Zone 2 subpopulation accounted for 75%, or 8,406 tons, of the annual waste disposed. Food accounted for nearly 28%. Animal by-products (12.1%) and disposable diapers (9.0%) were also large components. Detailed composition results for the single-family Zone 2 subpopulation are listed in Table 4-19.
Table 4-15: Top Ten Components – Single-family Zone 2 (January – December 2014)
Est. Cum. Est.
Material Percent Percent Tons
Food 27.8% 27.8% 3,106
Animal By-products 12.1% 39.9% 1,351
Disposable Diapers 9.0% 48.9% 1,003
Other Film 6.5% 55.4% 726
Compostable/Soiled Paper 6.3% 61.7% 699
Mixed Low-grade Paper 3.7% 65.4% 414
Textiles/Clothing 2.8% 68.2% 313
Mixed/Other Paper 2.6% 70.8% 289
Carpet 2.4% 73.2% 268
Newspaper 2.1% 75.3% 237
Total 75.3% 8,406

Cascadia Consulting Group, Inc. 31 Waste Stream Composition Study: 2014 FINAL Report
4.4.3 Single-family Zone 3
A total of 45 samples were sorted from single-family Zone 3 loads. This subpopulation disposed of 13,468 tons of waste between January and December 2014. The top ten components for the single-family Zone 3 subpopulation accounted for nearly 78%, or 10,445 tons, of the annual waste disposed. Food accounted for approximately 29%. Animal by-products (13.2%), disposable diapers (8.8%), and compostable/soiled paper (6.5%) were also large components. The detailed composition results for single-family Zone 3 are listed in Table 4-20.
Table 4-16: Top Ten Components – Single-family Zone 3 (January – December 2014)
Est. Cum. Est.
Material Percent Percent Tons
Food 29.3% 29.3% 3,945
Animal By-products 13.2% 42.5% 1,784
Disposable Diapers 8.8% 51.3% 1,185
Compostable/Soiled Paper 6.5% 57.9% 881
Other Film 6.1% 63.9% 817
Mixed Low-grade Paper 3.9% 67.9% 529
Textiles/Clothing 3.1% 71.0% 415
Mixed/Other Paper 2.5% 73.4% 331
Newspaper 2.3% 75.7% 307
Miscellaneous Organics 1.9% 77.6% 251
Total 77.6%
10,445
4.4.4 Single-family Zone 4
A total of 45 samples were taken from single-family Zone 4 loads. This subpopulation disposed of 20,363 tons of waste between January and December 2014. The top ten components for the single-family Zone 4 subpopulation accounted for about 77%, or 15,742 tons, of the annual waste disposed. The most prevalent component, food, accounted for about 29% by weight. Animal by-products (12.4%), disposable diapers (9.6%), and compostable/soiled paper (7.2%) were also large components. The detailed composition results for the single-family Zone 4 subpopulation are listed in Table 4-21.
Table 4-17: Top Ten Components – Single-family Zone 4 (January – December 2014)
Est. Cum. Est.
Material Percent Percent Tons
Food 29.1% 29.1% 5,924
Animal By-products 12.4% 41.5% 2,521
Disposable Diapers 9.6% 51.1% 1,960
Compostable/Soiled Paper 7.2% 58.3% 1,458
Other Film 6.3% 64.5% 1,274
Mixed Low-grade Paper 3.6% 68.1% 735
Textiles/Clothing 3.2% 71.3% 649
Mixed/Other Paper 2.4% 73.7% 489
Newspaper 2.0% 75.7% 403
Miscellaneous Organics 1.6% 77.3% 329
Total 77.3% 15,742

Cascadia Consulting Group, Inc. 32 Waste Stream Composition Study: 2014 FINAL Report
4.4.5 Detailed Composition Comparisons among Single-family Zones 1 through 4
At around 30%, food was the largest component of waste from all four zones, followed by animal by-products and disposable diapers. Compostable/soiled paper was the fourth largest component for Zones 1, 3, and 4. The fourth largest component in Zone 2 was other film. Nine of the top ten components are common to all four top ten lists: food, animal by-products, disposable diapers, compostable/soiled paper, mixed low-grade paper, other plastic film, textiles/clothing, mixed/other paper, and newspaper. Zones 1, 3, and 4 had miscellaneous organics as the remaining top ten component, while it was newspaper in Zone 2.

Cascadia Consulting Group, Inc. 33 Waste Stream Composition Study: 2014 FINAL Report
Table 4-18: Composition by Weight – Single-family Zone 1 (January – December 2014)
Est. Est. Est. Est.
Material Percent + / - Tons Percent + / - Tons
Paper 20.4% 3,084 Appliances and Electronics 0.5% 80
Newspaper 2.0% 0.5% 308 Furniture 0.1% 0.1% 9
Plain OCC/Kraft 0.8% 0.3% 118 Mattresses 0.2% 0.3% 24
Waxed OCC 0.0% 0.0% 5 Small Appliances 0.2% 0.2% 37
Grocery/Shopping Bags 0.6% 0.2% 88 Cell Phones 0.0% 0.0% 1
High-grade Paper 1.7% 0.5% 251 Audio/Visual Equipment 0.0% 0.0% 4
Mixed Low-grade Paper 4.3% 0.6% 655 CRT Monitors 0.0% 0.0% 0
Polycoated Containers 1.4% 1.5% 210 CRT Televisions 0.0% 0.0% 0
Compostable/Soiled 6.5% 0.5% 976 Other Electronics 0.0% 0.0% 6
Pot. Comp. Single-use Food Service 0.5% 0.1% 81
Non-Comp. Single-use Food Service 0.3% 0.1% 39 CDL Wastes 4.9% 744
Mixed/Other Paper 2.3% 0.5% 353 Clean Dimension Lumber 0.4% 0.3% 64
Clean Engineered Wood 0.1% 0.2% 20
Plastic 11.8% 1,776 Pallets 0.0% 0.0% 0
#1 PET Bottles 0.4% 0.1% 57 Crates 0.0% 0.0% 0
#2 HDPE Natural Bottles 0.1% 0.1% 22 Other Untreated Wood 0.1% 0.1% 21
#2 HDPE Colored Bottles 0.2% 0.1% 35 New Painted Wood 0.2% 0.2% 31
Other Bottles 0.2% 0.1% 27 Old Painted Wood 0.5% 0.4% 77
Tubs 0.4% 0.1% 54 Creosote-treated Wood 0.0% 0.0% 7
Expanded Poly. Non-food 0.1% 0.1% 20 Other Treated Wood 0.1% 0.1% 18
Expanded Poly. Food-grade 0.3% 0.1% 39 Contaminated Wood 0.8% 0.5% 118
Rigid Poly. Foam Insulation 0.1% 0.1% 10 New Gypsum Scrap 0.0% 0.0% 4
Pot. Comp. Single-use Food Service 0.2% 0.1% 30 Demo Gypsum Scrap 0.3% 0.2% 41
Non-Comp. Single-use Food Service 0.2% 0.1% 31 Carpet 0.8% 0.5% 122
Other Rigid Packaging 1.1% 0.3% 168 Felt Carpet Pad 0.0% 0.0% 2
Shopping/Dry Cleaning Bags 0.2% 0.1% 28 Fiberglass Insulation 0.0% 0.1% 5
Stretch Wrap 0.0% 0.0% 4 Concrete 0.1% 0.1% 11
Clean Polyethylene Film 0.1% 0.0% 10 Asphalt Paving 0.0% 0.0% 0
Other Film 6.1% 0.6% 926 Other Aggregates 0.0% 0.0% 0
Plastic Pipe 0.0% 0.0% 2 Rock 0.1% 0.1% 11
Foam Carpet Padding 0.2% 0.2% 24 Asphalt Shingles 0.3% 0.3% 41
Durable Plastic Products 1.1% 0.3% 173 Other Asphaltic Roofing 0.1% 0.1% 8
Plastic/Other Materials 0.8% 0.2% 118 Ceramics 0.3% 0.1% 43
Cement Fiber Board 0.0% 0.0% 0
Glass 1.8% 272 Single-ply Roofing Membranes 0.1% 0.1% 13
Clear Bottles 0.4% 0.2% 63 Ceiling Tiles 0.1% 0.2% 14
Green Bottles 0.4% 0.2% 62 Other Construction 0.5% 0.4% 73
Brown Bottles 0.3% 0.1% 49
Container Glass 0.3% 0.1% 38 Hazardous 0.7% 102
Fluorescent Tubes 0.0% 0.0% 1 Dried Latex Paint 0.0% 0.0% 3
CFLs 0.0% 0.0% 2 Liquid Latex Paint 0.2% 0.2% 27
Flat Glass 0.1% 0.2% 17 Solvent-based Adhesives 0.0% 0.0% 0
Automotive Glass 0.0% 0.0% 0 Water-based Adhesives 0.0% 0.0% 2
Other Glass 0.3% 0.1% 39 Oil-based Paint/Thinners 0.0% 0.0% 3
Caustic Cleaners 0.1% 0.1% 9
Metal 3.1% 466 Pesticides/Herbicides 0.0% 0.1% 6
Aluminum Beverage Cans 0.2% 0.1% 36 Rechargeable Batteries 0.0% 0.0% 0
Aluminum Foil/Containers 0.2% 0.0% 35 Other Dry-cell Batteries 0.1% 0.0% 8
Other Aluminum 0.1% 0.1% 20 Wet-cell Batteries 0.0% 0.0% 0
Other Nonferrous 0.3% 0.3% 41 Gasoline/Kerosene 0.0% 0.0% 0
Steel Food Cans 0.4% 0.1% 68 Motor Oil/Diesel Oil 0.0% 0.0% 0
Empty Aerosol Cans 0.1% 0.1% 22 Asbestos 0.0% 0.0% 0
Other Ferrous 0.5% 0.2% 72 Explosives 0.0% 0.0% 0
Oil filters 0.0% 0.0% 0 Medical Wastes 0.0% 0.1% 6
Mixed Metals/Material 1.1% 0.4% 173 Other Cleaners/Chemicals 0.0% 0.0% 4
Pharmaceuticals/Vitamins 0.0% 0.0% 5
Organics 53.2% 8,040 Cosmetics 0.1% 0.1% 16
Leaves and Grass 0.8% 0.6% 117 Other Potentially Harmful Waste 0.1% 0.1% 12
Prunings 0.0% 0.0% 4
Food 27.2% 1.9% 4,116 Fines and Misc Materials 3.6% 551
Fats, Oils, Grease 0.0% 0.0% 1 Sand/Soil/Dirt 0.8% 0.6% 124
Textiles/Clothing 2.6% 0.6% 390 Non-distinct Fines 0.3% 0.2% 41
Mixed Textiles 1.2% 0.4% 188 Miscellaneous Organics 2.4% 0.8% 366
Disposable Diapers 8.5% 1.3% 1,290 Miscellaneous Inorganics 0.1% 0.1% 19
Animal By-products 12.2% 1.5% 1,845
Rubber Products 0.6% 0.3% 84
Tires 0.0% 0.0% 4 Totals 100% 15,115
Sample Count 47
Confidence intervals calculated at the 90% confidence level. Percentages for material types may not total 100% due to rounding.

Cascadia Consulting Group, Inc. 34 Waste Stream Composition Study: 2014 FINAL Report
Table 4-19: Composition by Weight – Single-family Zone 2 (January – December 2014)
Est. Est. Est. Est.
Material Percent + / - Tons Percent + / - Tons
Paper 19.5% 2,176 Appliances and Electronics 0.2% 18
Newspaper 2.1% 0.6% 237 Furniture 0.0% 0.0% 0
Plain OCC/Kraft 0.7% 0.3% 80 Mattresses 0.0% 0.0% 0
Waxed OCC 0.0% 0.0% 3 Small Appliances 0.1% 0.1% 10
Grocery/Shopping Bags 0.6% 0.1% 67 Cell Phones 0.0% 0.0% 1
High-grade Paper 1.5% 0.5% 172 Audio/Visual Equipment 0.0% 0.0% 0
Mixed Low-grade Paper 3.7% 0.7% 414 CRT Monitors 0.0% 0.0% 0
Polycoated Containers 0.5% 0.3% 55 CRT Televisions 0.0% 0.0% 0
Compostable/Soiled 6.3% 0.7% 699 Other Electronics 0.1% 0.1% 7
Pot. Comp. Single-use Food Service 1.0% 0.4% 113
Non-Comp. Single-use Food Service 0.4% 0.2% 45 CDL Wastes 6.0% 673
Mixed/Other Paper 2.6% 0.5% 289 Clean Dimension Lumber 0.1% 0.1% 12
Clean Engineered Wood 0.2% 0.2% 27
Plastic 12.0% 1,344 Pallets 0.0% 0.0% 0
#1 PET Bottles 0.4% 0.1% 48 Crates 0.0% 0.0% 0
#2 HDPE Natural Bottles 0.1% 0.0% 14 Other Untreated Wood 0.2% 0.3% 21
#2 HDPE Colored Bottles 0.2% 0.0% 21 New Painted Wood 0.2% 0.1% 21
Other Bottles 0.1% 0.1% 10 Old Painted Wood 0.1% 0.2% 13
Tubs 0.4% 0.1% 42 Creosote-treated Wood 0.1% 0.0% 6
Expanded Poly. Non-food 0.2% 0.1% 21 Other Treated Wood 0.2% 0.2% 24
Expanded Poly. Food-grade 0.2% 0.1% 25 Contaminated Wood 0.5% 0.5% 59
Rigid Poly. Foam Insulation 0.1% 0.1% 6 New Gypsum Scrap 0.0% 0.0% 0
Pot. Comp. Single-use Food Service 0.2% 0.1% 20 Demo Gypsum Scrap 0.9% 0.8% 97
Non-Comp. Single-use Food Service 0.1% 0.1% 17 Carpet 2.4% 1.4% 268
Other Rigid Packaging 1.2% 0.2% 134 Felt Carpet Pad 0.0% 0.0% 1
Shopping/Dry Cleaning Bags 0.2% 0.0% 17 Fiberglass Insulation 0.0% 0.0% 2
Stretch Wrap 0.0% 0.0% 2 Concrete 0.1% 0.1% 8
Clean Polyethylene Film 0.2% 0.2% 23 Asphalt Paving 0.0% 0.0% 0
Other Film 6.5% 0.7% 726 Other Aggregates 0.0% 0.0% 1
Plastic Pipe 0.0% 0.0% 0 Rock 0.0% 0.0% 2
Foam Carpet Padding 0.2% 0.3% 21 Asphalt Shingles 0.0% 0.0% 0
Durable Plastic Products 1.2% 0.4% 131 Other Asphaltic Roofing 0.0% 0.0% 0
Plastic/Other Materials 0.6% 0.2% 64 Ceramics 0.3% 0.2% 34
Cement Fiber Board 0.0% 0.0% 0
Glass 1.9% 210 Single-ply Roofing Membranes 0.0% 0.0% 0
Clear Bottles 0.6% 0.2% 65 Ceiling Tiles 0.1% 0.1% 8
Green Bottles 0.2% 0.1% 18 Other Construction 0.6% 0.7% 70
Brown Bottles 0.5% 0.2% 52
Container Glass 0.3% 0.1% 34 Hazardous 0.7% 82
Fluorescent Tubes 0.0% 0.0% 1 Dried Latex Paint 0.1% 0.1% 10
CFLs 0.0% 0.0% 1 Liquid Latex Paint 0.2% 0.2% 17
Flat Glass 0.1% 0.1% 7 Solvent-based Adhesives 0.0% 0.0% 0
Automotive Glass 0.0% 0.0% 0 Water-based Adhesives 0.0% 0.0% 4
Other Glass 0.3% 0.1% 33 Oil-based Paint/Thinners 0.0% 0.0% 4
Caustic Cleaners 0.0% 0.0% 1
Metal 2.9% 326 Pesticides/Herbicides 0.0% 0.0% 2
Aluminum Beverage Cans 0.2% 0.0% 20 Rechargeable Batteries 0.0% 0.0% 0
Aluminum Foil/Containers 0.3% 0.1% 31 Other Dry-cell Batteries 0.0% 0.0% 4
Other Aluminum 0.2% 0.1% 18 Wet-cell Batteries 0.0% 0.0% 0
Other Nonferrous 0.2% 0.1% 17 Gasoline/Kerosene 0.0% 0.0% 0
Steel Food Cans 0.5% 0.1% 51 Motor Oil/Diesel Oil 0.0% 0.0% 1
Empty Aerosol Cans 0.1% 0.1% 15 Asbestos 0.0% 0.0% 0
Other Ferrous 0.4% 0.2% 45 Explosives 0.0% 0.0% 0
Oil filters 0.0% 0.0% 0 Medical Wastes 0.0% 0.0% 3
Mixed Metals/Material 1.2% 0.4% 130 Other Cleaners/Chemicals 0.0% 0.0% 2
Pharmaceuticals/Vitamins 0.0% 0.0% 2
Organics 54.5% 6,082 Cosmetics 0.2% 0.1% 20
Leaves and Grass 1.0% 1.0% 113 Other Potentially Harmful Waste 0.1% 0.1% 12
Prunings 0.2% 0.1% 20
Food 27.8% 1.7% 3,106 Fines and Misc Materials 2.2% 249
Fats, Oils, Grease 0.1% 0.2% 13 Sand/Soil/Dirt 0.1% 0.1% 14
Textiles/Clothing 2.8% 0.5% 313 Non-distinct Fines 0.2% 0.2% 25
Mixed Textiles 0.8% 0.3% 93 Miscellaneous Organics 1.6% 0.6% 174
Disposable Diapers 9.0% 1.1% 1,003 Miscellaneous Inorganics 0.3% 0.2% 36
Animal By-products 12.1% 1.4% 1,351
Rubber Products 0.6% 0.3% 72
Tires 0.0% 0.0% 0 Totals 100% 11,160
Sample Count 45
Confidence intervals calculated at the 90% confidence level. Percentages for material types may not total 100% due to rounding.

Cascadia Consulting Group, Inc. 35 Waste Stream Composition Study: 2014 FINAL Report
Table 4-20: Composition by Weight – Single-family Zone 3 (January – December 2014)
Est. Est. Est. Est.
Material Percent + / - Tons Percent + / - Tons
Paper 19.0% 2,559 Appliances and Electronics 0.2% 22
Newspaper 2.3% 0.6% 307 Furniture 0.0% 0.0% 0
Plain OCC/Kraft 1.0% 0.2% 130 Mattresses 0.0% 0.0% 0
Waxed OCC 0.0% 0.0% 2 Small Appliances 0.1% 0.2% 19
Grocery/Shopping Bags 0.7% 0.1% 92 Cell Phones 0.0% 0.0% 0
High-grade Paper 1.0% 0.3% 139 Audio/Visual Equipment 0.0% 0.0% 0
Mixed Low-grade Paper 3.9% 0.6% 529 CRT Monitors 0.0% 0.0% 0
Polycoated Containers 0.3% 0.1% 37 CRT Televisions 0.0% 0.0% 0
Compostable/Soiled 6.5% 0.7% 881 Other Electronics 0.0% 0.0% 4
Pot. Comp. Single-use Food Service 0.6% 0.1% 77
Non-Comp. Single-use Food Service 0.2% 0.1% 33 CDL Wastes 3.1% 420
Mixed/Other Paper 2.5% 0.6% 331 Clean Dimension Lumber 0.1% 0.1% 14
Clean Engineered Wood 0.1% 0.0% 8
Plastic 11.6% 1,563 Pallets 0.0% 0.0% 0
#1 PET Bottles 0.5% 0.1% 64 Crates 0.0% 0.0% 0
#2 HDPE Natural Bottles 0.2% 0.1% 22 Other Untreated Wood 0.3% 0.3% 45
#2 HDPE Colored Bottles 0.3% 0.1% 41 New Painted Wood 0.2% 0.2% 22
Other Bottles 0.2% 0.1% 22 Old Painted Wood 0.1% 0.1% 14
Tubs 0.4% 0.1% 57 Creosote-treated Wood 0.0% 0.0% 1
Expanded Poly. Non-food 0.2% 0.1% 23 Other Treated Wood 0.2% 0.2% 24
Expanded Poly. Food-grade 0.2% 0.0% 28 Contaminated Wood 0.3% 0.3% 38
Rigid Poly. Foam Insulation 0.1% 0.1% 17 New Gypsum Scrap 0.1% 0.1% 10
Pot. Comp. Single-use Food Service 0.1% 0.0% 17 Demo Gypsum Scrap 0.1% 0.2% 19
Non-Comp. Single-use Food Service 0.3% 0.1% 45 Carpet 0.7% 0.6% 89
Other Rigid Packaging 1.0% 0.2% 136 Felt Carpet Pad 0.0% 0.0% 0
Shopping/Dry Cleaning Bags 0.2% 0.1% 33 Fiberglass Insulation 0.1% 0.1% 9
Stretch Wrap 0.0% 0.0% 2 Concrete 0.3% 0.4% 35
Clean Polyethylene Film 0.1% 0.1% 13 Asphalt Paving 0.0% 0.0% 0
Other Film 6.1% 0.6% 817 Other Aggregates 0.0% 0.0% 0
Plastic Pipe 0.0% 0.0% 2 Rock 0.0% 0.0% 0
Foam Carpet Padding 0.2% 0.2% 21 Asphalt Shingles 0.0% 0.0% 1
Durable Plastic Products 0.9% 0.3% 119 Other Asphaltic Roofing 0.0% 0.1% 6
Plastic/Other Materials 0.6% 0.2% 84 Ceramics 0.4% 0.4% 59
Cement Fiber Board 0.0% 0.0% 0
Glass 1.9% 250 Single-ply Roofing Membranes 0.0% 0.0% 0
Clear Bottles 0.6% 0.1% 85 Ceiling Tiles 0.0% 0.0% 0
Green Bottles 0.2% 0.1% 32 Other Construction 0.2% 0.3% 27
Brown Bottles 0.4% 0.1% 47
Container Glass 0.3% 0.1% 36 Hazardous 0.4% 49
Fluorescent Tubes 0.0% 0.0% 0 Dried Latex Paint 0.0% 0.0% 0
CFLs 0.0% 0.0% 1 Liquid Latex Paint 0.0% 0.1% 6
Flat Glass 0.0% 0.0% 5 Solvent-based Adhesives 0.0% 0.0% 1
Automotive Glass 0.0% 0.0% 0 Water-based Adhesives 0.0% 0.0% 4
Other Glass 0.3% 0.1% 43 Oil-based Paint/Thinners 0.0% 0.0% 2
Caustic Cleaners 0.0% 0.0% 4
Metal 3.4% 451 Pesticides/Herbicides 0.0% 0.0% 3
Aluminum Beverage Cans 0.3% 0.1% 34 Rechargeable Batteries 0.0% 0.0% 0
Aluminum Foil/Containers 0.3% 0.1% 38 Other Dry-cell Batteries 0.0% 0.0% 4
Other Aluminum 0.1% 0.0% 12 Wet-cell Batteries 0.0% 0.0% 0
Other Nonferrous 0.2% 0.1% 21 Gasoline/Kerosene 0.0% 0.0% 0
Steel Food Cans 0.5% 0.1% 65 Motor Oil/Diesel Oil 0.0% 0.0% 0
Empty Aerosol Cans 0.2% 0.1% 23 Asbestos 0.0% 0.0% 0
Other Ferrous 0.8% 0.3% 104 Explosives 0.0% 0.0% 0
Oil filters 0.0% 0.0% 0 Medical Wastes 0.0% 0.0% 6
Mixed Metals/Material 1.1% 0.4% 154 Other Cleaners/Chemicals 0.0% 0.0% 0
Pharmaceuticals/Vitamins 0.0% 0.0% 3
Organics 57.7% 7,771 Cosmetics 0.1% 0.0% 14
Leaves and Grass 1.1% 0.5% 152 Other Potentially Harmful Waste 0.0% 0.0% 2
Prunings 0.4% 0.5% 58
Food 29.3% 1.5% 3,945 Fines and Misc Materials 2.8% 383
Fats, Oils, Grease 0.0% 0.0% 1 Sand/Soil/Dirt 0.8% 0.5% 111
Textiles/Clothing 3.1% 0.7% 415 Non-distinct Fines 0.1% 0.1% 10
Mixed Textiles 1.2% 0.3% 164 Miscellaneous Organics 1.9% 0.5% 251
Disposable Diapers 8.8% 0.8% 1,185 Miscellaneous Inorganics 0.1% 0.1% 10
Animal By-products 13.2% 1.6% 1,784
Rubber Products 0.5% 0.2% 67
Tires 0.0% 0.0% 0 Totals 100% 13,468
Sample Count 45
Confidence intervals calculated at the 90% confidence level. Percentages for material types may not total 100% due to rounding.

Cascadia Consulting Group, Inc. 36 Waste Stream Composition Study: 2014 FINAL Report
Table 4-21: Composition by Weight – Single-family Zone 4 (January – December 2014)
Est. Est. Est. Est.
Material Percent + / - Tons Percent + / - Tons
Paper 18.4% 3,751 Appliances and Electronics 0.8% 163
Newspaper 2.0% 0.3% 403 Furniture 0.4% 0.4% 80
Plain OCC/Kraft 0.7% 0.2% 150 Mattresses 0.0% 0.0% 0
Waxed OCC 0.2% 0.2% 41 Small Appliances 0.3% 0.3% 54
Grocery/Shopping Bags 0.5% 0.1% 101 Cell Phones 0.0% 0.0% 2
High-grade Paper 0.7% 0.2% 149 Audio/Visual Equipment 0.0% 0.0% 6
Mixed Low-grade Paper 3.6% 0.7% 735 CRT Monitors 0.0% 0.0% 0
Polycoated Containers 0.2% 0.1% 49 CRT Televisions 0.0% 0.0% 0
Compostable/Soiled 7.2% 0.7% 1,458 Other Electronics 0.1% 0.1% 22
Pot. Comp. Single-use Food Service 0.5% 0.1% 96
Non-Comp. Single-use Food Service 0.4% 0.2% 81 CDL Wastes 4.4% 891
Mixed/Other Paper 2.4% 0.6% 489 Clean Dimension Lumber 0.2% 0.2% 37
Clean Engineered Wood 0.2% 0.2% 31
Plastic 11.6% 2,366 Pallets 0.0% 0.0% 0
#1 PET Bottles 0.6% 0.1% 117 Crates 0.0% 0.0% 0
#2 HDPE Natural Bottles 0.2% 0.1% 34 Other Untreated Wood 0.2% 0.3% 39
#2 HDPE Colored Bottles 0.2% 0.1% 45 New Painted Wood 0.7% 0.4% 133
Other Bottles 0.1% 0.1% 25 Old Painted Wood 0.9% 0.8% 192
Tubs 0.4% 0.1% 73 Creosote-treated Wood 0.0% 0.0% 4
Expanded Poly. Non-food 0.2% 0.1% 37 Other Treated Wood 0.1% 0.1% 28
Expanded Poly. Food-grade 0.3% 0.1% 63 Contaminated Wood 0.1% 0.1% 23
Rigid Poly. Foam Insulation 0.1% 0.1% 18 New Gypsum Scrap 0.2% 0.3% 41
Pot. Comp. Single-use Food Service 0.2% 0.1% 41 Demo Gypsum Scrap 0.3% 0.2% 58
Non-Comp. Single-use Food Service 0.2% 0.1% 49 Carpet 0.6% 0.3% 117
Other Rigid Packaging 1.1% 0.2% 216 Felt Carpet Pad 0.0% 0.1% 10
Shopping/Dry Cleaning Bags 0.3% 0.1% 58 Fiberglass Insulation 0.0% 0.0% 4
Stretch Wrap 0.0% 0.0% 5 Concrete 0.1% 0.1% 11
Clean Polyethylene Film 0.0% 0.0% 5 Asphalt Paving 0.1% 0.2% 21
Other Film 6.3% 0.7% 1,274 Other Aggregates 0.0% 0.0% 1
Plastic Pipe 0.0% 0.0% 2 Rock 0.0% 0.0% 0
Foam Carpet Padding 0.0% 0.0% 5 Asphalt Shingles 0.0% 0.0% 1
Durable Plastic Products 0.8% 0.3% 165 Other Asphaltic Roofing 0.0% 0.0% 0
Plastic/Other Materials 0.7% 0.2% 134 Ceramics 0.2% 0.1% 36
Cement Fiber Board 0.0% 0.0% 0
Glass 2.0% 416 Single-ply Roofing Membranes 0.0% 0.0% 0
Clear Bottles 0.6% 0.2% 116 Ceiling Tiles 0.0% 0.0% 0
Green Bottles 0.3% 0.1% 65 Other Construction 0.5% 0.4% 104
Brown Bottles 0.4% 0.2% 88
Container Glass 0.4% 0.1% 87 Hazardous 0.8% 153
Fluorescent Tubes 0.0% 0.0% 0 Dried Latex Paint 0.2% 0.3% 48
CFLs 0.0% 0.0% 2 Liquid Latex Paint 0.2% 0.1% 31
Flat Glass 0.0% 0.0% 5 Solvent-based Adhesives 0.0% 0.0% 0
Automotive Glass 0.0% 0.0% 0 Water-based Adhesives 0.0% 0.0% 2
Other Glass 0.3% 0.1% 52 Oil-based Paint/Thinners 0.0% 0.0% 1
Caustic Cleaners 0.0% 0.0% 2
Metal 2.7% 543 Pesticides/Herbicides 0.0% 0.1% 10
Aluminum Beverage Cans 0.3% 0.1% 64 Rechargeable Batteries 0.0% 0.0% 0
Aluminum Foil/Containers 0.2% 0.0% 40 Other Dry-cell Batteries 0.0% 0.0% 4
Other Aluminum 0.2% 0.1% 31 Wet-cell Batteries 0.0% 0.0% 0
Other Nonferrous 0.3% 0.4% 59 Gasoline/Kerosene 0.0% 0.0% 0
Steel Food Cans 0.7% 0.2% 150 Motor Oil/Diesel Oil 0.0% 0.0% 1
Empty Aerosol Cans 0.1% 0.0% 18 Asbestos 0.0% 0.0% 0
Other Ferrous 0.3% 0.2% 64 Explosives 0.0% 0.0% 0
Oil filters 0.0% 0.0% 1 Medical Wastes 0.0% 0.0% 7
Mixed Metals/Material 0.6% 0.2% 116 Other Cleaners/Chemicals 0.0% 0.0% 4
Pharmaceuticals/Vitamins 0.0% 0.0% 7
Organics 56.4% 11,478 Cosmetics 0.1% 0.1% 29
Leaves and Grass 0.6% 0.4% 116 Other Potentially Harmful Waste 0.0% 0.0% 6
Prunings 0.1% 0.0% 14
Food 29.1% 1.3% 5,924 Fines and Misc Materials 3.0% 602
Fats, Oils, Grease 0.0% 0.0% 6 Sand/Soil/Dirt 0.9% 0.7% 193
Textiles/Clothing 3.2% 0.6% 649 Non-distinct Fines 0.2% 0.2% 48
Mixed Textiles 1.1% 0.4% 218 Miscellaneous Organics 1.6% 0.5% 329
Disposable Diapers 9.6% 1.1% 1,960 Miscellaneous Inorganics 0.2% 0.2% 31
Animal By-products 12.4% 1.6% 2,521
Rubber Products 0.3% 0.1% 68
Tires 0.0% 0.0% 2 Totals 100% 20,363
Sample Count 45
Confidence intervals calculated at the 90% confidence level. Percentages for material types may not total 100% due to rounding.

Cascadia Consulting Group, Inc. 37 Waste Stream Composition Study: 2014 FINAL Report
4.5 By Collection Zone and Residence Type: Multifamily
As shown in Figure 4-4, organics made up roughly half of the waste from multifamily residences in all four collection zones. The next largest category, paper, composed about 20% of the total for each subpopulation. Plastic accounted for between about 9% and 12% in all zones.
Figure 4-4: Composition Summary, Multifamily
(January – December 2014)
Multifamily Zone 1 Multifamily Zone 2
Multifamily Zone 3 Multifamily Zone 4

Cascadia Consulting Group, Inc. 38 Waste Stream Composition Study: 2014 FINAL Report
4.5.1 Multifamily Zone 1
A total of 45 loads were sampled for the multifamily Zone 1 subpopulation. Approximately 8,784 tons of waste were disposed by this subpopulation in calendar year 2014. Almost 28% of the waste was composed of food. Animal by-products (9.8%) and compostable/soiled paper (6.2%) were the next largest material components by weight. The full composition results for the multifamily Zone 1 subpopulation are listed in Table 4-26.
Table 4-22: Top Ten Components – Multifamily Zone 1 (January – December 2014)
Est. Cum. Est.
Material Percent Percent Tons
Food 27.9% 27.9% 2,449
Animal By-products 9.8% 37.7% 859
Compostable/Soiled Paper 6.2% 43.8% 540
Other Film 5.4% 49.2% 474
Disposable Diapers 5.1% 54.3% 444
Mixed Low-grade Paper 4.3% 58.5% 377
Mixed/Other Paper 2.7% 61.2% 236
Textiles/Clothing 2.2% 63.5% 195
Plain OCC/Kraft 2.1% 65.6% 185
Leaves and Grass 2.0% 67.6% 180
Total 67.6%
5,939
4.5.2 Multifamily Zone 2
To characterize waste from the multifamily Zone 2 subpopulation, 45 samples were sorted. It is estimated that multifamily residents in Zone 2 disposed about 8,950 tons in 2014. The top ten components for this subpopulation accounted for nearly 71%, or 6,347 tons. Approximately 30% of the waste was composed of food. Animal by-products, disposable diapers, and other film each accounted for at least 6%. Table 4-27 lists detailed composition results for waste from multifamily residences in Zone 2.

Cascadia Consulting Group, Inc. 39 Waste Stream Composition Study: 2014 FINAL Report
Table 4-23: Top Ten Components – Multifamily Zone 2 (January – December 2014)
Est. Cum. Est.
Material Percent Percent Tons
Food 29.9% 29.9% 2,680
Animal By-products 7.8% 37.8% 700
Disposable Diapers 6.3% 44.0% 560
Other Film 6.0% 50.0% 535
Compostable/Soiled Paper 5.9% 55.9% 526
Mixed Low-grade Paper 5.2% 61.1% 466
Mixed/Other Paper 3.2% 64.2% 282
Textiles/Clothing 2.7% 67.0% 245
Newspaper 2.1% 69.1% 192
Miscellaneous Organics 1.8% 70.9% 161
Total 70.9% 6,347
4.5.3 Multifamily Zone 3
A total of 46 samples were sorted to characterize waste from the multifamily Zone 3 subpopulation. It is estimated that multifamily residents in Zone 3 disposed about 23,045 tons in 2014. The top ten components for this subpopulation accounted for 70%, or 16,235 tons. Approximately 31% of the waste was composed of food. Animal by-products, and compostable/soiled paper each accounted for at least 6%. Table 4-28 lists detailed composition results for waste from multifamily residences in Zone 3.
Table 4-24: Top Ten Components – Multifamily Zone 3 (January – December 2014)
Est. Cum. Est.
Material Percent Percent Tons
Food 30.8% 30.8% 7,105
Animal By-products 9.0% 39.9% 2,079
Compostable/Soiled Paper 6.3% 46.2% 1,455
Disposable Diapers 5.3% 51.5% 1,219
Other Film 4.8% 56.3% 1,114
Mixed Low-grade Paper 4.6% 60.9% 1,052
Textiles/Clothing 2.9% 63.8% 673
Newspaper 2.5% 66.3% 584
Mixed/Other Paper 2.3% 68.6% 535
High-grade Paper 1.8% 70.4% 419
Total 70.4%
16,235
4.5.4 Multifamily Zone 4
To characterize waste from the multifamily Zone 4 subpopulation, 44 samples were sorted. It is estimated that multifamily residents in Zone 4 disposed about 11,352 tons in 2014. The top ten components for this subpopulation accounted for 73%, or 8,264 tons. About 33% of the waste was composed of food. Animal by-products (over 8%) was the next largest component. Table 4-29 lists detailed composition results for waste from multifamily residences in Zone 4.

Cascadia Consulting Group, Inc. 40 Waste Stream Composition Study: 2014 FINAL Report
Table 4-25: Top Ten Components – Multifamily Zone 4 (January – December 2014)
Est. Cum. Est.
Material Percent Percent Tons
Food 33.4% 33.4% 3,789
Animal By-products 8.1% 41.4% 914
Disposable Diapers 5.7% 47.2% 650
Compostable/Soiled Paper 5.6% 52.7% 633
Mixed Low-grade Paper 5.1% 57.8% 578
Other Film 4.6% 62.4% 518
Leaves and Grass 3.2% 65.6% 365
Textiles/Clothing 2.9% 68.5% 326
Newspaper 2.4% 70.9% 276
Plain OCC/Kraft 1.9% 72.8% 213
Total 72.8% 8,264
4.5.5 Detailed Composition Comparisons among Multifamily Zones 1 through 4
For Zones 1 through 4, food was the largest material component, composing about 30% of waste disposed. Animal by-products was the second largest material component, for all zones, but the third largest varied between disposable diapers (Zones 2 and 4), and compostable/soiled paper (Zones 1 and 3). Seven of the top ten components were the same across all four zones: food, compostable/soiled paper, mixed low-grade paper, animal by-products, disposable diapers, textiles/clothing, and other plastic film. Newspaper was a top ten component in Zones 2, 3, and 4, while plain OCC/Kraft and leaves and grass were top ten components in Zones 1 and 4. The only single occurrence of a material component in the top ten was miscellaneous organics in Zone 2.

Cascadia Consulting Group, Inc. 41 Waste Stream Composition Study: 2014 FINAL Report
Table 4-26: Composition by Weight – Multifamily Zone 1 (January – December 2014)
Est. Est. Est. Est.
Material Percent + / - Tons Percent + / - Tons
Paper 20.7% 1,820 Appliances and Electronics 1.5% 130
Newspaper 1.9% 0.5% 170 Furniture 0.5% 0.7% 43
Plain OCC/Kraft 2.1% 0.9% 185 Mattresses 0.0% 0.0% 0
Waxed OCC 0.3% 0.2% 29 Small Appliances 0.3% 0.3% 28
Grocery/Shopping Bags 0.6% 0.2% 54 Cell Phones 0.0% 0.0% 0
High-grade Paper 1.2% 0.3% 105 Audio/Visual Equipment 0.2% 0.2% 13
Mixed Low-grade Paper 4.3% 0.6% 377 CRT Monitors 0.0% 0.0% 0
Polycoated Containers 0.3% 0.1% 26 CRT Televisions 0.0% 0.0% 0
Compostable/Soiled 6.2% 1.2% 540 Other Electronics 0.5% 0.3% 46
Pot. Comp. Single-use Food Service 0.7% 0.2% 58
Non-Comp. Single-use Food Service 0.4% 0.2% 39 CDL Wastes 5.5% 483
Mixed/Other Paper 2.7% 0.8% 236 Clean Dimension Lumber 0.3% 0.1% 24
Clean Engineered Wood 0.3% 0.2% 28
Plastic 11.4% 1,004 Pallets 0.1% 0.1% 7
#1 PET Bottles 0.7% 0.1% 61 Crates 0.0% 0.0% 0
#2 HDPE Natural Bottles 0.2% 0.1% 20 Other Untreated Wood 0.8% 0.4% 69
#2 HDPE Colored Bottles 0.4% 0.1% 32 New Painted Wood 0.4% 0.3% 34
Other Bottles 0.2% 0.1% 13 Old Painted Wood 0.5% 0.4% 44
Tubs 0.4% 0.1% 34 Creosote-treated Wood 0.0% 0.0% 1
Expanded Poly. Non-food 0.2% 0.1% 21 Other Treated Wood 0.1% 0.1% 10
Expanded Poly. Food-grade 0.1% 0.0% 11 Contaminated Wood 0.4% 0.4% 36
Rigid Poly. Foam Insulation 0.1% 0.1% 11 New Gypsum Scrap 0.0% 0.0% 0
Pot. Comp. Single-use Food Service 0.1% 0.1% 11 Demo Gypsum Scrap 0.0% 0.1% 4
Non-Comp. Single-use Food Service 0.3% 0.1% 26 Carpet 1.6% 1.2% 137
Other Rigid Packaging 0.7% 0.1% 61 Felt Carpet Pad 0.0% 0.0% 0
Shopping/Dry Cleaning Bags 0.2% 0.0% 13 Fiberglass Insulation 0.0% 0.0% 1
Stretch Wrap 0.0% 0.0% 3 Concrete 0.3% 0.3% 27
Clean Polyethylene Film 0.2% 0.2% 18 Asphalt Paving 0.0% 0.0% 0
Other Film 5.4% 0.6% 474 Other Aggregates 0.0% 0.0% 2
Plastic Pipe 0.1% 0.1% 9 Rock 0.1% 0.1% 10
Foam Carpet Padding 0.2% 0.3% 19 Asphalt Shingles 0.0% 0.0% 0
Durable Plastic Products 1.2% 0.3% 105 Other Asphaltic Roofing 0.0% 0.0% 0
Plastic/Other Materials 0.7% 0.3% 62 Ceramics 0.3% 0.2% 29
Cement Fiber Board 0.0% 0.0% 0
Glass 2.4% 214 Single-ply Roofing Membranes 0.0% 0.0% 0
Clear Bottles 0.7% 0.2% 63 Ceiling Tiles 0.0% 0.0% 1
Green Bottles 0.4% 0.1% 36 Other Construction 0.2% 0.3% 19
Brown Bottles 0.5% 0.2% 45
Container Glass 0.3% 0.1% 22 Hazardous 0.6% 56
Fluorescent Tubes 0.0% 0.0% 0 Dried Latex Paint 0.1% 0.1% 9
CFLs 0.0% 0.0% 0 Liquid Latex Paint 0.0% 0.0% 2
Flat Glass 0.1% 0.1% 12 Solvent-based Adhesives 0.0% 0.1% 3
Automotive Glass 0.0% 0.0% 0 Water-based Adhesives 0.0% 0.0% 2
Other Glass 0.4% 0.3% 36 Oil-based Paint/Thinners 0.0% 0.0% 3
Caustic Cleaners 0.0% 0.0% 1
Metal 4.4% 391 Pesticides/Herbicides 0.0% 0.0% 1
Aluminum Beverage Cans 0.5% 0.1% 43 Rechargeable Batteries 0.0% 0.0% 0
Aluminum Foil/Containers 0.2% 0.1% 21 Other Dry-cell Batteries 0.0% 0.0% 1
Other Aluminum 0.1% 0.1% 10 Wet-cell Batteries 0.0% 0.0% 1
Other Nonferrous 0.7% 0.9% 60 Gasoline/Kerosene 0.0% 0.0% 0
Steel Food Cans 0.8% 0.4% 74 Motor Oil/Diesel Oil 0.0% 0.0% 0
Empty Aerosol Cans 0.1% 0.0% 8 Asbestos 0.0% 0.0% 0
Other Ferrous 0.3% 0.1% 25 Explosives 0.0% 0.0% 0
Oil filters 0.0% 0.0% 2 Medical Wastes 0.1% 0.1% 5
Mixed Metals/Material 1.7% 0.6% 148 Other Cleaners/Chemicals 0.2% 0.3% 14
Pharmaceuticals/Vitamins 0.0% 0.0% 0
Organics 50.7% 4,453 Cosmetics 0.1% 0.0% 5
Leaves and Grass 2.0% 2.3% 180 Other Potentially Harmful Waste 0.1% 0.1% 8
Prunings 0.8% 0.7% 68
Food 27.9% 2.1% 2,449 Fines and Misc Materials 2.7% 234
Fats, Oils, Grease 0.5% 0.6% 45 Sand/Soil/Dirt 1.0% 0.6% 89
Textiles/Clothing 2.2% 0.5% 195 Non-distinct Fines 0.3% 0.3% 23
Mixed Textiles 1.3% 0.5% 112 Miscellaneous Organics 1.3% 0.4% 117
Disposable Diapers 5.1% 1.1% 444 Miscellaneous Inorganics 0.1% 0.1% 5
Animal By-products 9.8% 1.5% 859
Rubber Products 1.1% 0.7% 100
Tires 0.0% 0.0% 0 Totals 100% 8,784
Sample Count 45
Confidence intervals calculated at the 90% confidence level. Percentages for material types may not total 100% due to rounding.

Cascadia Consulting Group, Inc. 42 Waste Stream Composition Study: 2014 FINAL Report
Table 4-27: Composition by Weight – Multifamily Zone 2 (January – December 2014)
Est. Est. Est. Est.
Material Percent + / - Tons Percent + / - Tons
Paper 21.9% 1,960 Appliances and Electronics 2.3% 207
Newspaper 2.1% 0.4% 192 Furniture 1.5% 1.4% 132
Plain OCC/Kraft 1.4% 0.4% 126 Mattresses 0.0% 0.0% 0
Waxed OCC 0.2% 0.1% 17 Small Appliances 0.3% 0.2% 25
Grocery/Shopping Bags 0.7% 0.1% 67 Cell Phones 0.0% 0.0% 0
High-grade Paper 1.5% 0.5% 137 Audio/Visual Equipment 0.1% 0.1% 5
Mixed Low-grade Paper 5.2% 0.5% 466 CRT Monitors 0.0% 0.0% 0
Polycoated Containers 0.3% 0.1% 29 CRT Televisions 0.0% 0.0% 0
Compostable/Soiled 5.9% 1.1% 526 Other Electronics 0.5% 0.7% 43
Pot. Comp. Single-use Food Service 0.8% 0.3% 76
Non-Comp. Single-use Food Service 0.5% 0.2% 42 CDL Wastes 4.3% 386
Mixed/Other Paper 3.2% 0.9% 282 Clean Dimension Lumber 0.3% 0.1% 23
Clean Engineered Wood 0.1% 0.1% 10
Plastic 12.1% 1,086 Pallets 0.0% 0.0% 0
#1 PET Bottles 0.9% 0.1% 78 Crates 0.0% 0.0% 0
#2 HDPE Natural Bottles 0.2% 0.1% 18 Other Untreated Wood 0.4% 0.3% 35
#2 HDPE Colored Bottles 0.3% 0.1% 29 New Painted Wood 0.5% 0.4% 43
Other Bottles 0.1% 0.0% 8 Old Painted Wood 0.1% 0.1% 5
Tubs 0.4% 0.1% 34 Creosote-treated Wood 0.2% 0.4% 19
Expanded Poly. Non-food 0.2% 0.1% 14 Other Treated Wood 0.0% 0.0% 2
Expanded Poly. Food-grade 0.1% 0.1% 13 Contaminated Wood 0.4% 0.3% 34
Rigid Poly. Foam Insulation 0.1% 0.1% 5 New Gypsum Scrap 0.0% 0.0% 4
Pot. Comp. Single-use Food Service 0.4% 0.2% 34 Demo Gypsum Scrap 0.5% 0.4% 42
Non-Comp. Single-use Food Service 0.3% 0.1% 25 Carpet 1.2% 0.7% 103
Other Rigid Packaging 1.1% 0.3% 98 Felt Carpet Pad 0.1% 0.1% 6
Shopping/Dry Cleaning Bags 0.2% 0.1% 20 Fiberglass Insulation 0.0% 0.0% 1
Stretch Wrap 0.0% 0.0% 3 Concrete 0.0% 0.0% 0
Clean Polyethylene Film 0.0% 0.0% 2 Asphalt Paving 0.0% 0.0% 0
Other Film 6.0% 0.8% 535 Other Aggregates 0.0% 0.0% 1
Plastic Pipe 0.0% 0.0% 1 Rock 0.0% 0.0% 0
Foam Carpet Padding 0.3% 0.3% 25 Asphalt Shingles 0.0% 0.0% 0
Durable Plastic Products 1.0% 0.4% 87 Other Asphaltic Roofing 0.0% 0.0% 0
Plastic/Other Materials 0.6% 0.2% 56 Ceramics 0.3% 0.2% 24
Cement Fiber Board 0.0% 0.0% 0
Glass 3.0% 268 Single-ply Roofing Membranes 0.0% 0.0% 0
Clear Bottles 0.6% 0.2% 53 Ceiling Tiles 0.0% 0.0% 0
Green Bottles 0.4% 0.1% 33 Other Construction 0.4% 0.3% 33
Brown Bottles 0.5% 0.2% 45
Container Glass 0.4% 0.1% 33 Hazardous 0.6% 50
Fluorescent Tubes 0.0% 0.0% 1 Dried Latex Paint 0.0% 0.0% 4
CFLs 0.0% 0.0% 1 Liquid Latex Paint 0.1% 0.2% 11
Flat Glass 0.2% 0.2% 15 Solvent-based Adhesives 0.0% 0.0% 0
Automotive Glass 0.2% 0.3% 14 Water-based Adhesives 0.0% 0.0% 0
Other Glass 0.8% 0.9% 74 Oil-based Paint/Thinners 0.0% 0.0% 2
Caustic Cleaners 0.0% 0.0% 0
Metal 3.0% 265 Pesticides/Herbicides 0.0% 0.0% 0
Aluminum Beverage Cans 0.4% 0.1% 36 Rechargeable Batteries 0.0% 0.0% 1
Aluminum Foil/Containers 0.2% 0.1% 21 Other Dry-cell Batteries 0.0% 0.0% 1
Other Aluminum 0.1% 0.0% 6 Wet-cell Batteries 0.0% 0.0% 2
Other Nonferrous 0.1% 0.1% 10 Gasoline/Kerosene 0.0% 0.0% 0
Steel Food Cans 0.7% 0.2% 62 Motor Oil/Diesel Oil 0.0% 0.0% 0
Empty Aerosol Cans 0.1% 0.0% 7 Asbestos 0.0% 0.0% 0
Other Ferrous 0.6% 0.2% 50 Explosives 0.0% 0.0% 0
Oil filters 0.0% 0.0% 0 Medical Wastes 0.1% 0.1% 10
Mixed Metals/Material 0.8% 0.4% 72 Other Cleaners/Chemicals 0.0% 0.0% 2
Pharmaceuticals/Vitamins 0.0% 0.0% 4
Organics 49.9% 4,463 Cosmetics 0.1% 0.1% 13
Leaves and Grass 1.1% 0.7% 101 Other Potentially Harmful Waste 0.0% 0.0% 1
Prunings 0.6% 0.7% 56
Food 29.9% 1.8% 2,680 Fines and Misc Materials 3.0% 266
Fats, Oils, Grease 0.0% 0.0% 1 Sand/Soil/Dirt 0.6% 0.5% 55
Textiles/Clothing 2.7% 0.5% 245 Non-distinct Fines 0.4% 0.3% 34
Mixed Textiles 1.1% 0.5% 103 Miscellaneous Organics 1.8% 0.9% 161
Disposable Diapers 6.3% 0.9% 560 Miscellaneous Inorganics 0.2% 0.2% 16
Animal By-products 7.8% 0.8% 700
Rubber Products 0.2% 0.1% 16
Tires 0.0% 0.0% 1 Totals 100% 8,950
Sample Count 45
Confidence intervals calculated at the 90% confidence level. Percentages for material types may not total 100% due to rounding.

Cascadia Consulting Group, Inc. 43 Waste Stream Composition Study: 2014 FINAL Report
Table 4-28: Composition by Weight – Multifamily Zone 3 (January – December 2014)
Est. Est. Est. Est.
Material Percent + / - Tons Percent + / - Tons
Paper 21.7% 4,990 Appliances and Electronics 1.0% 228
Newspaper 2.5% 0.4% 584 Furniture 0.2% 0.3% 40
Plain OCC/Kraft 1.6% 0.4% 368 Mattresses 0.4% 0.7% 96
Waxed OCC 0.2% 0.2% 57 Small Appliances 0.3% 0.3% 74
Grocery/Shopping Bags 1.2% 0.3% 273 Cell Phones 0.0% 0.0% 0
High-grade Paper 1.8% 0.5% 419 Audio/Visual Equipment 0.0% 0.0% 7
Mixed Low-grade Paper 4.6% 0.6% 1,052 CRT Monitors 0.0% 0.0% 0
Polycoated Containers 0.2% 0.0% 57 CRT Televisions 0.0% 0.0% 0
Compostable/Soiled 6.3% 0.6% 1,455 Other Electronics 0.0% 0.0% 11
Pot. Comp. Single-use Food Service 0.5% 0.2% 124
Non-Comp. Single-use Food Service 0.3% 0.1% 66 CDL Wastes 5.1% 1,174
Mixed/Other Paper 2.3% 0.5% 535 Clean Dimension Lumber 0.3% 0.2% 67
Clean Engineered Wood 0.2% 0.2% 46
Plastic 11.7% 2,705 Pallets 0.0% 0.0% 1
#1 PET Bottles 0.8% 0.1% 175 Crates 0.0% 0.0% 2
#2 HDPE Natural Bottles 0.3% 0.1% 62 Other Untreated Wood 0.2% 0.2% 57
#2 HDPE Colored Bottles 0.3% 0.1% 60 New Painted Wood 0.3% 0.3% 59
Other Bottles 0.1% 0.1% 34 Old Painted Wood 0.4% 0.3% 86
Tubs 0.5% 0.1% 107 Creosote-treated Wood 0.0% 0.0% 4
Expanded Poly. Non-food 0.1% 0.0% 23 Other Treated Wood 0.3% 0.3% 75
Expanded Poly. Food-grade 0.1% 0.0% 27 Contaminated Wood 0.5% 0.3% 108
Rigid Poly. Foam Insulation 0.0% 0.0% 4 New Gypsum Scrap 0.0% 0.0% 0
Pot. Comp. Single-use Food Service 0.1% 0.0% 26 Demo Gypsum Scrap 0.3% 0.3% 72
Non-Comp. Single-use Food Service 0.3% 0.1% 70 Carpet 1.4% 0.8% 312
Other Rigid Packaging 1.3% 0.3% 291 Felt Carpet Pad 0.0% 0.0% 0
Shopping/Dry Cleaning Bags 0.2% 0.1% 53 Fiberglass Insulation 0.2% 0.4% 48
Stretch Wrap 0.1% 0.1% 31 Concrete 0.3% 0.5% 78
Clean Polyethylene Film 0.6% 0.7% 140 Asphalt Paving 0.0% 0.0% 0
Other Film 4.8% 0.5% 1,114 Other Aggregates 0.0% 0.0% 0
Plastic Pipe 0.1% 0.1% 15 Rock 0.1% 0.2% 30
Foam Carpet Padding 0.3% 0.3% 60 Asphalt Shingles 0.0% 0.0% 0
Durable Plastic Products 0.8% 0.3% 193 Other Asphaltic Roofing 0.0% 0.0% 0
Plastic/Other Materials 1.0% 0.4% 220 Ceramics 0.3% 0.2% 74
Cement Fiber Board 0.1% 0.1% 15
Glass 3.1% 723 Single-ply Roofing Membranes 0.0% 0.0% 0
Clear Bottles 0.9% 0.2% 200 Ceiling Tiles 0.0% 0.0% 0
Green Bottles 0.8% 0.2% 173 Other Construction 0.2% 0.2% 38
Brown Bottles 0.9% 0.3% 213
Container Glass 0.3% 0.1% 79 Hazardous 0.3% 73
Fluorescent Tubes 0.1% 0.1% 20 Dried Latex Paint 0.0% 0.0% 7
CFLs 0.0% 0.0% 1 Liquid Latex Paint 0.1% 0.1% 14
Flat Glass 0.0% 0.0% 1 Solvent-based Adhesives 0.0% 0.0% 1
Automotive Glass 0.0% 0.0% 0 Water-based Adhesives 0.0% 0.0% 1
Other Glass 0.2% 0.1% 35 Oil-based Paint/Thinners 0.0% 0.0% 4
Caustic Cleaners 0.0% 0.0% 4
Metal 3.3% 763 Pesticides/Herbicides 0.0% 0.0% 0
Aluminum Beverage Cans 0.6% 0.1% 129 Rechargeable Batteries 0.0% 0.0% 1
Aluminum Foil/Containers 0.3% 0.1% 66 Other Dry-cell Batteries 0.0% 0.0% 3
Other Aluminum 0.1% 0.0% 16 Wet-cell Batteries 0.0% 0.0% 0
Other Nonferrous 0.4% 0.3% 90 Gasoline/Kerosene 0.0% 0.0% 0
Steel Food Cans 0.6% 0.1% 134 Motor Oil/Diesel Oil 0.0% 0.0% 3
Empty Aerosol Cans 0.1% 0.0% 15 Asbestos 0.0% 0.0% 0
Other Ferrous 0.5% 0.3% 108 Explosives 0.0% 0.0% 0
Oil filters 0.0% 0.0% 1 Medical Wastes 0.1% 0.0% 13
Mixed Metals/Material 0.9% 0.3% 205 Other Cleaners/Chemicals 0.0% 0.0% 2
Pharmaceuticals/Vitamins 0.0% 0.0% 7
Organics 51.2% 11,808 Cosmetics 0.1% 0.0% 12
Leaves and Grass 1.0% 0.5% 232 Other Potentially Harmful Waste 0.0% 0.0% 2
Prunings 0.4% 0.3% 90
Food 30.8% 1.4% 7,105 Fines and Misc Materials 2.5% 581
Fats, Oils, Grease 0.0% 0.0% 0 Sand/Soil/Dirt 0.5% 0.6% 117
Textiles/Clothing 2.9% 0.6% 673 Non-distinct Fines 0.3% 0.3% 79
Mixed Textiles 1.3% 0.3% 310 Miscellaneous Organics 1.4% 0.5% 317
Disposable Diapers 5.3% 0.8% 1,219 Miscellaneous Inorganics 0.3% 0.2% 69
Animal By-products 9.0% 1.5% 2,079
Rubber Products 0.4% 0.2% 94
Tires 0.0% 0.0% 5 Totals 100% 23,045
Sample Count 46
Confidence intervals calculated at the 90% confidence level. Percentages for material types may not total 100% due to rounding.

Cascadia Consulting Group, Inc. 44 Waste Stream Composition Study: 2014 FINAL Report
Table 4-29: Composition by Weight – Multifamily Zone 4 (January – December 2014)
Est. Est. Est. Est.
Material Percent + / - Tons Percent + / - Tons
Paper 21.0% 2,389 Appliances and Electronics 1.8% 203
Newspaper 2.4% 0.5% 276 Furniture 0.3% 0.4% 34
Plain OCC/Kraft 1.9% 0.6% 213 Mattresses 0.0% 0.0% 0
Waxed OCC 0.2% 0.1% 23 Small Appliances 0.8% 0.7% 86
Grocery/Shopping Bags 0.6% 0.2% 73 Cell Phones 0.0% 0.0% 0
High-grade Paper 1.7% 0.7% 196 Audio/Visual Equipment 0.2% 0.2% 27
Mixed Low-grade Paper 5.1% 0.7% 578 CRT Monitors 0.0% 0.0% 0
Polycoated Containers 0.6% 0.6% 71 CRT Televisions 0.2% 0.3% 24
Compostable/Soiled 5.6% 0.8% 633 Other Electronics 0.3% 0.3% 33
Pot. Comp. Single-use Food Service 0.6% 0.2% 70
Non-Comp. Single-use Food Service 0.4% 0.2% 44 CDL Wastes 3.9% 441
Mixed/Other Paper 1.9% 0.3% 211 Clean Dimension Lumber 0.2% 0.3% 27
Clean Engineered Wood 0.3% 0.2% 33
Plastic 9.7% 1,102 Pallets 0.0% 0.0% 1
#1 PET Bottles 0.8% 0.1% 90 Crates 0.0% 0.0% 0
#2 HDPE Natural Bottles 0.2% 0.1% 24 Other Untreated Wood 0.4% 0.5% 45
#2 HDPE Colored Bottles 0.2% 0.1% 24 New Painted Wood 0.2% 0.2% 21
Other Bottles 0.1% 0.0% 7 Old Painted Wood 0.1% 0.1% 14
Tubs 0.4% 0.1% 42 Creosote-treated Wood 0.0% 0.0% 0
Expanded Poly. Non-food 0.1% 0.0% 11 Other Treated Wood 0.0% 0.0% 1
Expanded Poly. Food-grade 0.1% 0.0% 17 Contaminated Wood 1.6% 1.1% 183
Rigid Poly. Foam Insulation 0.1% 0.1% 9 New Gypsum Scrap 0.2% 0.2% 17
Pot. Comp. Single-use Food Service 0.1% 0.1% 14 Demo Gypsum Scrap 0.4% 0.6% 46
Non-Comp. Single-use Food Service 0.2% 0.1% 28 Carpet 0.2% 0.2% 20
Other Rigid Packaging 0.8% 0.2% 92 Felt Carpet Pad 0.0% 0.1% 5
Shopping/Dry Cleaning Bags 0.2% 0.1% 26 Fiberglass Insulation 0.0% 0.0% 0
Stretch Wrap 0.0% 0.0% 2 Concrete 0.0% 0.0% 0
Clean Polyethylene Film 0.1% 0.1% 13 Asphalt Paving 0.0% 0.0% 0
Other Film 4.6% 0.6% 518 Other Aggregates 0.0% 0.0% 0
Plastic Pipe 0.0% 0.0% 2 Rock 0.0% 0.0% 1
Foam Carpet Padding 0.1% 0.1% 9 Asphalt Shingles 0.0% 0.0% 0
Durable Plastic Products 0.8% 0.2% 96 Other Asphaltic Roofing 0.0% 0.0% 0
Plastic/Other Materials 0.7% 0.3% 79 Ceramics 0.2% 0.1% 18
Cement Fiber Board 0.0% 0.0% 0
Glass 2.2% 245 Single-ply Roofing Membranes 0.0% 0.0% 0
Clear Bottles 0.7% 0.2% 78 Ceiling Tiles 0.0% 0.0% 0
Green Bottles 0.4% 0.2% 51 Other Construction 0.1% 0.1% 9
Brown Bottles 0.5% 0.1% 52
Container Glass 0.3% 0.1% 30 Hazardous 0.2% 28
Fluorescent Tubes 0.0% 0.0% 0 Dried Latex Paint 0.0% 0.0% 1
CFLs 0.0% 0.0% 0 Liquid Latex Paint 0.0% 0.0% 2
Flat Glass 0.0% 0.1% 5 Solvent-based Adhesives 0.0% 0.0% 0
Automotive Glass 0.0% 0.0% 0 Water-based Adhesives 0.0% 0.0% 1
Other Glass 0.3% 0.1% 29 Oil-based Paint/Thinners 0.0% 0.0% 0
Caustic Cleaners 0.0% 0.0% 0
Metal 2.8% 318 Pesticides/Herbicides 0.0% 0.0% 0
Aluminum Beverage Cans 0.5% 0.1% 52 Rechargeable Batteries 0.0% 0.0% 0
Aluminum Foil/Containers 0.3% 0.1% 29 Other Dry-cell Batteries 0.0% 0.0% 4
Other Aluminum 0.0% 0.0% 4 Wet-cell Batteries 0.0% 0.0% 0
Other Nonferrous 0.1% 0.1% 9 Gasoline/Kerosene 0.0% 0.0% 0
Steel Food Cans 0.6% 0.1% 70 Motor Oil/Diesel Oil 0.0% 0.0% 0
Empty Aerosol Cans 0.2% 0.1% 18 Asbestos 0.0% 0.0% 0
Other Ferrous 0.4% 0.2% 51 Explosives 0.0% 0.0% 0
Oil filters 0.0% 0.0% 0 Medical Wastes 0.0% 0.1% 6
Mixed Metals/Material 0.8% 0.3% 86 Other Cleaners/Chemicals 0.0% 0.0% 1
Pharmaceuticals/Vitamins 0.0% 0.0% 2
Organics 55.7% 6,322 Cosmetics 0.0% 0.0% 5
Leaves and Grass 3.2% 2.1% 365 Other Potentially Harmful Waste 0.0% 0.1% 5
Prunings 0.6% 0.4% 68
Food 33.4% 3.0% 3,789 Fines and Misc Materials 2.7% 304
Fats, Oils, Grease 0.0% 0.0% 6 Sand/Soil/Dirt 0.6% 0.6% 73
Textiles/Clothing 2.9% 0.5% 326 Non-distinct Fines 0.2% 0.2% 26
Mixed Textiles 1.2% 0.4% 139 Miscellaneous Organics 1.6% 0.6% 184
Disposable Diapers 5.7% 0.7% 650 Miscellaneous Inorganics 0.2% 0.2% 22
Animal By-products 8.1% 1.6% 914
Rubber Products 0.3% 0.2% 39
Tires 0.2% 0.4% 24 Totals 100% 11,352
Sample Count 44
Confidence intervals calculated at the 90% confidence level. Percentages for material types may not total 100% due to rounding.

Cascadia Consulting Group, Inc. 45 Waste Stream Composition Study: 2014 FINAL Report
4.6 By Season
Samples were classified into four seasons according to the month in which they were sorted: Spring (March, April, May), Summer (June, July, August), Fall (September, October, November), and Winter (January, February, December). Figure 4-5 summarizes the results by broad material category for each season. When summed together, organics and paper accounted for the largest portion of the total tonnage in each of the four seasons, collectively representing between 68% and 76%. The relative proportions of the broad material categories remained relatively consistent across the seasons; however, organics decreased to about 50% in the summer and fall, compared to about 58% in the other two seasons.
Figure 4-5: Composition Summary, by Season
Spring Summer
Fall Winter

Cascadia Consulting Group, Inc. 46 Waste Stream Composition Study: 2014 FINAL Report
4.6.1 Spring
A total of 121 samples were sorted from the 27,990 tons of residential waste disposed between the months of March and May 2014. The top ten components, which are listed in Table 4-30, sum to 74% of the total. Food accounted for 32% of the total waste disposed in the spring. Animal by-products (11.7%), disposable diapers (7.9%), and compostable/soiled paper (6.0%) were the next largest material components. Table 4-34 lists the full composition results for residential waste disposed during the spring of 2014.
Table 4-30: Top Ten Components – Spring (March – May 2014)
Est. Cum. Est.
Material Percent Percent Tons
Food 32.2% 32.2% 9,005
Animal By-products 11.7% 43.9% 3,271
Disposable Diapers 7.9% 51.7% 2,198
Compostable/Soiled Paper 6.0% 57.7% 1,677
Other Film 5.5% 63.2% 1,531
Mixed Low-grade Paper 3.6% 66.8% 1,003
Textiles/Clothing 2.9% 69.6% 808
Mixed/Other Paper 1.6% 71.2% 442
Mixed Textiles 1.5% 72.7% 414
Newspaper 1.5% 74.2% 408
Total 74.2% 20,757
4.6.2 Summer
A total of 120 samples were captured and sorted from the 28,339 tons of residential waste disposed between June and August 2014. As shown in Table 4-31, food was the largest component at almost 27%. Animal by-products, disposable diapers, and compostable/soiled paper each accounted for more than 6% of the total, by weight. See Table 4-35 for a complete list of the composition results for residential waste disposed in summer.
Table 4-31: Top Ten Components – Summer (June – August 2014)
Est. Cum. Est.
Material Percent Percent Tons
Food 26.7% 26.7% 7,577
Animal By-products 10.9% 37.6% 3,091
Disposable Diapers 7.2% 44.9% 2,052
Compostable/Soiled Paper 6.4% 51.3% 1,819
Other Film 5.8% 57.1% 1,647
Mixed Low-grade Paper 4.0% 61.1% 1,127
Textiles/Clothing 3.2% 64.3% 919
Mixed Metals/Material 1.4% 65.7% 398
Miscellaneous Organics 1.4% 67.1% 388
Sand/Soil/Dirt 1.3% 68.4% 372
Total 68.4% 19,389

Cascadia Consulting Group, Inc. 47 Waste Stream Composition Study: 2014 FINAL Report
4.6.3 Fall
A total of 61 samples were sorted from the 28,234 tons of residential waste disposed between September and November 2014. Table 4-32 lists the top ten components of waste disposed in the fall. Food composed about 23% of the total, the lowest food percentage of any season. Animal by-products, disposable diapers, and compostable/soiled paper each made up more than 7% of the total. When summed together, the top ten components made up nearly 74% of the total waste disposed in fall 2014. Table 4-36 lists the composition results for this season in detail.
Table 4-32: Top Ten Components – Fall (September – November 2014)
Est. Cum. Est.
Material Percent Percent Tons
Food 23.2% 23.2% 6,555
Animal By-products 10.9% 34.1% 3,065
Disposable Diapers 8.9% 42.9% 2,499
Compostable/Soiled Paper 7.0% 49.9% 1,970
Mixed/Other Paper 4.6% 54.5% 1,305
Newspaper 4.5% 59.0% 1,269
Other Film 4.4% 63.4% 1,231
Mixed Low-grade Paper 4.2% 67.6% 1,187
Miscellaneous Organics 3.9% 71.5% 1,109
Leaves and Grass 2.7% 74.2% 754
Total 74.2% 20,945
4.6.4 Winter
This study sorted waste during the calendar year 2014, so winter samples were split between January and February at the beginning of the study year and December at the end of the study year. A total of 60 samples were sorted from the 27,674 tons of residential waste disposed during these months. The top ten components are listed in Table 4-33 and sum to nearly 80% of the total. As in the other seasons, food was the top waste component and represented over 36% of the waste stream. Animal by-products (9.5%), other film (7.1%), and compostable/soiled paper (6.2%) each made up more than 6% of the waste disposed during December, January, and February 2014. Table 4-37 details the full composition results of this season’s waste.

Cascadia Consulting Group, Inc. 48 Waste Stream Composition Study: 2014 FINAL Report
Table 4-33: Top Ten Components – Winter (January, February, and December 2014)
Est. Cum. Est.
Material Percent Percent Tons
Food 36.1% 36.1% 9,977
Animal By-products 9.5% 45.5% 2,627
Other Film 7.1% 52.7% 1,974
Compostable/Soiled Paper 6.2% 58.8% 1,702
Disposable Diapers 5.6% 64.5% 1,563
Mixed Low-grade Paper 5.4% 69.9% 1,489
Textiles/Clothing 3.3% 73.2% 927
Mixed/Other Paper 2.6% 75.9% 732
Newspaper 2.0% 77.8% 541
Mixed Textiles 1.8% 79.6% 494
Total 79.6% 22,027
4.6.5 Detailed Composition Comparisons among Seasons
Food was the largest component for each of the four seasons. The percentage of food waste was highest in winter (36.1%) and lowest in fall (23.2%). Newspaper was among the top ten material components for spring, fall, and winter, while mixed textiles made the top ten in spring and winter. There were two single occurrences of material components in the top ten lists across all seasons: leaves and grass comprised nearly 3% of the fall weight, while sand, soil, and dirt accounted for just over 1% of waste disposed in the summer months.

Cascadia Consulting Group, Inc. 49 Waste Stream Composition Study: 2014 FINAL Report
Table 4-34: Composition by Weight – Spring (March – May 2014)
Est. Est. Est. Est.
Material Percent + / - Tons Percent + / - Tons
Paper 17.2% 4,816 Appliances and Electronics 0.8% 223
Newspaper 1.5% 0.2% 408 Furniture 0.0% 0.0% 2
Plain OCC/Kraft 1.2% 0.3% 326 Mattresses 0.0% 0.0% 0
Waxed OCC 0.1% 0.1% 34 Small Appliances 0.4% 0.2% 102
Grocery/Shopping Bags 0.6% 0.1% 166 Cell Phones 0.0% 0.0% 1
High-grade Paper 1.1% 0.2% 309 Audio/Visual Equipment 0.1% 0.0% 22
Mixed Low-grade Paper 3.6% 0.3% 1,003 CRT Monitors 0.0% 0.0% 0
Polycoated Containers 0.3% 0.1% 86 CRT Televisions 0.0% 0.0% 0
Compostable/Soiled 6.0% 0.4% 1,677 Other Electronics 0.3% 0.3% 98
Pot. Comp. Single-use Food Service 1.0% 0.1% 272
Non-Comp. Single-use Food Service 0.3% 0.1% 93 CDL Wastes 4.8% 1,357
Mixed/Other Paper 1.6% 0.2% 442 Clean Dimension Lumber 0.3% 0.1% 94
Clean Engineered Wood 0.3% 0.2% 93
Plastic 11.5% 3,227 Pallets 0.0% 0.0% 7
#1 PET Bottles 0.6% 0.1% 169 Crates 0.0% 0.0% 0
#2 HDPE Natural Bottles 0.1% 0.0% 42 Other Untreated Wood 0.0% 0.0% 14
#2 HDPE Colored Bottles 0.3% 0.1% 88 New Painted Wood 0.5% 0.2% 126
Other Bottles 0.1% 0.0% 22 Old Painted Wood 0.3% 0.2% 72
Tubs 0.3% 0.1% 95 Creosote-treated Wood 0.0% 0.0% 5
Expanded Poly. Non-food 0.1% 0.0% 38 Other Treated Wood 0.0% 0.0% 11
Expanded Poly. Food-grade 0.3% 0.0% 75 Contaminated Wood 0.5% 0.2% 136
Rigid Poly. Foam Insulation 0.1% 0.0% 15 New Gypsum Scrap 0.0% 0.0% 4
Pot. Comp. Single-use Food Service 0.2% 0.1% 64 Demo Gypsum Scrap 0.3% 0.2% 86
Non-Comp. Single-use Food Service 0.4% 0.1% 106 Carpet 1.3% 0.6% 360
Other Rigid Packaging 0.8% 0.1% 214 Felt Carpet Pad 0.0% 0.1% 12
Shopping/Dry Cleaning Bags 0.3% 0.1% 83 Fiberglass Insulation 0.0% 0.0% 5
Stretch Wrap 0.0% 0.0% 4 Concrete 0.2% 0.1% 49
Clean Polyethylene Film 0.2% 0.1% 49 Asphalt Paving 0.1% 0.1% 21
Other Film 5.5% 0.3% 1,531 Other Aggregates 0.0% 0.0% 3
Plastic Pipe 0.1% 0.1% 27 Rock 0.1% 0.2% 34
Foam Carpet Padding 0.3% 0.2% 75 Asphalt Shingles 0.1% 0.1% 25
Durable Plastic Products 1.1% 0.2% 304 Other Asphaltic Roofing 0.0% 0.0% 0
Plastic/Other Materials 0.8% 0.1% 227 Ceramics 0.5% 0.2% 129
Cement Fiber Board 0.0% 0.0% 0
Glass 2.3% 652 Single-ply Roofing Membranes 0.0% 0.0% 0
Clear Bottles 0.5% 0.1% 150 Ceiling Tiles 0.0% 0.0% 3
Green Bottles 0.5% 0.1% 130 Other Construction 0.2% 0.2% 67
Brown Bottles 0.5% 0.1% 141
Container Glass 0.4% 0.1% 115 Hazardous 0.8% 216
Fluorescent Tubes 0.0% 0.0% 3 Dried Latex Paint 0.1% 0.1% 29
CFLs 0.0% 0.0% 3 Liquid Latex Paint 0.1% 0.1% 19
Flat Glass 0.1% 0.1% 18 Solvent-based Adhesives 0.0% 0.0% 1
Automotive Glass 0.0% 0.0% 0 Water-based Adhesives 0.0% 0.0% 2
Other Glass 0.3% 0.1% 92 Oil-based Paint/Thinners 0.0% 0.0% 1
Caustic Cleaners 0.1% 0.0% 18
Metal 2.9% 818 Pesticides/Herbicides 0.0% 0.0% 9
Aluminum Beverage Cans 0.3% 0.0% 75 Rechargeable Batteries 0.0% 0.0% 1
Aluminum Foil/Containers 0.3% 0.0% 78 Other Dry-cell Batteries 0.0% 0.0% 12
Other Aluminum 0.1% 0.0% 20 Wet-cell Batteries 0.0% 0.0% 1
Other Nonferrous 0.2% 0.2% 68 Gasoline/Kerosene 0.0% 0.0% 0
Steel Food Cans 0.4% 0.1% 125 Motor Oil/Diesel Oil 0.0% 0.0% 3
Empty Aerosol Cans 0.1% 0.0% 24 Asbestos 0.0% 0.0% 0
Other Ferrous 0.5% 0.1% 137 Explosives 0.0% 0.0% 0
Oil filters 0.0% 0.0% 1 Medical Wastes 0.1% 0.1% 29
Mixed Metals/Material 1.0% 0.2% 290 Other Cleaners/Chemicals 0.0% 0.0% 9
Pharmaceuticals/Vitamins 0.0% 0.0% 14
Organics 57.3% 16,039 Cosmetics 0.2% 0.1% 53
Leaves and Grass 0.7% 0.2% 187 Other Potentially Harmful Waste 0.1% 0.0% 16
Prunings 0.1% 0.1% 39
Food 32.2% 1.1% 9,005 Fines and Misc Materials 2.3% 643
Fats, Oils, Grease 0.0% 0.0% 8 Sand/Soil/Dirt 1.0% 0.6% 291
Textiles/Clothing 2.9% 0.4% 808 Non-distinct Fines 0.0% 0.0% 2
Mixed Textiles 1.5% 0.2% 414 Miscellaneous Organics 0.9% 0.2% 257
Disposable Diapers 7.9% 0.7% 2,198 Miscellaneous Inorganics 0.3% 0.2% 93
Animal By-products 11.7% 1.2% 3,271
Rubber Products 0.4% 0.1% 107
Tires 0.0% 0.0% 2 Totals 100% 27,990
Sample Count 121
Confidence intervals calculated at the 90% confidence level. Percentages for material types may not total 100% due to rounding.

Cascadia Consulting Group, Inc. 50 Waste Stream Composition Study: 2014 FINAL Report
Table 4-35: Composition by Weight – Summer (June – August 2014)
Est. Est. Est. Est.
Material Percent + / - Tons Percent + / - Tons
Paper 16.8% 4,772 Appliances and Electronics 1.3% 382
Newspaper 0.9% 0.1% 259 Furniture 0.7% 0.5% 205
Plain OCC/Kraft 1.2% 0.2% 353 Mattresses 0.0% 0.0% 0
Waxed OCC 0.1% 0.0% 21 Small Appliances 0.3% 0.2% 78
Grocery/Shopping Bags 0.8% 0.1% 225 Cell Phones 0.0% 0.0% 2
High-grade Paper 0.7% 0.2% 198 Audio/Visual Equipment 0.1% 0.1% 24
Mixed Low-grade Paper 4.0% 0.3% 1,127 CRT Monitors 0.0% 0.0% 0
Polycoated Containers 0.4% 0.0% 100 CRT Televisions 0.1% 0.1% 24
Compostable/Soiled 6.4% 0.4% 1,819 Other Electronics 0.2% 0.1% 48
Pot. Comp. Single-use Food Service 0.8% 0.2% 222
Non-Comp. Single-use Food Service 0.7% 0.1% 201 CDL Wastes 7.0% 1,977
Mixed/Other Paper 0.9% 0.1% 248 Clean Dimension Lumber 0.5% 0.2% 143
Clean Engineered Wood 0.4% 0.2% 103
Plastic 12.9% 3,643 Pallets 0.0% 0.0% 2
#1 PET Bottles 0.7% 0.1% 193 Crates 0.0% 0.0% 2
#2 HDPE Natural Bottles 0.2% 0.0% 54 Other Untreated Wood 0.1% 0.1% 28
#2 HDPE Colored Bottles 0.3% 0.0% 97 New Painted Wood 0.7% 0.4% 186
Other Bottles 0.0% 0.0% 13 Old Painted Wood 0.7% 0.5% 192
Tubs 0.9% 0.1% 244 Creosote-treated Wood 0.1% 0.1% 37
Expanded Poly. Non-food 0.1% 0.0% 40 Other Treated Wood 0.3% 0.2% 99
Expanded Poly. Food-grade 0.3% 0.0% 95 Contaminated Wood 0.4% 0.2% 119
Rigid Poly. Foam Insulation 0.0% 0.0% 11 New Gypsum Scrap 0.2% 0.2% 61
Pot. Comp. Single-use Food Service 0.1% 0.0% 19 Demo Gypsum Scrap 0.7% 0.4% 202
Non-Comp. Single-use Food Service 0.4% 0.1% 108 Carpet 1.1% 0.4% 323
Other Rigid Packaging 1.2% 0.2% 344 Felt Carpet Pad 0.0% 0.0% 11
Shopping/Dry Cleaning Bags 0.3% 0.0% 87 Fiberglass Insulation 0.0% 0.0% 11
Stretch Wrap 0.1% 0.1% 39 Concrete 0.0% 0.0% 10
Clean Polyethylene Film 0.2% 0.1% 67 Asphalt Paving 0.0% 0.0% 0
Other Film 5.8% 0.4% 1,647 Other Aggregates 0.0% 0.0% 1
Plastic Pipe 0.0% 0.0% 6 Rock 0.1% 0.1% 15
Foam Carpet Padding 0.1% 0.1% 26 Asphalt Shingles 0.1% 0.1% 18
Durable Plastic Products 1.2% 0.2% 331 Other Asphaltic Roofing 0.0% 0.1% 14
Plastic/Other Materials 0.8% 0.3% 222 Ceramics 0.4% 0.1% 127
Cement Fiber Board 0.0% 0.0% 0
Glass 2.6% 734 Single-ply Roofing Membranes 0.0% 0.1% 13
Clear Bottles 0.7% 0.1% 199 Ceiling Tiles 0.1% 0.1% 14
Green Bottles 0.5% 0.1% 135 Other Construction 0.9% 0.4% 245
Brown Bottles 0.5% 0.1% 149
Container Glass 0.4% 0.1% 124 Hazardous 1.0% 272
Fluorescent Tubes 0.0% 0.0% 0 Dried Latex Paint 0.1% 0.1% 17
CFLs 0.0% 0.0% 4 Liquid Latex Paint 0.3% 0.2% 80
Flat Glass 0.1% 0.0% 15 Solvent-based Adhesives 0.0% 0.0% 5
Automotive Glass 0.0% 0.0% 0 Water-based Adhesives 0.0% 0.0% 12
Other Glass 0.4% 0.1% 107 Oil-based Paint/Thinners 0.0% 0.0% 12
Caustic Cleaners 0.0% 0.0% 4
Metal 3.8% 1,084 Pesticides/Herbicides 0.0% 0.0% 2
Aluminum Beverage Cans 0.3% 0.1% 99 Rechargeable Batteries 0.0% 0.0% 2
Aluminum Foil/Containers 0.3% 0.0% 92 Other Dry-cell Batteries 0.0% 0.0% 13
Other Aluminum 0.1% 0.0% 17 Wet-cell Batteries 0.0% 0.0% 2
Other Nonferrous 0.1% 0.1% 23 Gasoline/Kerosene 0.0% 0.0% 0
Steel Food Cans 0.6% 0.1% 171 Motor Oil/Diesel Oil 0.0% 0.0% 2
Empty Aerosol Cans 0.2% 0.0% 58 Asbestos 0.0% 0.0% 0
Other Ferrous 0.8% 0.2% 222 Explosives 0.0% 0.0% 0
Oil filters 0.0% 0.0% 3 Medical Wastes 0.1% 0.0% 18
Mixed Metals/Material 1.4% 0.3% 398 Other Cleaners/Chemicals 0.0% 0.0% 2
Pharmaceuticals/Vitamins 0.0% 0.0% 12
Organics 50.8% 14,397 Cosmetics 0.2% 0.1% 57
Leaves and Grass 0.7% 0.2% 208 Other Potentially Harmful Waste 0.1% 0.1% 33
Prunings 0.5% 0.3% 137
Food 26.7% 1.2% 7,577 Fines and Misc Materials 3.8% 1,079
Fats, Oils, Grease 0.0% 0.0% 9 Sand/Soil/Dirt 1.3% 0.6% 372
Textiles/Clothing 3.2% 0.3% 919 Non-distinct Fines 1.0% 0.3% 276
Mixed Textiles 1.0% 0.2% 287 Miscellaneous Organics 1.4% 0.3% 388
Disposable Diapers 7.2% 0.7% 2,052 Miscellaneous Inorganics 0.2% 0.1% 43
Animal By-products 10.9% 1.0% 3,091
Rubber Products 0.4% 0.1% 105
Tires 0.0% 0.0% 10 Totals 100% 28,339
Sample Count 120
Confidence intervals calculated at the 90% confidence level. Percentages for material types may not total 100% due to rounding.

Cascadia Consulting Group, Inc. 51 Waste Stream Composition Study: 2014 FINAL Report
Table 4-36: Composition by Weight – Fall (September – November 2014)
Est. Est. Est. Est.
Material Percent + / - Tons Percent + / - Tons
Paper 25.8% 7,274 Appliances and Electronics 1.1% 323
Newspaper 4.5% 0.5% 1,269 Furniture 0.3% 0.4% 99
Plain OCC/Kraft 1.6% 0.4% 439 Mattresses 0.4% 0.6% 120
Waxed OCC 0.3% 0.2% 80 Small Appliances 0.2% 0.2% 65
Grocery/Shopping Bags 0.6% 0.1% 161 Cell Phones 0.0% 0.0% 2
High-grade Paper 2.3% 0.4% 660 Audio/Visual Equipment 0.1% 0.1% 16
Mixed Low-grade Paper 4.2% 0.5% 1,187 CRT Monitors 0.0% 0.0% 0
Polycoated Containers 0.2% 0.0% 48 CRT Televisions 0.0% 0.0% 0
Compostable/Soiled 7.0% 0.6% 1,970 Other Electronics 0.1% 0.1% 21
Pot. Comp. Single-use Food Service 0.4% 0.2% 122
Non-Comp. Single-use Food Service 0.1% 0.1% 33 CDL Wastes 4.4% 1,230
Mixed/Other Paper 4.6% 0.5% 1,305 Clean Dimension Lumber 0.1% 0.1% 28
Clean Engineered Wood 0.0% 0.0% 7
Plastic 9.8% 2,757 Pallets 0.0% 0.0% 0
#1 PET Bottles 0.7% 0.1% 195 Crates 0.0% 0.0% 0
#2 HDPE Natural Bottles 0.3% 0.1% 83 Other Untreated Wood 0.6% 0.2% 181
#2 HDPE Colored Bottles 0.2% 0.1% 69 New Painted Wood 0.1% 0.1% 18
Other Bottles 0.3% 0.1% 78 Old Painted Wood 0.2% 0.1% 48
Tubs 0.1% 0.0% 30 Creosote-treated Wood 0.0% 0.0% 0
Expanded Poly. Non-food 0.2% 0.1% 58 Other Treated Wood 0.2% 0.2% 50
Expanded Poly. Food-grade 0.1% 0.0% 31 Contaminated Wood 1.0% 0.6% 286
Rigid Poly. Foam Insulation 0.1% 0.1% 26 New Gypsum Scrap 0.0% 0.0% 0
Pot. Comp. Single-use Food Service 0.2% 0.1% 47 Demo Gypsum Scrap 0.1% 0.1% 28
Non-Comp. Single-use Food Service 0.2% 0.1% 58 Carpet 1.4% 0.7% 386
Other Rigid Packaging 0.8% 0.1% 230 Felt Carpet Pad 0.0% 0.0% 0
Shopping/Dry Cleaning Bags 0.3% 0.1% 77 Fiberglass Insulation 0.2% 0.3% 48
Stretch Wrap 0.0% 0.0% 8 Concrete 0.0% 0.0% 0
Clean Polyethylene Film 0.0% 0.0% 0 Asphalt Paving 0.0% 0.0% 0
Other Film 4.4% 0.4% 1,231 Other Aggregates 0.0% 0.0% 1
Plastic Pipe 0.0% 0.0% 0 Rock 0.0% 0.0% 6
Foam Carpet Padding 0.2% 0.2% 58 Asphalt Shingles 0.0% 0.0% 0
Durable Plastic Products 0.9% 0.3% 267 Other Asphaltic Roofing 0.0% 0.0% 0
Plastic/Other Materials 0.7% 0.2% 211 Ceramics 0.2% 0.1% 60
Cement Fiber Board 0.1% 0.1% 15
Glass 2.3% 647 Single-ply Roofing Membranes 0.0% 0.0% 0
Clear Bottles 0.7% 0.1% 200 Ceiling Tiles 0.0% 0.0% 6
Green Bottles 0.4% 0.1% 111 Other Construction 0.2% 0.3% 60
Brown Bottles 0.7% 0.2% 190
Container Glass 0.2% 0.1% 65 Hazardous 0.1% 23
Fluorescent Tubes 0.0% 0.0% 2 Dried Latex Paint 0.0% 0.0% 13
CFLs 0.0% 0.0% 0 Liquid Latex Paint 0.0% 0.0% 0
Flat Glass 0.0% 0.0% 0 Solvent-based Adhesives 0.0% 0.0% 0
Automotive Glass 0.1% 0.1% 14 Water-based Adhesives 0.0% 0.0% 0
Other Glass 0.2% 0.1% 64 Oil-based Paint/Thinners 0.0% 0.0% 0
Caustic Cleaners 0.0% 0.0% 0
Metal 3.0% 844 Pesticides/Herbicides 0.0% 0.0% 0
Aluminum Beverage Cans 0.5% 0.1% 138 Rechargeable Batteries 0.0% 0.0% 1
Aluminum Foil/Containers 0.1% 0.0% 39 Other Dry-cell Batteries 0.0% 0.0% 2
Other Aluminum 0.2% 0.1% 48 Wet-cell Batteries 0.0% 0.0% 0
Other Nonferrous 0.5% 0.4% 138 Gasoline/Kerosene 0.0% 0.0% 0
Steel Food Cans 0.8% 0.2% 220 Motor Oil/Diesel Oil 0.0% 0.0% 0
Empty Aerosol Cans 0.0% 0.0% 14 Asbestos 0.0% 0.0% 0
Other Ferrous 0.2% 0.1% 47 Explosives 0.0% 0.0% 0
Oil filters 0.0% 0.0% 0 Medical Wastes 0.0% 0.0% 2
Mixed Metals/Material 0.7% 0.2% 200 Other Cleaners/Chemicals 0.0% 0.0% 0
Pharmaceuticals/Vitamins 0.0% 0.0% 4
Organics 49.2% 13,884 Cosmetics 0.0% 0.0% 1
Leaves and Grass 2.7% 1.1% 754 Other Potentially Harmful Waste 0.0% 0.0% 0
Prunings 0.1% 0.1% 17
Food 23.2% 1.3% 6,555 Fines and Misc Materials 4.4% 1,253
Fats, Oils, Grease 0.2% 0.2% 55 Sand/Soil/Dirt 0.3% 0.2% 98
Textiles/Clothing 2.0% 0.3% 553 Non-distinct Fines 0.0% 0.0% 6
Mixed Textiles 0.5% 0.2% 130 Miscellaneous Organics 3.9% 0.7% 1,109
Disposable Diapers 8.9% 0.7% 2,499 Miscellaneous Inorganics 0.1% 0.1% 40
Animal By-products 10.9% 1.0% 3,065
Rubber Products 0.8% 0.2% 230
Tires 0.1% 0.1% 24 Totals 100% 28,234
Sample Count 61
Confidence intervals calculated at the 90% confidence level. Percentages for material types may not total 100% due to rounding.

Cascadia Consulting Group, Inc. 52 Waste Stream Composition Study: 2014 FINAL Report
Table 4-37: Composition by Weight – Winter (January, February, and December 2014)
Est. Est. Est. Est.
Material Percent + / - Tons Percent + / - Tons
Paper 21.2% 5,865 Appliances and Electronics 0.4% 123
Newspaper 2.0% 0.4% 541 Furniture 0.1% 0.2% 32
Plain OCC/Kraft 0.9% 0.2% 254 Mattresses 0.0% 0.0% 0
Waxed OCC 0.1% 0.1% 41 Small Appliances 0.3% 0.3% 88
Grocery/Shopping Bags 0.9% 0.3% 263 Cell Phones 0.0% 0.0% 0
High-grade Paper 1.5% 0.4% 401 Audio/Visual Equipment 0.0% 0.0% 0
Mixed Low-grade Paper 5.4% 0.7% 1,489 CRT Monitors 0.0% 0.0% 0
Polycoated Containers 1.1% 0.9% 300 CRT Televisions 0.0% 0.0% 0
Compostable/Soiled 6.2% 0.7% 1,702 Other Electronics 0.0% 0.0% 4
Pot. Comp. Single-use Food Service 0.3% 0.1% 80
Non-Comp. Single-use Food Service 0.2% 0.1% 62 CDL Wastes 2.3% 649
Mixed/Other Paper 2.6% 0.6% 732 Clean Dimension Lumber 0.0% 0.0% 2
Clean Engineered Wood 0.0% 0.0% 1
Plastic 12.0% 3,319 Pallets 0.0% 0.0% 0
#1 PET Bottles 0.5% 0.1% 132 Crates 0.0% 0.0% 0
#2 HDPE Natural Bottles 0.1% 0.0% 38 Other Untreated Wood 0.4% 0.3% 108
#2 HDPE Colored Bottles 0.1% 0.0% 34 New Painted Wood 0.1% 0.1% 32
Other Bottles 0.1% 0.1% 34 Old Painted Wood 0.5% 0.4% 134
Tubs 0.3% 0.1% 75 Creosote-treated Wood 0.0% 0.0% 0
Expanded Poly. Non-food 0.1% 0.1% 35 Other Treated Wood 0.1% 0.1% 20
Expanded Poly. Food-grade 0.1% 0.0% 20 Contaminated Wood 0.2% 0.2% 58
Rigid Poly. Foam Insulation 0.1% 0.1% 28 New Gypsum Scrap 0.0% 0.1% 9
Pot. Comp. Single-use Food Service 0.2% 0.1% 62 Demo Gypsum Scrap 0.2% 0.3% 65
Non-Comp. Single-use Food Service 0.1% 0.0% 19 Carpet 0.4% 0.2% 98
Other Rigid Packaging 1.5% 0.3% 408 Felt Carpet Pad 0.0% 0.0% 0
Shopping/Dry Cleaning Bags 0.0% 0.0% 1 Fiberglass Insulation 0.0% 0.0% 6
Stretch Wrap 0.0% 0.0% 2 Concrete 0.4% 0.5% 113
Clean Polyethylene Film 0.4% 0.6% 107 Asphalt Paving 0.0% 0.0% 0
Other Film 7.1% 0.7% 1,974 Other Aggregates 0.0% 0.0% 0
Plastic Pipe 0.0% 0.0% 0 Rock 0.0% 0.0% 0
Foam Carpet Padding 0.1% 0.1% 25 Asphalt Shingles 0.0% 0.0% 0
Durable Plastic Products 0.6% 0.2% 167 Other Asphaltic Roofing 0.0% 0.0% 0
Plastic/Other Materials 0.6% 0.2% 158 Ceramics 0.0% 0.0% 1
Cement Fiber Board 0.0% 0.0% 0
Glass 2.0% 566 Single-ply Roofing Membranes 0.0% 0.0% 0
Clear Bottles 0.6% 0.2% 174 Ceiling Tiles 0.0% 0.0% 0
Green Bottles 0.3% 0.1% 93 Other Construction 0.0% 0.0% 1
Brown Bottles 0.4% 0.2% 112
Container Glass 0.2% 0.1% 56 Hazardous 0.3% 83
Fluorescent Tubes 0.1% 0.1% 19 Dried Latex Paint 0.1% 0.1% 21
CFLs 0.0% 0.0% 1 Liquid Latex Paint 0.0% 0.1% 11
Flat Glass 0.1% 0.1% 33 Solvent-based Adhesives 0.0% 0.0% 0
Automotive Glass 0.0% 0.0% 0 Water-based Adhesives 0.0% 0.0% 2
Other Glass 0.3% 0.3% 77 Oil-based Paint/Thinners 0.0% 0.0% 7
Caustic Cleaners 0.0% 0.0% 0
Metal 2.8% 776 Pesticides/Herbicides 0.0% 0.1% 11
Aluminum Beverage Cans 0.4% 0.1% 100 Rechargeable Batteries 0.0% 0.0% 0
Aluminum Foil/Containers 0.3% 0.1% 73 Other Dry-cell Batteries 0.0% 0.0% 3
Other Aluminum 0.1% 0.0% 32 Wet-cell Batteries 0.0% 0.0% 0
Other Nonferrous 0.3% 0.2% 78 Gasoline/Kerosene 0.0% 0.0% 0
Steel Food Cans 0.6% 0.1% 157 Motor Oil/Diesel Oil 0.0% 0.0% 0
Empty Aerosol Cans 0.1% 0.0% 28 Asbestos 0.0% 0.0% 0
Other Ferrous 0.4% 0.3% 112 Explosives 0.0% 0.0% 0
Oil filters 0.0% 0.0% 0 Medical Wastes 0.0% 0.0% 6
Mixed Metals/Material 0.7% 0.3% 195 Other Cleaners/Chemicals 0.1% 0.1% 18
Pharmaceuticals/Vitamins 0.0% 0.0% 0
Organics 58.2% 16,097 Cosmetics 0.0% 0.0% 3
Leaves and Grass 0.8% 0.8% 225 Other Potentially Harmful Waste 0.0% 0.0% 0
Prunings 0.7% 0.4% 184
Food 36.1% 1.5% 9,977 Fines and Misc Materials 0.7% 195
Fats, Oils, Grease 0.0% 0.0% 0 Sand/Soil/Dirt 0.1% 0.1% 16
Textiles/Clothing 3.3% 0.6% 927 Non-distinct Fines 0.0% 0.0% 2
Mixed Textiles 1.8% 0.4% 494 Miscellaneous Organics 0.5% 0.3% 145
Disposable Diapers 5.6% 0.8% 1,563 Miscellaneous Inorganics 0.1% 0.1% 32
Animal By-products 9.5% 1.3% 2,627
Rubber Products 0.4% 0.2% 99
Tires 0.0% 0.0% 0 Totals 100% 27,674
Sample Count 60
Confidence intervals calculated at the 90% confidence level. Percentages for material types may not total 100% due to rounding.

Cascadia Consulting Group, Inc. 53 Waste Stream Composition Study: 2014 FINAL Report
4.7 By Demographics
Waste compositions for various demographic groups were calculated by considering the median household income and mean household size of each sampled garbage route. Median household income for each route was calculated based on information from the 2009-2013 American Community Survey 5-year estimates, at the Census Block Group level of geography.19 The total population and number of households for each route were calculated using information from the 2010 Census, at the Census Block level of geography. Sampled routes were divided into quartiles based on the median income and mean household size of each garbage route. Waste samples from the first (0 - 25%) quartile of routes were used to calculate waste compositions for low-income and small households (separately). Samples from the top quartile (75% - 100%) were used to calculate composition profiles for high-income and large households. See Appendix D for more details on demographic calculations.
4.7.1 By Household Income
Figure 4-6 summarizes the composition by broad material category for each household income type. Organics accounted for a higher percentage of disposed waste for high-income (56.9%) than for low-income households (55.0%). Paper was the second largest broad material category in both income groups, making up between 18% and 19% of the total waste disposed.
Figure 4-6: Composition Summary, by Household Income (January – December 2014)
High-income Households Low-income Households
19 A Census Block is generally equivalent to a city block. A Block Group is a collection of Blocks. For reference, a Tract is a collection of Block Groups. There are approximately 9,200 Census Blocks; 570 Block Groups; and 126 Tracts in Seattle.

Cascadia Consulting Group, Inc. 54 Waste Stream Composition Study: 2014 FINAL Report
4.7.1.1 High-income Households
A total of 41 waste samples from routes classified as high-income were collected and sorted in 2014. Table 4-38 lists the top ten components, which sum to approximately 77% of the total. The largest component, food, accounted for approximately 29% of the waste stream. Animal by-products (13.0%) and disposable diapers (9.6%) were the next largest components. The detailed composition results for high-income routes are listed in Table 4-40.
Table 4-38: Top Ten Components – High-income Households (January – December 2014)
Est. Cum.
Material Percent Percent
Food 28.8% 28.8%
Animal By-products 13.0% 41.8%
Disposable Diapers 9.6% 51.4%
Compostable/Soiled Paper 6.3% 57.7%
Other Film 6.3% 64.0%
Mixed Low-grade Paper 3.9% 67.9%
Textiles/Clothing 2.8% 70.7%
Mixed/Other Paper 2.4% 73.1%
Newspaper 1.9% 75.0%
Miscellaneous Organics 1.6% 76.6%
Total 76.6%
4.7.1.2 Low-income Households
A total of 31 samples from routes classified as low-income were collected and sorted in 2014. The top ten components of these samples are listed in Table 4-39. Food made up about 29% of the total waste. Animal by-products and disposable diapers, together, accounted for another 20%. The top ten components amounted to approximately 76% of this waste. Table 4-41 details the waste composition results for low-income routes.
Table 4-39: Top Ten Components – Low-income Households (January – December 2014)
Est. Cum.
Material Percent Percent
Food 28.9% 28.9%
Animal By-products 12.2% 41.1%
Disposable Diapers 7.9% 49.0%
Compostable/Soiled Paper 6.9% 55.9%
Other Film 6.6% 62.5%
Mixed Low-grade Paper 3.6% 66.1%
Textiles/Clothing 3.4% 69.6%
Miscellaneous Organics 2.1% 71.7%
Newspaper 2.0% 73.7%
Mixed/Other Paper 2.0% 75.7%
Total 75.7%

Cascadia Consulting Group, Inc. 55 Waste Stream Composition Study: 2014 FINAL Report
4.7.1.3 Detailed Composition Comparisons between High- and Low-income Households
The seven most prevalent components were the same for both income groups: food, animal by-products, disposable diapers, compostable/soiled paper, mixed low-grade paper, other plastic film, and textiles/clothing. In addition, the category newspaper appears in both top ten lists. No material categories were exclusive to one demographic, but miscellaneous organics were more prevalent in low-income households, while mixed/other paper was more prevalent in waste from high-income households.

Cascadia Consulting Group, Inc. 56 Waste Stream Composition Study: 2014 FINAL Report
Table 4-40: Composition by Weight – High-income Households (January – December 2014)
Est. Est.
Material Percent + / - Percent + / -
Paper 18.7% Appliances and Electronics 0.7%
Newspaper 1.9% 0.5% Furniture 0.3% 0.5%
Plain OCC/Kraft 0.9% 0.2% Mattresses 0.0% 0.0%
Waxed OCC 0.0% 0.0% Small Appliances 0.4% 0.3%
Grocery/Shopping Bags 0.7% 0.1% Cell Phones 0.0% 0.0%
High-grade Paper 1.3% 0.4% Audio/Visual Equipment 0.0% 0.0%
Mixed Low-grade Paper 3.9% 0.6% CRT Monitors 0.0% 0.0%
Polycoated Containers 0.3% 0.1% CRT Televisions 0.0% 0.0%
Compostable/Soiled 6.3% 0.6% Other Electronics 0.0% 0.0%
Pot. Comp. Single-use Food Service 0.7% 0.2%
Non-Comp. Single-use Food Service 0.3% 0.1% CDL Wastes 4.4%
Mixed/Other Paper 2.4% 0.7% Clean Dimension Lumber 0.1% 0.1%
Clean Engineered Wood 0.1% 0.2%
Plastic 11.3% Pallets 0.0% 0.0%
#1 PET Bottles 0.4% 0.1% Crates 0.0% 0.0%
#2 HDPE Natural Bottles 0.2% 0.1% Other Untreated Wood 0.2% 0.2%
#2 HDPE Colored Bottles 0.2% 0.1% New Painted Wood 0.5% 0.4%
Other Bottles 0.1% 0.1% Old Painted Wood 0.1% 0.1%
Tubs 0.4% 0.1% Creosote-treated Wood 0.0% 0.1%
Expanded Poly. Non-food 0.2% 0.1% Other Treated Wood 0.2% 0.2%
Expanded Poly. Food-grade 0.2% 0.1% Contaminated Wood 0.4% 0.3%
Rigid Poly. Foam Insulation 0.1% 0.1% New Gypsum Scrap 0.0% 0.0%
Pot. Comp. Single-use Food Service 0.1% 0.0% Demo Gypsum Scrap 0.3% 0.3%
Non-Comp. Single-use Food Service 0.1% 0.1% Carpet 1.1% 0.7%
Other Rigid Packaging 1.0% 0.2% Felt Carpet Pad 0.0% 0.0%
Shopping/Dry Cleaning Bags 0.2% 0.1% Fiberglass Insulation 0.0% 0.1%
Stretch Wrap 0.0% 0.0% Concrete 0.1% 0.1%
Clean Polyethylene Film 0.1% 0.0% Asphalt Paving 0.0% 0.0%
Other Film 6.3% 0.6% Other Aggregates 0.0% 0.0%
Plastic Pipe 0.0% 0.0% Rock 0.0% 0.0%
Foam Carpet Padding 0.0% 0.1% Asphalt Shingles 0.0% 0.0%
Durable Plastic Products 1.0% 0.3% Other Asphaltic Roofing 0.0% 0.0%
Plastic/Other Materials 0.6% 0.2% Ceramics 0.2% 0.1%
Cement Fiber Board 0.0% 0.0%
Glass 1.8% Single-ply Roofing Membranes 0.1% 0.2%
Clear Bottles 0.4% 0.1% Ceiling Tiles 0.1% 0.2%
Green Bottles 0.3% 0.1% Other Construction 0.6% 0.6%
Brown Bottles 0.3% 0.1%
Container Glass 0.3% 0.1% Hazardous 0.8%
Fluorescent Tubes 0.0% 0.0% Dried Latex Paint 0.1% 0.2%
CFLs 0.0% 0.0% Liquid Latex Paint 0.3% 0.2%
Flat Glass 0.2% 0.2% Solvent-based Adhesives 0.0% 0.0%
Automotive Glass 0.0% 0.0% Water-based Adhesives 0.0% 0.0%
Other Glass 0.3% 0.1% Oil-based Paint/Thinners 0.0% 0.0%
Caustic Cleaners 0.1% 0.1%
Metal 3.0% Pesticides/Herbicides 0.0% 0.0%
Aluminum Beverage Cans 0.2% 0.1% Rechargeable Batteries 0.0% 0.0%
Aluminum Foil/Containers 0.3% 0.1% Other Dry-cell Batteries 0.0% 0.0%
Other Aluminum 0.1% 0.0% Wet-cell Batteries 0.0% 0.0%
Other Nonferrous 0.1% 0.1% Gasoline/Kerosene 0.0% 0.0%
Steel Food Cans 0.5% 0.1% Motor Oil/Diesel Oil 0.0% 0.0%
Empty Aerosol Cans 0.1% 0.1% Asbestos 0.0% 0.0%
Other Ferrous 0.6% 0.3% Explosives 0.0% 0.0%
Oil filters 0.0% 0.0% Medical Wastes 0.0% 0.0%
Mixed Metals/Material 1.2% 0.4% Other Cleaners/Chemicals 0.0% 0.0%
Pharmaceuticals/Vitamins 0.0% 0.0%
Organics 56.9% Cosmetics 0.2% 0.1%
Leaves and Grass 1.0% 0.5% Other Potentially Harmful Waste 0.1% 0.1%
Prunings 0.3% 0.3%
Food 28.8% 1.7% Fines and Misc Materials 2.4%
Fats, Oils, Grease 0.0% 0.0% Sand/Soil/Dirt 0.3% 0.3%
Textiles/Clothing 2.8% 0.7% Non-distinct Fines 0.5% 0.3%
Mixed Textiles 1.0% 0.4% Miscellaneous Organics 1.6% 0.6%
Disposable Diapers 9.6% 1.2% Miscellaneous Inorganics 0.0% 0.0%
Animal By-products 13.0% 1.5%
Rubber Products 0.4% 0.1%
Tires 0.0% 0.0% Totals 100%
Sample Count 41
Confidence intervals calculated at the 90% confidence level. Percentages for material types may not total 100% due to rounding.

Cascadia Consulting Group, Inc. 57 Waste Stream Composition Study: 2014 FINAL Report
Table 4-41: Composition by Weight – Low-income Households (January – December 2014)
Est. Est.
Material Percent + / - Percent + / -
Paper 18.4% Appliances and Electronics 0.4%
Newspaper 2.0% 0.6% Furniture 0.1% 0.1%
Plain OCC/Kraft 0.9% 0.3% Mattresses 0.0% 0.0%
Waxed OCC 0.2% 0.3% Small Appliances 0.2% 0.2%
Grocery/Shopping Bags 0.6% 0.1% Cell Phones 0.0% 0.0%
High-grade Paper 0.9% 0.3% Audio/Visual Equipment 0.0% 0.0%
Mixed Low-grade Paper 3.6% 0.6% CRT Monitors 0.0% 0.0%
Polycoated Containers 0.3% 0.1% CRT Televisions 0.0% 0.0%
Compostable/Soiled 6.9% 0.7% Other Electronics 0.2% 0.1%
Pot. Comp. Single-use Food Service 0.5% 0.1%
Non-Comp. Single-use Food Service 0.4% 0.2% CDL Wastes 4.5%
Mixed/Other Paper 2.0% 0.6% Clean Dimension Lumber 0.1% 0.1%
Clean Engineered Wood 0.2% 0.2%
Plastic 12.9% Pallets 0.0% 0.0%
#1 PET Bottles 0.7% 0.1% Crates 0.0% 0.0%
#2 HDPE Natural Bottles 0.2% 0.1% Other Untreated Wood 0.3% 0.3%
#2 HDPE Colored Bottles 0.3% 0.1% New Painted Wood 0.7% 0.6%
Other Bottles 0.2% 0.1% Old Painted Wood 1.2% 1.1%
Tubs 0.5% 0.1% Creosote-treated Wood 0.0% 0.0%
Expanded Poly. Non-food 0.2% 0.1% Other Treated Wood 0.1% 0.1%
Expanded Poly. Food-grade 0.4% 0.1% Contaminated Wood 0.0% 0.0%
Rigid Poly. Foam Insulation 0.1% 0.1% New Gypsum Scrap 0.0% 0.0%
Pot. Comp. Single-use Food Service 0.2% 0.2% Demo Gypsum Scrap 0.2% 0.2%
Non-Comp. Single-use Food Service 0.3% 0.1% Carpet 0.1% 0.1%
Other Rigid Packaging 1.1% 0.2% Felt Carpet Pad 0.0% 0.0%
Shopping/Dry Cleaning Bags 0.3% 0.1% Fiberglass Insulation 0.0% 0.0%
Stretch Wrap 0.0% 0.0% Concrete 0.0% 0.0%
Clean Polyethylene Film 0.3% 0.4% Asphalt Paving 0.2% 0.3%
Other Film 6.6% 0.7% Other Aggregates 0.0% 0.0%
Plastic Pipe 0.0% 0.0% Rock 0.0% 0.0%
Foam Carpet Padding 0.0% 0.1% Asphalt Shingles 0.3% 0.5%
Durable Plastic Products 0.9% 0.3% Other Asphaltic Roofing 0.0% 0.0%
Plastic/Other Materials 0.7% 0.2% Ceramics 0.3% 0.2%
Cement Fiber Board 0.0% 0.0%
Glass 2.1% Single-ply Roofing Membranes 0.0% 0.0%
Clear Bottles 0.7% 0.2% Ceiling Tiles 0.0% 0.1%
Green Bottles 0.3% 0.1% Other Construction 0.8% 0.8%
Brown Bottles 0.4% 0.2%
Container Glass 0.3% 0.1% Hazardous 0.7%
Fluorescent Tubes 0.0% 0.0% Dried Latex Paint 0.0% 0.0%
CFLs 0.0% 0.0% Liquid Latex Paint 0.0% 0.0%
Flat Glass 0.0% 0.0% Solvent-based Adhesives 0.0% 0.0%
Automotive Glass 0.0% 0.0% Water-based Adhesives 0.0% 0.0%
Other Glass 0.4% 0.2% Oil-based Paint/Thinners 0.0% 0.0%
Caustic Cleaners 0.0% 0.0%
Metal 2.8% Pesticides/Herbicides 0.1% 0.1%
Aluminum Beverage Cans 0.4% 0.1% Rechargeable Batteries 0.0% 0.0%
Aluminum Foil/Containers 0.3% 0.1% Other Dry-cell Batteries 0.0% 0.0%
Other Aluminum 0.2% 0.1% Wet-cell Batteries 0.0% 0.0%
Other Nonferrous 0.0% 0.0% Gasoline/Kerosene 0.0% 0.0%
Steel Food Cans 0.8% 0.3% Motor Oil/Diesel Oil 0.0% 0.0%
Empty Aerosol Cans 0.2% 0.1% Asbestos 0.0% 0.0%
Other Ferrous 0.4% 0.3% Explosives 0.0% 0.0%
Oil filters 0.0% 0.0% Medical Wastes 0.1% 0.1%
Mixed Metals/Material 0.7% 0.2% Other Cleaners/Chemicals 0.0% 0.0%
Pharmaceuticals/Vitamins 0.0% 0.0%
Organics 55.0% Cosmetics 0.2% 0.1%
Leaves and Grass 1.0% 0.6% Other Potentially Harmful Waste 0.1% 0.1%
Prunings 0.1% 0.1%
Food 28.9% 2.2% Fines and Misc Materials 3.2%
Fats, Oils, Grease 0.1% 0.0% Sand/Soil/Dirt 0.7% 0.8%
Textiles/Clothing 3.4% 0.8% Non-distinct Fines 0.3% 0.3%
Mixed Textiles 0.9% 0.4% Miscellaneous Organics 2.1% 0.8%
Disposable Diapers 7.9% 1.1% Miscellaneous Inorganics 0.1% 0.1%
Animal By-products 12.2% 1.8%
Rubber Products 0.5% 0.3%
Tires 0.0% 0.0% Totals 100%
Sample Count 35
Confidence intervals calculated at the 90% confidence level. Percentages for material types may not total 100% due to rounding.

Cascadia Consulting Group, Inc. 58 Waste Stream Composition Study: 2014 FINAL Report
4.7.2 By Household Size
Figure 4-7 presents a waste composition summary by broad material category for waste disposed by small and large households. Organics was the largest broad material category for both household types, accounting for around 57% of disposed waste. Paper was slightly more prevalent in small household waste (nearly 19%) compared to large households (17%). Waste percentages by broad material categories are very similar for the remaining categories.
Figure 4-7: Composition Summary, by Household Size (January – December 2014)
Small Households
Large Households

Cascadia Consulting Group, Inc. 59 Waste Stream Composition Study: 2014 FINAL Report
4.7.2.1 Small Households
A total of 38 samples were collected and sorted from small household routes. Table 4-42 lists the top ten components for small households. The most prevalent component, food (28.2%), accounted for nearly twice as much as the second most prevalent component (animal by-products, 14.6%). The top ten components, together, accounted for approximately 77% of the total waste. The full composition results for waste from small households are listed in Table 4-4.
Table 4-42: Top Ten Components – Small Households (January – December 2014)
Est. Cum.
Material Percent Percent
Food 28.2% 28.2%
Animal By-products 14.6% 42.8%
Disposable Diapers 8.6% 51.4%
Compostable/Soiled Paper 6.6% 58.0%
Other Film 6.3% 64.3%
Mixed Low-grade Paper 3.7% 68.0%
Textiles/Clothing 2.6% 70.6%
Miscellaneous Organics 2.2% 72.8%
Mixed/Other Paper 2.1% 74.9%
Newspaper 1.9% 76.9%
Total 76.9%
4.7.2.2 Large Households
A total of 32 samples were captured and sorted from large household routes. As shown in Table 4-43, food accounted for about 31% of the waste. Animal by-products, disposable diapers, compostable/soiled paper, and other film each accounted for between 6% and 12% of the total. Table 4-45 lists the detailed composition results for waste from large households.
Table 4-43: Top Ten Components – Large Households (January – December 2014)
Est. Cum.
Material Percent Percent
Food 30.7% 30.7%
Animal By-products 11.4% 42.1%
Disposable Diapers 9.1% 51.2%
Compostable/Soiled Paper 6.9% 58.1%
Other Film 6.7% 64.9%
Mixed Low-grade Paper 3.5% 68.3%
Textiles/Clothing 3.3% 71.6%
Mixed/Other Paper 1.9% 73.5%
Miscellaneous Organics 1.8% 75.3%
Newspaper 1.7% 77.0%
Total 77.0%

Cascadia Consulting Group, Inc. 60 Waste Stream Composition Study: 2014 FINAL Report
4.7.3 Detailed Composition Comparisons between Small and Large Households
The seven most prevalent components were the same for small and large households: food, animal by-products, disposable diapers, compostable/soiled paper, mixed low-grade paper, other plastic film, and textiles/clothing. Three other components, miscellaneous organics, newspaper and mixed/other paper, also appear in both top ten lists, though in different orders. Miscellaneous organics were more prevalent in the small household waste stream, while mixed/other paper was more prevalent in the large household waste stream.

Cascadia Consulting Group, Inc. 61 Waste Stream Composition Study: 2014 FINAL Report
Table 4-44: Composition by Weight – Small Households (January – December 2014)
Est. Est.
Material Percent + / - Percent + / -
Paper 18.8% Appliances and Electronics 0.5%
Newspaper 1.9% 0.6% Furniture 0.2% 0.3%
Plain OCC/Kraft 0.9% 0.3% Mattresses 0.2% 0.3%
Waxed OCC 0.0% 0.0% Small Appliances 0.1% 0.1%
Grocery/Shopping Bags 0.7% 0.2% Cell Phones 0.0% 0.0%
High-grade Paper 1.0% 0.3% Audio/Visual Equipment 0.1% 0.1%
Mixed Low-grade Paper 3.7% 0.6% CRT Monitors 0.0% 0.0%
Polycoated Containers 1.1% 1.4% CRT Televisions 0.0% 0.0%
Compostable/Soiled 6.6% 0.7% Other Electronics 0.0% 0.0%
Pot. Comp. Single-use Food Service 0.5% 0.1%
Non-Comp. Single-use Food Service 0.3% 0.1% CDL Wastes 3.8%
Mixed/Other Paper 2.1% 0.6% Clean Dimension Lumber 0.1% 0.1%
Clean Engineered Wood 0.1% 0.1%
Plastic 11.6% Pallets 0.0% 0.0%
#1 PET Bottles 0.4% 0.1% Crates 0.0% 0.0%
#2 HDPE Natural Bottles 0.1% 0.1% Other Untreated Wood 0.3% 0.2%
#2 HDPE Colored Bottles 0.2% 0.1% New Painted Wood 0.4% 0.4%
Other Bottles 0.1% 0.1% Old Painted Wood 0.3% 0.3%
Tubs 0.4% 0.1% Creosote-treated Wood 0.0% 0.0%
Expanded Poly. Non-food 0.2% 0.1% Other Treated Wood 0.1% 0.1%
Expanded Poly. Food-grade 0.2% 0.0% Contaminated Wood 0.5% 0.4%
Rigid Poly. Foam Insulation 0.1% 0.1% New Gypsum Scrap 0.1% 0.1%
Pot. Comp. Single-use Food Service 0.2% 0.1% Demo Gypsum Scrap 0.0% 0.1%
Non-Comp. Single-use Food Service 0.2% 0.1% Carpet 0.6% 0.4%
Other Rigid Packaging 1.1% 0.2% Felt Carpet Pad 0.0% 0.0%
Shopping/Dry Cleaning Bags 0.2% 0.1% Fiberglass Insulation 0.1% 0.1%
Stretch Wrap 0.0% 0.0% Concrete 0.4% 0.5%
Clean Polyethylene Film 0.0% 0.0% Asphalt Paving 0.0% 0.0%
Other Film 6.3% 0.6% Other Aggregates 0.0% 0.0%
Plastic Pipe 0.0% 0.0% Rock 0.0% 0.0%
Foam Carpet Padding 0.0% 0.0% Asphalt Shingles 0.0% 0.0%
Durable Plastic Products 1.1% 0.4% Other Asphaltic Roofing 0.0% 0.0%
Plastic/Other Materials 0.6% 0.2% Ceramics 0.2% 0.1%
Cement Fiber Board 0.0% 0.0%
Glass 1.7% Single-ply Roofing Membranes 0.0% 0.0%
Clear Bottles 0.4% 0.2% Ceiling Tiles 0.0% 0.0%
Green Bottles 0.3% 0.1% Other Construction 0.6% 0.5%
Brown Bottles 0.4% 0.2%
Container Glass 0.3% 0.1% Hazardous 0.6%
Fluorescent Tubes 0.0% 0.0% Dried Latex Paint 0.2% 0.3%
CFLs 0.0% 0.0% Liquid Latex Paint 0.1% 0.1%
Flat Glass 0.0% 0.0% Solvent-based Adhesives 0.0% 0.0%
Automotive Glass 0.0% 0.0% Water-based Adhesives 0.0% 0.0%
Other Glass 0.2% 0.1% Oil-based Paint/Thinners 0.0% 0.0%
Caustic Cleaners 0.0% 0.0%
Metal 3.2% Pesticides/Herbicides 0.1% 0.1%
Aluminum Beverage Cans 0.2% 0.1% Rechargeable Batteries 0.0% 0.0%
Aluminum Foil/Containers 0.3% 0.1% Other Dry-cell Batteries 0.0% 0.0%
Other Aluminum 0.1% 0.1% Wet-cell Batteries 0.0% 0.0%
Other Nonferrous 0.1% 0.1% Gasoline/Kerosene 0.0% 0.0%
Steel Food Cans 0.5% 0.1% Motor Oil/Diesel Oil 0.0% 0.0%
Empty Aerosol Cans 0.1% 0.0% Asbestos 0.0% 0.0%
Other Ferrous 0.8% 0.4% Explosives 0.0% 0.0%
Oil filters 0.0% 0.0% Medical Wastes 0.1% 0.1%
Mixed Metals/Material 1.1% 0.3% Other Cleaners/Chemicals 0.0% 0.0%
Pharmaceuticals/Vitamins 0.0% 0.0%
Organics 56.5% Cosmetics 0.0% 0.0%
Leaves and Grass 0.6% 0.3% Other Potentially Harmful Waste 0.0% 0.0%
Prunings 0.1% 0.1%
Food 28.2% 2.2% Fines and Misc Materials 3.4%
Fats, Oils, Grease 0.0% 0.0% Sand/Soil/Dirt 0.9% 0.7%
Textiles/Clothing 2.6% 0.5% Non-distinct Fines 0.1% 0.2%
Mixed Textiles 1.3% 0.4% Miscellaneous Organics 2.2% 0.9%
Disposable Diapers 8.6% 1.0% Miscellaneous Inorganics 0.1% 0.1%
Animal By-products 14.6% 1.8%
Rubber Products 0.6% 0.3%
Tires 0.0% 0.0% Totals 100%
Sample Count 38
Confidence intervals calculated at the 90% confidence level. Percentages for material types may not total 100% due to rounding.

Cascadia Consulting Group, Inc. 62 Waste Stream Composition Study: 2014 FINAL Report
Table 4-45: Composition by Weight – Large Households (January – December 2014)
Est. Est.
Material Percent + / - Percent + / -
Paper 17.3% Appliances and Electronics 0.4%
Newspaper 1.7% 0.6% Furniture 0.0% 0.0%
Plain OCC/Kraft 0.7% 0.3% Mattresses 0.0% 0.0%
Waxed OCC 0.3% 0.3% Small Appliances 0.2% 0.2%
Grocery/Shopping Bags 0.6% 0.1% Cell Phones 0.0% 0.0%
High-grade Paper 0.7% 0.2% Audio/Visual Equipment 0.0% 0.0%
Mixed Low-grade Paper 3.5% 0.8% CRT Monitors 0.0% 0.0%
Polycoated Containers 0.2% 0.1% CRT Televisions 0.0% 0.0%
Compostable/Soiled 6.9% 0.7% Other Electronics 0.1% 0.1%
Pot. Comp. Single-use Food Service 0.5% 0.1%
Non-Comp. Single-use Food Service 0.4% 0.2% CDL Wastes 4.6%
Mixed/Other Paper 1.9% 0.7% Clean Dimension Lumber 0.1% 0.1%
Clean Engineered Wood 0.2% 0.2%
Plastic 12.5% Pallets 0.0% 0.0%
#1 PET Bottles 0.6% 0.1% Crates 0.0% 0.0%
#2 HDPE Natural Bottles 0.2% 0.1% Other Untreated Wood 0.2% 0.4%
#2 HDPE Colored Bottles 0.2% 0.0% New Painted Wood 0.3% 0.2%
Other Bottles 0.1% 0.1% Old Painted Wood 1.2% 1.1%
Tubs 0.5% 0.2% Creosote-treated Wood 0.0% 0.0%
Expanded Poly. Non-food 0.1% 0.1% Other Treated Wood 0.1% 0.1%
Expanded Poly. Food-grade 0.4% 0.1% Contaminated Wood 0.2% 0.2%
Rigid Poly. Foam Insulation 0.0% 0.0% New Gypsum Scrap 0.0% 0.0%
Pot. Comp. Single-use Food Service 0.3% 0.2% Demo Gypsum Scrap 0.2% 0.2%
Non-Comp. Single-use Food Service 0.3% 0.1% Carpet 0.3% 0.2%
Other Rigid Packaging 1.2% 0.2% Felt Carpet Pad 0.0% 0.0%
Shopping/Dry Cleaning Bags 0.3% 0.1% Fiberglass Insulation 0.0% 0.0%
Stretch Wrap 0.0% 0.0% Concrete 0.1% 0.1%
Clean Polyethylene Film 0.1% 0.0% Asphalt Paving 0.2% 0.3%
Other Film 6.7% 1.0% Other Aggregates 0.0% 0.0%
Plastic Pipe 0.0% 0.0% Rock 0.0% 0.0%
Foam Carpet Padding 0.0% 0.0% Asphalt Shingles 0.0% 0.0%
Durable Plastic Products 0.8% 0.3% Other Asphaltic Roofing 0.0% 0.0%
Plastic/Other Materials 0.8% 0.3% Ceramics 0.3% 0.1%
Cement Fiber Board 0.0% 0.0%
Glass 2.1% Single-ply Roofing Membranes 0.0% 0.0%
Clear Bottles 0.5% 0.2% Ceiling Tiles 0.2% 0.3%
Green Bottles 0.3% 0.1% Other Construction 1.1% 0.9%
Brown Bottles 0.4% 0.2%
Container Glass 0.4% 0.1% Hazardous 0.6%
Fluorescent Tubes 0.0% 0.0% Dried Latex Paint 0.1% 0.2%
CFLs 0.0% 0.0% Liquid Latex Paint 0.0% 0.0%
Flat Glass 0.0% 0.0% Solvent-based Adhesives 0.0% 0.0%
Automotive Glass 0.0% 0.0% Water-based Adhesives 0.0% 0.0%
Other Glass 0.4% 0.2% Oil-based Paint/Thinners 0.0% 0.0%
Caustic Cleaners 0.0% 0.1%
Metal 2.8% Pesticides/Herbicides 0.1% 0.1%
Aluminum Beverage Cans 0.3% 0.1% Rechargeable Batteries 0.0% 0.0%
Aluminum Foil/Containers 0.3% 0.1% Other Dry-cell Batteries 0.0% 0.0%
Other Aluminum 0.2% 0.1% Wet-cell Batteries 0.0% 0.0%
Other Nonferrous 0.1% 0.1% Gasoline/Kerosene 0.0% 0.0%
Steel Food Cans 0.6% 0.1% Motor Oil/Diesel Oil 0.0% 0.0%
Empty Aerosol Cans 0.2% 0.1% Asbestos 0.0% 0.0%
Other Ferrous 0.4% 0.2% Explosives 0.0% 0.0%
Oil filters 0.0% 0.0% Medical Wastes 0.0% 0.0%
Mixed Metals/Material 0.8% 0.3% Other Cleaners/Chemicals 0.0% 0.0%
Pharmaceuticals/Vitamins 0.0% 0.0%
Organics 56.8% Cosmetics 0.2% 0.1%
Leaves and Grass 0.8% 0.5% Other Potentially Harmful Waste 0.0% 0.0%
Prunings 0.1% 0.0%
Food 30.7% 2.1% Fines and Misc Materials 2.9%
Fats, Oils, Grease 0.0% 0.0% Sand/Soil/Dirt 0.8% 0.9%
Textiles/Clothing 3.3% 0.8% Non-distinct Fines 0.2% 0.3%
Mixed Textiles 1.1% 0.5% Miscellaneous Organics 1.8% 0.7%
Disposable Diapers 9.1% 1.1% Miscellaneous Inorganics 0.1% 0.1%
Animal By-products 11.4% 2.3%
Rubber Products 0.3% 0.2%
Tires 0.0% 0.0% Totals 100%
Sample Count 32
Confidence intervals calculated at the 90% confidence level. Percentages for material types may not total 100% due to rounding.

Cascadia Consulting Group, Inc. A-1 2014 Waste Stream Composition Study FINAL Appendices
Appendix A. Material Components
Waste samples were sorted by hand into 115 waste components, which were grouped into ten broad categories. The waste categories in the 2014 study are based on those used in Seattle’s 2012 commercial and self-haul waste study. Refer to Table A-1 for additional details regarding the changes in components and categories. Medical wastes were excluded from sorting. A list of component categories and definitions follows.
PAPER 1. NEWSPAPER: Printed ground wood newsprint. Includes advertising “slicks” (glossy
paper), if found mixed with newspaper; otherwise, ad slicks are included with mixed low grade.
2. PLAIN OCC/KRAFT PAPER: Old unwaxed/uncoated corrugated container boxes and
Kraft paper. 3. WAXED OCC: Old waxed/coated corrugated container boxes and Kraft paper. 4. GROCERY/SHOPPING BAGS: Paper grocery and shopping bags. Includes all brown
paper bags and bags with non-paper handles. 5. HIGH-GRADE PAPER: White and lightly colored bond, rag, or stationary grade paper.
This includes white or lightly colored sulfite/sulfate bond, copy papers, notebook paper, envelopes, continuous-feed sulfite/sulfate computer printouts and forms of all types, excluding carbonless paper.
6. MIXED LOW-GRADE PAPER: Mixed paper acceptable in Seattle's residential curbside
program. This includes junk mail, magazines, colored papers, bleached Kraft, boxboard, mailing tubes, carbonless copy paper, ground wood computer printouts, paperback books, telephone directories, spiral notebooks, and frozen/refrigerator packaging. Excludes juice concentrate cans.
7. POLYCOATED CONTAINERS: Polycoated milk, ice cream, and aseptic juice
containers, including those with plastic spouts attached. 8. COMPOSTABLE/SOILED PAPER: Paper towels, waxed paper, tissues, and other
papers that were soiled with food during use (e.g., pizza box inserts). 9. POTENTIALLY COMPOSTABLE SINGLE-USE FOOD SERVICE PAPER: Paper plates,
bowls, and cups, including wax-coated paper plates, bowls, and cups, and items labeled “compostable.” Excludes items with visible plastic coating or lining.
10. NON-COMPOSTABLE SINGLE-USE FOOD SERVICE PAPER: Paper plates, bowls,
and cups not labeled “compostable” and that appear to have a plastic lining or coating. 11. MIXED/OTHER PAPER: Predominantly paper with other materials attached (e.g. orange
juice cans), and other non-recyclable papers such as carbon copy paper, hardcover books, and photographs.

Cascadia Consulting Group, Inc. A-2 2014 Waste Stream Composition Study FINAL Appendices
PLASTIC 12. PET BOTTLES: Blow-molded polyethylene terephthalate (#1) bottles and jars, excluding
toxic product containers. 13. HDPE NATURAL BOTTLES: Blow-molded high-density translucent polyethylene (#2)
bottles and jars, excluding toxic product containers. Examples include milk, juice, beverage, oil, vinegar, and distilled water.
14. HDPE COLORED BOTTLES: Blow-molded high-density colored polyethylene (#2)
bottles and jars, excluding toxic product containers. Examples include liquid detergent bottles and some hair care bottles.
15. OTHER PLASTIC BOTTLES: Blow-molded #3-#7 plastic bottles and jars and unknown
bottles. Excludes toxic product containers. 16. TUBS: #1-#7 tubs containing products such as yogurt, cottage cheese, margarine, and
prescription medication. Excludes toxic product containers. 17. EXPANDED POLYSTYRENE NON-FOOD GRADE: Includes non-food packaging and
finished products made of expanded polystyrene. Excludes Styrofoam products such as cups, plates, bowls, and rigid foam insulation.
18. EXPANDED POLYSTYRENE FOOD-GRADE: Styrofoam products used to contain food,
such as "clamshells," cups, plates, and bowls. 19. RIGID POLYSTYRENE FOAM INSULATION: Rigid panels of expanded polystyrene
used to insulate walls and roofs. Excludes non-polystyrene rigid foam insulation. 20. POTENTIALLY COMPOSTABLE SINGLE-USE FOOD SERVICE PLASTICS: Includes
clamshells, cups, cup lids, and salad trays, if they are labeled “compostable.” Excludes clamshells, cups, plates, bowls, and other food service items made of Styrofoam.
21. NON-COMPOSTABLE SINGLE-USE FOOD SERVICE PLASTICS: Includes forks,
spoons, clamshells, cups, cup lids, and salad trays, as long as they are not labeled “compostable.” Excludes clamshells, cups, plates, bowls, and other food service items made of Styrofoam.
22. OTHER RIGID PACKAGING: #1-#7 and unmarked rigid plastic packaging (excluding
expanded polystyrene, or Styrofoam), such as cookie tray inserts, plastic spools, plastic frozen food trays, plastic toothpaste tubes, and disposable plant pots. Also includes toxic product containers, such as for motor oil or antifreeze.
23. CLEAN SHOPPING/DRY CLEANER BAGS: Labeled grocery, merchandise, dry cleaner,
and newspaper polyethylene film bags that were not contaminated with food, liquid or grit during use.
24. STRETCH WRAP: Polyethylene pallet wrap or stretch wrap.

Cascadia Consulting Group, Inc. A-3 2014 Waste Stream Composition Study FINAL Appendices
25. OTHER CLEAN POLYETHYLENE FILM: Polyethylene film and bags, other than those identified above, which were not contaminated with food, liquid, or grit during use. Includes clean plastic sheeting, clean trash bags, and mattress packaging.
26. OTHER FILM: Film packaging not defined above, or: was contaminated with food, liquid
or grit during use; is woven together (e.g., grain bags); or that contains multiple layers of film or other materials that have been fused together (e.g., potato chip bags). This category also includes contaminated plastic sheeting, photographic negatives, shower curtains, any bags used to contain liquid or food (e.g., produce), contaminated trash bags, used garbage bags, and shopping bags used as garbage bags.
27. PLASTIC PIPE: Pipes and fittings made of PVC (polyvinyl chloride), ABS (acrylonitrile
butadiene styrene), or other rigid plastics. 28. FOAM CARPET PADDING: Foam material used under carpet to provide insulation and
padding. Most commonly made of urethane foam. Can be solid-colored or have a marbled appearance.
29. DURABLE PLASTIC PRODUCTS: Finished plastic products made entirely of plastic
such as toys, toothbrushes, vinyl hose, plastic lawn furniture, and foam mattresses. Includes fiberglass resin products and materials, and durable plastic pots.
30. PLASTIC/OTHER MATERIALS: Items that are predominately plastic with other materials
attached, such as disposable razors, pens, lighters, toys, and 3-ring binders.
GLASS 31. CLEAR BEVERAGE: Bottles that are clear in color, including pop, liquor, wine, juice,
beer, and vinegar bottles. 32. GREEN BEVERAGE: Bottles that are green in color, including green pop, liquor, wine,
beer, and lemon juice bottles. 33. BROWN BEVERAGE: Bottles that are brown in color, including brown pop, beer, liquor,
juice, and extract bottles. 34. CONTAINER GLASS: Glass containers of all colors that held solid materials such as
mayonnaise, non-dairy creamer, and facial cream. 35. FLUORESCENT TUBES: Fluorescent light tubes. 36. COMPACT FLUORESCENT LIGHTS (CFL): Small, fluorescent bulbs similar in
appearance to incandescent bulbs. These bulbs typically have a spiral or tubular design. 37. FLAT GLASS: Clear or tinted glass that is flat. Examples include glass window panes,
doors and table tops, safety glass, and architectural glass. Excludes windshields, laminated glass, or any curved glass.
38. AUTOMOTIVE GLASS: Windshield and side window auto glass.

Cascadia Consulting Group, Inc. A-4 2014 Waste Stream Composition Study FINAL Appendices
39. OTHER GLASS: Mirrors, light bulbs (except fluorescent tubes), glassware, and blue glass bottles.
METAL 40. ALUMINUM CANS: Aluminum beverage cans (UBC) and bi-metal cans made mostly of
aluminum. 41. ALUMINUM FOIL/CONTAINERS: Aluminum food containers, trays, and foil. 42. OTHER ALUMINUM: Aluminum products and scrap such as window frames and
cookware. 43. OTHER NONFERROUS: Metals not derived from iron, to which a magnet will not
adhere, and which are not significantly contaminated with other metals or materials. 44. STEEL FOOD CANS: Steel food containers, including bi-metal cans made mostly of
steel. 45. EMPTY AEROSOL CANS: Empty, mixed material/metal aerosol cans. (Aerosols that still
contain product are sorted according to that material—for instance, solvent-based paint.) 46. OTHER FERROUS: Ferrous and alloyed ferrous scrap metals to which a magnet
adheres and which are not significantly contaminated with other metals or materials. 47. OIL FILTERS: Metal oil filters used in cars and other automobiles. 48. MIXED METALS/MATERIALS: Items that are predominately metal with other materials
attached, such as motors, insulated wire, and finished products containing a mixture of metals, or metals and other materials. White goods are banned from Seattle’s disposal. However, segments of large appliances are occasionally found; they are included in this category.
COMPOSTABLE ORGANICS 49. LEAVES AND GRASS: Non-woody plant materials from a yard or garden area, including
grass clippings, leaves, weeds, and garden wastes. 50. PRUNINGS: Cut prunings, 6" or less in diameter, from bushes, shrubs, and trees. 51. FOOD: Food wastes and scraps, including bone, rinds, etc. Excludes the weight of food
containers, except when container weight is not appreciable compared to the food inside. Biodegradable packaging peanuts (made from corn starch) are also included in this category. Excludes fats, oils, and grease.
52. FATS, OILS, AND GREASE: Fatty by-products of food preparation. Includes cooking oil,
butter, lard, and gravy. Can be in liquid or solid form.
OTHER ORGANICS 53. TEXTILES: Rag stock fabric materials including natural and synthetic textiles such as
cotton, wool, silk, woven nylon, rayon, and polyester.

Cascadia Consulting Group, Inc. A-5 2014 Waste Stream Composition Study FINAL Appendices
54. MIXED TEXTILES: Non-rag stock grade textiles such as upholstered items, non-leather shoes and handbags, heavy linens, and draperies.
55. DISPOSABLE DIAPERS: Diapers made from a combination of fibers, synthetic and/or natural, and made for the purpose of single use. This includes disposable baby diapers and adult protective undergarments.
56. ANIMAL BY-PRODUCTS: Animal carcasses not resulting from food storage or
preparation, animal wastes, and kitty litter. 57. RUBBER PRODUCTS: Finished products and scrap materials made of natural and
synthetic rubber, such as bath mats, inner tubes, rubber hoses, rubber carpet padding, and foam rubber.
58. TIRES: Vehicle tires of all types. Tubes are put into the rubber category.
FURNITURE, APPLIANCES, AND ELECTRONICS 59. FURNITURE: Mixed-material furniture such as upholstered chairs. Furniture that is
made purely of one material, such as plastic or metal, would be categorized according to that material (e.g., plastic products or other ferrous metal).
60. MATTRESSES: Mattresses and box springs. 61. SMALL APPLIANCES: Small electric appliances such as toasters, microwave ovens,
power tools, curling irons, and light fixtures. 62. CELL PHONES: Personal digital assistants (PDA) and cell phones. 63. AUDIO/VISUAL EQUIPMENT: Examples include stereos, radios, tape decks, VCRs,
camcorders, and digital cameras. 64. COMPUTER MONITORS: Computer monitors containing a cathode ray tube (CRT). 65. TELEVISIONS: Television sets containing a cathode ray tube (CRT). 66. OTHER ELECTRONICS: Computer items not containing CRTs, such as processors,
mice and mouse pads, keyboards, disk drives, laptops, and other video displays without cathode ray tubes (CRT).
CONSTRUCTION DEBRIS 67. CLEAN DIMENSION LUMBER: Milled lumber commonly used in construction for
framing and related uses, including 2x4s and 2x6s, that is clean (only including trace amounts of paint, nails, and other contaminants). Includes 2x4s with painted ends.
68. CLEAN ENGINEERED WOOD: Clean sheets of plywood, strandboard, particleboard,
and other wood created using glue (only including trace amounts of paint, nails, and other contaminants).
69. PALLETS: Untreated wood pallets, whole and broken.

Cascadia Consulting Group, Inc. A-6 2014 Waste Stream Composition Study FINAL Appendices
70. CRATES: Untreated crates, pieces of crates, and other packaging lumber/panelboard. 71. OTHER UNTREATED WOOD: Compostable prunings or stumps that are 6" or more in
diameter. 72. NEW PAINTED WOOD: Lumber and wood products from new construction that have
been painted so as to render them difficult to compost. 73. OLD PAINTED WOOD: Painted wood from demolition jobs. May be flaky and oxidized.
Includes lead-based painted wood 74. CREOSOTE-TREATED WOOD: Lumber and wood products that have been treated with
creosote so as to render them difficult to compost (with generally 50% or more of the surface area treated).
75. OTHER TREATED WOOD: Lumber and wood products that have been treated (other
than painted or treated with creosote) so as to render them difficult to compost. This includes chemically treated lumber.
76. CONTAMINATED WOOD: Predominantly wood and lumber products that are mixed with
other materials in such a way that they cannot easily be separated. This includes wood with metal, gypsum, concrete, or other contaminants that would not compost easily.
77. NEW GYPSUM SCRAP: Calcium sulfate dehydrate sandwiched between heavy layers
of Kraft-type paper. Also known as drywall. This category includes new drywall that has not been painted or treated in other ways. Excludes GP DensGlass (and other brands) of exterior or roof paneling which is gypsum sandwiched between a fiberglass-reinforced coating.
78. DEMO GYPSUM SCRAP: Used or demolition gypsum wallboard scrap that has been
painted or treated.
79. CARPET: General category of flooring applications and non-rag stock textiles consisting of various natural or synthetic fibers bonded to some type of backing material.
80. FELT CARPET PAD: Fiber carpet pads made of jute, hair, or synthetic materials, such as recycled carpet fibers. This material may be coated with latex or other resin.
81. FIBERGLASS INSULATION: Fiberglass building and mechanical insulation, batt or rigid. 82. CONCRETE: A hard material made from sand, gravel, aggregate, cement mix, and
water. This category includes concrete containing steel mesh and/or reinforcement bars, or "rebar". Examples include pieces of building foundations, concrete paving, and cinder blocks.
83. ASPHALT PAVING: A black or brown, tar-like material mixed with aggregate and used as a paving material. This category includes asphalt paving containing steel mesh and/or reinforcement bars, or "rebar."

Cascadia Consulting Group, Inc. A-7 2014 Waste Stream Composition Study FINAL Appendices
84. OTHER AGGREGATES: Aggregates other than concrete and asphalt paving, such as bricks, masonry tile, and clay roofing tiles.
85. ROCK: Rock gravel larger than 2” in diameter.
86. ASPHALT SHINGLES: Roofing material composed of fiberglass or organic felts saturated with asphalt and covered with inert aggregates as well as attached roofing tar and tar paper. Commonly known as three-tab roofing shingles but including older designs as well.
87. OTHER ASPHALTIC ROOFING: Other roofing material made with layers of felt, asphalt,
aggregates, and attached roofing tar and tar paper, most commonly used on flat/low pitched roofs on commercial buildings. Includes tar and gravel or “built-up roof membranes” as well as other asphaltic roofing membranes.
88. CERAMICS: Finished ceramic or porcelain products such as toilets, sinks, and some
dishware. 89. CEMENT FIBER BOARD: A composite building material containing cement and wood
fiber. Includes Hardiplank, Hardiboard, tile backer board, and other similar products. 90. DRIED LATEX PAINTS: Water-based paints and similar products that have dried.
Excludes empty paint containers and paint that is outweighed by the container.
91. SINGLE-PLY ROOFING MEMBRANES: Plastic roofing membranes typically installed in gray, white, or black sheets. This category includes thermoplastic membranes, such as PVC or thermoplastic olefin (TPO), or thermoset roofing membranes, such as Ethylene Propylene Diene Monomer (EPDM) or “rubber” roofs.
92. CEILING TILES: Fiber or composite acoustic ceiling tiles. 93. OTHER CONSTRUCTION DEBRIS: Construction debris (other than wood) that cannot
be classified elsewhere and mixed fine building material scraps. For example, floor sweepings from construction activities containing sawdust, nails, wire, etc. Includes GP DensGlass (and other brands) of exterior or roof paneling which is gypsum sandwiched between a fiberglass-reinforced coating.
POTENTIALLY HARMFUL WASTES 94. LIQUID LATEX PAINTS: Water-based paints and similar products in liquid form.
Excludes empty paint containers and paint that is outweighed by the container. 95. SOLVENT-BASED ADHESIVES/GLUES: Oil/resin/volatile solvent-based glues and
adhesives, including epoxy, rubber cement, two-part glues and sealers, and auto body fillers.
96. WATER-BASED ADHESIVES/GLUES: Water-based glues, caulking compounds, grouts,
and Spackle. 97. OIL-BASED PAINT/SOLVENT: Solvent-based paints, varnishes, and similar products.
Various solvents, including chlorinated and flammable solvents, paint strippers, solvents

Cascadia Consulting Group, Inc. A-8 2014 Waste Stream Composition Study FINAL Appendices
contaminated with other products such as paints, degreasers and some other cleaners if the primary ingredient is (or was) a solvent, or alcohol such as methanol and isopropanol.
98. CAUSTIC CLEANERS: Caustic acids and bases whose primary purpose is to clean
surfaces, unclog drains, or perform other actions. 99. PESTICIDES/HERBICIDES: Variety of poisons with the purpose of discouraging or
killing insects, weeds, or microorganisms. Fungicides and wood preservatives, such as pentachlorophenol, are also included.
100. RECHARGEABLE BATTERIES: Rechargeable batteries, such as those found in cordless power tools, cell phones, laptops, digital cameras, toothbrushes, and remote control toys.
101. OTHER DRY-CELL BATTERIES: Dry-cell batteries of various sizes and types commonly
used in households. Includes button cell batteries, such as those found in watches and hearing aids.
102. WET-CELL BATTERIES: Wet-cell batteries of various sizes and types commonly used
in automobiles. 103. GASOLINE/KEROSENE: Gasoline, diesel fuel, and fuel oils. 104. MOTOR OIL/DIESEL OIL: Lubricating oils, primarily used in vehicles but including other
types with similar characteristics. 105. ASBESTOS: Asbestos and asbestos-containing wastes (if this is the primary hazard
associated with these wastes). 106. EXPLOSIVES: Gunpowder, unspent ammunition, picric acid, and other potentially
explosive chemicals. 107. MEDICAL WASTES: Materials typically discarded in a health care setting, such as I.V.
tubing and patient drapes, specimen containers, and Petri dishes. Medical wastes that could be considered a biohazard are weighed, but not further sorted.
108. OTHER CLEANERS/CHEMICALS: Non-caustic cleaners, and other household
chemicals. 109. PHARMACEUTICALS AND VITAMINS: Both prescription and over-the-counter
medications and supplements in all forms, including pills, liquid medications, creams, and ointments. Does not include containers for these items, except for tubes for creams and ointments and other containers that cannot be easily separated from the product they contain.
110. PERSONAL CARE/COSMETICS: Hygiene and grooming products, including bar soap,
shower gel, shampoo, conditioner, hairspray, deodorant, body powder, lotions, nail polish and remover, makeup, etc. Does not include containers for these items, except when containers cannot be easily separated from the product they contain.

Cascadia Consulting Group, Inc. A-9 2014 Waste Stream Composition Study FINAL Appendices
111. OTHER POTENTIALLY HARMFUL WASTES: Other chemicals or potentially harmful wastes that do not fit into the above categories, including unidentifiable materials.
FINES AND MISCELLANEOUS MATERIALS 112. SAND/SOIL/DIRT: Sand, soil, dirt, and gravel smaller than 2" in diameter. 113. NONDISTINCT FINES: Mixed MSW fines smaller than 2” in diameter. 114. MISCELLANEOUS ORGANICS: Combustible materials including wax; cigarette butts;
scraps of leather and leather products including shoes and belts; feminine hygiene products; briquettes; fireplace, burn barrel and fire pit ash; and other organic materials not classified elsewhere.
115. MISCELLANEOUS INORGANICS: Other inorganic, non-combustible materials not
classified elsewhere.
Changes to Waste Component Categories
The material types used to categorize Seattle’s waste stream have been refined over the years. The component categories for 2014 were updated and divided into 115 material components to provide more detail about specific materials in the waste stream. The material categories in the 2014 study are based on those used in Seattle’s 2012 commercial and self-haul waste study. Table A-1 provides an explanation of changes shown in Table A-2. Table A-2 tracks how the component categories have changed since 1988/1989. An “X” signifies that the component remained the same from the previous study period. If a component was split into two or more component categories (e.g., compostable/soiled paper into compostable/soiled paper and OCC/Kraft, waxed), then the rows will look like the example highlighted below in 1994 and 1996. If the two or more materials are combined into one material component category (e.g., mixed low grade and polycoated paper into mixed low grade), the rows will look like the example highlighted below in 2004 and 2006.
Table A-1: Explanation of Track Changes
1994 1996 1998/99 2000 2002 2004 2006
PAPER
New spaper x x x x x New spaper
OCC/Kraft OCC/Kraft, Unw axed x x x x Plain OCC/Kraft
Office Paper x x x x
Computer Paper x x x x
Mixed Low Grade x x x x
Phone Books x x x x
Milk/Juice Polycoats x x x x
Frozen Food Polycoats x x x x
x x x Compostable Paper x Compostable Paper
OCC/Kraft, Waxed x x x x Waxed OCC/Kraft
Paper/Other Materials x x x x
Other Paper x x x x
Compostable/Soiled
High Grade Paper
Mixed/Other Paper Mixed/Other Paper
High Grade Paper
Mixed Low Grade
Mixed Low Grade
Polycoated Paper

Cascadia Consulting Group, Inc. A-10 2014 Waste Stream Composition Study FINAL Appendices
Table A-2: Changes to Waste Component Categories, 1988 to present
1988/89 1990 1992 1994 1996 1998/99 2000 2002 2004 2006 2008 2010 2012 2014
PAPER
Newspaper x x x x x x x x x x x x x
Corrugated Paper
x x x x x x x x x x x
Plain OCC/ Kraft Paper
x
Grocery/ Shopping
Bags x
Office Paper
x x x x x x x High-grade
Paper x x x x x
Computer Paper
x x x x x x x
Mixed Scrap Paper
x x
Mixed Scrap Paper
x x x x Mixed Low-grade Paper
Mixed Low-grade
Paper x x
Mixed Low-grade Paper
x
Phone Books x x x x
Other Paper
x x
Milk/Juice Polycoats
x x x x Polycoated
Paper Polycoated
Paper x
Frozen Food Polycoats
x x x x
Compostable/ Soiled Paper
Compostable/ Soiled Paper
x x x x x
Compostable/ Soiled Paper
x x x
Single-use Food Service
Paper
Potentially Compostable
Single-use Food Service
x x
Other Single-use Food Service Paper
Non-Compostable Single-Use
Food Service
x
OCC/Kraft, Waxed
x x x x x x x x x
Paper/ Other Materials
x x x x Mixed/Other Paper
x x x x x
Other Paper x x x x

Cascadia Consulting Group, Inc. A-11 2014 Waste Stream Composition Study FINAL Appendices
1988/89 1990 1992 1994 1996 1998/99 2000 2002 2004 2006 2008 2010 2012 2014
PLASTIC
PET Bottles x x x
PET Pop & Liquor
x x x x #1 PET Bottles
#1 PET Bottles
x x x Other PET
Bottles x x x x
Moved to "Other Plastic Bottles"
HDPE Bottles
x x
HDPE Milk & Juice
x x x x
#2 HDPE Natural Bottles
x x x x x
#2 HDPE Colored
x x x x x
Other HDPE Bottles
x x x x
Moved to "Other Plastic Bottles"
Moved to "Other Rigid
Packaging"
x x x x
Plastic Packaging
Other Plastic Bottles
x x x x x x x x x x Other Plastic Bottles
x
Plastic Packaging
x Other Rigid
Containers Jars & Tubs x x x x x
Tubs #1-#7
x x x
Plastic Packaging
x x Other Rigid
Packaging x x x x x x
Single-use Food
Service Plastics
Potentially Compostable
Single-use Food Service
x x
Non-Compostable
Single-use Food Service
x x
Other Rigid
Packaging #1-#7
x x x
Plastic Packaging
x x
Grocery/ Bread Bags
x x x x
Clean Shopping/
Dry Cleaner Bags
x x x x x
Other Film
Garbage Bags x x x Other Clean
PE Film x x x
Other Clean PE
Film x
Other Film x x x
Stretch Wrap
x
Other Film x x x x x
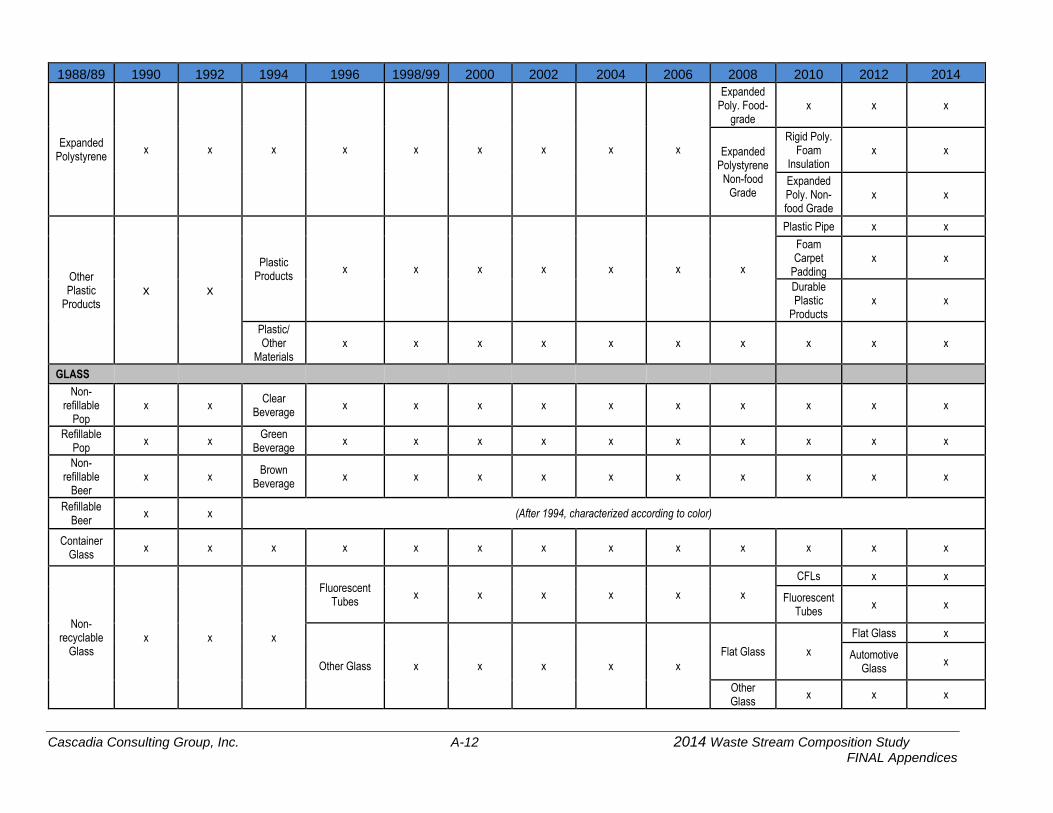
Cascadia Consulting Group, Inc. A-12 2014 Waste Stream Composition Study FINAL Appendices
1988/89 1990 1992 1994 1996 1998/99 2000 2002 2004 2006 2008 2010 2012 2014
Expanded Polystyrene
x x x x x x x x x
Expanded Poly. Food-
grade x x x
Expanded Polystyrene
Non-food Grade
Rigid Poly. Foam
Insulation x x
Expanded Poly. Non-food Grade
x x
Other Plastic
Products x x
Plastic Products
x x x x x x x
Plastic Pipe x x
Foam Carpet
Padding x x
Durable Plastic
Products x x
Plastic/ Other
Materials x x x x x x x x x x
GLASS
Non-refillable
Pop x x
Clear Beverage
x x x x x x x x x x
Refillable Pop
x x Green
Beverage x x x x x x x x x x
Non-refillable
Beer x x
Brown Beverage
x x x x x x x x x x
Refillable Beer
x x (After 1994, characterized according to color)
Container Glass
x x x x x x x x x x x x x
Non-recyclable
Glass x x x
Fluorescent Tubes
x x x x x x
CFLs x x
Fluorescent Tubes
x x
Other Glass x x x x x
Flat Glass x
Flat Glass x
Automotive Glass
x
Other Glass
x x x

Cascadia Consulting Group, Inc. A-13 2014 Waste Stream Composition Study FINAL Appendices
1988/89 1990 1992 1994 1996 1998/99 2000 2002 2004 2006 2008 2010 2012 2014
METAL
Aluminum Cans
x x x x x x x x x x x x x
Aluminum Foil/
Containers x x x x x x x x x x x x x
Nonferrous x x
Nonferrous Other
Nonferrous x x x x x x x x x
Other Aluminum
Other Aluminum
x x x x x x x x x
Empty Aerosol Cans
x x x x x x x x x
Tinned Cans
x x x x x x x x x x x Steel Food
Cans x
Bi-metal Cans
x x (After 1994, characterized according to predominant metal)
Ferrous x x x x x x x x x x x Other
Ferrous x
Mixed Metals/
Materials x x x x x x x x x x x x x
(Before 1998/99, was not characterized) Metal Oil
Filters x x x x x x x x
White Goods
x x (After 1994, banned from disposal. Parts show up in "Mixed Metals")
COMPOSTABLE ORGANICS
Leaves and Grass
x x x x x x x x x x x x x
Prunings x x x x x x x x x x x x x
Food x x x x x x x x x x
Fats, Oils, & Grease
x x
Food x x

Cascadia Consulting Group, Inc. A-14 2014 Waste Stream Composition Study FINAL Appendices
1988/89 1990 1992 1994 1996 1998/99 2000 2002 2004 2006 2008 2010 2012 2014
(COMPOSTABLE and OTHER ORGANICS Combined as ORGANICS prior to 2012) OTHER ORGANICS
Textiles x x
Textiles Textiles/ Clothing
x x x
Moved to "Organics"
Textiles x x x x
Carpet/ Upholstery
x x x x
Mixed Textiles
x x x x
Carpet x x Moved to
Construction Debris
x
Disposable Diapers
x x x x x x x Disposable
Diapers x x x x
(Discarded from samples prior to 1994) Animal By-Products
x x x x Animal By-products
x x x x
Rubber Products
x x moved to
"Other Materials"
x x x x Rubber
Products x x x x
Tires x x moved to
"Other Materials"
x x x x Tires x x x x
FURNITURE, APPLIANCES, AND ELECTRONICS
(Prior to 1994, split among various materials; Mixed Metal, Textiles, Other
Plastics, etc.) Furniture x x x x
Moved to "Furniture, Appliances,
& Electronics"
Furniture x x x x
(Prior to 1994, split among various materials; Mixed Metal, Textiles, Other
Plastics, etc.) Mattresses x x x x Mattresses x x x x
(Prior to 1994, split among various materials; Mixed Metal, Textiles, Other
Plastics, etc.)
Small Appliances
x x x x Small
Appliances x x x x

Cascadia Consulting Group, Inc. A-15 2014 Waste Stream Composition Study FINAL Appendices
1988/89 1990 1992 1994 1996 1998/99 2000 2002 2004 2006 2008 2010 2012 2014
(Prior to 1994, split among various materials; Mixed Metal, Textiles, Other
Plastics, etc.)
A/V Equipment
x x
x x
Moved to "Furniture, Appliances,
& Electronics"
Audio/Visual Equipment
x
Cell Phones x x
Audio/Visual Equipment
x x
Televisions &
Computer Monitors
Television Sets
Computer Monitors
x x x x
Computer Monitors
Televisions x x x x
Other Computer Equipment
x Other
Computer Equipment
x Other
Electronics x x
CONSTRUCTION DEBRIS
Wood x Untreated
Wood
Untreated Wood
Dimension Lumber
x x x x x
Clean Dimension
Lumber x x x
Clean Engineered
Wood x x x
Crates/ Pallets
Other Untreated
Wood x x x x x x x x x
Pallets x x x x x x x x x
Crates/Boxes x x x x Crates x x x x
Wood x Treated Wood
x
Treated Wood x x x x x
New Painted Wood
x x x
Old Painted Wood
x x x
Creosote-treated Wood
x x x
Other Treated Wood
x x x
Contaminated Wood
x x x x x x x x x

Cascadia Consulting Group, Inc. A-16 2014 Waste Stream Composition Study FINAL Appendices
1988/89 1990 1992 1994 1996 1998/99 2000 2002 2004 2006 2008 2010 2012 2014
Gypsum Drywall
x x x
New Gypsum Scrap
x x x x x x x x x
Demo Gypsum Scrap
x x x x x x x x x
Fiberglass Insulation
x x x Moved to
"Construction Debris"
x x x x x x x x x
Rock/ Concrete/
Brick x x x
Moved to "Construction
Debris" x x x x x x x
Concrete x
Asphalt Paving
x
Other Aggregates
x
Rock x
Ceramics, Porcelain,
China x x x x x x x
Moved to "Construction
Debris" Ceramics x x x x
Other Construction
Debris x x x
Asphaltic Roofing
x x x x x
Asphalt Shingles
x x x
Other Asphaltic Roofing
x x x
Other
Construction Debris
Cement Fiber Board
x x
Other Construction
Debris
Dried Latex Paint
x
Single-ply Roofing
Membranes x
Ceiling Tiles x
Other Construction
Debris x

Cascadia Consulting Group, Inc. A-17 2014 Waste Stream Composition Study FINAL Appendices
1988/89 1990 1992 1994 1996 1998/99 2000 2002 2004 2006 2008 2010 2012 2014
POTENTIALLY HARMFUL WASTE
Latex Paints
x x x x x x x x x x
Liquid Latex Paint
x x
Dried Latex Paint
Moved to "Construction
Debris" x
Adhesives/ Glues
x x x
Hazardous Glue/Adhesives
x x x
Solvent-based
Adhesives/ Glues
x x x x x
Non-hazardous Glue/Adhesives
x x x
Water-based
Adhesives/ Glues
x x x x x
Oil-based Paints/
Solvents x x x x x x x x x x x x x
Cleaners x x x x x x x Caustic
Cleaners x x x x x
Pesticides/ Herbicides
x x x x x x x x x x x x x
Batteries x x
Dry-cell Batteries
x x x x x x x x x x
Wet-cell Batteries
x x x x x x x x x x
Gasoline/ Kerosene
x x x x x x x x x x x x x
Motor Oil/ Diesel Oil
x x x x x x x x x x x x x
Asbestos x x x x x x x x x x x x x
Explosives x x x x x x x x x x x x x

Cascadia Consulting Group, Inc. A-18 2014 Waste Stream Composition Study FINAL Appendices
1988/89 1990 1992 1994 1996 1998/99 2000 2002 2004 2006 2008 2010 2012 2014
Other Chemicals
x x x
Other Hazardous Chemicals
x x x
Medical Waste
x x x x x
Other Cleaners/ Chemicals
x x x x
Other Cleaners/ Chemicals
Pharmaceuticals/ Vitamins
Personal Care/ Cosmetics
Other Non-hazardous Chemicals
x x x
Other Potentially Harmful Wastes
x x x x x
FINES AND MISCELLANEOUS MATERIALS
Sand, Dirt, Non-
distinct Fines
x x
Sand/Soil/ Dirt
Moved to "Construction
Debris" x x x
Moved to "Fines &
Miscellaneous Materials"
Sand/Soil/ Dirt
x x x x
Non-distinct Fines
x x x x
Moved to "Fines &
Miscellaneous Materials"
Non-distinct Fines
x x x x
Ash x x x x x x x
Moved to "Fines &
Miscellaneous Materials"
Misc. Organics
x x x x
Leather x x x x x x x
(Prior to 1994, mostly in "Sand, Dirt, Non-distinct Fines; also in various "Mixed" and "Other" categories)
Misc. Organics
x x x x
(Prior to 1994, mostly in "Sand, Dirt, Non-distinct Fines; also in various "Mixed" and "Other" categories)
Misc. Inorganics
x x x x
Moved to "Fines &
Miscellaneous Materials"
Misc. Inorganics
x x x x

Cascadia Consulting Group, Inc. B-1 2014 Waste Stream Composition Study FINAL Appendices
Appendix B. Sampling Methodology
Overview
The objective of the 2014 Seattle Waste Composition Study was to provide statistically significant data on the composition of residential wastes from single-family and multifamily households in the City of Seattle. The residential waste stream was last sampled in 2010. The current project followed the same basic methodology as the previous study. This appendix outlines the sampling methodology for the current study.
Sampling Populations
This study examined waste disposed by two types of generators: single-family and multifamily residences. All materials were collected from Seattle’s two contracted haulers, each serving two of the four collection zones located throughout the City (Figure B-1). Self-hauled residential waste loads were not included in this study.
Figure B-1: Seattle’s Collection Zones
In Seattle, single-family and multifamily generators are defined as follows:
Single-family: Primarily detached single-family, duplex, triplex, and four-plex homes. Waste is collected from garbage cans.
Multifamily: Primarily apartments and condominiums with five or more units. Waste is collected from dumpsters.

Cascadia Consulting Group, Inc. B-2 2014 Waste Stream Composition Study FINAL Appendices
The single-family and multifamily samples were evenly distributed across the four waste collection zones to ensure comparability of data across all four zones. Table B-1 shows the eight residential subpopulations, according to residence type and collection zones.
Table B-1: Subpopulations, by Residence Type and Collection Zones
Generator Type Single-family Multifamily
Wa
ste
Co
lle
cti
on
Zo
nes
On
e
Single-family Zone 1
Multifamily
Zone 1
Tw
o
Single-family Zone 2
Multifamily
Zone 2 T
hre
e
Single-family Zone 3
Multifamily
Zone 3
Four
Single-family Zone 4
Multifamily
Zone 4
Sample Allocation
In the past Seattle housing was predominately comprised of single-family residences. This has recently shifted, and currently there is nearly a 1:1 ratio between single-family and multifamily residential units in Seattle. To match the shift in Seattle’s housing stock, equal numbers of study samples are allocated to the single-family and multifamily substreams. This shift also mitigates a potential source of bias (different sample numbers) when comparing the composition data between the two generator types. Table B-2 outlines the total number of waste samples that were planned for the 2014 study and the actual number of samples sorted, by residence type and service area.
Table B-2: Planned versus Actual Number of Samples
Planned Number of Samples
Actual Number of Samples
Single-family Zone 1 45 47 Zone 2 Zone 3 Zone 4
45 45 45
45 45 45
Multifamily
Zone 1 Zone 2 Zone 3 Zone 4
45 45 45 45
45 45 46 44
Total 360 362

Cascadia Consulting Group, Inc. B-3 2014 Waste Stream Composition Study FINAL Appendices
Sampling Calendar
To reflect seasonal variation in the amounts and types of waste disposed by Seattle residents, the samples were distributed across the 12-month study period. Since the field crew can sort approximately 12 samples of waste per day, 30 days of sampling were initially scheduled. Sampling events were completed every other month, beginning in January. Monthly sampling events each consisted of five consecutive days (Monday-Friday) of sampling. Sampling dates at each facility were selected using a random process and then adjusted in several instances to avoid sampling on or around holidays, to accommodate the sorting crew’s availability, or to improve the distribution across days of the week and weeks of the month. The sampling calendar was designed using the following steps.
Step 1: Selected weeks for sampling events. Sampling was scheduled for every other month starting in January of 2014, for five consecutive days. The week of sampling for each of the six months was randomly selected, then assessed for conflicts. Sampling weeks for January and November were adjusted to accommodate the sampling crew’s availability, and the sampling week in May was adjusted to avoid the Memorial Day holiday. In all, sampling events for three months were adjusted due to conflicts.
Step 2: Selected days within each sampling week. Because each season included five days of sorting, and to maximize the sort crew efficiency, each sampling event began on a Monday.
Step 3: Assigned sampling days to transfer stations. Waste sampling days were randomly assigned to a transfer station for the first sampling season in January. The North Recycling and Disposal Stations (NRDS) closed Jan 20, 2014, for renovation for the remainder of the year, so all sampling over the final five sampling months (or events) occurred at the South Recycling and Disposal Station (SRDS).
Table B-3 presents the waste sampling calendar, as well as the planned and actual samples sorted on each day.
Table B-3: Waste Sampling Calendar
Date Facility Day of the Week
Week of the Month
Planned Samples
Actual Samples
Difference
1/13/2014 NRDS Monday 2 12 5 -7
1/14/2014 NRDS Tuesday 2 12 13 1
1/15/2014 SRDS Wednesday 3 12 20 8
1/16/2014 NRDS Thursday 3 12 13 1
1/17/2014 SRDS Friday 3 12 9 -3
3/3/2014 SRDS Monday 1 12 15 3
3/4/2014 SRDS Tuesday 1 12 12 0
3/5/2014 SRDS Wednesday 1 12 9 -3
3/6/2014 SRDS Thursday 1 12 14 2
3/7/2014 SRDS Friday 1 12 11 -1
5/19/2014 SRDS Monday 3 12 13 1
5/20/2014 SRDS Tuesday 3 12 14 2
5/21/2014 SRDS Wednesday 3 12 11 -1
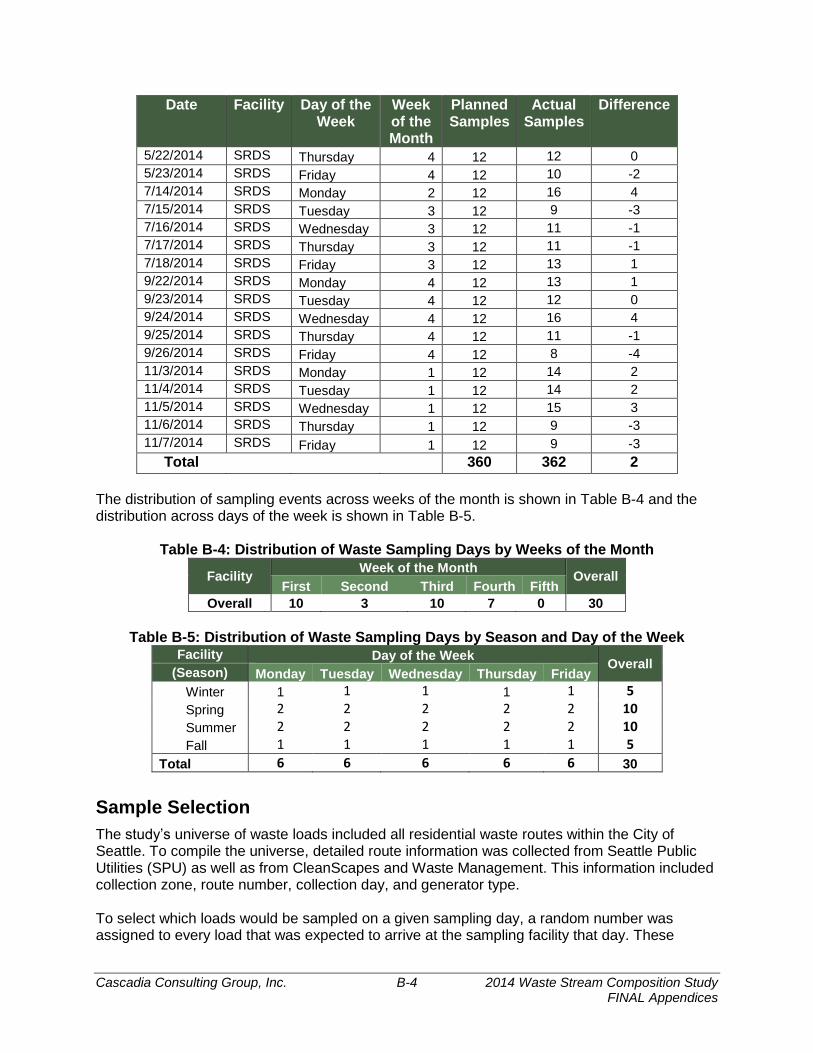
Cascadia Consulting Group, Inc. B-4 2014 Waste Stream Composition Study FINAL Appendices
Date Facility Day of the Week
Week of the Month
Planned Samples
Actual Samples
Difference
5/22/2014 SRDS Thursday 4 12 12 0
5/23/2014 SRDS Friday 4 12 10 -2
7/14/2014 SRDS Monday 2 12 16 4
7/15/2014 SRDS Tuesday 3 12 9 -3
7/16/2014 SRDS Wednesday 3 12 11 -1
7/17/2014 SRDS Thursday 3 12 11 -1
7/18/2014 SRDS Friday 3 12 13 1
9/22/2014 SRDS Monday 4 12 13 1
9/23/2014 SRDS Tuesday 4 12 12 0
9/24/2014 SRDS Wednesday 4 12 16 4
9/25/2014 SRDS Thursday 4 12 11 -1
9/26/2014 SRDS Friday 4 12 8 -4
11/3/2014 SRDS Monday 1 12 14 2
11/4/2014 SRDS Tuesday 1 12 14 2
11/5/2014 SRDS Wednesday 1 12 15 3
11/6/2014 SRDS Thursday 1 12 9 -3
11/7/2014 SRDS Friday 1 12 9 -3
Total 360 362 2
The distribution of sampling events across weeks of the month is shown in Table B-4 and the distribution across days of the week is shown in Table B-5.
Table B-4: Distribution of Waste Sampling Days by Weeks of the Month
Facility Week of the Month
Overall First Second Third Fourth Fifth
Overall 10 3 10 7 0 30
Table B-5: Distribution of Waste Sampling Days by Season and Day of the Week
Facility Day of the Week Overall
(Season) Monday Tuesday Wednesday Thursday Friday
Winter 1 1 1 1 1 5
Spring 2 2 2 2 2 10
Summer 2 2 2 2 2 10
Fall 1 1 1 1 1 5
Total 6 6 6 6 6 30
Sample Selection
The study’s universe of waste loads included all residential waste routes within the City of Seattle. To compile the universe, detailed route information was collected from Seattle Public Utilities (SPU) as well as from CleanScapes and Waste Management. This information included collection zone, route number, collection day, and generator type. To select which loads would be sampled on a given sampling day, a random number was assigned to every load that was expected to arrive at the sampling facility that day. These

Cascadia Consulting Group, Inc. B-5 2014 Waste Stream Composition Study FINAL Appendices
random numbers were sorted, and the loads with the lowest random number were selected in sequence until the target number of samples was achieved. For subsequent sampling days, a new random number was assigned to each load, and the process was repeated. An additional single-family route was added to the list of routes scheduled on each sampling day. The additional routes provided “contingency samples” that were obtained and sorted in the event that one of the vehicles for the regularly-planned collection route failed to arrive on time or was not intercepted in time to obtain a sample. This study was designed to sample “pure” loads of single-family and multifamily waste only. When mixed loads were selected for sampling, drivers were instructed by the contracted haulers to collect multifamily waste separately from commercial waste to deliver a pure multifamily load for sampling. As the study progressed, the sampling plan was modified to meet the objectives of the study. For example, additional sampling days were added in some months to compensate for previous months where sorting crews could not sample an adequate number of loads. Missed sampling days could often be attributed to miscommunication between the drivers and the sampling crews. Appendix C provides more details regarding monthly sampling events.
Hauler and Transfer Station Participation
The City owns and operates two transfer stations (North and South Recycling and Disposal Stations – NRDS and SRDS). In the past, both of the City’s contracted haulers delivered most residential waste loads to the two stations. In January of 2014, the NRDS was closed down for a remodel and the remainder of sampling for the calendar year occurred at SRDS. Depending on several factors that vary daily (e.g., time needed to cover a specified route, traffic at the site), loads from the four service areas are typically taken to SRDS, but may be diverted to a private station if there is a problem at the nearest city station. At the outset of the study, meetings were held with hauler and transfer station staff to communicate study objectives and explain all sampling procedures. Additionally, hauler and transfer station contacts received a schedule of all the sampling events for the year. Haulers were sent reminders the week prior to each sampling event. Several days prior to each selected sampling day, the universe of routes believed to be scheduled for the sampling day was sent to each hauler. The hauler verified that route numbers were correct; added truck numbers, driver names, and vehicle arrival times; and returned the list. From the lists of routes, the target numbers of routes were randomly selected to correspond to the number of samples required from each subpopulation on each sampling day. The list of vehicles selected for sampling were forwarded to the hauler and verified verbally. In addition, the haulers were reminded to notify drivers of selected vehicles that they were to participate in the sampling activities and to which transfer station they were expected to deliver their selected load. Affected transfer station personnel were contacted using a similar process as used with haulers: affected transfer station staff were notified the week and the day prior to sampling to ensure that all staff were aware of the sampling event and that no conflicting circumstances had arisen.

Cascadia Consulting Group, Inc. B-6 2014 Waste Stream Composition Study FINAL Appendices
Field Procedures
The field supervisor coordinated all logistics involving truck selection, sample extraction, sorting area, and disposal of sorted materials with transfer station staff. As the selected truck dumped at the transfer station, a loader operator “nosed” the bucket of the loader into the stream of material falling from the truck and captured about 1 cubic yard (approximately 250 pounds) of garbage. Each sample was placed on a clean tarp and sorted by hand into 115 component categories as defined in Appendix A. Components were placed in plastic laundry baskets to be weighed and recorded. Each sample was sorted to the greatest reasonable detail. The field supervisor monitored the homogeneity of the component baskets as material accumulated, rejecting items that may have been improperly classified. Open laundry baskets allowed the field supervisor to see the material at all times. The weights of all materials were recorded on a waste tally sheet (see Appendix F).
Changes in Methodology from 2010 Study
The sampling methodology for this study differed from 2010 in the following ways:
Equal numbers of samples were allocated to the single-family and multifamily substreams instead of a 2:1 ratio as in previous studies.
Samples were collected for five consecutive days every other month of the year instead of two to three days every month.
NRDS was closed for the March through November field seasons. All samples were collected at SRDS during that time period.
The component categories were updated to provide more detail about specific materials in the waste stream. These category changes are tracked in Appendix A.
Cascadia Consulting Group, Inc. C-1 2014 Waste Stream Composition Study FINAL Appendices
Appendix C. Comments on Monthly Sampling Events
This section presents monthly sampling progress reports that were sent to the SPU project manager throughout the year. Each summary presents days and station(s) where sampling took place, either at the North Recycling Disposal Station (NRDS) or the South Recycling Disposal Station (SRDS); the total number of samples sorted compared to the goal for that sampling event; and whether any samples were missed or replaced by a different zone or sector. Each section also includes a table detailing the number of samples that were actually sorted versus the number originally planned, by sector and zone.
January
Five days of sampling took place from Monday, January 13 to Friday, January 17. Overall, 60 samples were sorted; 60 samples was the goal. Due to a communications breakdown with the haulers, most of the Zone 1 samples on January 13 went to SRDS instead of NRDS. The field crew worked with the route managers through the rest of the week to collect and sort additional Zone 1 samples at SRDS. For each day and zone, the difference from planned samples ranged from zero to seven. For the week, actual samples were within one of the target for each zone.

Cascadia Consulting Group, Inc. C-2 2014 Waste Stream Composition Study FINAL Appendices
Generator Zone 1/13/2014 1/14/2014 1/15/2014 1/16/2014 1/17/2014 Total
Actual Single-family
1 1 4 2 2 9
Single-family
2 3 4 2 1 10
Single-family
3 3 4 3 1 11
Single-family
4 1 4 1 4 10
Multifamily 1 4 4
Multifamily 2 1 2 1 4
Multifamily 3 3 2 2 7
Multifamily 4 2 2 1 5
Difference from Planned
Single-family
1 (7) 0 4 2 2 1
Single-family
2 0 1 1 (1) (2) (1)
Single-family
3 0 (1) 1 2 (1) 1
Single-family
4 0 (1) 2 (3) 1 (1)
Multifamily 1 0 0 0 0 0 0
Multifamily 2 0 0 0 0 (1) (1)
Multifamily 3 0 1 0 1 (1) 1
Multifamily 4 0 1 0 0 (1) 0
March
Five days of sampling took place from Monday, March 3 to Friday, March 7. Overall, 61 samples of residential waste were sorted in March; 60 samples was the goal. On most days in most zones, the planned number of samples were sorted; the actual number of samples sorted differed from the planned number of samples by one in some cases. For the week, one fewer Zone 3 single-family sample, one greater Zone 3 multifamily sample, and one greater Zone 4 multifamily sample was sorted than planned.

Cascadia Consulting Group, Inc. C-3 2014 Waste Stream Composition Study FINAL Appendices
Generator Zone 3/3/2014 3/4/2014 3/5/2014 3/6/2014 3/7/2014 Total
Actual Single-family
1 2 2 1 2 1 8
Single-family
2 2 2 1 1 1 7
Single-family
3 1 1 1 2 1 6
Single-family
4 2 1 2 1 6
Multifamily 1 2 2 2 1 2 9
Multifamily 2 3 1 1 2 1 8
Multifamily 3 2 1 2 2 2 9
Multifamily 4 1 2 1 2 2 8
Difference from Planned
Single-family
1 0 0 (1) 1 0 0
Single-family
2 0 0 0 0 0 0
Single-family
3 0 0 (1) 0 0 (1)
Single-family
4 0 0 (1) 1 0 0
Multifamily 1 0 0 0 (1) 1 0
Multifamily 2 1 (1) (1) 1 0 0
Multifamily 3 0 0 0 1 0 1
Multifamily 4 0 0 0 0 1 1
May
Five days of sampling took place from Monday, May 19 through Friday, May 23. By generator, day, and zone, the actual samples differed from the planned number of samples by two at the most. For the week, the number of samples completed was one fewer than planned for Single-family Zone 1, Multifamily Zone 1, and Multifamily Zone 3. For Single-family Zone 3 and 4 and Multifamily Zone 4, one more sample was sorted than planned.

Cascadia Consulting Group, Inc. C-4 2014 Waste Stream Composition Study FINAL Appendices
Generator Zone 5/19/2014 5/20/2014 5/21/2014 5/22/2014 5/23/2014 Total
Actual Single-family
1 2 2 1 1 1 7
Single-family
2 1 2 1 2 1 7
Single-family
3 1 2 4 1 8
Single-family
4 1 3 1 2 7
Multifamily 1 2 3 2 1 8
Multifamily 2 2 2 1 1 2 8
Multifamily 3 2 1 1 2 1 7
Multifamily 4 2 2 2 1 1 8
Difference from Planned
Single-family
1 1 0 0 0 0 1
Single-family
2 0 0 0 0 0 0
Single-family
3 (1) 0 (2) 3 0 0
Single-family
4 (1) (1) 1 (1) 1 (1)
Multifamily 1 0 1 0 0 0 1
Multifamily 2 0 0 0 0 0 0
Multifamily 3 0 0 0 0 0 0
Multifamily 4 0 0 0 0 0 0
July
Five days of sampling took place from Monday, July 14 through Friday, July 18. Overall, 60 samples were sorted, one greater than planned. By generator, day, and zone, the actual samples differed from the planned number of samples by two at the most. For the week, the number of samples completed was one fewer than planned for Multifamily Zone 3. One more sample was sorted than planned for Single-family Zone 2 and Multifamily Zone 2.
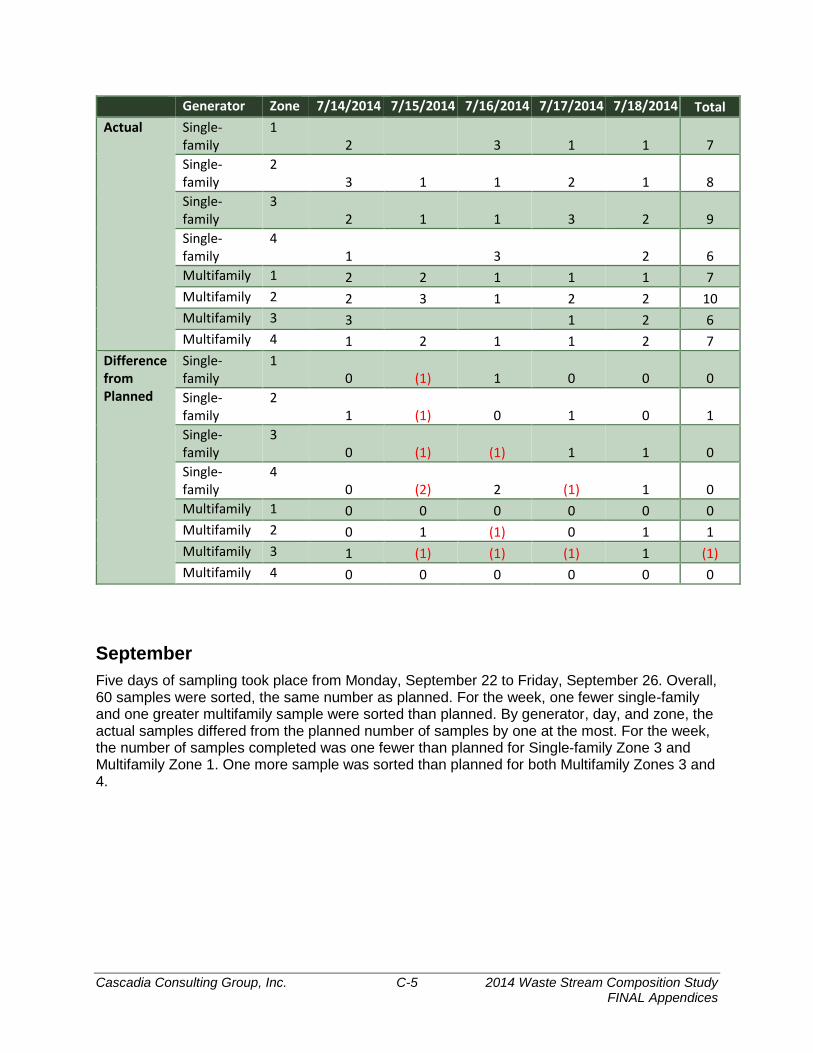
Cascadia Consulting Group, Inc. C-5 2014 Waste Stream Composition Study FINAL Appendices
Generator Zone 7/14/2014 7/15/2014 7/16/2014 7/17/2014 7/18/2014 Total
Actual Single-family
1 2 3 1 1 7
Single-family
2 3 1 1 2 1 8
Single-family
3 2 1 1 3 2 9
Single-family
4 1 3 2 6
Multifamily 1 2 2 1 1 1 7
Multifamily 2 2 3 1 2 2 10
Multifamily 3 3 1 2 6
Multifamily 4 1 2 1 1 2 7
Difference from Planned
Single-family
1 0 (1) 1 0 0 0
Single-family
2 1 (1) 0 1 0 1
Single-family
3 0 (1) (1) 1 1 0
Single-family
4 0 (2) 2 (1) 1 0
Multifamily 1 0 0 0 0 0 0
Multifamily 2 0 1 (1) 0 1 1
Multifamily 3 1 (1) (1) (1) 1 (1)
Multifamily 4 0 0 0 0 0 0
September
Five days of sampling took place from Monday, September 22 to Friday, September 26. Overall, 60 samples were sorted, the same number as planned. For the week, one fewer single-family and one greater multifamily sample were sorted than planned. By generator, day, and zone, the actual samples differed from the planned number of samples by one at the most. For the week, the number of samples completed was one fewer than planned for Single-family Zone 3 and Multifamily Zone 1. One more sample was sorted than planned for both Multifamily Zones 3 and 4.

Cascadia Consulting Group, Inc. C-6 2014 Waste Stream Composition Study FINAL Appendices
Generator Zone 9/22/2014 9/23/2014 9/24/2014 9/25/2014 9/26/2014 Total
Actual
Single-family 1 2 1 3 1 0 7
Single-family 2 2 2 2 1 0 7
Single-family 3 1 1 1 1 1 5
Single-family 4 2 2 1 1 1 7
Multifamily 1 2 2 2 2 0 8
Multifamily 2 1 2 2 1 2 8
Multifamily 3 2 1 2 2 2 9
Multifamily 4 1 1 3 2 2 9
Difference from Planned
Single-family 1 0 0 1 0 (1) 0
Single-family 2 0 0 1 0 (1) 0
Single-family 3 0 (1) 0 0 0 (1)
Single-family 4 0 0 0 0 0 0
Multifamily 1 0 0 0 0 (1) (1)
Multifamily 2 0 0 0 (1) 1 0
Multifamily 3 0 0 0 0 1 1
Multifamily 4 (1) (1) 1 1 1 1
November
Five days of sampling took place from Monday, November 3 through Friday, November 7. Overall, 61 samples were sorted, one greater than what was planned. For the week, two greater single-family and one fewer multifamily sample were sorted than planned. By generator, day, and zone, the actual samples differed from the planned number of samples by two at the most. For the week, the number of samples completed was one fewer than planned for Multifamily Zone 4. Two more samples were sorted than planned for Single-family Zone 1.

Cascadia Consulting Group, Inc. C-7 2014 Waste Stream Composition Study FINAL Appendices
Generator Zone 11/3/2014 11/4/2014 11/5/2014 11/6/2014 11/7/2014 Total
Actual
Single-family 1 2 2 2 1 2 9
Single-family 2 1 2 1 1 1 6
Single-family 3 1 2 1 1 1 6
Single-family 4 2 2 0 3 2 9
Multifamily 1 2 2 3 1 1 9
Multifamily 2 2 1 3 1 0 7
Multifamily 3 2 2 2 1 1 8
Multifamily 4 2 1 3 0 1 7
Difference from Planned
Single-family 1 0 1 0 0 1 2
Single-family 2 0 0 0 0 0 0
Single-family 3 0 0 0 0 0 0
Single-family 4 0 0 (2) 1 1 0
Multifamily 1 0 0 1 (1) 0 0
Multifamily 2 0 0 1 0 (1) 0
Multifamily 3 0 0 0 0 0 0
Multifamily 4 0 (1) 1 (1) 0 (1)
Overall
By sector, all sampling goals but one were met for 2014. The number of Zone 4 Multifamily samples was one short of the goal for the year. As shown in the table below, 362 samples were completed, two more than the goal.
Generator Zone Completed
Samples Overall Target
% Complete
Current Target (based on % complete)
Difference
Single-family 1 47 45 100% 45 2
Single-family 2 45 45 100% 45 0
Single-family 3 45 45 100% 45 0
Single-family 4 45 45 100% 45 0
Subtotal, Single-family 182 180 180 2
Multifamily 1 45 45 100% 45 0
Multifamily 2 45 45 100% 45 0
Multifamily 3 46 45 100% 45 1
Multifamily 4 44 45 100% 45 (1)
Subtotal, Multifamily 180 180 180 0
Total 362 360 360 2

[This page was intentionally left blank.]

Cascadia Consulting Group, Inc. D-1 2014 Waste Stream Composition Study FINAL Appendices
Appendix D. Waste Composition Calculations
Composition Calculations
The composition estimates represent the ratio of the components’ weight to the total waste for each noted subpopulation. They were derived by summing each component’s weight across all of the selected records and dividing by the sum of the total weight of waste, as shown in the following equation:
where: c = weight of particular component
w = sum of all component weights
for i 1 to n
where n = number of selected samples
for j 1 to m
where m = number of components
The confidence interval for this estimate was derived in two steps. First, the variance around the estimate was calculated, accounting for the fact that the ratio includes two random variables (the component and total sample weights). The variance of the ratio estimator equation follows:
where:
Second, confidence intervals at the 90% confidence level were calculated for a component’s mean as follows:
where: t = the value of the t-statistic (1.645) corresponding to a 90% confidence level
For more detail, please refer to Chapter 6 “Ratio, Regression and Difference Estimation” of Elementary Survey Sampling by R.L. Scheaffer, W. Mendenhall and L. Ott (PWS Publishers, 1986).
r
c
wj
ij
i
i
i
V
n w
c r w
nr
ij j i
i
j
1 1
12
2
w
w
n
i
i
r t Vj rj

Cascadia Consulting Group, Inc. D-2 2014 Waste Stream Composition Study FINAL Appendices
Weighted Averages
Waste composition estimates were calculated by using a weighted average procedure. For example, to develop composition estimates for Seattle's multifamily residential waste, sample data from all four zones were combined, with much more importance given to the Multifamily Zone 3 samples (contributing approximately 44% of total multifamily tons disposed). Seattle provided the estimate of tonnage disposed by each of the eight subpopulations. The composition estimates were applied to the relevant tonnages to estimate the amount of waste disposed for each component category for each residence type, collection zone, and season. The weighted average for an overall composition estimate was performed as follows:
where:
p = the proportion of tonnage contributed by the noted subpopulation
r = ratio of component weight to total waste weight in the noted subpopulation
for j 1 to m
where m = number of components
The variance of the weighted average was calculated:
Table D-1 show the weighting percentages that were used to produce the estimates for the overall residential waste stream as well as estimates by generator, zone, and season.
O p r p r p rj j j j 1 1 2 2 3 3* ( * ) ( * ) ...
VarO p V p V p Vj r r rj j j ( * ) ( * ) ( * ) ...1
22
23
2
1 2 3

Cascadia Consulting Group, Inc. D-3 2014 Waste Stream Composition Study FINAL Appendices
Table D-1: Weighting Percentages, Overall
Generator Season Zone Tons
Disposed Percent of Total
Sin
gle
-fam
ily
Fall 1 3,779 3.37%
Fall 2 2,864 2.55%
Fall 3 3,327 2.96%
Fall 4 5,046 4.50%
Spring 1 3,742 3.33%
Spring 2 2,696 2.40%
Spring 3 3,375 3.01%
Spring 4 5,097 4.54%
Summer 1 3,827 3.41%
Summer 2 2,861 2.55%
Summer 3 3,430 3.06%
Summer 4 5,177 4.61%
Winter 1 3,766 3.36%
Winter 2 2,739 2.44%
Winter 3 3,336 2.97%
Winter 4 5,044 4.49%
Mu
ltif
amily
Fall 1 2,243 2.00%
Fall 2 2,280 2.03%
Fall 3 5,840 5.20%
Fall 4 2,855 2.54%
Spring 1 2,164 1.93%
Spring 2 2,262 2.02%
Spring 3 5,756 5.13%
Spring 4 2,899 2.58%
Summer 1 2,252 2.01%
Summer 2 2,179 1.94%
Summer 3 5,816 5.18%
Summer 4 2,798 2.49%
Winter 1 2,126 1.89%
Winter 2 2,230 1.99%
Winter 3 5,633 5.02%
Winter 4 2,800 2.49%
Total 112,238 100.00%
Comparison Calculations
Identifying statistically significant differences requires a two-step calculation. First, assuming that the two groups to be compared have the same variance, a pooled sample variance was calculated:

Cascadia Consulting Group, Inc. D-4 2014 Waste Stream Composition Study FINAL Appendices
Next, the t-statistic was constructed:
The p-value of the t-statistic was calculated based on (n1+n2 -2) degrees of freedom.
Demographic Calculations
Waste compositions for different demographic groups were calculated by considering the median household income and mean household size of each sampled garbage route. Single-family waste samples were grouped according to whether they were collected from garbage routes with high-income, low-income, large household size, or small household size. Once the waste samples were identified as belonging to one of these four demographic groups, waste composition calculations were performed as described above under “Composition Calculations.” Calculations of each garbage route’s mean household size were performed as follows: Population and number of households were obtained for each Census Block in Seattle via the 2010 Census Redistricting Data Summary Files. Geographic locations for Census Blocks in Seattle were obtained in GIS shapefile format from the Census website.1
1. Census Blocks were identified by the Seattle single-family garbage route (serviced by Cleanscapes and Waste Management) that covered that Block area. These companies provided GIS shapefiles of their recent garbage routes. The total population and total households for each garbage route were then calculated by summing the population and number of households for all Census Blocks contained within each route.
2. Mean household size was calculated by dividing the total population of each route by the total number of households.
Calculations of each garbage route’s median income were performed as follows, using information from the 2009-2013 American Community Survey 5-year estimates Summary File.2 Each Census Block Group was identified by the garbage route that covers that Block Group. Figure D-1 presents an example where Block Groups A, B, and C are identified by one designated garbage route, Garbage Route 321. The number of households in each Census Block Group was used to calculate a weighted median income for the route. For instance, because Block Group C contains more households than Block Groups A and B, the median income of Block Group C would be given more importance than the other two Block Groups in calculating the median income for the
1 http://www.census.gov/rdo/data/2010_census_redistricting_data_pl_94-171_summary_files.html 2 http://www.census.gov/acs/www/data_documentation/summary_file/
S
n n V n n V
n npool
r rj j21 21 1 1 2 1 2
1 2 2
t
r r
S
n
S
n
pool pool
1 2
1 2
2 2

Cascadia Consulting Group, Inc. D-5 2014 Waste Stream Composition Study FINAL Appendices
designated garbage route, Garbage Route 321. The weighting was carried out as follows, where “Households” refers to the number of households in each Block Group, and “Income” refers to the median income of each Block Group within the designated route.
Estimated Median Income of Garbage Route 321
=
A Households * A Income + B Households * B Income
+ C Households * C Income
A Households + B Households + C Households
1. The result of this weighting is an approximation of the median income for the designated route.
Figure D-1: Geographies Used in Demographic Calculations
Sampled routes were then divided into quartiles based on the median income and mean household size of each garbage route. Waste samples from the first (0 - 25%) quartile were used to calculate “low income” and “small household” waste compositions and samples from the top quartile (75% - 100%) were used to calculate “high income” and “large household” waste compositions.
Block Group B
Block Group C
A B
C
Garbage Route 321
Small squares indicate Census Blocks
Block Group A

[This page was intentionally left blank]

Cascadia Consulting Group, Inc. E-1 2014 Waste Stream Composition Study FINAL Appendices
Appendix E. Comparison Calculations
The comparison methodology is outlined in the first section of this appendix and the calculations are outlined in Appendix D. For more detail, the remaining sections describe technical issues regarding the statistics.
Background
In an ongoing effort to monitor the types and amounts of materials disposed locally, Seattle has performed several waste composition studies. Differences are often apparent between project years. In this appendix, detailed results from the following comparisons are presented. The results of these comparisons can be used to indicate trends in the composition data.
This report presents the below year-to-year comparisons
1988/89 vs. 2014 2010 vs. 2014
Comparisons examined the changes in the composition percentages for each of the eight broad material categories.3 In order to control for population changes and other factors that may influence the total amount of waste disposed from year to year, the tests described in this appendix measure waste proportions, not actual tonnage. For example, say that mixed low-grade paper accounts for 10% of a particular substream’s disposed waste each year, and that a total of 1,000 tons of waste was disposed in one year and 2,000 tons of waste in the next. While the amount of newspaper increased from 100 to 200 tons, the percentage remained the same. Therefore, the tests would indicate that there had been no change. The purpose of conducting these comparisons is to identify trends within the residential substream, in the percentage of selected types of waste disposed over time. One specific example is stated as follows: Hypothesis: “There is no statistically significant difference between the 1988/89 and 2014 study periods in the percentage of paper disposed.” Statistics are then employed to look for evidence disproving the hypothesis. A “significant” result means that there is enough evidence to disprove the hypothesis and it can be concluded that there is a true difference across years. “Insignificant” results indicate that either a) there is no true difference, or b) even though there may be a difference, there is not enough evidence to prove it.4 The purpose of these tests is to identify changes across years. However, the study did not attempt to investigate why or how these changes occurred. The changes may be due to a variety of factors. For example, the decrease in paper could be due to any combination of the following:
3 The material components for each season have been adjusted to match a uniform material list: (1) the material list has changed from 52 material components in 1988/89 to 115 materials in 2014 and (2) several materials have been moved to different broad material categories to better reflect new policies in recycling and composting. 4 Please see the “Power Analysis” discussion on page E-3.

Cascadia Consulting Group, Inc. E-2 2014 Waste Stream Composition Study FINAL Appendices
Consumer Preferences—plastic containers might have captured some of the market previously held by corrugated containers.
Technology—manufacturers might use thinner paperboard than in the past, which would decrease the weight of cardboard, even if the same number of boxes were disposed.
Recycling—more residents may participate in paper recycling programs due to new education programs or new programs such as commingled recycling.
Future studies could be designed to test the influence of various potential sources of the increase/decrease of specific materials in the disposed waste stream.
Statistical Considerations
The analyses were based on the component percentages, by weight. As described in Appendix D, these percentages are calculated by dividing the sum of the selected component weights by the sum of the corresponding sample weights. T-tests (modified for ratio estimation) were used to examine the variations from year-to-year and within subpopulations.
Normality
The distributions of some of the waste categories (particularly the hazardous materials) are skewed and may not follow a normal distribution. Although t-tests assume a normal distribution, they are very robust to departures from this assumption, particularly with large sample sizes. In addition, most of the selected categories are sums of several individual waste components, which improve our ability to meet the assumptions of normality.
Dependence
There may be dependence between waste types (if a person disposes of material A, they always dispose of material B at the same time). There is certainly a degree of dependence between the calculated percentages. Because the percentages sum to 100 (in the case of year-to-year comparisons) or near 100 (in the case of subpopulation comparisons), if the percentage of material A increases, the percentage of some other material must decrease.
Multiple T-Tests
In all statistical tests, there is a chance of incorrectly concluding that a result is significant. The year-to-year comparison required conducting several t-tests (one for each broad material class) each of which carries that risk. However, we were willing to accept only a 10% chance, overall, of making an incorrect conclusion. Therefore, each test was adjusted by setting the significance
threshold to (w = the number of t-tests). 010.
w

Cascadia Consulting Group, Inc. E-3 2014 Waste Stream Composition Study FINAL Appendices
The adjustment can be explained as follows:
For each test, we set a chance of not making a mistake, which results in a
chance of not making a mistake during all w tests. Since one minus the chance of not making a mistake equals the chance of making a mistake, by making this adjustment, we have set the overall risk of making a wrong conclusion during
any one of the tests at .
The chance of a “false positive” for the year-to-year comparisons made in this study is restricted to 10% overall, or 1.25% for each test (10% divided by the eight tests equals 1.25%). For more detail regarding this issue, please refer to Section 11.2 “The Multiplicity Problem and the Bonferroni Inequality” of An Introduction to Contemporary Statistics by L.H. Koopmans (Duxbury Press, 1981).
Power Analysis
As the number of samples is increased, so is the ability to detect differences. In the future, an a priori power analysis might benefit this research by determining how many samples would be required to detect a particular minimum difference of interest.
Interpreting the Calculation Results
This section interprets the statistical results for year-to-year comparisons. For the purposes of this study, only those calculation results with a p-value of less than 1.25% are considered to be statistically significant. As described above, the threshold for determining statistically significant results (the “alpha-level”) is conservative, accounting for the fact that so many individual tests were calculated. An asterisk notes the statistically significant differences. The t-statistic is calculated from the data. According to statistical theory, the larger the absolute value of the t-statistic the less likely that the two populations have the same mean. The p-value describes the probability of observing the calculated t-statistic if there were no true difference between the population means. The key differences between study years are summarized below and shown in detail in Tables E-1 and E-2. Between the first residential waste study in 1988/89 and the current study, several material categories show significant variations (Table E-1). Paper, glass, metal, organics, and CDL wastes show decreasing trends, while plastic and other materials show increasing trends. Other materials includes a variety of materials, such as diapers, carpet, tires, mattresses, A/V equipment, small appliances, miscellaneous organics, and miscellaneous inorganics. The change between the proportions of hazardous materials was not significant.
1010
.
w1
010
.
w
w
1 1010
010
..
w
w

Cascadia Consulting Group, Inc. E-4 2014 Waste Stream Composition Study FINAL Appendices
Table E-1: Comparison of Residential Composition Results, 1988/89 vs. 2014
Table E-2 presents the results of the comparison calculations between the previous residential waste study in 2010 and the current study. The paper and plastic proportions increased significantly over the last 4 years. Variations among the other category proportions were not significant.
Table E-2: Comparison of Residential Composition Results, 2010 vs. 2014
Mean Ratio t-Statistic p-Value
(Material Wt/Total Wt) (Cut-off for statistically
2010 2014 valid difference = 0.0125)
Paper 17.7% 19.6% 3.6449 0.0003 *
Plastic 10.4% 11.6% 4.1428 0.0000 *
Glass 2.1% 2.3% 1.9199 0.0553
Metal 4.0% 3.3% 2.3664 0.0182
Organics 31.4% 30.7% 0.9030 0.3668
Other Materials 27.9% 27.1% 1.0327 0.3021
CDL Wastes 5.7% 4.8% 1.4951 0.1353
Hazardous 0.9% 0.6% 1.5721 0.1164
Number of Samples 361 362
Mean Ratio t-Statistic p-Value
(Material Wt/Total Wt) (Cut-off for statistically
1988/89 2014 valid difference = 0.0125)
Paper 31.24% 19.58% 14.6233 0.0000 *
Plastic 8.06% 11.63% 11.4658 0.0000 *
Glass 6.41% 2.34% 16.8222 0.0000 *
Metal 5.27% 3.30% 7.4436 0.0000 *
Organics 33.42% 30.70% 2.5566 0.0108 *
Other Materials 6.14% 27.07% 30.7350 0.0000 *
CDL Wastes 8.80% 4.75% 6.0641 0.0000 *
Hazardous 0.66% 0.63% 0.3588 0.7199
Number of Samples 212 362

Cascadia Consulting Group, Inc. G-1 2014 Waste Stream Composition Study FINAL Appendices
Appendix F. Field Forms
The field forms are included in the following order:
Vehicle Selection Sheet
Waste Tally Sheet

Cascadia Consulting Group, Inc. G-2 2014 Waste Stream Composition Study FINAL Appendices
Vehicle Selection Sheet
Facility: SRDS
NEED? Selected Truck No. Route Zone HaulerSample
IDSector
Truck
Type1
st or 2
nd
Dump?Notes and dimensions
2647691311 1 WM SF-6101 SF
2647671302 1 WM SF-6105 SF
2647761309 1 WM SF-6106 SF
2647471327 4 WM SF-6102 SF
2647421323 4 WM SF-6103 SF
2647441324 4 WM SF-6104 SF
363088A12H 1 WM MF-6101 MF
362945A12C 1 WM MF-6105 MF
362949A12J 1 WM MF-6106 MF
362948A12G 4 WM MF-6102 MF
209796A11C 4 WM MF-6103 MF
209794A11A 4 WM MF-6104 MF
1126 2 CS SF-6107 SF
1120 2 CS SF-6110 SF
1145 3 CS SF-6108 SF
1143 3 CS SF-6109 SF
1249 2 CS MF-6108 MF
1248 2 CS MF-6111 MF
1224 2 CS MF-6112 MF
1240 3 CS MF-6107 MF
1220 3 CS MF-6109 MF
1221 3 CS MF-6110 MF
14 Total Samples Today
Vehicle Selection Sheet
Seattle Residential Waste Composition Study
2
2
2
2
1
1
2
2
Monday, November 03, 2014

Cascadia Consulting Group, Inc. G-3 2014 Waste Stream Composition Study FINAL Appendices
Waste Tally Sheet, Front
Newspaper Clear Bottles
Plain OCC/Kraft Green Bottles
Waxed OCC/Kraft Brown Bottles
Grocery/Shopping Bags Container Glass
High Grade Fluorescent Tubes
Mixed Low-grade CFLs
Polycoated Containers Flat Glass
Compostable/Soiled Automotive Glass
Pot. Comp. Single-use Food Service Other Glass
Other Single-use Food Service
Mixed/Other Paper Alum. Beverage Cans
Alum. Foil/Containers
#1 PET Bottles Other Aluminum
#2 HDPE Natural Bottles Other Nonferrous
#2 HDPE Colored Bottles Tin Food Cans
Other Bottles Empty Aerosol Cans
Tubs Other Ferrous
Expanded Poly. Nonfood Oil filters Filter Count:
Expanded Poly. Food grade Mixed Metals/Material
Rigid Poly. Foam Insulation
Pot. Comp. Single-use Food Service Leaves & Grass
Other Single-use Food Service Prunings
Other Rigid Packaging Food
Shopping/Dry Cleaning Bags Fats/Oils/Grease
Stretch Wrap Textiles/Clothing
Clean PE Film Mixed Textiles
Other Film Disposable Diapers
Plastic Pipe Animal By-products
Foam Carpet Padding Rubber Products
Durable Plastic Products Tires
Plastic/Other Materials
TRUCK #
ROUTE #
LOAD #
ZONE #
NRDS SRDS
DATE: TIME:
SAMPLE #
RL-Rear Loader FL-Front Loader SL-Side LoaderVEHICLE TYPE:
HAULER:
FACILITY:
CleanScapes
GL
AS
S
PL
AS
TIC
OR
GA
NIC
SM
ET
AL
Ta
lly S
heet
- P
age 1
2
01
4 S
ea
ttle
Wa
ste
Co
mp
os
itio
n S
tud
y
PA
PE
R
Waste Management

Cascadia Consulting Group, Inc. G-4 2014 Waste Stream Composition Study FINAL Appendices
Waste Tally Sheet, Back
Clean Dimension Lumber Liquid Latex Paint
Clean Engineered Wood Solvent-based Adhesives
Pallets Water-based Adhesives
Crates Oil-based Paint/Thinners
Other Untreated Wood Caustic Cleaners
New Painted Wood Pesticides/Herbicides
Old Painted Wood Rechargeable Batteries
Creosote-treated Wood Wet-cell Batteries
Other Treated Wood Other Dry-cell Batteries
Contaminated Wood Gasoline/Kerosene
New Gypsum Scrap Motor Oil/Diesel Oil
Demo Gypsum Scrap Asbestos
Carpet Explosives
Felt Carpet Pad Medical Wastes
Fiberglass Insulation Other Cleaners/Chemicals
Concrete Pharmaceuticals/Vitamins
Asphalt Paving Cosmetics
Other Aggregates Other Potentially Toxic
Rock
Asphalt Shingles Sand/Soil/Dirt
Other Asphaltic Roofing Non-distinct Fines
Ceramics Misc. Organics
Cement Fiber Board Misc. Inorganics
Dried Latex Paint
Single-ply Roofing Materials NOTES:
Ceiling Tiles
Other Construction Debris
Furniture
Mattresses
Small Appliances
Cell Phones
Audio/Visual Equipment
CRT Monitors
CRT Televisions
Other ElectronicsFU
RN
ITU
RE
, A
PP
LIA
NC
ES
, A
ND
EL
EC
TR
ON
ICS
Ta
lly S
heet
- P
age 2
CO
NS
TR
UC
TIO
N D
EB
RIS
PO
TE
NT
IAL
LY
HA
RM
FU
L W
AS
TE
FIN
ES
&
MIS
C.
Revis
ed 1
2/1
3/1
3