Seasonal Variation in Water Quality of the Weija Dam, Ghana
7
Journal of Natural Sciences Research www.iiste.org ISSN 2224-3186 (Paper) ISSN 2225-0921 (Online) Vol.5, No.20, 2015 82 Seasonal Variation in Water Quality of the Weija Dam, Ghana *Raphael Kwaku Klake 1 , Vincent Kodzo Nartey 1 , Louis Korbla Doamekpor 1 , David Edem Dinku 1 1 School of Physical and Mathematical Sciences, Chemistry Department, University of Ghana, P.O. Box LG 56, Legon , Accra, Ghana Abstract The water quality examination of the Weija dam was conducted by determining the physicochemical parameters at ten (10) sampling sites in March 2014, representing the dry season and August 2014, representing the wet season. Physicochemical parameters such as temperature, pH, conductivity, hardness and nutrients were measured. Values of the parameters were all within the acceptable limits of WHO with the exception of phosphate concentrations which were above the threshold limit in the wet season. The results of this study also indicated that there were significant differences in concentrations of the physicochemical parameters between the two seasons. The physiochemical parameters ranged from 6.62 to 8.00 (pH unit), 94.95 to 285.61.00 µS/cm (electrical conductivity), 28.59 to 73.45 mg/L (total dissolved solids), 49.18 to 94.54 mg/L (total hardness), 86.21 to 105.68 mg/L (alkalinity) and dissolved oxygen levels of 2.70 to 5.84 mg/L in both seasons. The mean concentration of nitrates in the dry season was 0.32 mg/L and 0.31 mg/L in the wet season. Chloride, fluoride and phosphate concentrations ranged from 43.54 to 67.13 mg/L, 0.03 to 0.09 mg/L and 0.03 to 0.40 mg/L respectively. Keywords: Weija dam, Water quality, physicochemical analyses, seasonal variation 1. Introduction Water is vital to the existence of life. Today, people are concerned about the quality of drinking water. This is because the quality of this valued resource is increasingly being compromised as a result of the growth of human populations and increased demand for water for domestic purposes and economic activities (UNEP, 2000). Polluted water tends to serve as a vessel for the spread of diseases. In developing countries, 1.8 million people, mostly children, die every year as a result of water related diseases (WHO, 2004). Ghana’s water resources have been under increasing threat of pollution in recent years. This threat is due to rapid establishment of new human settlements which lack the appropriate sanitary infrastructure and other human activities such as farming very near to water bodies. Many of such settlements can be found in the Accra Metropolis (Ghana Statistical Service, 2002). Inhabitants of such settlements more often utilize the contaminated surface water for, drinking, recreation and irrigation thus resulting in serious health effects (Verma,1990). Weija Lake is an important drinking water source for the Accra metropolis and its surrounding communities. However, the lake is being polluted by indiscriminate disposal of sewage and industrial waste. These activities result in changes in physicochemical characteristics and microbiological quality of the water (Koshy, 1999). Pollution of the lake is a serious and growing problem. For example, increasing amounts of domestic waste, contributes to oxygen demand and nutrient loading which leads to the destabilization of the aquatic ecosystem (DWAF and WRC, 1995; WRC, 2000). Industrial and agricultural waste discharged into the lake also has deleterious effects on aquatic organisms. In addition, this can be detrimental to human and animal health and safety (Adekunle and Eniola, 2008). Disposal of sewage wastes into a large volume of water like the Weija Lake could also increase the biological oxygen demand to such a high level that all the available oxygen may be removed, thus causing the death of organisms like fish (Maduka, 2004). Due to the rate and extent of anthropogenic activities impacting on the water quality of the dam, it is necessary to determine the physicochemical properties of the water from the Weija Lake in order to record any alteration in the water quality, which could lead to serious health effects. There has been some studies on the quality of the Weija dam ( Anim et al 2011). However, there has not been any new study on the characteristics and seasonality of water quality in recent times. The objective of the study is to provide a quantitative record of the seasonal changes as well as the levels of the various physicochemical parameters.
Transcript of Seasonal Variation in Water Quality of the Weija Dam, Ghana

Journal of Natural Sciences Research www.iiste.org
ISSN 2224-3186 (Paper) ISSN 2225-0921 (Online)
Vol.5, No.20, 2015
82
Seasonal Variation in Water Quality of the Weija Dam, Ghana
*Raphael Kwaku Klake1, Vincent Kodzo Nartey
1, Louis Korbla Doamekpor
1, David Edem Dinku
1
1School of Physical and Mathematical Sciences, Chemistry Department, University of Ghana,
P.O. Box LG 56, Legon , Accra, Ghana
Abstract
The water quality examination of the Weija dam was conducted by determining the physicochemical parameters
at ten (10) sampling sites in March 2014, representing the dry season and August 2014, representing the wet
season. Physicochemical parameters such as temperature, pH, conductivity, hardness and nutrients were
measured. Values of the parameters were all within the acceptable limits of WHO with the exception of
phosphate concentrations which were above the threshold limit in the wet season. The results of this study also
indicated that there were significant differences in concentrations of the physicochemical parameters between the
two seasons. The physiochemical parameters ranged from 6.62 to 8.00 (pH unit), 94.95 to 285.61.00 µS/cm
(electrical conductivity), 28.59 to 73.45 mg/L (total dissolved solids), 49.18 to 94.54 mg/L (total hardness),
86.21 to 105.68 mg/L (alkalinity) and dissolved oxygen levels of 2.70 to 5.84 mg/L in both seasons. The mean
concentration of nitrates in the dry season was 0.32 mg/L and 0.31 mg/L in the wet season. Chloride, fluoride
and phosphate concentrations ranged from 43.54 to 67.13 mg/L, 0.03 to 0.09 mg/L and 0.03 to 0.40 mg/L
respectively.
Keywords: Weija dam, Water quality, physicochemical analyses, seasonal variation
1. Introduction
Water is vital to the existence of life. Today, people are concerned about the quality of drinking water. This is
because the quality of this valued resource is increasingly being compromised as a result of the growth of
human populations and increased demand for water for domestic purposes and economic activities (UNEP,
2000).
Polluted water tends to serve as a vessel for the spread of diseases. In developing countries, 1.8 million people,
mostly children, die every year as a result of water related diseases (WHO, 2004).
Ghana’s water resources have been under increasing threat of pollution in recent years. This threat is due to rapid
establishment of new human settlements which lack the appropriate sanitary infrastructure and other human
activities such as farming very near to water bodies. Many of such settlements can be found in the Accra
Metropolis (Ghana Statistical Service, 2002). Inhabitants of such settlements more often utilize the contaminated
surface water for, drinking, recreation and irrigation thus resulting in serious health effects (Verma,1990).
Weija Lake is an important drinking water source for the Accra metropolis and its surrounding communities.
However, the lake is being polluted by indiscriminate disposal of sewage and industrial waste. These activities
result in changes in physicochemical characteristics and microbiological quality of the water (Koshy, 1999).
Pollution of the lake is a serious and growing problem. For example, increasing amounts of domestic waste,
contributes to oxygen demand and nutrient loading which leads to the destabilization of the aquatic ecosystem
(DWAF and WRC, 1995; WRC, 2000). Industrial and agricultural waste discharged into the lake also has
deleterious effects on aquatic organisms. In addition, this can be detrimental to human and animal health and
safety (Adekunle and Eniola, 2008). Disposal of sewage wastes into a large volume of water like the Weija Lake
could also increase the biological oxygen demand to such a high level that all the available oxygen may be
removed, thus causing the death of organisms like fish (Maduka, 2004). Due to the rate and extent of
anthropogenic activities impacting on the water quality of the dam, it is necessary to determine the
physicochemical properties of the water from the Weija Lake in order to record any alteration in the water quality,
which could lead to serious health effects. There has been some studies on the quality of the Weija dam ( Anim et
al 2011). However, there has not been any new study on the characteristics and seasonality of water quality in
recent times. The objective of the study is to provide a quantitative record of the seasonal changes as well as the
levels of the various physicochemical parameters.
Journal of Natural Sciences Research www.iiste.org
ISSN 2224-3186 (Paper) ISSN 2225-0921 (Online)
Vol.5, No.20, 2015
83
2. Materials and Methods
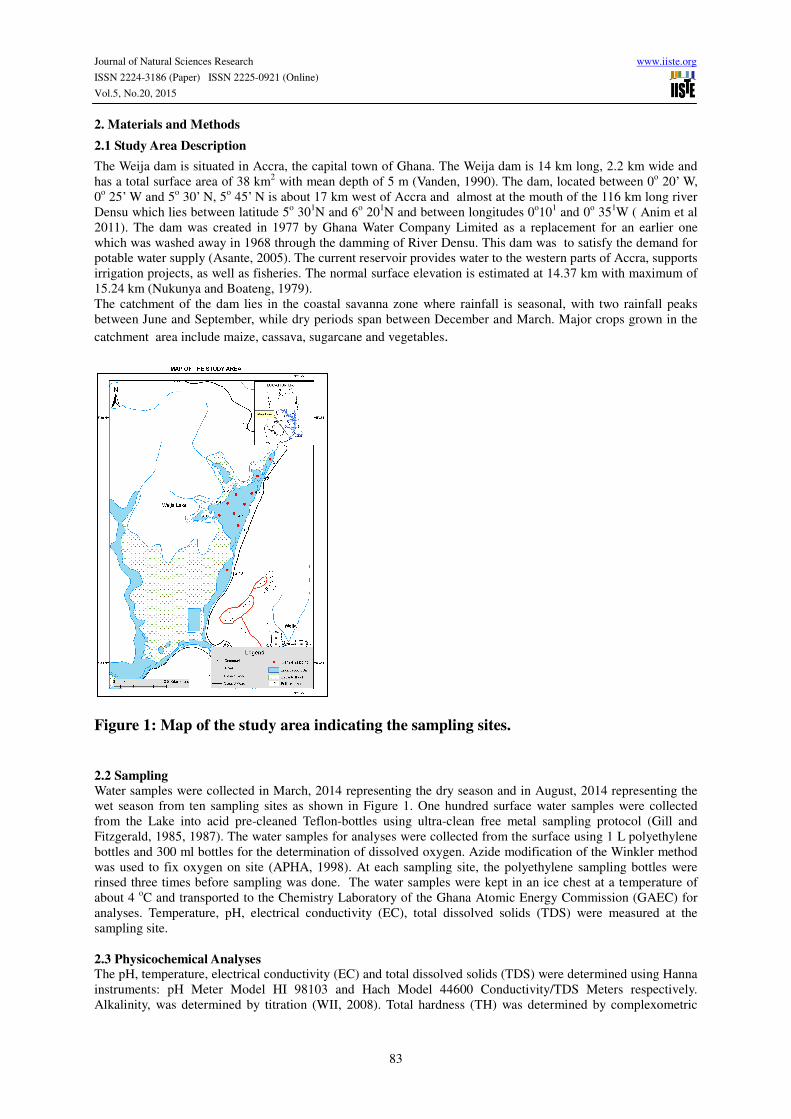
2.1 Study Area Description
The Weija dam is situated in Accra, the capital town of Ghana. The Weija dam is 14 km long, 2.2 km wide and
has a total surface area of 38 km2 with mean depth of 5 m (Vanden, 1990). The dam, located between 0
o 20’ W,
0o 25’ W and 5
o 30’ N, 5
o 45’ N is about 17 km west of Accra and almost at the mouth of the 116 km long river
Densu which lies between latitude 5o 30
1N and 6
o 20
1N and between longitudes 0
o10
1 and 0
o 35
1W ( Anim et al
2011). The dam was created in 1977 by Ghana Water Company Limited as a replacement for an earlier one
which was washed away in 1968 through the damming of River Densu. This dam was to satisfy the demand for
potable water supply (Asante, 2005). The current reservoir provides water to the western parts of Accra, supports
irrigation projects, as well as fisheries. The normal surface elevation is estimated at 14.37 km with maximum of
15.24 km (Nukunya and Boateng, 1979).
The catchment of the dam lies in the coastal savanna zone where rainfall is seasonal, with two rainfall peaks
between June and September, while dry periods span between December and March. Major crops grown in the
catchment area include maize, cassava, sugarcane and vegetables.
Figure 1: Map of the study area indicating the sampling sites.
2.2 Sampling
Water samples were collected in March, 2014 representing the dry season and in August, 2014 representing the
wet season from ten sampling sites as shown in Figure 1. One hundred surface water samples were collected
from the Lake into acid pre-cleaned Teflon-bottles using ultra-clean free metal sampling protocol (Gill and
Fitzgerald, 1985, 1987). The water samples for analyses were collected from the surface using 1 L polyethylene
bottles and 300 ml bottles for the determination of dissolved oxygen. Azide modification of the Winkler method
was used to fix oxygen on site (APHA, 1998). At each sampling site, the polyethylene sampling bottles were
rinsed three times before sampling was done. The water samples were kept in an ice chest at a temperature of
about 4 oC and transported to the Chemistry Laboratory of the Ghana Atomic Energy Commission (GAEC) for
analyses. Temperature, pH, electrical conductivity (EC), total dissolved solids (TDS) were measured at the
sampling site.
2.3 Physicochemical Analyses The pH, temperature, electrical conductivity (EC) and total dissolved solids (TDS) were determined using Hanna
instruments: pH Meter Model HI 98103 and Hach Model 44600 Conductivity/TDS Meters respectively.
Alkalinity, was determined by titration (WII, 2008). Total hardness (TH) was determined by complexometric

Journal of Natural Sciences Research www.iiste.org
ISSN 2224-3186 (Paper) ISSN 2225-0921 (Online)
Vol.5, No.20, 2015
84
titration with standard EDTA solution using Eriochrome Black T as indicator. Chloride concentration was
determined using argentometric titration, while Nitrate (NO3-) and phosphate (PO4
3- ) were determined by UV
spectrophotometric method (APHA, 1998). Fluoride was also determined by SPANDS method.
3. Results and Discussion
The results of the physicochemical characteristics of water samples from the Weija dam for dry and wet seasons
are presented in Tables 1 and 2 respectively. The results were compared with World Health Organization (WHO,
2004) guideline values to assess the potability of the water.
The mean pH values ranged from 6.62 (site 9) to 7.16 (site 8) in the dry season and ranged from 6.75 (site 6) to
8.02 (site 3) in the wet season with their seasonal mean values of 6.93 and 7.36 for the dry and wet seasons
respectively. All the pH values were within the (WHO, 2006) guideline range of 6.50 – 8.50 for drinking water.
The lower pH values in the dry season could be attributed to surface evaporation.
The measured temperature values ranged from 26.52 at site 5 to 28.19 at site 4 in the dry season with the
mean value of 27.34 (Table 1) and from 25.67 at site 9 to 27.01 at site 10 with the mean value of
26.26 (Table 2) in the wet season. The higher temperature of the water samples in the dry season than in the
wet season could be as a result of the high temperature during the dry season. High temperature reduces the
amount of dissolved oxygen in water thereby affecting aquatic lives (Akan et al., 2012). High temperature of
water accelerates chemical reactions, reduces solubility of gases, amplifies taste and odor and elevates metabolic
activity of organisms.
The results of conductivity measurements varied from 164.57 µS/cm (site 4) to 285.61 µS/cm (site 7) in the dry
season and ranged from 94.95 µS/cm (site 8) in the wet season to 190.58 µS/cm (site 10). The mean values of
215.41 µS/cm (dry) (Table 1) and 156.08 µS/cm (wet) (Table 2) were obtained. The high conductivity mean
values in the dry season may be due to a reduction in the lake volume as a result of evaporation at the water
surface resulting in concentration of ions and dissolved organic matter (Coke, 2001) which gets into the dam
through runoffs. However, the lower conductivity in the wet season' might be due to high rainfall which reduces
the level of dissolved solids by dilution of water in the lake through runoff which increases the volume of water
(FAO, 1993). Electrical conductivity (EC) values measured for both seasons were far below the WHO maximum
permissible limit.
The dry season recorded the highest TDS of 47.52 mg/L (Table 1) and ranged from 28.60 mg/L at site 6 to 73.45
mg/L at site 2 while the wet season recorded the lowest mean value of 41.50 mg/L (Table 2) and ranged from
30.00 mg/L at site 6 to 52.00 mg/L at site 9. Decrease in the volume of water due to the evaporation on the
surface of the water might be the reason for the high TDS values in the dry season. However, the TDS levels
recorded in the entire sample points were below the WHO maximum permissible limit of 1000 mg/L for the
protection of fisheries and aquatic life and for domestic water supply.
The major factors controlling dissolved oxygen concentration are photosynthesis producing oxygen while
respiration and nitrification consume oxygen (Best et al., 2007. The wet season recorded mean DO values
varying from 4.56 mg/L to 5.84 mg/L at sites 6 and site 1 respectively and from 2.70 mg/L at site 7 to 4.10 mg/L
at site 4 in the dry season. The relatively higher DO levels in the waters of Weija dam in the wet season could be
attributed to mixing and aeration due to wind action (Straskaba and Tundisi, 1999), as well as photosynthetic
activity. High DO levels may also be due to the inflow of cool oxygenated flood waters from the catchment area.
The inflow is an annual event that normally occurs from May to August, a phenomenon which was also reported
by Ameka et al. (2000). In general, DO levels less than 3 mg/L are stressful to most aquatic organisms. Most fish
die at 1.00 – 2.00 mg/L. However, fish can move away from low DO areas. The oxygen levels in the Weija dam
were slightly above the 5.00 mg/L threshold needed to support fish life (Hynes, 1970; USEPA, 1999 and WHO,
2002) especially in the wet season.
The levels of alkalinity measured was between 90.43 mg/L (site 2) and 105.68 mg/L (site 8) in the dry season
and from 86.21 (site 9) to 102.00 mg/L (site 2) in the wet season. The mean alkalinity for the respective seasons
was 98.18 mg/L (Table 1) for the dry season and 94.68 mg/L (Table 2) for the wet season. The reduction in the
water volume due to evaporation might increase the constituents of alkalinity. The activities of vegetables
farmers within the catchment of the dam may have resulted in the relatively high values in the dry season. The
alkalinity values recorded were all below WHO (2003).
Chloride concentrations varied from 44.18 mg/L (site 8) to 68.98 mg/L (site 4) in the dry season while the
concentration varied from 39.53 mg/L (site 9) to 67.13 mg/L (site 4) in the wet season. There was a difference in
chloride concentrations for both seasons, with the dry season showing a relatively higher chloride level (53.33
Journal of Natural Sciences Research www.iiste.org
ISSN 2224-3186 (Paper) ISSN 2225-0921 (Online)
Vol.5, No.20, 2015
85
mg/L) than the wet season (50.04 mg/L). This is probably due to evapotranspiration (Asante et al., 2005).
Results obtained in both seasons were below the WHO maximum permissible limit of 250.00 mg/L for drinking
water.
The fluoride concentrations measured ranged from 0.09 mg/L (site 2) to 0.05 mg/L (site 9) in the dry season,
and from 0.03 mg/L (site 8) to 0.07 mg/L (site 6) in the wet season with mean a value of 0.07 mg/L (dry) which
was slightly higher than 0.06 mg/L (wet) season. Presence of fluoride may be due to the weathering of rocks
within the catchment area. WHO (2003), report showed that low levels of fluoride are medically good for
healthy teeth but high levels can result in a disease called fluorosis. Fluoride levels within the dam in both
seasons were generally below WHO recommended levels for drinking water of 1.50 mg/L.
The phosphate concentrations determined ranged from 0.15 mg/L (site 9) to 0.82 mg/L (site 5) in the dry season
with the mean value of 0.27 mg/L (Table 1) while the wet season levels ranged from 0.03 mg/L (site 7) to 0.13
mg/L (site 5) with the mean value of 0.06 mg/L (Table 2). The huge agricultural activities together with the use
of fertilizer, other agrochemicals as well as other human activities within the study area might have been
responsible for the levels of phosphate in the water samples (Asante et al., 2005). The concentrations of
phosphate in almost the entire water sampling sites were below the WHO maximum permissible limit of 0.30
mg/L
Concentrations of nitrates measured ranged from 0.18 mg/L (site 6) to 0.47 mg/L (site 10) with a mean 0.32
mg/L (Table 1) in the dry season. The wet season level varied from 0.41 mg/L (site 10) to 0.21 mg/L (site 6) with
the mean value of 0.31 mg/L (Table 2). This might be as a result of runoff from fertilized farm lands and
domestic wastes (Asante et al., 2005). Many nitrogenous fertilizers are converted into mobile nitrates by natural
processes which contaminate nearby water bodies (Freeze and Cherry, 1979, Walter et. al., 1975). These nitrate
levels were below the WHO limit of 10.00 mg/L therefore does not constitute a health hazard.
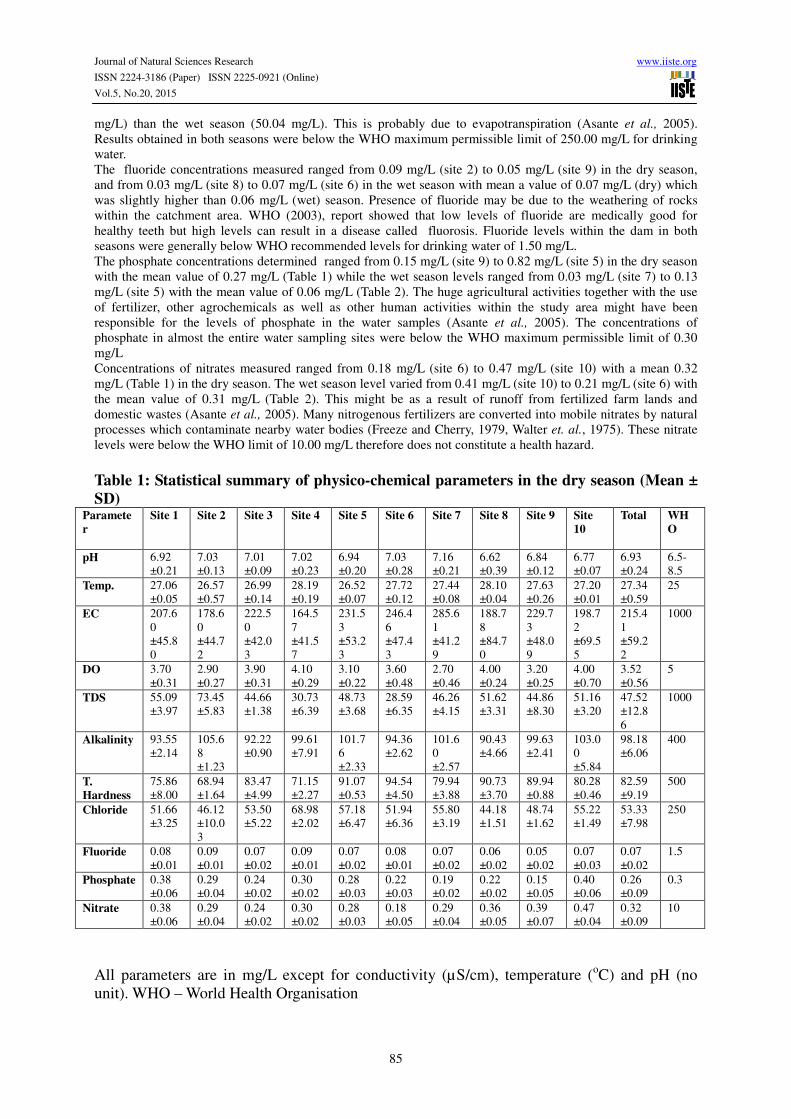
Table 1: Statistical summary of physico-chemical parameters in the dry season (Mean ±
SD) Paramete
r
Site 1 Site 2 Site 3 Site 4 Site 5 Site 6 Site 7 Site 8 Site 9 Site
10
Total WH
O
pH 6.92
±0.21
7.03
±0.13
7.01
±0.09
7.02
±0.23
6.94
±0.20
7.03
±0.28
7.16
±0.21
6.62
±0.39
6.84
±0.12
6.77
±0.07
6.93
±0.24
6.5-
8.5
Temp. 27.06
±0.05
26.57
±0.57
26.99
±0.14
28.19
±0.19
26.52
±0.07
27.72
±0.12
27.44
±0.08
28.10
±0.04
27.63
±0.26
27.20
±0.01
27.34
±0.59
25
EC 207.6
0
±45.8
0
178.6
0
±44.7
2
222.5
0
±42.0
3
164.5
7
±41.5
7
231.5
3
±53.2
3
246.4
6
±47.4
3
285.6
1
±41.2
9
188.7
8
±84.7
0
229.7
3
±48.0
9
198.7
2
±69.5
5
215.4
1
±59.2
2
1000
DO 3.70
±0.31
2.90
±0.27
3.90
±0.31
4.10
±0.29
3.10
±0.22
3.60
±0.48
2.70
±0.46
4.00
±0.24
3.20
±0.25
4.00
±0.70
3.52
±0.56
5
TDS 55.09
±3.97
73.45
±5.83
44.66
±1.38
30.73
±6.39
48.73
±3.68
28.59
±6.35
46.26
±4.15
51.62
±3.31
44.86
±8.30
51.16
±3.20
47.52
±12.8
6
1000
Alkalinity 93.55
±2.14
105.6
8
±1.23
92.22
±0.90
99.61
±7.91
101.7
6
±2.33
94.36
±2.62
101.6
0
±2.57
90.43
±4.66
99.63
±2.41
103.0
0
±5.84
98.18
±6.06
400
T.
Hardness
75.86
±8.00
68.94
±1.64
83.47
±4.99
71.15
±2.27
91.07
±0.53
94.54
±4.50
79.94
±3.88
90.73
±3.70
89.94
±0.88
80.28
±0.46
82.59
±9.19
500
Chloride 51.66
±3.25
46.12
±10.0
3
53.50
±5.22
68.98
±2.02
57.18
±6.47
51.94
±6.36
55.80
±3.19
44.18
±1.51
48.74
±1.62
55.22
±1.49
53.33
±7.98
250
Fluoride 0.08
±0.01
0.09
±0.01
0.07
±0.02
0.09
±0.01
0.07
±0.02
0.08
±0.01
0.07
±0.02
0.06
±0.02
0.05
±0.02
0.07
±0.03
0.07
±0.02
1.5
Phosphate 0.38
±0.06
0.29
±0.04
0.24
±0.02
0.30
±0.02
0.28
±0.03
0.22
±0.03
0.19
±0.02
0.22
±0.02
0.15
±0.05
0.40
±0.06
0.26
±0.09
0.3
Nitrate 0.38
±0.06
0.29
±0.04
0.24
±0.02
0.30
±0.02
0.28
±0.03
0.18
±0.05
0.29
±0.04
0.36
±0.05
0.39
±0.07
0.47
±0.04
0.32
±0.09
10
All parameters are in mg/L except for conductivity (µS/cm), temperature (oC) and pH (no
unit). WHO – World Health Organisation
Journal of Natural Sciences Research www.iiste.org
ISSN 2224-3186 (Paper) ISSN 2225-0921 (Online)
Vol.5, No.20, 2015
86
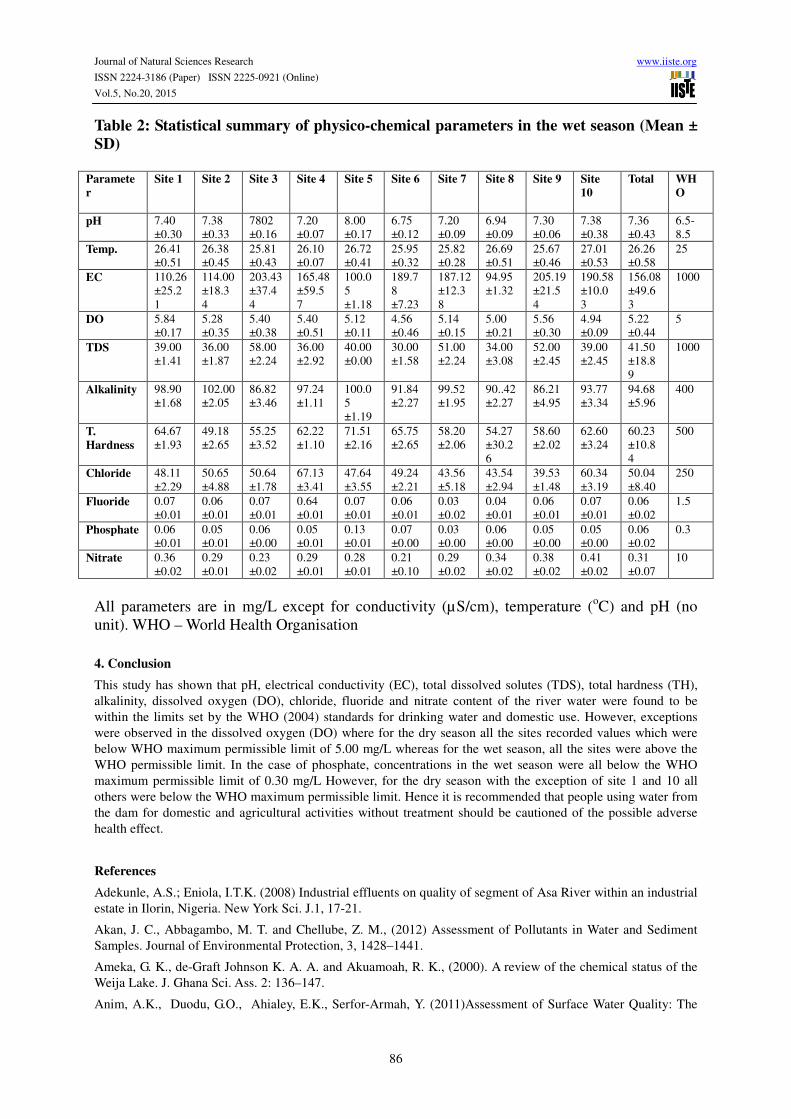
Table 2: Statistical summary of physico-chemical parameters in the wet season (Mean ±
SD)
Paramete
r
Site 1 Site 2 Site 3 Site 4 Site 5 Site 6 Site 7 Site 8 Site 9 Site
10
Total WH
O
pH 7.40
±0.30
7.38
±0.33
7802
±0.16
7.20
±0.07
8.00
±0.17
6.75
±0.12
7.20
±0.09
6.94
±0.09
7.30
±0.06
7.38
±0.38
7.36
±0.43
6.5-
8.5
Temp. 26.41
±0.51
26.38
±0.45
25.81
±0.43
26.10
±0.07
26.72
±0.41
25.95
±0.32
25.82
±0.28
26.69
±0.51
25.67
±0.46
27.01
±0.53
26.26
±0.58
25
EC 110.26
±25.2
1
114.00
±18.3
4
203.43
±37.4
4
165.48
±59.5
7
100.0
5
±1.18
189.7
8
±7.23
187.12
±12.3
8
94.95
±1.32
205.19
±21.5
4
190.58
±10.0
3
156.08
±49.6
3
1000
DO 5.84
±0.17
5.28
±0.35
5.40
±0.38
5.40
±0.51
5.12
±0.11
4.56
±0.46
5.14
±0.15
5.00
±0.21
5.56
±0.30
4.94
±0.09
5.22
±0.44
5
TDS 39.00
±1.41
36.00
±1.87
58.00
±2.24
36.00
±2.92
40.00
±0.00
30.00
±1.58
51.00
±2.24
34.00
±3.08
52.00
±2.45
39.00
±2.45
41.50
±18.8
9
1000
Alkalinity 98.90
±1.68
102.00
±2.05
86.82
±3.46
97.24
±1.11
100.0
5
±1.19
91.84
±2.27
99.52
±1.95
90..42
±2.27
86.21
±4.95
93.77
±3.34
94.68
±5.96
400
T.
Hardness
64.67
±1.93
49.18
±2.65
55.25
±3.52
62.22
±1.10
71.51
±2.16
65.75
±2.65
58.20
±2.06
54.27
±30.2
6
58.60
±2.02
62.60
±3.24
60.23
±10.8
4
500
Chloride 48.11
±2.29
50.65
±4.88
50.64
±1.78
67.13
±3.41
47.64
±3.55
49.24
±2.21
43.56
±5.18
43.54
±2.94
39.53
±1.48
60.34
±3.19
50.04
±8.40
250
Fluoride 0.07
±0.01
0.06
±0.01
0.07
±0.01
0.64
±0.01
0.07
±0.01
0.06
±0.01
0.03
±0.02
0.04
±0.01
0.06
±0.01
0.07
±0.01
0.06
±0.02
1.5
Phosphate 0.06
±0.01
0.05
±0.01
0.06
±0.00
0.05
±0.01
0.13
±0.01
0.07
±0.00
0.03
±0.00
0.06
±0.00
0.05
±0.00
0.05
±0.00
0.06
±0.02
0.3
Nitrate 0.36
±0.02
0.29
±0.01
0.23
±0.02
0.29
±0.01
0.28
±0.01
0.21
±0.10
0.29
±0.02
0.34
±0.02
0.38
±0.02
0.41
±0.02
0.31
±0.07
10
All parameters are in mg/L except for conductivity (µS/cm), temperature (oC) and pH (no
unit). WHO – World Health Organisation
4. Conclusion
This study has shown that pH, electrical conductivity (EC), total dissolved solutes (TDS), total hardness (TH),
alkalinity, dissolved oxygen (DO), chloride, fluoride and nitrate content of the river water were found to be
within the limits set by the WHO (2004) standards for drinking water and domestic use. However, exceptions
were observed in the dissolved oxygen (DO) where for the dry season all the sites recorded values which were
below WHO maximum permissible limit of 5.00 mg/L whereas for the wet season, all the sites were above the
WHO permissible limit. In the case of phosphate, concentrations in the wet season were all below the WHO
maximum permissible limit of 0.30 mg/L However, for the dry season with the exception of site 1 and 10 all
others were below the WHO maximum permissible limit. Hence it is recommended that people using water from
the dam for domestic and agricultural activities without treatment should be cautioned of the possible adverse
health effect.
References
Adekunle, A.S.; Eniola, I.T.K. (2008) Industrial effluents on quality of segment of Asa River within an industrial
estate in Ilorin, Nigeria. New York Sci. J.1, 17-21.
Akan, J. C., Abbagambo, M. T. and Chellube, Z. M., (2012) Assessment of Pollutants in Water and Sediment
Samples. Journal of Environmental Protection, 3, 1428–1441.
Ameka, G. K., de-Graft Johnson K. A. A. and Akuamoah, R. K., (2000). A review of the chemical status of the
Weija Lake. J. Ghana Sci. Ass. 2: 136–147.
Anim, A.K., Duodu, G.O., Ahialey, E.K., Serfor-Armah, Y. (2011)Assessment of Surface Water Quality: The
Journal of Natural Sciences Research www.iiste.org
ISSN 2224-3186 (Paper) ISSN 2225-0921 (Online)
Vol.5, No.20, 2015
87
Perspective of the Weija Dam in Ghana International Journal of Chemistry 3, (2), 32-39
Ansa-Asare, O. D. and Asante K. A., (2000). The quality of the Birim River in South-east Ghana. West African
Journal Applied Ecology, 1: 23-34.
APHA and AWWA. (1998). Standard methods for the examination of water and wastewater. 20th edition.
American Public Health Association, New York.
Asante, K. A., Quarcoopome T. and Amevenku F. Y. K., (2005). Water Quality of the Weija Reservoir after 28
years of Impoundment. West African Journal of Applied Ecology, 13:171-180.
Ayibotele, N. B. and Nerquaye-Tetteh, F. D., (1989). Studies into the problems of Saline intrusion at the Secondi-
Takoradi water supply intake works on the Pra River at Daboase. Draft Final report, Water Resources Research
Institution (CSIR), Accra.
Best, A. A., Wither A. W.and Coates, S., (2007). Dissolved oxygen as a physicochemical supporting element in
the water framework directive. Marine Pollution Bulletin 55: 53-64.
Chapman, D., (1993). “Assessment of Injury to Fish Populations: Clark Fork River NPL Sites, Montana,” In: J.
Lipton, Ed., Aquatic Resources Injury Assessment Report, Upper Clark Fork Riverm Basin, Montana Natural
Resource Damage Assessment Program, Helena, Mont.
DWAF and WRC, (1995). South African Water quality management series. Procedures to assess effluent
discharge impacts. WRC Report NoTT 64/94. Dept. Water Affairs For. Water Res. Commission, Pretoria.
Freeze, A. R. and Cherry, J. A. (1979). Groundwater. Prentice Hall, Inc. Englewood Cliffs, New Jersey 07632.
nants/index.html#inorganic
Gampson, E. K., Nartey, V. K., Golow, A. A. and Akiti T. T., (2013). Heavy metal and drinking water quality on
a river system at the Lower Manya Krobo and South Tongu districts , Ghana. 3(13), 23–31.
Ghana Statistical Service (2002). 2000 Population and Housing Census. Accra.
Hynes H. B. N., (1970). The ecology of running waters. Liverpool University Press. Liverpool. 555 pp.
Koshy, M. and Nayar, T.V. (1999). Water quality aspects of River Pamba. Pollut. Res., 18, 501-510
Maduka, H.C.C., (2004). Water Pollution and Man’s Health in Environmental Degradation, Reclamation,
Conservation and Pollution Control for the Rural Women and the Youths; Green Line Publishers: Ado Ekiti,
Nigeria, pp.198-203.
McCurtheon, S. C., Martin, J. L. and Barnwell, T. O., (1983). Water quality. Handbook of Hydrology. McGraw-
Hill Inc., New York.
Meybeck, M. and Helmer, R., (1989). The quality of rivers: from prestine stage to global pollution.
Palaeogeography, Palaeoclimatology, Palaeoe-cology (Global Planet Change Section) 75: 283–309.
Morrison, G., Fatoki, O. S. and Ekberg, A., (2001). Assessment of the impact of Point Source Pollution from
Keiskammahoek Sewage Treatment Plant on the Keiskamma River – pH, Electrical Conductivity, Oxygen-
Demanding Substances (COD) and Nutrients. Water SA, 27: 475-480.
Nukunya, G. K. and Boateng, E. O., (1979). Weija Dam Project An Evaluation/Study of Water Utilisation
Behaviour and its Realated Socio-economic Impact. Report submitted to Canadian International Development
Agency (CIDA).
Ofori-Danson, P. K. and Ntow, W. J., (2005). Studies on the current state of the limno-chemistry and potential
fish yield of Lake Volta (Yeji sector) after three decades of impoundment. Ghana J. agric. Sci. 38: 55-64.
Shrinivasa, B. R. and Venkateswarlu, P., (2000). Evaluation of ground water quality in Chirala Town, Prakasam
District, and Indian J. environ. Prot., 20(3), 161,
Straskaba, M. and Tundisi, J. G. (1999). Guidelines of Lake Management, vol. 9. Reservoir Water Quality
Management. Lake Environment Committee Foundation, Shiga, Japan
Todd, D. K., (1980): Groundwater Hydrology. John Wiley and Sons Inc. New York, 2nd
U. S. A Environmental Protection Agency. (1999). Current drinking water regulations. National Primary and
Secondary Drinking Water Regulations: U. S. A Environmental Protection Agency, Office of Ground Water and
Drinking Water.
United Nations Environment Programme Global Environment Monitoring System/Water Programme, (2000).
Water Quality for Ecosystem and Human Health; National Water Research Institute: Burlington, ON, Canada.

Journal of Natural Sciences Research www.iiste.org
ISSN 2224-3186 (Paper) ISSN 2225-0921 (Online)
Vol.5, No.20, 2015
88
USEPA, (1999). “Volunteer Lake Monitoring: A Methods Manual,” EPA 440/4-91-002, Office of Water US
Environmental Protection Agency, Washington DC
Vanden Bossche J. P. and Bernacsek G. M., (1990). Source Book for the Inland Fishery Resources of Africa,
CIFA Technical Paper No 18/1, 1:240
Verma B. L. and Srivastava R. N. (1990). Measurement of the Personal Cost of Illness due to some Major Water-
related issues in an Indian Rural Population. Int. J. Epidemiol, 19: 169–176.
Walter, M. F., Bubenzer, G. D. and Converse, J. C., (1975). Predicting vertical movement of manorial nitrogen in
soil. Trans.Am.Soc Agric.Eng, 18: 100–105.
Water Resources Commission (WRC), (2003). Ghana Raw Water Criteria and Guidelines Series. Report
Prepared for Ghana Water Resources Commission by CSIR-Water Research Institute. WRI/TR No. 556.114
COU WRI/CAR No.133.
Weiss, R. F., (1970). The solubility of nitrogen, oxygen and. argon in water and seawater. Deep Sea Research and
Oceanographic Abstracts 17(4): 721-735.
WHO, (1996). Guidelines for drinking water Quantity (Vol.2) (2nd edn.) World Health Organization, Geneva,
Switzerland.
WHO, (2002).“World Health Organization Standard for Drink-ing Water,” Guidelines for Drinking Water
Quality, Vol. 1, Recommendation, France, WHO, 181 p
WHO, (2004). “World Health Organization standard for Drinking Water,” Guidelines for Drinking Water Quality,
Vol. 1, Recommendation, France, WHO, 181 p.
WII, (2008). Wildlife Institute of India (WII). A Manual on Analytical Techniques. India
World Health Organisation (WHO), (2003). Background document for preparation of WHO Guidelines for
drinking-water quality. Geneva, World Health Organization. WHO/SDE/WSH/03.04
World Health Organization (WHO). (2004). Guidelines for Drinking Water Quality, Vol. 1 Recommendations
(3rd edn). WHO, Geneva.
WRC. (2000). National Eutrophication of Surface Waters: Policy/Research Needs. Water Research Commission,
Pretoria