
21 April 2021 Results for the six months ended 31 December ...
E N E R P L U S R E S O U R C E S
2 0 0 9 F I N A N C I A L S U M M A R Y
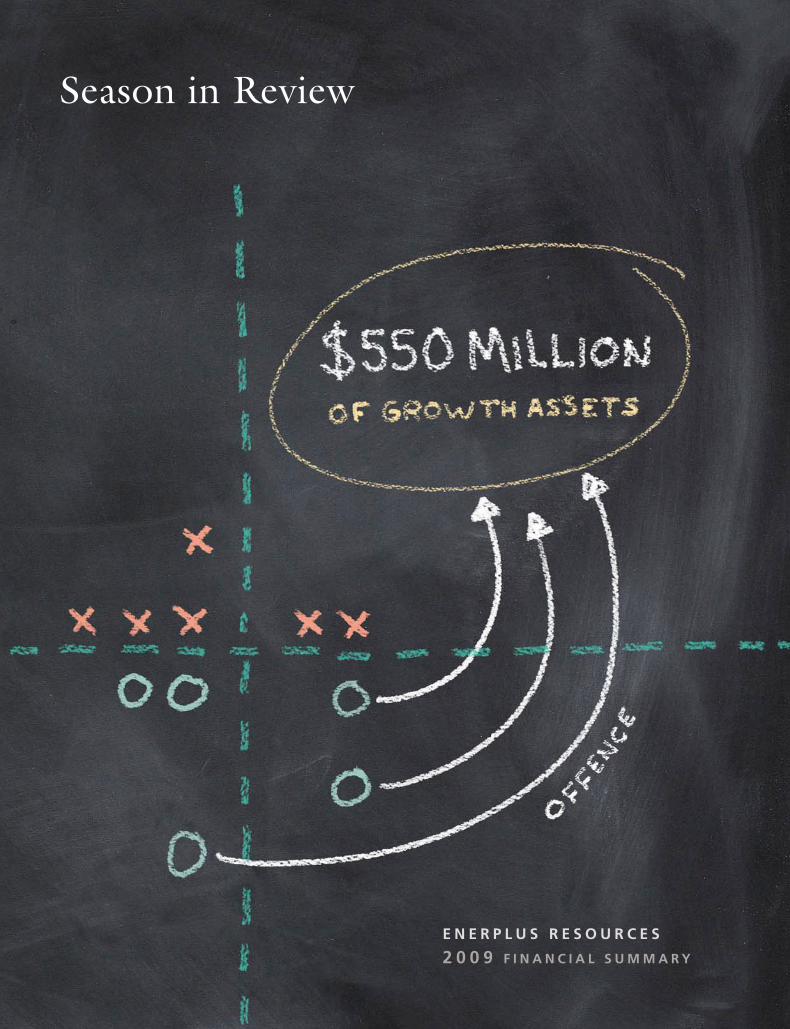
Season in Review
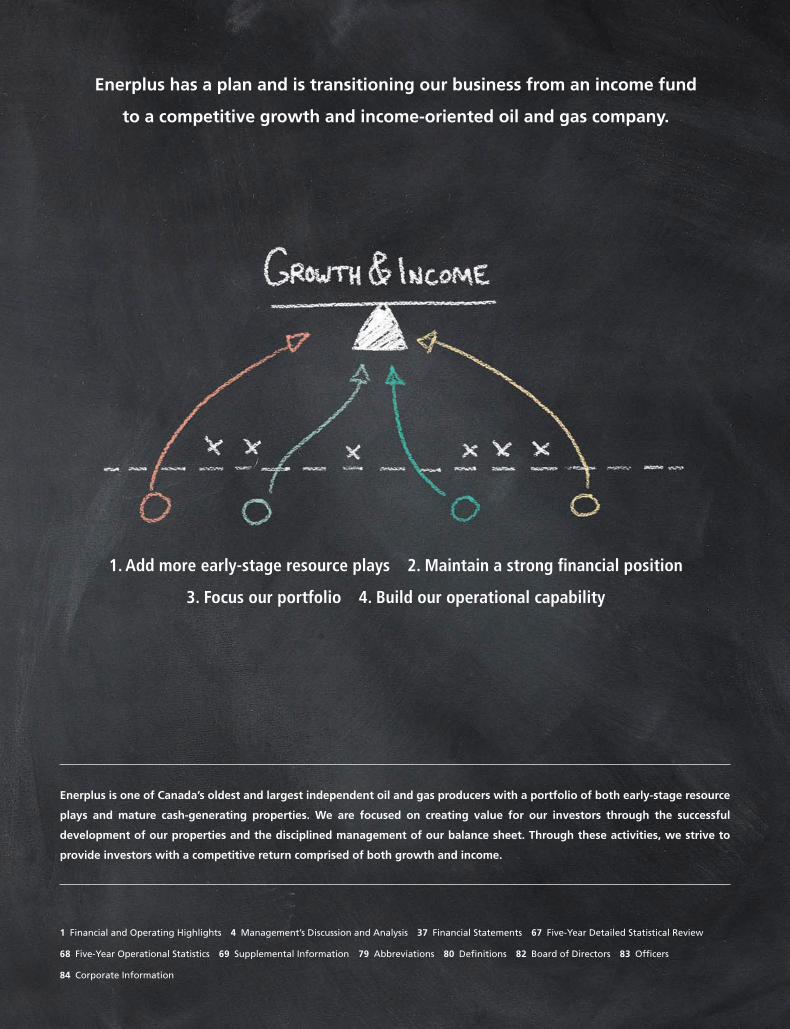
Enerplus has a plan and is transitioning our business from an income fund
to a competitive growth and income-oriented oil and gas company.
1. Add more early-stage resource plays 2. Maintain a strong financial position
3. Focus our portfolio 4. Build our operational capability
1 Financial and Operating Highlights 4 Management’s Discussion and Analysis 37 Financial Statements 67 Five-Year Detailed Statistical Review
68 Five-Year Operational Statistics 69 Supplemental Information 79 Abbreviations 80 Definitions 82 Board of Directors 83 Officers
84 Corporate Information
Enerplus is one of Canada’s oldest and largest independent oil and gas producers with a portfolio of both early-stage resource
plays and mature cash-generating properties. We are focused on creating value for our investors through the successful
development of our properties and the disciplined management of our balance sheet. Through these activities, we strive to
provide investors with a competitive return comprised of both growth and income.
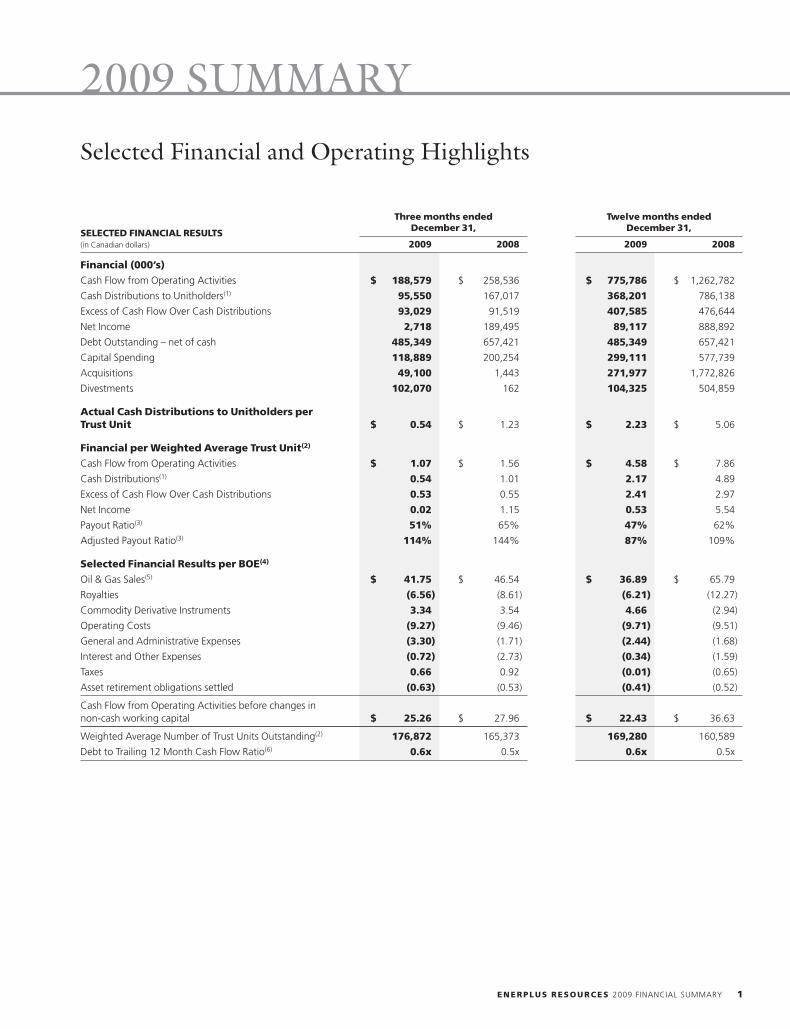
Selected Financial and Operating Highlights
Three months ended Twelve months endedDecember 31, December 31,SELECTED FINANCIAL RESULTS
(in Canadian dollars) 2009 2008 2009 2008
Financial (000’s)
Cash Flow from Operating Activities $ 188,579 $ 258,536 $ 775,786 $ 1,262,782
Cash Distributions to Unitholders(1) 95,550 167,017 368,201 786,138
Excess of Cash Flow Over Cash Distributions 93,029 91,519 407,585 476,644
Net Income 2,718 189,495 89,117 888,892
Debt Outstanding – net of cash 485,349 657,421 485,349 657,421
Capital Spending 118,889 200,254 299,111 577,739
Acquisitions 49,100 1,443 271,977 1,772,826
Divestments 102,070 162 104,325 504,859
Actual Cash Distributions to Unitholders perTrust Unit $ 0.54 $ 1.23 $ 2.23 $ 5.06
Financial per Weighted Average Trust Unit(2)
Cash Flow from Operating Activities $ 1.07 $ 1.56 $ 4.58 $ 7.86
Cash Distributions(1) 0.54 1.01 2.17 4.89
Excess of Cash Flow Over Cash Distributions 0.53 0.55 2.41 2.97
Net Income 0.02 1.15 0.53 5.54
Payout Ratio(3) 51% 65% 47% 62%
Adjusted Payout Ratio(3) 114% 144% 87% 109%
Selected Financial Results per BOE(4)
Oil & Gas Sales(5) $ 41.75 $ 46.54 $ 36.89 $ 65.79
Royalties (6.56) (8.61) (6.21) (12.27)
Commodity Derivative Instruments 3.34 3.54 4.66 (2.94)
Operating Costs (9.27) (9.46) (9.71) (9.51)
General and Administrative Expenses (3.30) (1.71) (2.44) (1.68)
Interest and Other Expenses (0.72) (2.73) (0.34) (1.59)
Taxes 0.66 0.92 (0.01) (0.65)
Asset retirement obligations settled (0.63) (0.53) (0.41) (0.52)
Cash Flow from Operating Activities before changes innon-cash working capital $ 25.26 $ 27.96 $ 22.43 $ 36.63
Weighted Average Number of Trust Units Outstanding(2) 176,872 165,373 169,280 160,589
Debt to Trailing 12 Month Cash Flow Ratio(6) 0.6x 0.5x 0.6x 0.5x
ENERPLUS RESOURCES 2009 FINANCIAL SUMMARY 1
2009 SUMMARY
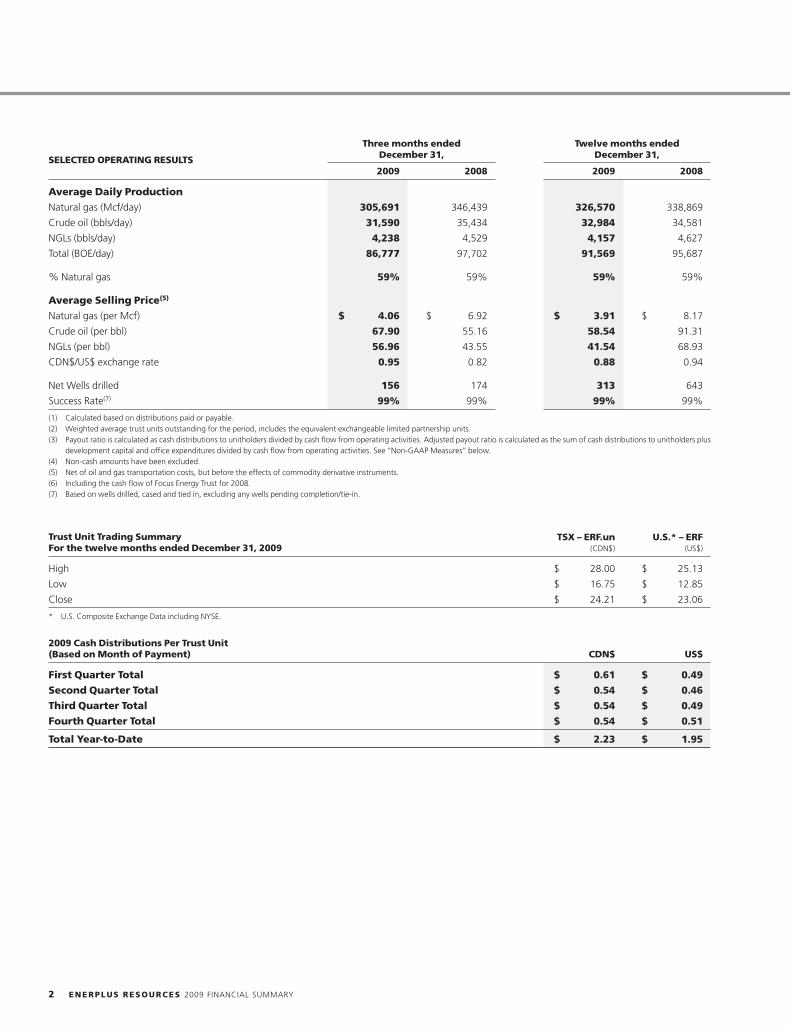
Three months ended Twelve months endedDecember 31, December 31,SELECTED OPERATING RESULTS2009 2008 2009 2008
Average Daily Production
Natural gas (Mcf/day) 305,691 346,439 326,570 338,869
Crude oil (bbls/day) 31,590 35,434 32,984 34,581
NGLs (bbls/day) 4,238 4,529 4,157 4,627
Total (BOE/day) 86,777 97,702 91,569 95,687
% Natural gas 59% 59% 59% 59%
Average Selling Price(5)
Natural gas (per Mcf) $ 4.06 $ 6.92 $ 3.91 $ 8.17
Crude oil (per bbl) 67.90 55.16 58.54 91.31
NGLs (per bbl) 56.96 43.55 41.54 68.93
CDN$/US$ exchange rate 0.95 0.82 0.88 0.94
Net Wells drilled 156 174 313 643
Success Rate(7) 99% 99% 99% 99%
(1) Calculated based on distributions paid or payable.(2) Weighted average trust units outstanding for the period, includes the equivalent exchangeable limited partnership units.(3) Payout ratio is calculated as cash distributions to unitholders divided by cash flow from operating activities. Adjusted payout ratio is calculated as the sum of cash distributions to unitholders plus
development capital and office expenditures divided by cash flow from operating activities. See ‘‘Non-GAAP Measures’’ below.(4) Non-cash amounts have been excluded.(5) Net of oil and gas transportation costs, but before the effects of commodity derivative instruments.(6) Including the cash flow of Focus Energy Trust for 2008.(7) Based on wells drilled, cased and tied in, excluding any wells pending completion/tie-in.
Trust Unit Trading Summary TSX – ERF.un U.S.* – ERFFor the twelve months ended December 31, 2009 (CDN$) (US$)
High $ 28.00 $ 25.13
Low $ 16.75 $ 12.85
Close $ 24.21 $ 23.06
* U.S. Composite Exchange Data including NYSE.
2009 Cash Distributions Per Trust Unit(Based on Month of Payment) CDN$ US$
First Quarter Total $ 0.61 $ 0.49
Second Quarter Total $ 0.54 $ 0.46
Third Quarter Total $ 0.54 $ 0.49
Fourth Quarter Total $ 0.54 $ 0.51
Total Year-to-Date $ 2.23 $ 1.95
2 ENERPLUS RESOURCES 2009 FINANCIAL SUMMARY
BUILDING FUTURE GROWTH POTENTIAL:
• Enerplus invested over $500 million in 2009 acquiring over 226,000 net acres (approximately 350 net sections) of early stage growth lands
in the Marcellus shale gas (approximately 200 net sections), Bakken/tight oil in Saskatchewan and North Dakota (approximately 78 net
sections), Deep Basin tight gas play in Alberta and British Columbia (approximately 29 net sections), and other various plays.
• We added over 2.1 trillion cubic feet equivalent (‘‘Tcfe’’) of contingent resources associated with our Marcellus shale gas assets, providing
the opportunity to more than triple our current total natural gas proved plus probable reserves.
• We invested $82 million on assessment activities associated with early-stage resource plays including land, seismic and drilling.
• We increased the best estimate of contingent resources associated with our Kirby Oil Sands lease by 20% to 497 million barrels, adding
83 million barrels from the estimate at year end 2008. Since acquiring the lease in 2007, we have increased the contingent resource
estimate by over 100%.
PRESERVING FINANCIAL STRENGTH:
• Through our disciplined approach to capital spending and distributions, we maintained a strong balance sheet and exited 2009 with a
trailing debt-to-cash flow ratio of 0.6x.
• Our unused debt facility of approximately $1.4 billion should provide meaningful credit capacity to fund additional acquisitions and further
transition the asset base.
• Cash flow from operating activities was down considerably in 2009 to $776 million from $1,263 million in 2008 as a result of decreased
commodity prices.
• Cash distributions paid to unitholders were reduced by 56% and totaled $2.23 per trust unit. In total, 47% of cash flow was paid
to unitholders.
• Cash distributions and development capital spending combined represented 87% of cash flow for the year.
• Our oil and natural gas hedging program generated cash gains of $155.8 million during 2009.
OPERATIONAL PERFORMANCE:
• Production averaged 91,569 BOE/day, slightly ahead of our full-year guidance of 91,000 BOE/day.
• Average December production volumes were 85,400 BOE/day, 3% below our exit target as a result of unexpected downtime related to
cold weather, unplanned turn-arounds at two non-operated facilities and delays in capital spending. After adjusting for weather and
unplanned downtime, our exit rate would have been 87,200 BOE/day.
• Capital spending was $299 million, approximately 5% less than our guidance of $315 million excluding the carry capital associated with
our Marcellus shale gas assets.
• A total of 313 net wells were drilled with a 99% success rate.
• Operating costs were $9.79/BOE, 4% lower than our guidance of $10.20/BOE.
• General and Administrative (‘‘G&A’’) expenses were impacted by one-time costs in 2009 and averaged $2.64/BOE, approximately 8%
higher than our guidance of $2.45/BOE. After adjusting for one-time costs, our G&A costs were $2.31/BOE, approximately 6% better
than guidance.
• We sold approximately 4.5 net sections of low working interest, non-core property interests in southeast Saskatchewan for approximately
$100 million as part of our strategy to focus our activities on a fewer number of high impact resource plays.
• We are well positioned to begin marketing and potentially divest up to 14,000 BOE/day of non-core assets to further focus our asset base.
• Our reserve volumes were impacted by negative revisions associated with changes in evaluation methodology, the removal of
undeveloped drilling locations due to changes to our capital spending plans, lower natural gas prices along with reservoir performance.
• Total proved plus probable reserves declined to 345 million BOE, a decrease of approximately 20% over year-end 2008, primarily in our
shallow natural gas assets.
• Our 2009 acquisition activities were focused primarily on acquiring land positions in key resource plays that provide growth prospects for
the future. While these acquisitions did not add any significant proved plus probable reserves in the current year, they did add significant
contingent resources and growth potential for future years.
• The negative reserve revisions more than offset the reserves added through our capital spending and acquisition activities. As a result, our
Finding & Development (‘‘F&D’’) and Finding, Development & Acquisition (‘‘FD&A’’) costs and recycle ratios were negative in 2009 and
consequently incalculable.
• Excluding revisions, our capital program added 13.6 million BOE of new reserves resulting in F&D costs of approximately $20/BOE with a
1.3x recycle ratio.
ENERPLUS RESOURCES 2009 FINANCIAL SUMMARY 3
2009 HIGHLIGHTS
Management’s Discussion and Analysis (‘‘MD&A’’)
The following discussion and analysis of financial results is dated February 24, 2010 and is to be read in conjunction with the audited
consolidated financial statements as at and for the years ended December 31, 2009 and 2008. All amounts are stated in Canadian dollars
unless otherwise specified. All references to GAAP refer to Canadian generally accepted accounting principles. All note references relate to
the notes included with the consolidated financial statements. In accordance with Canadian practice revenues are reported on a gross basis,
before deduction of Crown and other royalties, unless otherwise stated. Where applicable, natural gas has been converted to barrels of oil
equivalent (‘‘BOE’’) based on 6 Mcf:1 BOE. The BOE rate is based on an energy equivalent conversion method primarily applicable at the
burner tip and does not represent a value equivalent at the wellhead. Use of BOE in isolation may be misleading.
The following MD&A contains forward-looking information and statements. We refer you to the end of the MD&A under ‘‘Forward-Looking
Information and Statements’’ for our disclaimer on forward-looking information and statements.
NON-GAAP MEASURES
Throughout the MD&A we use the term ‘‘payout ratio’’ and ‘‘adjusted payout ratio’’ to analyze operating performance, leverage and
liquidity. We calculate payout ratio by dividing cash distributions to unitholders (‘‘cash distributions’’) by cash flow from operating activities
(‘‘cash flow’’), both of which appear on our consolidated statements of cash flows prepared in accordance with GAAP. ‘‘Adjusted payout
ratio’’ is calculated as cash distributions plus development capital and office expenditures divided by cash flow. The terms ‘‘payout ratio’’ and
‘‘adjusted payout ratio’’ do not have a standardized meaning or definition as prescribed by GAAP and therefore may not be comparable with
the calculation of similar measures by other entities. Refer to the Liquidity and Capital Resources section of the MD&A for further
information.
OVERVIEW
Early in 2009 in response to the steep decline in commodity prices and the global credit crisis we lowered our monthly distributions to $0.18
per unit and significantly reduced our development capital program. This was done to ensure we maintained a strong balance sheet to
provide the financial flexibility and liquidity to pursue growth assets.
In June 2009 we successfully diversified our credit sources through a private placement of senior unsecured notes that raised gross proceeds
of approximately $338.7 million. At December 31, 2009 our entire $1.4 billion credit facility was undrawn and our trailing debt to cash flow
ratio was 0.6x.
Throughout 2009 we executed on our strategy of acquiring new positions in earlier stage resource plays. On September 1, 2009 we acquired
an average 21.5% working interest in approximately 540,000 gross acres of land in the U.S. Marcellus shale gas play. Total consideration was
US$411 million comprised of US$164.4 million of cash paid on closing and US$246.6 million to be paid over time as a carry representing
50% of our partners’ future drilling and completion costs. In conjunction with the acquisition we completed an equity offering on
September 9, 2009 raising gross proceeds of $225.3 million through the issuance of 10.4 million trust units. We also acquired additional
Bakken land interests in southeast Saskatchewan and North Dakota for approximately $55 million during 2009.
Our operational results for 2009 were generally in-line with guidance. We exited the year with production of 85,400 BOE/day, which was
slightly lower than our expectations due to extreme cold weather and downtime at two facilities. Operating costs were better than expected
along with G&A costs before one-time charges.
In late 2009 we announced our intention to sell approximately 14,000 BOE/day of non-core production that does not fit with our strategy
going forward. This should provide additional funds for acquisitions and capital spending during 2010, and allow us to focus our efforts on
high impact properties.
We expect to take advantage of SIFT conversion rules which will allow us to significantly simplify our organizational structure at the same
time as we convert to a dividend paying corporation. Assuming the conversion proposal receives Board approval and unitholder acceptance,
we expect to convert into a corporation on or about January 1, 2011.
4 ENERPLUS RESOURCES 2009 FINANCIAL SUMMARY
MD&A
RESULTS OF OPERATIONS
Production
Production during 2009 averaged 91,569 BOE/day, slightly ahead of our guidance of 91,000 BOE/day and 4% lower than 95,687 BOE/day in
2008. The decrease compared to 2008 was consistent with our expectations as reduced capital spending did not completely replace natural
reservoir declines during the year.
Average production in 2009 was weighted 59% to natural gas and 41% to crude oil and liquids on a BOE basis. Average production volumes
for the years ended December 31, 2009 and 2008 are outlined below:
Daily Production Volumes 2009 2008 % Change
Natural gas (Mcf/day) 326,570 338,869 (4)%
Crude oil (bbls/day) 32,984 34,581 (5)%
Natural gas liquids (bbls/day) 4,157 4,627 (10)%
Total daily sales (BOE/day) 91,569 95,687 (4)%
Our average daily production for the month of December was approximately 85,400 BOE/day, below our anticipated exit rate of
88,000 BOE/day. During the month of December we experienced interruptions of 1,300 BOE/day due to weather freeze-ups, 500 BOE/day
due to unscheduled downtime at non-operated facilities, and the delay of approximately 800 BOE/day due to the timing of capital projects.
Considering our development capital program for the year, we expect 2010 production volumes to average 86,000 BOE/day, weighted 58%
to natural gas and 42% to crude oil and liquids. We expect our production volumes to increase throughout the year and to exit 2010 at
approximately 88,000 BOE/day which does not contemplate any potential acquisitions or dispositions.
Pricing
The prices received for our natural gas and crude oil production directly impact our earnings, cash flow and financial condition. The following
table compares our average selling prices for 2009 with those of 2008. It also compares the benchmark price indices for the same periods.
Average Selling Price(1) 2009 2008 % Change
Natural gas (per Mcf) $ 3.91 $ 8.17 (52)%
Crude oil (per bbl) $ 58.54 $ 91.31 (36)%
Natural gas liquids (per bbl) $ 41.54 $ 68.93 (40)%
Per BOE $ 36.89 $ 65.79 (44)%
(1) Net of oil and gas transportation costs, but before the effects of commodity derivative instruments.
Average Benchmark Pricing 2009 2008 % Change
AECO natural gas – monthly index (CDN$/Mcf) $ 4.14 $ 8.13 (49)%
AECO natural gas – daily index (CDN$/Mcf) $ 3.95 $ 8.14 (51)%
NYMEX natural gas – monthly NX3 index (US$/Mcf) $ 4.03 $ 8.93 (55)%
NYMEX natural gas – monthly NX3 index: CDN$ equivalent (CDN$/Mcf) $ 4.58 $ 9.50 (52)%
WTI crude oil (US$/bbl) $ 61.80 $ 99.65 (38)%
WTI crude oil: CDN$ equivalent (CDN$/bbl) $ 70.23 $ 106.01 (34)%
CDN$/US$ exchange rate 0.88 0.94 (6)%
Natural Gas
Natural gas prices declined through the first three quarters of 2009, opening at $6.67/Mcf at AECO and falling to a daily low of $2.03/Mcf
on September 3, 2009. The weakening natural gas price was due to demand destruction from the sluggish economy and also an over supply
from US domestic natural gas production. Storage inventories grew to record levels as demand for cooling through the summer was low due
to mild weather. Minimal disruptions from hurricane activity kept supply strong causing additional downward pressure on price. By October,
gas prices started to recover with the onset of winter weather and lower storage injection rates ending the year at $5.68/Mcf.
ENERPLUS RESOURCES 2009 FINANCIAL SUMMARY 5
22FEB201012245427
22FEB201012245291
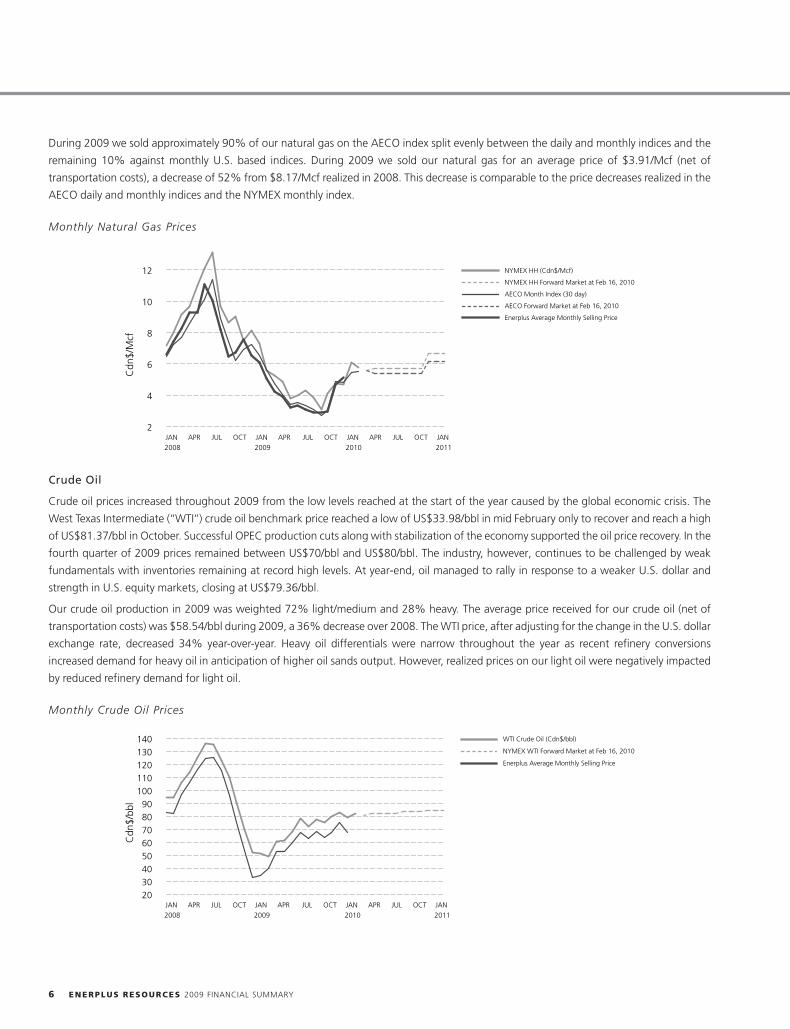
During 2009 we sold approximately 90% of our natural gas on the AECO index split evenly between the daily and monthly indices and the
remaining 10% against monthly U.S. based indices. During 2009 we sold our natural gas for an average price of $3.91/Mcf (net of
transportation costs), a decrease of 52% from $8.17/Mcf realized in 2008. This decrease is comparable to the price decreases realized in the
AECO daily and monthly indices and the NYMEX monthly index.
Monthly Natural Gas Prices
2
4
6
8
10
12
JAN2008
APR JUL OCT JAN2009
APR JUL OCT JAN2010
APR JUL OCT JAN2011
Cdn
$/M
cf
NYMEX HH (Cdn$/Mcf)
NYMEX HH Forward Market at Feb 16, 2010
AECO Month Index (30 day)
AECO Forward Market at Feb 16, 2010
Enerplus Average Monthly Selling Price
Crude Oil
Crude oil prices increased throughout 2009 from the low levels reached at the start of the year caused by the global economic crisis. The
West Texas Intermediate (‘‘WTI’’) crude oil benchmark price reached a low of US$33.98/bbl in mid February only to recover and reach a high
of US$81.37/bbl in October. Successful OPEC production cuts along with stabilization of the economy supported the oil price recovery. In the
fourth quarter of 2009 prices remained between US$70/bbl and US$80/bbl. The industry, however, continues to be challenged by weak
fundamentals with inventories remaining at record high levels. At year-end, oil managed to rally in response to a weaker U.S. dollar and
strength in U.S. equity markets, closing at US$79.36/bbl.
Our crude oil production in 2009 was weighted 72% light/medium and 28% heavy. The average price received for our crude oil (net of
transportation costs) was $58.54/bbl during 2009, a 36% decrease over 2008. The WTI price, after adjusting for the change in the U.S. dollar
exchange rate, decreased 34% year-over-year. Heavy oil differentials were narrow throughout the year as recent refinery conversions
increased demand for heavy oil in anticipation of higher oil sands output. However, realized prices on our light oil were negatively impacted
by reduced refinery demand for light oil.
Monthly Crude Oil Prices
2030405060708090
100110120130140
JAN2008
APR JUL OCT JAN2009
APR JUL OCT JAN2010
APR JUL OCT JAN2011
Cdn
$/bb
l
WTI Crude Oil (Cdn$/bbl)
NYMEX WTI Forward Market at Feb 16, 2010
Enerplus Average Monthly Selling Price
6 ENERPLUS RESOURCES 2009 FINANCIAL SUMMARY
Foreign Exchange
The Canadian dollar opened 2009 at a CDN$/US$ exchange rate of $0.83 and strengthened throughout most of the year hitting a high in
October of $0.97 and ending the year at $0.96. The Canadian dollar strengthened against the U.S. dollar during 2009 but was weaker on
average compared to 2008. As most of our crude oil and natural gas is priced in reference to U.S. dollar denominated benchmarks, a weaker
Canadian dollar increases the prices that we would have otherwise realized.
Price Risk Management
We continue to adjust our price risk management program with consideration given to our overall financial position together with the
economics of our development capital program and potential acquisitions. Consideration is also given to the costs of our risk management
program as we seek to limit our exposure to price downturns.
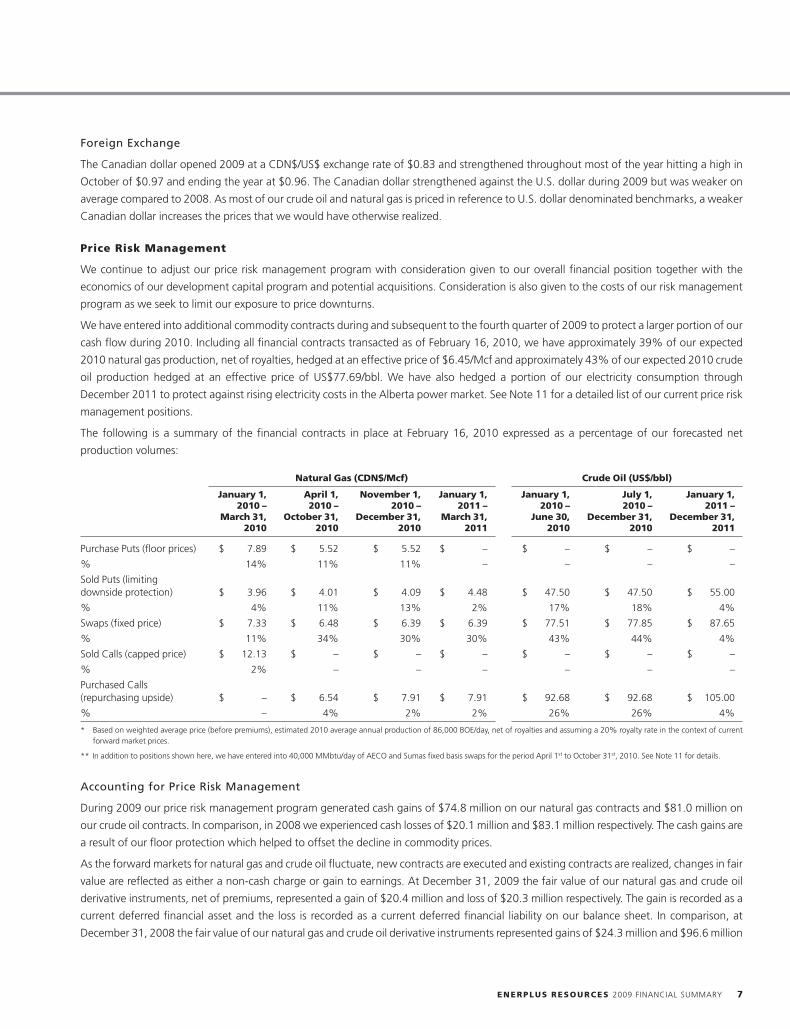
We have entered into additional commodity contracts during and subsequent to the fourth quarter of 2009 to protect a larger portion of our
cash flow during 2010. Including all financial contracts transacted as of February 16, 2010, we have approximately 39% of our expected
2010 natural gas production, net of royalties, hedged at an effective price of $6.45/Mcf and approximately 43% of our expected 2010 crude
oil production hedged at an effective price of US$77.69/bbl. We have also hedged a portion of our electricity consumption through
December 2011 to protect against rising electricity costs in the Alberta power market. See Note 11 for a detailed list of our current price risk
management positions.
The following is a summary of the financial contracts in place at February 16, 2010 expressed as a percentage of our forecasted net
production volumes:
Natural Gas (CDN$/Mcf) Crude Oil (US$/bbl)
January 1, April 1, November 1, January 1, January 1, July 1, January 1,2010 – 2010 – 2010 – 2011 – 2010 – 2010 – 2011 –
March 31, October 31, December 31, March 31, June 30, December 31, December 31,2010 2010 2010 2011 2010 2010 2011
Purchase Puts (floor prices) $ 7.89 $ 5.52 $ 5.52 $ – $ – $ – $ –
% 14% 11% 11% – – – –
Sold Puts (limitingdownside protection) $ 3.96 $ 4.01 $ 4.09 $ 4.48 $ 47.50 $ 47.50 $ 55.00
% 4% 11% 13% 2% 17% 18% 4%
Swaps (fixed price) $ 7.33 $ 6.48 $ 6.39 $ 6.39 $ 77.51 $ 77.85 $ 87.65
% 11% 34% 30% 30% 43% 44% 4%
Sold Calls (capped price) $ 12.13 $ – $ – $ – $ – $ – $ –
% 2% – – – – – –
Purchased Calls(repurchasing upside) $ – $ 6.54 $ 7.91 $ 7.91 $ 92.68 $ 92.68 $ 105.00
% – 4% 2% 2% 26% 26% 4%
* Based on weighted average price (before premiums), estimated 2010 average annual production of 86,000 BOE/day, net of royalties and assuming a 20% royalty rate in the context of currentforward market prices.
** In addition to positions shown here, we have entered into 40,000 MMbtu/day of AECO and Sumas fixed basis swaps for the period April 1st to October 31st, 2010. See Note 11 for details.
Accounting for Price Risk Management
During 2009 our price risk management program generated cash gains of $74.8 million on our natural gas contracts and $81.0 million on
our crude oil contracts. In comparison, in 2008 we experienced cash losses of $20.1 million and $83.1 million respectively. The cash gains are
a result of our floor protection which helped to offset the decline in commodity prices.
As the forward markets for natural gas and crude oil fluctuate, new contracts are executed and existing contracts are realized, changes in fair
value are reflected as either a non-cash charge or gain to earnings. At December 31, 2009 the fair value of our natural gas and crude oil
derivative instruments, net of premiums, represented a gain of $20.4 million and loss of $20.3 million respectively. The gain is recorded as a
current deferred financial asset and the loss is recorded as a current deferred financial liability on our balance sheet. In comparison, at
December 31, 2008 the fair value of our natural gas and crude oil derivative instruments represented gains of $24.3 million and $96.6 million
ENERPLUS RESOURCES 2009 FINANCIAL SUMMARY 7
respectively. The change in the fair value of our commodity derivative instruments during 2009 resulted in unrealized losses of $3.9 million
for natural gas and $117.0 million for crude oil. See Note 11 for details.
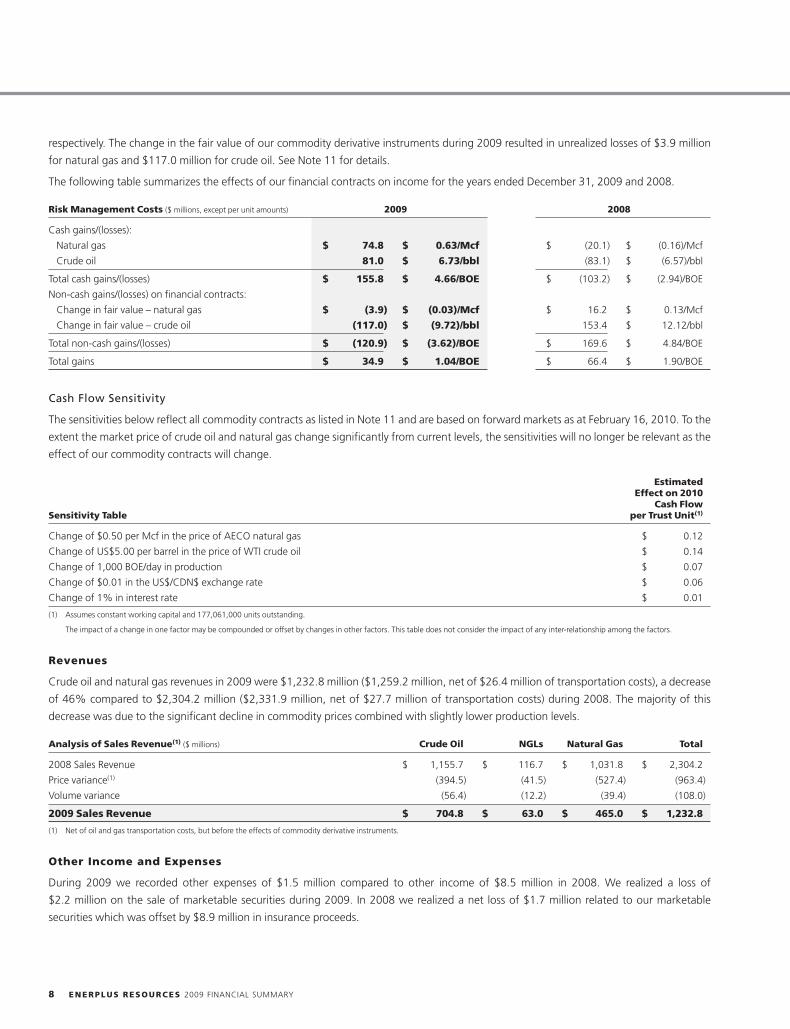
The following table summarizes the effects of our financial contracts on income for the years ended December 31, 2009 and 2008.
Risk Management Costs ($ millions, except per unit amounts) 2009 2008
Cash gains/(losses):
Natural gas $ 74.8 $ 0.63/Mcf $ (20.1) $ (0.16)/Mcf
Crude oil 81.0 $ 6.73/bbl (83.1) $ (6.57)/bbl
Total cash gains/(losses) $ 155.8 $ 4.66/BOE $ (103.2) $ (2.94)/BOE
Non-cash gains/(losses) on financial contracts:
Change in fair value – natural gas $ (3.9) $ (0.03)/Mcf $ 16.2 $ 0.13/Mcf
Change in fair value – crude oil (117.0) $ (9.72)/bbl 153.4 $ 12.12/bbl
Total non-cash gains/(losses) $ (120.9) $ (3.62)/BOE $ 169.6 $ 4.84/BOE
Total gains $ 34.9 $ 1.04/BOE $ 66.4 $ 1.90/BOE
Cash Flow Sensitivity
The sensitivities below reflect all commodity contracts as listed in Note 11 and are based on forward markets as at February 16, 2010. To the
extent the market price of crude oil and natural gas change significantly from current levels, the sensitivities will no longer be relevant as the
effect of our commodity contracts will change.
EstimatedEffect on 2010
Cash FlowSensitivity Table per Trust Unit(1)
Change of $0.50 per Mcf in the price of AECO natural gas $ 0.12
Change of US$5.00 per barrel in the price of WTI crude oil $ 0.14
Change of 1,000 BOE/day in production $ 0.07
Change of $0.01 in the US$/CDN$ exchange rate $ 0.06
Change of 1% in interest rate $ 0.01
(1) Assumes constant working capital and 177,061,000 units outstanding.
The impact of a change in one factor may be compounded or offset by changes in other factors. This table does not consider the impact of any inter-relationship among the factors.
Revenues
Crude oil and natural gas revenues in 2009 were $1,232.8 million ($1,259.2 million, net of $26.4 million of transportation costs), a decrease
of 46% compared to $2,304.2 million ($2,331.9 million, net of $27.7 million of transportation costs) during 2008. The majority of this
decrease was due to the significant decline in commodity prices combined with slightly lower production levels.
Analysis of Sales Revenue(1) ($ millions) Crude Oil NGLs Natural Gas Total
2008 Sales Revenue $ 1,155.7 $ 116.7 $ 1,031.8 $ 2,304.2
Price variance(1) (394.5) (41.5) (527.4) (963.4)
Volume variance (56.4) (12.2) (39.4) (108.0)
2009 Sales Revenue $ 704.8 $ 63.0 $ 465.0 $ 1,232.8
(1) Net of oil and gas transportation costs, but before the effects of commodity derivative instruments.
Other Income and Expenses
During 2009 we recorded other expenses of $1.5 million compared to other income of $8.5 million in 2008. We realized a loss of
$2.2 million on the sale of marketable securities during 2009. In 2008 we realized a net loss of $1.7 million related to our marketable
securities which was offset by $8.9 million in insurance proceeds.
8 ENERPLUS RESOURCES 2009 FINANCIAL SUMMARY
Royalties
Royalties are paid to various government entities and other land and mineral rights owners. Total royalties paid during 2009 decreased to
$207.5 million from $429.9 million in 2008, primarily due to lower commodity prices and to a lesser extent lower production volumes. As a
percentage of oil and gas sales, net of transportation costs, royalties in 2009 decreased to approximately 17% from 19% in the previous year
largely due to Alberta’s New Royalty Framework’s sensitivity to lower natural gas prices in 2009.
The province of Alberta is currently conducting a review of its royalty structure, to ensure the competitiveness of oil and gas investment in
Alberta. The results of the review are expected to be announced in the second or third quarter of 2010. Approximately 60% of our
production is from Alberta.
Operating Expenses
Operating expenses during 2009 were $327.2 million, 2% lower than 2008 operating costs of $332.6 million due to lower power costs. On
a BOE basis, 2009 operating expenses were $9.79/BOE or 3% higher than 2008 operating costs of $9.50/BOE due to lower production
volumes during 2009.
For 2010 we expect operating costs to average $10.90/BOE. We are anticipating a modest increase in our power and labour costs, but expect
other operating costs to remain essentially flat. Operating costs are expected to be higher on a BOE basis due to lower average production.
General and Administrative Expenses (‘‘G&A’’)
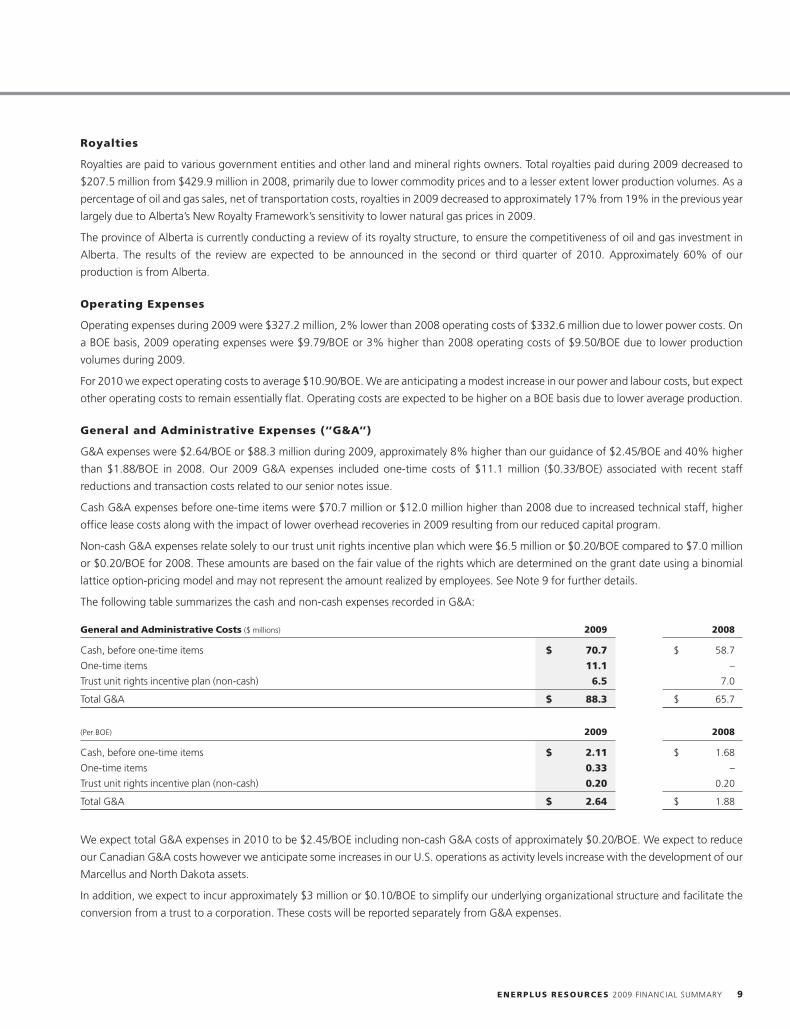
G&A expenses were $2.64/BOE or $88.3 million during 2009, approximately 8% higher than our guidance of $2.45/BOE and 40% higher
than $1.88/BOE in 2008. Our 2009 G&A expenses included one-time costs of $11.1 million ($0.33/BOE) associated with recent staff
reductions and transaction costs related to our senior notes issue.
Cash G&A expenses before one-time items were $70.7 million or $12.0 million higher than 2008 due to increased technical staff, higher
office lease costs along with the impact of lower overhead recoveries in 2009 resulting from our reduced capital program.
Non-cash G&A expenses relate solely to our trust unit rights incentive plan which were $6.5 million or $0.20/BOE compared to $7.0 million
or $0.20/BOE for 2008. These amounts are based on the fair value of the rights which are determined on the grant date using a binomial
lattice option-pricing model and may not represent the amount realized by employees. See Note 9 for further details.
The following table summarizes the cash and non-cash expenses recorded in G&A:
General and Administrative Costs ($ millions) 2009 2008
Cash, before one-time items $ 70.7 $ 58.7
One-time items 11.1 –
Trust unit rights incentive plan (non-cash) 6.5 7.0
Total G&A $ 88.3 $ 65.7
(Per BOE) 2009 2008
Cash, before one-time items $ 2.11 $ 1.68
One-time items 0.33 –
Trust unit rights incentive plan (non-cash) 0.20 0.20
Total G&A $ 2.64 $ 1.88
We expect total G&A expenses in 2010 to be $2.45/BOE including non-cash G&A costs of approximately $0.20/BOE. We expect to reduce
our Canadian G&A costs however we anticipate some increases in our U.S. operations as activity levels increase with the development of our
Marcellus and North Dakota assets.
In addition, we expect to incur approximately $3 million or $0.10/BOE to simplify our underlying organizational structure and facilitate the
conversion from a trust to a corporation. These costs will be reported separately from G&A expenses.
ENERPLUS RESOURCES 2009 FINANCIAL SUMMARY 9
Interest Expense
Interest expense includes interest on long-term debt, the premium amortization on our US$175 million senior unsecured notes, unrealized
gains and losses resulting from the change in fair value of our interest rate swaps as well as the interest component on our cross currency
interest rate swap (‘‘CCIRS’’). See Note 7 for further details.
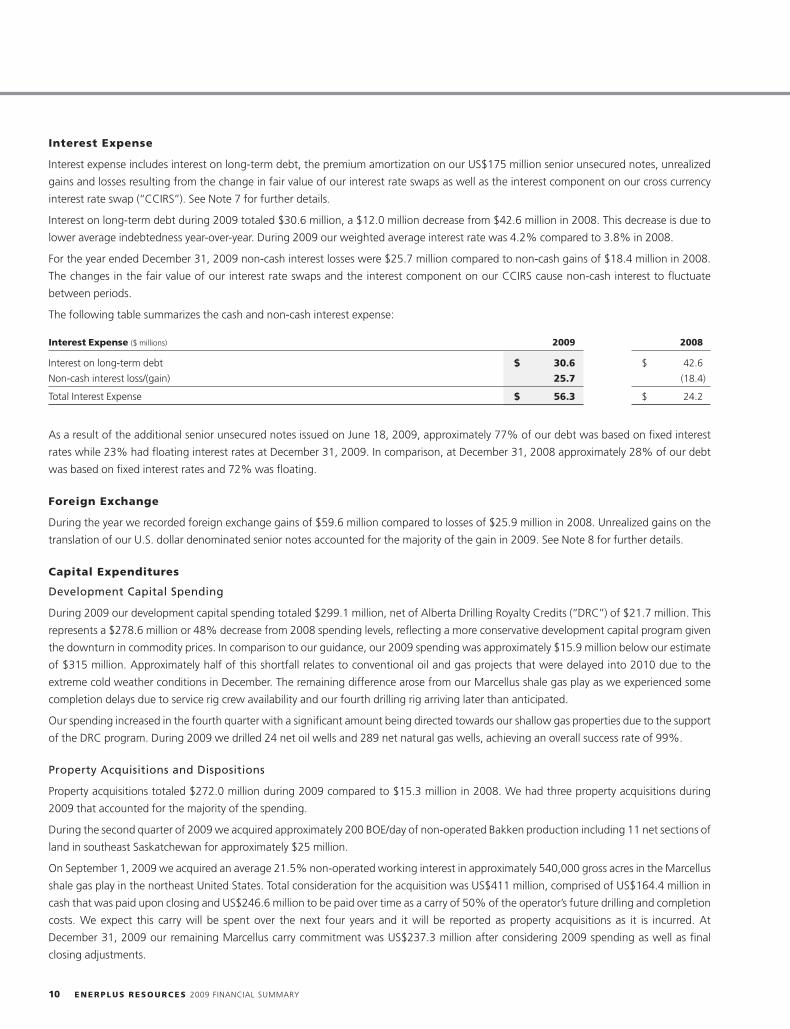
Interest on long-term debt during 2009 totaled $30.6 million, a $12.0 million decrease from $42.6 million in 2008. This decrease is due to
lower average indebtedness year-over-year. During 2009 our weighted average interest rate was 4.2% compared to 3.8% in 2008.
For the year ended December 31, 2009 non-cash interest losses were $25.7 million compared to non-cash gains of $18.4 million in 2008.
The changes in the fair value of our interest rate swaps and the interest component on our CCIRS cause non-cash interest to fluctuate
between periods.
The following table summarizes the cash and non-cash interest expense:
Interest Expense ($ millions) 2009 2008
Interest on long-term debt $ 30.6 $ 42.6
Non-cash interest loss/(gain) 25.7 (18.4)
Total Interest Expense $ 56.3 $ 24.2
As a result of the additional senior unsecured notes issued on June 18, 2009, approximately 77% of our debt was based on fixed interest
rates while 23% had floating interest rates at December 31, 2009. In comparison, at December 31, 2008 approximately 28% of our debt
was based on fixed interest rates and 72% was floating.
Foreign Exchange
During the year we recorded foreign exchange gains of $59.6 million compared to losses of $25.9 million in 2008. Unrealized gains on the
translation of our U.S. dollar denominated senior notes accounted for the majority of the gain in 2009. See Note 8 for further details.
Capital Expenditures
Development Capital Spending
During 2009 our development capital spending totaled $299.1 million, net of Alberta Drilling Royalty Credits (‘‘DRC’’) of $21.7 million. This
represents a $278.6 million or 48% decrease from 2008 spending levels, reflecting a more conservative development capital program given
the downturn in commodity prices. In comparison to our guidance, our 2009 spending was approximately $15.9 million below our estimate
of $315 million. Approximately half of this shortfall relates to conventional oil and gas projects that were delayed into 2010 due to the
extreme cold weather conditions in December. The remaining difference arose from our Marcellus shale gas play as we experienced some
completion delays due to service rig crew availability and our fourth drilling rig arriving later than anticipated.
Our spending increased in the fourth quarter with a significant amount being directed towards our shallow gas properties due to the support
of the DRC program. During 2009 we drilled 24 net oil wells and 289 net natural gas wells, achieving an overall success rate of 99%.
Property Acquisitions and Dispositions
Property acquisitions totaled $272.0 million during 2009 compared to $15.3 million in 2008. We had three property acquisitions during
2009 that accounted for the majority of the spending.
During the second quarter of 2009 we acquired approximately 200 BOE/day of non-operated Bakken production including 11 net sections of
land in southeast Saskatchewan for approximately $25 million.
On September 1, 2009 we acquired an average 21.5% non-operated working interest in approximately 540,000 gross acres in the Marcellus
shale gas play in the northeast United States. Total consideration for the acquisition was US$411 million, comprised of US$164.4 million in
cash that was paid upon closing and US$246.6 million to be paid over time as a carry of 50% of the operator’s future drilling and completion
costs. We expect this carry will be spent over the next four years and it will be reported as property acquisitions as it is incurred. At
December 31, 2009 our remaining Marcellus carry commitment was US$237.3 million after considering 2009 spending as well as final
closing adjustments.
10 ENERPLUS RESOURCES 2009 FINANCIAL SUMMARY
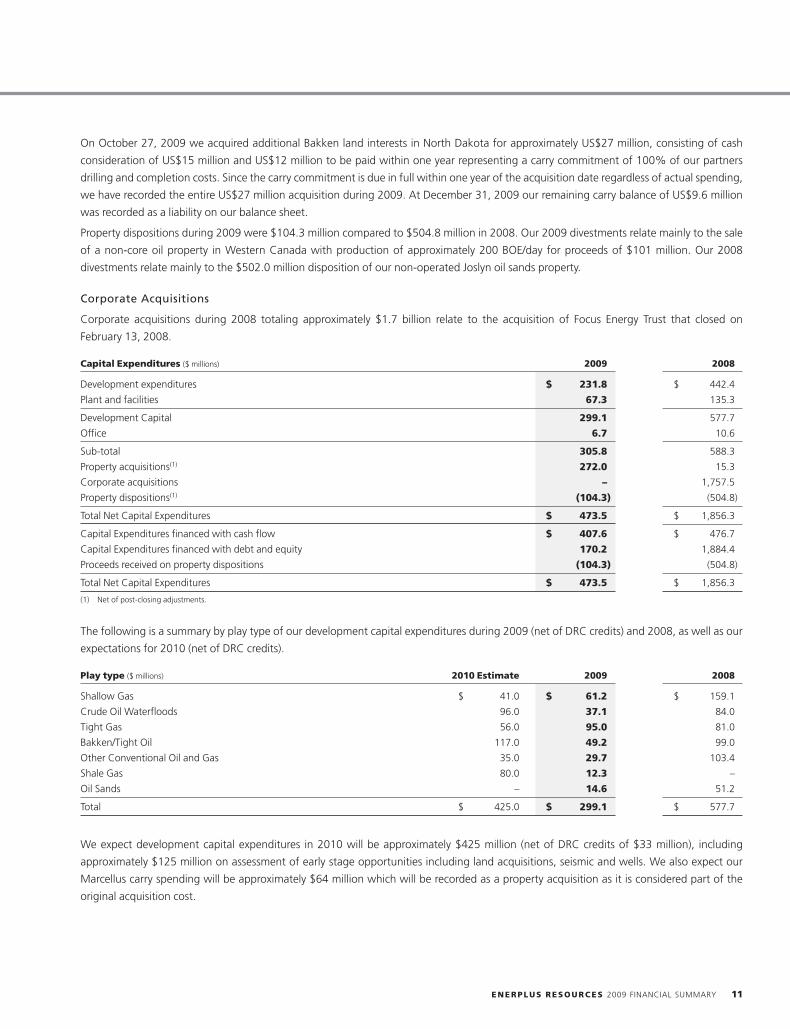
On October 27, 2009 we acquired additional Bakken land interests in North Dakota for approximately US$27 million, consisting of cash
consideration of US$15 million and US$12 million to be paid within one year representing a carry commitment of 100% of our partners
drilling and completion costs. Since the carry commitment is due in full within one year of the acquisition date regardless of actual spending,
we have recorded the entire US$27 million acquisition during 2009. At December 31, 2009 our remaining carry balance of US$9.6 million
was recorded as a liability on our balance sheet.
Property dispositions during 2009 were $104.3 million compared to $504.8 million in 2008. Our 2009 divestments relate mainly to the sale
of a non-core oil property in Western Canada with production of approximately 200 BOE/day for proceeds of $101 million. Our 2008
divestments relate mainly to the $502.0 million disposition of our non-operated Joslyn oil sands property.
Corporate Acquisitions
Corporate acquisitions during 2008 totaling approximately $1.7 billion relate to the acquisition of Focus Energy Trust that closed on
February 13, 2008.
Capital Expenditures ($ millions) 2009 2008
Development expenditures $ 231.8 $ 442.4
Plant and facilities 67.3 135.3
Development Capital 299.1 577.7
Office 6.7 10.6
Sub-total 305.8 588.3
Property acquisitions(1) 272.0 15.3
Corporate acquisitions – 1,757.5
Property dispositions(1) (104.3) (504.8)
Total Net Capital Expenditures $ 473.5 $ 1,856.3
Capital Expenditures financed with cash flow $ 407.6 $ 476.7
Capital Expenditures financed with debt and equity 170.2 1,884.4
Proceeds received on property dispositions (104.3) (504.8)
Total Net Capital Expenditures $ 473.5 $ 1,856.3
(1) Net of post-closing adjustments.
The following is a summary by play type of our development capital expenditures during 2009 (net of DRC credits) and 2008, as well as our
expectations for 2010 (net of DRC credits).
Play type ($ millions) 2010 Estimate 2009 2008
Shallow Gas $ 41.0 $ 61.2 $ 159.1
Crude Oil Waterfloods 96.0 37.1 84.0
Tight Gas 56.0 95.0 81.0
Bakken/Tight Oil 117.0 49.2 99.0
Other Conventional Oil and Gas 35.0 29.7 103.4
Shale Gas 80.0 12.3 –
Oil Sands – 14.6 51.2
Total $ 425.0 $ 299.1 $ 577.7
We expect development capital expenditures in 2010 will be approximately $425 million (net of DRC credits of $33 million), including
approximately $125 million on assessment of early stage opportunities including land acquisitions, seismic and wells. We also expect our
Marcellus carry spending will be approximately $64 million which will be recorded as a property acquisition as it is considered part of the
original acquisition cost.
ENERPLUS RESOURCES 2009 FINANCIAL SUMMARY 11
Oil Sands
Our current oil sands portfolio includes our 100% owned and operated Kirby steam assisted gravity drainage (‘‘SAGD’’) project and an 11%
minority equity ownership interest in Laricina Energy Ltd., a private oil sands company focused on SAGD development in the Athabasca oil
sands. On April 17, 2009 we announced the deferral of further development of the Kirby project although we expect to receive regulatory
approval in 2010.
Our oil sands projects have not commenced commercial production and as a result, all associated costs inclusive of acquisition expenditures
are capitalized and excluded from our depletion calculation. At December 31, 2009 capitalized costs life-to-date for our oil sands projects
were $273.0 million compared to $257.6 million at December 31, 2008.
Depletion, Depreciation, Amortization and Accretion (‘‘DDA&A’’)
DDA&A of property, plant and equipment (‘‘PP&E’’) is recognized using the unit-of-production method based on proved reserves. For 2009
DDA&A was $650.4 million or $19.45/BOE compared to $640.4 million or $18.29/BOE in 2008. The increase in our 2009 DDA&A is
attributable to a higher depletion rate due to negative reserve revisions at December 31, 2009.
No impairment of the Fund’s PP&E values existed at December 31, 2009 using year-end reserves and management’s estimates of future
prices. Our future price estimates are more fully discussed in Note 3.
Goodwill
The goodwill balance of $607.4 million is a result of previous corporate acquisitions and represents the excess of the total purchase price over
the fair value of the net identifiable assets and liabilities acquired. The goodwill balance with respect to our U.S operations is exposed to
foreign currency fluctuations as it is translated into Canadian dollars at the period end exchange rate. No goodwill impairment existed as of
December 31, 2009.
Asset Retirement Obligations
In connection with our operations, we anticipate we will incur abandonment and reclamation costs for surface leases, wells, facilities and
pipelines. Total future asset retirement obligations included on our balance sheet are estimated by management based on our net ownership
interest in wells and facilities, estimated costs to abandon and reclaim the wells and facilities and the estimated timing of the costs to be
incurred in future periods. We have estimated the net present value of our total asset retirement obligations to be approximately
$230.5 million at December 31, 2009 compared to $207.4 million at December 31, 2008. The majority of the $23.1 million increase was due
to the acceleration of the timing of future abandonment and reclamation expenditures on the majority of our shallow gas properties due to
the reduced economic life of our reserves that resulted from our December 31, 2009 reserve revisions.
Actual asset retirement costs are incurred at different times compared to the recording of amortization and accretion charges. Actual asset
retirement costs will be incurred over the next 66 years with the majority between 2030 and 2049. For accounting purposes, the asset
retirement cost is amortized using a unit-of-production method based on proved reserves before royalties, while the asset retirement
obligation accretes until the time the obligation is settled.
Taxes
Future Income Taxes
Future income taxes arise from differences between the accounting and tax basis of assets and liabilities. A portion of the future income tax
liability recorded on the balance sheet will be recovered through earnings before 2011. The balance will be realized when future income tax
assets and liabilities are realized or settled.
The future income tax recovery for 2009 was $93.2 million compared to $51.2 million in 2008. The increase in the future income tax recovery
was a result of lower net income in our operating entities during 2009 compared to 2008 and the enactment of provincial SIFT legislation.
Current Income Taxes
In our current structure, payments are made between the operating entities and the Fund, which ultimately transfers both income and future
income tax liability to our unitholders. As a result minimal cash income taxes are generally paid by our Canadian operating entities. Effective
12 ENERPLUS RESOURCES 2009 FINANCIAL SUMMARY
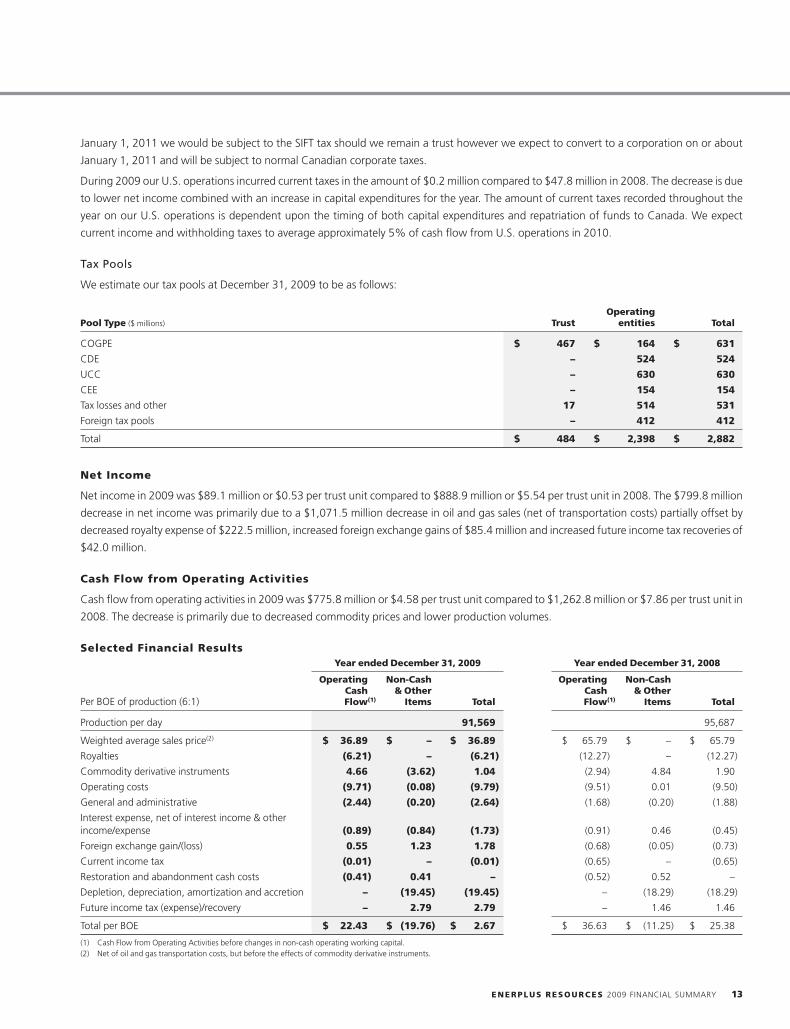
January 1, 2011 we would be subject to the SIFT tax should we remain a trust however we expect to convert to a corporation on or about
January 1, 2011 and will be subject to normal Canadian corporate taxes.
During 2009 our U.S. operations incurred current taxes in the amount of $0.2 million compared to $47.8 million in 2008. The decrease is due
to lower net income combined with an increase in capital expenditures for the year. The amount of current taxes recorded throughout the
year on our U.S. operations is dependent upon the timing of both capital expenditures and repatriation of funds to Canada. We expect
current income and withholding taxes to average approximately 5% of cash flow from U.S. operations in 2010.
Tax Pools
We estimate our tax pools at December 31, 2009 to be as follows:
OperatingPool Type ($ millions) Trust entities Total
COGPE $ 467 $ 164 $ 631
CDE – 524 524
UCC – 630 630
CEE – 154 154
Tax losses and other 17 514 531
Foreign tax pools – 412 412
Total $ 484 $ 2,398 $ 2,882
Net Income
Net income in 2009 was $89.1 million or $0.53 per trust unit compared to $888.9 million or $5.54 per trust unit in 2008. The $799.8 million
decrease in net income was primarily due to a $1,071.5 million decrease in oil and gas sales (net of transportation costs) partially offset by
decreased royalty expense of $222.5 million, increased foreign exchange gains of $85.4 million and increased future income tax recoveries of
$42.0 million.
Cash Flow from Operating Activities
Cash flow from operating activities in 2009 was $775.8 million or $4.58 per trust unit compared to $1,262.8 million or $7.86 per trust unit in
2008. The decrease is primarily due to decreased commodity prices and lower production volumes.
Selected Financial ResultsYear ended December 31, 2009 Year ended December 31, 2008
Operating Non-Cash Operating Non-CashCash & Other Cash & Other
Per BOE of production (6:1) Flow(1) Items Total Flow(1) Items Total
Production per day 91,569 95,687
Weighted average sales price(2) $ 36.89 $ – $ 36.89 $ 65.79 $ – $ 65.79
Royalties (6.21) – (6.21) (12.27) – (12.27)
Commodity derivative instruments 4.66 (3.62) 1.04 (2.94) 4.84 1.90
Operating costs (9.71) (0.08) (9.79) (9.51) 0.01 (9.50)
General and administrative (2.44) (0.20) (2.64) (1.68) (0.20) (1.88)
Interest expense, net of interest income & otherincome/expense (0.89) (0.84) (1.73) (0.91) 0.46 (0.45)
Foreign exchange gain/(loss) 0.55 1.23 1.78 (0.68) (0.05) (0.73)
Current income tax (0.01) – (0.01) (0.65) – (0.65)
Restoration and abandonment cash costs (0.41) 0.41 – (0.52) 0.52 –
Depletion, depreciation, amortization and accretion – (19.45) (19.45) – (18.29) (18.29)
Future income tax (expense)/recovery – 2.79 2.79 – 1.46 1.46
Total per BOE $ 22.43 $ (19.76) $ 2.67 $ 36.63 $ (11.25) $ 25.38
(1) Cash Flow from Operating Activities before changes in non-cash operating working capital.(2) Net of oil and gas transportation costs, but before the effects of commodity derivative instruments.
ENERPLUS RESOURCES 2009 FINANCIAL SUMMARY 13
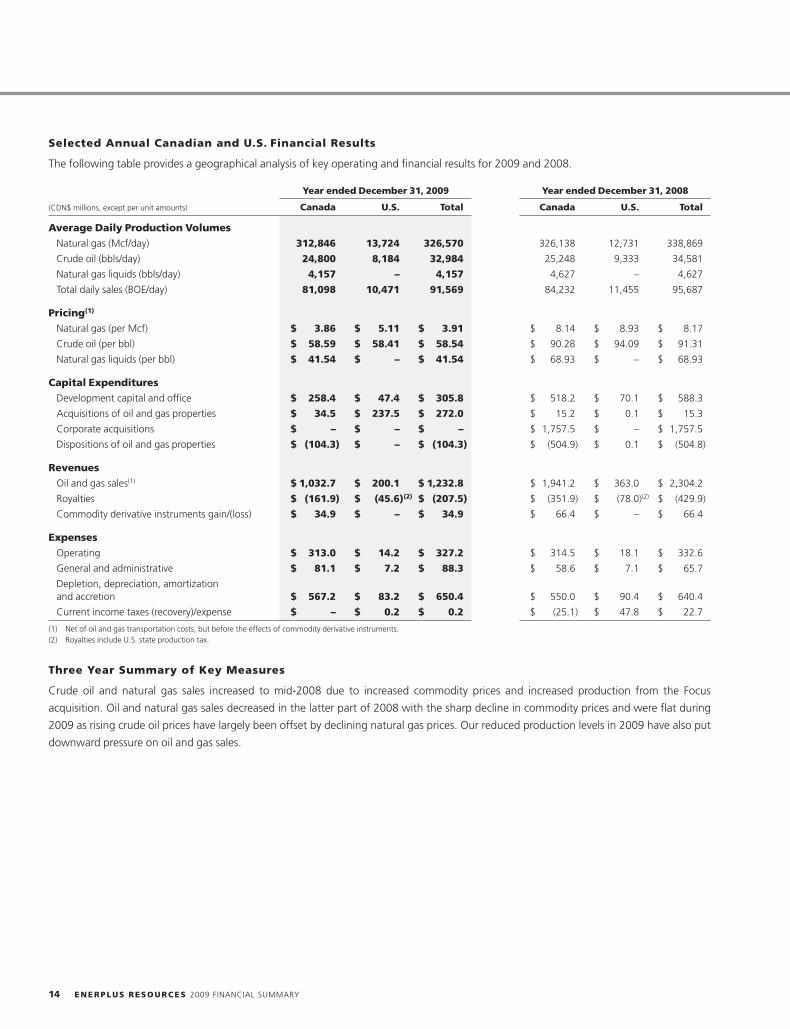
Selected Annual Canadian and U.S. Financial Results
The following table provides a geographical analysis of key operating and financial results for 2009 and 2008.
Year ended December 31, 2009 Year ended December 31, 2008
(CDN$ millions, except per unit amounts) Canada U.S. Total Canada U.S. Total
Average Daily Production Volumes
Natural gas (Mcf/day) 312,846 13,724 326,570 326,138 12,731 338,869
Crude oil (bbls/day) 24,800 8,184 32,984 25,248 9,333 34,581
Natural gas liquids (bbls/day) 4,157 – 4,157 4,627 – 4,627
Total daily sales (BOE/day) 81,098 10,471 91,569 84,232 11,455 95,687
Pricing(1)
Natural gas (per Mcf) $ 3.86 $ 5.11 $ 3.91 $ 8.14 $ 8.93 $ 8.17
Crude oil (per bbl) $ 58.59 $ 58.41 $ 58.54 $ 90.28 $ 94.09 $ 91.31
Natural gas liquids (per bbl) $ 41.54 $ – $ 41.54 $ 68.93 $ – $ 68.93
Capital Expenditures
Development capital and office $ 258.4 $ 47.4 $ 305.8 $ 518.2 $ 70.1 $ 588.3
Acquisitions of oil and gas properties $ 34.5 $ 237.5 $ 272.0 $ 15.2 $ 0.1 $ 15.3
Corporate acquisitions $ – $ – $ – $ 1,757.5 $ – $ 1,757.5
Dispositions of oil and gas properties $ (104.3) $ – $ (104.3) $ (504.9) $ 0.1 $ (504.8)
Revenues
Oil and gas sales(1) $ 1,032.7 $ 200.1 $ 1,232.8 $ 1,941.2 $ 363.0 $ 2,304.2
Royalties $ (161.9) $ (45.6)(2) $ (207.5) $ (351.9) $ (78.0)(2) $ (429.9)
Commodity derivative instruments gain/(loss) $ 34.9 $ – $ 34.9 $ 66.4 $ – $ 66.4
Expenses
Operating $ 313.0 $ 14.2 $ 327.2 $ 314.5 $ 18.1 $ 332.6
General and administrative $ 81.1 $ 7.2 $ 88.3 $ 58.6 $ 7.1 $ 65.7
Depletion, depreciation, amortizationand accretion $ 567.2 $ 83.2 $ 650.4 $ 550.0 $ 90.4 $ 640.4
Current income taxes (recovery)/expense $ – $ 0.2 $ 0.2 $ (25.1) $ 47.8 $ 22.7
(1) Net of oil and gas transportation costs, but before the effects of commodity derivative instruments.(2) Royalties include U.S. state production tax.
Three Year Summary of Key Measures
Crude oil and natural gas sales increased to mid-2008 due to increased commodity prices and increased production from the Focus
acquisition. Oil and natural gas sales decreased in the latter part of 2008 with the sharp decline in commodity prices and were flat during
2009 as rising crude oil prices have largely been offset by declining natural gas prices. Our reduced production levels in 2009 have also put
downward pressure on oil and gas sales.
14 ENERPLUS RESOURCES 2009 FINANCIAL SUMMARY
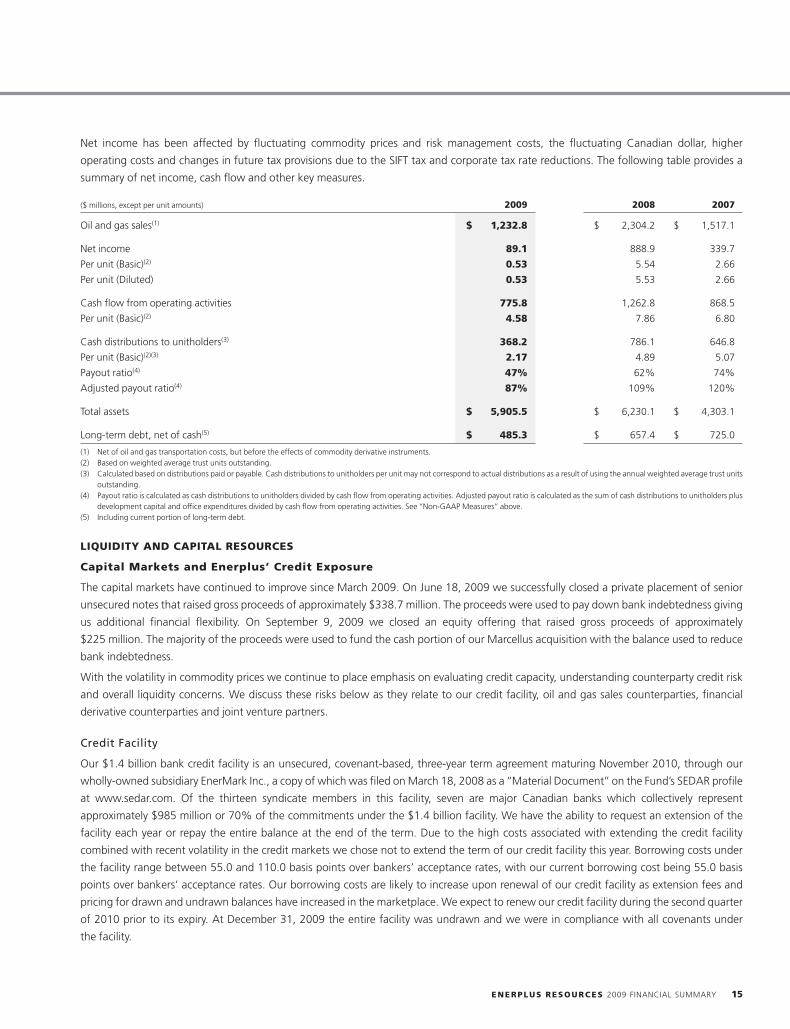
Net income has been affected by fluctuating commodity prices and risk management costs, the fluctuating Canadian dollar, higher
operating costs and changes in future tax provisions due to the SIFT tax and corporate tax rate reductions. The following table provides a
summary of net income, cash flow and other key measures.
($ millions, except per unit amounts) 2009 2008 2007
Oil and gas sales(1) $ 1,232.8 $ 2,304.2 $ 1,517.1
Net income 89.1 888.9 339.7
Per unit (Basic)(2) 0.53 5.54 2.66
Per unit (Diluted) 0.53 5.53 2.66
Cash flow from operating activities 775.8 1,262.8 868.5
Per unit (Basic)(2) 4.58 7.86 6.80
Cash distributions to unitholders(3) 368.2 786.1 646.8
Per unit (Basic)(2)(3) 2.17 4.89 5.07
Payout ratio(4) 47% 62% 74%
Adjusted payout ratio(4) 87% 109% 120%
Total assets $ 5,905.5 $ 6,230.1 $ 4,303.1
Long-term debt, net of cash(5) $ 485.3 $ 657.4 $ 725.0
(1) Net of oil and gas transportation costs, but before the effects of commodity derivative instruments.(2) Based on weighted average trust units outstanding.(3) Calculated based on distributions paid or payable. Cash distributions to unitholders per unit may not correspond to actual distributions as a result of using the annual weighted average trust units
outstanding.(4) Payout ratio is calculated as cash distributions to unitholders divided by cash flow from operating activities. Adjusted payout ratio is calculated as the sum of cash distributions to unitholders plus
development capital and office expenditures divided by cash flow from operating activities. See ‘‘Non-GAAP Measures’’ above.(5) Including current portion of long-term debt.
LIQUIDITY AND CAPITAL RESOURCES
Capital Markets and Enerplus’ Credit Exposure
The capital markets have continued to improve since March 2009. On June 18, 2009 we successfully closed a private placement of senior
unsecured notes that raised gross proceeds of approximately $338.7 million. The proceeds were used to pay down bank indebtedness giving
us additional financial flexibility. On September 9, 2009 we closed an equity offering that raised gross proceeds of approximately
$225 million. The majority of the proceeds were used to fund the cash portion of our Marcellus acquisition with the balance used to reduce
bank indebtedness.
With the volatility in commodity prices we continue to place emphasis on evaluating credit capacity, understanding counterparty credit risk
and overall liquidity concerns. We discuss these risks below as they relate to our credit facility, oil and gas sales counterparties, financial
derivative counterparties and joint venture partners.
Credit Facility
Our $1.4 billion bank credit facility is an unsecured, covenant-based, three-year term agreement maturing November 2010, through our
wholly-owned subsidiary EnerMark Inc., a copy of which was filed on March 18, 2008 as a ‘‘Material Document’’ on the Fund’s SEDAR profile
at www.sedar.com. Of the thirteen syndicate members in this facility, seven are major Canadian banks which collectively represent
approximately $985 million or 70% of the commitments under the $1.4 billion facility. We have the ability to request an extension of the
facility each year or repay the entire balance at the end of the term. Due to the high costs associated with extending the credit facility
combined with recent volatility in the credit markets we chose not to extend the term of our credit facility this year. Borrowing costs under
the facility range between 55.0 and 110.0 basis points over bankers’ acceptance rates, with our current borrowing cost being 55.0 basis
points over bankers’ acceptance rates. Our borrowing costs are likely to increase upon renewal of our credit facility as extension fees and
pricing for drawn and undrawn balances have increased in the marketplace. We expect to renew our credit facility during the second quarter
of 2010 prior to its expiry. At December 31, 2009 the entire facility was undrawn and we were in compliance with all covenants under
the facility.
ENERPLUS RESOURCES 2009 FINANCIAL SUMMARY 15
Oil and Gas Sales Counterparties
Our oil and gas receivables are with customers in the petroleum and natural gas business and are subject to normal credit risks.
Concentration of credit risk is mitigated by marketing production to numerous purchasers under normal industry sale and payment terms. A
credit review process is in place to assess and monitor our counterparties’ credit worthiness on a regular basis. This process involves reviewing
and ratifying our corporate credit guidelines, assessing the credit ratings of our counterparties and setting exposure limits. When warranted
we obtain financial assurances such as letters of credit, parental guarantees or third party insurance to mitigate our credit risk. This process is
utilized for both our oil and gas sales counterparties as well as our financial derivative counterparties.
Financial Derivative Counterparties
We are exposed to credit risk in the event of non-performance by our financial counterparties regarding our derivative contracts. We mitigate
this risk by entering into transactions with major financial institutions, the majority of which are members of our bank syndicate. We have
International Swaps and Derivatives Association (‘‘ISDA’’) agreements in place with the majority of our financial counterparties. These
agreements provide some credit protection by generally allowing parties to aggregate amounts owing to each other under all outstanding
transactions and settle with a single net amount in the case of a credit event. In the absence of an ISDA we rely on long form confirmations
which provide us with similar credit protection. At December 31, 2009 we had $22.3 million in mark-to-market assets offset by $92.2 million
of mark-to-market liabilities resulting in a net liability position of $69.9 million.
We will continue to monitor developments in the financial markets that could impact the creditworthiness of our financial counterparties. To
date we have not experienced any losses due to non-performance by our derivative counterparties.
Joint Venture Partners
We attempt to mitigate the credit risk associated with our joint interest receivables by reviewing and actively following up on older accounts.
In addition, we are specifically monitoring our receivables against a watch list of publicly traded companies that have high debt-to-cash flow
ratios or highly drawn bank facilities. We do not anticipate any significant issues in the collection of our joint interest receivables at this time.
Distribution Policy
The amount of cash distributions paid to unitholders is proposed by management and approved by the Board of Directors. We continually
assess distribution levels with respect to anticipated cash flows, debt levels, capital spending plans and capital market conditions. The level of
cash withheld varies and is dependent upon numerous factors, the most significant of which are the prevailing commodity price
environment, our current levels of production, debt obligations, funding requirements for our development capital program and our access
to equity markets.
We have maintained our monthly distribution rate of $0.18 per unit distribution since February 2009 and have been able to manage our
distribution levels and capital spending in order to minimize increases in our debt levels and preserve our balance sheet strength.
Sustainability of our Distributions and Asset Base
As an oil and gas producer we have a declining asset base and therefore rely on ongoing development activities and acquisitions to replace
production and add additional reserves. Our future crude oil and natural gas production is highly dependent on our success in exploiting our
asset base and acquiring or developing additional reserves. To the extent we are unsuccessful in these activities, our cash distributions could
be reduced.
Development activities and acquisitions may be funded internally by withholding a portion of cash flow or through external sources of capital
such as debt or the issuance of equity. To the extent that we withhold cash flow to finance these activities, the amount of cash distributions
to our unitholders may be reduced. Should external sources of capital become limited or unavailable, our ability to make the necessary
development expenditures and acquisitions to maintain or expand our asset base may be impaired and ultimately reduce the amount of
cash distributions.
Our 2010 development capital spending is expected to be $425 million (net of DRC credits) which represents a 42% increase from 2009
spending of $299.1 million. We expect to exit 2010 with production of approximately 88,000 BOE/day.
16 ENERPLUS RESOURCES 2009 FINANCIAL SUMMARY
Should we choose to issue equity in conjunction with an acquisition we do not anticipate any constraints for our growth strategy stemming
from the Canadian Government’s ‘‘normal growth’’ guidelines for SIFT’s as we currently have approximately $9 billion of safe harbour
growth capacity.
Cash Flow from Operating Activities, Cash Distributions and Payout Ratio
Cash flow from operating activities and cash distributions are reported on the Consolidated Statements of Cash Flows. During 2009 cash
distributions of $368.2 million were funded entirely through cash flow of $775.8 million.
Our payout ratio, which is calculated as cash distributions divided by cash flow, was 47% for 2009 compared to 62% in 2008. Our adjusted
payout ratio, which is calculated as the sum of cash distributions plus development capital and office expenditures divided by cash flow, was
87% for 2009 compared to 109% in 2008. The decrease in our payout ratio and adjusted payout ratio is due to the reduction in our monthly
cash distributions and capital spending along with changes in our working capital balances that impact cash flow. See ‘‘Non-GAAP
Measures’’ above.
For the year ended December 31, 2009 our cash distributions exceeded our net income by $279.1 million whereas in 2008 our net income
exceeded our cash distributions by $102.8 million. Non-cash items such as changes in the fair value of our derivative instruments and future
income taxes cause net income to fluctuate between periods but do not reduce or increase our cash flow. Future income taxes can fluctuate
from period to period as a result of changes in tax rates as well as changes in interest, royalties and dividends from our operating subsidiaries
paid to the Fund. In addition, we believe that other non-cash charges such as DDA&A are not a good proxy for the cost of maintaining our
productive capacity as they are based on the historical cost of our PP&E and not the fair market value of replacing those assets within the
context of the current environment.
It is not practical to distinguish between capital spent on maintaining productive capacity and capital spent on growth opportunities in the oil
and gas sector due to the nature of reserve reporting, natural reservoir declines and the risks involved with capital investment. As a result, we
do not distinguish maintenance capital separately from development capital spending. The level of investment in a given period may not be
sufficient to replace productive capacity given the natural declines associated with oil and natural gas assets. In these instances a portion of
the cash distributions paid to unitholders may represent a return of the unitholders’ capital.
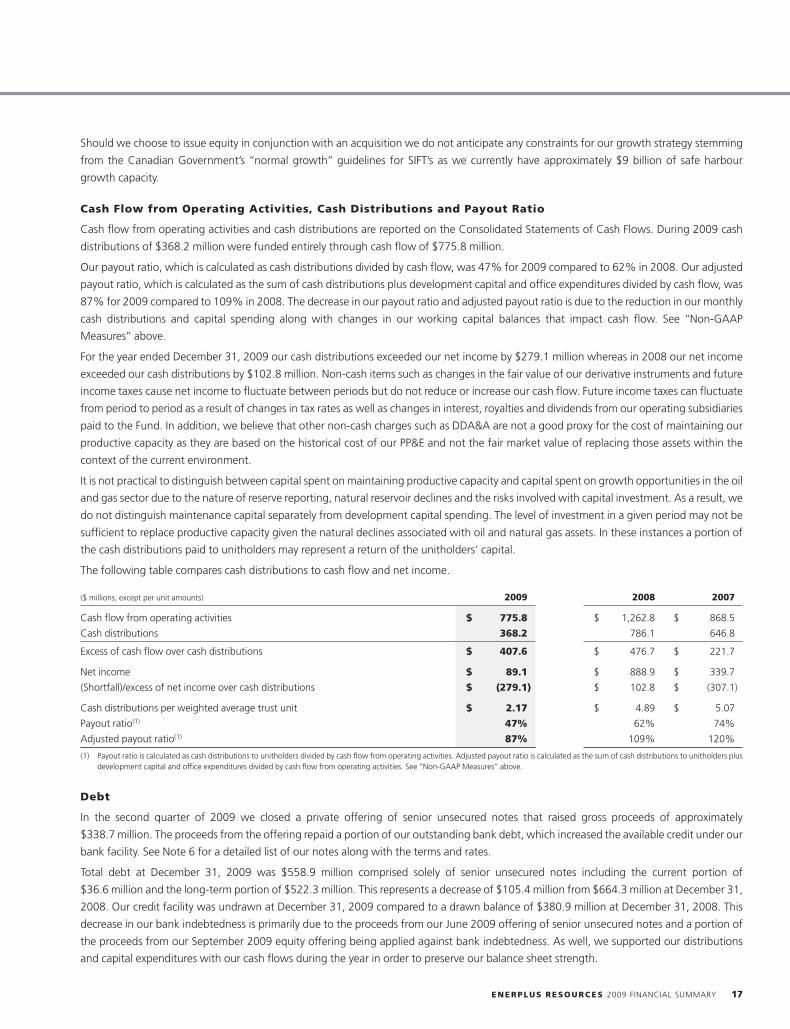
The following table compares cash distributions to cash flow and net income.
($ millions, except per unit amounts) 2009 2008 2007
Cash flow from operating activities $ 775.8 $ 1,262.8 $ 868.5
Cash distributions 368.2 786.1 646.8
Excess of cash flow over cash distributions $ 407.6 $ 476.7 $ 221.7
Net income $ 89.1 $ 888.9 $ 339.7
(Shortfall)/excess of net income over cash distributions $ (279.1) $ 102.8 $ (307.1)
Cash distributions per weighted average trust unit $ 2.17 $ 4.89 $ 5.07
Payout ratio(1) 47% 62% 74%
Adjusted payout ratio(1) 87% 109% 120%
(1) Payout ratio is calculated as cash distributions to unitholders divided by cash flow from operating activities. Adjusted payout ratio is calculated as the sum of cash distributions to unitholders plusdevelopment capital and office expenditures divided by cash flow from operating activities. See ‘‘Non-GAAP Measures’’ above.
Debt
In the second quarter of 2009 we closed a private offering of senior unsecured notes that raised gross proceeds of approximately
$338.7 million. The proceeds from the offering repaid a portion of our outstanding bank debt, which increased the available credit under our
bank facility. See Note 6 for a detailed list of our notes along with the terms and rates.
Total debt at December 31, 2009 was $558.9 million comprised solely of senior unsecured notes including the current portion of
$36.6 million and the long-term portion of $522.3 million. This represents a decrease of $105.4 million from $664.3 million at December 31,
2008. Our credit facility was undrawn at December 31, 2009 compared to a drawn balance of $380.9 million at December 31, 2008. This
decrease in our bank indebtedness is primarily due to the proceeds from our June 2009 offering of senior unsecured notes and a portion of
the proceeds from our September 2009 equity offering being applied against bank indebtedness. As well, we supported our distributions
and capital expenditures with our cash flows during the year in order to preserve our balance sheet strength.
ENERPLUS RESOURCES 2009 FINANCIAL SUMMARY 17
We expect that our debt levels may increase marginally through 2010 based on our current development plans, distribution levels and
forward commodity prices and disregarding potential acquisitions or divestments. Given our focus on early stage resource plays such as the
Marcellus, Deep Basin, and Bakken, we will consider investment and distribution levels that modestly exceed cash flow provided we retain
balance sheet strength and achieve compelling economics on our development capital program.
Our working capital at December 31, 2009, excluding cash, current deferred financial assets and credits, future income taxes and current
portion of long-term debt, increased by $4.9 million compared to December 31, 2008. This change was due to decreased accounts payable
that resulted from lower capital spending activity along with decreased distributions payable as a result of the reduction in our monthly
distributions partially offset by decreased accounts receivable.
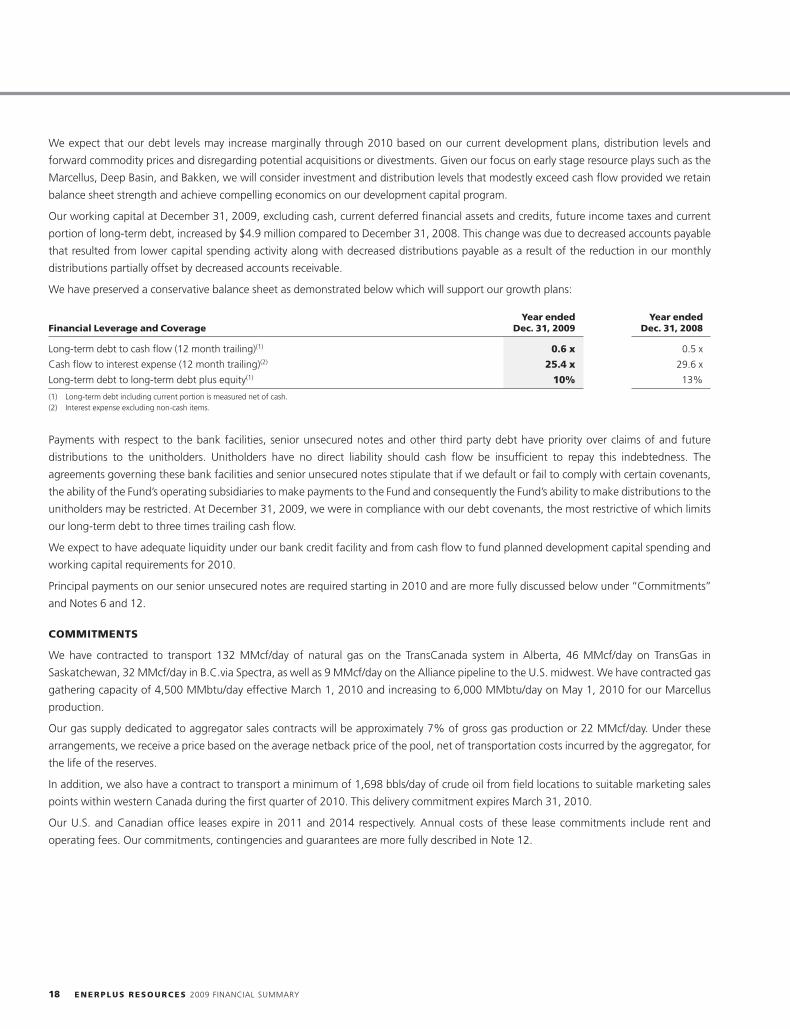
We have preserved a conservative balance sheet as demonstrated below which will support our growth plans:
Year ended Year endedFinancial Leverage and Coverage Dec. 31, 2009 Dec. 31, 2008
Long-term debt to cash flow (12 month trailing)(1) 0.6 x 0.5 x
Cash flow to interest expense (12 month trailing)(2) 25.4 x 29.6 x
Long-term debt to long-term debt plus equity(1) 10% 13%
(1) Long-term debt including current portion is measured net of cash.(2) Interest expense excluding non-cash items.
Payments with respect to the bank facilities, senior unsecured notes and other third party debt have priority over claims of and future
distributions to the unitholders. Unitholders have no direct liability should cash flow be insufficient to repay this indebtedness. The
agreements governing these bank facilities and senior unsecured notes stipulate that if we default or fail to comply with certain covenants,
the ability of the Fund’s operating subsidiaries to make payments to the Fund and consequently the Fund’s ability to make distributions to the
unitholders may be restricted. At December 31, 2009, we were in compliance with our debt covenants, the most restrictive of which limits
our long-term debt to three times trailing cash flow.
We expect to have adequate liquidity under our bank credit facility and from cash flow to fund planned development capital spending and
working capital requirements for 2010.
Principal payments on our senior unsecured notes are required starting in 2010 and are more fully discussed below under ‘‘Commitments’’
and Notes 6 and 12.
COMMITMENTS
We have contracted to transport 132 MMcf/day of natural gas on the TransCanada system in Alberta, 46 MMcf/day on TransGas in
Saskatchewan, 32 MMcf/day in B.C.via Spectra, as well as 9 MMcf/day on the Alliance pipeline to the U.S. midwest. We have contracted gas
gathering capacity of 4,500 MMbtu/day effective March 1, 2010 and increasing to 6,000 MMbtu/day on May 1, 2010 for our Marcellus
production.
Our gas supply dedicated to aggregator sales contracts will be approximately 7% of gross gas production or 22 MMcf/day. Under these
arrangements, we receive a price based on the average netback price of the pool, net of transportation costs incurred by the aggregator, for
the life of the reserves.
In addition, we also have a contract to transport a minimum of 1,698 bbls/day of crude oil from field locations to suitable marketing sales
points within western Canada during the first quarter of 2010. This delivery commitment expires March 31, 2010.
Our U.S. and Canadian office leases expire in 2011 and 2014 respectively. Annual costs of these lease commitments include rent and
operating fees. Our commitments, contingencies and guarantees are more fully described in Note 12.
18 ENERPLUS RESOURCES 2009 FINANCIAL SUMMARY
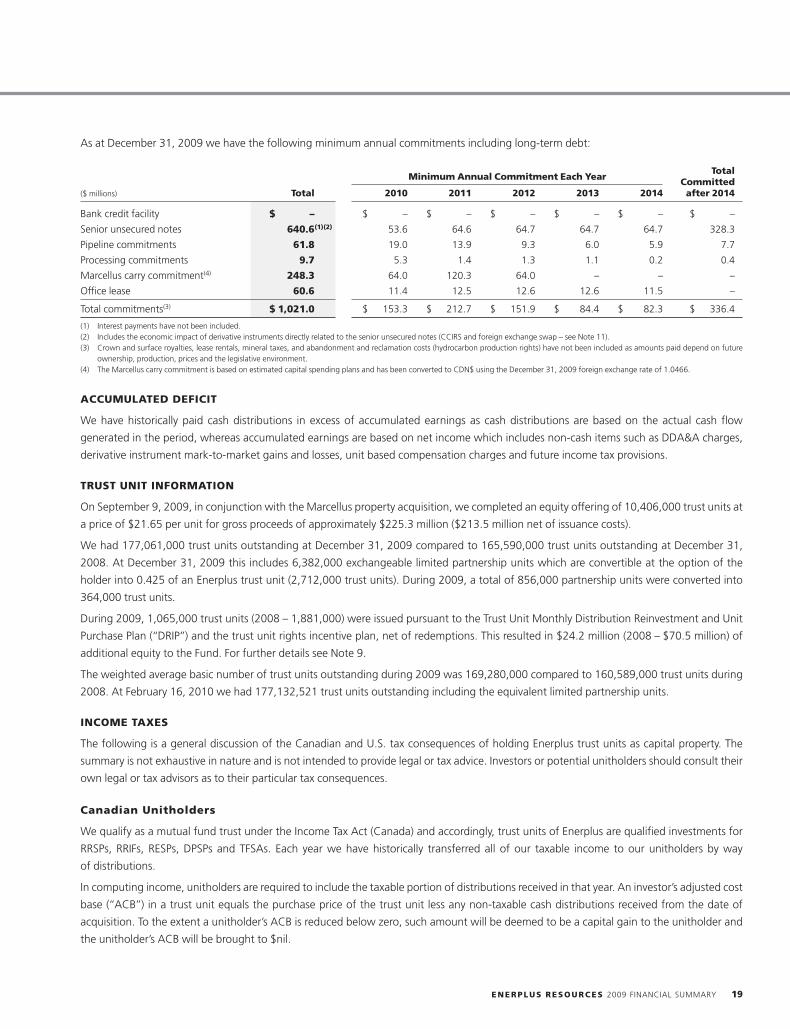
As at December 31, 2009 we have the following minimum annual commitments including long-term debt:
TotalMinimum Annual Commitment Each Year Committed
($ millions) Total 2010 2011 2012 2013 2014 after 2014
Bank credit facility $ – $ – $ – $ – $ – $ – $ –
Senior unsecured notes 640.6(1)(2) 53.6 64.6 64.7 64.7 64.7 328.3
Pipeline commitments 61.8 19.0 13.9 9.3 6.0 5.9 7.7
Processing commitments 9.7 5.3 1.4 1.3 1.1 0.2 0.4
Marcellus carry commitment(4) 248.3 64.0 120.3 64.0 – – –
Office lease 60.6 11.4 12.5 12.6 12.6 11.5 –
Total commitments(3) $ 1,021.0 $ 153.3 $ 212.7 $ 151.9 $ 84.4 $ 82.3 $ 336.4
(1) Interest payments have not been included.(2) Includes the economic impact of derivative instruments directly related to the senior unsecured notes (CCIRS and foreign exchange swap – see Note 11).(3) Crown and surface royalties, lease rentals, mineral taxes, and abandonment and reclamation costs (hydrocarbon production rights) have not been included as amounts paid depend on future
ownership, production, prices and the legislative environment.(4) The Marcellus carry commitment is based on estimated capital spending plans and has been converted to CDN$ using the December 31, 2009 foreign exchange rate of 1.0466.
ACCUMULATED DEFICIT
We have historically paid cash distributions in excess of accumulated earnings as cash distributions are based on the actual cash flow
generated in the period, whereas accumulated earnings are based on net income which includes non-cash items such as DDA&A charges,
derivative instrument mark-to-market gains and losses, unit based compensation charges and future income tax provisions.
TRUST UNIT INFORMATION
On September 9, 2009, in conjunction with the Marcellus property acquisition, we completed an equity offering of 10,406,000 trust units at
a price of $21.65 per unit for gross proceeds of approximately $225.3 million ($213.5 million net of issuance costs).
We had 177,061,000 trust units outstanding at December 31, 2009 compared to 165,590,000 trust units outstanding at December 31,
2008. At December 31, 2009 this includes 6,382,000 exchangeable limited partnership units which are convertible at the option of the
holder into 0.425 of an Enerplus trust unit (2,712,000 trust units). During 2009, a total of 856,000 partnership units were converted into
364,000 trust units.
During 2009, 1,065,000 trust units (2008 – 1,881,000) were issued pursuant to the Trust Unit Monthly Distribution Reinvestment and Unit
Purchase Plan (‘‘DRIP’’) and the trust unit rights incentive plan, net of redemptions. This resulted in $24.2 million (2008 – $70.5 million) of
additional equity to the Fund. For further details see Note 9.
The weighted average basic number of trust units outstanding during 2009 was 169,280,000 compared to 160,589,000 trust units during
2008. At February 16, 2010 we had 177,132,521 trust units outstanding including the equivalent limited partnership units.
INCOME TAXES
The following is a general discussion of the Canadian and U.S. tax consequences of holding Enerplus trust units as capital property. The
summary is not exhaustive in nature and is not intended to provide legal or tax advice. Investors or potential unitholders should consult their
own legal or tax advisors as to their particular tax consequences.
Canadian Unitholders
We qualify as a mutual fund trust under the Income Tax Act (Canada) and accordingly, trust units of Enerplus are qualified investments for
RRSPs, RRIFs, RESPs, DPSPs and TFSAs. Each year we have historically transferred all of our taxable income to our unitholders by way
of distributions.
In computing income, unitholders are required to include the taxable portion of distributions received in that year. An investor’s adjusted cost
base (‘‘ACB’’) in a trust unit equals the purchase price of the trust unit less any non-taxable cash distributions received from the date of
acquisition. To the extent a unitholder’s ACB is reduced below zero, such amount will be deemed to be a capital gain to the unitholder and
the unitholder’s ACB will be brought to $nil.
ENERPLUS RESOURCES 2009 FINANCIAL SUMMARY 19
We paid $2.16 per trust unit in cash distributions to unitholders on record during 2009. For Canadian tax purposes, approximately 2% of
these distributions, or $0.04 per trust unit was a tax deferred return of capital, approximately 98% or $2.12 per trust unit was taxable to
unitholders as other income.
For 2010, we estimate that 95% of cash distributions will be taxable and 5% will be a tax deferred return of capital. Actual taxable amounts
may vary depending on actual distributions which are dependent upon, among other things, production, commodity prices and cash flow
experienced throughout the year.
U.S. Unitholders
U.S. unitholders who received cash distributions are subject to at least a 15% Canadian withholding tax. The withholding tax is applied to
both the taxable portion of the distribution as computed under Canadian tax law and the non-taxable portion of the distribution.
U.S. taxpayers may be eligible for a foreign tax credit with respect to Canadian withholding taxes paid.
For U.S. taxpayers the taxable portion of cash distributions are considered to be a dividend for U.S. tax purposes. For most U.S. taxpayers this
should be a ‘‘Qualified Dividend’’ eligible for the reduced tax rate. The 15% preferred rate of tax on ‘‘Qualified Dividends’’ is currently
scheduled to expire at the end of 2010. We are unable to determine whether or to what extent the preferred rate of tax on ‘‘Qualified
Dividends’’ may be extended.
We paid US$1.95 per trust unit to U.S. residents during the 2009 calendar year of which approximately 14% or US$0.27 per trust unit was a
tax deferred return of capital and approximately 86% or US$1.68 per unit was a qualified dividend.
For 2010, we estimate that 90% of cash distributions will be taxable to most U.S. investors and 10% will be a tax deferred return of capital.
Actual taxable amounts may vary depending on actual distributions which are dependent upon production, commodity prices and cash flow
experienced throughout the year.
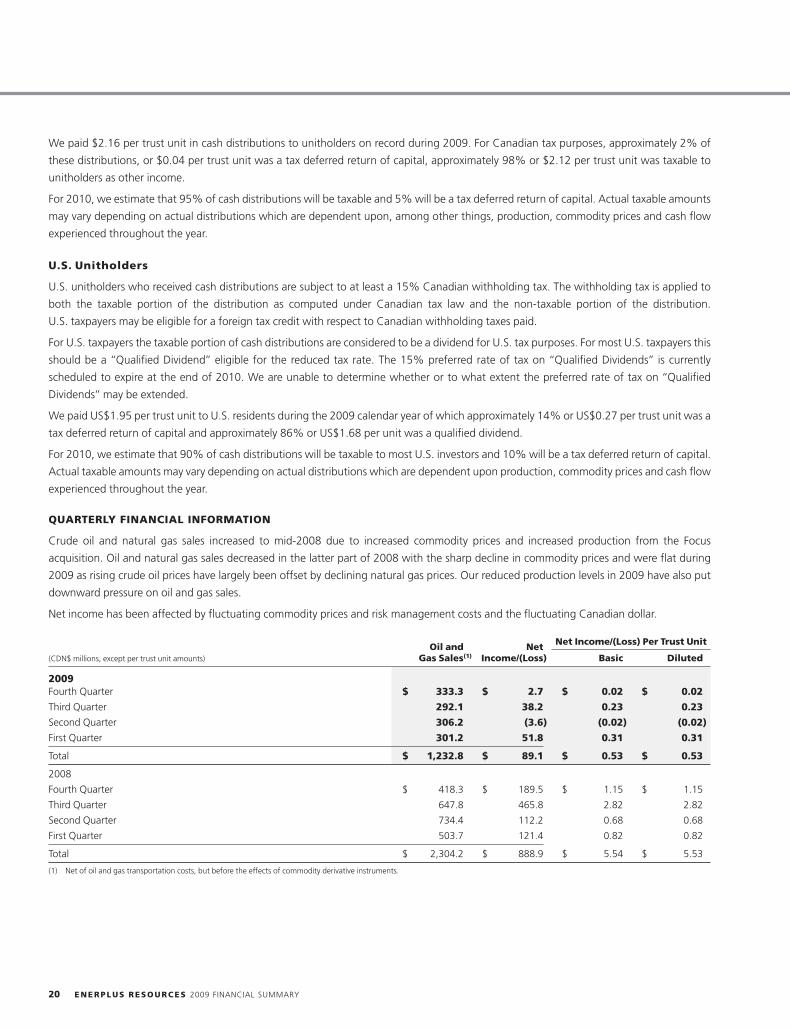
QUARTERLY FINANCIAL INFORMATION
Crude oil and natural gas sales increased to mid-2008 due to increased commodity prices and increased production from the Focus
acquisition. Oil and natural gas sales decreased in the latter part of 2008 with the sharp decline in commodity prices and were flat during
2009 as rising crude oil prices have largely been offset by declining natural gas prices. Our reduced production levels in 2009 have also put
downward pressure on oil and gas sales.
Net income has been affected by fluctuating commodity prices and risk management costs and the fluctuating Canadian dollar.
Net Income/(Loss) Per Trust UnitOil and Net(CDN$ millions, except per trust unit amounts) Gas Sales(1) Income/(Loss) Basic Diluted
2009Fourth Quarter $ 333.3 $ 2.7 $ 0.02 $ 0.02
Third Quarter 292.1 38.2 0.23 0.23
Second Quarter 306.2 (3.6) (0.02) (0.02)
First Quarter 301.2 51.8 0.31 0.31
Total $ 1,232.8 $ 89.1 $ 0.53 $ 0.53
2008
Fourth Quarter $ 418.3 $ 189.5 $ 1.15 $ 1.15
Third Quarter 647.8 465.8 2.82 2.82
Second Quarter 734.4 112.2 0.68 0.68
First Quarter 503.7 121.4 0.82 0.82
Total $ 2,304.2 $ 888.9 $ 5.54 $ 5.53
(1) Net of oil and gas transportation costs, but before the effects of commodity derivative instruments.
20 ENERPLUS RESOURCES 2009 FINANCIAL SUMMARY
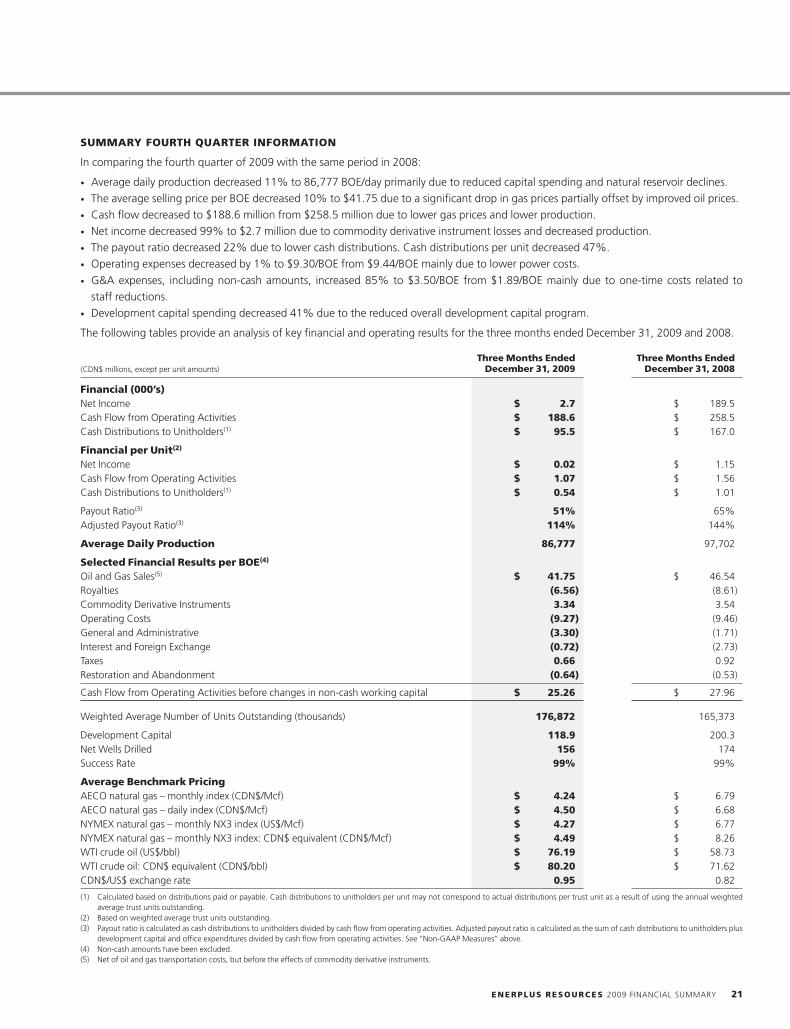
SUMMARY FOURTH QUARTER INFORMATION
In comparing the fourth quarter of 2009 with the same period in 2008:
• Average daily production decreased 11% to 86,777 BOE/day primarily due to reduced capital spending and natural reservoir declines.• The average selling price per BOE decreased 10% to $41.75 due to a significant drop in gas prices partially offset by improved oil prices.• Cash flow decreased to $188.6 million from $258.5 million due to lower gas prices and lower production.• Net income decreased 99% to $2.7 million due to commodity derivative instrument losses and decreased production.• The payout ratio decreased 22% due to lower cash distributions. Cash distributions per unit decreased 47%.• Operating expenses decreased by 1% to $9.30/BOE from $9.44/BOE mainly due to lower power costs.
• G&A expenses, including non-cash amounts, increased 85% to $3.50/BOE from $1.89/BOE mainly due to one-time costs related tostaff reductions.
• Development capital spending decreased 41% due to the reduced overall development capital program.
The following tables provide an analysis of key financial and operating results for the three months ended December 31, 2009 and 2008.
Three Months Ended Three Months Ended(CDN$ millions, except per unit amounts) December 31, 2009 December 31, 2008
Financial (000’s)Net Income $ 2.7 $ 189.5Cash Flow from Operating Activities $ 188.6 $ 258.5Cash Distributions to Unitholders(1) $ 95.5 $ 167.0
Financial per Unit(2)
Net Income $ 0.02 $ 1.15Cash Flow from Operating Activities $ 1.07 $ 1.56Cash Distributions to Unitholders(1) $ 0.54 $ 1.01
Payout Ratio(3) 51% 65%Adjusted Payout Ratio(3) 114% 144%
Average Daily Production 86,777 97,702
Selected Financial Results per BOE(4)
Oil and Gas Sales(5) $ 41.75 $ 46.54Royalties (6.56) (8.61)Commodity Derivative Instruments 3.34 3.54Operating Costs (9.27) (9.46)General and Administrative (3.30) (1.71)Interest and Foreign Exchange (0.72) (2.73)Taxes 0.66 0.92Restoration and Abandonment (0.64) (0.53)
Cash Flow from Operating Activities before changes in non-cash working capital $ 25.26 $ 27.96
Weighted Average Number of Units Outstanding (thousands) 176,872 165,373
Development Capital 118.9 200.3Net Wells Drilled 156 174Success Rate 99% 99%
Average Benchmark PricingAECO natural gas – monthly index (CDN$/Mcf) $ 4.24 $ 6.79AECO natural gas – daily index (CDN$/Mcf) $ 4.50 $ 6.68NYMEX natural gas – monthly NX3 index (US$/Mcf) $ 4.27 $ 6.77NYMEX natural gas – monthly NX3 index: CDN$ equivalent (CDN$/Mcf) $ 4.49 $ 8.26WTI crude oil (US$/bbl) $ 76.19 $ 58.73WTI crude oil: CDN$ equivalent (CDN$/bbl) $ 80.20 $ 71.62CDN$/US$ exchange rate 0.95 0.82
(1) Calculated based on distributions paid or payable. Cash distributions to unitholders per unit may not correspond to actual distributions per trust unit as a result of using the annual weightedaverage trust units outstanding.
(2) Based on weighted average trust units outstanding.(3) Payout ratio is calculated as cash distributions to unitholders divided by cash flow from operating activities. Adjusted payout ratio is calculated as the sum of cash distributions to unitholders plus
development capital and office expenditures divided by cash flow from operating activities. See ‘‘Non-GAAP Measures’’ above.(4) Non-cash amounts have been excluded.(5) Net of oil and gas transportation costs, but before the effects of commodity derivative instruments.
ENERPLUS RESOURCES 2009 FINANCIAL SUMMARY 21
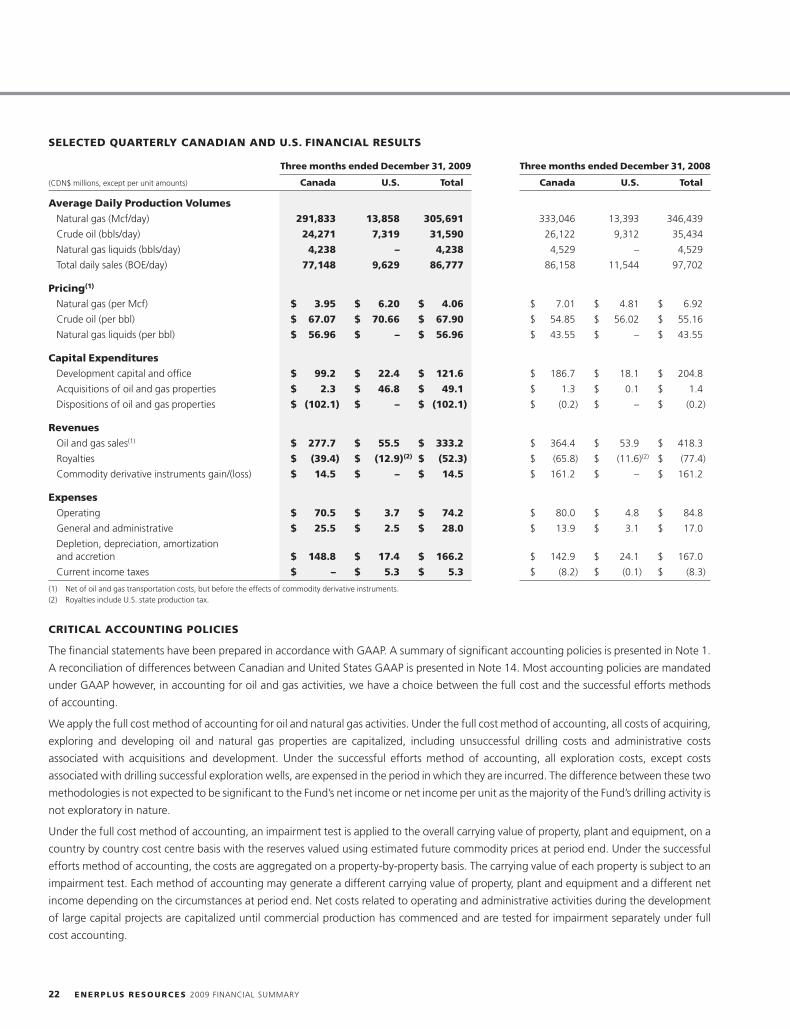
SELECTED QUARTERLY CANADIAN AND U.S. FINANCIAL RESULTS
Three months ended December 31, 2009 Three months ended December 31, 2008
(CDN$ millions, except per unit amounts) Canada U.S. Total Canada U.S. Total
Average Daily Production Volumes
Natural gas (Mcf/day) 291,833 13,858 305,691 333,046 13,393 346,439
Crude oil (bbls/day) 24,271 7,319 31,590 26,122 9,312 35,434
Natural gas liquids (bbls/day) 4,238 – 4,238 4,529 – 4,529
Total daily sales (BOE/day) 77,148 9,629 86,777 86,158 11,544 97,702
Pricing(1)
Natural gas (per Mcf) $ 3.95 $ 6.20 $ 4.06 $ 7.01 $ 4.81 $ 6.92
Crude oil (per bbl) $ 67.07 $ 70.66 $ 67.90 $ 54.85 $ 56.02 $ 55.16
Natural gas liquids (per bbl) $ 56.96 $ – $ 56.96 $ 43.55 $ – $ 43.55
Capital Expenditures
Development capital and office $ 99.2 $ 22.4 $ 121.6 $ 186.7 $ 18.1 $ 204.8
Acquisitions of oil and gas properties $ 2.3 $ 46.8 $ 49.1 $ 1.3 $ 0.1 $ 1.4
Dispositions of oil and gas properties $ (102.1) $ – $ (102.1) $ (0.2) $ – $ (0.2)
Revenues
Oil and gas sales(1) $ 277.7 $ 55.5 $ 333.2 $ 364.4 $ 53.9 $ 418.3
Royalties $ (39.4) $ (12.9)(2) $ (52.3) $ (65.8) $ (11.6)(2) $ (77.4)
Commodity derivative instruments gain/(loss) $ 14.5 $ – $ 14.5 $ 161.2 $ – $ 161.2
Expenses
Operating $ 70.5 $ 3.7 $ 74.2 $ 80.0 $ 4.8 $ 84.8
General and administrative $ 25.5 $ 2.5 $ 28.0 $ 13.9 $ 3.1 $ 17.0
Depletion, depreciation, amortizationand accretion $ 148.8 $ 17.4 $ 166.2 $ 142.9 $ 24.1 $ 167.0
Current income taxes $ – $ 5.3 $ 5.3 $ (8.2) $ (0.1) $ (8.3)
(1) Net of oil and gas transportation costs, but before the effects of commodity derivative instruments.(2) Royalties include U.S. state production tax.
CRITICAL ACCOUNTING POLICIES
The financial statements have been prepared in accordance with GAAP. A summary of significant accounting policies is presented in Note 1.
A reconciliation of differences between Canadian and United States GAAP is presented in Note 14. Most accounting policies are mandated
under GAAP however, in accounting for oil and gas activities, we have a choice between the full cost and the successful efforts methods
of accounting.
We apply the full cost method of accounting for oil and natural gas activities. Under the full cost method of accounting, all costs of acquiring,
exploring and developing oil and natural gas properties are capitalized, including unsuccessful drilling costs and administrative costs
associated with acquisitions and development. Under the successful efforts method of accounting, all exploration costs, except costs
associated with drilling successful exploration wells, are expensed in the period in which they are incurred. The difference between these two
methodologies is not expected to be significant to the Fund’s net income or net income per unit as the majority of the Fund’s drilling activity is
not exploratory in nature.
Under the full cost method of accounting, an impairment test is applied to the overall carrying value of property, plant and equipment, on a
country by country cost centre basis with the reserves valued using estimated future commodity prices at period end. Under the successful
efforts method of accounting, the costs are aggregated on a property-by-property basis. The carrying value of each property is subject to an
impairment test. Each method of accounting may generate a different carrying value of property, plant and equipment and a different net
income depending on the circumstances at period end. Net costs related to operating and administrative activities during the development
of large capital projects are capitalized until commercial production has commenced and are tested for impairment separately under full
cost accounting.
22 ENERPLUS RESOURCES 2009 FINANCIAL SUMMARY
CRITICAL ACCOUNTING ESTIMATES
The preparation of financial statements in accordance with GAAP requires management to make certain judgments and estimates. Due to
the timing of when activities occur compared to the reporting of those activities, management must estimate and accrue operating results
and capital spending. Changes in these judgments and estimates could have a material impact on our financial results and
financial condition.
Reserves
The process of estimating reserves is critical to several accounting estimates. It requires significant judgments based on available geological,
geophysical, engineering and economic data. These estimates may change substantially as data from ongoing development and production
activities becomes available, and as economic conditions impacting oil and gas prices, operating costs and royalty burdens change. Reserve
estimates impact net income through depletion, the determination of asset retirement obligations and the application of an impairment test.
Revisions or changes in the reserve estimates can have either a positive or a negative impact on net income and the asset
retirement obligation.
Asset Retirement Obligation
Management calculates the asset retirement obligation based on estimated costs to abandon and reclaim its net ownership interest in all
wells and facilities and the estimated timing of the costs to be incurred in future periods. The fair value estimate is capitalized to PP&E as part
of the cost of the related asset and amortized over its useful life.
Business Combinations
Management makes various assumptions in determining the fair values of any acquired company’s assets and liabilities in a business
combination. The most significant assumptions and judgments made relate to the estimation of the fair value of the oil and gas properties. To
determine the fair value of these properties, we estimate (a) oil and gas reserves in accordance with National Instrument 51-101 – Standards
of Disclosure for Oil and Gas Activities (‘‘NI 51-101’’) adopted by the Canadian Securities regulatory authorities reserve standards, and
(b) future prices of oil and gas.
Commodity Prices
Management’s estimates of future crude oil and natural gas prices are critical as these prices are used to determine the carrying amount of
PP&E, assess impairment in our cost centers, and determine the change in fair value of financial contracts. Management’s estimates of prices
are based on the price forecast from our reserve engineers and the current forward market.
Trust Unit Rights
Management calculates the fair value of rights granted under our trust unit rights incentive plan using a binomial lattice option-pricing
model. This process involves the use of significant estimates and assumptions which may change over time. The values calculated under the
option-pricing model may not reflect the actual value realized by trust unit rights holders.
Derivative Financial Instruments
We utilize derivative financial instruments to manage our exposure to market risks relating to commodity prices, foreign currency exchange
rates and interest rates. Fair values of derivative contracts fluctuate depending on the underlying estimate of future commodity prices,
foreign currency exchange rates, interest rates and counterparty credit risk.
RECENT CANADIAN ACCOUNTING AND RELATED PRONOUNCEMENTS
Current Year Accounting Changes
During 2009, the Fund adopted the following new accounting standards or amendments that were issued by the Canadian Institute of
Chartered Accountants (‘‘CICA’’): Handbook Section 3064, Goodwill and Intangible Assets, Section 3862, Financial Instruments –
Disclosures and Emerging Issues Committee (‘‘EIC’’) 173 – Credit Risk and the Fair Value of Financial Assets and Financial Liabilities.
ENERPLUS RESOURCES 2009 FINANCIAL SUMMARY 23
Goodwill and Intangible Assets
Section 3064 replaces Section 3062, Goodwill and Other Intangible Assets and Section 3450, Research and Development Costs. The new
Section establishes standards for the recognition, measurement, presentation and disclosure of goodwill and intangible assets subsequent to
its initial recognition. Standards concerning goodwill are unchanged from the standards included in the previous Section 3062. The adoption
of this new standard did not have a material impact on the Fund’s Consolidated Financial Statements.
Financial Instruments – Disclosures
Section 3862 was amended to include additional disclosure requirements about fair value measurement for financial instruments and
liquidity risk disclosures. These amendments require a three level hierarchy that reflects the significance of the inputs used in making the fair
value measurements. Fair values of assets and liabilities included in Level 1 are determined by reference to quoted prices in active markets for
identical assets and liabilities. Assets and liabilities in Level 2 include valuations using inputs other than quoted prices for which all significant
inputs are observable, either directly or indirectly. Level 3 valuations are based on inputs that are unobservable and significant to the overall
fair value measurement. The adoption of this new standard did not have a material impact on the Fund’s Consolidated Financial Statements.
Credit Risk and the Fair Value of Financial Assets and Financial Liabilities
EIC-173 provides guidance on how to take into account the credit risk of an entity and counterparty when determining the fair value of
financial assets and financial liabilities, including derivative instruments. The adoption of EIC-173 did not have a material impact on the
Fund’s Consolidated Financial Statements.
These standards were adopted prospectively.
Future Accounting Changes
Business Combinations
In January 2009, the CICA issued Handbook Section 1582, Business Combinations that replaces the previous business combinations
standard. Under the new standard, the purchase price used in a business combination is based on the fair value of shares exchanged at the
market price at acquisition date. Under the current standard, the purchase price used is based on the market price of shares for a reasonable
period before and after the date the acquisition is agreed upon and announced. In addition, the new standard generally requires all
acquisition costs to be expensed. Current standards allow for the capitalization of these costs as part of the purchase price. This new
standard also addresses contingent liabilities, which will be required to be recognized at fair value on acquisition, and subsequently
remeasured at each reporting period until settled. Current standards require only contingent liabilities that are due to be recognized. The
new standard requires any negative goodwill to be recognized as a charge to earnings rather than the current standard of which reduces the
fair value of non-current assets in the purchase price allocation. The new standard applies prospectively to business combinations on or after
January 1, 2011 with earlier application permitted. We do not intend to early adopt the new standard.
Convergence of Canadian GAAP with International Financial Reporting Standards (‘‘IFRS’’)
In October 2009 the Accounting Standards Board (‘‘AcSB’’) issued a third and final IFRS Omnibus Exposure Draft confirming that publicly
accountable enterprises will be required to apply IFRS, in full and without modification, for financial periods beginning on January 1, 2011.
The adoption date of January 1, 2011 will require the restatement, for comparative purposes, of amounts reported by Enerplus for the year
ended December 31, 2010, including the opening balance sheet as at January 1, 2010.
In order to meet our reporting requirements and transition to IFRS we have established a project team comprised of individuals from Finance,
Information Systems, Business Solutions, Operations, Tax, Investor Relations and Management. Our transition plan consists of four
main phases:
• An IFRS diagnostic phase which involves an assessment of the differences between Canadian GAAP and IFRS,
• An assessment and selection phase whereby we will determine accounting policies for transition and our continuing IFRS
accounting policies,
• An evaluation of our information systems, business processes, procedures and controls to support the new reporting standards, and
• Training and development throughout the organization.
24 ENERPLUS RESOURCES 2009 FINANCIAL SUMMARY
To date we have completed our IFRS diagnostic. As we have not yet finalized our accounting policies, we are unable to quantify the impact of
adopting IFRS on our financial statements. In addition, due to anticipated changes to IFRS and International Accounting Standards (‘‘IAS’’)
prior to our adoption of IFRS, our policy choices are subject to change based on new facts and circumstances that arise after the date of
this MD&A.
As a result of our information system evaluation and assessments in 2009, we have implemented certain system changes in late 2009 to
facilitate the classification of our PP&E in accordance with IFRS requirements in 2010. Therefore, we will be able to capture the 2010
comparative information required for our 2011 reporting under IFRS.
Internal Control Over Financial Reporting (‘‘ICFR’’) and Disclosure Controls and Procedures (‘‘DC&P’’)
In implementing the changes required for the transition to IFRS we have considered the integrity of our ICFR and DC&P. We do not expect
significant changes to our ICFR and DC&P, however we will continue to assess the impact to ICFR and DC&P during 2010 should additional
changes be made to information systems, business processes, or our accounting policies.
During 2009 we provided regular progress reporting to the Audit Committee of the Board of Directors on the status of the IFRS transition. In
addition, we provided targeted training on capital asset changes to our operations groups and business analysis teams. More comprehensive
training was provided to members of our Executive, Board of Directors and Corporate Finance group with a focus on the most significant
IFRS accounting policy changes that may impact our 2011 financial statements.
IFRS 1 Voluntary Exemptions Applied
First-Time Adoption of International Financial Reporting Standard (‘‘IFRS 1’’) allows first time adopters certain exemptions from the general
requirement to apply IFRS retrospectively. In July 2009, International Accounting Standards Board (‘‘IASB’’) finalized an amendment to IFRS 1
that allows a first-time adopter using full cost accounting to elect to measure its oil and gas assets at the date of transition to IFRS based on
the entity’s previous GAAP carrying value. This standard is effective for years beginning on or after January 1, 2010 with early adoption
permitted.
As of the date of this MD&A, we expect to apply the following voluntary IFRS 1 exemptions at the date of transition:
• IAS 16 ‘‘Property, Plant and Equipment’’ will not be applied retrospectively as we have elected to take the exemption which allows oil and
gas companies that applied full cost accounting to allocate their historic net PP&E to cash generating units (‘‘CGUs’’) using either reserve
volumes or values at January 1, 2010;
• IFRS 3 ‘‘Business Combinations’’ will not be applied to business combinations that occur before January 1, 2010 as such, IFRS 3 will be
adopted on a prospective basis;
• IAS 21, ‘‘The Effects of Changes in Foreign Exchange Rates’’ will not be applied retrospectively. Instead, the exemption allows us to deem
the cumulative translation differences for all foreign operations to be zero at January 1, 2010;
• IAS 23, ‘‘Borrowing Costs’’, will not be applied retrospectively. This exemption eliminates the requirement to capitalize interest on
qualifying assets where active development commenced before January 1, 2010; and
• IAS 17 ‘‘Leases’’ will not be applied retrospectively. A preliminary review of our existing arrangements have been assessed under IFRIC 4 –
‘‘Arrangements containing a Lease’’. No arrangements have been identified that would result in the recognition of additional leases at
January 1, 2010.
Key Accounting Policy Differences
The transition from current Canadian GAAP to IFRS is a significant undertaking that may materially affect our reported financial position and
results of operations. First time adoption impacts of IFRS are reflected through opening balance sheet transitional entries, the majority of
which are expected to be offset to retained earnings. The key differences between existing Canadian GAAP and IFRS that impact us are
presented below.
ENERPLUS RESOURCES 2009 FINANCIAL SUMMARY 25
Property, Plant and Equipment
Under IFRS capital costs will be recorded using one of the following three categories:
a. Pre-Exploration Costs
Under Canadian GAAP costs incurred prior to having obtained the legal right to explore are capitalized using the full cost method of
accounting. Under IFRS such expenditures are expensed as incurred.
b. Exploration and Evaluation (‘‘E&E’’) Assets
E&E assets are assets that are not considered by management to be commercially viable or technically feasible. These would include our oil
sands assets and undeveloped land. Under Canadian GAAP E&E assets are not separately identified whereas IFRS requires E&E assets to be
separately identified on the face of the balance sheet as tangible or intangible assets.
c. Developed and Producing (‘‘D&P’’) Assets
Under Canadian GAAP D&P assets are capitalized using the full cost method of accounting. Under IFRS D&P assets are accounted for in
smaller cost centers, or CGUs, and recognized on the balance sheet separately from E&E assets.
As a result of the changes in accounting for PP&E under IFRS we expect a moderate decrease in the overall capitalization of our development
capital and acquisition expenditures.
Depletion Policy
Under Canadian GAAP depletion is based on a unit of production basis using proved reserves. Under IFRS we have a choice to deplete our
D&P assets on a unit of production basis using either proved or proved plus probable reserves for each CGU. We expect to adopt a policy of
depleting using proved plus probable reserves for each CGU, which would reduce the amount of depletion recorded.
Impairment of Assets
Canadian GAAP generally uses a two-step approach to impairment testing. The first compares the asset carrying value with undiscounted
future cash flows to determine whether an impairment exists. If an impairment exists the amount of the impairment is determined by
comparing the asset carrying value with the discounted future cash flows. IAS 36, ‘‘Impairment of Assets’’, uses a one-step approach for both
testing and measurement of impairment whereby the asset carrying value is compared directly with the discounted future cash flows of
the asset.
At each reporting date all E&E assets and D&P assets are assessed for indicators of impairment. When indicators of a possible impairment
exist, an impairment test is performed. Impairment tests are carried out at the CGU level, or based on a group of CGUs. In addition to
performing an impairment test when indicators are present, impairment tests occur prior to the transfer of E&E assets into the D&P asset
class. Intangible assets, like goodwill, are tested for impairment annually. Any write-downs required will first reduce goodwill to zero before
impacting the value of the E&E or D&P asset. This may result in more write-downs under IFRS compared to Canadian GAAP.
As a result of selecting the IFRS 1 exemption noted above, we are required to perform impairment tests on our assets at the date of transition,
January 1, 2010. We have not assessed the impact at this time.
Canadian GAAP prohibits reversal of impairment losses. Under IFRS if the conditions giving rise to impairment have reversed, impairment
losses previously recorded would be partially or fully reversed to eliminate write-downs recorded.
26 ENERPLUS RESOURCES 2009 FINANCIAL SUMMARY
Decommissioning Liabilities (or Asset Retirement Obligations under Canadian GAAP)
Under Canadian GAAP we recognize a liability for the estimated fair value of the future retirement obligations associated with PP&E. The fair
value is capitalized and amortized over the same period as the underlying asset. We estimate the liability based on the estimated costs to
abandon and reclaim our net ownership interest in wells and facilities, including an estimate for the timing of the costs to be incurred in
future periods. These cash outflows are discounted using a credit-adjusted risk free rate. Changes in the net present value of the future
retirement obligation are expensed through accretion as part of DDA&A.
Under IFRS decommissioning liabilities are included as part of IAS 37, ‘‘Provisions, Contingent Liabilities and Contingent Assets’’. The liability
is calculated at each reporting period using estimates of risk-adjusted future cash outflows discounted using the risk free rate. Changes in the
net present value of the future retirement obligation are expensed through accretion as a part of DDA&A.
As a result of the change in the discount rate from a credit-adjusted rate to a risk free rate, we expect there may be an increase in the value of
the decommissioning liability under IFRS compared to Canadian GAAP, however the difference, if any, is not known at this time.
Marketable Securities
Under Canadian GAAP investments for non-public companies are carried at cost. Under IFRS all investments, public or private, must be
carried at fair value and revalued at each reporting date. Enerplus expects this may have an impact on the carrying value of our marketable
securities under IFRS as these values fluctuate over time.
Other Considerations
As a result of the combined IFRS changes noted in the preceding paragraphs, Management has been actively working with counterparties to
ensure agreements entered into that make reference to Canadian GAAP statements are modified to allow for IFRS financial statements. This
communication was in place during 2009 and such provisions were included in the agreements related to the issuance of our senior
unsecured notes on June 18, 2009. As such, we do not anticipate issues with our existing debt covenants and related agreements at this
time; however we will continue to monitor this during 2010.
RISK FACTORS AND RISK MANAGEMENT
Commodity Price Risk
Our operating results and financial condition are dependent on the prices we receive for our crude oil and natural gas production. These
prices have fluctuated widely in response to a variety of factors including global and domestic demand, weather conditions, the supply and
price of imported oil and liquefied natural gas, the production and storage levels of North American natural gas, political stability,
transportation facilities, the price and availability of alternative fuels and government regulations.
We may use financial derivative instruments and other hedging mechanisms to help limit the adverse effects of natural gas and crude oil
price volatility. However, we do not hedge all of our production and expect there will always be a portion that remains unhedged.
Furthermore, we may use financial derivative instruments that offer only limited protection within selected price ranges. To the extent price
exposure is hedged, we may forego the benefits that would otherwise be experienced if commodity prices increase. Refer to the ‘‘Price Risk
Management’’ section for further details on our price risk management program.
Availability of Credit and Renewal Risk
As a result of the global credit crisis during 2009 the fees and borrowing costs associated with renewing our bank credit facility were
extremely high. Therefore we decided to delay the renewal of our $1.4 billion facility which expires on November 18, 2010. Although we
expect to renew the facility during the second quarter of 2010, we have no assurance that the credit markets will be favorable at that time or
that all our banks will renew at their current commitment levels.
At December 31, 2009, our entire $1.4 billion bank credit facility was undrawn. Approximately 70% of the commitments under this facility
are with major Canadian banks who have indicated they would be supportive of our renewal in 2010 and are considered to be among the
most sound credit providers. Our borrowing costs are likely to increase upon renewal of our credit facility as extension fees and pricing for
drawn and undrawn balances have generally increased in the marketplace.
See the ‘‘Liquidity and Capital Resources’’ section for further information related to our credit facility.
ENERPLUS RESOURCES 2009 FINANCIAL SUMMARY 27
Counterparty and Joint Venture Credit Exposure
Early in 2009 economic conditions negatively affected the availability of credit and increased the risk that certain counterparties for our oil
and gas sales, financial derivatives and operations may fail to pay. Generally credit markets have improved however there remains a risk that
our counterparties may experience financial problems. Furthermore, if oil and natural gas prices remain low there is a risk of increased bad
debts related to our joint venture industry partners.
A credit review process is in place to assess and monitor our counterparties’ credit worthiness on a regular basis. This includes reviewing and
ratifying our corporate credit guidelines, assessing the credit ratings of our counterparties and setting exposure limits. When warranted we
obtain financial assurances such as letters of credit, parental guarantees, or third party insurance to mitigate our counterparty risk. In
addition, we monitor our receivables against a watch list of publicly traded companies that have high debt-to-cash flow ratios or fully drawn
bank facilities. In certain instances we may be able to aggregate all amounts owing to each other and settle with a single net amount.
See the ‘‘Liquidity and Capital Resources’’ section for further information related to our counterparties and joint venture partners.
Access to Capital Markets
Our access to capital has allowed us to fund a portion of our acquisitions and development capital program through equity and debt and as a
result, distribute a significant portion of our cash flow to our unitholders. Although we are somewhat dependent on continued access to the
capital market to fund our acquisition activity, we have chosen to reduce our reliance on the market by balancing the level of capital spending
and distributions more closely to our cash flow. Continued access to capital is dependent on our ability to maintain our track record of
performance and to demonstrate the advantages of the acquisition or development program that we are financing at the time.
We are listed on the Toronto and New York stock exchanges and maintain an active investor relations program. We provide continuous
disclosure and maintain complete public filings to ensure our eligibility to file a short form prospectus under applicable Canadian
securities law.
We maintain a prudent capital structure by retaining a portion of cash flow for capital spending and utilizing the equity markets and debt
facilities when deemed appropriate.
Oil and Gas Reserves and Resources Risk
The value of our trust units are based on, among other things, the underlying value of the oil and gas reserves and resources. Geological and
operational risks along with product price forecasts can affect the quantity and quality of reserves and resources and the cost of ultimately
recovering those reserves and resources. Lower crude oil and natural gas prices along with lower development capital spending associated
with certain projects may increase the risk of write-downs for our oil and gas property investments. Changes in reporting methodology as
well as regulatory reporting practices can result in reserve or resource write-downs.
We strive to acquire assets with positive operating metrics, long reserve lives and significant growth or cash flow potential. Where we do
engage in higher risk activities we target areas where there is potential for larger scale repeatable resource development if successful.
Each year, independent engineers evaluate a significant portion of our proved and probable reserves as well as the resources attributable to
our oil sands properties and Marcellus shale gas properties.
McDaniel & Associates Consultants Ltd. (‘‘McDaniel’’) evaluated 90% of the total proved plus probable value (discounted at 10%) of our
Canadian conventional year-end reserves and have reviewed the remainder of the reserves which we have evaluated internally. Netherland,
Sewell & Associates Inc. (‘‘NSAI’’) of Dallas, Texas, evaluated 100% of the reserves attributed to our western US assets including the Sleeping
Giant field and Haas Petroleum Engineering Services, Inc. (‘‘Haas’’) evaluated 100% of the reserves and contingent resources associated with
our Marcellus shale gas property in the eastern United States. GLJ Petroleum Consultants Ltd. (‘‘GLJ’’) evaluated the contingent resources
attributable to our Kirby oil sands leases.
To ensure comparability all of the independent reserve engineering firms utilized McDaniel’s forecast prices, constant prices and cost
assumptions as of December 31, 2009 and evaluated our reserves in accordance with NI 51-101.
The Reserves Committee of the Board of Directors has reviewed and approved the reserve and resource reports of the independent
evaluators.
28 ENERPLUS RESOURCES 2009 FINANCIAL SUMMARY
Marcellus Shale Gas
The Marcellus properties represent a new focus on shale gas outside of our traditional geographic areas. We have very limited experience in
the drilling and development of shale gas properties including the Marcellus shale gas region. The expansion of our activities into this new
resource play and location may present challenges and risks that we have not faced in the past. Failure to manage these challenges and risks
successfully may adversely affect the results of our operations and financial condition.
We purchased a non-operated position and intend to initially rely upon our partner’s expertise, Chief Oil & Gas LLC (‘‘Chief’’), with respect to
ongoing development, operations and certain future expansions in the Marcellus shale gas region. Furthermore, we expect to utilize Chief’s
knowledge to enhance our in-house technical expertise through a close working relationship.
Minimum Royalty Litigation May Invalidate Marcellus Leases
A significant amount of the lands that we acquired in the Marcellus shale gas region are located in the state of Pennsylvania, which has
legislation requiring the lessee of a freehold oil and gas lease to provide the lessor with a minimum royalty equal to 1/8th of the hydrocarbons
produced from the leased lands. Currently there are several legal actions proceeding in the state including various third parties that claim any
reduction in the royalty related to post-production costs such as gathering, processing and marketing of the production results in the lessor
receiving less than the minimum royalty and therefore invalidates the lease.
The majority of the leases we acquired pursuant to our Marcellus acquisition provide for the deduction of post-production costs from the
lessor’s royalty share of production. Chief has advised us that they have taken certain steps to mitigate this risk, and in particular to enter into
lease amendments with respect to developed properties. There is no assurance that the courts hearing these matters will rule in favour of
validating these leases and it is possible that an adverse ruling could result in the loss of some or all of the economic benefit of the leases
we acquired.
Access to Transportation Capacity
Market access for crude oil and natural gas production in Canada and the United States is dependent on our ability to access sufficient
transportation capacity on third party pipelines to transport all production volumes. New resource plays, such as the U.S. Marcellus shale gas,
generally experience a sharp increase in the amount of production being produced in the area which could exceed the existing capacity of
the various gathering and pipeline infrastructure. While the third party pipelines generally expand capacity to meet market needs, there can
be differences in timing between the growth of production and the growth of pipeline capacity. There are also occasionally operational
reasons for curtailing transportation capacity. Accordingly, there can be periods where transportation capacity is insufficient to
accommodate all of the production from a given region, causing added expense and/or volume curtailments for all shippers.
We continuously monitor this risk for both the short and longer term through dialogue and review with the third party pipelines and other
market participants. Where available and commercially appropriate given the production profile and commodity, we attempt to mitigate this
risk by contracting for firm transportation capacity or using other means of transportation.
Strategy Post 2010
We currently anticipate converting to a dividend paying corporation on or about January 1, 2011. We intend to take advantage of the SIFT
conversion rules to significantly simplify our underlying organization structure in 2010. Our corporate conversion is expected to be achieved
through a Plan of Arrangement which must be approved by our Board of Directors as well as our unitholders through a special meeting
currently anticipated to be held in late 2010. There is a risk that our unitholders may not approve our conversion to a corporation, however
the Canadian government has legislated the SIFT tax beginning in 2011 which effectively removes the benefits of remaining a trust. There is
also a risk that conversion could create a taxable event for some unitholders.
We do not expect the conversion to a corporation to have a major impact on our underlying operating strategy or business affairs.
Furthermore, at this time we do not anticipate that the conversion will create a taxable event for our unitholders. However, going forward,
the tax treatment of our distributions or dividends may be different for our unitholders/shareholders depending on their jurisdiction and
whether they are holding their investment in a taxable account or tax-deferred account.
ENERPLUS RESOURCES 2009 FINANCIAL SUMMARY 29
Regulatory Risk & Greenhouse Gas Emissions
Government royalties, income tax laws, environmental laws and regulatory requirements can have a significant financial and operational
impact on us. As an oil and gas producer, we are subject to a broad range of regulatory requirements that continue to increase both within
Canada and the United States.
Although we have no control over these regulatory risks, we continuously monitor changes in these areas by participating in industry
organizations, conferences, exchanging information with third party experts and employing qualified individuals to assess the impact of such
changes on our financial and operating results. In 2009 we continued with our extensive review of the regulatory compliance obligations
across our full business in all jurisdictions in order to confirm that we both understand and are meeting all requirements, and that employees
are aware of their individual accountabilities.
Specifically with respect to regulations for the reduction of greenhouse gas emissions, the Canadian federal government did not issue the
expected regulations in 2009, but rather continues to seek to align with any regulations to be issued by the United States. Accordingly, while
we continue to prepare to meet the potential requirements, the actual cost impact and its materiality to our business remains uncertain.
Production Replacement Risk
Oil and natural gas reserves naturally deplete as they are produced over time. Our ability to replace production depends on our success in
acquiring new reserves and resources and developing existing reserves and resources. Acquisitions of oil and gas assets depend on our
assessment of value at the time of acquisition. Incorrect assessments of value may adversely affect distributions to unitholders and the value
of our trust units.
Acquisitions and our development capital program are subject to investment guidelines, due diligence and review. Major acquisitions are
approved by the Board of Directors and where appropriate, independent reserve engineer evaluations are obtained.
Health, Safety and Environmental Risk (‘‘HSE’’)
Health, safety and environmental risks influence the workforce, operating costs and the establishment of regulatory standards.
We have established a HSE Management System designed to:
• provide staff with the training and resources needed to complete work safely and effectively;
• incorporate hazard assessment and risk management as an integral part of everyday business;
• monitor performance to ensure that our operations comply with legal obligations and the standards we set for ourselves; and
• identify and manage environmental liabilities associated with our existing asset base and potential acquisitions.
We have a site inspections program and a corrosion risk management program designed to ensure compliance with environmental laws and
regulations. We carry insurance to cover a portion of our property losses, liability and potential losses from business interruption. HSE risks
are reviewed regularly by the HSE committee which is comprised of members of the Board of Directors and management.
Foreign Currency Exposure
We have exposure to fluctuations in foreign currency as most of our senior unsecured notes are denominated in U.S. dollars. Our
U.S. operations are directly exposed to fluctuations in the U.S. dollar when translated to our Canadian dollar denominated financial
statements.
We also have indirect exposure to fluctuations in foreign currency as our crude oil sales and a portion of our natural gas sales are based on
U.S. dollar indices. Our oil and gas revenues are positively impacted as the Canadian dollar weakens relative to the U.S. dollar.
We have hedged our foreign currency exposure on both our US$175 million and US$54 million senior unsecured notes using financial swaps
that convert the U.S. denominated debt to Canadian dollar debt. In addition we have hedged the U.S. dollar interest obligation on our
US$175 million notes. We have not entered into any other foreign currency derivatives with respect to our oil and gas sales, our
U.S. operations or the U.S. senior unsecured notes issued during 2009.
Interest Rate Exposure
We have exposure to movements in interest rates and credit markets as changing interest rates affect our borrowing costs and the unit price
of yield-based investments such as our trust units as well as other equity investments.
30 ENERPLUS RESOURCES 2009 FINANCIAL SUMMARY
We monitor the interest rate forward market and have fixed the interest rate on approximately 77% of our debt through our senior
unsecured notes and interest rate swaps. Our bank credit facility which is based on floating interest rates was undrawn at year end.
Non-Resident Ownership and Mutual Fund Trust Status
Based on information received from our transfer agent and financial intermediaries in February 2010, we estimated our non-Canadian
ownership to be 69%. This estimate may not be accurate as it is based on certain assumptions and data from the securities industry that does
not have a well-defined methodology to determine the residency of beneficial holders of securities.
We currently meet the requirements of a mutual fund trust as defined in the Income Tax Act (Canada). Our trust indenture does not have a
specific limit on the percentage of trust units that may be owned by non-residents. At this time, we do not anticipate any legislative changes
that would affect our status as a mutual fund trust.
2010 GUIDANCE
A summary of our 2010 guidance is below which does not include any potential acquisitions or divestments:
Summary of 2010 Expectations Target Comments
Average annual production 86,000 BOE/day
Exit rate 2010 production 88,000 BOE/day Assumes $425 million development capital spending, net of
$33 million of Alberta DRC credits
2010 production mix 57% gas, 43% liquids
Average royalty rate 20% Percentage of gross sales
Operating costs $10.90/BOE
G&A costs $2.45/BOE Includes non-cash charges of $0.20/BOE (trust unit rights
incentive plan)
U.S. income and withholding 5% Applied to net cash flow generated by U.S. operations
tax – cash costs
Average interest and 8% Based on current fixed rate contracts, forward interest rates and
financing costs anticipated credit facility renewal costs
Corporate conversion and $3 million or $0.10/BOE Fees related to our conversion from a trust to a corporation and
simplification simplification of our underlying corporate structure
Development capital spending $425 million, net of Alberta Within the context of current commodity prices
DRC credits of $33 million
Marcellus carry commitment $64 million Will be reported as a property acquisition
DISCLOSURE CONTROLS AND PROCEDURES AND INTERNAL CONTROL OVER FINANCIAL REPORTING
Under the supervision of our Chief Executive Officer and Chief Financial Officer we have evaluated the effectiveness of our disclosure
controls and procedures and internal control over financial reporting as defined in Rule 13a – 15 under the US securities Exchange Act of
1934 and as defined in Canada by National Instrument 52-109, Certification of Disclosure in Issuers’ Annual and Interim Filings. We have
concluded that as of the end of the period covered by this report, our disclosure controls and procedures and internal control over financial
reporting are effective. There were no changes in our internal control over financial reporting during the period beginning on October 1,
2009 and ended December 31, 2009 that have materially affected, or are reasonably likely to materially affect, our internal control over
financial reporting.
ENERPLUS RESOURCES 2009 FINANCIAL SUMMARY 31
ADDITIONAL INFORMATION
Additional information relating to Enerplus Resources Fund, including our Annual Information Form, is available under our profile on the
SEDAR website at www.sedar.com, on the EDGAR website at www.sec.gov and at www.enerplus.com.
FORWARD-LOOKING INFORMATION AND STATEMENTS
This MD&A contains certain forward-looking information and statements within the meaning of applicable securities laws. The use of any of
the words ‘‘expect’’, ‘‘anticipate’’, ‘‘continue’’, ‘‘estimate’’, ‘‘guidance’’, ‘‘objective’’, ‘‘ongoing’’, ‘‘may’’, ‘‘will’’, ‘‘project’’, ‘‘should’’, ‘‘believe’’,
‘‘plans’’, ‘‘intends’’, ‘‘budget’’, ‘‘strategy’’ and similar expressions are intended to identify forward-looking information or statements. In
particular, but without limiting the foregoing, this MD&A contains forward-looking information and statements pertaining to the following:
asset dispositions and the use of proceeds therefrom; our corporate strategy, including transition from an income trust to a corporate form,
the timing thereof and the potential tax treatment of the conversion; expected oil, natural gas and natural gas liquids production volumes
and product mix; future oil and natural gas prices and the Fund’s commodity risk management programs; cash flow sensitivities to
commodity price, production, foreign exchange and interest rate changes; expected operating, G&A and trust conversion expenses and
royalty and interest rates; development capital expenditures and the allocation thereof; future acquisitions; receipt of required regulatory
approvals; the amount of future abandonment and reclamation costs and asset retirement obligations; taxes payable by the Fund and its
subsidiaries; the tax pools of the Fund and its subsidiaries; renewal of our credit facility and the borrowing costs associated with the credit
facility; credit risk mitigation programs; future debt levels, financial capacity, liquidity and capital resources; cash distributions and dividends
and the tax treatment thereof; future contractual commitments; our transition to IFRS and the impact of that change on our financial results;
reliance on industry partners to develop and expand our assets and operations; litigation relating to our Marcellus properties and the
potential outcome of such litigation; and future environmental obligations and the costs associated therewith.
The forward-looking information and statements contained in this MD&A reflect several material factors and expectations and assumptions
of the Fund including, without limitation: that the Fund will conduct its operations in a manner consistent with its expectations and, where
applicable, consistent with past practice; the general continuance of current or, where applicable, assumed industry conditions; the
continuance of existing (and in certain circumstances, the implementation of proposed) tax, royalty and regulatory regimes; the accuracy of
the estimates of the Fund’s reserve and resource volumes; certain commodity price and other cost assumptions; the continued availability of
adequate debt and/or equity financing and cash flow to fund its capital and operating requirements as needed; and the extent of its
liabilities. The Fund believes the material factors, expectations and assumptions reflected in the forward-looking information and statements
are reasonable but no assurance can be given that these factors, expectations and assumptions will prove to be correct. The forward-looking
information and statements included in this MD&A are not guarantees of future performance and should not be unduly relied upon. Such
information and statements involve known and unknown risks, uncertainties and other factors that may cause actual results or events to
differ materially from those anticipated in such forward-looking information or statements including, without limitation: changes in
commodity prices; changes in the demand for or supply of the Fund’s products; unanticipated operating results or production declines;
changes in tax or environmental laws, royalty rates or other regulatory matters; changes in development plans the Fund or by third party
operators of the Fund’s properties, increased debt levels or debt service requirements; inaccurate estimation of the Fund’s oil and gas reserve
and resource volumes; limited, unfavourable or a lack of access to capital markets; increased costs; a lack of adequate insurance coverage;
the impact of competitors; reliance on industry partners; and certain other risks detailed from time to time in the Fund’s public disclosure
documents (including, without limitation, those risks and contingencies described above and under ‘‘Risk Factors and Risk Management’’ in
this MD&A and under ‘‘Risk Factors’’ in the Fund’s Annual Information Form dated March 13, 2009, which is available on our website at
www.enerplus.com and on our SEDAR profile at www.sedar.com and which forms part of our Form 40-F filed with the SEC on March 13,
2009 and available at www.sec.gov. Additional risk factors will be contained in the Fund’s Annual Information Form (and corresponding
Form 40-F) for the year ended December 31, 2009, which the Fund anticipates will be filed in mid-March 2010.
The forward-looking information and statements contained in this MD&A speak only as of the date of this MD&A, and none of the Fund or
its subsidiaries assumes any obligation to publicly update or revise them to reflect new events or circumstances, except as may be required
pursuant to applicable laws.
32 ENERPLUS RESOURCES 2009 FINANCIAL SUMMARY
23FEB200623300212 23FEB200623301586
Management’s Report onInternal Control Over Financial Reporting
The management of Enerplus Resources Fund is responsible for establishing and maintaining adequate internal control over financial
reporting for the Fund. Under the supervision of our Chief Executive Officer and our Chief Financial Officer we have conducted an evaluation
of the effectiveness of our internal control over financial reporting based on the Internal Control-Integrated Framework issued by the
Committee of Sponsoring Organizations of the Treadway Commission (COSO). Based on our assessment, we have concluded that as of
December 31, 2009, our internal control over financial reporting is effective.
Because of inherent limitations, internal control over financial reporting may not prevent or detect misstatements and even those systems
determined to be effective can provide only reasonable assurance with respect to the financial statement preparation and presentation.
The effectiveness of the Fund’s internal control over financial reporting as of December 31, 2009, has been audited by Deloitte & Touche LLP,
the Fund’s Independent Registered Chartered Accountants, who also audited the Fund’s Consolidated Financial Statements for the year
ended December 31, 2009.
Gordon J. Kerr Robert J. Waters
President and Senior Vice President and
Chief Executive Officer Chief Financial Officer
Calgary, Alberta
February 24, 2010
ENERPLUS RESOURCES 2009 FINANCIAL SUMMARY 33
REPORTS
23FEB200623294394
Report of Independent Registered Chartered Accountants
To the Board of Directors of Enermark Inc. and
Unitholders of Enerplus Resources Fund:
We have audited the internal control over financial reporting of Enerplus Resources Fund and subsidiaries (the ‘‘Fund’’) as of December 31,
2009, based on the criteria established in Internal Control – Integrated Framework issued by the Committee of Sponsoring Organizations of
the Treadway Commission. The Fund’s management is responsible for maintaining effective internal control over financial reporting and for
its assessment of the effectiveness of internal control over financial reporting, included in the accompanying Management’s Report on
Internal Control Over Financial Reporting. Our responsibility is to express an opinion on the Fund’s internal control over financial reporting
based on our audit.
We conducted our audit in accordance with the standards of the Public Company Accounting Oversight Board (United States). Those
standards require that we plan and perform the audit to obtain reasonable assurance about whether effective internal control over financial
reporting was maintained in all material respects. Our audit included obtaining an understanding of internal control over financial reporting,
assessing the risk that a material weakness exists, testing and evaluating the design and operating effectiveness of internal control based on
the assessed risk, and performing such other procedures as we considered necessary in the circumstances. We believe that our audit provides
a reasonable basis for our opinion.
A company’s internal control over financial reporting is a process designed by, or under the supervision of, the company’s principal executive
and principal financial officers, or persons performing similar functions, and effected by the company’s board of directors, management, and
other personnel to provide reasonable assurance regarding the reliability of financial reporting and the preparation of financial statements
for external purposes in accordance with generally accepted accounting principles. A company’s internal control over financial reporting
includes those policies and procedures that (1) pertain to the maintenance of records that, in reasonable detail, accurately and fairly reflect
the transactions and dispositions of the assets of the company; (2) provide reasonable assurance that transactions are recorded as necessary
to permit preparation of financial statements in accordance with generally accepted accounting principles, and that receipts and
expenditures of the company are being made only in accordance with authorizations of management and directors of the company; and
(3) provide reasonable assurance regarding prevention or timely detection of unauthorized acquisition, use, or disposition of the company’s
assets that could have a material effect on the financial statements.
Because of the inherent limitations of internal control over financial reporting, including the possibility of collusion or improper management
override of controls, material misstatements due to error or fraud may not be prevented or detected on a timely basis. Also, projections of
any evaluation of the effectiveness of the internal control over financial reporting to future periods are subject to the risk that the controls
may become inadequate because of changes in conditions, or that the degree of compliance with the policies or procedures may deteriorate.
In our opinion, the Fund maintained, in all material respects, effective internal control over financial reporting as of December 31, 2009,
based on the criteria established in Internal Control – Integrated Framework issued by the Committee of Sponsoring Organizations of the
Treadway Commission.
We have also audited, in accordance with Canadian generally accepted auditing standards and the standards of the Public Company
Accounting Oversight Board (United States), the consolidated financial statements as at and for the year ended December 31, 2009 of the
Fund and our report dated February 24, 2010 expressed an unqualified opinion on those financial statements and included a separate report
titled Comments by Independent Registered Chartered Accountants on Canada-United States of America Reporting Difference referring to
changes in accounting principles.
Independent Registered Chartered Accountants
Calgary, Canada
February 24, 2010
34 ENERPLUS RESOURCES 2009 FINANCIAL SUMMARY
23FEB200623300212 23FEB200623301586
Management’s Responsibility for Financial Statements
In management’s opinion, the accompanying consolidated financial statements of Enerplus Resources Fund (the ‘‘Fund’’) have been prepared
within reasonable limits of materiality and in accordance with Canadian generally accepted accounting principles. Since a precise
determination of many assets and liabilities is dependent on future events, the preparation of financial statements necessarily involves the
use of estimates and approximations. These have been made using careful judgment and with all information available up to February 24,
2010. Management is responsible for all information in the annual report and for the consistency, therewith, of all other financial and
operating data presented in this report.
To meet its responsibility for reliable and accurate financial statements, management has established and monitors systems of internal
control which are designed to provide reasonable assurance that financial information is relevant, reliable and accurate, and that assets are
safeguarded and transactions are executed in accordance with management’s authorization.
The consolidated financial statements have been examined by Deloitte & Touche LLP, Independent Registered Chartered Accountants. Their
responsibility is to express a professional opinion on the fair presentation of the consolidated financial statements in accordance with
Canadian generally accepted accounting principles. The Independent Registered Chartered Accountants Report outlines the scope of their
examination and sets forth their opinion.
The Audit Committee, consisting exclusively of independent directors, has reviewed these statements with management and the
Independent Registered Chartered Accountants and has recommended their approval to the Board of Directors. The Board of Directors has
approved the consolidated financial statements of the Fund.
Gordon J. Kerr Robert J. Waters
President and Senior Vice President and
Chief Executive Officer Chief Financial Officer
Calgary, Alberta
February 24, 2010
ENERPLUS RESOURCES 2009 FINANCIAL SUMMARY 35
23FEB200623294394
23FEB200623294394
Report of Independent Registered Chartered Accountants
To the Board of Directors of Enermark Inc. andUnitholders of Enerplus Resources Fund:
We have audited the accompanying consolidated balance sheets of Enerplus Resources Fund and subsidiaries (the ‘‘Fund’’) as atDecember 31, 2009 and 2008, and the related consolidated statements of income, accumulated deficit, comprehensive income (loss),accumulated other comprehensive income (loss) and cash flows for the years then ended. These financial statements are the responsibility ofthe Fund’s management. Our responsibility is to express an opinion on these financial statements based on our audits.
We conducted our audits in accordance with Canadian generally accepted auditing standards and the standards of the Public CompanyAccounting Oversight Board (United States). These standards require that we plan and perform the audit to obtain reasonable assuranceabout whether the financial statements are free of material misstatement. An audit includes examining, on a test basis, evidence supportingthe amounts and disclosures in the financial statements. An audit also includes assessing the accounting principles used and significantestimates made by management, as well as evaluating the overall financial statement presentation. We believe that our audits provide areasonable basis for our opinion.
In our opinion, these consolidated financial statements present fairly, in all material respects, the financial position of Enerplus ResourcesFund and subsidiaries as at December 31, 2009 and 2008, and the results of their operations and their cash flows for the years then ended inaccordance with Canadian generally accepted accounting principles.
We have also audited, in accordance with the standards of the Public Company Accounting Oversight Board (United States), the Fund’sinternal control over financial reporting as of December 31, 2009, based on the criteria established in Internal Control – IntegratedFramework issued by the Committee of Sponsoring Organizations of the Treadway Commission and our report dated February 24, 2010expressed an unqualified opinion on the Fund’s internal control over financial reporting.
Independent Registered Chartered AccountantsCalgary, CanadaFebruary 24, 2010
Comments by Independent Registered Chartered Accountantson Canada-United States of America Reporting Difference
The standards of the Public Company Accounting Oversight Board (United States) require the addition of an explanatory paragraph(following the opinion paragraph) when there are changes in accounting principles that have a material effect on the comparability of theFund’s financial statements, such as the changes described in Notes 2 and 14 to the consolidated financial statements. Although weconducted our audits in accordance with both Canadian generally accepted auditing standards and the standards of the Public CompanyAccounting Oversight Board (United States), our report to the Board of Directors of Enermark Inc. and Unitholders of Enerplus ResourcesFund, dated February 24, 2010, is expressed in accordance with Canadian reporting standards which do not require a reference to suchchanges in accounting principles in the auditors’ report when the changes are properly accounted for and adequately disclosed in thefinancial statements.
Independent Registered Chartered AccountantsCalgary, CanadaFebruary 24, 2010
36 ENERPLUS RESOURCES 2009 FINANCIAL SUMMARY
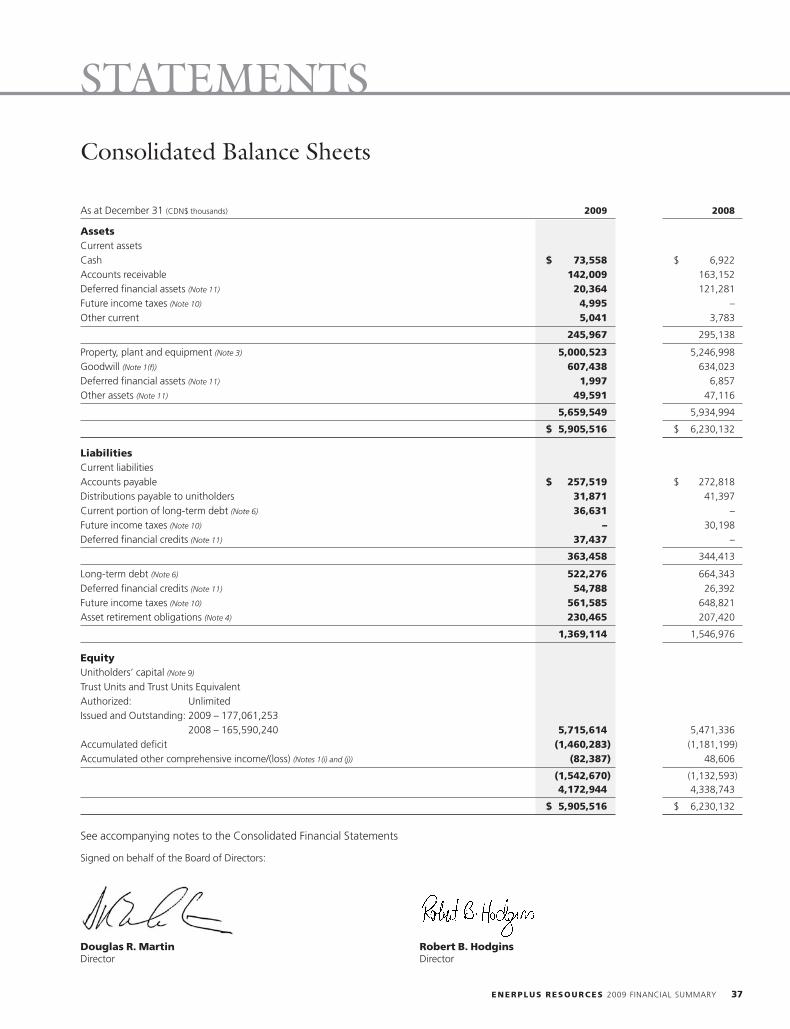
3MAR200619341178 5MAR200912444643
Consolidated Balance Sheets
As at December 31 (CDN$ thousands) 2009 2008
AssetsCurrent assetsCash $ 73,558 $ 6,922Accounts receivable 142,009 163,152Deferred financial assets (Note 11) 20,364 121,281Future income taxes (Note 10) 4,995 –
Other current 5,041 3,783
245,967 295,138
Property, plant and equipment (Note 3) 5,000,523 5,246,998Goodwill (Note 1(f)) 607,438 634,023Deferred financial assets (Note 11) 1,997 6,857Other assets (Note 11) 49,591 47,116
5,659,549 5,934,994
$ 5,905,516 $ 6,230,132
LiabilitiesCurrent liabilitiesAccounts payable $ 257,519 $ 272,818Distributions payable to unitholders 31,871 41,397
Current portion of long-term debt (Note 6) 36,631 –Future income taxes (Note 10) – 30,198Deferred financial credits (Note 11) 37,437 –
363,458 344,413
Long-term debt (Note 6) 522,276 664,343
Deferred financial credits (Note 11) 54,788 26,392Future income taxes (Note 10) 561,585 648,821Asset retirement obligations (Note 4) 230,465 207,420
1,369,114 1,546,976
EquityUnitholders’ capital (Note 9)
Trust Units and Trust Units EquivalentAuthorized: UnlimitedIssued and Outstanding: 2009 – 177,061,253
2008 – 165,590,240 5,715,614 5,471,336
Accumulated deficit (1,460,283) (1,181,199)Accumulated other comprehensive income/(loss) (Notes 1(i) and (j)) (82,387) 48,606
(1,542,670) (1,132,593)4,172,944 4,338,743
$ 5,905,516 $ 6,230,132
See accompanying notes to the Consolidated Financial Statements
Signed on behalf of the Board of Directors:
Douglas R. Martin Robert B. HodginsDirector Director
ENERPLUS RESOURCES 2009 FINANCIAL SUMMARY 37
STATEMENTS
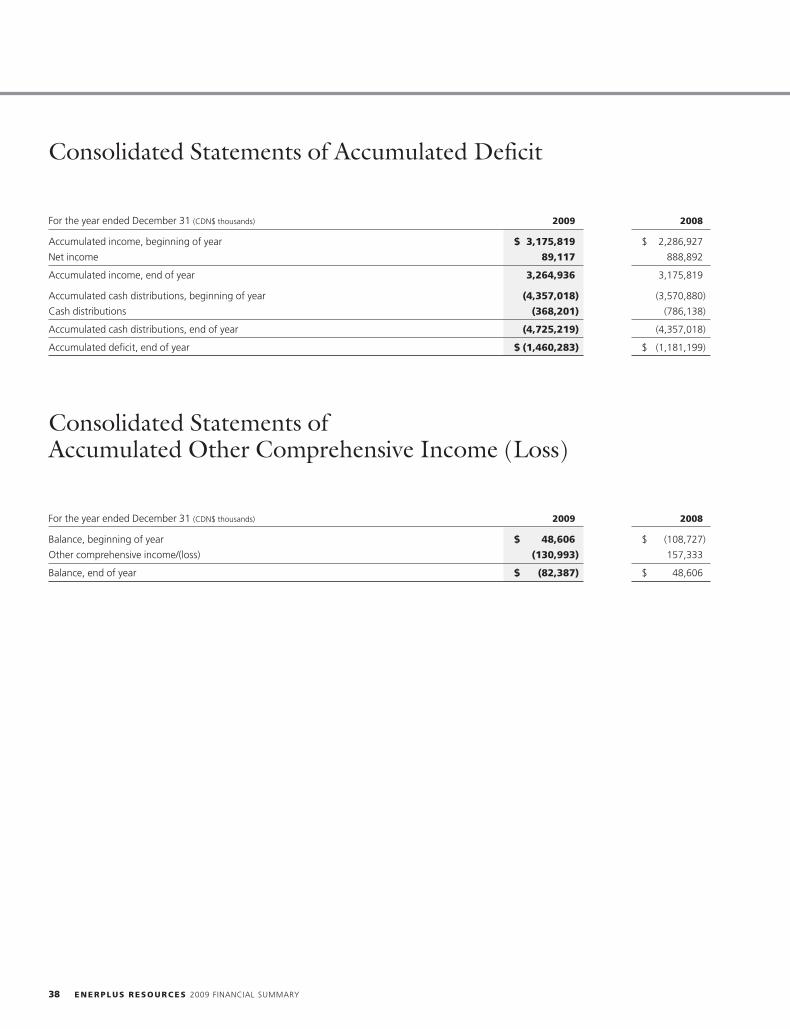
Consolidated Statements of Accumulated Deficit
For the year ended December 31 (CDN$ thousands) 2009 2008
Accumulated income, beginning of year $ 3,175,819 $ 2,286,927
Net income 89,117 888,892
Accumulated income, end of year 3,264,936 3,175,819
Accumulated cash distributions, beginning of year (4,357,018) (3,570,880)
Cash distributions (368,201) (786,138)
Accumulated cash distributions, end of year (4,725,219) (4,357,018)
Accumulated deficit, end of year $ (1,460,283) $ (1,181,199)
Consolidated Statements ofAccumulated Other Comprehensive Income (Loss)
For the year ended December 31 (CDN$ thousands) 2009 2008
Balance, beginning of year $ 48,606 $ (108,727)
Other comprehensive income/(loss) (130,993) 157,333
Balance, end of year $ (82,387) $ 48,606
38 ENERPLUS RESOURCES 2009 FINANCIAL SUMMARY
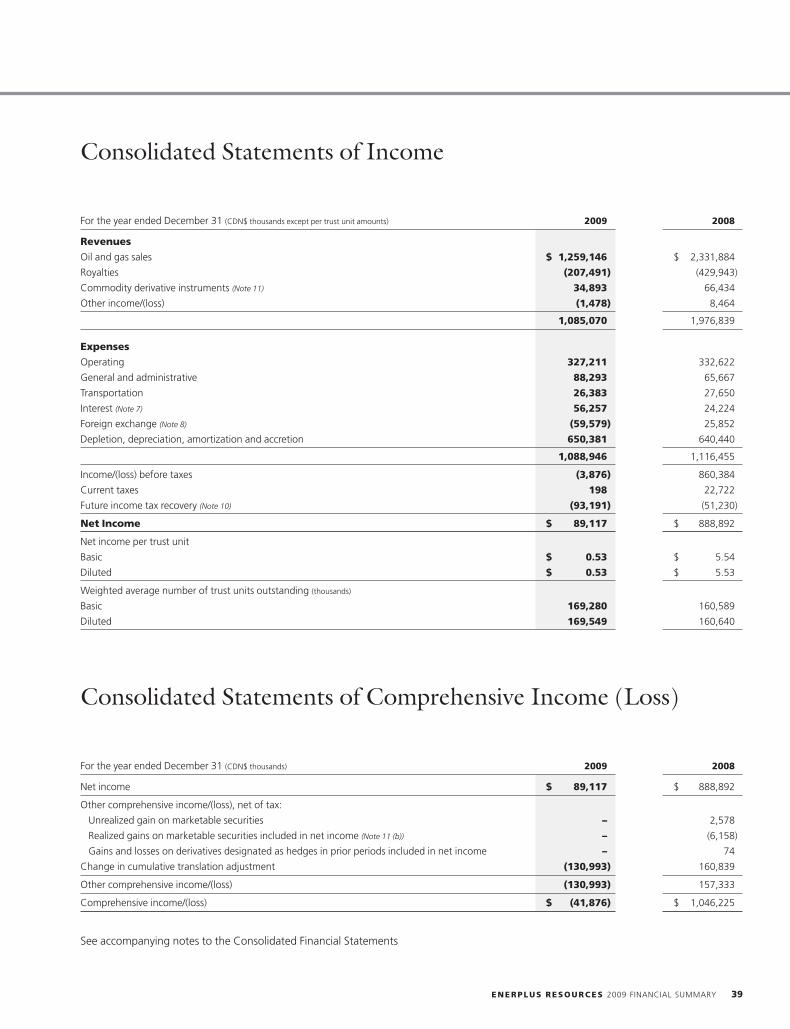
Consolidated Statements of Income
For the year ended December 31 (CDN$ thousands except per trust unit amounts) 2009 2008
Revenues
Oil and gas sales $ 1,259,146 $ 2,331,884
Royalties (207,491) (429,943)
Commodity derivative instruments (Note 11) 34,893 66,434
Other income/(loss) (1,478) 8,464
1,085,070 1,976,839
Expenses
Operating 327,211 332,622
General and administrative 88,293 65,667
Transportation 26,383 27,650
Interest (Note 7) 56,257 24,224
Foreign exchange (Note 8) (59,579) 25,852
Depletion, depreciation, amortization and accretion 650,381 640,440
1,088,946 1,116,455
Income/(loss) before taxes (3,876) 860,384
Current taxes 198 22,722
Future income tax recovery (Note 10) (93,191) (51,230)
Net Income $ 89,117 $ 888,892
Net income per trust unit
Basic $ 0.53 $ 5.54
Diluted $ 0.53 $ 5.53
Weighted average number of trust units outstanding (thousands)
Basic 169,280 160,589
Diluted 169,549 160,640
Consolidated Statements of Comprehensive Income (Loss)
For the year ended December 31 (CDN$ thousands) 2009 2008
Net income $ 89,117 $ 888,892
Other comprehensive income/(loss), net of tax:
Unrealized gain on marketable securities – 2,578
Realized gains on marketable securities included in net income (Note 11 (b)) – (6,158)
Gains and losses on derivatives designated as hedges in prior periods included in net income – 74
Change in cumulative translation adjustment (130,993) 160,839
Other comprehensive income/(loss) (130,993) 157,333
Comprehensive income/(loss) $ (41,876) $ 1,046,225
See accompanying notes to the Consolidated Financial Statements
ENERPLUS RESOURCES 2009 FINANCIAL SUMMARY 39
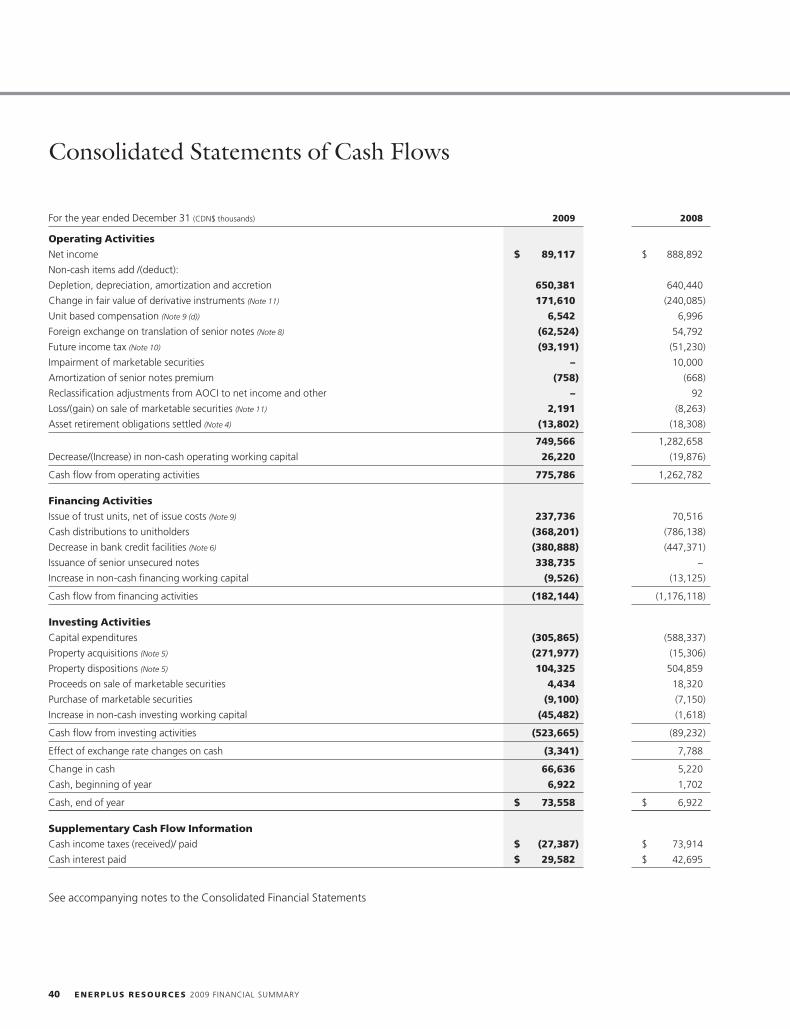
Consolidated Statements of Cash Flows
For the year ended December 31 (CDN$ thousands) 2009 2008
Operating Activities
Net income $ 89,117 $ 888,892
Non-cash items add /(deduct):
Depletion, depreciation, amortization and accretion 650,381 640,440
Change in fair value of derivative instruments (Note 11) 171,610 (240,085)
Unit based compensation (Note 9 (d)) 6,542 6,996
Foreign exchange on translation of senior notes (Note 8) (62,524) 54,792
Future income tax (Note 10) (93,191) (51,230)
Impairment of marketable securities – 10,000
Amortization of senior notes premium (758) (668)
Reclassification adjustments from AOCI to net income and other – 92
Loss/(gain) on sale of marketable securities (Note 11) 2,191 (8,263)
Asset retirement obligations settled (Note 4) (13,802) (18,308)
749,566 1,282,658
Decrease/(Increase) in non-cash operating working capital 26,220 (19,876)
Cash flow from operating activities 775,786 1,262,782
Financing Activities
Issue of trust units, net of issue costs (Note 9) 237,736 70,516
Cash distributions to unitholders (368,201) (786,138)
Decrease in bank credit facilities (Note 6) (380,888) (447,371)
Issuance of senior unsecured notes 338,735 –
Increase in non-cash financing working capital (9,526) (13,125)
Cash flow from financing activities (182,144) (1,176,118)
Investing Activities
Capital expenditures (305,865) (588,337)
Property acquisitions (Note 5) (271,977) (15,306)
Property dispositions (Note 5) 104,325 504,859
Proceeds on sale of marketable securities 4,434 18,320
Purchase of marketable securities (9,100) (7,150)
Increase in non-cash investing working capital (45,482) (1,618)
Cash flow from investing activities (523,665) (89,232)
Effect of exchange rate changes on cash (3,341) 7,788
Change in cash 66,636 5,220
Cash, beginning of year 6,922 1,702
Cash, end of year $ 73,558 $ 6,922
Supplementary Cash Flow Information
Cash income taxes (received)/ paid $ (27,387) $ 73,914
Cash interest paid $ 29,582 $ 42,695
See accompanying notes to the Consolidated Financial Statements
40 ENERPLUS RESOURCES 2009 FINANCIAL SUMMARY
Notes to Consolidated Financial Statements
1. SUMMARY OF SIGNIFICANT ACCOUNTING POLICIES
The management of Enerplus Resources Fund (‘‘Enerplus’’ or the ‘‘Fund’’) prepares the consolidated financial statements in accordance with
Canadian generally accepted accounting principles (‘‘Canadian GAAP’’). A reconciliation between Canadian GAAP and United States of
America GAAP (‘‘U.S. GAAP’’) is disclosed in Note 14. The preparation of financial statements requires management to make estimates and
assumptions that affect the reported amounts of assets and liabilities and disclosures of contingencies, if any, as at the date of the financial
statements and the reported amounts of revenues and expenses during the reporting period. Actual results could differ from those
estimated. In particular, the amounts recorded for depletion and depreciation of the petroleum and natural gas properties and for asset
retirement obligations are based on estimates of reserves and future costs. By their nature, these estimates, and those related to future cash
flows used to assess impairment, are subject to measurement uncertainty and the impact on the financial statements of future periods could
be material.
The following significant accounting policies are presented to assist the reader in evaluating these consolidated financial statements and,
together with the following notes, should be considered an integral part of the consolidated financial statements.
(a) Organization and Basis of Accounting
The Fund is an open-end investment trust created under the laws of the Province of Alberta operating pursuant to the Amended and
Restated Trust Indenture between EnerMark Inc. (the Fund’s wholly-owned subsidiary), Enerplus Resources Corporation (‘‘ERC’’) and
Computershare Trust Company of Canada. The beneficiaries of the Fund (the ‘‘unitholders’’) are holders of the trust units issued by the Fund.
As a mutual fund trust under the Income Tax Act (Canada), Enerplus is limited to holding and administering permitted investments and
making distributions to the unitholders.
The Fund’s financial statements include the accounts of the Fund and its subsidiaries on a consolidated basis. All inter-entity transactions
have been eliminated. Many of the Fund’s production activities are conducted through joint ventures and the financial statements reflect
only the Fund’s proportionate interest in such activities.
(b) Revenue Recognition
Revenue associated with the sale of crude oil, natural gas and natural gas liquids is recognized when title passes from the Fund to its
customers based on price, volumes delivered and contractual delivery points. A portion of the properties acquired through the March 5,
2003 acquisition of PCC Energy Inc. and PCC Energy Corp. are subject to a royalty arrangement, with a private company, that is structured as
a net profits interest. The results from operations included in the Fund’s consolidated financial statements for these properties are reduced for
this net profits interest.
(c) Property, Plant and Equipment (‘‘PP&E’’)
The Fund follows the full cost method of accounting for petroleum and natural gas properties under which all acquisition and development
costs are capitalized on a country by country cost centre basis. Such costs include land acquisition, geological, geophysical, drilling costs for
productive and non-productive wells, facilities and directly related overhead charges. Repairs, maintenance and operational costs that do not
extend or enhance the recoverable reserves are charged to earnings. Proceeds from the sale of petroleum and natural gas properties are
applied against the capitalized costs. Gains and losses are not recognized upon disposition of oil and natural gas properties unless such a
disposition would alter the rate of depletion by 20% or more. Net costs related to operating and administrative activities during the
development of large capital projects are capitalized until commercial production has commenced.
ENERPLUS RESOURCES 2009 FINANCIAL SUMMARY 41
NOTES
(d) Impairment Test
A limit is placed on the aggregate carrying value of PP&E (the ‘‘impairment test’’). The Fund performs an impairment test on a country by
country basis. An impairment loss exists when the carrying amount of the country’s PP&E exceeds the estimated undiscounted future net
cash flows associated with the country’s proved reserves. If an impairment loss is determined to exist, the costs carried on the balance sheet
in excess of the discounted future net cash flows associated with the country’s proved and probable reserves are charged to income. Net
costs related to projects in the pre-commercial phase of development are excluded from the country by country impairment test and are
tested for impairment separately.
(e) Depletion and Depreciation
The provision for depletion and depreciation of oil and natural gas assets is calculated on a country by country basis using the
unit-of-production method, based on the country’s share of estimated proved reserves before royalties. Reserves and production are
converted to equivalent units on the basis of 6 Mcf = 1 bbl, reflecting the approximate relative energy content.
(f) Goodwill
The Fund, when appropriate, recognizes goodwill relating to corporate acquisitions when the total purchase price exceeds the fair value of
the net identifiable assets and liabilities of the acquired companies. The portion of goodwill that relates to its foreign operations fluctuates
due to changes in foreign exchange rates. The goodwill balance is assessed for impairment annually at year-end or as events occur that could
result in an impairment. To assess impairment, the fair values of the Canadian and U.S. reporting units are compared to their respective book
values. If the fair value is less than the book value, a second test is performed to determine the amount of impairment. The amount of
impairment is measured by allocating the fair value of the reporting unit to its identifiable assets and liabilities as if they had been acquired in
a business combination for a purchase price equal to their fair value. If goodwill determined in this manner is less than the carrying value of
goodwill, an impairment is recognized in the period in which it occurs. Goodwill is stated at cost less impairment and is not amortized.
Goodwill is not deductible for income tax purposes.
(g) Asset Retirement Obligations
The Fund recognizes a liability for the estimated fair value of the future retirement obligations associated with its PP&E. The fair value is
capitalized and amortized over the same period as the underlying asset. The Fund estimates the liability based on the estimated costs to
abandon and reclaim its net ownership interest in all wells and facilities and the estimated timing of the costs to be incurred in future periods.
This estimate is evaluated on a periodic basis and any adjustment to the estimate is prospectively applied. As time passes, the change in net
present value of the future retirement obligation is expensed through accretion. Retirement obligations settled during the period reduce the
future retirement liability. No gains or losses on retirement activities were realized due to settlements approximating the estimates.
(h) Income Taxes
The Fund is a taxable entity under the Income Tax Act (Canada) and is taxable only on Canadian income that is not distributed or distributable
to the Fund’s unitholders. In the Trust structure, payments made between the Canadian operating entities and the Fund ultimately transfer
both income and future income tax liability to the unitholders. The future income tax liability associated with Canadian assets recorded on
the balance sheet is recovered over time through these payments. As the Canadian operating entities transfer all of their Canadian taxable
income to the Fund, no provision for current Canadian income tax has been made by any Canadian operating entity.
Effective January 1, 2011, the Fund and its underlying Canadian entities will be subject to either a Canadian corporate income tax or the
26.5% SIFT (specified investment flow-through) tax. The future tax liability associated with Canadian assets recorded on the balance sheet as
at December 31, 2009 reflects the commencement of the SIFT tax.
The U.S. operating entity is subject to U.S. income taxes on its taxable income determined under U.S. income tax rules and regulations.
Repatriation of funds from U.S. operations will also be subject to applicable withholding taxes as required under U.S. tax law.
The Fund follows the liability method of accounting for income taxes. Under this method, income tax liabilities and assets are recognized for
the estimated tax consequences attributable to the temporary differences between the carrying value of the assets and liabilities on the
42 ENERPLUS RESOURCES 2009 FINANCIAL SUMMARY
consolidated financial statements and their respective tax bases, using substantively enacted income tax rates. The effect of a change in
these income tax rates on future income tax liabilities and assets is recognized in income during the period that the change occurs.
(i) Financial Instruments
The Fund is exposed to market risks resulting from fluctuations in commodity prices, foreign exchange rates and interest rates in the normal
course of operations. A variety of derivative instruments are used by the Fund to reduce its exposure to these risks. The Fund records its
derivative instruments on the Consolidated Balance Sheet at fair value and recognizes any change in fair value through net income during
the period. The fair values of these derivative instruments are generally based on an estimate of the amounts that would be received or paid
to settle these instruments at the balance sheet date.
The Fund has certain minor equity investments in entities involved in the oil and gas industry. Investments that have a quoted price in an
active market are measured at fair value with changes in fair value recognized in other comprehensive income. When the investment is
ultimately sold any gains or losses are recognized in net income and any unrealized gains or losses previously recognized in other
comprehensive income are reversed. Investments that do not have a quoted price in an active market are measured at cost unless there has
been any other than temporary impairment, in which case a charge is recognized in net income to record the loss in value.
(j) Foreign Currency Translation
The Fund’s U.S. operations are self-sustaining. Assets and liabilities of these operations are translated into Canadian dollars at period end
exchange rates, while revenues and expenses are converted using average rates for the period. Gains and losses from the translation into
Canadian dollars are deferred and included in the cumulative translation adjustment (‘‘CTA’’) which is part of accumulated other
comprehensive income (‘‘AOCI’’).
Other monetary assets and liabilities, not related to the Fund’s U.S. operations, are translated into Canadian dollars at rates of exchange in
effect at the balance sheet date. The other assets and related depreciation, depletion and amortization, other liabilities, revenue and other
expenses are translated into Canadian dollars at rates of exchange in effect at the respective transaction dates. The resulting exchange gains
or losses are included in earnings.
(k) Unit Based Compensation
The Fund uses the fair value method of accounting for its trust unit rights incentive plan. Under this method, the fair value of the rights is
determined on the date in which fair value can reasonably be determined, generally being the grant date. This amount is charged to earnings
over the vesting period of the rights, with a corresponding increase in contributed surplus. When rights are exercised, the proceeds, together
with the amount recorded in contributed surplus, are recorded to unitholders’ capital.
2. CHANGES IN ACCOUNTING POLICIES
Current Year Accounting Changes
During 2009, the Fund adopted the following new accounting standard or amendments that were issued by the Canadian Institute of
Chartered Accountants (‘‘CICA’’): Handbook Section 3064, Goodwill and Intangible Assets, Section 3862, Financial Instruments –
Disclosures and Emerging Issues Committee 173 – Credit Risk and the Fair Value of Financial Assets and Financial Liabilities.
Goodwill and Intangible Assets
Section 3064 replaces Section 3062, Goodwill and Other Intangible Assets and Section 3450, Research and Development Costs. The new
Section establishes standards for the recognition, measurement, presentation and disclosure of goodwill and intangible assets subsequent to
its initial recognition. Standards concerning goodwill are unchanged from the standards included in the previous Section 3062. The adoption
of this new standard did not have a material impact on the Fund’s Consolidated Financial Statements.
Financial Instruments – Disclosures
Section 3862 was amended to include additional disclosure requirements about fair value measurement for financial instruments and
liquidity risk disclosures. These amendments require a three level hierarchy that reflects the significance of the inputs used in making the fair
value measurements. Fair values of assets and liabilities included in Level 1 are determined by reference to quoted prices in active markets for
ENERPLUS RESOURCES 2009 FINANCIAL SUMMARY 43
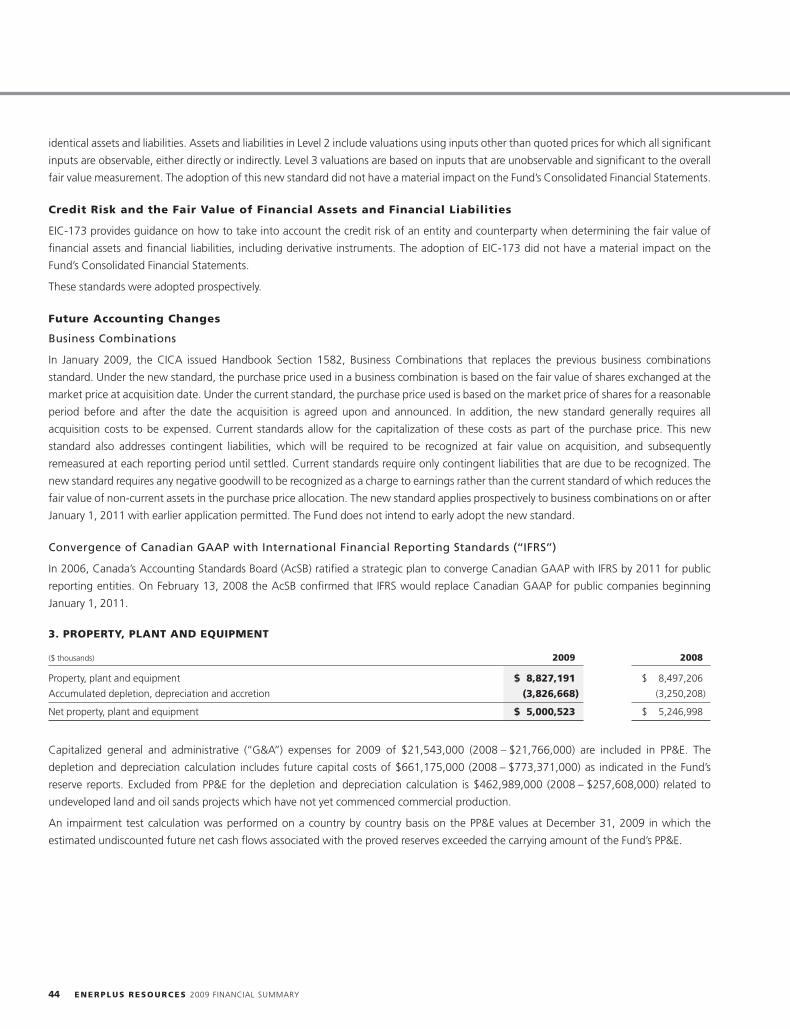
identical assets and liabilities. Assets and liabilities in Level 2 include valuations using inputs other than quoted prices for which all significant
inputs are observable, either directly or indirectly. Level 3 valuations are based on inputs that are unobservable and significant to the overall
fair value measurement. The adoption of this new standard did not have a material impact on the Fund’s Consolidated Financial Statements.
Credit Risk and the Fair Value of Financial Assets and Financial Liabilities
EIC-173 provides guidance on how to take into account the credit risk of an entity and counterparty when determining the fair value of
financial assets and financial liabilities, including derivative instruments. The adoption of EIC-173 did not have a material impact on the
Fund’s Consolidated Financial Statements.
These standards were adopted prospectively.
Future Accounting Changes
Business Combinations
In January 2009, the CICA issued Handbook Section 1582, Business Combinations that replaces the previous business combinations
standard. Under the new standard, the purchase price used in a business combination is based on the fair value of shares exchanged at the
market price at acquisition date. Under the current standard, the purchase price used is based on the market price of shares for a reasonable
period before and after the date the acquisition is agreed upon and announced. In addition, the new standard generally requires all
acquisition costs to be expensed. Current standards allow for the capitalization of these costs as part of the purchase price. This new
standard also addresses contingent liabilities, which will be required to be recognized at fair value on acquisition, and subsequently
remeasured at each reporting period until settled. Current standards require only contingent liabilities that are due to be recognized. The
new standard requires any negative goodwill to be recognized as a charge to earnings rather than the current standard of which reduces the
fair value of non-current assets in the purchase price allocation. The new standard applies prospectively to business combinations on or after
January 1, 2011 with earlier application permitted. The Fund does not intend to early adopt the new standard.
Convergence of Canadian GAAP with International Financial Reporting Standards (‘‘IFRS’’)
In 2006, Canada’s Accounting Standards Board (AcSB) ratified a strategic plan to converge Canadian GAAP with IFRS by 2011 for public
reporting entities. On February 13, 2008 the AcSB confirmed that IFRS would replace Canadian GAAP for public companies beginning
January 1, 2011.
3. PROPERTY, PLANT AND EQUIPMENT
($ thousands) 2009 2008
Property, plant and equipment $ 8,827,191 $ 8,497,206
Accumulated depletion, depreciation and accretion (3,826,668) (3,250,208)
Net property, plant and equipment $ 5,000,523 $ 5,246,998
Capitalized general and administrative (‘‘G&A’’) expenses for 2009 of $21,543,000 (2008 – $21,766,000) are included in PP&E. The
depletion and depreciation calculation includes future capital costs of $661,175,000 (2008 – $773,371,000) as indicated in the Fund’s
reserve reports. Excluded from PP&E for the depletion and depreciation calculation is $462,989,000 (2008 – $257,608,000) related to
undeveloped land and oil sands projects which have not yet commenced commercial production.
An impairment test calculation was performed on a country by country basis on the PP&E values at December 31, 2009 in which the
estimated undiscounted future net cash flows associated with the proved reserves exceeded the carrying amount of the Fund’s PP&E.
44 ENERPLUS RESOURCES 2009 FINANCIAL SUMMARY
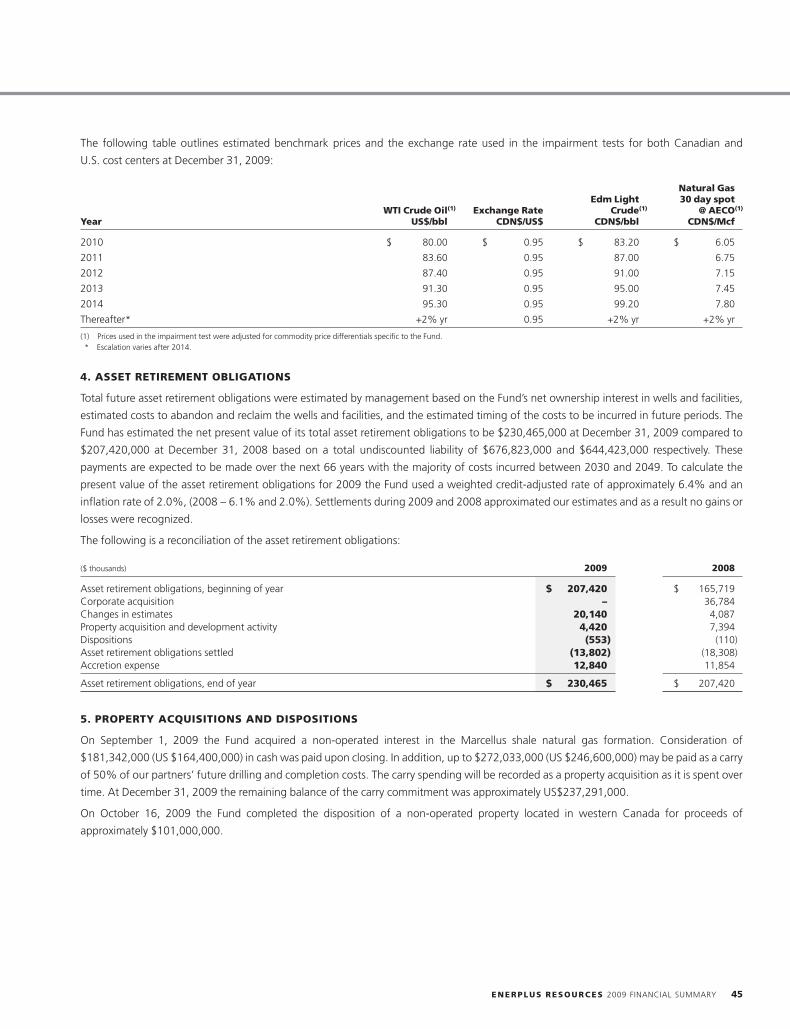
The following table outlines estimated benchmark prices and the exchange rate used in the impairment tests for both Canadian and
U.S. cost centers at December 31, 2009:
Natural GasEdm Light 30 day spot
WTI Crude Oil(1) Exchange Rate Crude(1) @ AECO(1)
Year US$/bbl CDN$/US$ CDN$/bbl CDN$/Mcf
2010 $ 80.00 $ 0.95 $ 83.20 $ 6.05
2011 83.60 0.95 87.00 6.75
2012 87.40 0.95 91.00 7.15
2013 91.30 0.95 95.00 7.45
2014 95.30 0.95 99.20 7.80
Thereafter* +2% yr 0.95 +2% yr +2% yr
(1) Prices used in the impairment test were adjusted for commodity price differentials specific to the Fund.* Escalation varies after 2014.
4. ASSET RETIREMENT OBLIGATIONS
Total future asset retirement obligations were estimated by management based on the Fund’s net ownership interest in wells and facilities,
estimated costs to abandon and reclaim the wells and facilities, and the estimated timing of the costs to be incurred in future periods. The
Fund has estimated the net present value of its total asset retirement obligations to be $230,465,000 at December 31, 2009 compared to
$207,420,000 at December 31, 2008 based on a total undiscounted liability of $676,823,000 and $644,423,000 respectively. These
payments are expected to be made over the next 66 years with the majority of costs incurred between 2030 and 2049. To calculate the
present value of the asset retirement obligations for 2009 the Fund used a weighted credit-adjusted rate of approximately 6.4% and an
inflation rate of 2.0%, (2008 – 6.1% and 2.0%). Settlements during 2009 and 2008 approximated our estimates and as a result no gains or
losses were recognized.
The following is a reconciliation of the asset retirement obligations:
($ thousands) 2009 2008
Asset retirement obligations, beginning of year $ 207,420 $ 165,719Corporate acquisition – 36,784Changes in estimates 20,140 4,087Property acquisition and development activity 4,420 7,394Dispositions (553) (110)Asset retirement obligations settled (13,802) (18,308)Accretion expense 12,840 11,854
Asset retirement obligations, end of year $ 230,465 $ 207,420
5. PROPERTY ACQUISITIONS AND DISPOSITIONS
On September 1, 2009 the Fund acquired a non-operated interest in the Marcellus shale natural gas formation. Consideration of
$181,342,000 (US $164,400,000) in cash was paid upon closing. In addition, up to $272,033,000 (US $246,600,000) may be paid as a carry
of 50% of our partners’ future drilling and completion costs. The carry spending will be recorded as a property acquisition as it is spent over
time. At December 31, 2009 the remaining balance of the carry commitment was approximately US$237,291,000.
On October 16, 2009 the Fund completed the disposition of a non-operated property located in western Canada for proceeds of
approximately $101,000,000.
ENERPLUS RESOURCES 2009 FINANCIAL SUMMARY 45
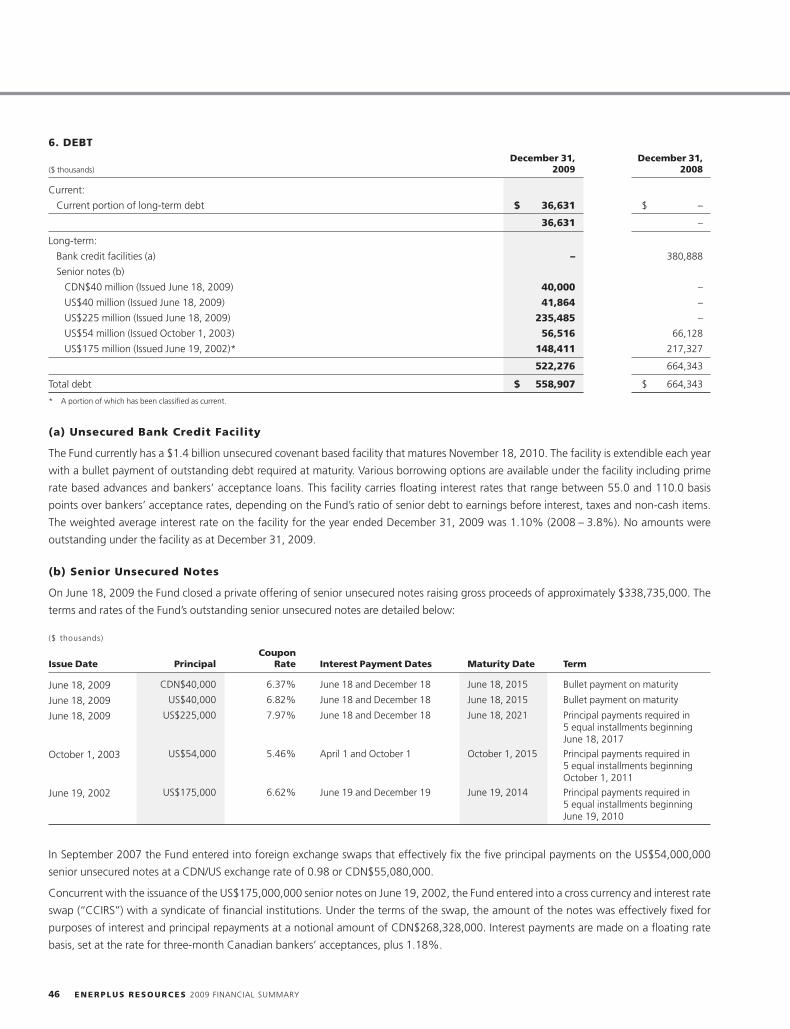
6. DEBTDecember 31, December 31,
($ thousands) 2009 2008
Current:
Current portion of long-term debt $ 36,631 $ –
36,631 –
Long-term:
Bank credit facilities (a) – 380,888
Senior notes (b)
CDN$40 million (Issued June 18, 2009) 40,000 –
US$40 million (Issued June 18, 2009) 41,864 –
US$225 million (Issued June 18, 2009) 235,485 –
US$54 million (Issued October 1, 2003) 56,516 66,128
US$175 million (Issued June 19, 2002)* 148,411 217,327
522,276 664,343
Total debt $ 558,907 $ 664,343
* A portion of which has been classified as current.
(a) Unsecured Bank Credit Facility
The Fund currently has a $1.4 billion unsecured covenant based facility that matures November 18, 2010. The facility is extendible each year
with a bullet payment of outstanding debt required at maturity. Various borrowing options are available under the facility including prime
rate based advances and bankers’ acceptance loans. This facility carries floating interest rates that range between 55.0 and 110.0 basis
points over bankers’ acceptance rates, depending on the Fund’s ratio of senior debt to earnings before interest, taxes and non-cash items.
The weighted average interest rate on the facility for the year ended December 31, 2009 was 1.10% (2008 – 3.8%). No amounts were
outstanding under the facility as at December 31, 2009.
(b) Senior Unsecured Notes
On June 18, 2009 the Fund closed a private offering of senior unsecured notes raising gross proceeds of approximately $338,735,000. The
terms and rates of the Fund’s outstanding senior unsecured notes are detailed below:
($ thousands)
CouponIssue Date Principal Rate Interest Payment Dates Maturity Date Term
CDN$40,000 6.37% June 18 and December 18 June 18, 2015 Bullet payment on maturityJune 18, 2009US$40,000 6.82% June 18 and December 18 June 18, 2015 Bullet payment on maturityJune 18, 2009
US$225,000 7.97% June 18 and December 18 June 18, 2021 Principal payments required inJune 18, 20095 equal installments beginningJune 18, 2017
US$54,000 5.46% April 1 and October 1 October 1, 2015 Principal payments required inOctober 1, 20035 equal installments beginningOctober 1, 2011
US$175,000 6.62% June 19 and December 19 June 19, 2014 Principal payments required inJune 19, 20025 equal installments beginningJune 19, 2010
In September 2007 the Fund entered into foreign exchange swaps that effectively fix the five principal payments on the US$54,000,000
senior unsecured notes at a CDN/US exchange rate of 0.98 or CDN$55,080,000.
Concurrent with the issuance of the US$175,000,000 senior notes on June 19, 2002, the Fund entered into a cross currency and interest rate
swap (‘‘CCIRS’’) with a syndicate of financial institutions. Under the terms of the swap, the amount of the notes was effectively fixed for
purposes of interest and principal repayments at a notional amount of CDN$268,328,000. Interest payments are made on a floating rate
basis, set at the rate for three-month Canadian bankers’ acceptances, plus 1.18%.
46 ENERPLUS RESOURCES 2009 FINANCIAL SUMMARY
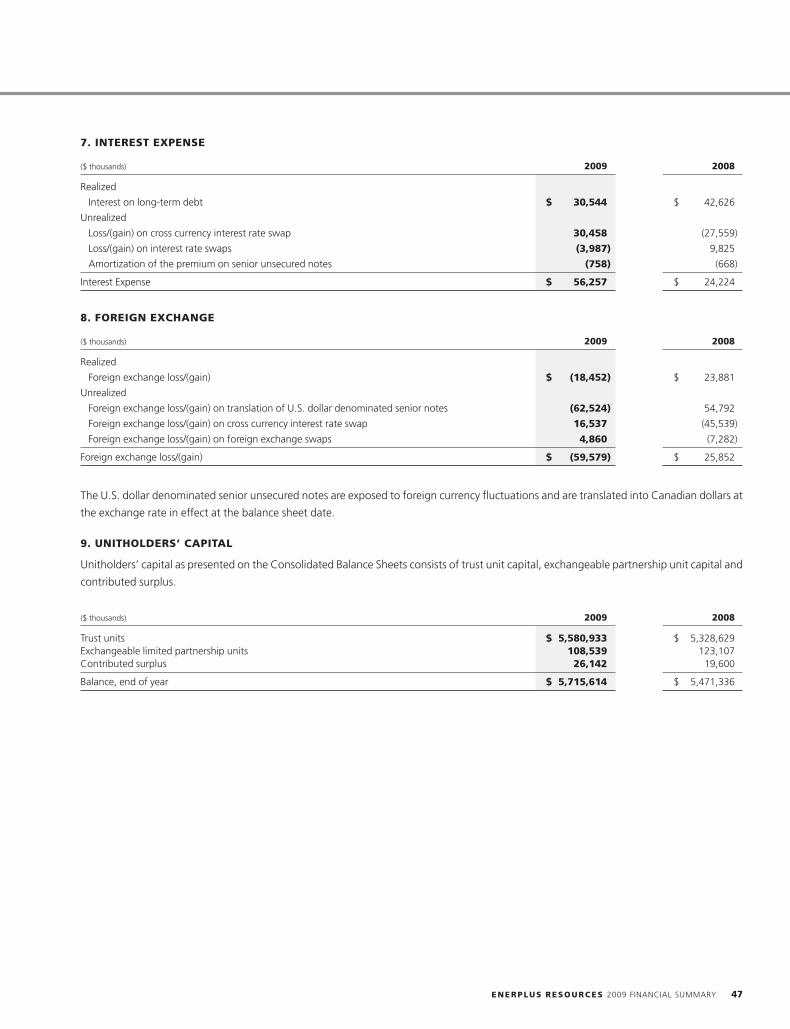
7. INTEREST EXPENSE
($ thousands) 2009 2008
Realized
Interest on long-term debt $ 30,544 $ 42,626
Unrealized
Loss/(gain) on cross currency interest rate swap 30,458 (27,559)
Loss/(gain) on interest rate swaps (3,987) 9,825
Amortization of the premium on senior unsecured notes (758) (668)
Interest Expense $ 56,257 $ 24,224
8. FOREIGN EXCHANGE
($ thousands) 2009 2008
Realized
Foreign exchange loss/(gain) $ (18,452) $ 23,881
Unrealized
Foreign exchange loss/(gain) on translation of U.S. dollar denominated senior notes (62,524) 54,792
Foreign exchange loss/(gain) on cross currency interest rate swap 16,537 (45,539)
Foreign exchange loss/(gain) on foreign exchange swaps 4,860 (7,282)
Foreign exchange loss/(gain) $ (59,579) $ 25,852
The U.S. dollar denominated senior unsecured notes are exposed to foreign currency fluctuations and are translated into Canadian dollars at
the exchange rate in effect at the balance sheet date.
9. UNITHOLDERS’ CAPITAL
Unitholders’ capital as presented on the Consolidated Balance Sheets consists of trust unit capital, exchangeable partnership unit capital and
contributed surplus.
($ thousands) 2009 2008
Trust units $ 5,580,933 $ 5,328,629Exchangeable limited partnership units 108,539 123,107Contributed surplus 26,142 19,600
Balance, end of year $ 5,715,614 $ 5,471,336
ENERPLUS RESOURCES 2009 FINANCIAL SUMMARY 47
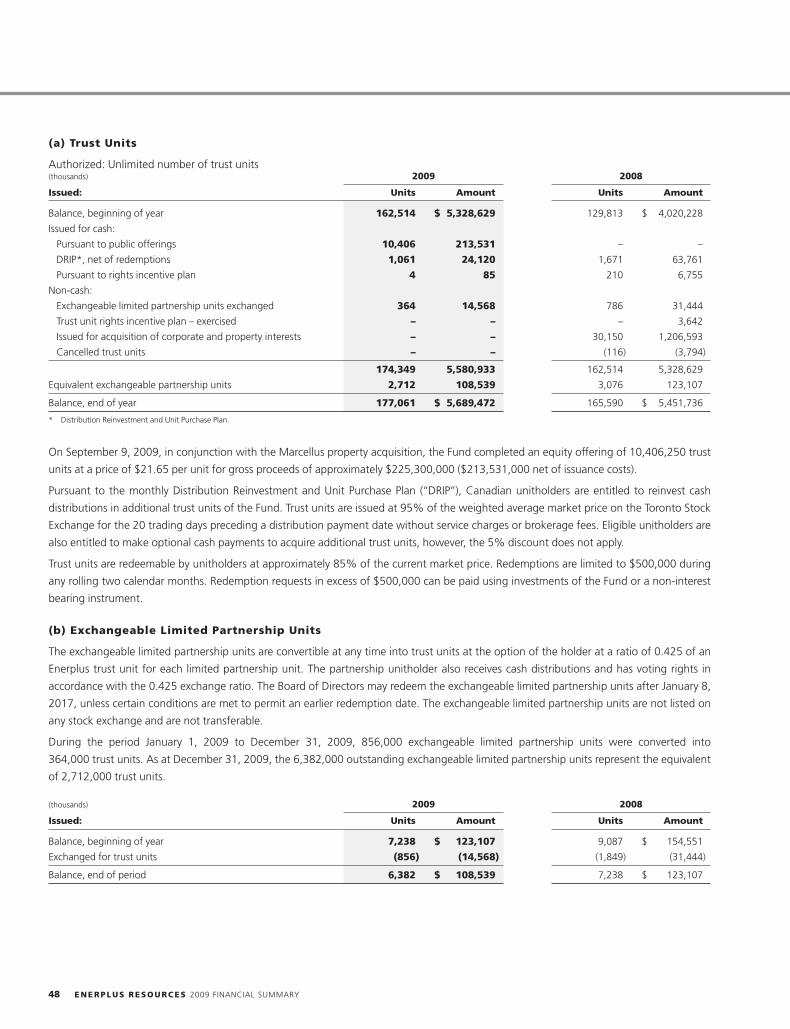
(a) Trust Units
Authorized: Unlimited number of trust units(thousands) 2009 2008
Issued: Units Amount Units Amount
Balance, beginning of year 162,514 $ 5,328,629 129,813 $ 4,020,228
Issued for cash:
Pursuant to public offerings 10,406 213,531 – –
DRIP*, net of redemptions 1,061 24,120 1,671 63,761
Pursuant to rights incentive plan 4 85 210 6,755
Non-cash:
Exchangeable limited partnership units exchanged 364 14,568 786 31,444
Trust unit rights incentive plan – exercised – – – 3,642
Issued for acquisition of corporate and property interests – – 30,150 1,206,593
Cancelled trust units – – (116) (3,794)
174,349 5,580,933 162,514 5,328,629
Equivalent exchangeable partnership units 2,712 108,539 3,076 123,107
Balance, end of year 177,061 $ 5,689,472 165,590 $ 5,451,736
* Distribution Reinvestment and Unit Purchase Plan.
On September 9, 2009, in conjunction with the Marcellus property acquisition, the Fund completed an equity offering of 10,406,250 trust
units at a price of $21.65 per unit for gross proceeds of approximately $225,300,000 ($213,531,000 net of issuance costs).
Pursuant to the monthly Distribution Reinvestment and Unit Purchase Plan (‘‘DRIP’’), Canadian unitholders are entitled to reinvest cash
distributions in additional trust units of the Fund. Trust units are issued at 95% of the weighted average market price on the Toronto Stock
Exchange for the 20 trading days preceding a distribution payment date without service charges or brokerage fees. Eligible unitholders are
also entitled to make optional cash payments to acquire additional trust units, however, the 5% discount does not apply.
Trust units are redeemable by unitholders at approximately 85% of the current market price. Redemptions are limited to $500,000 during
any rolling two calendar months. Redemption requests in excess of $500,000 can be paid using investments of the Fund or a non-interest
bearing instrument.
(b) Exchangeable Limited Partnership Units
The exchangeable limited partnership units are convertible at any time into trust units at the option of the holder at a ratio of 0.425 of an
Enerplus trust unit for each limited partnership unit. The partnership unitholder also receives cash distributions and has voting rights in
accordance with the 0.425 exchange ratio. The Board of Directors may redeem the exchangeable limited partnership units after January 8,
2017, unless certain conditions are met to permit an earlier redemption date. The exchangeable limited partnership units are not listed on
any stock exchange and are not transferable.
During the period January 1, 2009 to December 31, 2009, 856,000 exchangeable limited partnership units were converted into
364,000 trust units. As at December 31, 2009, the 6,382,000 outstanding exchangeable limited partnership units represent the equivalent
of 2,712,000 trust units.
(thousands) 2009 2008
Issued: Units Amount Units Amount
Balance, beginning of year 7,238 $ 123,107 9,087 $ 154,551
Exchanged for trust units (856) (14,568) (1,849) (31,444)
Balance, end of period 6,382 $ 108,539 7,238 $ 123,107
48 ENERPLUS RESOURCES 2009 FINANCIAL SUMMARY
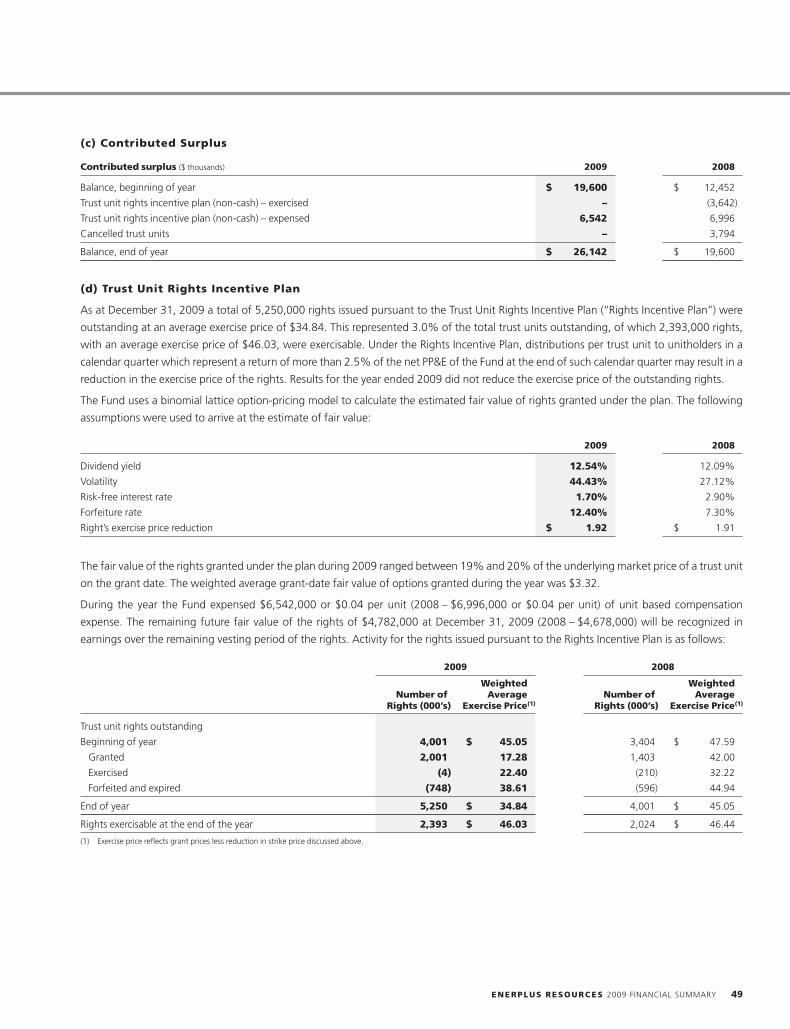
(c) Contributed Surplus
Contributed surplus ($ thousands) 2009 2008
Balance, beginning of year $ 19,600 $ 12,452
Trust unit rights incentive plan (non-cash) – exercised – (3,642)
Trust unit rights incentive plan (non-cash) – expensed 6,542 6,996
Cancelled trust units – 3,794
Balance, end of year $ 26,142 $ 19,600
(d) Trust Unit Rights Incentive Plan
As at December 31, 2009 a total of 5,250,000 rights issued pursuant to the Trust Unit Rights Incentive Plan (‘‘Rights Incentive Plan’’) were
outstanding at an average exercise price of $34.84. This represented 3.0% of the total trust units outstanding, of which 2,393,000 rights,
with an average exercise price of $46.03, were exercisable. Under the Rights Incentive Plan, distributions per trust unit to unitholders in a
calendar quarter which represent a return of more than 2.5% of the net PP&E of the Fund at the end of such calendar quarter may result in a
reduction in the exercise price of the rights. Results for the year ended 2009 did not reduce the exercise price of the outstanding rights.
The Fund uses a binomial lattice option-pricing model to calculate the estimated fair value of rights granted under the plan. The following
assumptions were used to arrive at the estimate of fair value:
2009 2008
Dividend yield 12.54% 12.09%
Volatility 44.43% 27.12%
Risk-free interest rate 1.70% 2.90%
Forfeiture rate 12.40% 7.30%
Right’s exercise price reduction $ 1.92 $ 1.91
The fair value of the rights granted under the plan during 2009 ranged between 19% and 20% of the underlying market price of a trust unit
on the grant date. The weighted average grant-date fair value of options granted during the year was $3.32.
During the year the Fund expensed $6,542,000 or $0.04 per unit (2008 – $6,996,000 or $0.04 per unit) of unit based compensation
expense. The remaining future fair value of the rights of $4,782,000 at December 31, 2009 (2008 – $4,678,000) will be recognized in
earnings over the remaining vesting period of the rights. Activity for the rights issued pursuant to the Rights Incentive Plan is as follows:
2009 2008
Weighted WeightedNumber of Average Number of Average
Rights (000’s) Exercise Price(1) Rights (000’s) Exercise Price(1)
Trust unit rights outstanding
Beginning of year 4,001 $ 45.05 3,404 $ 47.59
Granted 2,001 17.28 1,403 42.00
Exercised (4) 22.40 (210) 32.22
Forfeited and expired (748) 38.61 (596) 44.94
End of year 5,250 $ 34.84 4,001 $ 45.05
Rights exercisable at the end of the year 2,393 $ 46.03 2,024 $ 46.44
(1) Exercise price reflects grant prices less reduction in strike price discussed above.
ENERPLUS RESOURCES 2009 FINANCIAL SUMMARY 49
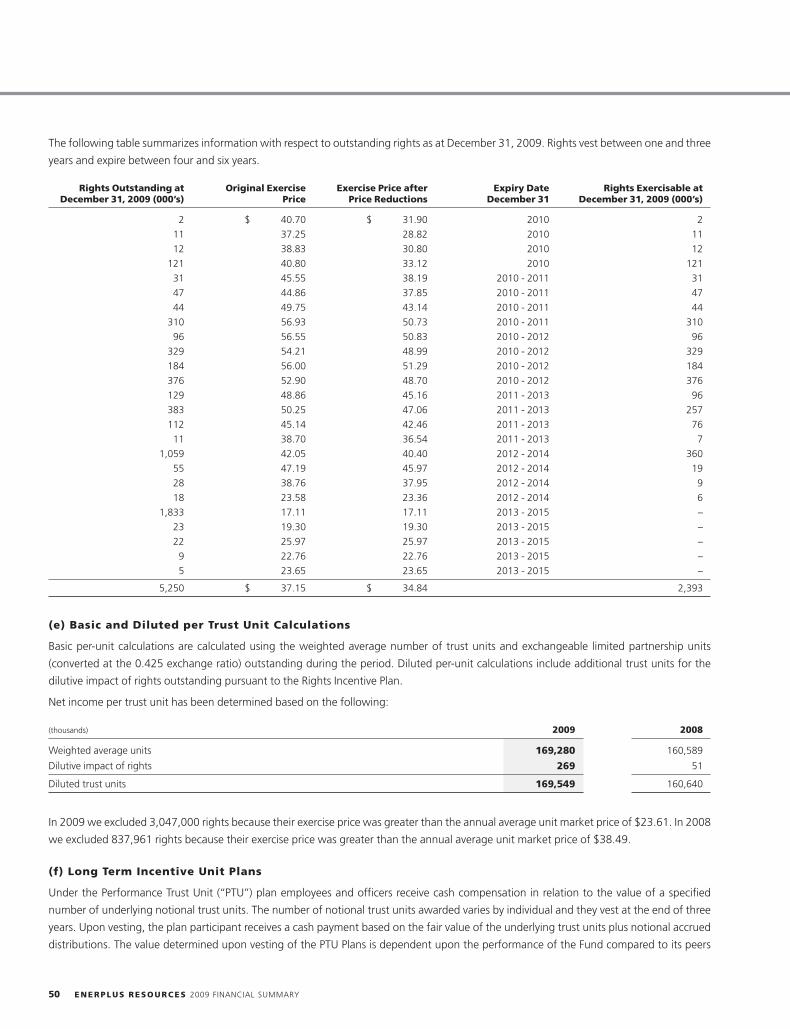
The following table summarizes information with respect to outstanding rights as at December 31, 2009. Rights vest between one and three
years and expire between four and six years.
Rights Outstanding at Original Exercise Exercise Price after Expiry Date Rights Exercisable atDecember 31, 2009 (000’s) Price Price Reductions December 31 December 31, 2009 (000’s)
2 $ 40.70 $ 31.90 2010 2
11 37.25 28.82 2010 11
12 38.83 30.80 2010 12
121 40.80 33.12 2010 121
31 45.55 38.19 2010 - 2011 31
47 44.86 37.85 2010 - 2011 47
44 49.75 43.14 2010 - 2011 44
310 56.93 50.73 2010 - 2011 310
96 56.55 50.83 2010 - 2012 96
329 54.21 48.99 2010 - 2012 329
184 56.00 51.29 2010 - 2012 184
376 52.90 48.70 2010 - 2012 376
129 48.86 45.16 2011 - 2013 96
383 50.25 47.06 2011 - 2013 257
112 45.14 42.46 2011 - 2013 76
11 38.70 36.54 2011 - 2013 7
1,059 42.05 40.40 2012 - 2014 360
55 47.19 45.97 2012 - 2014 19
28 38.76 37.95 2012 - 2014 9
18 23.58 23.36 2012 - 2014 6
1,833 17.11 17.11 2013 - 2015 –
23 19.30 19.30 2013 - 2015 –
22 25.97 25.97 2013 - 2015 –
9 22.76 22.76 2013 - 2015 –
5 23.65 23.65 2013 - 2015 –
5,250 $ 37.15 $ 34.84 2,393
(e) Basic and Diluted per Trust Unit Calculations
Basic per-unit calculations are calculated using the weighted average number of trust units and exchangeable limited partnership units
(converted at the 0.425 exchange ratio) outstanding during the period. Diluted per-unit calculations include additional trust units for the
dilutive impact of rights outstanding pursuant to the Rights Incentive Plan.
Net income per trust unit has been determined based on the following:
(thousands) 2009 2008
Weighted average units 169,280 160,589
Dilutive impact of rights 269 51
Diluted trust units 169,549 160,640
In 2009 we excluded 3,047,000 rights because their exercise price was greater than the annual average unit market price of $23.61. In 2008
we excluded 837,961 rights because their exercise price was greater than the annual average unit market price of $38.49.
(f) Long Term Incentive Unit Plans
Under the Performance Trust Unit (‘‘PTU’’) plan employees and officers receive cash compensation in relation to the value of a specified
number of underlying notional trust units. The number of notional trust units awarded varies by individual and they vest at the end of three
years. Upon vesting, the plan participant receives a cash payment based on the fair value of the underlying trust units plus notional accrued
distributions. The value determined upon vesting of the PTU Plans is dependent upon the performance of the Fund compared to its peers
50 ENERPLUS RESOURCES 2009 FINANCIAL SUMMARY
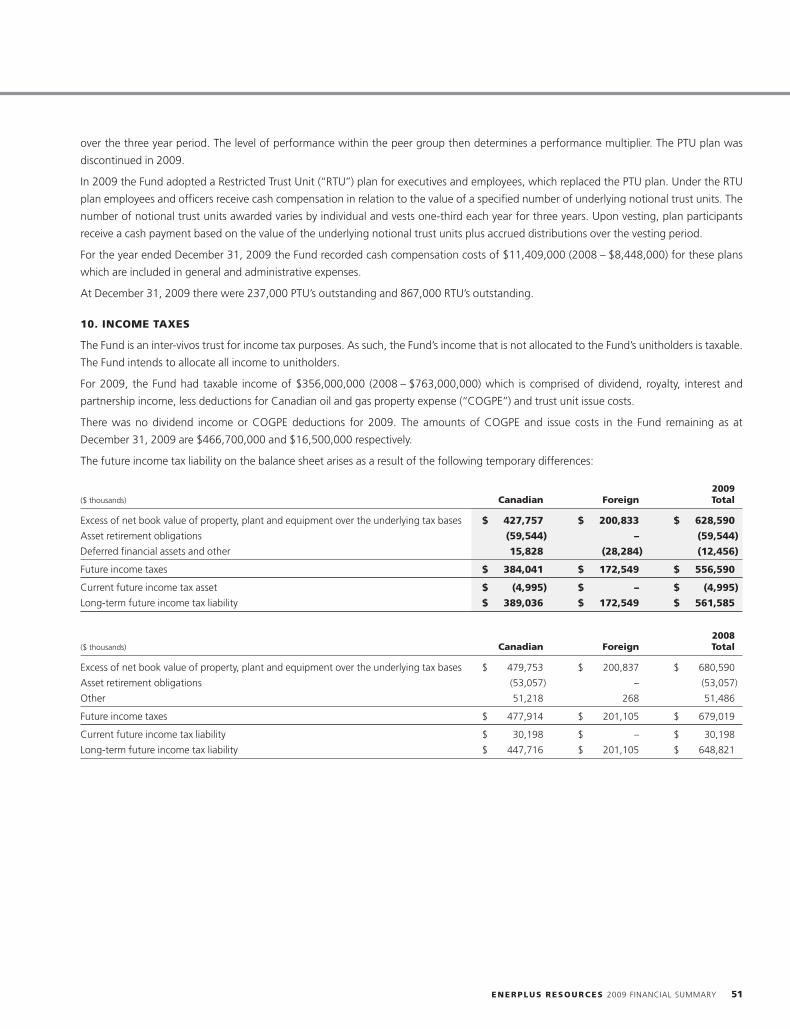
over the three year period. The level of performance within the peer group then determines a performance multiplier. The PTU plan was
discontinued in 2009.
In 2009 the Fund adopted a Restricted Trust Unit (‘‘RTU’’) plan for executives and employees, which replaced the PTU plan. Under the RTU
plan employees and officers receive cash compensation in relation to the value of a specified number of underlying notional trust units. The
number of notional trust units awarded varies by individual and vests one-third each year for three years. Upon vesting, plan participants
receive a cash payment based on the value of the underlying notional trust units plus accrued distributions over the vesting period.
For the year ended December 31, 2009 the Fund recorded cash compensation costs of $11,409,000 (2008 – $8,448,000) for these plans
which are included in general and administrative expenses.
At December 31, 2009 there were 237,000 PTU’s outstanding and 867,000 RTU’s outstanding.
10. INCOME TAXES
The Fund is an inter-vivos trust for income tax purposes. As such, the Fund’s income that is not allocated to the Fund’s unitholders is taxable.
The Fund intends to allocate all income to unitholders.
For 2009, the Fund had taxable income of $356,000,000 (2008 – $763,000,000) which is comprised of dividend, royalty, interest and
partnership income, less deductions for Canadian oil and gas property expense (‘‘COGPE’’) and trust unit issue costs.
There was no dividend income or COGPE deductions for 2009. The amounts of COGPE and issue costs in the Fund remaining as at
December 31, 2009 are $466,700,000 and $16,500,000 respectively.
The future income tax liability on the balance sheet arises as a result of the following temporary differences:
2009($ thousands) Canadian Foreign Total
Excess of net book value of property, plant and equipment over the underlying tax bases $ 427,757 $ 200,833 $ 628,590
Asset retirement obligations (59,544) – (59,544)
Deferred financial assets and other 15,828 (28,284) (12,456)
Future income taxes $ 384,041 $ 172,549 $ 556,590
Current future income tax asset $ (4,995) $ – $ (4,995)
Long-term future income tax liability $ 389,036 $ 172,549 $ 561,585
2008($ thousands) Canadian Foreign Total
Excess of net book value of property, plant and equipment over the underlying tax bases $ 479,753 $ 200,837 $ 680,590
Asset retirement obligations (53,057) – (53,057)
Other 51,218 268 51,486
Future income taxes $ 477,914 $ 201,105 $ 679,019
Current future income tax liability $ 30,198 $ – $ 30,198
Long-term future income tax liability $ 447,716 $ 201,105 $ 648,821
ENERPLUS RESOURCES 2009 FINANCIAL SUMMARY 51
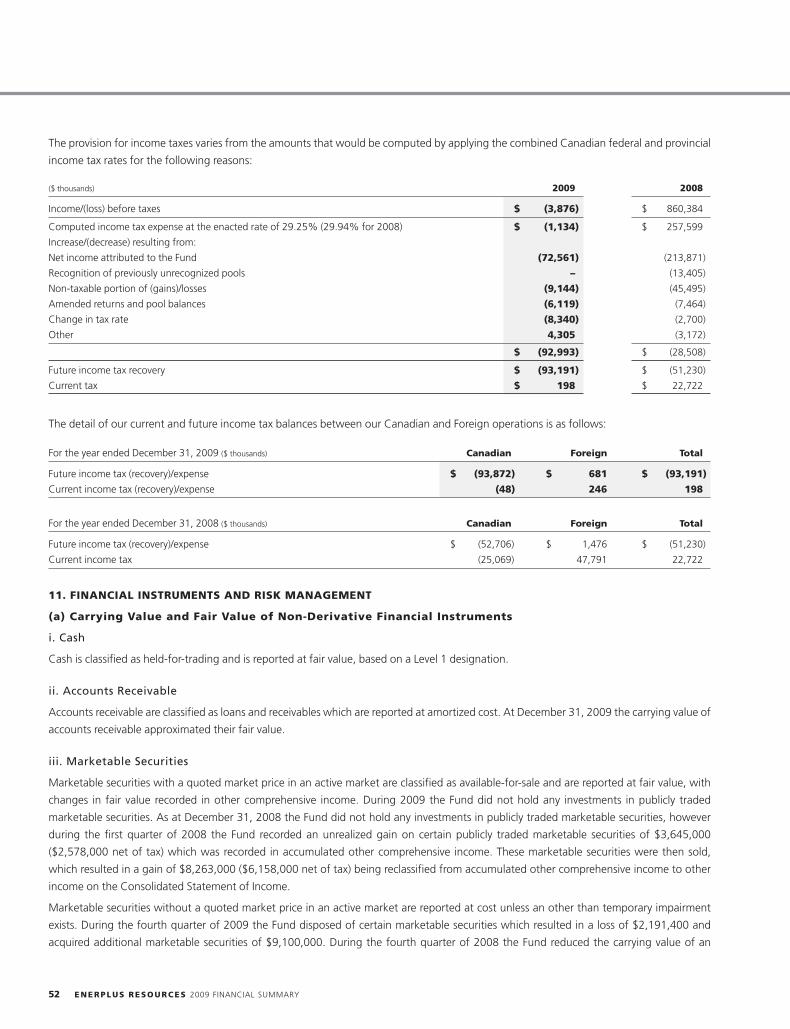
The provision for income taxes varies from the amounts that would be computed by applying the combined Canadian federal and provincial
income tax rates for the following reasons:
($ thousands) 2009 2008
Income/(loss) before taxes $ (3,876) $ 860,384
Computed income tax expense at the enacted rate of 29.25% (29.94% for 2008) $ (1,134) $ 257,599
Increase/(decrease) resulting from:
Net income attributed to the Fund (72,561) (213,871)
Recognition of previously unrecognized pools – (13,405)
Non-taxable portion of (gains)/losses (9,144) (45,495)
Amended returns and pool balances (6,119) (7,464)
Change in tax rate (8,340) (2,700)
Other 4,305 (3,172)
$ (92,993) $ (28,508)
Future income tax recovery $ (93,191) $ (51,230)
Current tax $ 198 $ 22,722
The detail of our current and future income tax balances between our Canadian and Foreign operations is as follows:
For the year ended December 31, 2009 ($ thousands) Canadian Foreign Total
Future income tax (recovery)/expense $ (93,872) $ 681 $ (93,191)
Current income tax (recovery)/expense (48) 246 198
For the year ended December 31, 2008 ($ thousands) Canadian Foreign Total
Future income tax (recovery)/expense $ (52,706) $ 1,476 $ (51,230)
Current income tax (25,069) 47,791 22,722
11. FINANCIAL INSTRUMENTS AND RISK MANAGEMENT
(a) Carrying Value and Fair Value of Non-Derivative Financial Instruments
i. Cash
Cash is classified as held-for-trading and is reported at fair value, based on a Level 1 designation.
ii. Accounts Receivable
Accounts receivable are classified as loans and receivables which are reported at amortized cost. At December 31, 2009 the carrying value of
accounts receivable approximated their fair value.
iii. Marketable Securities
Marketable securities with a quoted market price in an active market are classified as available-for-sale and are reported at fair value, with
changes in fair value recorded in other comprehensive income. During 2009 the Fund did not hold any investments in publicly traded
marketable securities. As at December 31, 2008 the Fund did not hold any investments in publicly traded marketable securities, however
during the first quarter of 2008 the Fund recorded an unrealized gain on certain publicly traded marketable securities of $3,645,000
($2,578,000 net of tax) which was recorded in accumulated other comprehensive income. These marketable securities were then sold,
which resulted in a gain of $8,263,000 ($6,158,000 net of tax) being reclassified from accumulated other comprehensive income to other
income on the Consolidated Statement of Income.
Marketable securities without a quoted market price in an active market are reported at cost unless an other than temporary impairment
exists. During the fourth quarter of 2009 the Fund disposed of certain marketable securities which resulted in a loss of $2,191,400 and
acquired additional marketable securities of $9,100,000. During the fourth quarter of 2008 the Fund reduced the carrying value of an
52 ENERPLUS RESOURCES 2009 FINANCIAL SUMMARY
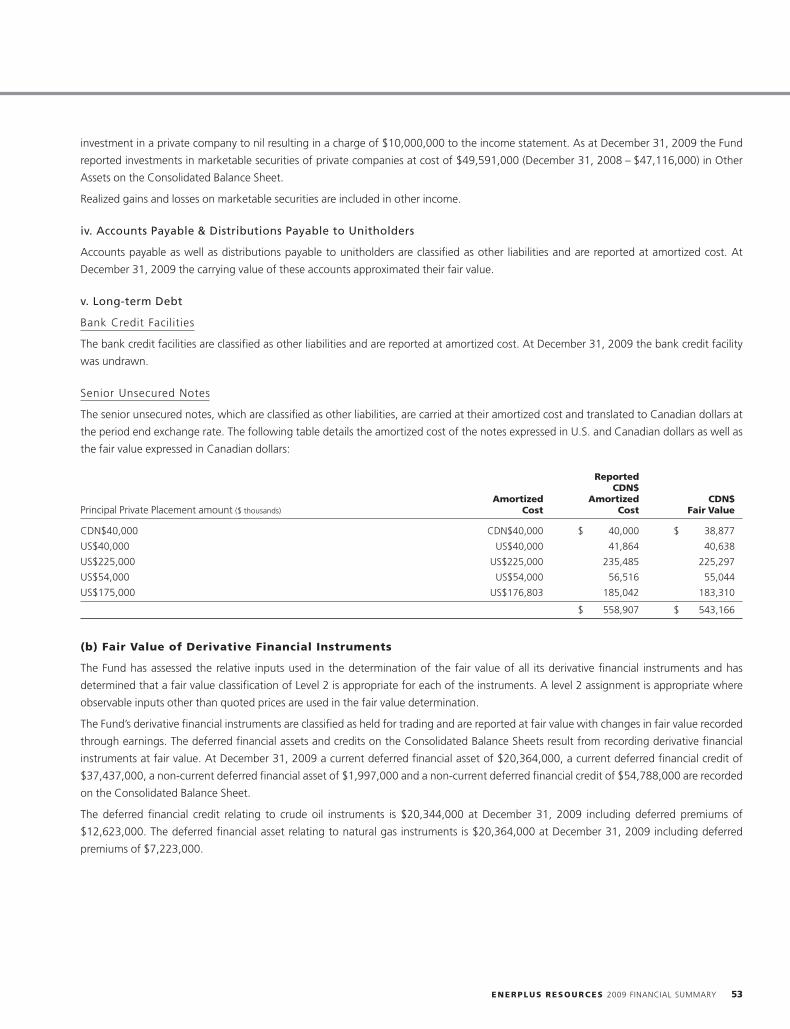
investment in a private company to nil resulting in a charge of $10,000,000 to the income statement. As at December 31, 2009 the Fund
reported investments in marketable securities of private companies at cost of $49,591,000 (December 31, 2008 – $47,116,000) in Other
Assets on the Consolidated Balance Sheet.
Realized gains and losses on marketable securities are included in other income.
iv. Accounts Payable & Distributions Payable to Unitholders
Accounts payable as well as distributions payable to unitholders are classified as other liabilities and are reported at amortized cost. At
December 31, 2009 the carrying value of these accounts approximated their fair value.
v. Long-term Debt
Bank Credit Facilities
The bank credit facilities are classified as other liabilities and are reported at amortized cost. At December 31, 2009 the bank credit facility
was undrawn.
Senior Unsecured Notes
The senior unsecured notes, which are classified as other liabilities, are carried at their amortized cost and translated to Canadian dollars at
the period end exchange rate. The following table details the amortized cost of the notes expressed in U.S. and Canadian dollars as well as
the fair value expressed in Canadian dollars:
ReportedCDN$
Amortized Amortized CDN$Principal Private Placement amount ($ thousands) Cost Cost Fair Value
CDN$40,000 CDN$40,000 $ 40,000 $ 38,877
US$40,000 US$40,000 41,864 40,638
US$225,000 US$225,000 235,485 225,297
US$54,000 US$54,000 56,516 55,044
US$175,000 US$176,803 185,042 183,310
$ 558,907 $ 543,166
(b) Fair Value of Derivative Financial Instruments
The Fund has assessed the relative inputs used in the determination of the fair value of all its derivative financial instruments and has
determined that a fair value classification of Level 2 is appropriate for each of the instruments. A level 2 assignment is appropriate where
observable inputs other than quoted prices are used in the fair value determination.
The Fund’s derivative financial instruments are classified as held for trading and are reported at fair value with changes in fair value recorded
through earnings. The deferred financial assets and credits on the Consolidated Balance Sheets result from recording derivative financial
instruments at fair value. At December 31, 2009 a current deferred financial asset of $20,364,000, a current deferred financial credit of
$37,437,000, a non-current deferred financial asset of $1,997,000 and a non-current deferred financial credit of $54,788,000 are recorded
on the Consolidated Balance Sheet.
The deferred financial credit relating to crude oil instruments is $20,344,000 at December 31, 2009 including deferred premiums of
$12,623,000. The deferred financial asset relating to natural gas instruments is $20,364,000 at December 31, 2009 including deferred
premiums of $7,223,000.
ENERPLUS RESOURCES 2009 FINANCIAL SUMMARY 53
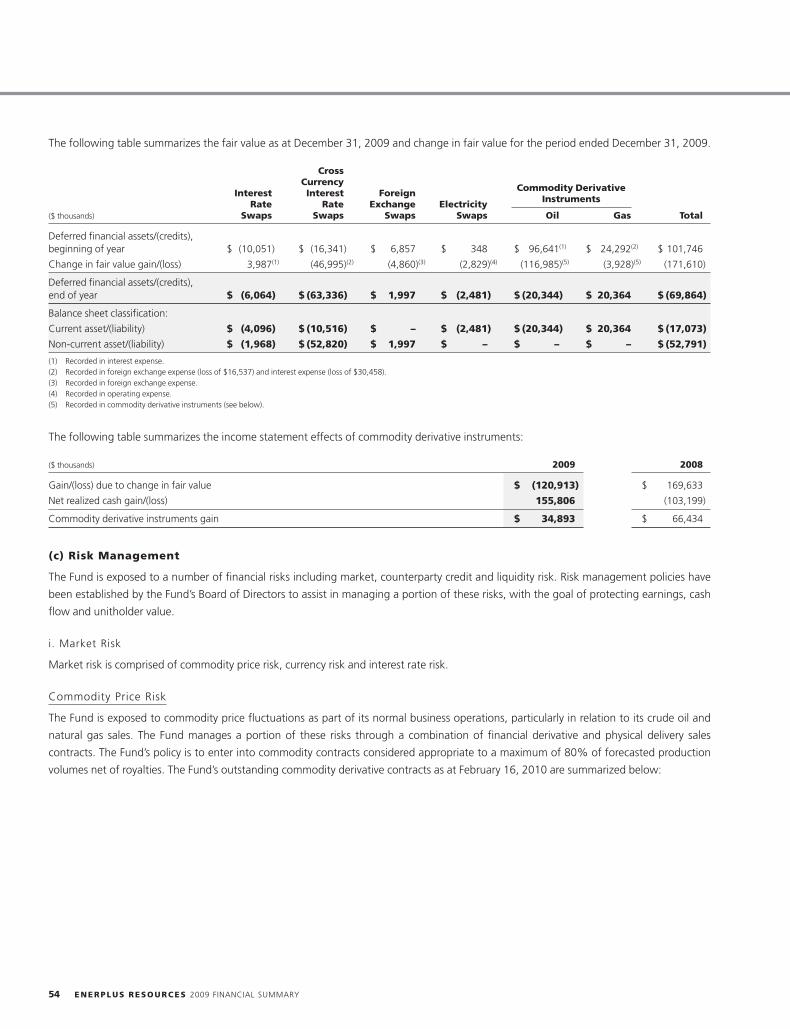
The following table summarizes the fair value as at December 31, 2009 and change in fair value for the period ended December 31, 2009.
CrossCurrency
Commodity DerivativeInterest Interest ForeignInstrumentsRate Rate Exchange Electricity
($ thousands) Swaps Swaps Swaps Swaps Oil Gas Total
Deferred financial assets/(credits),beginning of year $ (10,051) $ (16,341) $ 6,857 $ 348 $ 96,641(1) $ 24,292(2) $ 101,746
Change in fair value gain/(loss) 3,987(1) (46,995)(2) (4,860)(3) (2,829)(4) (116,985)(5) (3,928)(5) (171,610)
Deferred financial assets/(credits),end of year $ (6,064) $ (63,336) $ 1,997 $ (2,481) $ (20,344) $ 20,364 $ (69,864)
Balance sheet classification:
Current asset/(liability) $ (4,096) $ (10,516) $ – $ (2,481) $ (20,344) $ 20,364 $ (17,073)
Non-current asset/(liability) $ (1,968) $ (52,820) $ 1,997 $ – $ – $ – $ (52,791)
(1) Recorded in interest expense.(2) Recorded in foreign exchange expense (loss of $16,537) and interest expense (loss of $30,458).(3) Recorded in foreign exchange expense.(4) Recorded in operating expense.(5) Recorded in commodity derivative instruments (see below).
The following table summarizes the income statement effects of commodity derivative instruments:
($ thousands) 2009 2008
Gain/(loss) due to change in fair value $ (120,913) $ 169,633
Net realized cash gain/(loss) 155,806 (103,199)
Commodity derivative instruments gain $ 34,893 $ 66,434
(c) Risk Management
The Fund is exposed to a number of financial risks including market, counterparty credit and liquidity risk. Risk management policies have
been established by the Fund’s Board of Directors to assist in managing a portion of these risks, with the goal of protecting earnings, cash
flow and unitholder value.
i. Market Risk
Market risk is comprised of commodity price risk, currency risk and interest rate risk.
Commodity Price Risk
The Fund is exposed to commodity price fluctuations as part of its normal business operations, particularly in relation to its crude oil and
natural gas sales. The Fund manages a portion of these risks through a combination of financial derivative and physical delivery sales
contracts. The Fund’s policy is to enter into commodity contracts considered appropriate to a maximum of 80% of forecasted production
volumes net of royalties. The Fund’s outstanding commodity derivative contracts as at February 16, 2010 are summarized below:
54 ENERPLUS RESOURCES 2009 FINANCIAL SUMMARY
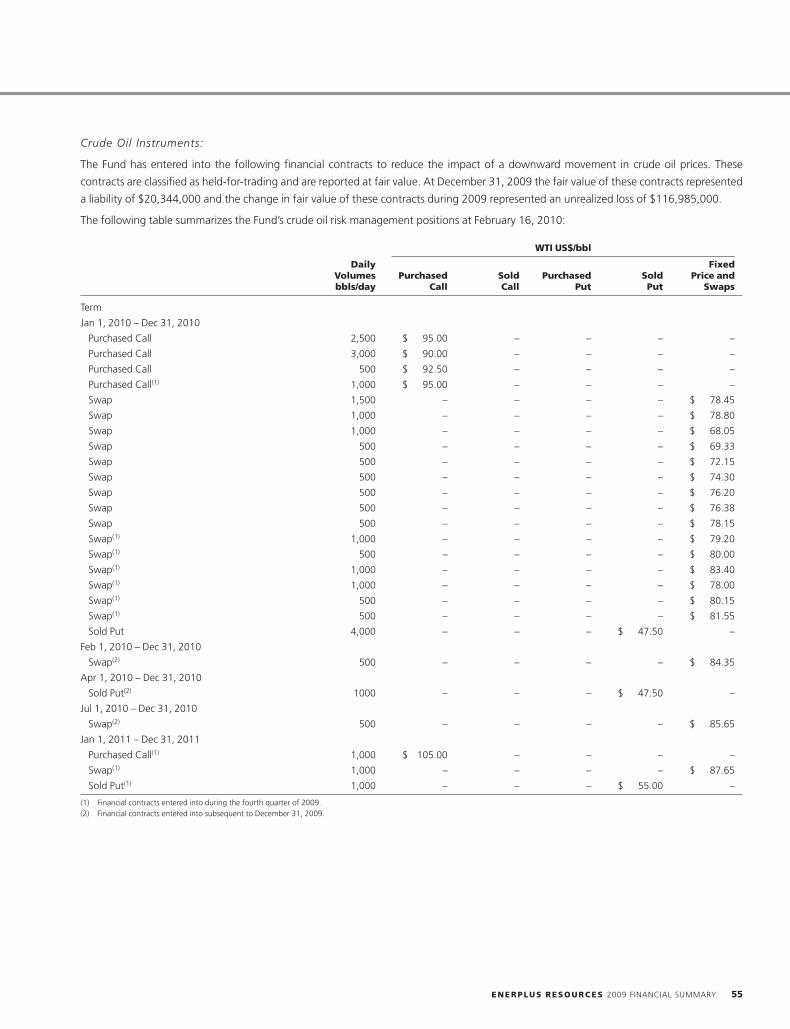
Crude Oil Instruments:
The Fund has entered into the following financial contracts to reduce the impact of a downward movement in crude oil prices. These
contracts are classified as held-for-trading and are reported at fair value. At December 31, 2009 the fair value of these contracts represented
a liability of $20,344,000 and the change in fair value of these contracts during 2009 represented an unrealized loss of $116,985,000.
The following table summarizes the Fund’s crude oil risk management positions at February 16, 2010:
WTI US$/bbl
Daily FixedVolumes Purchased Sold Purchased Sold Price andbbls/day Call Call Put Put Swaps
Term
Jan 1, 2010 – Dec 31, 2010
Purchased Call 2,500 $ 95.00 – – – –
Purchased Call 3,000 $ 90.00 – – – –
Purchased Call 500 $ 92.50 – – – –
Purchased Call(1) 1,000 $ 95.00 – – – –
Swap 1,500 – – – – $ 78.45
Swap 1,000 – – – – $ 78.80
Swap 1,000 – – – – $ 68.05
Swap 500 – – – – $ 69.33
Swap 500 – – – – $ 72.15
Swap 500 – – – – $ 74.30
Swap 500 – – – – $ 76.20
Swap 500 – – – – $ 76.38
Swap 500 – – – – $ 78.15
Swap(1) 1,000 – – – – $ 79.20
Swap(1) 500 – – – – $ 80.00
Swap(1) 1,000 – – – – $ 83.40
Swap(1) 1,000 – – – – $ 78.00
Swap(1) 500 – – – – $ 80.15
Swap(1) 500 – – – – $ 81.55
Sold Put 4,000 – – – $ 47.50 –
Feb 1, 2010 – Dec 31, 2010
Swap(2) 500 – – – – $ 84.35
Apr 1, 2010 – Dec 31, 2010
Sold Put(2) 1000 – – – $ 47.50 –
Jul 1, 2010 – Dec 31, 2010
Swap(2) 500 – – – – $ 85.65
Jan 1, 2011 – Dec 31, 2011
Purchased Call(1) 1,000 $ 105.00 – – – –
Swap(1) 1,000 – – – – $ 87.65
Sold Put(1) 1,000 – – – $ 55.00 –
(1) Financial contracts entered into during the fourth quarter of 2009.(2) Financial contracts entered into subsequent to December 31, 2009.
ENERPLUS RESOURCES 2009 FINANCIAL SUMMARY 55
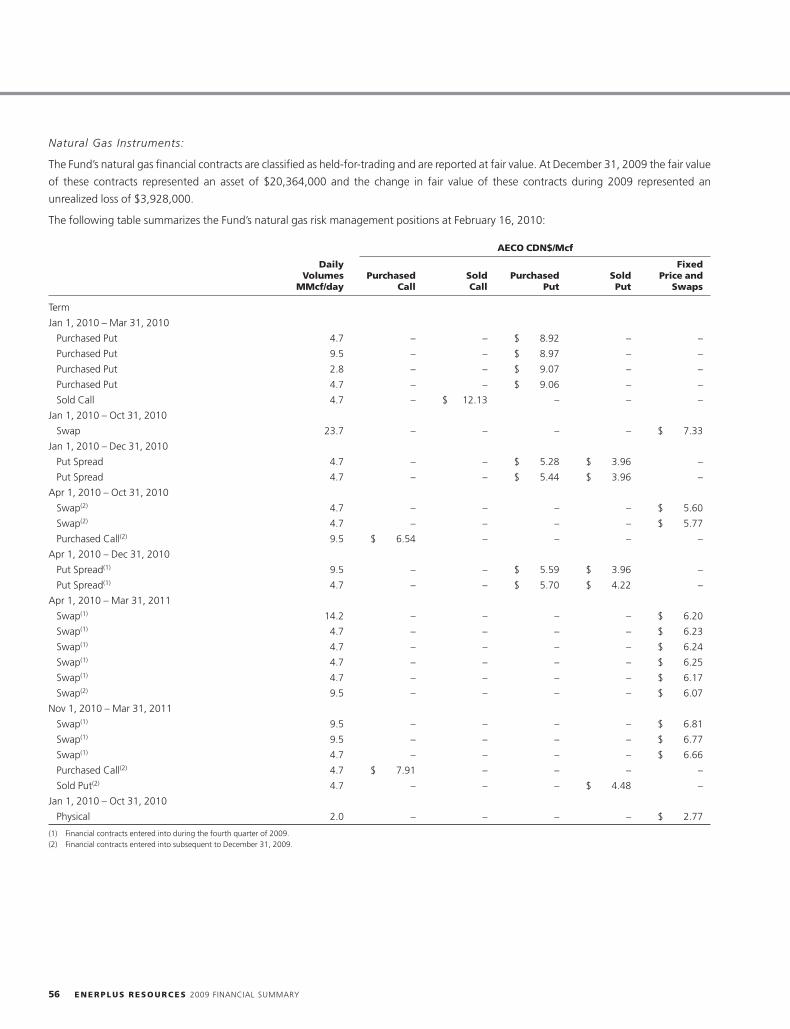
Natural Gas Instruments:
The Fund’s natural gas financial contracts are classified as held-for-trading and are reported at fair value. At December 31, 2009 the fair value
of these contracts represented an asset of $20,364,000 and the change in fair value of these contracts during 2009 represented an
unrealized loss of $3,928,000.
The following table summarizes the Fund’s natural gas risk management positions at February 16, 2010:
AECO CDN$/Mcf
Daily FixedVolumes Purchased Sold Purchased Sold Price and
MMcf/day Call Call Put Put Swaps
Term
Jan 1, 2010 – Mar 31, 2010
Purchased Put 4.7 – – $ 8.92 – –
Purchased Put 9.5 – – $ 8.97 – –
Purchased Put 2.8 – – $ 9.07 – –
Purchased Put 4.7 – – $ 9.06 – –
Sold Call 4.7 – $ 12.13 – – –
Jan 1, 2010 – Oct 31, 2010
Swap 23.7 – – – – $ 7.33
Jan 1, 2010 – Dec 31, 2010
Put Spread 4.7 – – $ 5.28 $ 3.96 –
Put Spread 4.7 – – $ 5.44 $ 3.96 –
Apr 1, 2010 – Oct 31, 2010
Swap(2) 4.7 – – – – $ 5.60
Swap(2) 4.7 – – – – $ 5.77
Purchased Call(2) 9.5 $ 6.54 – – – –
Apr 1, 2010 – Dec 31, 2010
Put Spread(1) 9.5 – – $ 5.59 $ 3.96 –
Put Spread(1) 4.7 – – $ 5.70 $ 4.22 –
Apr 1, 2010 – Mar 31, 2011
Swap(1) 14.2 – – – – $ 6.20
Swap(1) 4.7 – – – – $ 6.23
Swap(1) 4.7 – – – – $ 6.24
Swap(1) 4.7 – – – – $ 6.25
Swap(1) 4.7 – – – – $ 6.17
Swap(2) 9.5 – – – – $ 6.07
Nov 1, 2010 – Mar 31, 2011
Swap(1) 9.5 – – – – $ 6.81
Swap(1) 9.5 – – – – $ 6.77
Swap(1) 4.7 – – – – $ 6.66
Purchased Call(2) 4.7 $ 7.91 – – – –
Sold Put(2) 4.7 – – – $ 4.48 –
Jan 1, 2010 – Oct 31, 2010
Physical 2.0 – – – – $ 2.77
(1) Financial contracts entered into during the fourth quarter of 2009.(2) Financial contracts entered into subsequent to December 31, 2009.
56 ENERPLUS RESOURCES 2009 FINANCIAL SUMMARY
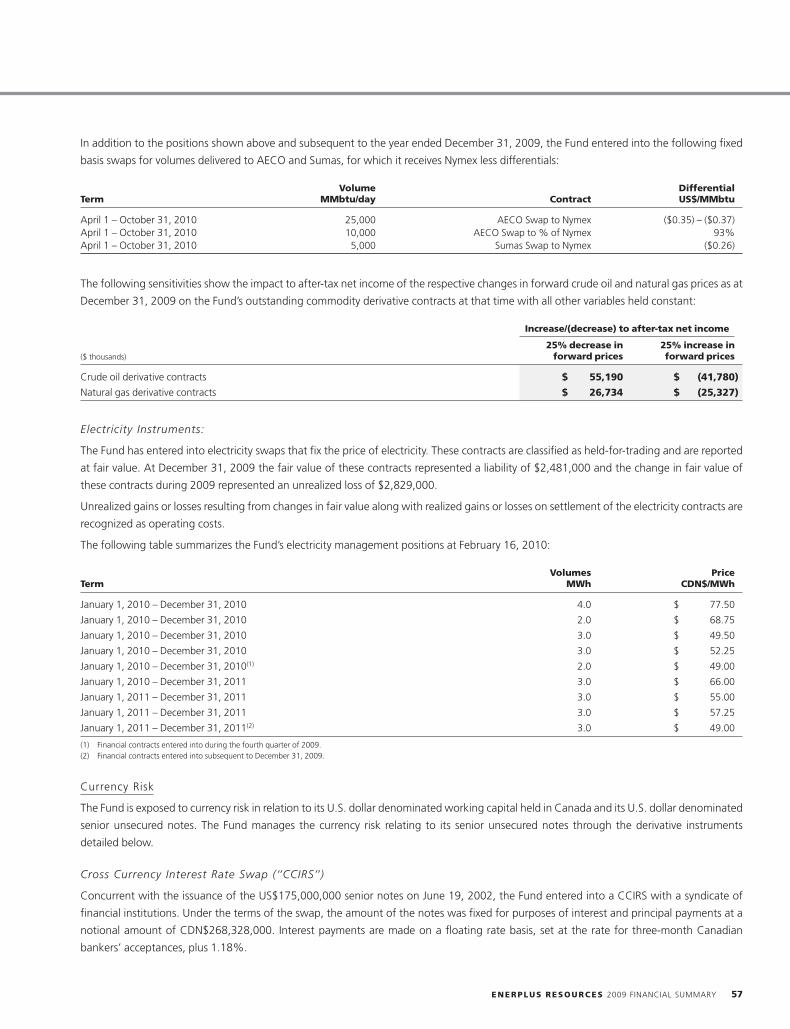
In addition to the positions shown above and subsequent to the year ended December 31, 2009, the Fund entered into the following fixed
basis swaps for volumes delivered to AECO and Sumas, for which it receives Nymex less differentials:
Volume DifferentialTerm MMbtu/day Contract US$/MMbtu
April 1 – October 31, 2010 25,000 AECO Swap to Nymex ($0.35) – ($0.37)April 1 – October 31, 2010 10,000 AECO Swap to % of Nymex 93%April 1 – October 31, 2010 5,000 Sumas Swap to Nymex ($0.26)
The following sensitivities show the impact to after-tax net income of the respective changes in forward crude oil and natural gas prices as at
December 31, 2009 on the Fund’s outstanding commodity derivative contracts at that time with all other variables held constant:
Increase/(decrease) to after-tax net income
25% decrease in 25% increase in($ thousands) forward prices forward prices
Crude oil derivative contracts $ 55,190 $ (41,780)
Natural gas derivative contracts $ 26,734 $ (25,327)
Electricity Instruments:
The Fund has entered into electricity swaps that fix the price of electricity. These contracts are classified as held-for-trading and are reported
at fair value. At December 31, 2009 the fair value of these contracts represented a liability of $2,481,000 and the change in fair value of
these contracts during 2009 represented an unrealized loss of $2,829,000.
Unrealized gains or losses resulting from changes in fair value along with realized gains or losses on settlement of the electricity contracts are
recognized as operating costs.
The following table summarizes the Fund’s electricity management positions at February 16, 2010:
Volumes PriceTerm MWh CDN$/MWh
January 1, 2010 – December 31, 2010 4.0 $ 77.50
January 1, 2010 – December 31, 2010 2.0 $ 68.75
January 1, 2010 – December 31, 2010 3.0 $ 49.50
January 1, 2010 – December 31, 2010 3.0 $ 52.25
January 1, 2010 – December 31, 2010(1) 2.0 $ 49.00
January 1, 2010 – December 31, 2011 3.0 $ 66.00
January 1, 2011 – December 31, 2011 3.0 $ 55.00
January 1, 2011 – December 31, 2011 3.0 $ 57.25
January 1, 2011 – December 31, 2011(2) 3.0 $ 49.00
(1) Financial contracts entered into during the fourth quarter of 2009.(2) Financial contracts entered into subsequent to December 31, 2009.
Currency Risk
The Fund is exposed to currency risk in relation to its U.S. dollar denominated working capital held in Canada and its U.S. dollar denominated
senior unsecured notes. The Fund manages the currency risk relating to its senior unsecured notes through the derivative instruments
detailed below.
Cross Currency Interest Rate Swap (‘‘CCIRS’’)
Concurrent with the issuance of the US$175,000,000 senior notes on June 19, 2002, the Fund entered into a CCIRS with a syndicate of
financial institutions. Under the terms of the swap, the amount of the notes was fixed for purposes of interest and principal payments at a
notional amount of CDN$268,328,000. Interest payments are made on a floating rate basis, set at the rate for three-month Canadian
bankers’ acceptances, plus 1.18%.
ENERPLUS RESOURCES 2009 FINANCIAL SUMMARY 57
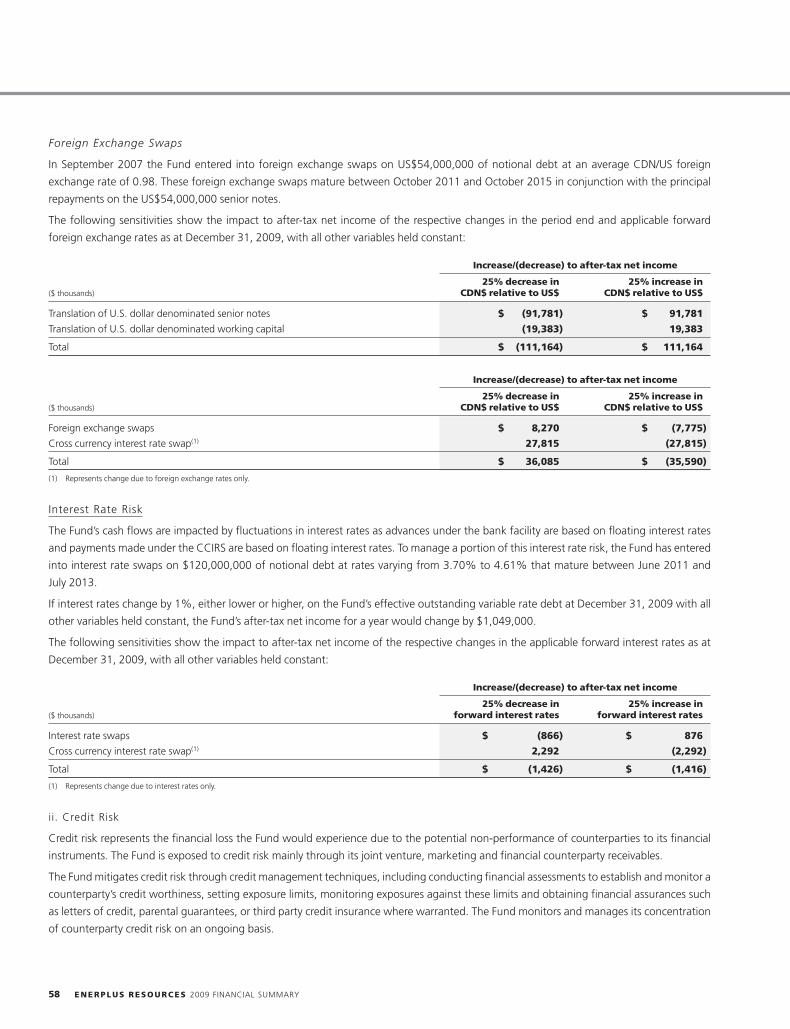
Foreign Exchange Swaps
In September 2007 the Fund entered into foreign exchange swaps on US$54,000,000 of notional debt at an average CDN/US foreign
exchange rate of 0.98. These foreign exchange swaps mature between October 2011 and October 2015 in conjunction with the principal
repayments on the US$54,000,000 senior notes.
The following sensitivities show the impact to after-tax net income of the respective changes in the period end and applicable forward
foreign exchange rates as at December 31, 2009, with all other variables held constant:
Increase/(decrease) to after-tax net income
25% decrease in 25% increase in($ thousands) CDN$ relative to US$ CDN$ relative to US$
Translation of U.S. dollar denominated senior notes $ (91,781) $ 91,781
Translation of U.S. dollar denominated working capital (19,383) 19,383
Total $ (111,164) $ 111,164
Increase/(decrease) to after-tax net income
25% decrease in 25% increase in($ thousands) CDN$ relative to US$ CDN$ relative to US$
Foreign exchange swaps $ 8,270 $ (7,775)
Cross currency interest rate swap(1) 27,815 (27,815)
Total $ 36,085 $ (35,590)
(1) Represents change due to foreign exchange rates only.
Interest Rate Risk
The Fund’s cash flows are impacted by fluctuations in interest rates as advances under the bank facility are based on floating interest rates
and payments made under the CCIRS are based on floating interest rates. To manage a portion of this interest rate risk, the Fund has entered
into interest rate swaps on $120,000,000 of notional debt at rates varying from 3.70% to 4.61% that mature between June 2011 and
July 2013.
If interest rates change by 1%, either lower or higher, on the Fund’s effective outstanding variable rate debt at December 31, 2009 with all
other variables held constant, the Fund’s after-tax net income for a year would change by $1,049,000.
The following sensitivities show the impact to after-tax net income of the respective changes in the applicable forward interest rates as at
December 31, 2009, with all other variables held constant:
Increase/(decrease) to after-tax net income
25% decrease in 25% increase in($ thousands) forward interest rates forward interest rates
Interest rate swaps $ (866) $ 876
Cross currency interest rate swap(1) 2,292 (2,292)
Total $ (1,426) $ (1,416)
(1) Represents change due to interest rates only.
ii. Credit Risk
Credit risk represents the financial loss the Fund would experience due to the potential non-performance of counterparties to its financial
instruments. The Fund is exposed to credit risk mainly through its joint venture, marketing and financial counterparty receivables.
The Fund mitigates credit risk through credit management techniques, including conducting financial assessments to establish and monitor a
counterparty’s credit worthiness, setting exposure limits, monitoring exposures against these limits and obtaining financial assurances such
as letters of credit, parental guarantees, or third party credit insurance where warranted. The Fund monitors and manages its concentration
of counterparty credit risk on an ongoing basis.
58 ENERPLUS RESOURCES 2009 FINANCIAL SUMMARY
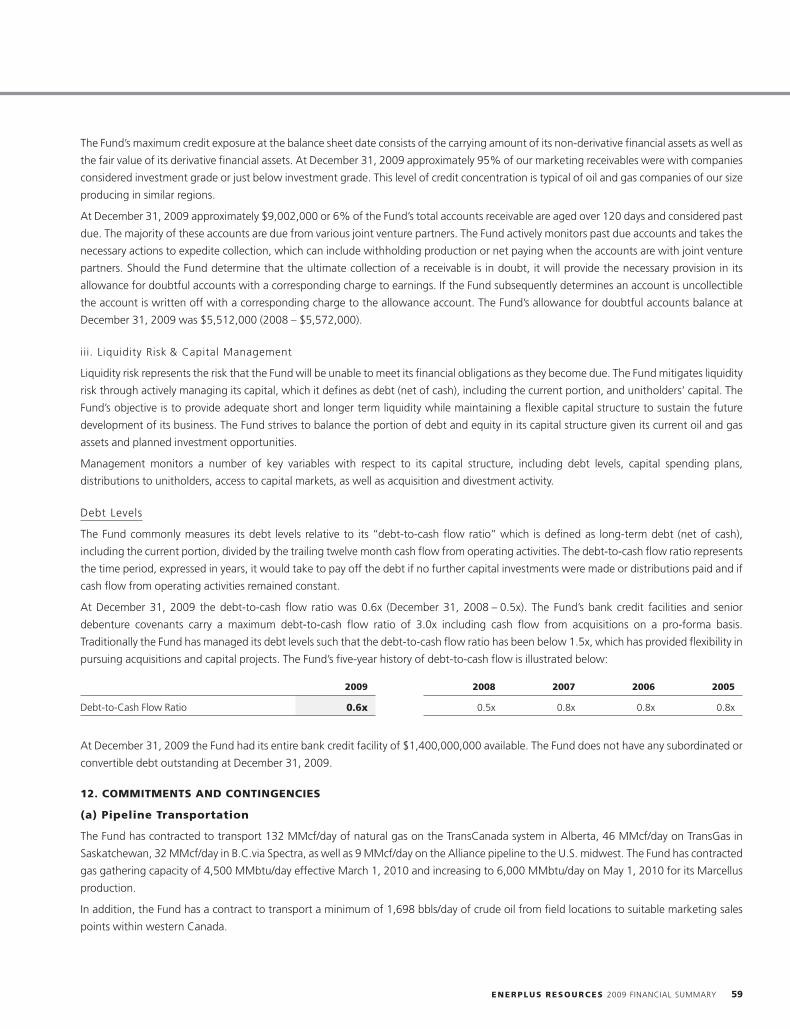
The Fund’s maximum credit exposure at the balance sheet date consists of the carrying amount of its non-derivative financial assets as well as
the fair value of its derivative financial assets. At December 31, 2009 approximately 95% of our marketing receivables were with companies
considered investment grade or just below investment grade. This level of credit concentration is typical of oil and gas companies of our size
producing in similar regions.
At December 31, 2009 approximately $9,002,000 or 6% of the Fund’s total accounts receivable are aged over 120 days and considered past
due. The majority of these accounts are due from various joint venture partners. The Fund actively monitors past due accounts and takes the
necessary actions to expedite collection, which can include withholding production or net paying when the accounts are with joint venture
partners. Should the Fund determine that the ultimate collection of a receivable is in doubt, it will provide the necessary provision in its
allowance for doubtful accounts with a corresponding charge to earnings. If the Fund subsequently determines an account is uncollectible
the account is written off with a corresponding charge to the allowance account. The Fund’s allowance for doubtful accounts balance at
December 31, 2009 was $5,512,000 (2008 – $5,572,000).
iii. Liquidity Risk & Capital Management
Liquidity risk represents the risk that the Fund will be unable to meet its financial obligations as they become due. The Fund mitigates liquidity
risk through actively managing its capital, which it defines as debt (net of cash), including the current portion, and unitholders’ capital. The
Fund’s objective is to provide adequate short and longer term liquidity while maintaining a flexible capital structure to sustain the future
development of its business. The Fund strives to balance the portion of debt and equity in its capital structure given its current oil and gas
assets and planned investment opportunities.
Management monitors a number of key variables with respect to its capital structure, including debt levels, capital spending plans,
distributions to unitholders, access to capital markets, as well as acquisition and divestment activity.
Debt Levels
The Fund commonly measures its debt levels relative to its ‘‘debt-to-cash flow ratio’’ which is defined as long-term debt (net of cash),
including the current portion, divided by the trailing twelve month cash flow from operating activities. The debt-to-cash flow ratio represents
the time period, expressed in years, it would take to pay off the debt if no further capital investments were made or distributions paid and if
cash flow from operating activities remained constant.
At December 31, 2009 the debt-to-cash flow ratio was 0.6x (December 31, 2008 – 0.5x). The Fund’s bank credit facilities and senior
debenture covenants carry a maximum debt-to-cash flow ratio of 3.0x including cash flow from acquisitions on a pro-forma basis.
Traditionally the Fund has managed its debt levels such that the debt-to-cash flow ratio has been below 1.5x, which has provided flexibility in
pursuing acquisitions and capital projects. The Fund’s five-year history of debt-to-cash flow is illustrated below:
2009 2008 2007 2006 2005
Debt-to-Cash Flow Ratio 0.6x 0.5x 0.8x 0.8x 0.8x
At December 31, 2009 the Fund had its entire bank credit facility of $1,400,000,000 available. The Fund does not have any subordinated or
convertible debt outstanding at December 31, 2009.
12. COMMITMENTS AND CONTINGENCIES
(a) Pipeline Transportation
The Fund has contracted to transport 132 MMcf/day of natural gas on the TransCanada system in Alberta, 46 MMcf/day on TransGas in
Saskatchewan, 32 MMcf/day in B.C.via Spectra, as well as 9 MMcf/day on the Alliance pipeline to the U.S. midwest. The Fund has contracted
gas gathering capacity of 4,500 MMbtu/day effective March 1, 2010 and increasing to 6,000 MMbtu/day on May 1, 2010 for its Marcellus
production.
In addition, the Fund has a contract to transport a minimum of 1,698 bbls/day of crude oil from field locations to suitable marketing sales
points within western Canada.
ENERPLUS RESOURCES 2009 FINANCIAL SUMMARY 59
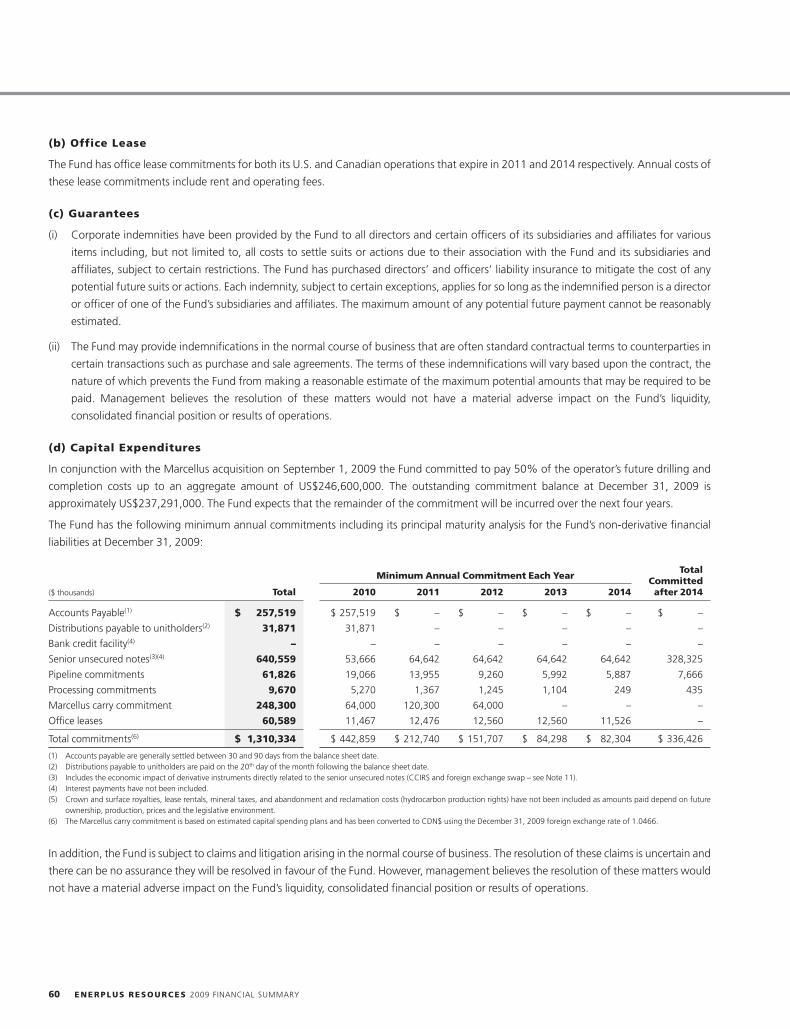
(b) Office Lease
The Fund has office lease commitments for both its U.S. and Canadian operations that expire in 2011 and 2014 respectively. Annual costs of
these lease commitments include rent and operating fees.
(c) Guarantees
(i) Corporate indemnities have been provided by the Fund to all directors and certain officers of its subsidiaries and affiliates for various
items including, but not limited to, all costs to settle suits or actions due to their association with the Fund and its subsidiaries and
affiliates, subject to certain restrictions. The Fund has purchased directors’ and officers’ liability insurance to mitigate the cost of any
potential future suits or actions. Each indemnity, subject to certain exceptions, applies for so long as the indemnified person is a director
or officer of one of the Fund’s subsidiaries and affiliates. The maximum amount of any potential future payment cannot be reasonably
estimated.
(ii) The Fund may provide indemnifications in the normal course of business that are often standard contractual terms to counterparties in
certain transactions such as purchase and sale agreements. The terms of these indemnifications will vary based upon the contract, the
nature of which prevents the Fund from making a reasonable estimate of the maximum potential amounts that may be required to be
paid. Management believes the resolution of these matters would not have a material adverse impact on the Fund’s liquidity,
consolidated financial position or results of operations.
(d) Capital Expenditures
In conjunction with the Marcellus acquisition on September 1, 2009 the Fund committed to pay 50% of the operator’s future drilling and
completion costs up to an aggregate amount of US$246,600,000. The outstanding commitment balance at December 31, 2009 is
approximately US$237,291,000. The Fund expects that the remainder of the commitment will be incurred over the next four years.
The Fund has the following minimum annual commitments including its principal maturity analysis for the Fund’s non-derivative financial
liabilities at December 31, 2009:
TotalMinimum Annual Commitment Each Year Committed
($ thousands) Total 2010 2011 2012 2013 2014 after 2014
Accounts Payable(1) $ 257,519 $ 257,519 $ – $ – $ – $ – $ –
Distributions payable to unitholders(2) 31,871 31,871 – – – – –
Bank credit facility(4) – – – – – – –
Senior unsecured notes(3)(4) 640,559 53,666 64,642 64,642 64,642 64,642 328,325
Pipeline commitments 61,826 19,066 13,955 9,260 5,992 5,887 7,666
Processing commitments 9,670 5,270 1,367 1,245 1,104 249 435
Marcellus carry commitment 248,300 64,000 120,300 64,000 – – –
Office leases 60,589 11,467 12,476 12,560 12,560 11,526 –
Total commitments(6) $ 1,310,334 $ 442,859 $ 212,740 $ 151,707 $ 84,298 $ 82,304 $ 336,426
(1) Accounts payable are generally settled between 30 and 90 days from the balance sheet date.(2) Distributions payable to unitholders are paid on the 20th day of the month following the balance sheet date.(3) Includes the economic impact of derivative instruments directly related to the senior unsecured notes (CCIRS and foreign exchange swap – see Note 11).(4) Interest payments have not been included.(5) Crown and surface royalties, lease rentals, mineral taxes, and abandonment and reclamation costs (hydrocarbon production rights) have not been included as amounts paid depend on future
ownership, production, prices and the legislative environment.(6) The Marcellus carry commitment is based on estimated capital spending plans and has been converted to CDN$ using the December 31, 2009 foreign exchange rate of 1.0466.
In addition, the Fund is subject to claims and litigation arising in the normal course of business. The resolution of these claims is uncertain and
there can be no assurance they will be resolved in favour of the Fund. However, management believes the resolution of these matters would
not have a material adverse impact on the Fund’s liquidity, consolidated financial position or results of operations.
60 ENERPLUS RESOURCES 2009 FINANCIAL SUMMARY
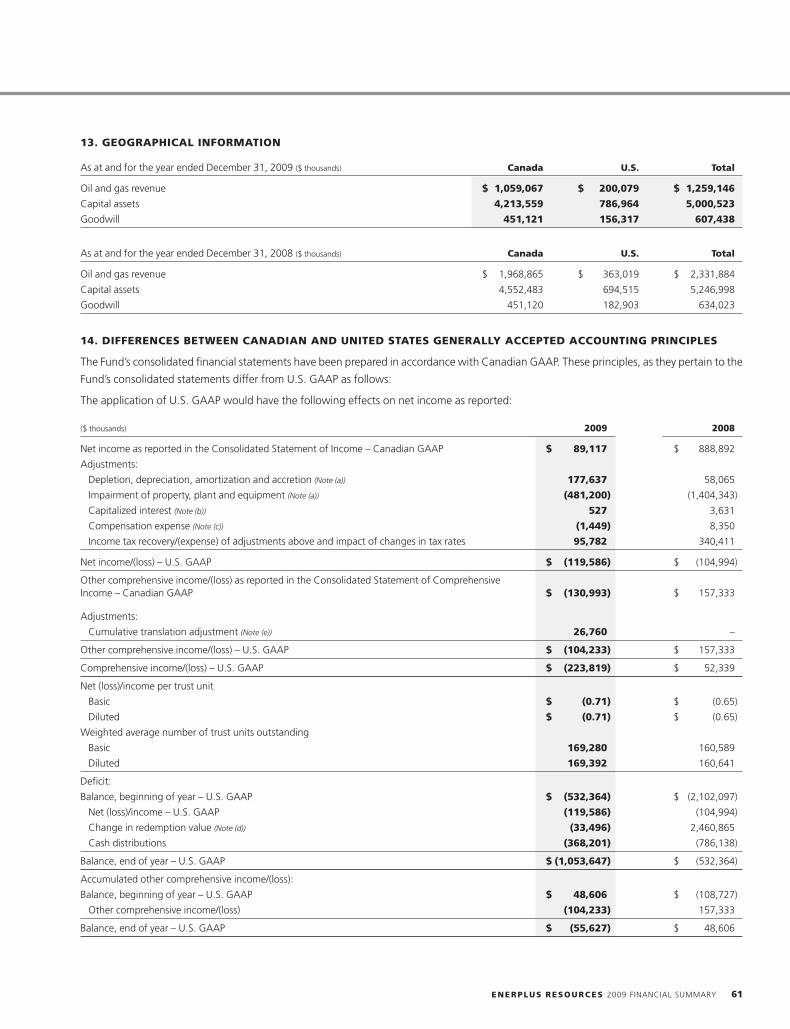
13. GEOGRAPHICAL INFORMATION
As at and for the year ended December 31, 2009 ($ thousands) Canada U.S. Total
Oil and gas revenue $ 1,059,067 $ 200,079 $ 1,259,146
Capital assets 4,213,559 786,964 5,000,523
Goodwill 451,121 156,317 607,438
As at and for the year ended December 31, 2008 ($ thousands) Canada U.S. Total
Oil and gas revenue $ 1,968,865 $ 363,019 $ 2,331,884
Capital assets 4,552,483 694,515 5,246,998
Goodwill 451,120 182,903 634,023
14. DIFFERENCES BETWEEN CANADIAN AND UNITED STATES GENERALLY ACCEPTED ACCOUNTING PRINCIPLES
The Fund’s consolidated financial statements have been prepared in accordance with Canadian GAAP. These principles, as they pertain to the
Fund’s consolidated statements differ from U.S. GAAP as follows:
The application of U.S. GAAP would have the following effects on net income as reported:
($ thousands) 2009 2008
Net income as reported in the Consolidated Statement of Income – Canadian GAAP $ 89,117 $ 888,892
Adjustments:
Depletion, depreciation, amortization and accretion (Note (a)) 177,637 58,065
Impairment of property, plant and equipment (Note (a)) (481,200) (1,404,343)
Capitalized interest (Note (b)) 527 3,631
Compensation expense (Note (c)) (1,449) 8,350
Income tax recovery/(expense) of adjustments above and impact of changes in tax rates 95,782 340,411
Net income/(loss) – U.S. GAAP $ (119,586) $ (104,994)
Other comprehensive income/(loss) as reported in the Consolidated Statement of ComprehensiveIncome – Canadian GAAP $ (130,993) $ 157,333
Adjustments:
Cumulative translation adjustment (Note (e)) 26,760 –
Other comprehensive income/(loss) – U.S. GAAP $ (104,233) $ 157,333
Comprehensive income/(loss) – U.S. GAAP $ (223,819) $ 52,339
Net (loss)/income per trust unit
Basic $ (0.71) $ (0.65)
Diluted $ (0.71) $ (0.65)
Weighted average number of trust units outstanding
Basic 169,280 160,589
Diluted 169,392 160,641
Deficit:
Balance, beginning of year – U.S. GAAP $ (532,364) $ (2,102,097)
Net (loss)/income – U.S. GAAP (119,586) (104,994)
Change in redemption value (Note (d)) (33,496) 2,460,865
Cash distributions (368,201) (786,138)
Balance, end of year – U.S. GAAP $ (1,053,647) $ (532,364)
Accumulated other comprehensive income/(loss):
Balance, beginning of year – U.S. GAAP $ 48,606 $ (108,727)
Other comprehensive income/(loss) (104,233) 157,333
Balance, end of year – U.S. GAAP $ (55,627) $ 48,606
ENERPLUS RESOURCES 2009 FINANCIAL SUMMARY 61
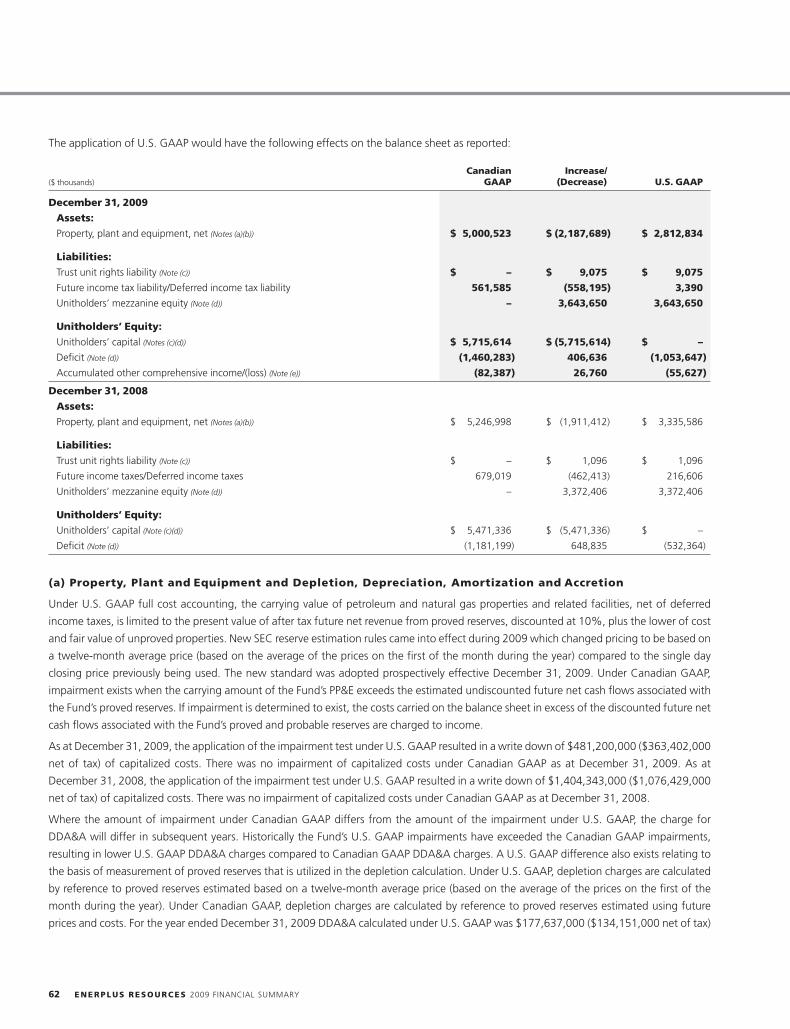
The application of U.S. GAAP would have the following effects on the balance sheet as reported:
Canadian Increase/($ thousands) GAAP (Decrease) U.S. GAAP
December 31, 2009
Assets:
Property, plant and equipment, net (Notes (a)(b)) $ 5,000,523 $ (2,187,689) $ 2,812,834
Liabilities:
Trust unit rights liability (Note (c)) $ – $ 9,075 $ 9,075
Future income tax liability/Deferred income tax liability 561,585 (558,195) 3,390
Unitholders’ mezzanine equity (Note (d)) – 3,643,650 3,643,650
Unitholders’ Equity:
Unitholders’ capital (Notes (c)(d)) $ 5,715,614 $ (5,715,614) $ –
Deficit (Note (d)) (1,460,283) 406,636 (1,053,647)
Accumulated other comprehensive income/(loss) (Note (e)) (82,387) 26,760 (55,627)
December 31, 2008
Assets:
Property, plant and equipment, net (Notes (a)(b)) $ 5,246,998 $ (1,911,412) $ 3,335,586
Liabilities:
Trust unit rights liability (Note (c)) $ – $ 1,096 $ 1,096
Future income taxes/Deferred income taxes 679,019 (462,413) 216,606
Unitholders’ mezzanine equity (Note (d)) – 3,372,406 3,372,406
Unitholders’ Equity:
Unitholders’ capital (Note (c)(d)) $ 5,471,336 $ (5,471,336) $ –
Deficit (Note (d)) (1,181,199) 648,835 (532,364)
(a) Property, Plant and Equipment and Depletion, Depreciation, Amortization and Accretion
Under U.S. GAAP full cost accounting, the carrying value of petroleum and natural gas properties and related facilities, net of deferred
income taxes, is limited to the present value of after tax future net revenue from proved reserves, discounted at 10%, plus the lower of cost
and fair value of unproved properties. New SEC reserve estimation rules came into effect during 2009 which changed pricing to be based on
a twelve-month average price (based on the average of the prices on the first of the month during the year) compared to the single day
closing price previously being used. The new standard was adopted prospectively effective December 31, 2009. Under Canadian GAAP,
impairment exists when the carrying amount of the Fund’s PP&E exceeds the estimated undiscounted future net cash flows associated with
the Fund’s proved reserves. If impairment is determined to exist, the costs carried on the balance sheet in excess of the discounted future net
cash flows associated with the Fund’s proved and probable reserves are charged to income.
As at December 31, 2009, the application of the impairment test under U.S. GAAP resulted in a write down of $481,200,000 ($363,402,000
net of tax) of capitalized costs. There was no impairment of capitalized costs under Canadian GAAP as at December 31, 2009. As at
December 31, 2008, the application of the impairment test under U.S. GAAP resulted in a write down of $1,404,343,000 ($1,076,429,000
net of tax) of capitalized costs. There was no impairment of capitalized costs under Canadian GAAP as at December 31, 2008.
Where the amount of impairment under Canadian GAAP differs from the amount of the impairment under U.S. GAAP, the charge for
DDA&A will differ in subsequent years. Historically the Fund’s U.S. GAAP impairments have exceeded the Canadian GAAP impairments,
resulting in lower U.S. GAAP DDA&A charges compared to Canadian GAAP DDA&A charges. A U.S. GAAP difference also exists relating to
the basis of measurement of proved reserves that is utilized in the depletion calculation. Under U.S. GAAP, depletion charges are calculated
by reference to proved reserves estimated based on a twelve-month average price (based on the average of the prices on the first of the
month during the year). Under Canadian GAAP, depletion charges are calculated by reference to proved reserves estimated using future
prices and costs. For the year ended December 31, 2009 DDA&A calculated under U.S. GAAP was $177,637,000 ($134,151,000 net of tax)
62 ENERPLUS RESOURCES 2009 FINANCIAL SUMMARY
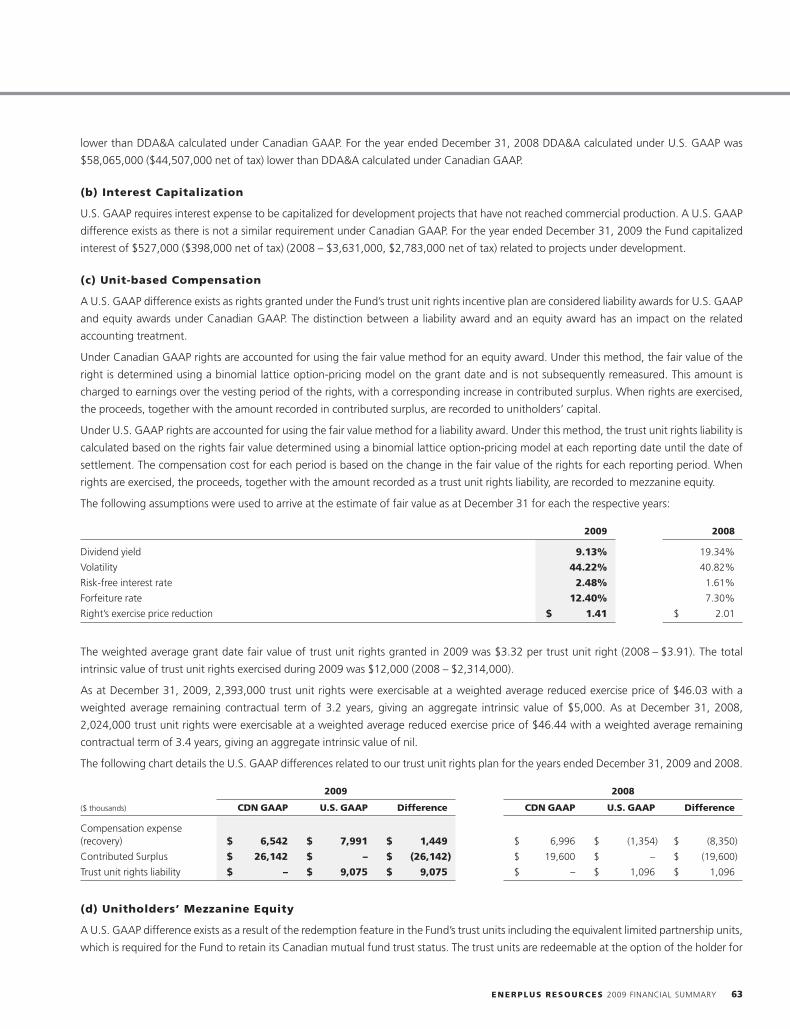
lower than DDA&A calculated under Canadian GAAP. For the year ended December 31, 2008 DDA&A calculated under U.S. GAAP was
$58,065,000 ($44,507,000 net of tax) lower than DDA&A calculated under Canadian GAAP.
(b) Interest Capitalization
U.S. GAAP requires interest expense to be capitalized for development projects that have not reached commercial production. A U.S. GAAP
difference exists as there is not a similar requirement under Canadian GAAP. For the year ended December 31, 2009 the Fund capitalized
interest of $527,000 ($398,000 net of tax) (2008 – $3,631,000, $2,783,000 net of tax) related to projects under development.
(c) Unit-based Compensation
A U.S. GAAP difference exists as rights granted under the Fund’s trust unit rights incentive plan are considered liability awards for U.S. GAAP
and equity awards under Canadian GAAP. The distinction between a liability award and an equity award has an impact on the related
accounting treatment.
Under Canadian GAAP rights are accounted for using the fair value method for an equity award. Under this method, the fair value of the
right is determined using a binomial lattice option-pricing model on the grant date and is not subsequently remeasured. This amount is
charged to earnings over the vesting period of the rights, with a corresponding increase in contributed surplus. When rights are exercised,
the proceeds, together with the amount recorded in contributed surplus, are recorded to unitholders’ capital.
Under U.S. GAAP rights are accounted for using the fair value method for a liability award. Under this method, the trust unit rights liability is
calculated based on the rights fair value determined using a binomial lattice option-pricing model at each reporting date until the date of
settlement. The compensation cost for each period is based on the change in the fair value of the rights for each reporting period. When
rights are exercised, the proceeds, together with the amount recorded as a trust unit rights liability, are recorded to mezzanine equity.
The following assumptions were used to arrive at the estimate of fair value as at December 31 for each the respective years:
2009 2008
Dividend yield 9.13% 19.34%
Volatility 44.22% 40.82%
Risk-free interest rate 2.48% 1.61%
Forfeiture rate 12.40% 7.30%
Right’s exercise price reduction $ 1.41 $ 2.01
The weighted average grant date fair value of trust unit rights granted in 2009 was $3.32 per trust unit right (2008 – $3.91). The total
intrinsic value of trust unit rights exercised during 2009 was $12,000 (2008 – $2,314,000).
As at December 31, 2009, 2,393,000 trust unit rights were exercisable at a weighted average reduced exercise price of $46.03 with a
weighted average remaining contractual term of 3.2 years, giving an aggregate intrinsic value of $5,000. As at December 31, 2008,
2,024,000 trust unit rights were exercisable at a weighted average reduced exercise price of $46.44 with a weighted average remaining
contractual term of 3.4 years, giving an aggregate intrinsic value of nil.
The following chart details the U.S. GAAP differences related to our trust unit rights plan for the years ended December 31, 2009 and 2008.
2009 2008
($ thousands) CDN GAAP U.S. GAAP Difference CDN GAAP U.S. GAAP Difference
Compensation expense(recovery) $ 6,542 $ 7,991 $ 1,449 $ 6,996 $ (1,354) $ (8,350)
Contributed Surplus $ 26,142 $ – $ (26,142) $ 19,600 $ – $ (19,600)
Trust unit rights liability $ – $ 9,075 $ 9,075 $ – $ 1,096 $ 1,096
(d) Unitholders’ Mezzanine Equity
A U.S. GAAP difference exists as a result of the redemption feature in the Fund’s trust units including the equivalent limited partnership units,
which is required for the Fund to retain its Canadian mutual fund trust status. The trust units are redeemable at the option of the holder for
ENERPLUS RESOURCES 2009 FINANCIAL SUMMARY 63
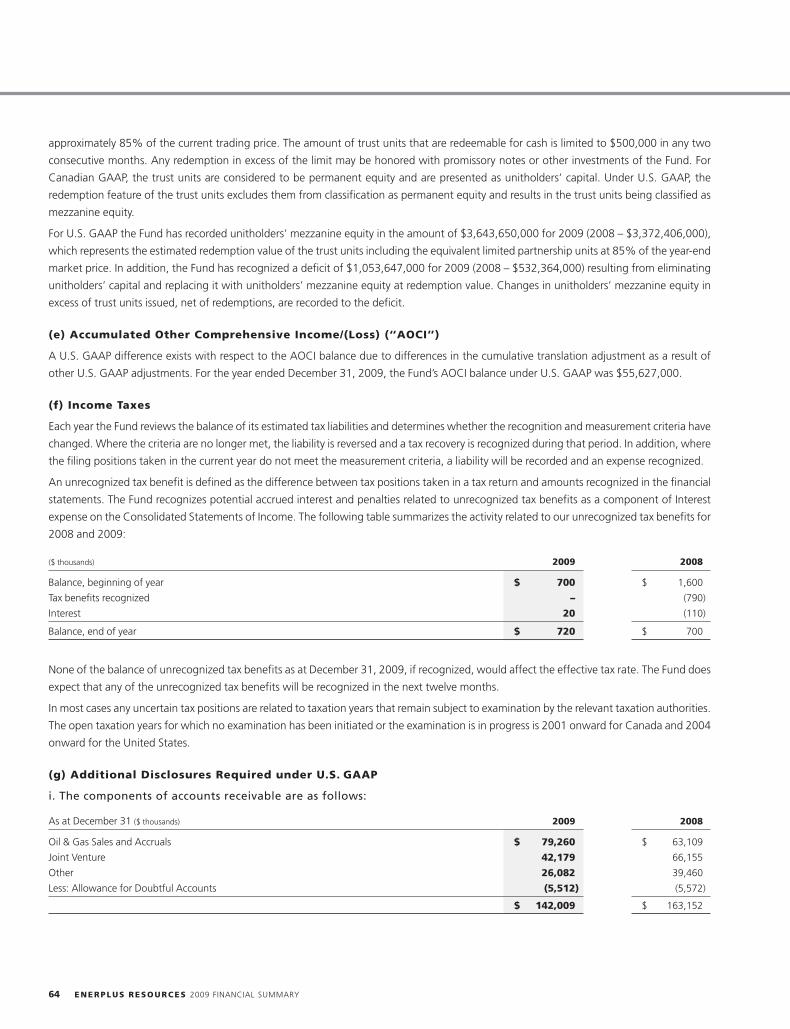
approximately 85% of the current trading price. The amount of trust units that are redeemable for cash is limited to $500,000 in any two
consecutive months. Any redemption in excess of the limit may be honored with promissory notes or other investments of the Fund. For
Canadian GAAP, the trust units are considered to be permanent equity and are presented as unitholders’ capital. Under U.S. GAAP, the
redemption feature of the trust units excludes them from classification as permanent equity and results in the trust units being classified as
mezzanine equity.
For U.S. GAAP the Fund has recorded unitholders’ mezzanine equity in the amount of $3,643,650,000 for 2009 (2008 – $3,372,406,000),
which represents the estimated redemption value of the trust units including the equivalent limited partnership units at 85% of the year-end
market price. In addition, the Fund has recognized a deficit of $1,053,647,000 for 2009 (2008 – $532,364,000) resulting from eliminating
unitholders’ capital and replacing it with unitholders’ mezzanine equity at redemption value. Changes in unitholders’ mezzanine equity in
excess of trust units issued, net of redemptions, are recorded to the deficit.
(e) Accumulated Other Comprehensive Income/(Loss) (‘‘AOCI’’)
A U.S. GAAP difference exists with respect to the AOCI balance due to differences in the cumulative translation adjustment as a result of
other U.S. GAAP adjustments. For the year ended December 31, 2009, the Fund’s AOCI balance under U.S. GAAP was $55,627,000.
(f) Income Taxes
Each year the Fund reviews the balance of its estimated tax liabilities and determines whether the recognition and measurement criteria have
changed. Where the criteria are no longer met, the liability is reversed and a tax recovery is recognized during that period. In addition, where
the filing positions taken in the current year do not meet the measurement criteria, a liability will be recorded and an expense recognized.
An unrecognized tax benefit is defined as the difference between tax positions taken in a tax return and amounts recognized in the financial
statements. The Fund recognizes potential accrued interest and penalties related to unrecognized tax benefits as a component of Interest
expense on the Consolidated Statements of Income. The following table summarizes the activity related to our unrecognized tax benefits for
2008 and 2009:
($ thousands) 2009 2008
Balance, beginning of year $ 700 $ 1,600
Tax benefits recognized – (790)
Interest 20 (110)
Balance, end of year $ 720 $ 700
None of the balance of unrecognized tax benefits as at December 31, 2009, if recognized, would affect the effective tax rate. The Fund does
expect that any of the unrecognized tax benefits will be recognized in the next twelve months.
In most cases any uncertain tax positions are related to taxation years that remain subject to examination by the relevant taxation authorities.
The open taxation years for which no examination has been initiated or the examination is in progress is 2001 onward for Canada and 2004
onward for the United States.
(g) Additional Disclosures Required under U.S. GAAP
i. The components of accounts receivable are as follows:
As at December 31 ($ thousands) 2009 2008
Oil & Gas Sales and Accruals $ 79,260 $ 63,109
Joint Venture 42,179 66,155
Other 26,082 39,460
Less: Allowance for Doubtful Accounts (5,512) (5,572)
$ 142,009 $ 163,152
64 ENERPLUS RESOURCES 2009 FINANCIAL SUMMARY
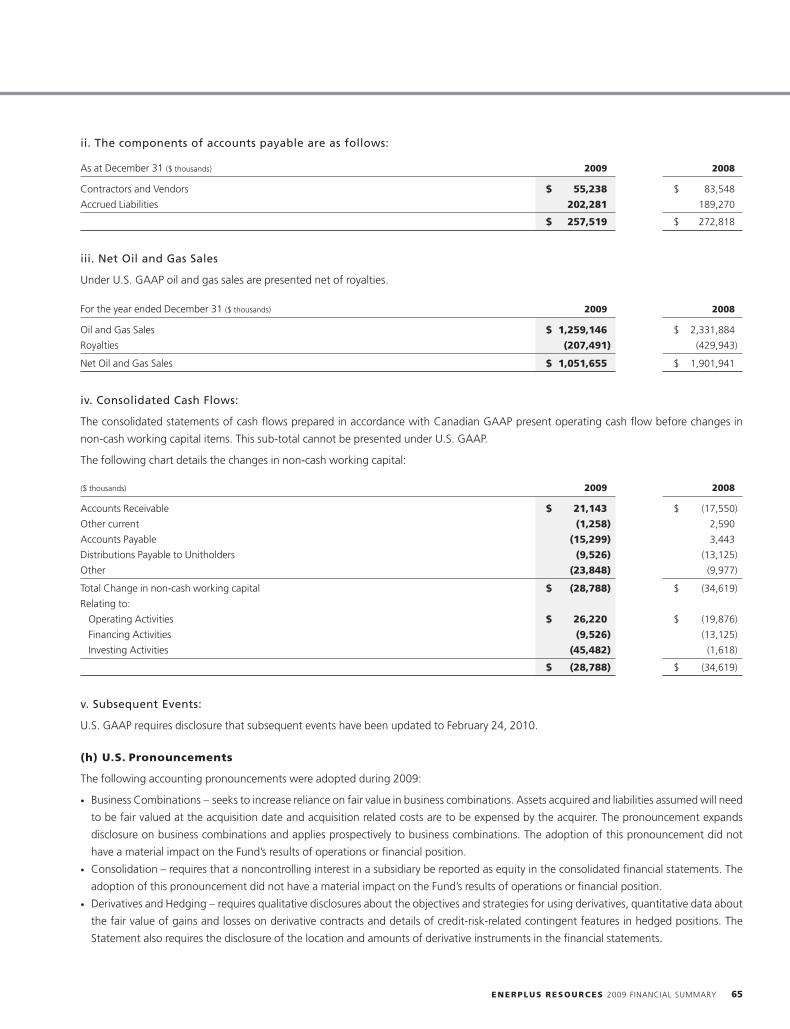
ii. The components of accounts payable are as follows:
As at December 31 ($ thousands) 2009 2008
Contractors and Vendors $ 55,238 $ 83,548
Accrued Liabilities 202,281 189,270
$ 257,519 $ 272,818
iii. Net Oil and Gas Sales
Under U.S. GAAP oil and gas sales are presented net of royalties.
For the year ended December 31 ($ thousands) 2009 2008
Oil and Gas Sales $ 1,259,146 $ 2,331,884
Royalties (207,491) (429,943)
Net Oil and Gas Sales $ 1,051,655 $ 1,901,941
iv. Consolidated Cash Flows:
The consolidated statements of cash flows prepared in accordance with Canadian GAAP present operating cash flow before changes in
non-cash working capital items. This sub-total cannot be presented under U.S. GAAP.
The following chart details the changes in non-cash working capital:
($ thousands) 2009 2008
Accounts Receivable $ 21,143 $ (17,550)
Other current (1,258) 2,590
Accounts Payable (15,299) 3,443
Distributions Payable to Unitholders (9,526) (13,125)
Other (23,848) (9,977)
Total Change in non-cash working capital $ (28,788) $ (34,619)
Relating to:
Operating Activities $ 26,220 $ (19,876)
Financing Activities (9,526) (13,125)
Investing Activities (45,482) (1,618)
$ (28,788) $ (34,619)
v. Subsequent Events:
U.S. GAAP requires disclosure that subsequent events have been updated to February 24, 2010.
(h) U.S. Pronouncements
The following accounting pronouncements were adopted during 2009:
• Business Combinations – seeks to increase reliance on fair value in business combinations. Assets acquired and liabilities assumed will need
to be fair valued at the acquisition date and acquisition related costs are to be expensed by the acquirer. The pronouncement expands
disclosure on business combinations and applies prospectively to business combinations. The adoption of this pronouncement did not
have a material impact on the Fund’s results of operations or financial position.
• Consolidation – requires that a noncontrolling interest in a subsidiary be reported as equity in the consolidated financial statements. The
adoption of this pronouncement did not have a material impact on the Fund’s results of operations or financial position.
• Derivatives and Hedging – requires qualitative disclosures about the objectives and strategies for using derivatives, quantitative data about
the fair value of gains and losses on derivative contracts and details of credit-risk-related contingent features in hedged positions. The
Statement also requires the disclosure of the location and amounts of derivative instruments in the financial statements.
ENERPLUS RESOURCES 2009 FINANCIAL SUMMARY 65
• Subsequent Events – seeks to establish general standards relating to the accounting and disclosure of events that occur after the balance
sheet date but before the financial statements are issued or are available to be issued. The adoption of this pronouncement did not have a
material impact on the Fund’s results of operations or financial position.
• Reserve Estimation and Disclosures – The SEC updated its oil and gas reporting requirements and related rules. The new rules include
changes to pricing where a twelve-month average price is used compared to the single-day closing price previously being used. The Fund’s
December 31, 2009 impairment test of its petroleum and natural gas properties incorporated the new rules and resulted in a write down
of $481,200,000 ($363,402,000 net of tax) of capitalized costs.
Future accounting pronouncements:
• Amendments to Consolidation of Variable Interest Entities – retains the scope of the previous guidance with the addition of entities
previously considered qualifying special-purpose entities and eliminates the previous quantitative approach with a qualitative analysis in
determining whether the enterprise’s variable interest or interests give it a controlling financial interest in a variable interest entity. The
Statement also requires ongoing reassessments of whether an enterprise is the primary beneficiary of a variable interest entity and requires
enhanced disclosures about an enterprise’s involvement in a variable interest entity. The Statement is effective at the beginning of the first
annual reporting period after November 15, 2009. The adoption of this statement is not expected to have a material impact on the Fund’s
results of operations or financial position.
66 ENERPLUS RESOURCES 2009 FINANCIAL SUMMARY
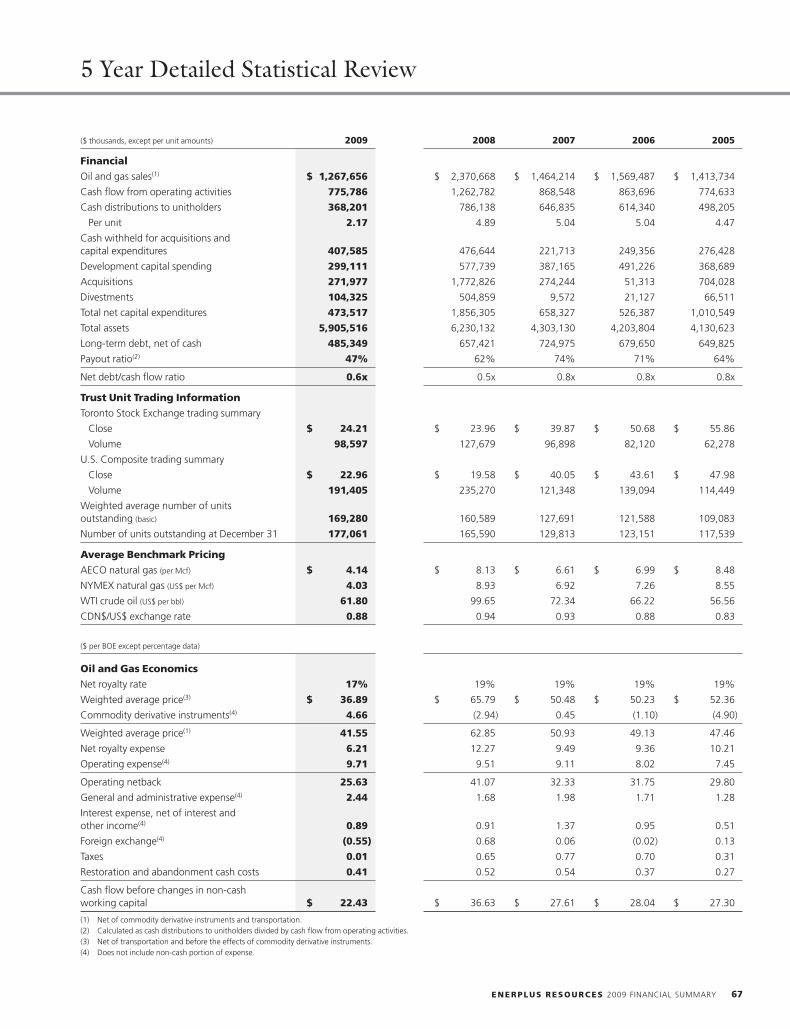
5 Year Detailed Statistical Review
($ thousands, except per unit amounts) 2009 2008 2007 2006 2005
Financial
Oil and gas sales(1) $ 1,267,656 $ 2,370,668 $ 1,464,214 $ 1,569,487 $ 1,413,734
Cash flow from operating activities 775,786 1,262,782 868,548 863,696 774,633
Cash distributions to unitholders 368,201 786,138 646,835 614,340 498,205
Per unit 2.17 4.89 5.04 5.04 4.47
Cash withheld for acquisitions andcapital expenditures 407,585 476,644 221,713 249,356 276,428
Development capital spending 299,111 577,739 387,165 491,226 368,689
Acquisitions 271,977 1,772,826 274,244 51,313 704,028
Divestments 104,325 504,859 9,572 21,127 66,511
Total net capital expenditures 473,517 1,856,305 658,327 526,387 1,010,549
Total assets 5,905,516 6,230,132 4,303,130 4,203,804 4,130,623
Long-term debt, net of cash 485,349 657,421 724,975 679,650 649,825
Payout ratio(2) 47% 62% 74% 71% 64%
Net debt/cash flow ratio 0.6x 0.5x 0.8x 0.8x 0.8x
Trust Unit Trading Information
Toronto Stock Exchange trading summary
Close $ 24.21 $ 23.96 $ 39.87 $ 50.68 $ 55.86
Volume 98,597 127,679 96,898 82,120 62,278
U.S. Composite trading summary
Close $ 22.96 $ 19.58 $ 40.05 $ 43.61 $ 47.98
Volume 191,405 235,270 121,348 139,094 114,449
Weighted average number of unitsoutstanding (basic) 169,280 160,589 127,691 121,588 109,083
Number of units outstanding at December 31 177,061 165,590 129,813 123,151 117,539
Average Benchmark Pricing
AECO natural gas (per Mcf) $ 4.14 $ 8.13 $ 6.61 $ 6.99 $ 8.48
NYMEX natural gas (US$ per Mcf) 4.03 8.93 6.92 7.26 8.55
WTI crude oil (US$ per bbl) 61.80 99.65 72.34 66.22 56.56
CDN$/US$ exchange rate 0.88 0.94 0.93 0.88 0.83
($ per BOE except percentage data)
Oil and Gas Economics
Net royalty rate 17% 19% 19% 19% 19%
Weighted average price(3) $ 36.89 $ 65.79 $ 50.48 $ 50.23 $ 52.36
Commodity derivative instruments(4) 4.66 (2.94) 0.45 (1.10) (4.90)
Weighted average price(1) 41.55 62.85 50.93 49.13 47.46
Net royalty expense 6.21 12.27 9.49 9.36 10.21
Operating expense(4) 9.71 9.51 9.11 8.02 7.45
Operating netback 25.63 41.07 32.33 31.75 29.80
General and administrative expense(4) 2.44 1.68 1.98 1.71 1.28
Interest expense, net of interest andother income(4) 0.89 0.91 1.37 0.95 0.51
Foreign exchange(4) (0.55) 0.68 0.06 (0.02) 0.13
Taxes 0.01 0.65 0.77 0.70 0.31
Restoration and abandonment cash costs 0.41 0.52 0.54 0.37 0.27
Cash flow before changes in non-cashworking capital $ 22.43 $ 36.63 $ 27.61 $ 28.04 $ 27.30
(1) Net of commodity derivative instruments and transportation.(2) Calculated as cash distributions to unitholders divided by cash flow from operating activities.(3) Net of transportation and before the effects of commodity derivative instruments.(4) Does not include non-cash portion of expense.
ENERPLUS RESOURCES 2009 FINANCIAL SUMMARY 67
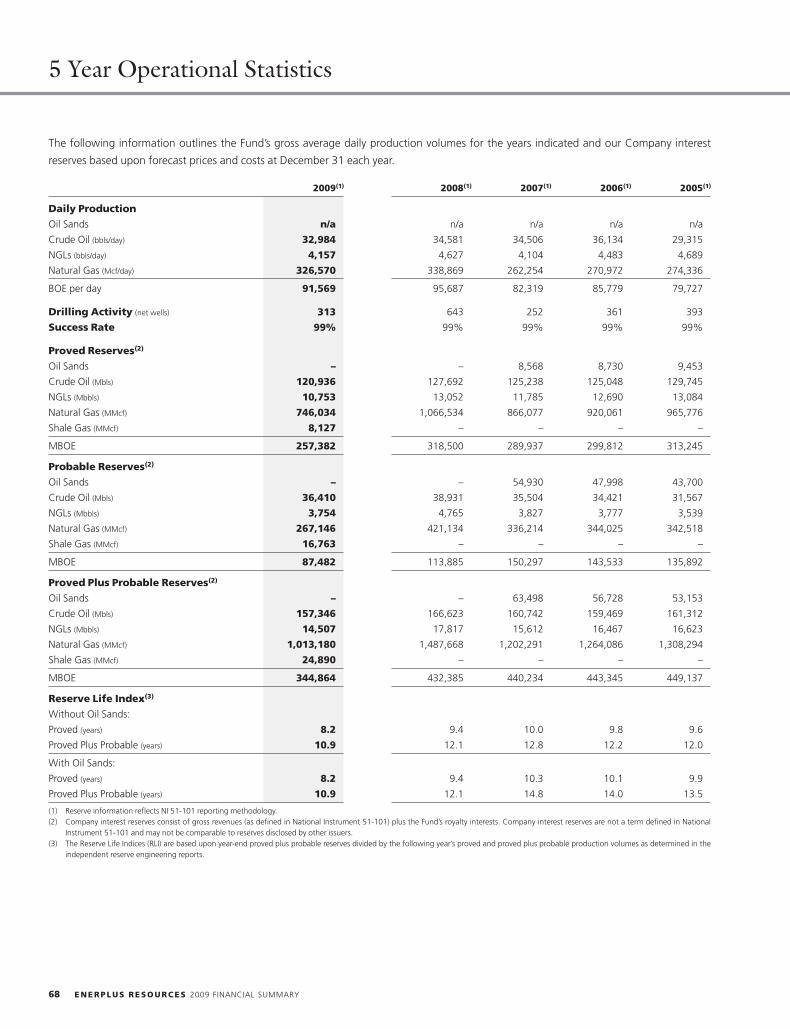
5 Year Operational Statistics
The following information outlines the Fund’s gross average daily production volumes for the years indicated and our Company interest
reserves based upon forecast prices and costs at December 31 each year.
2009(1) 2008(1) 2007(1) 2006(1) 2005(1)
Daily Production
Oil Sands n/a n/a n/a n/a n/a
Crude Oil (bbls/day) 32,984 34,581 34,506 36,134 29,315
NGLs (bbls/day) 4,157 4,627 4,104 4,483 4,689
Natural Gas (Mcf/day) 326,570 338,869 262,254 270,972 274,336
BOE per day 91,569 95,687 82,319 85,779 79,727
Drilling Activity (net wells) 313 643 252 361 393
Success Rate 99% 99% 99% 99% 99%
Proved Reserves(2)
Oil Sands – – 8,568 8,730 9,453
Crude Oil (Mbls) 120,936 127,692 125,238 125,048 129,745
NGLs (Mbbls) 10,753 13,052 11,785 12,690 13,084
Natural Gas (MMcf) 746,034 1,066,534 866,077 920,061 965,776
Shale Gas (MMcf) 8,127 – – – –
MBOE 257,382 318,500 289,937 299,812 313,245
Probable Reserves(2)
Oil Sands – – 54,930 47,998 43,700
Crude Oil (Mbls) 36,410 38,931 35,504 34,421 31,567
NGLs (Mbbls) 3,754 4,765 3,827 3,777 3,539
Natural Gas (MMcf) 267,146 421,134 336,214 344,025 342,518
Shale Gas (MMcf) 16,763 – – – –
MBOE 87,482 113,885 150,297 143,533 135,892
Proved Plus Probable Reserves(2)
Oil Sands – – 63,498 56,728 53,153
Crude Oil (Mbls) 157,346 166,623 160,742 159,469 161,312
NGLs (Mbbls) 14,507 17,817 15,612 16,467 16,623
Natural Gas (MMcf) 1,013,180 1,487,668 1,202,291 1,264,086 1,308,294
Shale Gas (MMcf) 24,890 – – – –
MBOE 344,864 432,385 440,234 443,345 449,137
Reserve Life Index(3)
Without Oil Sands:
Proved (years) 8.2 9.4 10.0 9.8 9.6
Proved Plus Probable (years) 10.9 12.1 12.8 12.2 12.0
With Oil Sands:
Proved (years) 8.2 9.4 10.3 10.1 9.9
Proved Plus Probable (years) 10.9 12.1 14.8 14.0 13.5
(1) Reserve information reflects NI 51-101 reporting methodology.(2) Company interest reserves consist of gross revenues (as defined in National Instrument 51-101) plus the Fund’s royalty interests. Company interest reserves are not a term defined in National
Instrument 51-101 and may not be comparable to reserves disclosed by other issuers.(3) The Reserve Life Indices (RLI) are based upon year-end proved plus probable reserves divided by the following year’s proved and proved plus probable production volumes as determined in the
independent reserve engineering reports.
68 ENERPLUS RESOURCES 2009 FINANCIAL SUMMARY
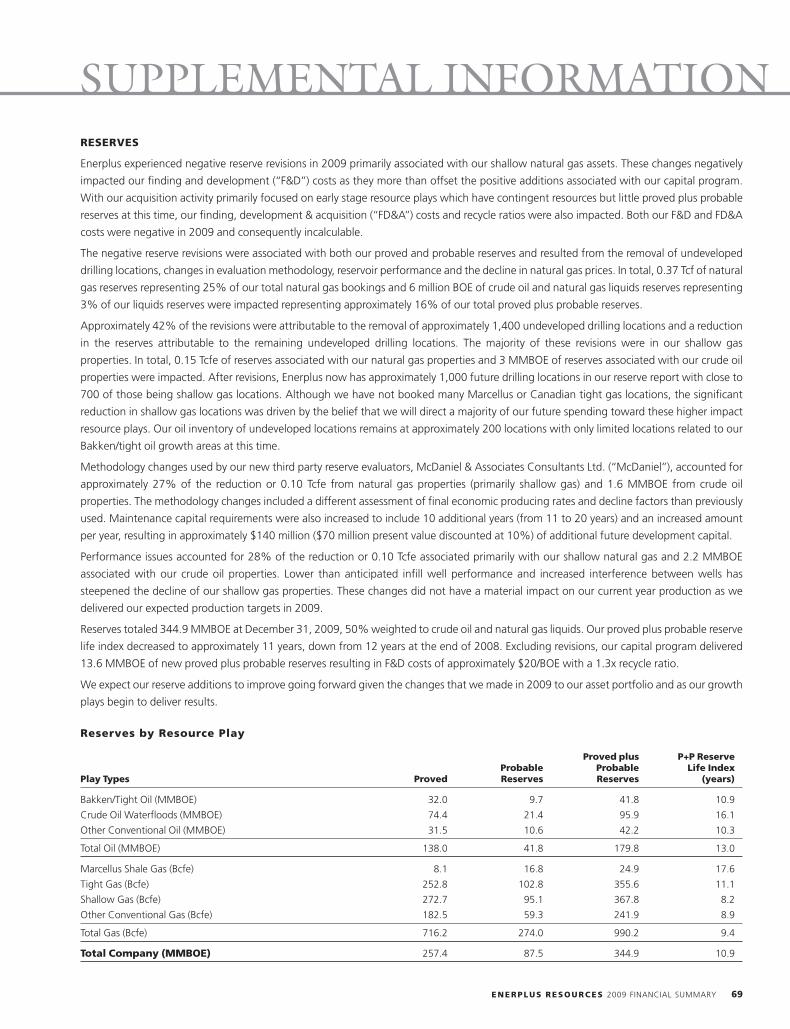
RESERVES
Enerplus experienced negative reserve revisions in 2009 primarily associated with our shallow natural gas assets. These changes negatively
impacted our finding and development (‘‘F&D’’) costs as they more than offset the positive additions associated with our capital program.
With our acquisition activity primarily focused on early stage resource plays which have contingent resources but little proved plus probable
reserves at this time, our finding, development & acquisition (‘‘FD&A’’) costs and recycle ratios were also impacted. Both our F&D and FD&A
costs were negative in 2009 and consequently incalculable.
The negative reserve revisions were associated with both our proved and probable reserves and resulted from the removal of undeveloped
drilling locations, changes in evaluation methodology, reservoir performance and the decline in natural gas prices. In total, 0.37 Tcf of natural
gas reserves representing 25% of our total natural gas bookings and 6 million BOE of crude oil and natural gas liquids reserves representing
3% of our liquids reserves were impacted representing approximately 16% of our total proved plus probable reserves.
Approximately 42% of the revisions were attributable to the removal of approximately 1,400 undeveloped drilling locations and a reduction
in the reserves attributable to the remaining undeveloped drilling locations. The majority of these revisions were in our shallow gas
properties. In total, 0.15 Tcfe of reserves associated with our natural gas properties and 3 MMBOE of reserves associated with our crude oil
properties were impacted. After revisions, Enerplus now has approximately 1,000 future drilling locations in our reserve report with close to
700 of those being shallow gas locations. Although we have not booked many Marcellus or Canadian tight gas locations, the significant
reduction in shallow gas locations was driven by the belief that we will direct a majority of our future spending toward these higher impact
resource plays. Our oil inventory of undeveloped locations remains at approximately 200 locations with only limited locations related to our
Bakken/tight oil growth areas at this time.
Methodology changes used by our new third party reserve evaluators, McDaniel & Associates Consultants Ltd. (‘‘McDaniel’’), accounted for
approximately 27% of the reduction or 0.10 Tcfe from natural gas properties (primarily shallow gas) and 1.6 MMBOE from crude oil
properties. The methodology changes included a different assessment of final economic producing rates and decline factors than previously
used. Maintenance capital requirements were also increased to include 10 additional years (from 11 to 20 years) and an increased amount
per year, resulting in approximately $140 million ($70 million present value discounted at 10%) of additional future development capital.
Performance issues accounted for 28% of the reduction or 0.10 Tcfe associated primarily with our shallow natural gas and 2.2 MMBOE
associated with our crude oil properties. Lower than anticipated infill well performance and increased interference between wells has
steepened the decline of our shallow gas properties. These changes did not have a material impact on our current year production as we
delivered our expected production targets in 2009.
Reserves totaled 344.9 MMBOE at December 31, 2009, 50% weighted to crude oil and natural gas liquids. Our proved plus probable reserve
life index decreased to approximately 11 years, down from 12 years at the end of 2008. Excluding revisions, our capital program delivered
13.6 MMBOE of new proved plus probable reserves resulting in F&D costs of approximately $20/BOE with a 1.3x recycle ratio.
We expect our reserve additions to improve going forward given the changes that we made in 2009 to our asset portfolio and as our growth
plays begin to deliver results.
Reserves by Resource Play
Proved plus P+P ReserveProbable Probable Life Index
Play Types Proved Reserves Reserves (years)
Bakken/Tight Oil (MMBOE) 32.0 9.7 41.8 10.9
Crude Oil Waterfloods (MMBOE) 74.4 21.4 95.9 16.1
Other Conventional Oil (MMBOE) 31.5 10.6 42.2 10.3
Total Oil (MMBOE) 138.0 41.8 179.8 13.0
Marcellus Shale Gas (Bcfe) 8.1 16.8 24.9 17.6
Tight Gas (Bcfe) 252.8 102.8 355.6 11.1
Shallow Gas (Bcfe) 272.7 95.1 367.8 8.2
Other Conventional Gas (Bcfe) 182.5 59.3 241.9 8.9
Total Gas (Bcfe) 716.2 274.0 990.2 9.4
Total Company (MMBOE) 257.4 87.5 344.9 10.9
ENERPLUS RESOURCES 2009 FINANCIAL SUMMARY 69
SUPPLEMENTAL INFORMATION
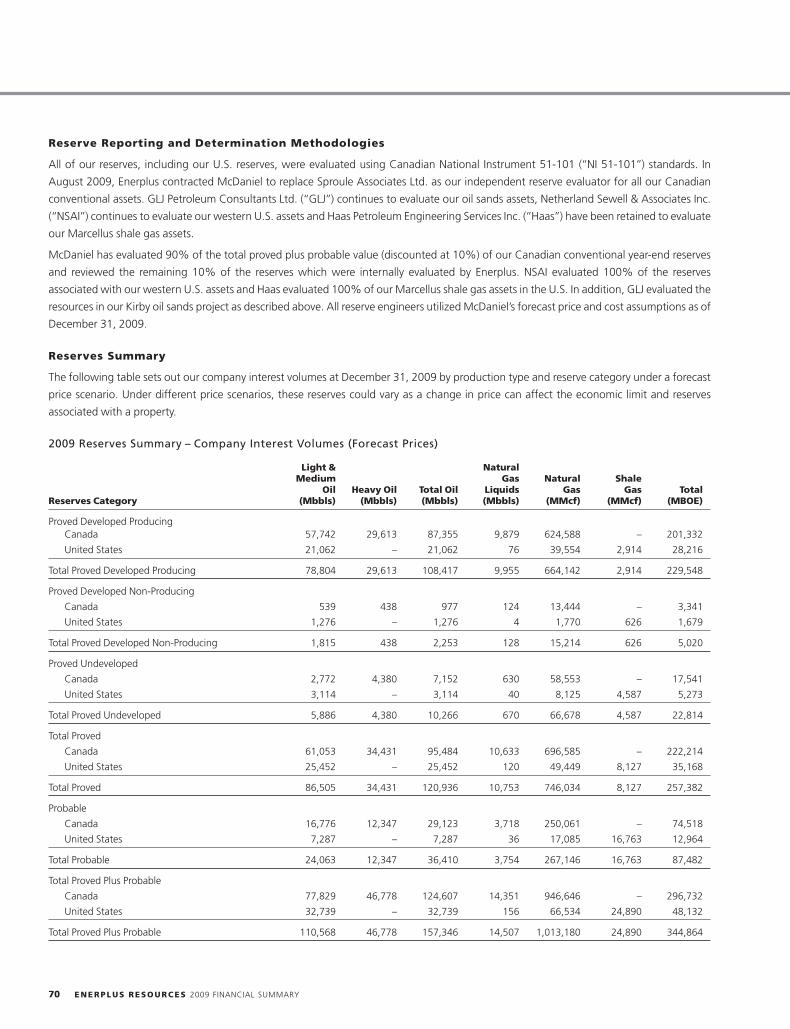
Reserve Reporting and Determination Methodologies
All of our reserves, including our U.S. reserves, were evaluated using Canadian National Instrument 51-101 (‘‘NI 51-101’’) standards. In
August 2009, Enerplus contracted McDaniel to replace Sproule Associates Ltd. as our independent reserve evaluator for all our Canadian
conventional assets. GLJ Petroleum Consultants Ltd. (‘‘GLJ’’) continues to evaluate our oil sands assets, Netherland Sewell & Associates Inc.
(‘‘NSAI’’) continues to evaluate our western U.S. assets and Haas Petroleum Engineering Services Inc. (‘‘Haas’’) have been retained to evaluate
our Marcellus shale gas assets.
McDaniel has evaluated 90% of the total proved plus probable value (discounted at 10%) of our Canadian conventional year-end reserves
and reviewed the remaining 10% of the reserves which were internally evaluated by Enerplus. NSAI evaluated 100% of the reserves
associated with our western U.S. assets and Haas evaluated 100% of our Marcellus shale gas assets in the U.S. In addition, GLJ evaluated the
resources in our Kirby oil sands project as described above. All reserve engineers utilized McDaniel’s forecast price and cost assumptions as of
December 31, 2009.
Reserves Summary
The following table sets out our company interest volumes at December 31, 2009 by production type and reserve category under a forecast
price scenario. Under different price scenarios, these reserves could vary as a change in price can affect the economic limit and reserves
associated with a property.
2009 Reserves Summary – Company Interest Volumes (Forecast Prices)
Light & NaturalMedium Gas Natural Shale
Oil Heavy Oil Total Oil Liquids Gas Gas TotalReserves Category (Mbbls) (Mbbls) (Mbbls) (Mbbls) (MMcf) (MMcf) (MBOE)
Proved Developed ProducingCanada 57,742 29,613 87,355 9,879 624,588 – 201,332
United States 21,062 – 21,062 76 39,554 2,914 28,216
Total Proved Developed Producing 78,804 29,613 108,417 9,955 664,142 2,914 229,548
Proved Developed Non-Producing
Canada 539 438 977 124 13,444 – 3,341
United States 1,276 – 1,276 4 1,770 626 1,679
Total Proved Developed Non-Producing 1,815 438 2,253 128 15,214 626 5,020
Proved Undeveloped
Canada 2,772 4,380 7,152 630 58,553 – 17,541
United States 3,114 – 3,114 40 8,125 4,587 5,273
Total Proved Undeveloped 5,886 4,380 10,266 670 66,678 4,587 22,814
Total Proved
Canada 61,053 34,431 95,484 10,633 696,585 – 222,214
United States 25,452 – 25,452 120 49,449 8,127 35,168
Total Proved 86,505 34,431 120,936 10,753 746,034 8,127 257,382
Probable
Canada 16,776 12,347 29,123 3,718 250,061 – 74,518
United States 7,287 – 7,287 36 17,085 16,763 12,964
Total Probable 24,063 12,347 36,410 3,754 267,146 16,763 87,482
Total Proved Plus Probable
Canada 77,829 46,778 124,607 14,351 946,646 – 296,732
United States 32,739 – 32,739 156 66,534 24,890 48,132
Total Proved Plus Probable 110,568 46,778 157,346 14,507 1,013,180 24,890 344,864
70 ENERPLUS RESOURCES 2009 FINANCIAL SUMMARY
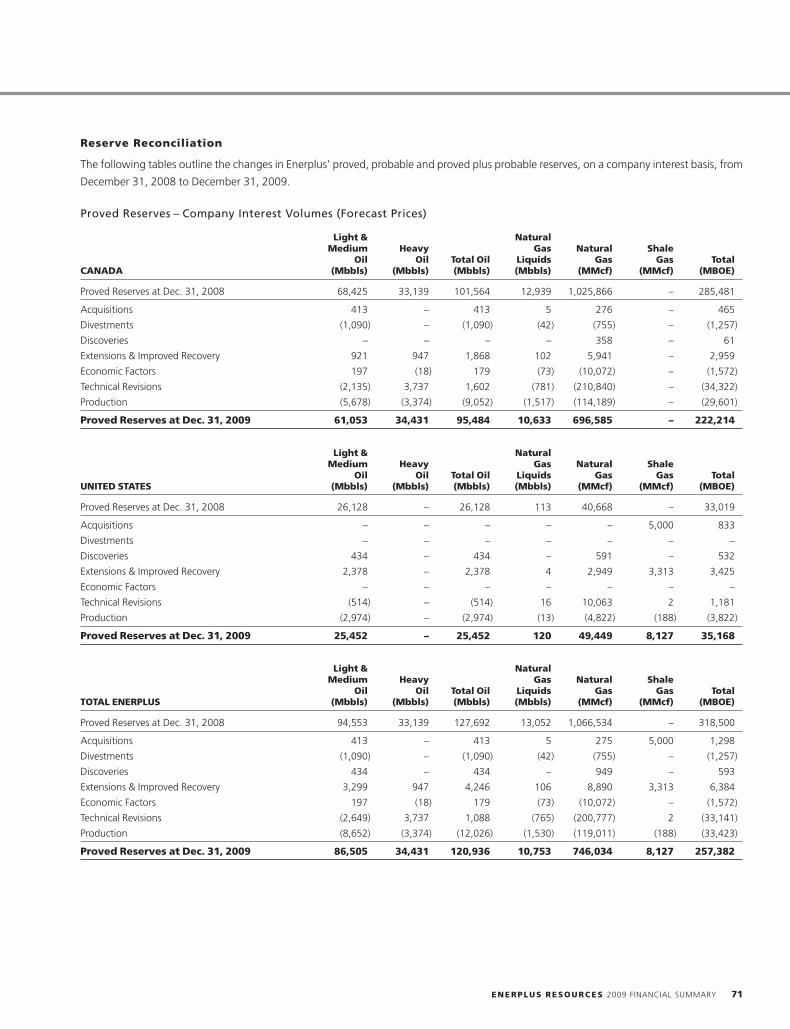
Reserve Reconciliation
The following tables outline the changes in Enerplus’ proved, probable and proved plus probable reserves, on a company interest basis, from
December 31, 2008 to December 31, 2009.
Proved Reserves – Company Interest Volumes (Forecast Prices)
Light & NaturalMedium Heavy Gas Natural Shale
Oil Oil Total Oil Liquids Gas Gas TotalCANADA (Mbbls) (Mbbls) (Mbbls) (Mbbls) (MMcf) (MMcf) (MBOE)
Proved Reserves at Dec. 31, 2008 68,425 33,139 101,564 12,939 1,025,866 – 285,481
Acquisitions 413 – 413 5 276 – 465
Divestments (1,090) – (1,090) (42) (755) – (1,257)
Discoveries – – – – 358 – 61
Extensions & Improved Recovery 921 947 1,868 102 5,941 – 2,959
Economic Factors 197 (18) 179 (73) (10,072) – (1,572)
Technical Revisions (2,135) 3,737 1,602 (781) (210,840) – (34,322)
Production (5,678) (3,374) (9,052) (1,517) (114,189) – (29,601)
Proved Reserves at Dec. 31, 2009 61,053 34,431 95,484 10,633 696,585 – 222,214
Light & NaturalMedium Heavy Gas Natural Shale
Oil Oil Total Oil Liquids Gas Gas TotalUNITED STATES (Mbbls) (Mbbls) (Mbbls) (Mbbls) (MMcf) (MMcf) (MBOE)
Proved Reserves at Dec. 31, 2008 26,128 – 26,128 113 40,668 – 33,019
Acquisitions – – – – – 5,000 833
Divestments – – – – – – –
Discoveries 434 – 434 – 591 – 532
Extensions & Improved Recovery 2,378 – 2,378 4 2,949 3,313 3,425
Economic Factors – – – – – – –
Technical Revisions (514) – (514) 16 10,063 2 1,181
Production (2,974) – (2,974) (13) (4,822) (188) (3,822)
Proved Reserves at Dec. 31, 2009 25,452 – 25,452 120 49,449 8,127 35,168
Light & NaturalMedium Heavy Gas Natural Shale
Oil Oil Total Oil Liquids Gas Gas TotalTOTAL ENERPLUS (Mbbls) (Mbbls) (Mbbls) (Mbbls) (MMcf) (MMcf) (MBOE)
Proved Reserves at Dec. 31, 2008 94,553 33,139 127,692 13,052 1,066,534 – 318,500
Acquisitions 413 – 413 5 275 5,000 1,298
Divestments (1,090) – (1,090) (42) (755) – (1,257)
Discoveries 434 – 434 – 949 – 593
Extensions & Improved Recovery 3,299 947 4,246 106 8,890 3,313 6,384
Economic Factors 197 (18) 179 (73) (10,072) – (1,572)
Technical Revisions (2,649) 3,737 1,088 (765) (200,777) 2 (33,141)
Production (8,652) (3,374) (12,026) (1,530) (119,011) (188) (33,423)
Proved Reserves at Dec. 31, 2009 86,505 34,431 120,936 10,753 746,034 8,127 257,382
ENERPLUS RESOURCES 2009 FINANCIAL SUMMARY 71
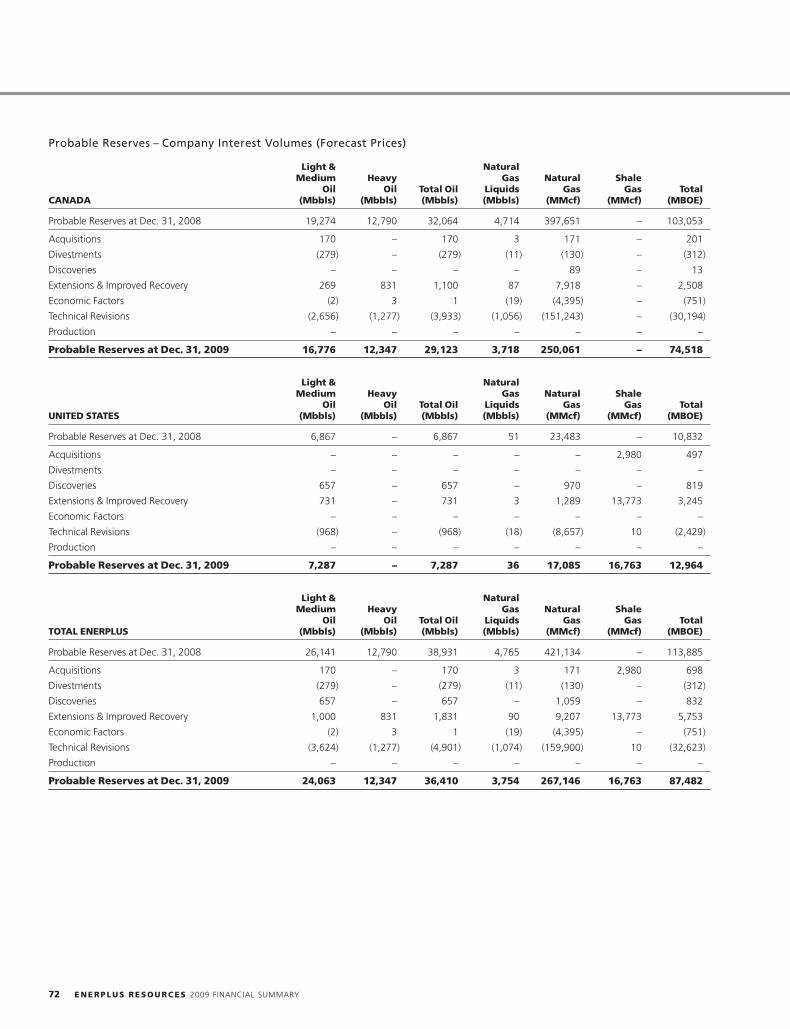
Probable Reserves – Company Interest Volumes (Forecast Prices)
Light & NaturalMedium Heavy Gas Natural Shale
Oil Oil Total Oil Liquids Gas Gas TotalCANADA (Mbbls) (Mbbls) (Mbbls) (Mbbls) (MMcf) (MMcf) (MBOE)
Probable Reserves at Dec. 31, 2008 19,274 12,790 32,064 4,714 397,651 – 103,053
Acquisitions 170 – 170 3 171 – 201
Divestments (279) – (279) (11) (130) – (312)
Discoveries – – – – 89 – 13
Extensions & Improved Recovery 269 831 1,100 87 7,918 – 2,508
Economic Factors (2) 3 1 (19) (4,395) – (751)
Technical Revisions (2,656) (1,277) (3,933) (1,056) (151,243) – (30,194)
Production – – – – – – –
Probable Reserves at Dec. 31, 2009 16,776 12,347 29,123 3,718 250,061 – 74,518
Light & NaturalMedium Heavy Gas Natural Shale
Oil Oil Total Oil Liquids Gas Gas TotalUNITED STATES (Mbbls) (Mbbls) (Mbbls) (Mbbls) (MMcf) (MMcf) (MBOE)
Probable Reserves at Dec. 31, 2008 6,867 – 6,867 51 23,483 – 10,832
Acquisitions – – – – – 2,980 497
Divestments – – – – – – –
Discoveries 657 – 657 – 970 – 819
Extensions & Improved Recovery 731 – 731 3 1,289 13,773 3,245
Economic Factors – – – – – – –
Technical Revisions (968) – (968) (18) (8,657) 10 (2,429)
Production – – – – – – –
Probable Reserves at Dec. 31, 2009 7,287 – 7,287 36 17,085 16,763 12,964
Light & NaturalMedium Heavy Gas Natural Shale
Oil Oil Total Oil Liquids Gas Gas TotalTOTAL ENERPLUS (Mbbls) (Mbbls) (Mbbls) (Mbbls) (MMcf) (MMcf) (MBOE)
Probable Reserves at Dec. 31, 2008 26,141 12,790 38,931 4,765 421,134 – 113,885
Acquisitions 170 – 170 3 171 2,980 698
Divestments (279) – (279) (11) (130) – (312)
Discoveries 657 – 657 – 1,059 – 832
Extensions & Improved Recovery 1,000 831 1,831 90 9,207 13,773 5,753
Economic Factors (2) 3 1 (19) (4,395) – (751)
Technical Revisions (3,624) (1,277) (4,901) (1,074) (159,900) 10 (32,623)
Production – – – – – – –
Probable Reserves at Dec. 31, 2009 24,063 12,347 36,410 3,754 267,146 16,763 87,482
72 ENERPLUS RESOURCES 2009 FINANCIAL SUMMARY
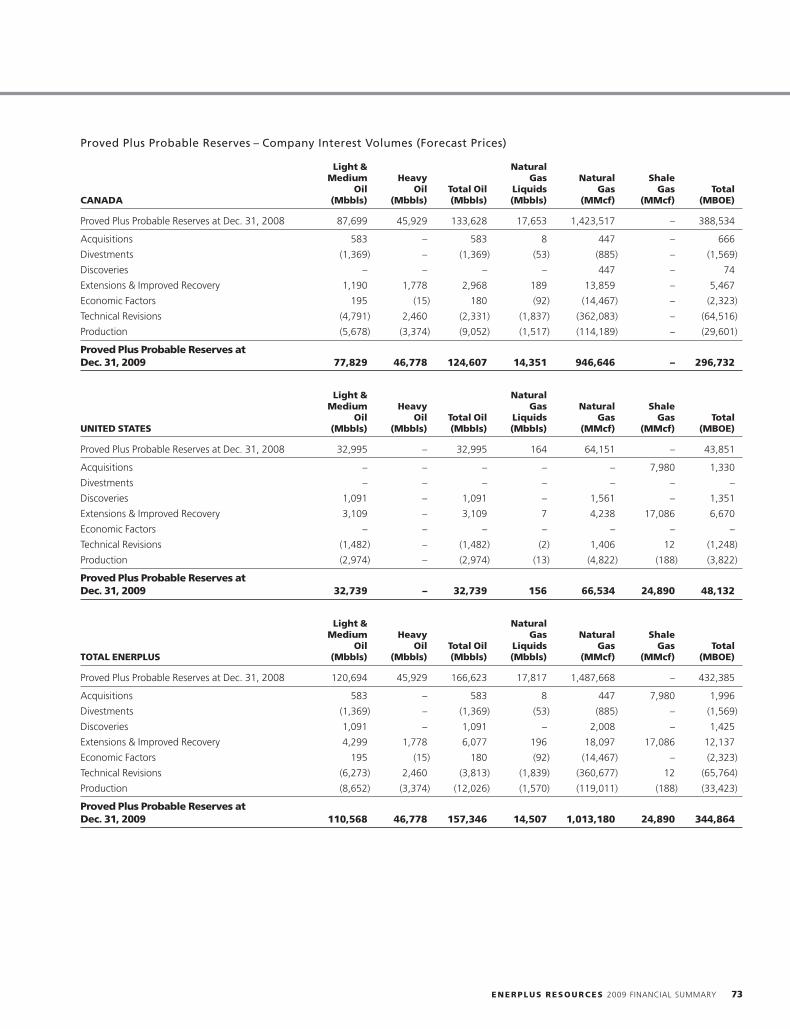
Proved Plus Probable Reserves – Company Interest Volumes (Forecast Prices)
Light & NaturalMedium Heavy Gas Natural Shale
Oil Oil Total Oil Liquids Gas Gas TotalCANADA (Mbbls) (Mbbls) (Mbbls) (Mbbls) (MMcf) (MMcf) (MBOE)
Proved Plus Probable Reserves at Dec. 31, 2008 87,699 45,929 133,628 17,653 1,423,517 – 388,534
Acquisitions 583 – 583 8 447 – 666
Divestments (1,369) – (1,369) (53) (885) – (1,569)
Discoveries – – – – 447 – 74
Extensions & Improved Recovery 1,190 1,778 2,968 189 13,859 – 5,467
Economic Factors 195 (15) 180 (92) (14,467) – (2,323)
Technical Revisions (4,791) 2,460 (2,331) (1,837) (362,083) – (64,516)
Production (5,678) (3,374) (9,052) (1,517) (114,189) – (29,601)
Proved Plus Probable Reserves atDec. 31, 2009 77,829 46,778 124,607 14,351 946,646 – 296,732
Light & NaturalMedium Heavy Gas Natural Shale
Oil Oil Total Oil Liquids Gas Gas TotalUNITED STATES (Mbbls) (Mbbls) (Mbbls) (Mbbls) (MMcf) (MMcf) (MBOE)
Proved Plus Probable Reserves at Dec. 31, 2008 32,995 – 32,995 164 64,151 – 43,851
Acquisitions – – – – – 7,980 1,330
Divestments – – – – – – –
Discoveries 1,091 – 1,091 – 1,561 – 1,351
Extensions & Improved Recovery 3,109 – 3,109 7 4,238 17,086 6,670
Economic Factors – – – – – – –
Technical Revisions (1,482) – (1,482) (2) 1,406 12 (1,248)
Production (2,974) – (2,974) (13) (4,822) (188) (3,822)
Proved Plus Probable Reserves atDec. 31, 2009 32,739 – 32,739 156 66,534 24,890 48,132
Light & NaturalMedium Heavy Gas Natural Shale
Oil Oil Total Oil Liquids Gas Gas TotalTOTAL ENERPLUS (Mbbls) (Mbbls) (Mbbls) (Mbbls) (MMcf) (MMcf) (MBOE)
Proved Plus Probable Reserves at Dec. 31, 2008 120,694 45,929 166,623 17,817 1,487,668 – 432,385
Acquisitions 583 – 583 8 447 7,980 1,996
Divestments (1,369) – (1,369) (53) (885) – (1,569)
Discoveries 1,091 – 1,091 – 2,008 – 1,425
Extensions & Improved Recovery 4,299 1,778 6,077 196 18,097 17,086 12,137
Economic Factors 195 (15) 180 (92) (14,467) – (2,323)
Technical Revisions (6,273) 2,460 (3,813) (1,839) (360,677) 12 (65,764)
Production (8,652) (3,374) (12,026) (1,570) (119,011) (188) (33,423)
Proved Plus Probable Reserves atDec. 31, 2009 110,568 46,778 157,346 14,507 1,013,180 24,890 344,864
ENERPLUS RESOURCES 2009 FINANCIAL SUMMARY 73
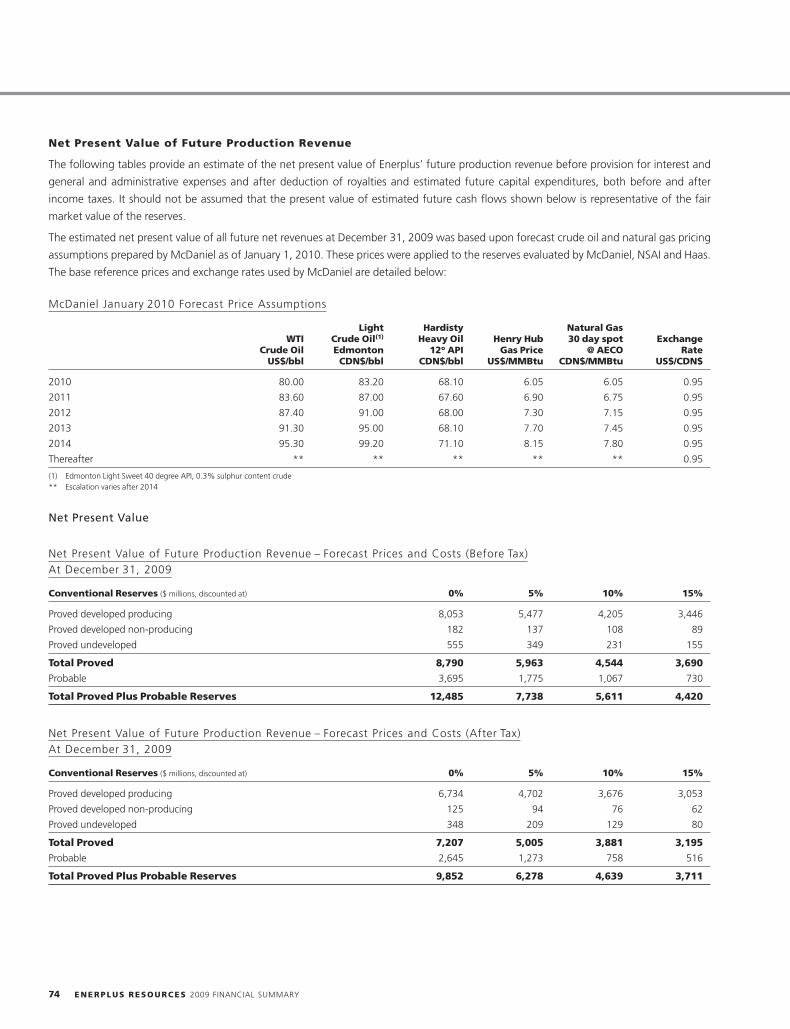
Net Present Value of Future Production Revenue
The following tables provide an estimate of the net present value of Enerplus’ future production revenue before provision for interest and
general and administrative expenses and after deduction of royalties and estimated future capital expenditures, both before and after
income taxes. It should not be assumed that the present value of estimated future cash flows shown below is representative of the fair
market value of the reserves.
The estimated net present value of all future net revenues at December 31, 2009 was based upon forecast crude oil and natural gas pricing
assumptions prepared by McDaniel as of January 1, 2010. These prices were applied to the reserves evaluated by McDaniel, NSAI and Haas.
The base reference prices and exchange rates used by McDaniel are detailed below:
McDaniel January 2010 Forecast Price Assumptions
Light Hardisty Natural GasWTI Crude Oil(1) Heavy Oil Henry Hub 30 day spot Exchange
Crude Oil Edmonton 12o API Gas Price @ AECO RateUS$/bbl CDN$/bbl CDN$/bbl US$/MMBtu CDN$/MMBtu US$/CDN$
2010 80.00 83.20 68.10 6.05 6.05 0.95
2011 83.60 87.00 67.60 6.90 6.75 0.95
2012 87.40 91.00 68.00 7.30 7.15 0.95
2013 91.30 95.00 68.10 7.70 7.45 0.95
2014 95.30 99.20 71.10 8.15 7.80 0.95
Thereafter ** ** ** ** ** 0.95
(1) Edmonton Light Sweet 40 degree API, 0.3% sulphur content crude** Escalation varies after 2014
Net Present Value
Net Present Value of Future Production Revenue – Forecast Prices and Costs (Before Tax)At December 31, 2009
Conventional Reserves ($ millions, discounted at) 0% 5% 10% 15%
Proved developed producing 8,053 5,477 4,205 3,446
Proved developed non-producing 182 137 108 89
Proved undeveloped 555 349 231 155
Total Proved 8,790 5,963 4,544 3,690
Probable 3,695 1,775 1,067 730
Total Proved Plus Probable Reserves 12,485 7,738 5,611 4,420
Net Present Value of Future Production Revenue – Forecast Prices and Costs (After Tax)At December 31, 2009
Conventional Reserves ($ millions, discounted at) 0% 5% 10% 15%
Proved developed producing 6,734 4,702 3,676 3,053
Proved developed non-producing 125 94 76 62
Proved undeveloped 348 209 129 80
Total Proved 7,207 5,005 3,881 3,195
Probable 2,645 1,273 758 516
Total Proved Plus Probable Reserves 9,852 6,278 4,639 3,711
74 ENERPLUS RESOURCES 2009 FINANCIAL SUMMARY
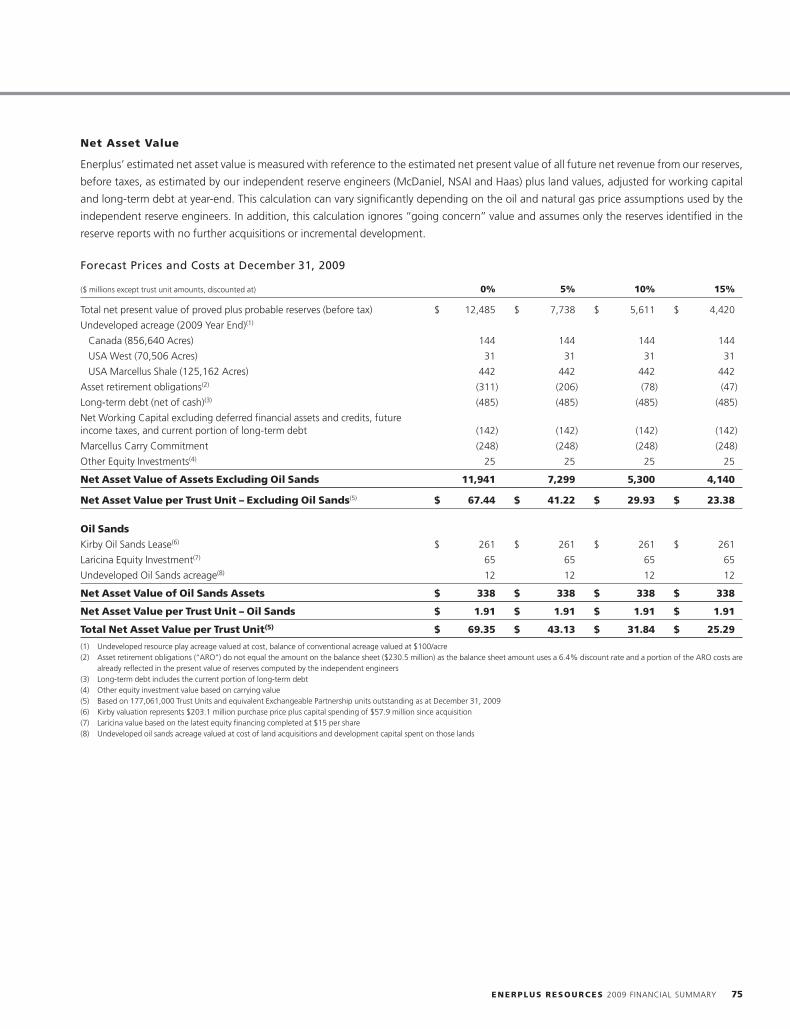
Net Asset Value
Enerplus’ estimated net asset value is measured with reference to the estimated net present value of all future net revenue from our reserves,
before taxes, as estimated by our independent reserve engineers (McDaniel, NSAI and Haas) plus land values, adjusted for working capital
and long-term debt at year-end. This calculation can vary significantly depending on the oil and natural gas price assumptions used by the
independent reserve engineers. In addition, this calculation ignores ‘‘going concern’’ value and assumes only the reserves identified in the
reserve reports with no further acquisitions or incremental development.
Forecast Prices and Costs at December 31, 2009
($ millions except trust unit amounts, discounted at) 0% 5% 10% 15%
Total net present value of proved plus probable reserves (before tax) $ 12,485 $ 7,738 $ 5,611 $ 4,420
Undeveloped acreage (2009 Year End)(1)
Canada (856,640 Acres) 144 144 144 144
USA West (70,506 Acres) 31 31 31 31
USA Marcellus Shale (125,162 Acres) 442 442 442 442
Asset retirement obligations(2) (311) (206) (78) (47)
Long-term debt (net of cash)(3) (485) (485) (485) (485)
Net Working Capital excluding deferred financial assets and credits, futureincome taxes, and current portion of long-term debt (142) (142) (142) (142)
Marcellus Carry Commitment (248) (248) (248) (248)
Other Equity Investments(4) 25 25 25 25
Net Asset Value of Assets Excluding Oil Sands 11,941 7,299 5,300 4,140
Net Asset Value per Trust Unit – Excluding Oil Sands(5) $ 67.44 $ 41.22 $ 29.93 $ 23.38
Oil Sands
Kirby Oil Sands Lease(6) $ 261 $ 261 $ 261 $ 261
Laricina Equity Investment(7) 65 65 65 65
Undeveloped Oil Sands acreage(8) 12 12 12 12
Net Asset Value of Oil Sands Assets $ 338 $ 338 $ 338 $ 338
Net Asset Value per Trust Unit – Oil Sands $ 1.91 $ 1.91 $ 1.91 $ 1.91
Total Net Asset Value per Trust Unit(5) $ 69.35 $ 43.13 $ 31.84 $ 25.29
(1) Undeveloped resource play acreage valued at cost, balance of conventional acreage valued at $100/acre(2) Asset retirement obligations (‘‘ARO’’) do not equal the amount on the balance sheet ($230.5 million) as the balance sheet amount uses a 6.4% discount rate and a portion of the ARO costs are
already reflected in the present value of reserves computed by the independent engineers(3) Long-term debt includes the current portion of long-term debt(4) Other equity investment value based on carrying value(5) Based on 177,061,000 Trust Units and equivalent Exchangeable Partnership units outstanding as at December 31, 2009(6) Kirby valuation represents $203.1 million purchase price plus capital spending of $57.9 million since acquisition(7) Laricina value based on the latest equity financing completed at $15 per share(8) Undeveloped oil sands acreage valued at cost of land acquisitions and development capital spent on those lands
ENERPLUS RESOURCES 2009 FINANCIAL SUMMARY 75
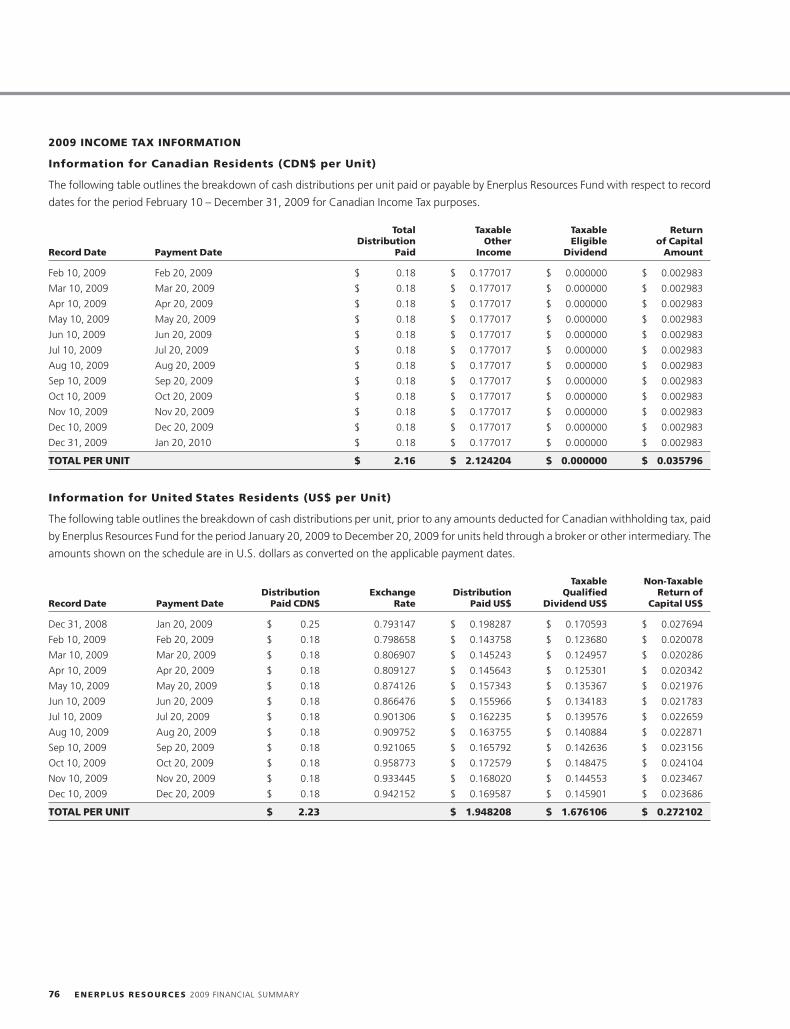
2009 INCOME TAX INFORMATION
Information for Canadian Residents (CDN$ per Unit)
The following table outlines the breakdown of cash distributions per unit paid or payable by Enerplus Resources Fund with respect to record
dates for the period February 10 – December 31, 2009 for Canadian Income Tax purposes.
Total Taxable Taxable ReturnDistribution Other Eligible of Capital
Record Date Payment Date Paid Income Dividend Amount
Feb 10, 2009 Feb 20, 2009 $ 0.18 $ 0.177017 $ 0.000000 $ 0.002983
Mar 10, 2009 Mar 20, 2009 $ 0.18 $ 0.177017 $ 0.000000 $ 0.002983
Apr 10, 2009 Apr 20, 2009 $ 0.18 $ 0.177017 $ 0.000000 $ 0.002983
May 10, 2009 May 20, 2009 $ 0.18 $ 0.177017 $ 0.000000 $ 0.002983
Jun 10, 2009 Jun 20, 2009 $ 0.18 $ 0.177017 $ 0.000000 $ 0.002983
Jul 10, 2009 Jul 20, 2009 $ 0.18 $ 0.177017 $ 0.000000 $ 0.002983
Aug 10, 2009 Aug 20, 2009 $ 0.18 $ 0.177017 $ 0.000000 $ 0.002983
Sep 10, 2009 Sep 20, 2009 $ 0.18 $ 0.177017 $ 0.000000 $ 0.002983
Oct 10, 2009 Oct 20, 2009 $ 0.18 $ 0.177017 $ 0.000000 $ 0.002983
Nov 10, 2009 Nov 20, 2009 $ 0.18 $ 0.177017 $ 0.000000 $ 0.002983
Dec 10, 2009 Dec 20, 2009 $ 0.18 $ 0.177017 $ 0.000000 $ 0.002983
Dec 31, 2009 Jan 20, 2010 $ 0.18 $ 0.177017 $ 0.000000 $ 0.002983
TOTAL PER UNIT $ 2.16 $ 2.124204 $ 0.000000 $ 0.035796
Information for United States Residents (US$ per Unit)
The following table outlines the breakdown of cash distributions per unit, prior to any amounts deducted for Canadian withholding tax, paid
by Enerplus Resources Fund for the period January 20, 2009 to December 20, 2009 for units held through a broker or other intermediary. The
amounts shown on the schedule are in U.S. dollars as converted on the applicable payment dates.
Taxable Non-TaxableDistribution Exchange Distribution Qualified Return of
Record Date Payment Date Paid CDN$ Rate Paid US$ Dividend US$ Capital US$
Dec 31, 2008 Jan 20, 2009 $ 0.25 0.793147 $ 0.198287 $ 0.170593 $ 0.027694
Feb 10, 2009 Feb 20, 2009 $ 0.18 0.798658 $ 0.143758 $ 0.123680 $ 0.020078
Mar 10, 2009 Mar 20, 2009 $ 0.18 0.806907 $ 0.145243 $ 0.124957 $ 0.020286
Apr 10, 2009 Apr 20, 2009 $ 0.18 0.809127 $ 0.145643 $ 0.125301 $ 0.020342
May 10, 2009 May 20, 2009 $ 0.18 0.874126 $ 0.157343 $ 0.135367 $ 0.021976
Jun 10, 2009 Jun 20, 2009 $ 0.18 0.866476 $ 0.155966 $ 0.134183 $ 0.021783
Jul 10, 2009 Jul 20, 2009 $ 0.18 0.901306 $ 0.162235 $ 0.139576 $ 0.022659
Aug 10, 2009 Aug 20, 2009 $ 0.18 0.909752 $ 0.163755 $ 0.140884 $ 0.022871
Sep 10, 2009 Sep 20, 2009 $ 0.18 0.921065 $ 0.165792 $ 0.142636 $ 0.023156
Oct 10, 2009 Oct 20, 2009 $ 0.18 0.958773 $ 0.172579 $ 0.148475 $ 0.024104
Nov 10, 2009 Nov 20, 2009 $ 0.18 0.933445 $ 0.168020 $ 0.144553 $ 0.023467
Dec 10, 2009 Dec 20, 2009 $ 0.18 0.942152 $ 0.169587 $ 0.145901 $ 0.023686
TOTAL PER UNIT $ 2.23 $ 1.948208 $ 1.676106 $ 0.272102
76 ENERPLUS RESOURCES 2009 FINANCIAL SUMMARY
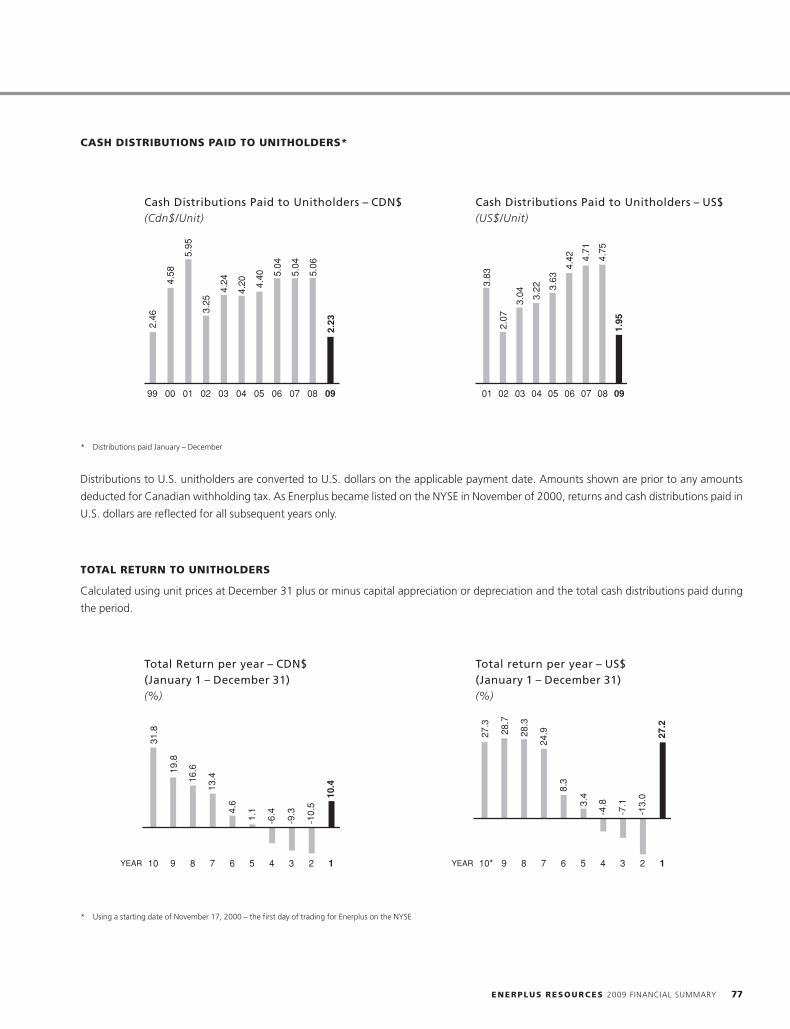
20FEB201003175623 20FEB201003175984
20FEB201003180219 20FEB201003180527
CASH DISTRIBUTIONS PAID TO UNITHOLDERS*
Cash Distributions Paid to Unitholders – CDN$ Cash Distributions Paid to Unitholders – US$(Cdn$/Unit) (US$/Unit)
4.58
5.95
3.25
4.24
4.20 4.
40 5.04
5.04
5.06
2.232.46
99 00 01 02 03 04 05 06 07 08 09
3.22 3.
63
4.42
3.83
3.04
2.07
4.71
4.75
1.95
0201 03 04 05 06 07 08 09
* Distributions paid January – December
Distributions to U.S. unitholders are converted to U.S. dollars on the applicable payment date. Amounts shown are prior to any amounts
deducted for Canadian withholding tax. As Enerplus became listed on the NYSE in November of 2000, returns and cash distributions paid in
U.S. dollars are reflected for all subsequent years only.
TOTAL RETURN TO UNITHOLDERS
Calculated using unit prices at December 31 plus or minus capital appreciation or depreciation and the total cash distributions paid during
the period.
Total Return per year – CDN$ Total return per year – US$(January 1 – December 31) (January 1 – December 31)(%) (%)
10YEAR 9
31.8
19.8
16.6
13.4
4.6
1.1
-6.4
-9.3
-10.
5
10.4
8 7 6 5 4 3 2 1 10*YEAR 9
27.3
28.7
28.3
24.9
8.3
3.4
-4.8
-7.1
-13.
0
27.2
8 7 6 5 4 3 2 1
* Using a starting date of November 17, 2000 – the first day of trading for Enerplus on the NYSE
ENERPLUS RESOURCES 2009 FINANCIAL SUMMARY 77
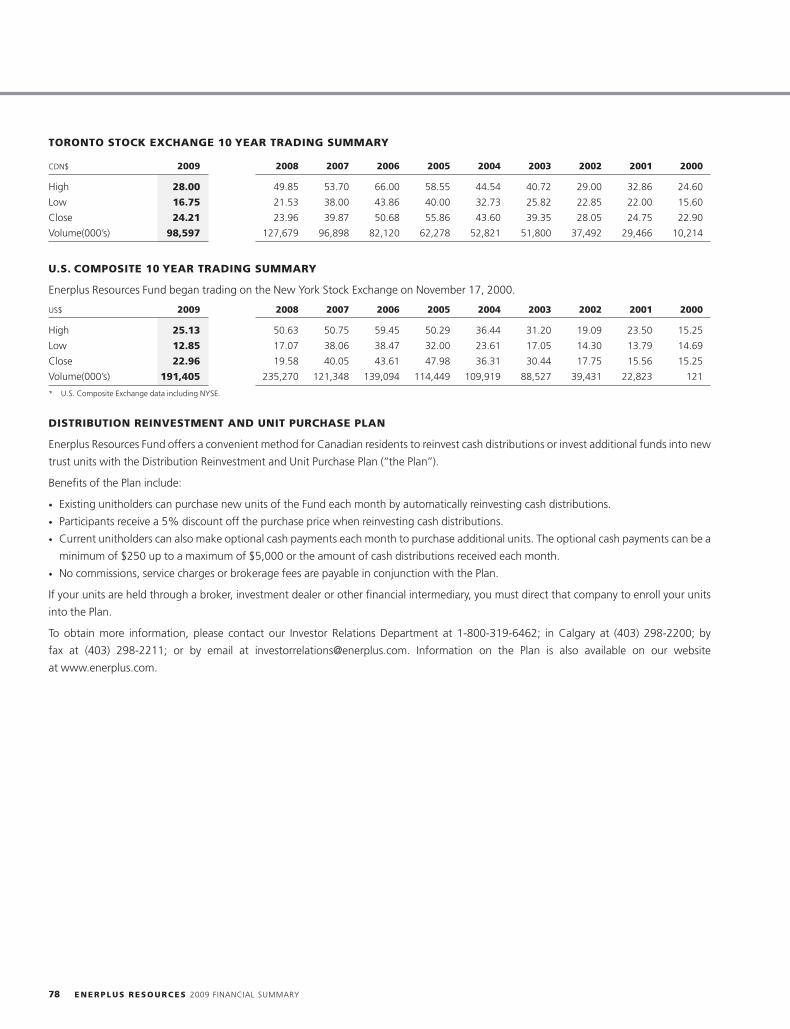
TORONTO STOCK EXCHANGE 10 YEAR TRADING SUMMARY
CDN$ 2009 2008 2007 2006 2005 2004 2003 2002 2001 2000
High 28.00 49.85 53.70 66.00 58.55 44.54 40.72 29.00 32.86 24.60
Low 16.75 21.53 38.00 43.86 40.00 32.73 25.82 22.85 22.00 15.60
Close 24.21 23.96 39.87 50.68 55.86 43.60 39.35 28.05 24.75 22.90
Volume(000’s) 98,597 127,679 96,898 82,120 62,278 52,821 51,800 37,492 29,466 10,214
U.S. COMPOSITE 10 YEAR TRADING SUMMARY
Enerplus Resources Fund began trading on the New York Stock Exchange on November 17, 2000.
US$ 2009 2008 2007 2006 2005 2004 2003 2002 2001 2000
High 25.13 50.63 50.75 59.45 50.29 36.44 31.20 19.09 23.50 15.25
Low 12.85 17.07 38.06 38.47 32.00 23.61 17.05 14.30 13.79 14.69
Close 22.96 19.58 40.05 43.61 47.98 36.31 30.44 17.75 15.56 15.25
Volume(000’s) 191,405 235,270 121,348 139,094 114,449 109,919 88,527 39,431 22,823 121
* U.S. Composite Exchange data including NYSE.
DISTRIBUTION REINVESTMENT AND UNIT PURCHASE PLAN
Enerplus Resources Fund offers a convenient method for Canadian residents to reinvest cash distributions or invest additional funds into new
trust units with the Distribution Reinvestment and Unit Purchase Plan (‘‘the Plan’’).
Benefits of the Plan include:
• Existing unitholders can purchase new units of the Fund each month by automatically reinvesting cash distributions.
• Participants receive a 5% discount off the purchase price when reinvesting cash distributions.
• Current unitholders can also make optional cash payments each month to purchase additional units. The optional cash payments can be a
minimum of $250 up to a maximum of $5,000 or the amount of cash distributions received each month.
• No commissions, service charges or brokerage fees are payable in conjunction with the Plan.
If your units are held through a broker, investment dealer or other financial intermediary, you must direct that company to enroll your units
into the Plan.
To obtain more information, please contact our Investor Relations Department at 1-800-319-6462; in Calgary at (403) 298-2200; by
fax at (403) 298-2211; or by email at [email protected]. Information on the Plan is also available on our website
at www.enerplus.com.
78 ENERPLUS RESOURCES 2009 FINANCIAL SUMMARY
Abbreviations
AECO A reference to the physical storage and trading hub on Mcf/day thousand cubic feet per day
the TransCanada Alberta Transmission System (NOVA) which is Mcfe/day thousand cubic feet equivalent per daythe delivery point for the various benchmark Alberta Index prices
MMbbl(s) million barrelsAOCI accumulated other comprehensive income
MMBOE million barrels of oil equivalentAPI American Petroleum Institute
MMBtu million British Thermal Unitsbbl(s)/day barrel(s) per day, with each barrel representing
MMBtu/day million British Thermal Units per day34.972 Imperial gallons or 42 U.S. gallons
MMcf/day million cubic feet per dayBcf billion cubic feet
MMcfe/day million cubic feet equivalent per dayBOE(s)/day barrel of oil equivalent per day (6 Mcf of
MWh megawatt hour(s) of electricitygas:1 BOE)
NGLs natural gas liquidsCBM coalbed methane, otherwise known as natural gas from
coal – NGC NI 51-101 National Instrument 51-101 Oil and Gas Activities
adopted by the Canadian Securities regulatory authoritiesCOGPE Canadian oil and gas property expense(pertaining to reserve reporting in Canada)
CTA cumulative translation adjustmentOCI other comprehensive income
F&D Costs finding and development costsP+P Reserves proved plus probable reserves
FD&A Costs finding, development and acquisition costsPDP Reserves proved developed producing reserves
FDC future development capitalRLI reserve life index
GORR gross overriding royaltySAGD steam assisted gravity drainage
HH ‘‘Henry Hub’’ A reference to the physical storage andWI percentage working interest ownershiptrading hub in Louisiana which is the delivery point for the
NYMEX Natural Gas contract WTI West Texas Intermediate oil at Cushing, Oklahoma, the
benchmark for North American crude oil pricing purposesMbbls thousand barrels
MBOE thousand barrels of oil equivalent
ENERPLUS RESOURCES 2009 FINANCIAL SUMMARY 79
Definitions
Bitumen A highly viscous oil which is too thick to flow in its Oil, light & medium Oil that has a density of 22.3 degrees
native state and which cannot be produced without altering its API or higher.
viscosity. The density of bitumen is generally less than 10 degreesOperating Income Calculated as revenues from oil and gas
API.sales less cash hedging costs, transportation costs, royalties and
BOE Barrels of oil equivalent converting 6 Mcf of natural gas to operating costs.
one barrel of oil equivalent and one barrel of natural gas liquidsProduction, gross Our working interest (operated and
to one barrel of oil equivalent. The factor used to convert naturalnon-operated) share of production before the deduction of any
gas and natural gas liquids to oil equivalent is not based on eitherroyalty interest production. Unless otherwise stated, all
energy content or prices but is a commonly used industryproduction volumes utilized in any discussions or calculations are
benchmark. BOEs may be misleading, particularly if used ingross production volumes.
isolation. A BOE conversion ratio of 6 Mcf:1 BOE is based on anProduction per Debt-Adjusted Unit Production per unit isenergy equivalency conversion method primarily applicable at themeasured in respect of the average production for the year, andburner tip and does not represent a value equivalency at thethe weighted average number of trust units outstanding duringwellhead.the year. The measurements are then debt-adjusted by assuming
Drilling Success Rate Measures our drilling success based onadditional trust units are issued at quarter-end unit prices to
wells drilled, tied-in or cased.replace long-term debt outstanding at each quarter-end. The
F&D Costs Finding and development costs. Calculated as total average number of trust units created over the four quarters is
capital expenditures, exclusive of acquisitions or divestments, and then added to the weighted average number of trust units to
including changes in future development capital, divided by the obtain the debt-adjusted number of trust units for the year.
applicable reserve additions (proved and/or proved plus probable).Recycle Ratio Calculated as operating income per BOE
It is a measure of the effectiveness of a company’s capitaldivided by FD&A costs per BOE. It is an indication of the value
program.creation of each dollar invested.
FD&A Costs Finding, development and acquisition costs.Reserve Life Index Calculated as proved reserves at year-end
Calculated as total capital expenditures and net acquisitions,divided by the following year’s estimate.
including changes in future development capital, divided byResource Play Large, aerially extensive accumulations ofreserve additions (proved and/or proved plus probable). It is adiscovered oil, natural gas and bitumen with limited geologicalmeasure of a company’s ability to add reserves in a cost effectiverisk. Resource plays typically cover large geographic areas andmanner.require many wells to develop the play over time. With a large
Future Development Capital Future Development Capital isnumber of wells generating relatively predictable production and
defined as those costs which reflect the independent evaluator’sdecline profiles, the timing, cost, and production rates and
best estimate of what it will cost to bring the proved undevelopedreserve additions associated with the resource play can be more
and probable reserves on production in the future. Changes toaccurately predicted.
this figure occur annually as a result of development activities,Proved Proved production volumes as determined by theacquisition and disposition activities, and capital cost estimateindependent reserve engineering report for 2003 and forward,revisions.and management’s estimate for all prior years.
NGLs Natural gas liquids – hydrocarbon components that canReserve Life Index, Proved plus Probable Calculated asbe recovered from natural gas as liquids, including, but notproved plus probable reserves at year-end (established reserves forlimited to, ethane, propane, butanes, pentanes plus, condensateyears 2002 and prior) divided by the following year’s estimatedand small quantities of non-hydrocarbons.proved plus probable production volumes as determined by the
Oil, heavy Oil with a density between 10 to 22.3 degrees APIindependent reserve engineering report for 2003 and forward
or where a royalty regime exists specific to heavy oil, it is definedand management’s estimate for all prior years.
based upon that royalty regime.
80 ENERPLUS RESOURCES 2009 FINANCIAL SUMMARY
Reserves, Company Interest Our working interest than proved reserves. It is equally likely that the actual remaining
(operated and non-operated) share of reserves before the quantities recovered will be greater or less than the sum of the
deduction of any royalty interest reserves, but inclusive of any estimated proved plus probable reserves.
royalty interest reserves owned by Enerplus. Unless otherwiseReserves, Proved Reserves that can be estimated with a high
stated, reserve volumes utilized in any discussions or calculationsdegree of certainty to be recoverable in accordance with
are company interest reserves. ‘‘Company interest’’ is not a termNI 51-101. It is likely that the actual remaining quantities
defined in National Instrument 51-101 adopted by the Canadianrecovered will exceed the estimated proved reserves.
Securities regulatory authorities and does not have a standardizedReserves, Proved Developed Non-Producing Reservesmeaning under NI 51-101 and therefore disclosure of ourthat have either not been on production or have previously beencompany interest reserves may not be comparable to disclosure ofon production, but are shut-in, and the date of resumption ofreserves by other issuers.production is unknown.
Reserves, Gross Our working interest (operated andReserves, Proved Developed Producing Reserves that arenon-operated) share of reserves before the deduction of anyexpected to be recovered from completion intervals open at theroyalty interest reserves but exclusive of royalty interest reservestime of the estimate. These reserves may be currently producingowned by Enerplus.or, if shut-in, they must have previously been on production, and
Reserves, Net Our working interest (operated andthe date of resumption of production must be known with
non-operated) share of reserves after the deduction of royaltyreasonable certainty.
interest reserves but inclusive of any royalty interest reservesReserves, Proved Undeveloped Reserves expected to beowned by Enerplus.recovered from known accumulations where a significant
Reserves per Debt-Adjusted Unit Reserves per trust unitexpenditure (for example, when compared to the cost of drilling a
are measured in respect of year-end proved plus probable reserveswell) is required to render them capable of production.
and the number of trust units outstanding at year-end. ToSAGD Steam assisted gravity drainage, an in situ productioneliminate the temporary timing effects of financing decisions, weprocess used to recover bitumen from oil sands.have debt-adjusted these measurements by assuming we issue
additional trust units at year-end prices to replace year-endTotal Return Calculated using the change in the trust unit
long-term debt.price from the start of the period (including any capital
appreciation or depreciation) and the total cash distributions paidReserves, Probable Additional reserves, calculated induring the period divided by the starting unit price.accordance with NI 51-101, that are less certain to be recovered
ENERPLUS RESOURCES 2009 FINANCIAL SUMMARY 81

5MAR200823330178 2MAR200921222174 5MAR200823340697
5MAR200823331207 5MAR200823334429 11MAR200821435253
11MAR200821443622 5MAR200823445158 5MAR200823451898
12MAR200923464932 5MAR200823325127
Board of Directors
Douglas R. Martin(1)(2) David O’Brien(3) Harry B. Wheeler(5)(7)
President Corporate Director Corporate DirectorCharles Avenue Capital Corp. Calgary, Alberta Calgary, AlbertaCalgary, Alberta
Edwin V. Dodge(9)(12) Glen D. Roane(5)(10) Clayton Woitas(7)(11)
Corporate Director Corporate Director PresidentVancouver, British Columbia Canmore, Alberta Range Royalty Management Ltd.
Calgary, Alberta
Robert B. Hodgins(3)(6) W. C. (Mike) Seth(3)(8) Robert L. Zorich(4)(9)
Corporate Director President Managing DirectorCalgary, Alberta Seth Consultants Ltd. EnCap Investments L.P.
Calgary, Alberta Houston, Texas
Gordon J. Kerr Donald T. West(7)(11)
President & Chief Executive Officer Corporate DirectorEnerplus Resources Fund Calgary, AlbertaCalgary, Alberta
(1) Chairman of the Board (5) Member of the Audit & Risk Management (10) Chairman of the Compensation & Human(2) Ex-Officio member of all Committees of the Committee Resources Committee
Board (6) Chairman of the Audit & Risk Management (11) Member of the Environment, Health & Safety(3) Member of the Corporate Governance & Committee Committee
Nominating Committee (7) Member of the Reserves Committee (12) Chairman of the Environment, Health & Safety(4) Chairman of the Corporate Governance & (8) Chairman of the Reserves Committee Committee
Nominating Committee (9) Member of the Compensation & HumanResources Committee
82 ENERPLUS RESOURCES 2009 FINANCIAL SUMMARY

12MAR200923464932 12MAR200923491421 5MAR200906411876 22FEB201011360115
5MAR200906414351 22FEB201011362338 5MAR200906572793 5MAR200906422172
5MAR200906580691 5MAR200906424665 5MAR200906425720 5MAR200906431133
5MAR200906402542 5MAR200906404903 5MAR200906410384
Officers
Gordon J. Kerr Ray J. Daniels Robert A. Kehrig Robert W. SymondsPresident & Vice President, Development Vice President, Vice President,Chief Executive Officer Services & Oil Sands Resource Development Canadian Operations
Ian C. Dundas Rodney D. Gray Jennifer F. Koury Kenneth W. YoungExecutive Vice President Vice President, Finance Vice President, Vice President, Land
Corporate Services
Robert J. Waters Dana W. Johnson Eric G. Le Dain Jodine J. Jenson LabrieSenior Vice President & President, U.S. Operations Vice President, Strategic Planning, Controller, FinanceChief Financial Officer Reserves & Marketing
Jo-Anne M. Caza Lyonel G. Kawa David A. McCoyVice President, Corporate & Vice President, Vice President, General Counsel &Investor Relations Information Services Corporate Secretary
ENERPLUS RESOURCES 2009 FINANCIAL SUMMARY 83
Corporate Information
Operating Companies Owned by Stock Exchange Listings and Trading Symbols
Enerplus Resources Fund Toronto Stock Exchange: ERF.un
New York Stock Exchange: ERFEnerMark Inc.
Enerplus Resources Corporation U.S. Office
Enerplus Commercial Trust Wells Fargo Center
Enerplus Resources (USA) Corporation 1300, 1700 Lincoln Street
FET Operational Partnership Denver, Colorado 80203
Telephone: 720.279.5500Legal CounselFax: 720.279.5550Blake, Cassels & Graydon LLP
Calgary, AlbertaAnnual General Meeting
Unitholders are encouraged to attend the Annual GeneralAuditorsMeeting being held on:Deloitte & Touche LLP
Calgary, Alberta Friday, May 7, 2010
10:00 am MTTransfer Agent
The Metropolitan CentreComputershare Trust Company of Canada
Lecture TheatreCalgary, Alberta
333 - 4th Avenue SWToll free: 1.866.921.0978
Calgary, Alberta
U.S. Co-Transfer Agent
Computershare Trust Company, N.A.
Golden, Colorado
Independent Reserve Engineers
McDaniel & Associates Consultants Ltd.
Calgary, Alberta
GLJ Petroleum Consultants Ltd.
Calgary, Alberta
Netherland, Sewell & Associates Inc.
Dallas, Texas
Haas Petroleum Engineering Services, Inc.
Dallas, Texas
84 ENERPLUS RESOURCES 2009 FINANCIAL SUMMARY


30%
Cert no. SW-COC-002068
The Dome Tower
3000, 333 – 7th Avenue S.W.
Calgary, Alberta T2P 2Z1
Tel. 403.298.2200
Toll Free 1.800.319.6462
Fax 403.298.2211
www.enerplus.com


![Three months ended December 31, Year ended December 31, … · 2016-01-27 · Three months ended December 31, Year ended December 31, 2015 2014 Change ~¦u]oo]}v 2015 2014 Change](https://static.fdocuments.us/doc/165x107/5f05bacd7e708231d41469d5/three-months-ended-december-31-year-ended-december-31-2016-01-27-three-months.jpg)

