Search of visually similar microscopic rock...
10
Comput Geosci DOI 10.1007/s10596-014-9459-2 ORIGINAL PAPER Search of visually similar microscopic rock images Magdalena Ladniak · Mariusz Mlynarczuk Received: 24 June 2014 / Accepted: 29 October 2014 © The Author(s) 2014. This article is published with open access at Springerlink.com Abstract The present paper discusses the essential tenets of the method whose purpose is to enable effective search of images of given rock in multimedia databases. The search is based exclusively on an image request, to which the system’s response is a set of images presenting visu- ally similar rocks. The images that constitute the basis of the discussed research had been registered with an opti- cal microscope. The collection of images that were used in the process of performing measurements encompassed 5700 digital images presenting 19 rock types. The pro- posed method is based on the application of image analysis and artificial intelligence concepts. The very process of inference, in turn, makes use of the methods of data classi- fication and grouping. In the paper, the authors demonstrate that these may turn out to be effective mathematical meth- ods, successfully applied to the problem of image search, performed with imagings presenting rock textures. The dis- cussed system concept, based on a feature space defined by the authors, successfully matches up images with the refer- ence standard. The effectiveness rate of that process is very high (very often, it is 100 %). Failed classifications concern only the images which differ visually—in a considerable way—from the rest of the images within a given group. The proposed system concept is to facilitate the decision- making process involved in determining the similarity of investigated objects. In the opinion of the authors, it meets M. Ladniak () · M. Mlynarczuk Faculty of Geology, Geophysics and Environmental Protection, AGH University of Science and Technology, al. Mickiewicza 30, 30-059, Cracow, Poland e-mail: [email protected] M. Mlynarczuk e-mail: [email protected] the requirements—and, as such, can be applied to the prob- lem of searching for images in databases, searching discs in order to find images of given rocks and automatic informa- tion gain on the basis of video sequences, e.g., in order to find frames presenting particular rock structures. Keywords Search by image · Image exploration · Artificial intelligence · Cluster analysis · Data analysis · Image processing 1 Introduction In recent years, obtaining, storing, and sharing multime- dia data have been influenced by the dynamic development of information technology. It is no longer the case that multimedia data is connected with a given PC or stor- age medium—on the contrary, it is widely available as databases, stored on network servers and accessed simul- taneously by a number of users (Fig. 1). Such a tendency necessitates optimizing the way in which the data in ques- tion is organized, analyzed, and interpreted. In particular, this concerns visual data (such as digital photos or videos). It is a dynamically developing issue in medicine and the broader bioinformatics [28, 29]. Such data is successfully explored by means of methods of digital image processing (e.g., the ones that facilitate stereological analysis) [22] and [12] and methods involving artificial intelligence (such as teaching neural networks) [27]. The combination of these methods results in obtaining highly specialized algorithms of image content analysis. Such issues are also investigated in relation to geological and mining data [24, 25] and the results reported by researchers seem to be very promising. However, it needs to be remembered that obtaining high- quality analysis results—such as those presented by the
Transcript of Search of visually similar microscopic rock...
Comput GeosciDOI 10.1007/s10596-014-9459-2
ORIGINAL PAPER
Search of visually similar microscopic rock images
Magdalena Ładniak · Mariusz Młynarczuk
Received: 24 June 2014 / Accepted: 29 October 2014© The Author(s) 2014. This article is published with open access at Springerlink.com
Abstract The present paper discusses the essential tenetsof the method whose purpose is to enable effective searchof images of given rock in multimedia databases. Thesearch is based exclusively on an image request, to whichthe system’s response is a set of images presenting visu-ally similar rocks. The images that constitute the basis ofthe discussed research had been registered with an opti-cal microscope. The collection of images that were usedin the process of performing measurements encompassed5700 digital images presenting 19 rock types. The pro-posed method is based on the application of image analysisand artificial intelligence concepts. The very process ofinference, in turn, makes use of the methods of data classi-fication and grouping. In the paper, the authors demonstratethat these may turn out to be effective mathematical meth-ods, successfully applied to the problem of image search,performed with imagings presenting rock textures. The dis-cussed system concept, based on a feature space defined bythe authors, successfully matches up images with the refer-ence standard. The effectiveness rate of that process is veryhigh (very often, it is 100 %). Failed classifications concernonly the images which differ visually—in a considerableway—from the rest of the images within a given group.The proposed system concept is to facilitate the decision-making process involved in determining the similarity ofinvestigated objects. In the opinion of the authors, it meets
M. Ładniak (�) · M. MłynarczukFaculty of Geology, Geophysics and Environmental Protection,AGH University of Science and Technology, al. Mickiewicza 30,30-059, Cracow, Polande-mail: [email protected]
M. Młynarczuke-mail: [email protected]
the requirements—and, as such, can be applied to the prob-lem of searching for images in databases, searching discs inorder to find images of given rocks and automatic informa-tion gain on the basis of video sequences, e.g., in order tofind frames presenting particular rock structures.
Keywords Search by image · Image exploration ·Artificial intelligence · Cluster analysis · Data analysis ·Image processing
1 Introduction
In recent years, obtaining, storing, and sharing multime-dia data have been influenced by the dynamic developmentof information technology. It is no longer the case thatmultimedia data is connected with a given PC or stor-age medium—on the contrary, it is widely available asdatabases, stored on network servers and accessed simul-taneously by a number of users (Fig. 1). Such a tendencynecessitates optimizing the way in which the data in ques-tion is organized, analyzed, and interpreted. In particular,this concerns visual data (such as digital photos or videos).It is a dynamically developing issue in medicine and thebroader bioinformatics [28, 29]. Such data is successfullyexplored by means of methods of digital image processing(e.g., the ones that facilitate stereological analysis) [22] and[12] and methods involving artificial intelligence (such asteaching neural networks) [27]. The combination of thesemethods results in obtaining highly specialized algorithmsof image content analysis. Such issues are also investigatedin relation to geological and mining data [24, 25] and theresults reported by researchers seem to be very promising.However, it needs to be remembered that obtaining high-quality analysis results—such as those presented by the
Comput Geosci
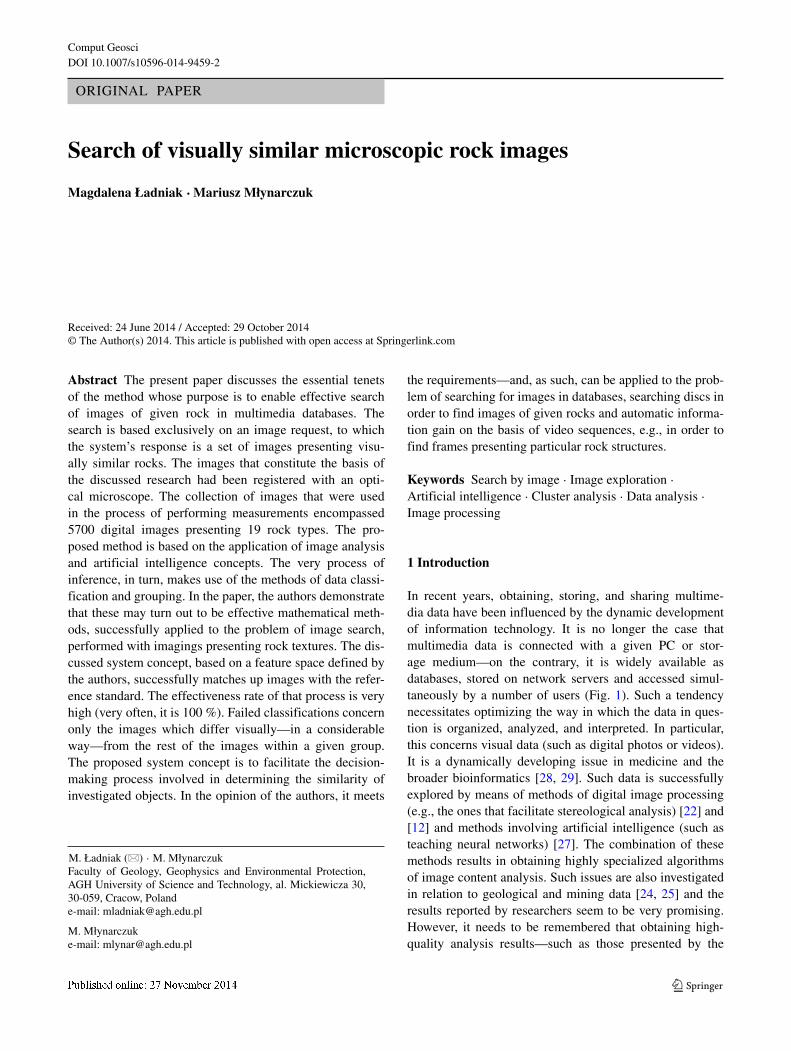
Fig. 1 Sharing researchresources among multiplescientific and industrial units
authors of well-known scientific publications [3] and [16]and [19]—is connected with using sophisticated learningdata sets, due to which proposed algorithms make decisionsconcerning the analysis of investigated objects.
Such an approach, though very efficient, cannot beadopted when exploring a database that was not previouslydescribed, i.e., a database about which the algorithm has noa priori knowledge, neither in the form of text descriptions,nor in the form of previously defined learning sequences.An example can be the problem of searching for visuallysimilar rock structure images. The key to such a search isone image, solely. Thus, the authors propose to use non-model methods of data exploration in order to construct analgorithm facilitating the process of determining the visualsimilarity between rock structure imagings.
2 Image search—a description
Usually, the technological progress in mining and geol-ogy requires thorough reconnaissance of rocks and a rockmassif. This often involves the obligatory determination ofparameters of the observed rock structures. Here, image
analysis [9] and [14] proves an effective method, whicheventually leaves researchers with constantly increasingdatabases containing digital multimedia materials. The ever-increasing amount of data in such data collections, as well asconsolidating collections from various independent researchteams at big scientific and industrial consortiums (Fig. 1),make the processes of exploring databases and searching forthe desired images extremely difficult [17].
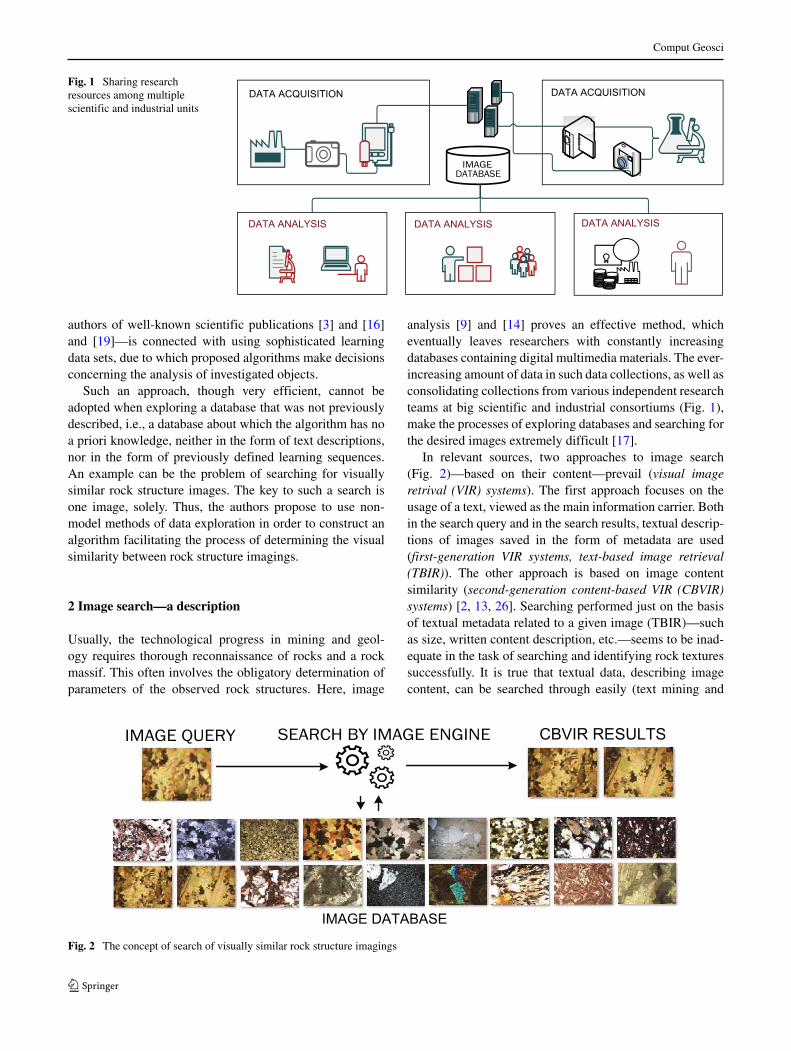
In relevant sources, two approaches to image search(Fig. 2)—based on their content—prevail (visual imageretrival (VIR) systems). The first approach focuses on theusage of a text, viewed as the main information carrier. Bothin the search query and in the search results, textual descrip-tions of images saved in the form of metadata are used(first-generation VIR systems, text-based image retrieval(TBIR)). The other approach is based on image contentsimilarity (second-generation content-based VIR (CBVIR)systems) [2, 13, 26]. Searching performed just on the basisof textual metadata related to a given image (TBIR)—suchas size, written content description, etc.—seems to be inad-equate in the task of searching and identifying rock texturessuccessfully. It is true that textual data, describing imagecontent, can be searched through easily (text mining and
IMAGE DATABASE
CBVIR RESULTS
Fig. 2 The concept of search of visually similar rock structure imagings
Comput Geosci
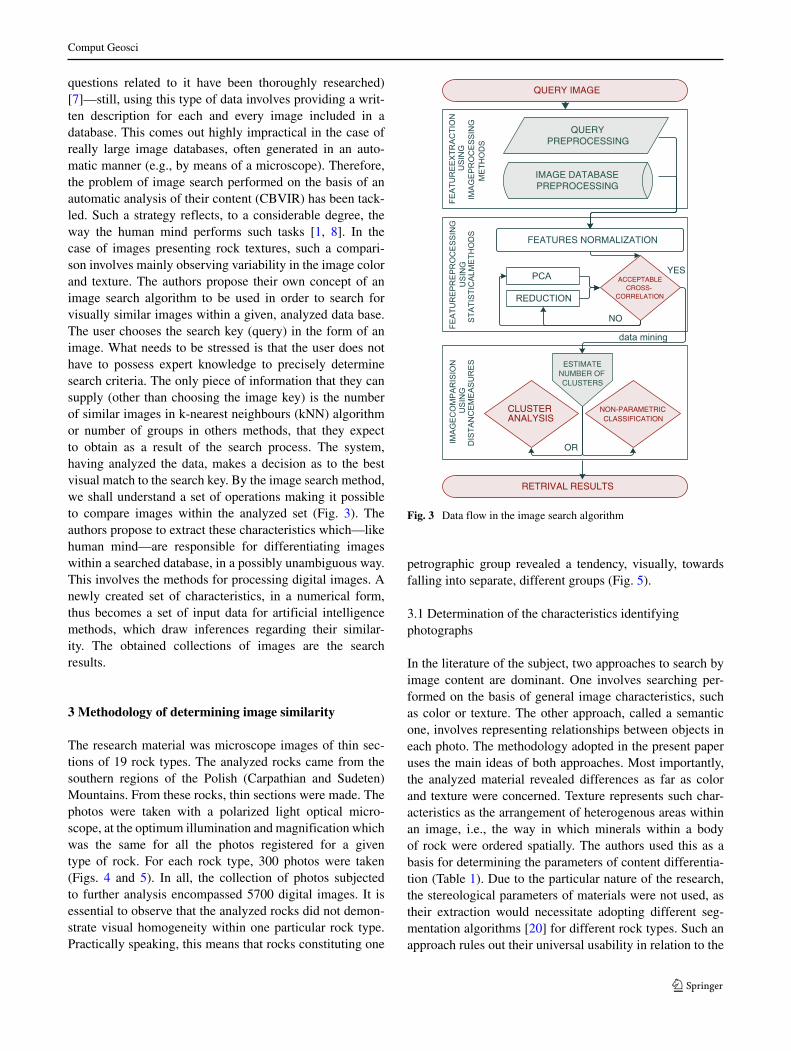
questions related to it have been thoroughly researched)[7]—still, using this type of data involves providing a writ-ten description for each and every image included in adatabase. This comes out highly impractical in the case ofreally large image databases, often generated in an auto-matic manner (e.g., by means of a microscope). Therefore,the problem of image search performed on the basis of anautomatic analysis of their content (CBVIR) has been tack-led. Such a strategy reflects, to a considerable degree, theway the human mind performs such tasks [1, 8]. In thecase of images presenting rock textures, such a compari-son involves mainly observing variability in the image colorand texture. The authors propose their own concept of animage search algorithm to be used in order to search forvisually similar images within a given, analyzed data base.The user chooses the search key (query) in the form of animage. What needs to be stressed is that the user does nothave to possess expert knowledge to precisely determinesearch criteria. The only piece of information that they cansupply (other than choosing the image key) is the numberof similar images in k-nearest neighbours (kNN) algorithmor number of groups in others methods, that they expectto obtain as a result of the search process. The system,having analyzed the data, makes a decision as to the bestvisual match to the search key. By the image search method,we shall understand a set of operations making it possibleto compare images within the analyzed set (Fig. 3). Theauthors propose to extract these characteristics which—likehuman mind—are responsible for differentiating imageswithin a searched database, in a possibly unambiguous way.This involves the methods for processing digital images. Anewly created set of characteristics, in a numerical form,thus becomes a set of input data for artificial intelligencemethods, which draw inferences regarding their similar-ity. The obtained collections of images are the searchresults.
3 Methodology of determining image similarity
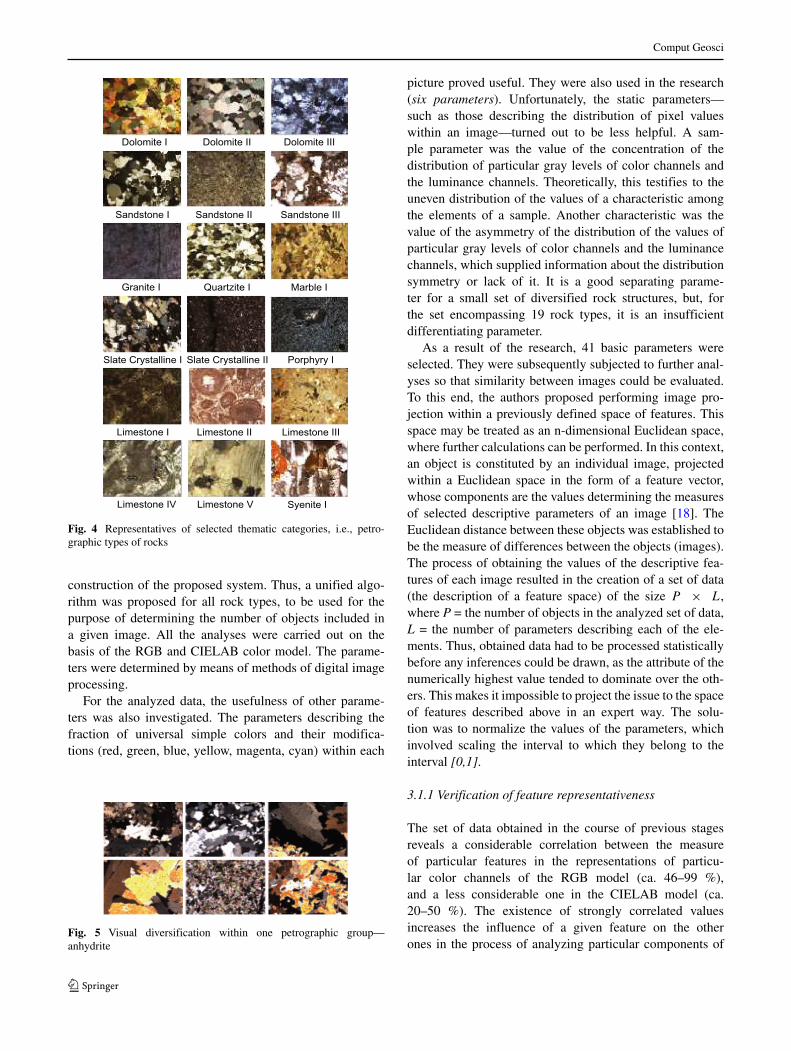
The research material was microscope images of thin sec-tions of 19 rock types. The analyzed rocks came from thesouthern regions of the Polish (Carpathian and Sudeten)Mountains. From these rocks, thin sections were made. Thephotos were taken with a polarized light optical micro-scope, at the optimum illumination and magnification whichwas the same for all the photos registered for a giventype of rock. For each rock type, 300 photos were taken(Figs. 4 and 5). In all, the collection of photos subjectedto further analysis encompassed 5700 digital images. It isessential to observe that the analyzed rocks did not demon-strate visual homogeneity within one particular rock type.Practically speaking, this means that rocks constituting one
QUERY IMAGE
IMAGE DATABASEPREPROCESSING
QUERY PREPROCESSING
ACCEPTABLE CROSS-
CORRELATION
FEATURES NORMALIZATION
PCA
REDUCTION
CLUSTER ANALYSIS
NON-PARAMETRICCLASSIFICATION
ESTIMATE NUMBER OF CLUSTERS
NO
YES
RETRIVAL RESULTS
OR
data mining
IMAG
ECO
MPA
RIS
ION
DIS
TAN
CEM
EASU
RES
FEAT
UR
EPR
EPR
OC
ESSI
NG
STAT
ISTI
CAL
MET
HO
DS
FEAT
UR
EEXT
RAC
TIO
NU
SIN
GIM
AGEP
RO
CES
SIN
GM
ETH
OD
S
USI
NG
USI
NG
Fig. 3 Data flow in the image search algorithm
petrographic group revealed a tendency, visually, towardsfalling into separate, different groups (Fig. 5).
3.1 Determination of the characteristics identifyingphotographs
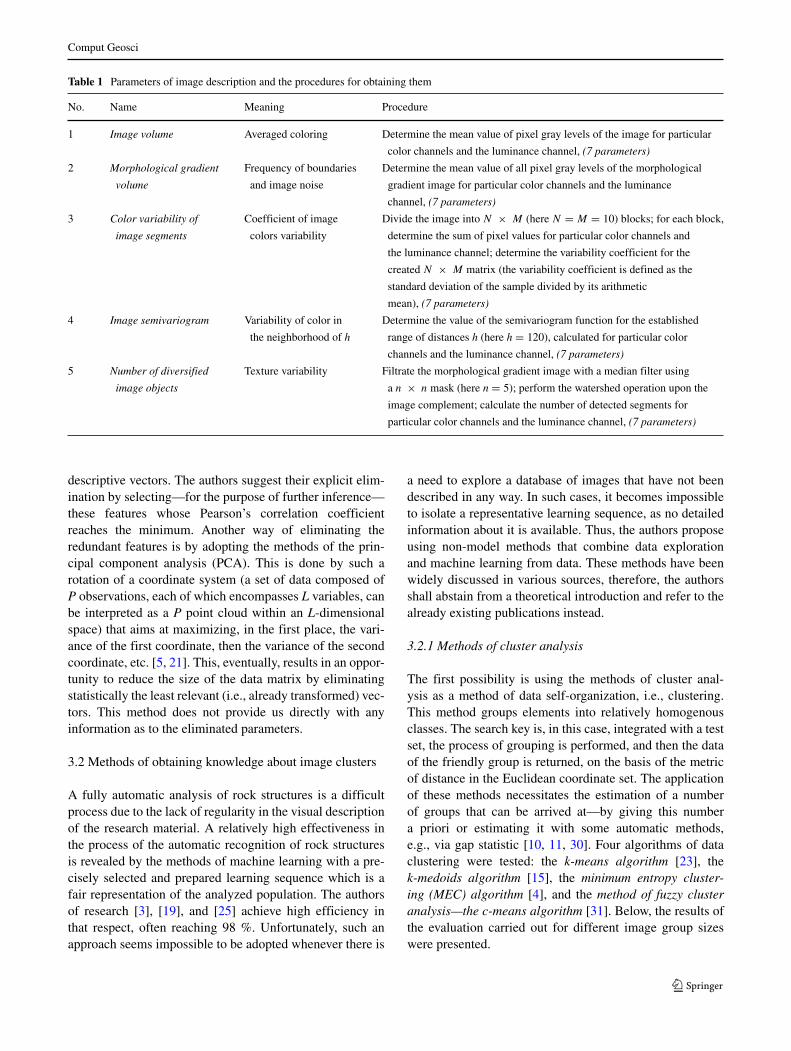
In the literature of the subject, two approaches to search byimage content are dominant. One involves searching per-formed on the basis of general image characteristics, suchas color or texture. The other approach, called a semanticone, involves representing relationships between objects ineach photo. The methodology adopted in the present paperuses the main ideas of both approaches. Most importantly,the analyzed material revealed differences as far as colorand texture were concerned. Texture represents such char-acteristics as the arrangement of heterogenous areas withinan image, i.e., the way in which minerals within a bodyof rock were ordered spatially. The authors used this as abasis for determining the parameters of content differentia-tion (Table 1). Due to the particular nature of the research,the stereological parameters of materials were not used, astheir extraction would necessitate adopting different seg-mentation algorithms [20] for different rock types. Such anapproach rules out their universal usability in relation to the
Comput Geosci
Dolomite I Dolomite II Dolomite III
Sandstone I Sandstone II Sandstone III
Granite I Quartzite I Marble I
Slate Crystalline I Slate Crystalline II Porphyry I
Syenite I
Limestone I Limestone II Limestone III
Limestone IV Limestone V
Fig. 4 Representatives of selected thematic categories, i.e., petro-graphic types of rocks
construction of the proposed system. Thus, a unified algo-rithm was proposed for all rock types, to be used for thepurpose of determining the number of objects included ina given image. All the analyses were carried out on thebasis of the RGB and CIELAB color model. The parame-ters were determined by means of methods of digital imageprocessing.
For the analyzed data, the usefulness of other parame-ters was also investigated. The parameters describing thefraction of universal simple colors and their modifica-tions (red, green, blue, yellow, magenta, cyan) within each
Fig. 5 Visual diversification within one petrographic group—anhydrite
picture proved useful. They were also used in the research(six parameters). Unfortunately, the static parameters—such as those describing the distribution of pixel valueswithin an image—turned out to be less helpful. A sam-ple parameter was the value of the concentration of thedistribution of particular gray levels of color channels andthe luminance channels. Theoretically, this testifies to theuneven distribution of the values of a characteristic amongthe elements of a sample. Another characteristic was thevalue of the asymmetry of the distribution of the values ofparticular gray levels of color channels and the luminancechannels, which supplied information about the distributionsymmetry or lack of it. It is a good separating parame-ter for a small set of diversified rock structures, but, forthe set encompassing 19 rock types, it is an insufficientdifferentiating parameter.
As a result of the research, 41 basic parameters wereselected. They were subsequently subjected to further anal-yses so that similarity between images could be evaluated.To this end, the authors proposed performing image pro-jection within a previously defined space of features. Thisspace may be treated as an n-dimensional Euclidean space,where further calculations can be performed. In this context,an object is constituted by an individual image, projectedwithin a Euclidean space in the form of a feature vector,whose components are the values determining the measuresof selected descriptive parameters of an image [18]. TheEuclidean distance between these objects was established tobe the measure of differences between the objects (images).The process of obtaining the values of the descriptive fea-tures of each image resulted in the creation of a set of data(the description of a feature space) of the size P × L,where P = the number of objects in the analyzed set of data,L = the number of parameters describing each of the ele-ments. Thus, obtained data had to be processed statisticallybefore any inferences could be drawn, as the attribute of thenumerically highest value tended to dominate over the oth-ers. This makes it impossible to project the issue to the spaceof features described above in an expert way. The solu-tion was to normalize the values of the parameters, whichinvolved scaling the interval to which they belong to theinterval [0,1].
3.1.1 Verification of feature representativeness
The set of data obtained in the course of previous stagesreveals a considerable correlation between the measureof particular features in the representations of particu-lar color channels of the RGB model (ca. 46–99 %),and a less considerable one in the CIELAB model (ca.20–50 %). The existence of strongly correlated valuesincreases the influence of a given feature on the otherones in the process of analyzing particular components of
Comput Geosci
Table 1 Parameters of image description and the procedures for obtaining them
No. Name Meaning Procedure
1 Image volume Averaged coloring Determine the mean value of pixel gray levels of the image for particular
color channels and the luminance channel, (7 parameters)
2 Morphological gradient Frequency of boundaries Determine the mean value of all pixel gray levels of the morphological
volume and image noise gradient image for particular color channels and the luminance
channel, (7 parameters)
3 Color variability of Coefficient of image Divide the image into N × M (here N = M = 10) blocks; for each block,
image segments colors variability determine the sum of pixel values for particular color channels and
the luminance channel; determine the variability coefficient for the
created N × M matrix (the variability coefficient is defined as the
standard deviation of the sample divided by its arithmetic
mean), (7 parameters)
4 Image semivariogram Variability of color in Determine the value of the semivariogram function for the established
the neighborhood of h range of distances h (here h = 120), calculated for particular color
channels and the luminance channel, (7 parameters)
5 Number of diversified Texture variability Filtrate the morphological gradient image with a median filter using
image objects a n × n mask (here n = 5); perform the watershed operation upon the
image complement; calculate the number of detected segments for
particular color channels and the luminance channel, (7 parameters)
descriptive vectors. The authors suggest their explicit elim-ination by selecting—for the purpose of further inference—these features whose Pearson’s correlation coefficientreaches the minimum. Another way of eliminating theredundant features is by adopting the methods of the prin-cipal component analysis (PCA). This is done by such arotation of a coordinate system (a set of data composed ofP observations, each of which encompasses L variables, canbe interpreted as a P point cloud within an L-dimensionalspace) that aims at maximizing, in the first place, the vari-ance of the first coordinate, then the variance of the secondcoordinate, etc. [5, 21]. This, eventually, results in an oppor-tunity to reduce the size of the data matrix by eliminatingstatistically the least relevant (i.e., already transformed) vec-tors. This method does not provide us directly with anyinformation as to the eliminated parameters.
3.2 Methods of obtaining knowledge about image clusters
A fully automatic analysis of rock structures is a difficultprocess due to the lack of regularity in the visual descriptionof the research material. A relatively high effectiveness inthe process of the automatic recognition of rock structuresis revealed by the methods of machine learning with a pre-cisely selected and prepared learning sequence which is afair representation of the analyzed population. The authorsof research [3], [19], and [25] achieve high efficiency inthat respect, often reaching 98 %. Unfortunately, such anapproach seems impossible to be adopted whenever there is
a need to explore a database of images that have not beendescribed in any way. In such cases, it becomes impossibleto isolate a representative learning sequence, as no detailedinformation about it is available. Thus, the authors proposeusing non-model methods that combine data explorationand machine learning from data. These methods have beenwidely discussed in various sources, therefore, the authorsshall abstain from a theoretical introduction and refer to thealready existing publications instead.
3.2.1 Methods of cluster analysis
The first possibility is using the methods of cluster anal-ysis as a method of data self-organization, i.e., clustering.This method groups elements into relatively homogenousclasses. The search key is, in this case, integrated with a testset, the process of grouping is performed, and then the dataof the friendly group is returned, on the basis of the metricof distance in the Euclidean coordinate set. The applicationof these methods necessitates the estimation of a numberof groups that can be arrived at—by giving this numbera priori or estimating it with some automatic methods,e.g., via gap statistic [10, 11, 30]. Four algorithms of dataclustering were tested: the k-means algorithm [23], thek-medoids algorithm [15], the minimum entropy cluster-ing (MEC) algorithm [4], and the method of fuzzy clusteranalysis—the c-means algorithm [31]. Below, the results ofthe evaluation carried out for different image group sizeswere presented.
Comput Geosci
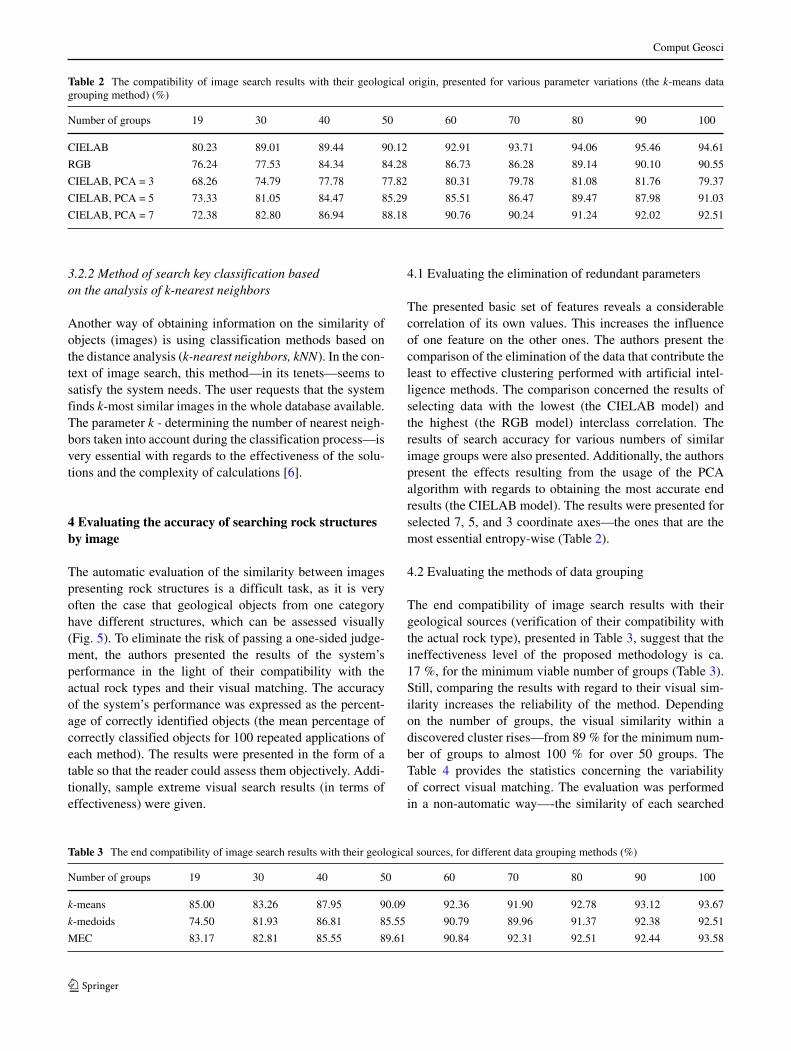
Table 2 The compatibility of image search results with their geological origin, presented for various parameter variations (the k-means datagrouping method) (%)
Number of groups 19 30 40 50 60 70 80 90 100
CIELAB 80.23 89.01 89.44 90.12 92.91 93.71 94.06 95.46 94.61
RGB 76.24 77.53 84.34 84.28 86.73 86.28 89.14 90.10 90.55
CIELAB, PCA = 3 68.26 74.79 77.78 77.82 80.31 79.78 81.08 81.76 79.37
CIELAB, PCA = 5 73.33 81.05 84.47 85.29 85.51 86.47 89.47 87.98 91.03
CIELAB, PCA = 7 72.38 82.80 86.94 88.18 90.76 90.24 91.24 92.02 92.51
3.2.2 Method of search key classification basedon the analysis of k-nearest neighbors
Another way of obtaining information on the similarity ofobjects (images) is using classification methods based onthe distance analysis (k-nearest neighbors, kNN). In the con-text of image search, this method—in its tenets—seems tosatisfy the system needs. The user requests that the systemfinds k-most similar images in the whole database available.The parameter k - determining the number of nearest neigh-bors taken into account during the classification process—isvery essential with regards to the effectiveness of the solu-tions and the complexity of calculations [6].
4 Evaluating the accuracy of searching rock structuresby image
The automatic evaluation of the similarity between imagespresenting rock structures is a difficult task, as it is veryoften the case that geological objects from one categoryhave different structures, which can be assessed visually(Fig. 5). To eliminate the risk of passing a one-sided judge-ment, the authors presented the results of the system’sperformance in the light of their compatibility with theactual rock types and their visual matching. The accuracyof the system’s performance was expressed as the percent-age of correctly identified objects (the mean percentage ofcorrectly classified objects for 100 repeated applications ofeach method). The results were presented in the form of atable so that the reader could assess them objectively. Addi-tionally, sample extreme visual search results (in terms ofeffectiveness) were given.
4.1 Evaluating the elimination of redundant parameters
The presented basic set of features reveals a considerablecorrelation of its own values. This increases the influenceof one feature on the other ones. The authors present thecomparison of the elimination of the data that contribute theleast to effective clustering performed with artificial intel-ligence methods. The comparison concerned the results ofselecting data with the lowest (the CIELAB model) andthe highest (the RGB model) interclass correlation. Theresults of search accuracy for various numbers of similarimage groups were also presented. Additionally, the authorspresent the effects resulting from the usage of the PCAalgorithm with regards to obtaining the most accurate endresults (the CIELAB model). The results were presented forselected 7, 5, and 3 coordinate axes—the ones that are themost essential entropy-wise (Table 2).
4.2 Evaluating the methods of data grouping
The end compatibility of image search results with theirgeological sources (verification of their compatibility withthe actual rock type), presented in Table 3, suggest that theineffectiveness level of the proposed methodology is ca.17 %, for the minimum viable number of groups (Table 3).Still, comparing the results with regard to their visual sim-ilarity increases the reliability of the method. Dependingon the number of groups, the visual similarity within adiscovered cluster rises—from 89 % for the minimum num-ber of groups to almost 100 % for over 50 groups. TheTable 4 provides the statistics concerning the variabilityof correct visual matching. The evaluation was performedin a non-automatic way—-the similarity of each searched
Table 3 The end compatibility of image search results with their geological sources, for different data grouping methods (%)
Number of groups 19 30 40 50 60 70 80 90 100
k-means 85.00 83.26 87.95 90.09 92.36 91.90 92.78 93.12 93.67
k-medoids 74.50 81.93 86.81 85.55 90.79 89.96 91.37 92.38 92.51
MEC 83.17 82.81 85.55 89.61 90.84 92.31 92.51 92.44 93.58
Comput Geosci
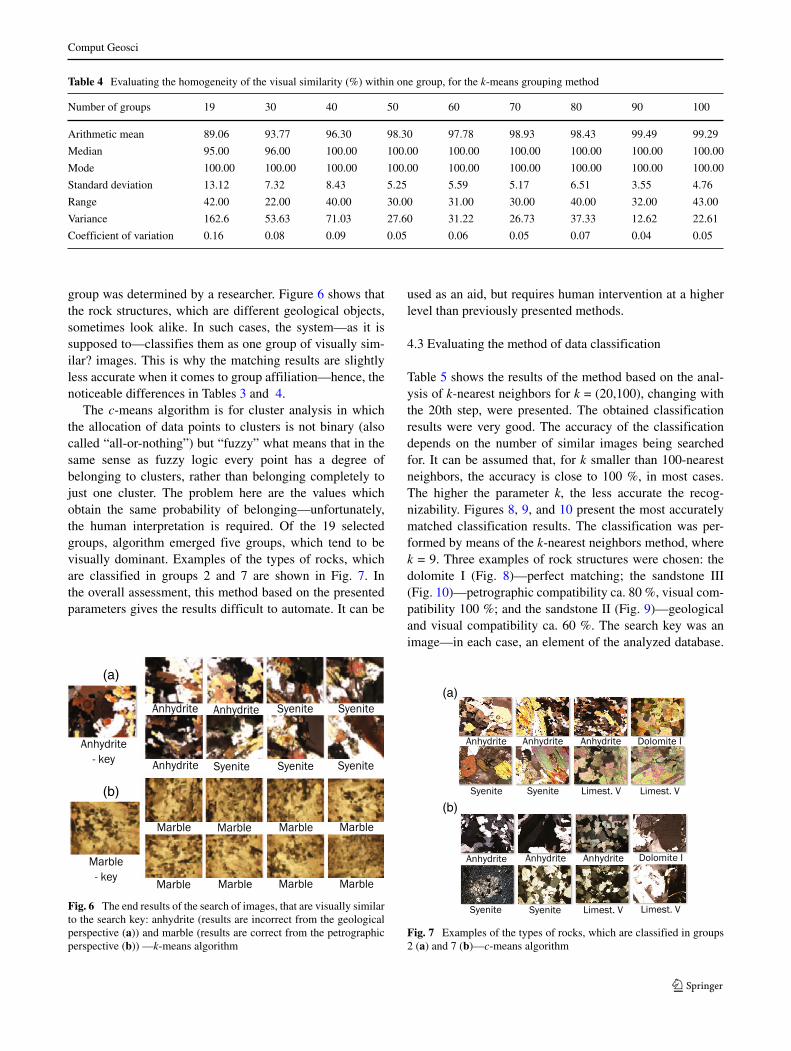
Table 4 Evaluating the homogeneity of the visual similarity (%) within one group, for the k-means grouping method
Number of groups 19 30 40 50 60 70 80 90 100
Arithmetic mean 89.06 93.77 96.30 98.30 97.78 98.93 98.43 99.49 99.29
Median 95.00 96.00 100.00 100.00 100.00 100.00 100.00 100.00 100.00
Mode 100.00 100.00 100.00 100.00 100.00 100.00 100.00 100.00 100.00
Standard deviation 13.12 7.32 8.43 5.25 5.59 5.17 6.51 3.55 4.76
Range 42.00 22.00 40.00 30.00 31.00 30.00 40.00 32.00 43.00
Variance 162.6 53.63 71.03 27.60 31.22 26.73 37.33 12.62 22.61
Coefficient of variation 0.16 0.08 0.09 0.05 0.06 0.05 0.07 0.04 0.05
group was determined by a researcher. Figure 6 shows thatthe rock structures, which are different geological objects,sometimes look alike. In such cases, the system—as it issupposed to—classifies them as one group of visually sim-ilar? images. This is why the matching results are slightlyless accurate when it comes to group affiliation—hence, thenoticeable differences in Tables 3 and 4.
The c-means algorithm is for cluster analysis in whichthe allocation of data points to clusters is not binary (alsocalled “all-or-nothing”) but “fuzzy” what means that in thesame sense as fuzzy logic every point has a degree ofbelonging to clusters, rather than belonging completely tojust one cluster. The problem here are the values whichobtain the same probability of belonging—unfortunately,the human interpretation is required. Of the 19 selectedgroups, algorithm emerged five groups, which tend to bevisually dominant. Examples of the types of rocks, whichare classified in groups 2 and 7 are shown in Fig. 7. Inthe overall assessment, this method based on the presentedparameters gives the results difficult to automate. It can be
(a)
(b)
Fig. 6 The end results of the search of images, that are visually similarto the search key: anhydrite (results are incorrect from the geologicalperspective (a)) and marble (results are correct from the petrographicperspective (b)) —k-means algorithm
used as an aid, but requires human intervention at a higherlevel than previously presented methods.
4.3 Evaluating the method of data classification
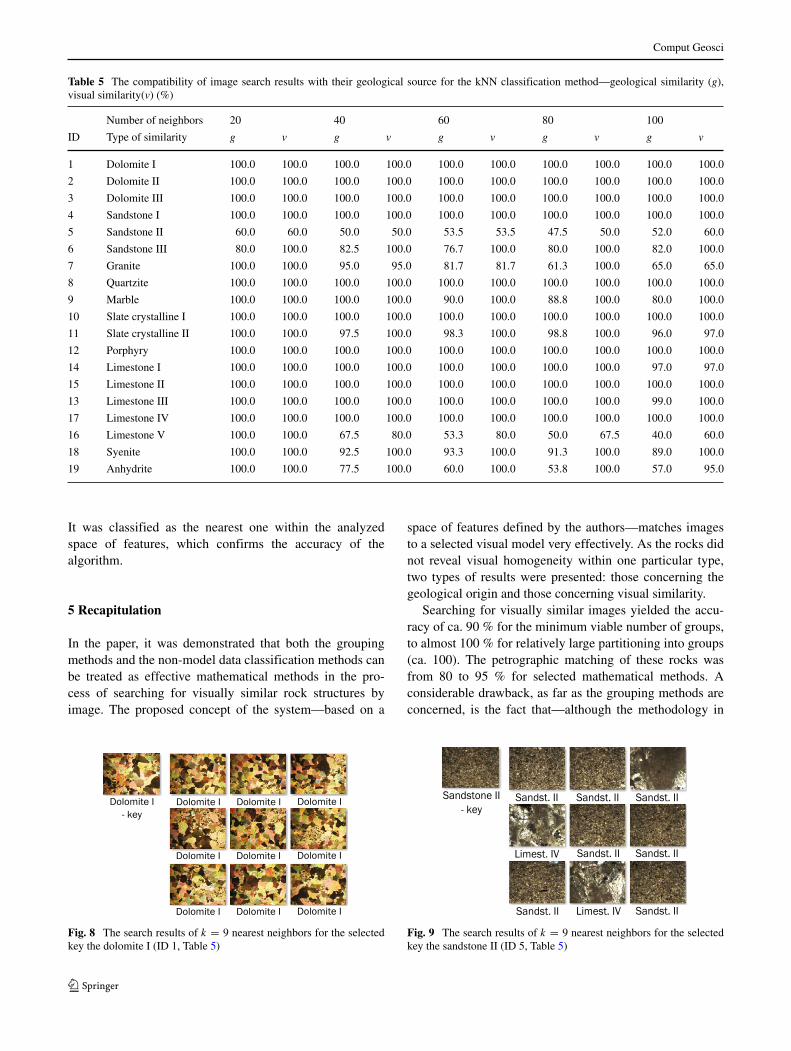
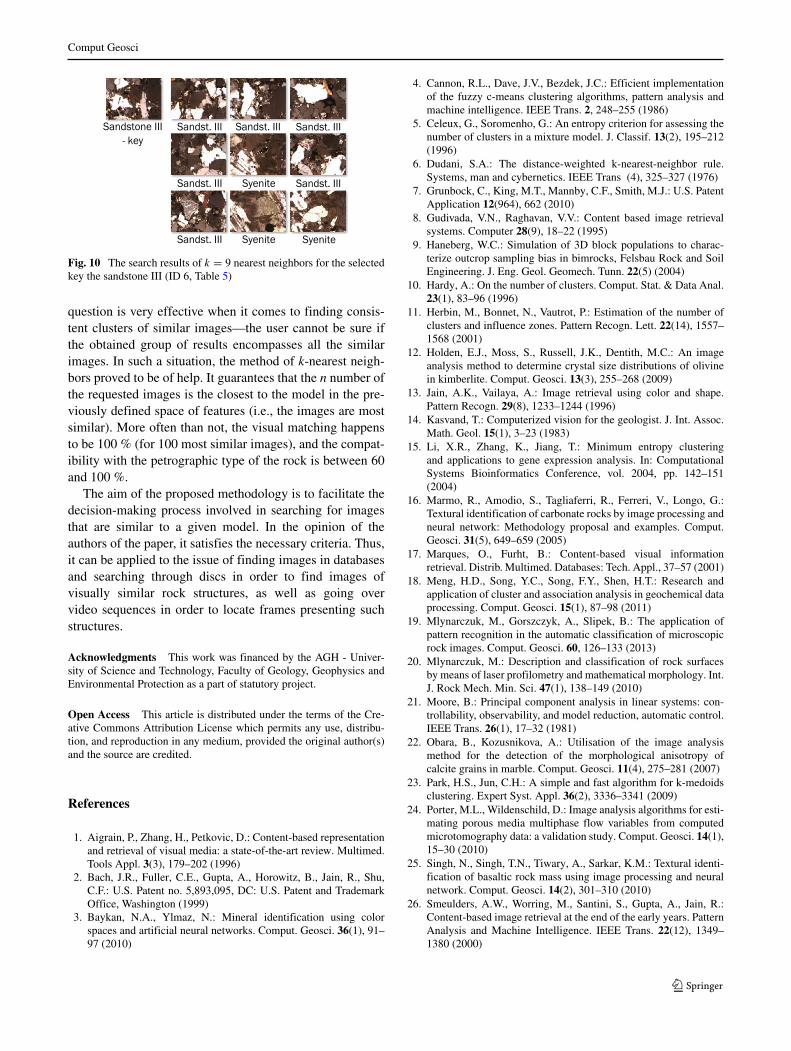
Table 5 shows the results of the method based on the anal-ysis of k-nearest neighbors for k = (20,100), changing withthe 20th step, were presented. The obtained classificationresults were very good. The accuracy of the classificationdepends on the number of similar images being searchedfor. It can be assumed that, for k smaller than 100-nearestneighbors, the accuracy is close to 100 %, in most cases.The higher the parameter k, the less accurate the recog-nizability. Figures 8, 9, and 10 present the most accuratelymatched classification results. The classification was per-formed by means of the k-nearest neighbors method, wherek = 9. Three examples of rock structures were chosen: thedolomite I (Fig. 8)—perfect matching; the sandstone III(Fig. 10)—petrographic compatibility ca. 80 %, visual com-patibility 100 %; and the sandstone II (Fig. 9)—geologicaland visual compatibility ca. 60 %. The search key was animage—in each case, an element of the analyzed database.
(a)
(b)
Fig. 7 Examples of the types of rocks, which are classified in groups2 (a) and 7 (b)—c-means algorithm
Comput Geosci
Table 5 The compatibility of image search results with their geological source for the kNN classification method—geological similarity (g),visual similarity(v) (%)
Number of neighbors 20 40 60 80 100
ID Type of similarity g v g v g v g v g v
1 Dolomite I 100.0 100.0 100.0 100.0 100.0 100.0 100.0 100.0 100.0 100.0
2 Dolomite II 100.0 100.0 100.0 100.0 100.0 100.0 100.0 100.0 100.0 100.0
3 Dolomite III 100.0 100.0 100.0 100.0 100.0 100.0 100.0 100.0 100.0 100.0
4 Sandstone I 100.0 100.0 100.0 100.0 100.0 100.0 100.0 100.0 100.0 100.0
5 Sandstone II 60.0 60.0 50.0 50.0 53.5 53.5 47.5 50.0 52.0 60.0
6 Sandstone III 80.0 100.0 82.5 100.0 76.7 100.0 80.0 100.0 82.0 100.0
7 Granite 100.0 100.0 95.0 95.0 81.7 81.7 61.3 100.0 65.0 65.0
8 Quartzite 100.0 100.0 100.0 100.0 100.0 100.0 100.0 100.0 100.0 100.0
9 Marble 100.0 100.0 100.0 100.0 90.0 100.0 88.8 100.0 80.0 100.0
10 Slate crystalline I 100.0 100.0 100.0 100.0 100.0 100.0 100.0 100.0 100.0 100.0
11 Slate crystalline II 100.0 100.0 97.5 100.0 98.3 100.0 98.8 100.0 96.0 97.0
12 Porphyry 100.0 100.0 100.0 100.0 100.0 100.0 100.0 100.0 100.0 100.0
14 Limestone I 100.0 100.0 100.0 100.0 100.0 100.0 100.0 100.0 97.0 97.0
15 Limestone II 100.0 100.0 100.0 100.0 100.0 100.0 100.0 100.0 100.0 100.0
13 Limestone III 100.0 100.0 100.0 100.0 100.0 100.0 100.0 100.0 99.0 100.0
17 Limestone IV 100.0 100.0 100.0 100.0 100.0 100.0 100.0 100.0 100.0 100.0
16 Limestone V 100.0 100.0 67.5 80.0 53.3 80.0 50.0 67.5 40.0 60.0
18 Syenite 100.0 100.0 92.5 100.0 93.3 100.0 91.3 100.0 89.0 100.0
19 Anhydrite 100.0 100.0 77.5 100.0 60.0 100.0 53.8 100.0 57.0 95.0
It was classified as the nearest one within the analyzedspace of features, which confirms the accuracy of thealgorithm.
5 Recapitulation
In the paper, it was demonstrated that both the groupingmethods and the non-model data classification methods canbe treated as effective mathematical methods in the pro-cess of searching for visually similar rock structures byimage. The proposed concept of the system—based on a
Fig. 8 The search results of k = 9 nearest neighbors for the selectedkey the dolomite I (ID 1, Table 5)
space of features defined by the authors—matches imagesto a selected visual model very effectively. As the rocks didnot reveal visual homogeneity within one particular type,two types of results were presented: those concerning thegeological origin and those concerning visual similarity.
Searching for visually similar images yielded the accu-racy of ca. 90 % for the minimum viable number of groups,to almost 100 % for relatively large partitioning into groups(ca. 100). The petrographic matching of these rocks wasfrom 80 to 95 % for selected mathematical methods. Aconsiderable drawback, as far as the grouping methods areconcerned, is the fact that—although the methodology in
Fig. 9 The search results of k = 9 nearest neighbors for the selectedkey the sandstone II (ID 5, Table 5)
Comput Geosci
Fig. 10 The search results of k = 9 nearest neighbors for the selectedkey the sandstone III (ID 6, Table 5)
question is very effective when it comes to finding consis-tent clusters of similar images—the user cannot be sure ifthe obtained group of results encompasses all the similarimages. In such a situation, the method of k-nearest neigh-bors proved to be of help. It guarantees that the n number ofthe requested images is the closest to the model in the pre-viously defined space of features (i.e., the images are mostsimilar). More often than not, the visual matching happensto be 100 % (for 100 most similar images), and the compat-ibility with the petrographic type of the rock is between 60and 100 %.
The aim of the proposed methodology is to facilitate thedecision-making process involved in searching for imagesthat are similar to a given model. In the opinion of theauthors of the paper, it satisfies the necessary criteria. Thus,it can be applied to the issue of finding images in databasesand searching through discs in order to find images ofvisually similar rock structures, as well as going overvideo sequences in order to locate frames presenting suchstructures.
Acknowledgments This work was financed by the AGH - Univer-sity of Science and Technology, Faculty of Geology, Geophysics andEnvironmental Protection as a part of statutory project.
Open Access This article is distributed under the terms of the Cre-ative Commons Attribution License which permits any use, distribu-tion, and reproduction in any medium, provided the original author(s)and the source are credited.
References
1. Aigrain, P., Zhang, H., Petkovic, D.: Content-based representationand retrieval of visual media: a state-of-the-art review. Multimed.Tools Appl. 3(3), 179–202 (1996)
2. Bach, J.R., Fuller, C.E., Gupta, A., Horowitz, B., Jain, R., Shu,C.F.: U.S. Patent no. 5,893,095, DC: U.S. Patent and TrademarkOffice, Washington (1999)
3. Baykan, N.A., Ylmaz, N.: Mineral identification using colorspaces and artificial neural networks. Comput. Geosci. 36(1), 91–97 (2010)
4. Cannon, R.L., Dave, J.V., Bezdek, J.C.: Efficient implementationof the fuzzy c-means clustering algorithms, pattern analysis andmachine intelligence. IEEE Trans. 2, 248–255 (1986)
5. Celeux, G., Soromenho, G.: An entropy criterion for assessing thenumber of clusters in a mixture model. J. Classif. 13(2), 195–212(1996)
6. Dudani, S.A.: The distance-weighted k-nearest-neighbor rule.Systems, man and cybernetics. IEEE Trans (4), 325–327 (1976)
7. Grunbock, C., King, M.T., Mannby, C.F., Smith, M.J.: U.S. PatentApplication 12(964), 662 (2010)
8. Gudivada, V.N., Raghavan, V.V.: Content based image retrievalsystems. Computer 28(9), 18–22 (1995)
9. Haneberg, W.C.: Simulation of 3D block populations to charac-terize outcrop sampling bias in bimrocks, Felsbau Rock and SoilEngineering. J. Eng. Geol. Geomech. Tunn. 22(5) (2004)
10. Hardy, A.: On the number of clusters. Comput. Stat. & Data Anal.23(1), 83–96 (1996)
11. Herbin, M., Bonnet, N., Vautrot, P.: Estimation of the number ofclusters and influence zones. Pattern Recogn. Lett. 22(14), 1557–1568 (2001)
12. Holden, E.J., Moss, S., Russell, J.K., Dentith, M.C.: An imageanalysis method to determine crystal size distributions of olivinein kimberlite. Comput. Geosci. 13(3), 255–268 (2009)
13. Jain, A.K., Vailaya, A.: Image retrieval using color and shape.Pattern Recogn. 29(8), 1233–1244 (1996)
14. Kasvand, T.: Computerized vision for the geologist. J. Int. Assoc.Math. Geol. 15(1), 3–23 (1983)
15. Li, X.R., Zhang, K., Jiang, T.: Minimum entropy clusteringand applications to gene expression analysis. In: ComputationalSystems Bioinformatics Conference, vol. 2004, pp. 142–151(2004)
16. Marmo, R., Amodio, S., Tagliaferri, R., Ferreri, V., Longo, G.:Textural identification of carbonate rocks by image processing andneural network: Methodology proposal and examples. Comput.Geosci. 31(5), 649–659 (2005)
17. Marques, O., Furht, B.: Content-based visual informationretrieval. Distrib. Multimed. Databases: Tech. Appl., 37–57 (2001)
18. Meng, H.D., Song, Y.C., Song, F.Y., Shen, H.T.: Research andapplication of cluster and association analysis in geochemical dataprocessing. Comput. Geosci. 15(1), 87–98 (2011)
19. Mlynarczuk, M., Gorszczyk, A., Slipek, B.: The application ofpattern recognition in the automatic classification of microscopicrock images. Comput. Geosci. 60, 126–133 (2013)
20. Mlynarczuk, M.: Description and classification of rock surfacesby means of laser profilometry and mathematical morphology. Int.J. Rock Mech. Min. Sci. 47(1), 138–149 (2010)
21. Moore, B.: Principal component analysis in linear systems: con-trollability, observability, and model reduction, automatic control.IEEE Trans. 26(1), 17–32 (1981)
22. Obara, B., Kozusnikova, A.: Utilisation of the image analysismethod for the detection of the morphological anisotropy ofcalcite grains in marble. Comput. Geosci. 11(4), 275–281 (2007)
23. Park, H.S., Jun, C.H.: A simple and fast algorithm for k-medoidsclustering. Expert Syst. Appl. 36(2), 3336–3341 (2009)
24. Porter, M.L., Wildenschild, D.: Image analysis algorithms for esti-mating porous media multiphase flow variables from computedmicrotomography data: a validation study. Comput. Geosci. 14(1),15–30 (2010)
25. Singh, N., Singh, T.N., Tiwary, A., Sarkar, K.M.: Textural identi-fication of basaltic rock mass using image processing and neuralnetwork. Comput. Geosci. 14(2), 301–310 (2010)
26. Smeulders, A.W., Worring, M., Santini, S., Gupta, A., Jain, R.:Content-based image retrieval at the end of the early years. PatternAnalysis and Machine Intelligence. IEEE Trans. 22(12), 1349–1380 (2000)

Comput Geosci
27. Thompson, S., Fueten, F., Bockus, D.: Mineral identification usingartificial neural networks and the rotating polarizer stage. Comput.Geosci. 27(9), 1081–1089 (2001)
28. Tadeusiewicz, R., Ogiela, M.R.: Medical image understandingtechnology, artificial intelligence and soft computing for imageunderstanding. Springer-Verlag, Berlin, Heildelberg (2004)
29. Kurgan, L.A., Cios, K.J., Tadeusiewicz, R., Ogiela, M.,Goodenday, L.S.: Knowledge discovery approach to automated
cardiac SPECT diagnosis. Artif. Intell. Med. 23(2), 149–169(2001)
30. Wagstaff, K., Cardie, C., Rogers, S., Schrdl, S.: Constrainedk-means clustering with background knowledge. ICML 1, 577–584 (2001)
31. Weinberger, K.Q., Blitzer, J., Saul, L.K.: Distance metric learningfor large margin nearest neighbour classification. In: Advances inneural information processing systems, pp. 1473–1480 (2005)