
SEARCH AND RESCUE DEVELOPMENT AND VERIFICATION OF A ...
9
SEARCH AND RESCUE – DEVELOPMENT AND VERIFICATION OF A MODERNIZED PASSIVE FLOATING SYSTEM FOR PAYLOAD SEA RECOVERY Johannes Göser (1) , Oliver Drescher (2) , Marcus Hörschgen-Eggers (3) , Ulf Gemeinhardt (4) (1) Deutsches Zentrum für Luft- und Raumfahrt (DLR)/Oberpfaffenhofen, Mobile Raketen Basis, Münchener Straße 20 82234 Weßling, Germany, E-mail: [email protected] (2) Deutsches Zentrum für Luft- und Raumfahrt (DLR)/Oberpfaffenhofen, Mobile Raketen Basis, Münchener Straße 20 82234 Weßling, Germany, E-mail: [email protected] (3) Deutsches Zentrum für Luft- und Raumfahrt (DLR)/Oberpfaffenhofen, Mobile Raketen Basis, Münchener Straße 20 82234 Weßling, Germany, E-mail: [email protected] (4) TEXCON GmbH, Bruchweg 22-24, 37632 Eschershausen, Germany, E-mail: [email protected] ABSTRACT For most suborbital space flights, the successful recovery of the experimental payload is a critical point at the very end of the mission. Beside land based recovery, particular missions require a sea recovery in the Arctic Ocean. Therefore, a variety of passive floating systems have been developed and used by DLR’s Mobile Rocket Base (MORABA). Using the vast experience of multiple successful sea recoveries over the last decades, some of the latest development work has been dedicated to a modernised version. In cooperation with TEXCON GmbH, improved long-term floating behaviour and a considerably reduced packing volume have been achieved by using innovative materials and manufacturing technologies. Prior to the first successful operation of the improved passive floating system, various tests had to be performed to verify the floater’s functionality and durability. In this context, the Neutral Buoyancy Facility’s (NBF) diving pool of ESA’s European Astronaut Centre (EAC) in Cologne was offered for investigating different recovery scenarios. This paper describes the development and verification process of the modernized passive floating system. Furthermore, results of the first successful operation during the PMWE mission are presented. 1. INTRODUCTION For the safe retrieval of experiments on sounding rockets, MORABA uses various recovery systems customized for the challenges of the particular missions. Besides different payload masses, experiment configurations and re-entry velocities, the impact area is a decisive design factor. Recovery systems that are developed and used by MORABA consist of a two staged parachute system with a first stage stabilization parachute and a second stage main parachute. During the payload descent the parachute system is activated by barometric pressure switches and decelerates the payload to comfortable impact velocities below 15 m/s. At several launch sites all around the world sounding rockets are launched towards the sea. This offers a wide range of possible impact areas without affecting or disturbing populated areas. To enable a payload recovery at sea, MORABA uses floating systems that are mounted to the main parachute’s apex and are passively inflated by the ram air during descent. The floater is finally sealed by a duckbill valve and prevents the payload from sinking after touchdown. Figure 1 Sketch of typical sea recovery sequence Because of its two chamber design, the floater still generates buoyancy even if there is a rupture on the outer shell. The size of the floater body can vary, depending on the mass of the payload. For localisation a GPS/Iridium transceiver, a VHF radio beacon transmitter and a strobe light for visual detection are installed in a watertight box that is mounted on the floater’s apex. After visual detection the floater can be hooked at a salvage line and hoisted off the water together with the parachute and the payload. Those kind of floating recovery systems have been used for multiple missions during the last 50 years.
Transcript of SEARCH AND RESCUE DEVELOPMENT AND VERIFICATION OF A ...

SEARCH AND RESCUE – DEVELOPMENT AND VERIFICATION OF A MODERNIZED
PASSIVE FLOATING SYSTEM FOR PAYLOAD SEA RECOVERY
Johannes Göser(1)
, Oliver Drescher(2)
, Marcus Hörschgen-Eggers(3)
, Ulf Gemeinhardt(4)
(1) Deutsches Zentrum für Luft- und Raumfahrt (DLR)/Oberpfaffenhofen, Mobile Raketen Basis, Münchener Straße 20
82234 Weßling, Germany, E-mail: [email protected]
(2)
Deutsches Zentrum für Luft- und Raumfahrt (DLR)/Oberpfaffenhofen, Mobile Raketen Basis, Münchener Straße 20
82234 Weßling, Germany, E-mail: [email protected]
(3)
Deutsches Zentrum für Luft- und Raumfahrt (DLR)/Oberpfaffenhofen, Mobile Raketen Basis, Münchener Straße 20
82234 Weßling, Germany, E-mail: [email protected]
(4)
TEXCON GmbH, Bruchweg 22-24, 37632 Eschershausen, Germany, E-mail: [email protected]
ABSTRACT
For most suborbital space flights, the successful
recovery of the experimental payload is a critical point
at the very end of the mission. Beside land based
recovery, particular missions require a sea recovery in
the Arctic Ocean. Therefore, a variety of passive
floating systems have been developed and used by
DLR’s Mobile Rocket Base (MORABA).
Using the vast experience of multiple successful sea
recoveries over the last decades, some of the latest
development work has been dedicated to a modernised
version. In cooperation with TEXCON GmbH,
improved long-term floating behaviour and a
considerably reduced packing volume have been
achieved by using innovative materials and
manufacturing technologies.
Prior to the first successful operation of the improved
passive floating system, various tests had to be
performed to verify the floater’s functionality and
durability. In this context, the Neutral Buoyancy
Facility’s (NBF) diving pool of ESA’s European
Astronaut Centre (EAC) in Cologne was offered for
investigating different recovery scenarios.
This paper describes the development and verification
process of the modernized passive floating system.
Furthermore, results of the first successful operation
during the PMWE mission are presented.
1. INTRODUCTION
For the safe retrieval of experiments on sounding
rockets, MORABA uses various recovery systems
customized for the challenges of the particular missions.
Besides different payload masses, experiment
configurations and re-entry velocities, the impact area is
a decisive design factor. Recovery systems that are
developed and used by MORABA consist of a two
staged parachute system with a first stage stabilization
parachute and a second stage main parachute. During
the payload descent the parachute system is activated by
barometric pressure switches and decelerates the
payload to comfortable impact velocities below 15 m/s.
At several launch sites all around the world sounding
rockets are launched towards the sea. This offers a wide
range of possible impact areas without affecting or
disturbing populated areas. To enable a payload
recovery at sea, MORABA uses floating systems that
are mounted to the main parachute’s apex and are
passively inflated by the ram air during descent. The
floater is finally sealed by a duckbill valve and prevents
the payload from sinking after touchdown.
Figure 1 Sketch of typical sea recovery sequence
Because of its two chamber design, the floater still
generates buoyancy even if there is a rupture on the
outer shell. The size of the floater body can vary,
depending on the mass of the payload. For localisation a
GPS/Iridium transceiver, a VHF radio beacon
transmitter and a strobe light for visual detection are
installed in a watertight box that is mounted on the
floater’s apex. After visual detection the floater can be
hooked at a salvage line and hoisted off the water
together with the parachute and the payload. Those kind
of floating recovery systems have been used for
multiple missions during the last 50 years.

Figure 2 Previous passive floating system
Most of the recovery operations have been successful
whereas several findings and weaknesses could be
revealed. For example, the poor tightness of the floater
material and the joints increased the probability of a
mission failure because of payload sinking. The gained
experience combined with modern manufacturing
methods showed the potential for the development of an
improved and more reliable passive floating system for
payload sea recovery.
2. DEVELOPMENT
The development of the modernized version of the
passive floating system has been performed in
cooperation with the manufacturer TEXCON GmbH.
Initially, MORABA worked out a technical
specification document to determine the requirements of
the new system [1]. The general functionality of the
modernized floater system shall not be changed
compared to the previous floater system. Improvements
of the material and the manufacturing method shall be
the main focus of the modernization. MORABA
engineers expect an improved tightness of the floater
material and joints redesign. A long time buoyancy of
48 hours is required. Furthermore, the visibility of the
floater system shall be improved by using signal colour
with reflector markings.
Similar to the most commonly used system in the past
the new floater shall have a capacity of 320l and thereby
generate sufficient buoyancy to keep a 200kg payload in
surface waters. It shall have a maximum packing
volume of 4dm3 and a maximum mass of 1.5kg [1].
The previously used floating system was made of
Rivertex 240 material (mass: 240g/m2, hydrostatic head:
>3000mm) and manufactured by adhesive bonding [2].
Both the material and the joints started leaking over
time. The company TEXCON GmbH proposed to use
804 FL Yellow material (mass: 153g/m2, hydrostatic
head: 155100mm) for the floater body [3]. It is a
polyurethane coated polyamide fabric that is commonly
used by TEXCON GmbH to design life vests. Besides
the lower mass and the higher hydrostatic head the
distinctive and bright colour of the material meets the
requirement of a better visibility. Different to the
previous design the single strips are not bonded but
connected by ultrasonic welding and high frequency
welding. This technique provides more reliable,
homogenous and tight joints. A first prototype of the
redesigned floater was manufactured and completed
after one day. In comparison the production of the
previous floater took multiple days. The final mass of
the floater body prototype is 0.89kg, which results in a
mass reduction of 40% compared to the previous design
(1.53kg).
Figure 3 New (left) and previous (right) floater design
For the qualification of the new material and the new
manufacturing method tensile tests of the material and
the joints were performed. Furthermore, burst tests were
conducted for several prototypes. The test results are
compared to the expected flight loads in order to
determine safety factors of the system.
Determination of Flight Loads 2.1.
The floater is inflated by the ram air in the main
parachute canopy. It is deployed together with the main
parachute at an altitude of approximately 3300m and a
velocity between 35-50m/s. The dynamic pressure in
the canopy is calculated with Eq. 2-1
𝑝𝑑𝑦𝑛 =1
2ρ𝑣2 2-1
where ρ is the density and v the velocity of the body.
The density is dependent on the air pressure and
temperature. It is determined with Eq.2-2.
𝜌 =𝑝0
𝑅𝑠𝑇0 2-2
Rs is the specific gas constant, p0 the air pressure and T0
the air temperature. The specific gas constant is defined
with Rs=287.05J/kgK. Values for the altitude dependent
air pressure and temperature are gained by using the
simplified Boltzmann barometric equation (Eq. 2-3) for

the air pressure and a constant air temperature of
T0=273.15K.
𝑝𝑜 = p 𝑒(−
𝐻
𝐻0) 2-3
H0 is defined with 7990m and p is the pressure of the
standard atmosphere 101325Pa. An opening velocity of
50m/s results in a theoretical dynamic pressure of
10.7mbar in the parachute canopy and in the floater. As
the dynamic pressure is highly dependent on the
velocity it rapidly decreases after the deceleration of the
main parachute. The floater is inflated during the first
seconds after deployment. When the final sink rate
velocity of 14m/s is reached the dynamic pressure in the
canopy decreases to 1-2mbar. Taking into account that a
negative pressure area is created around the outer shell
of the canopy during deployment and the first opening
shock could be even higher than the theoretically
calculated 10.7mbar, a floater filling pressure of 30mbar
was defined for further calculations and testing
activities.
For the simplified calculation of the tensile stress in the
floater material the boiler formula for spherical bodies is
used (Eq. 2-4).
𝜎 =𝑝𝑟
2𝑡 2-4
Here, p is the positive pressure in the floater, r the
radius of the floater body and t the thickness of the
material. A positive pressure of 30mbar, a floater radius
of 425mm and a material thickness of 1mm results in a
tensile stress of 0,63N/mm2. Tensile tests shall prove
that the new floater material and joints withstand higher
stresses.
Tensile Test 2.2.
The data sheet of the 804 FL Yellow fabric specifies a
tensile strength of 438N/25mm in warp direction and
350N/25mm in weft direction [3]. The qualification
process at TEXCON GmbH included the validation of
these values by testing three samples with a width of
50mm in each direction. Average tear strengths of 800N
were measured, whereas the values in weft direction
were slightly lower than the ones in warp direction [4].
Figure 4 Tear strength 804 FL Yellow
This difference is documented in the data sheet, too.
Considering that twice as wide samples were used the
measurement of twice as high tear strengths can be
explained. For the calculation of the tensile stress in Eq.
2-5, the defined material thickness of 1mm is used
again.
𝜎 =𝐹
𝐴=
800𝑁
50𝑚𝑚∗ 1𝑚𝑚= 16
𝑁
𝑚𝑚2 2-5
The result corresponds to a safety factor of 25 compared
to the determined tensile stress during flight.
For the determination of the joints’ tear strength, five
test samples of each welding configuration on the
floater were manufactured [4]. Three different welding
configurations exist on the floater. They are presented in
Table 1.
Table 1 Different tensile test configurations
(a)
5mm ultrasonic welded joint
(b)
6mm high frequency welded joint
(c)
6mm high frequency welded joint
&
5mm ultrasonic welded joint (90°)
Besides the tear strength, the tests shall reveal the
failure pattern of the welded joints. In Table 2 the
results of the tensile tests are presented. The crack
pattern is described and the average and minimum tear
strength of each configuration is listed.
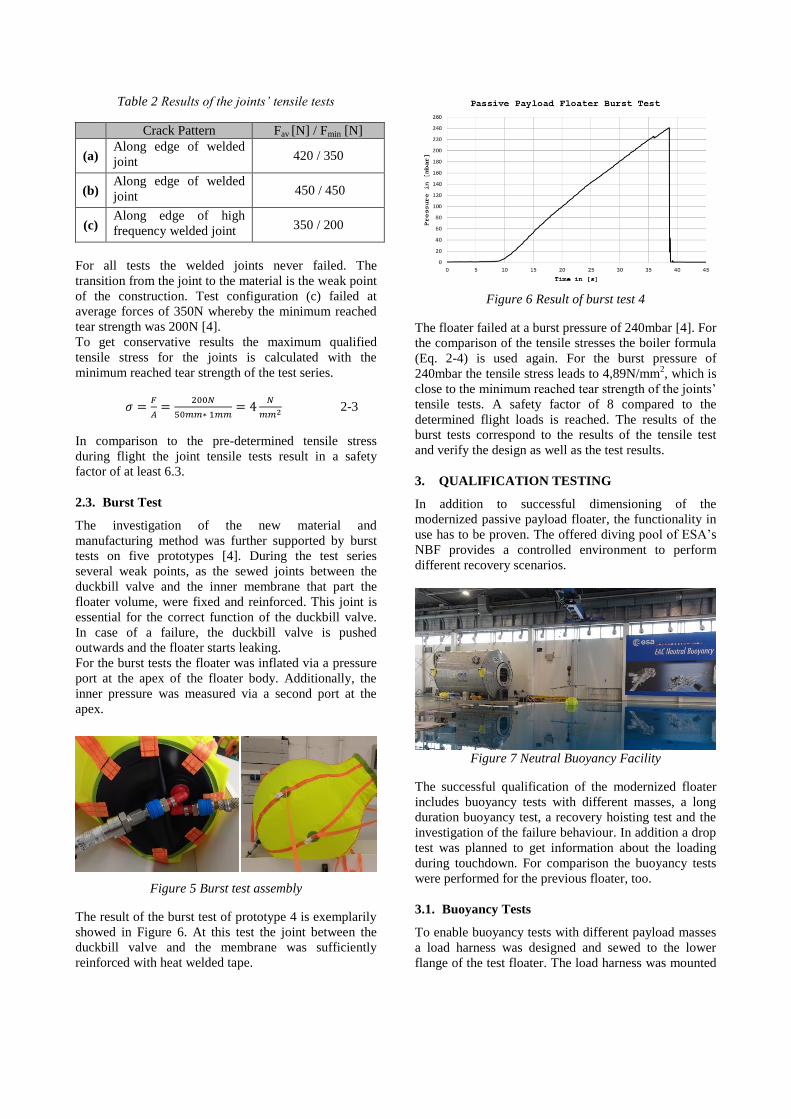
Table 2 Results of the joints’ tensile tests
Crack Pattern Fav [N] / Fmin [N]
(a) Along edge of welded
joint 420 / 350
(b) Along edge of welded
joint 450 / 450
(c) Along edge of high
frequency welded joint 350 / 200
For all tests the welded joints never failed. The
transition from the joint to the material is the weak point
of the construction. Test configuration (c) failed at
average forces of 350N whereby the minimum reached
tear strength was 200N [4].
To get conservative results the maximum qualified
tensile stress for the joints is calculated with the
minimum reached tear strength of the test series.
𝜎 =𝐹
𝐴=
200𝑁
50𝑚𝑚∗ 1𝑚𝑚= 4
𝑁
𝑚𝑚2 2-3
In comparison to the pre-determined tensile stress
during flight the joint tensile tests result in a safety
factor of at least 6.3.
Burst Test 2.3.
The investigation of the new material and
manufacturing method was further supported by burst
tests on five prototypes [4]. During the test series
several weak points, as the sewed joints between the
duckbill valve and the inner membrane that part the
floater volume, were fixed and reinforced. This joint is
essential for the correct function of the duckbill valve.
In case of a failure, the duckbill valve is pushed
outwards and the floater starts leaking.
For the burst tests the floater was inflated via a pressure
port at the apex of the floater body. Additionally, the
inner pressure was measured via a second port at the
apex.
Figure 5 Burst test assembly
The result of the burst test of prototype 4 is exemplarily
showed in Figure 6. At this test the joint between the
duckbill valve and the membrane was sufficiently
reinforced with heat welded tape.
Figure 6 Result of burst test 4
The floater failed at a burst pressure of 240mbar [4]. For
the comparison of the tensile stresses the boiler formula
(Eq. 2-4) is used again. For the burst pressure of
240mbar the tensile stress leads to 4,89N/mm2, which is
close to the minimum reached tear strength of the joints’
tensile tests. A safety factor of 8 compared to the
determined flight loads is reached. The results of the
burst tests correspond to the results of the tensile test
and verify the design as well as the test results.
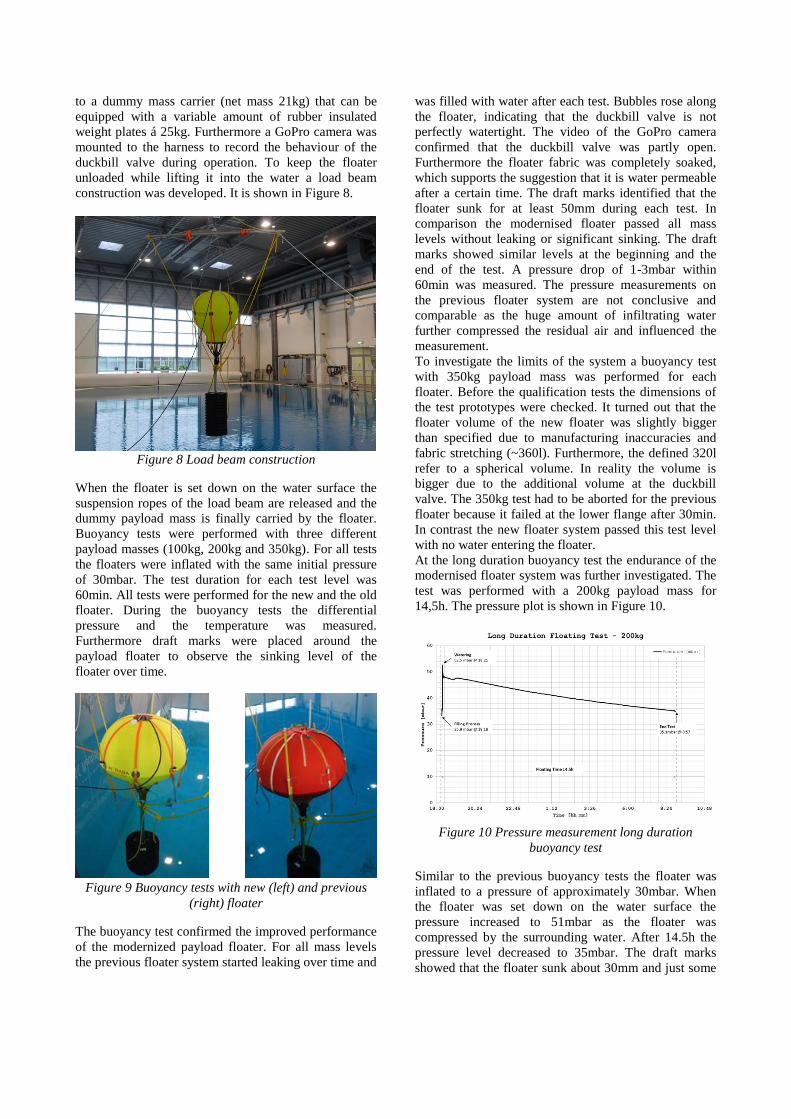
3. QUALIFICATION TESTING
In addition to successful dimensioning of the
modernized passive payload floater, the functionality in
use has to be proven. The offered diving pool of ESA’s
NBF provides a controlled environment to perform
different recovery scenarios.
Figure 7 Neutral Buoyancy Facility
The successful qualification of the modernized floater
includes buoyancy tests with different masses, a long
duration buoyancy test, a recovery hoisting test and the
investigation of the failure behaviour. In addition a drop
test was planned to get information about the loading
during touchdown. For comparison the buoyancy tests
were performed for the previous floater, too.
Buoyancy Tests 3.1.
To enable buoyancy tests with different payload masses
a load harness was designed and sewed to the lower
flange of the test floater. The load harness was mounted
to a dummy mass carrier (net mass 21kg) that can be
equipped with a variable amount of rubber insulated
weight plates á 25kg. Furthermore a GoPro camera was
mounted to the harness to record the behaviour of the
duckbill valve during operation. To keep the floater
unloaded while lifting it into the water a load beam
construction was developed. It is shown in Figure 8.
Figure 8 Load beam construction
When the floater is set down on the water surface the
suspension ropes of the load beam are released and the
dummy payload mass is finally carried by the floater.
Buoyancy tests were performed with three different
payload masses (100kg, 200kg and 350kg). For all tests
the floaters were inflated with the same initial pressure
of 30mbar. The test duration for each test level was
60min. All tests were performed for the new and the old
floater. During the buoyancy tests the differential
pressure and the temperature was measured.
Furthermore draft marks were placed around the
payload floater to observe the sinking level of the
floater over time.
Figure 9 Buoyancy tests with new (left) and previous
(right) floater
The buoyancy test confirmed the improved performance
of the modernized payload floater. For all mass levels
the previous floater system started leaking over time and
was filled with water after each test. Bubbles rose along
the floater, indicating that the duckbill valve is not
perfectly watertight. The video of the GoPro camera
confirmed that the duckbill valve was partly open.
Furthermore the floater fabric was completely soaked,
which supports the suggestion that it is water permeable
after a certain time. The draft marks identified that the
floater sunk for at least 50mm during each test. In
comparison the modernised floater passed all mass
levels without leaking or significant sinking. The draft
marks showed similar levels at the beginning and the
end of the test. A pressure drop of 1-3mbar within
60min was measured. The pressure measurements on
the previous floater system are not conclusive and
comparable as the huge amount of infiltrating water
further compressed the residual air and influenced the
measurement.
To investigate the limits of the system a buoyancy test
with 350kg payload mass was performed for each
floater. Before the qualification tests the dimensions of
the test prototypes were checked. It turned out that the
floater volume of the new floater was slightly bigger
than specified due to manufacturing inaccuracies and
fabric stretching (~360l). Furthermore, the defined 320l
refer to a spherical volume. In reality the volume is
bigger due to the additional volume at the duckbill
valve. The 350kg test had to be aborted for the previous
floater because it failed at the lower flange after 30min.
In contrast the new floater system passed this test level
with no water entering the floater.
At the long duration buoyancy test the endurance of the
modernised floater system was further investigated. The
test was performed with a 200kg payload mass for
14,5h. The pressure plot is shown in Figure 10.
Figure 10 Pressure measurement long duration
buoyancy test
Similar to the previous buoyancy tests the floater was
inflated to a pressure of approximately 30mbar. When
the floater was set down on the water surface the
pressure increased to 51mbar as the floater was
compressed by the surrounding water. After 14.5h the
pressure level decreased to 35mbar. The draft marks
showed that the floater sunk about 30mm and just some

water puddles accumulated in the floater. A closer look
to Figure 10 reveals that the course of the plot is not
proportional over time but the gradient of the pressure
loss decreases. A trend line analysis displayed that after
48h the pressure inside the floater still would have been
17mbar. The buoyancy performance of the modernized
passive payload floater has been satisfying. The
improvement compared to the previous floater system
was clearly proven.
Recovery Test and Test of Failure Behaviour 3.2.
The recovery test showed whether the modernized
floater can withstand the loads that occur when it is
hoisted off the water together with the payload. To lift
the floater a salvage line is installed, which is passed
through 8 sewed-on loops around the circumference.
The salvage line is used to grab the floater with a crane
hook. For the recovery test the floater was loaded with a
dummy payload mass of 200kg.
Figure 11 Recovery test at NBF
The floater and the dummy payload mass were
successfully hoisted. No damage was observed on the
floater structure.
Besides the recovery operation the failure behaviour of
the floater was further investigated. The two chamber
design of the floater should still generate buoyancy even
if there is a rupture in the floater body. To simulate this
scenario without damaging the floater body a valve was
integrated to the floater body, which could be manually
opened when assembly is floating. This test was
performed with a payload mass of 100kg. Adding the
mass of the dummy mass carrier the resulting actual
payload mass was 121kg. After the valve was opened
the payload floater deflated, however the membrane
avoided that that all air was released. Because of the
pressure drop in one compartment, the fabric around the
duckbill valve lost its tension and failed. Water got
inside the floater body and avoided that the air in the
second compartment could leak out, too. The floater still
generated enough buoyancy to carry the payload. The
half-filled floater is shown in Figure 12.
Figure 12 Failure behaviour test
To investigate the floating behaviour in this
configuration, a 60min buoyancy test was performed.
No changes could be detected during the test. At the end
of the test the “damaged” floater still generated
sufficient buoyancy for the payload. The test confirmed
that the membrane technique is working.
Drop Test 3.3.
A decisive event during the parachute sequence is the
splashdown of the payload and the floater. As the
waiting position of the recovery vessel is multiple
kilometres away from the expected impact point the
splashdown was never observed from the vessel nor
recorded by on-board telemetry. The final sink velocity
of previous missions is 10-15m/s. Although it is
expected that only the payload hits the water with this
velocity and the parachute and floater impact velocity is
much lower, a floater drop test with a payload mass of
175kg was conducted.
For the test the dummy mass and the floater were lifted
up to an altitude of 3m above the water surface
corresponding to an impact velocity of around ~8m/s.
Despite the rather unrealistic test conditions the result
was of general interest, as an active recovery system
with inflatable balloons on the payload is also
considered as a future development project. The test
shows the robustness of the material in case of a hard
impact (see Figure 13). The assembly was released by a
snap shackle.

Figure 13 Drop test at ESA NBF
During the splashdown the floater body failed. Because
of its small surface area the dummy mass did not
decelerate the complete assembly very much. Because
of that the floater hit the water surface with almost the
same velocity. Cracks around the lower flange and
along one of the strip joints were detected. The test
revealed that the development of an active recovery
system would require further investigations concerning
the robustness of the inflated balloons. For the
qualification of the passive floater system the successful
conduction of this drop test was not essential. To further
support the assumption that the parachute and floater hit
the surface with much lower speed, a touchdown
analysis of available on board video material was
performed [5]. It showed that the suspension lines are
relaxed after payload touchdown and the parachute
slowly sinks to the ground.
Figure 14 Parachute sinking to the ground
A video analysis showed that the parachute usually hits
the ground or water surface with velocities between 1-
3m/s [5].
4. FLIGHT OPERATION
In April 2018 the PMWE 1 and 2 mission was
conducted at Andøya Space Center in Norway. During
the campaign two single stage rockets were successfully
launched and the instrumented payloads recovered. The
mission goal aimed at the investigation of polar
mesospheric winter echos (PMWE), which occur at
altitudes from 60 to 90km.
Both rockets were boosted by an Improved Malemute
motor and were equipped with the modernized passive
floating recovery system. The payload masses in
recovery configuration were 161.3kg (PMWE 1) and
159.3kg (PMWE 2) [6].
Figure 15 PMWE 2 vehicle at the launcher
For the recovery operation the service and off-shore
work boat MS Niklas from FDA (Finnsnes Dykk &
Anleggservice AS) was hired, which is equipped with
two 20m cranes that facilitate payload recovery from
10m below the sea surface [7]. Prior to the campaign a
VHF direction finder has been installed on board to
receive the signal of the radio beacon transmitter. Three
crew members of MS Niklas and one member of
MORABA finally performed the recovery operation on
deck.
Figure 16 Recovery vessel MS Niklas
Recovery Operation 4.1.
The rockets were launched on April 13th
and April 18th
2018. On both launch days the weather and sea
conditions were good, with sea state levels between
2Bft (PMWE 1) and 3Bft (PMWE 2) [8]. To minimize
the time of the floater and payload in the water, the
recovery vessel went to a safe waiting position, three
hours away from the harbour, before the launch window
opened.

Both payloads were located within two hours after
splashdown. About one hour before visual detection, the
beacon signal, transmitted by the floater, was received.
The bright yellow colour of the modernised floater
created a good contrast to the sea water and therefore
the floater was easily localized. Pictures of the PMWE 1
and PMWE 2 floating systems before recovery are
shown in Figure 17. The observed draft of the floaters is
different. For the PMWE 1 floater 80% of the body
volume was above water surface whereas only 60% of
the body volume was above water surface for the
PMWE 2 floater.
Figure 17 PMWE 1 and PMWE 2 floating in the sea
After the recovery vessel got close enough to the floater
one of the crane hooks was manually clipped to the
salvage line. As the payload is hanging 10m below
water surface and the draft of MS Niklas is 4.35m, the
payload could not hit the hull of the recovery vessel [7].
Exemplary for both payloads the recovery operation of
the PMWE 1 payload is illustrated in Figure 18.
Figure 18 Recovery operation of PMWE 1
The hoisting of the payload was performed in two steps.
Although the cranes of this vessel may be big enough to
hoist the payload in one step, it is a safer manoeuvre to
perform the recovery in two steps.
First, the floater was lifted about 1m over the ship rail,
ensuring that the payload was still below the vessel’s
hull. After that the floater was taken on board and the
parachute was knotted with a sling to the ship rail.
Subsequent to that the crane hook was released from the
salvage line and hooked to the created sling. Finally the
sling was released from the rail and the payload was
completely hoisted and pulled on board.
One advantage of a two-step hoisting is that the floater
is only stressed when the payload is still in the water.
For both recoveries the floater was not damaged by the
stress of the salvage line, constricting the floater body.
After each recovery the floater was further inspected.
Concerning the tightness a significant difference was
detected. Whereas 1-2l of water were inside the PMWE
1 floater considerably more water was caught inside the
PMWE 2 floater. Over 30l must have been inside this
floater. A picture of the water inside the PMWE 2
floater is shown in Figure 19.
Figure 19 Water inside the PMWE 2 floater
The different amount of water inside the floater explains
the different draft of the floaters that was observed
before the recoveries (see Figure 17). Considering the
short floating time and the moderate sea state level, the
amount of water inside the PMWE 2 floater is not
satisfactory. During the qualification tests at the ESA
NBF such a huge amount of water was never observed
inside the modernized floater. Two major differences to
the ESA NBF tests are the sea state conditions that
could not be simulated in the NBF pool and the
stabilization straps connecting the floater to the main
parachute. During flotation the main load of the payload
is transferred via those straps and not via the floater’s
base, which is why the less centred floater body could
start shaking by the waves. This process is displayed in
Figure 20.
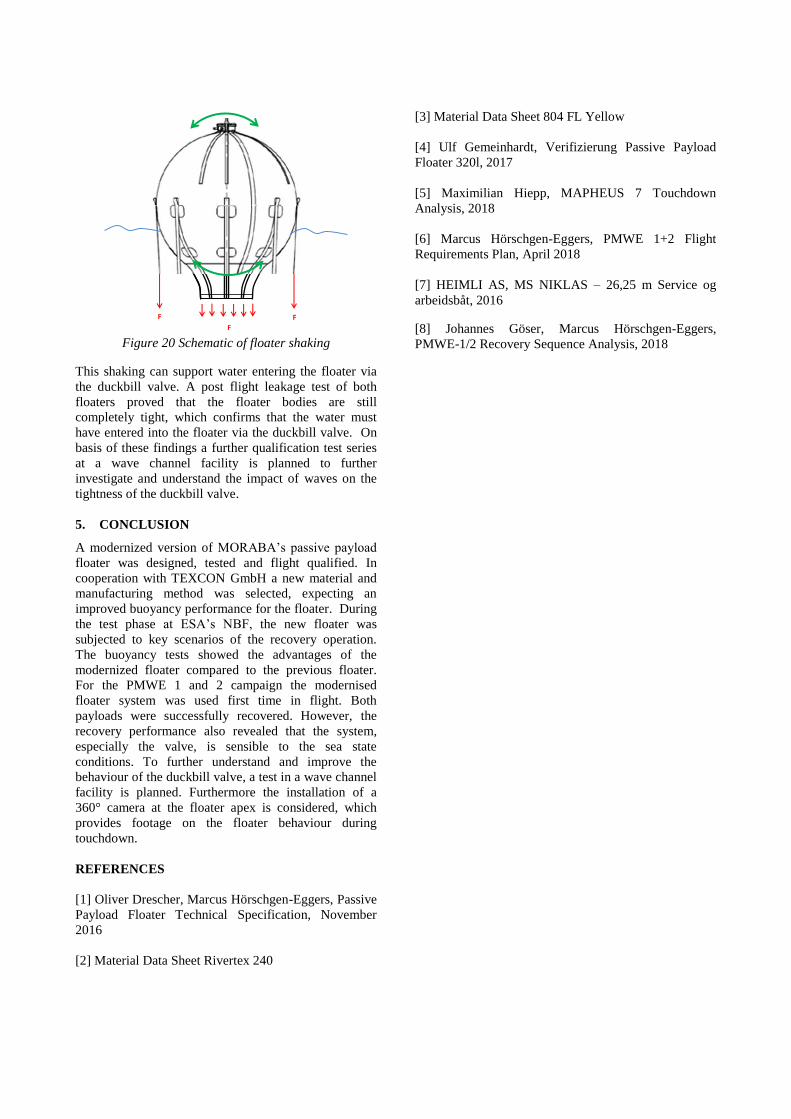
Figure 20 Schematic of floater shaking
This shaking can support water entering the floater via
the duckbill valve. A post flight leakage test of both
floaters proved that the floater bodies are still
completely tight, which confirms that the water must
have entered into the floater via the duckbill valve. On
basis of these findings a further qualification test series
at a wave channel facility is planned to further
investigate and understand the impact of waves on the
tightness of the duckbill valve.
5. CONCLUSION
A modernized version of MORABA’s passive payload
floater was designed, tested and flight qualified. In
cooperation with TEXCON GmbH a new material and
manufacturing method was selected, expecting an
improved buoyancy performance for the floater. During
the test phase at ESA’s NBF, the new floater was
subjected to key scenarios of the recovery operation.
The buoyancy tests showed the advantages of the
modernized floater compared to the previous floater.
For the PMWE 1 and 2 campaign the modernised
floater system was used first time in flight. Both
payloads were successfully recovered. However, the
recovery performance also revealed that the system,
especially the valve, is sensible to the sea state
conditions. To further understand and improve the
behaviour of the duckbill valve, a test in a wave channel
facility is planned. Furthermore the installation of a
360° camera at the floater apex is considered, which
provides footage on the floater behaviour during
touchdown.
REFERENCES
[1] Oliver Drescher, Marcus Hörschgen-Eggers, Passive
Payload Floater Technical Specification, November
2016
[2] Material Data Sheet Rivertex 240
[3] Material Data Sheet 804 FL Yellow
[4] Ulf Gemeinhardt, Verifizierung Passive Payload
Floater 320l, 2017
[5] Maximilian Hiepp, MAPHEUS 7 Touchdown
Analysis, 2018
[6] Marcus Hörschgen-Eggers, PMWE 1+2 Flight
Requirements Plan, April 2018
[7] HEIMLI AS, MS NIKLAS – 26,25 m Service og
arbeidsbåt, 2016
[8] Johannes Göser, Marcus Hörschgen-Eggers,
PMWE-1/2 Recovery Sequence Analysis, 2018
F F F F
F