Seam Welding
186
EUR. ih .s so * * *** Commission of the European Communities technical steel research Properties and service performance HIGH SPEED RESISTANCE SEAM WELDING OF UNCOATED AND COATED STEELS Blow-up from microfiche original
description
THIS IS THE SEAM WELDING PROCEDURES
Transcript of Seam Welding
EUR. ih .s so * * ***
Commission of the European Communities
technical steel research
Properties and service performance
HIGH SPEED RESISTANCE SEAM WELDING OF UNCOATED AND COATED STEELS
Blow-up from microfiche original


Commission of the European Communities
iGUililtfli sitiei l i^ct iy i l
Properties and service performance
HIGH SPEED RESISTANCE SEAM WELDING OF UNCOATED AND COATED STEELS
N.T. WILLIAMS, W. WADDELL
BRITISH STEEL CORPORATION 9, Albert Embankment GB-LONDON SE1 7SN
Contract No 7210-KA/809 (1.7.1984 - 30.6.1987)
FINAL REPORT
1988
Directorate-General Science, Research and Development
PARI nr
N.C./E -Í CL EUR 11550 EN
ri IIW1.W
Published by the COMMISSION OF THE EUROPEAN COMMUNITIES
Directorate-General Telecommunications, Information Industries and Innovation
L-2920 LUXEMBOURG
LEGAL NOTICE
Neither the Commission of the European Communities nor any person acting on behalf of the Commission is responsible for the use which might be made of
the following information
© ECSC-EEC-EAEC, Brussels • Luxembourg, 1988

HIGH SPEED RESISTANCE SEAM WELDING OF UNCOATED AND COATED STEELS
Summary
Sheet steel in the thickness range 0.5-1.5mm is currently resistance seam welded in mass production industries for domestic appliances, central heating radiators, fuel tanks and container/drum manufacture. Welding speeds of 2-4m/min are typical in many applications. The various factors which limit the welding speed were therefore determined for the many variants of the seam welding process. A comparison was made of conventional wide seam welding with narrow wheel and wire seam welding techniques, using either an AC or DC secondary current.
A range of uncoated and coated mild steels was used for this assessment. Results indicated that welding speeds up to 14 to 16m/min could be attained with narrow seam and mash welding of uncoated steels. As the welding speed was increased, the available current range between weld formation and weld splash decreased thereby decreasing the available range for satisfactory welding. The maximum speed attainable depended on the welding conditions, steel thickness and the type of seam welding process used.
The decrease in the available welding range could be attributed to the relatively earlier onset of weld splash as welding speed was increased. This generally resulted from an increased rate of nugget growth towards the surface of the weld seam and consequent expulsion of liquid through the sheet surface. Nugget growth in the through thickness direction was promoted by increasing the proportion of the welding current which flowed towards the exit side of the arc of contact between the welding electrodes and the sheet being welded. This had the result of concentrating the welding current over a shorter distance and also resulted in a decrease in the rate of heat abstraction through the electrodes. Factors which facilitated current now towards the exit side of the electrode arc of contact were increased steel thickness, the presence of a low resistance coating and increased welding speeds. Weld nugget growth in the through thickness direction and the earlier onset of weld splash were also promoted by low electrode force levels and the use of steels of high resistivity.With regard to welding configuration, wide seam welding generally resulted in lower maximum welding speeds than either narrow or mash seam welding, e.g. 6-8m/min compared to 14-16m/min. This was attributed to the greater volume of liquid nugget produced in this process and the consequent difficulty in achieving the necessary solidification before the nugget exited from the electrode arc of contact.
The influence of a DC welding current compared to an AC current depended on the factors which limited the maximum speed when an AC welding current was used. In situations where the welding speed was limited by weld splash, the use of a DC current generally resulted in a slight decrease in the maximum welding speed attained. This was attributed to the higher surface temperatures with DC current which resulted from the absence of the low/zero current region which occurs with an AC current waveform. In situations where the welding speed was limited by nugget separation when using an AC current, e.g. mash welding, then the use of a DC current resulted in an increase in the maximum welding speed attained by at least 30%.
It was noted that the presence of different surface oil levels had little effect on weld formation.
Minimum indentation welds could be produced over a range of welding currents and welding speeds. With the higher welding currents slight bulging was produced on the non-indentation side. At welding speeds above 6m/min, the limiting factor was a ripple effect on the weld surface, this being due to the oscillating nature of the AC current.
With coated steels, the maximum welding speeds were less than those obtained with uncoated mild steel both with narrow seam and wire welding, e.g. 8-12m/min compared to 14-16m/min. Coated steels exhibited narrower welding ranges because of the higher currents necessary for weld formation and the relatively early onset of weld splash. This effect arose from the additional current shunting which occurred through the region of bonded coating around the periphery of the weld nugget, from increased
- I V -
current flow towards the exit side of the electrode arc of contact, and from the high surface temperatures which resulted.
Another factor which limited the welding range with coated steels was weld cracking. The coated steels could be classified into three groups based on their susceptability to cracking, i.e.
- High susceptability to cracking - hot dipped and electroplated zinc coatings
- Intermediate susceptability to cracking - iron-zinc alloy, zinc-5% aluminium and lead-tin coatings
- Low susceptability to cracking - zinc - 55% aluminium and aluminium coatings
Cracking resulted from intergranular penetration of liquid copper, brass or bronze phases which formed on the surface of the weld seam as a result of alloying between the coating and the copper electrode. The use of interrupted current programmes and relatively low welding speeds improved the heat abstraction from the surface of the seam and reduced/eliminated the problem of weld cracking.
Monitoring of welding current, electrode force, electrode movement, and dynamic resistance was carried out during welding. With roller-spot seam welding the parameters exhibited responses similar to those observed in spot welding. With continuous current the parameters varied dur ing the initial weld formation then reached a steady-state condition which was generally maintained along the remainder of the seam.
The electrode force pattern during welding was predominantly a function of machine and welding current characteristics. Any force which tends to separate the electrode wheels will result in an increase in the force recorded in any machine where the welding head cannot react quickly enough to the expansion forces.
The steady-state condition recorded for the electrode head movement was explained in terms of the basic stiffness of the welding head preventing oscillations at 100Hz and also the fairly constant volume of liquid which forms under the electrode wheels once a steady-state condition is reached. The steady-state level of the dynamic resistance was influenced by welding and material parameters, the welding process and the extent of weld formation. The latter suggests that it may be possible to use dynamic resistance as a basis for monitoring seam weld quality.
A basic model of weld formation was developed which showed that weld growth was governed by the distribution of resistance in the weld zone and the corresponding variation in current density in this zone.
From the proposed model it was concluded that factors which may allow an increase in the attainable welding speed are:-
1) The use of increased electrode force levels and/or the use of larger diameter electrodes.
2) Improved cooling of the surface of the welding seam by more efficient water cooling and/or electrode extension systems.
3) The use of a two-stage process, i.e. a low heat weld to initiate bonding followed by a high heat stage to ensure acceptable weld quality.
4) In situations where the welding speed is limited by nugget separation, DC currrent or higher frequency AC welding current can be beneficial.
It should also be noted that the maximum welding speed may be increased in many instances by reducing the width of the weld seam to the minimum width compatable with the requirements of the end product.
v
CONTENTS Page No.
1. INTRODUCTION 1
2. SCOPE OF INVESTIGATION 1
2.1. Basic Principles of Seam Welding 1
2.2. Objectives of Investigation 2
3. EXPERIMENTAL PROCEDURE 3
3.1. Materials Examined 3 3.2. Welding Equipment 4 3.3. Welding Procedure 4 3.4. Assessment of Weld Quality 5 3.5. Instrumentation 5 3.5.1. Secondary Current 5 3.5.2. Dynamic Resistance 6 3.5.3. Electrode Force Measurement 7 3.5.4. Displacement/Head Movement 7 3.5.5. Eliminationof Noise Signals 7 3.5.6. Storage and Recovery of Data 8 4. WELDABILITY OF UNCOATED MILD STEEL 8
4.1. Influence of Steel Quality 9 4.1.1. Influence of Sheet Thickness 9 4.1.1.1. Effect of Sheet Thickness on the Weldability Lobe 9 4.1.1.2. Effect of Thickness Tolerance 10 4.1.2. Effect of Surface Oil 11 4.1.3. Influence of Bulk Resistivity 11 4.2. Influence of Current Waveform 12 4.2.1. Effect of Interrupted Current Programmes 13 4.2.2. DC Welding Currents 13 4.3. Effect of Electrode Force 14 4.4. Effect of Welding Configuration 15 4.5. Roller-spot Welding 16 4.6. Low Indentation Welding 17
5. WELDABILITY OF COATED STEELS 17
5.1. Narrow Seam Welding 18 5.1.1. Terne Coated Steels 18 5.1.2. Aluminium Coated Steels 18 5.1.3. Zinc Coated Steels 18 5.2. Soudronic Wire Welding 19 5.2.1. Continuous Welding 19 5.2.2. Interrupted Current Programmes 20 5.2.3. Metallographic Examination of Welds 21 5.2.4. Factors Limiting the Welding Range 22 5.3. Cracking in Narrow Seam Welds 23 5.3.1. Incidence of Cracking 23 5.3.2. Mechanism of Crack Formation 24
6. MONITORING OF THE SEAM WELDING PROCESS 25
6.1. Welding Current 26 6.2. Voltage between the Welding Electrodes 26 6.3. Electrode Force 26

-VI
6.4. Electrode Displacement 27 6.5. Dynamic Resistance 27 6.5.1. Influence of Welding Current Programme 28 6.5.2. Factors Influencing Initial Peak 28 6.5.3. Factors Influencing Steady-State Condition 29
7. METALLOGRAPHIC STUDY OF WELD FORMATION 30
7.1. Uncoated Steels 30 7.1.1. Weld Nugget Structures 30 7.1.2. Weld Start Position 31 7.1.3. Distribution of Current Flow in the Weld Zone 33 7.1.4. Influence of Welding/Material Parameters 34 7.1.4.1. Narrow Seam Welds 34 7.1.4.2. Wide Seams Welds 34 7.1.4.3. Mash Welds 35 7.2. Coated Steels 36
8. GENERAL MODEL OF WELD FORMATION 36
8.1. Uncoated Mild Steel 36 8.1.1. Stages of Weld Formation 37 8.1.2. Current Distribution in the Weld Zone 38 8.1.3. Factors Influencing the Available Welding Range 39 8.2. Coated Steels 40
8.3. Guidelines for Increasing Welding Speed 41
9. CONCLUSIONS 42
10. REFERENCES 45
TABLES 47
FIGURES 70

VII
List of Table
1. Chemical Analysis of Mild Steels used in the Investigation 2. Chemical Analysis of High Strength Steels Examined. 3. Chemical Analysis of Base Steels and Coatings in the Coated Steels Examined. 4. Comparison of Maximum Welding Speeds for AC and DC Power Supplies with Narrow, Wide
and Mash Seam Welding. 5. Comparison of Minimum Current Requirements for AC and DC Power Supplies with
Narrow, Wide and Mash Seam Welding. 6. Comparison of Available Welding Current Ranges for AC and DC Power Supplies with
Narrow, Wide and Mash Seam Welding. 7. Effect of Steel Variables - Metallographic Examination. 8. Resistivity Values Determined for the Steel Types Used. 9. Effect of Increasing the Electrode Force on the Maximum Welding Speed for 1.2/1.4mm
Thick Steel. 10. Comparison of Maximum Welding Speeds for Steels of Different Composition and Thickness
- Narrow Seam/Continuous AC Current. 11. Minimum and Maximum Welding Currents for 1.2/1.4 mm Thick Mild and High Strength
Steels. 12. Effect of Electrode Force on Maximum Welding Speeds Attainable. 13. Maximum Welding Speeds for Uncoated and Coated Steels. 14. Comparison of Minimum AC Current Requirement for Mild Steel and Coated Steel. 15. Comparison of AC Welding Current Giving Rise to Splash/Pitting for Mild Steel and Coated
Steel. 16. Decrease in Welding Current for Continuous Plug Formation when using DC Compared to
AC Current. 17. General Results from Soudronic Welding Trials. 18. Comparison of Available Welding Range Narrow Seam vs Wire Weld. 19. Comparison of Minimum Currents for Continuous Weld Formation Narrow Seam vs Wire
Weld. 20. The Effect of Electrode Force on the Resistance at the Minimum and Maximum Welding
Conditions at 6 m/min. 21. Dynamic Resistance Level at Minimum and Maximum Welding Currents for 1.2/1.4 mm
Thick Steels of Different Resistivity. 22. Comparison of Resistance Level for AC vs DC and Narrow vs Wide Seam Welding at a
Welding Speed of 6 m/min.

IX
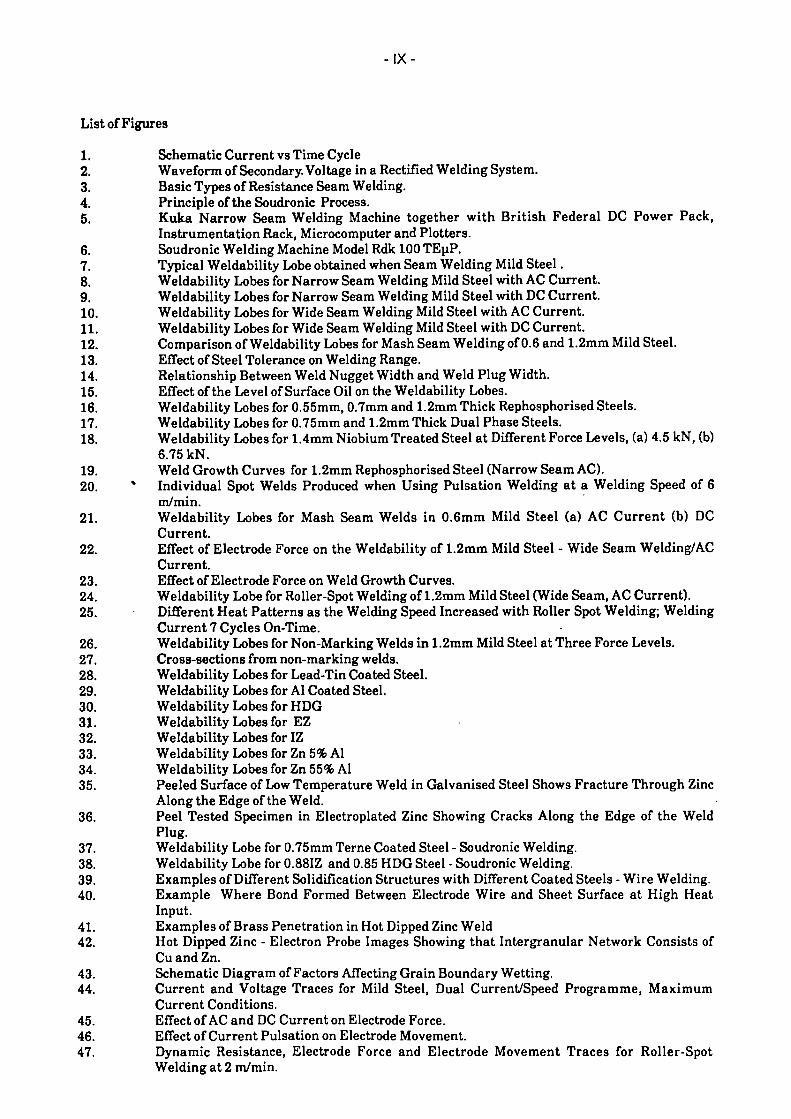
List of Figures
1. Schematic Current vs Time Cycle 2. Waveform of Secondary. Voltage in a Rectified Welding System. 3. Basic Types of Resistance Seam Welding. 4. Principle of the Soudronic Process. 5. Kuka Narrow Seam Welding Machine together with British Federal DC Power Pack,
Instrumentation Rack, Microcomputer and Plotters. 6. Soudronic Welding Machine Model Rdk 100 TEpP. 7. Typical Weldability Lobe obtained when Seam Welding Mild Steel. 8. Weldability Lobes for Narrow Seam Welding Mild Steel with AC Current. 9. Weldability Lobes for Narrow Seam Welding Mild Steel with DC Current. 10. Weldability Lobes for Wide Seam Welding Mild Steel with AC Current. 11. Weldability Lobes for Wide Seam Welding Mild Steel with DC Current. 12. Comparison of Weldability Lobes for Mash Seam Welding of 0.6 and 1.2mm Mild Steel. 13. Effect of Steel Tolerance on Welding Range. 14. Relationship Between Weld Nugget Width and Weld Plug Width. 15. Effect of the Level of Surface Oil on the Weldability Lobes. 16. Weldability Lobes for 0.55mm, 0.7mm and 1.2mm Thick Rephosphorised Steels. 17. Weldability Lobes for 0.75mm and 1.2mm Thick Dual Phase Steels. 18. Weldability Lobes for 1.4mm Niobium Treated Steel at Different Force Levels, (a) 4.5 kN, (b)
6.75 kN. 19. Weld Growth Curves for 1.2mm Rephosphorised Steel (Narrow Seam AC). 20. * Individual Spot Welds Produced when Using Pulsation Welding at a Welding Speed of 6
m/min. 21. Weldability Lobes for Mash Seam Welds in 0.6mm Mild Steel (a) AC Current (b) DC
Current. 22. Effect of Electrode Force on the Weldability of 1.2mm Mild Steel - Wide Seam Welding/AC
Current. 23. Effect of Electrode Force on Weld Growth Curves. 24. Weldability Lobe for Roller-Spot Welding of 1.2mm Mild Steel (Wide Seam, AC Current). 25. Different Heat Patterns as the Welding Speed Increased with Roller Spot Welding; Welding
Current 7 Cycles On-Time. 26. Weldability Lobes for Non-Marking Welds in 1.2mm Mild Steel at Three Force Levels. 27. Cross-sections from non-marking welds. 28. Weldability Lobes for Lead-Tin Coated Steel. 29. Weldability Lobes for Al Coated Steel. 30. Weldability Lobes for HDG 31. Weldability Lobes for EZ 32. Weldability Lobes for IZ 33. Weldability Lobes for Zn 5% Al 34. Weldability Lobes for Zn 55% Al 35. Peeled Surface of Low Temperature Weld in Galvanised Steel Shows Fracture Through Zinc
Along the Edge of the Weld. 36. Peel Tested Specimen in Electroplated Zinc Showing Cracks Along the Edge of the Weld
Plug. 37. Weldability Lobe for 0.75mm Terne Coated Steel - Soudronic Welding. 38. Weldability Lobe for 0.88IZ and 0.85 HDG Steel - Soudronic Welding. 39. Examples of Different Solidification Structures with Different Coated Steels - Wire Welding. 40. Example Where Bond Formed Between Electrode Wire and Sheet Surface at High Heat
Input. 41. Examples of Brass Penetration in Hot Dipped Zinc Weld 42. Hot Dipped Zinc - Electron Probe Images Showing that Intergranular Network Consists of
Cu and Zn. 43. Schematic Diagram of Factors Affecting Grain Boundary Wetting. 44. Current and Voltage Traces for Mild Steel, Dual Current/Speed Programme, Maximum
Current Conditions. 45. Effect of AC and DC Current on Electrode Force. 46. Effect of Current Pulsation on Electrode Movement. 47. Dynamic Resistance, Electrode Force and Electrode Movement Traces for Roller-Spot
Welding at 2 m/min.

X
48. Dynamic Resistance, Electrode Force and Electrode Movement Traces for Roller-Spot Welding at 6m/min.
49. Dynamic Resistance, Electrode Force and Electrode Movement Traces for Roller-Spot Welding at 10 m/min.
50. Dynamic Resistance Curves for an Interrupted Current Programme of 3 Cycles on/2 Cycles Off Showing the Effect of Welding Speed and Welding Current.
51. Dynamic Resistance for AC and DC Welds on 1.2mm Mild Steel (6m/min). 52. Dynamic Resistance and Current Traces at the start of the Weld for 0.6mm and 1.2mm Mild
Steel. 53. The Effect of Increasing Welding Current on the Steady State Dynamic Resistance Level for
a Range of Steels (2m/min). 54. The Effect of Steel Composition and Speed on the Dynamic Resistance at Minimum and
Maximum Current for 0.7/0.75 mm Thick Steels. 55. Typical Weld Structure Revealed by Nital Etch. 56. Effect of Current Waveform on Weld Nugget Formation. 57. Effect of Light Aperture and Focus on Revelation of Weld Bands. 58. Effect of Using a Current Programme of 2 Cycles on /l Cycle Off on Band Formation. 59. Production of Bands in Spot Welds. 60. Influence of Speed on Nugget Geometry. 61. Nugget Development from 2 to 4 Cycles of Welding Current. 62. Changes in the Weld Zone During the First Few Cycles of Welding Current. 63. Comparison of Heat Patterns, with One Cycle of Weld Current, Between 1.2 and 0.6mm
Thick Mild Steel. 64. Heat Pattern Under Electrodes at Welding Speeds of 2, 6 and 10 m/min. 65. The Effect of Welding Current on Nugget Geometry. 66. The Effect of Welding Speed on Nugget Geometry. 67. The Effect of Electrode Force on Nugget Geometry. 68. The Effect of Resistivity on Nugget Geometry. 69. " The Effect of AC and DC Current on Nugget Geometry. 70. "High Temperature Tunnel" Effect Observed in DC Welding. 71. Rotation of Weld Nugget from Horizontal to a Position Along the Inclined Interface Occurred
as the Welding Speed was Increased. 72. Transverse Sections Taken from the Region of Weld Formation Showing that 'Mash-Down'
Occurs before any Liquid is Formed at Low and High Welding Speeds. 73. Comparison of Nugget Formation with AC and DC Current in Mash Seam Welding. 74. Initial Weld Formed after 1 Cycle With Mild Steel 2 Cycles with Pb (Sn) Coatings and 3
Cycles with Hot Dipped Zinc Coated Steel. 75. Longitudinal Sections Showing Heat Pattern in the Region of Weld Formation at 2, 6 and 10
m/min, for Mild Steel. 76. Longitudinal Sections Showing Heat Pattern in the Region of Weld Formation at 2, 6 and 10
m/min, for Electroplated Zinc Coated Steel. 77. Longitudinal Sections Showing Heat Pattern in the Region of Weld Formation at 2, 6 and 10
m/min for Hot Dipped Zinc Coated Steel. 78. Four Stages of Weld Development as Indicated by the Dynamic Resistance. 79. Resistance Paths Between Welding Electrodes. 80. Current Flow Between Welding Electrodes. 81. Effect of Welding Speed on Current Flow.

XI
SOUDAGE A RESISTANCE EN LIGNE CONTINUE A GRANDE VITESSE D'ACIERS REVETUS ET NON REVETUS
Résumé
Des tôles d'une épaisseur comprise entre 0,5 et 1,5mm sont actuellement soudées par soudage à résistance en ligne continue dans des usine de production en série d'appareils ménagers, de radiateurs de chauffage central, de réservoirs de carburant et de conteneurs/fûts. Des vitesses de soudage de 2 à 4 mètres par minutes se rencontrent couramment dans l'industrie. On a donc déterminé les facteurs qui limitent la vitesse de soudage applicable à de nombreuses variantes du soudage en ligne continue. On a comparé les techniques de soudage avec rouleau étroit et large et avec fil métallique.
Dans le cadre de cette étude, on a utilisé des aciers doux revêtus et non revêtus. D'après les résultats, on peut conclure qu'il est possible d'atteindre des vitesses de 14 à 16 m par minute pour le soudage à recouvrement étroit et par écrasement d'aciers non revêtus. Si on augmente la vitesse de soudage, l'écart entre la formation de la soudure et l'apparition des éclaboussures diminue, ce qui signifie que l'on dispose en fait de moins de temps pour produire une soudure de bonne qualité. La vitesse maximum atteinte dépend des conditions de soudage, de l'épaisseur de l'acier et du type de soudage en ligne effectué.
La diminution du temps disponible peut s'expliquer par l'apparition précoce des éclaboussures au fur et à mesure que la vitesse de soudage augmente. En règle générale, le phénomène se traduit par l'apparition de pépites à la surface de la soudure et le rejet de liquide à la surface de la tôle. L'apparition des pépites est 'encouragée par l'augmentation du courant qui circule du côté sortie de l'arc de contact entre les électrodes de soudage et la tôle soudée. Le courant est alors concentré sur une courte distance et la vitesse des pertes de chaleur dans les électrodes diminue. Les facteurs qui stimulent le flux de courant vers le côté sortie de l'arc de contact sont une tôle plus épaisse, un revêtement à faible résistance et des vitesses de soudage plus grandes. L'apparition des pépites et des éclaboussures précoces est due à la faible force des électrodes et à l'utilisation d'aciers à haute résistance. En ce qui concerne le soudage, les vitesses maximum sont moins grandes pour le soudage à rouleaux larges que pour celui à rouleaux étroits et par écrasement (par exemple 6 à 8 min contre 14 à 16 min). Cette différence s'explique par le plus grand volume de pépites liquides générées et, par conséquent, par les difficultés rencontrées pour obtenir la solidification des pépites avant qu'elles ne sortent de l'arc de contact des électrodes.

XII-
L'effet du courant continu comparé à celui du courant alternatif dépend des facteurs qui limitent la vitesse maximum de soudage lorsque du courant alternatif est utilisé. Dans les cas où la vitesse de soudage est limitée par des éclaboussures, le courant continu provoque, en général, une légère diminution de la vitesse de soudage. Ce phénomène s'explique par des températures de surface plus élevées en présence de courant continu, et à leur tour, ces températures plus élevées s'expliquent par l'absence de courant bas/zéro rencontré en présence d'une forme d'onde de courant alternatif. Dans les cas où la vitesse de soudage est limitée par la séparation des pépites et où du courant alternatif est utilisé, par exemple lors de soudage par écrasement, on constate une augmentation d'au moins 30% de la vitesse maximum de soudage si l'on utilise du courant continu.
L'on a constaté que la présence de niveaux d'huile de surface différents n'avait guère d'effet sur la formation de la soudure.
Des soudures à indentation minimum peuvent être générées à l'aide d'une série de courants et de vitesses de soudage. A des vitesses de soudage supérieures à 6m/m, la limite.'est l'ondulation sur la surface de la soudure qui s'explique par les oscillations du courant alternatif.
Avec les aciers revêtus, les vitesses maximum de soudage sont inférieures à celles obtenues avec ce l'acier doux non revêtu, soudé par soudage étroit et fil métallique, par exemple 8 à 12m/min contre 14 à 16m/min. les aciers revêtus atteignent des vitesses moins élevées car ils exigent des courants plus forts pour la formation de la soudure et parce que des éclaboussures font leur apparition assez rapidement. Ce phénomène s'explique par le shunt de courant qui se produit dans la région du revêtement, autour de la périphérie des pépites, à partir du débit de courant plus élevé près du côté sortie de l'arc de contact de l'électrode et des températures de surface plus élevées.
Un autre facteur qui limite le soudage des aciers revêtus est la fissuration des soudures. Les aciers soudés peuvent être classés en trois catégories, selon leur propension à la fissuration :
Haute propension à la fissuration - aciers revêtus galvanisés à chaud et électrolytiquement
Propension moyenne à la fissuration - aciers revêtus alliés au zinc avec 5% d'aluminium, aciers plombés et étamés
Faible propension à la 'issuration - aciers alliés au zinc avec 5% d'aluminium et aluminiu-.
Les fissures proviennert de la pénétration intergranulaire de cuivre, de .laiton ou de bronze liquide qui se forme à la surface de la soudure à la suite de l'alliage entre le revêtement et l'électrode en cuivre. L'utilisation de courarts interrompus et de vitesses de soudage relativement basses améliorent les pertes de chaleur à la surface de la soudure et réduisent ou élimine-t les fissures.
Pendant le soudage, on c contrôlé le courant de soudage, la force et le mouvement des électrodes et la résistance d>namique. Lors du soudage pas

XIII-
à pas par molette, les paramètres ont produit des réactions similaires à celles rencontrées lors du soudage par points. Avec du courant continu, les paramètres varient pendant la formation de la soudure initiale, puis se stabilisent pour se maintenir le long du reste de la soudure.
La force des électrodes au cours du soudage est essentiellement fonction des caractéristiques de la machine et du courant de soudage. Toute force qui a tendance à séparer les roues des électrodes provoque une augmentation de la force enregistrée dans n'importe quelle machine où la tête de soudage est incapable de réagir suffisamment rapidement aux forces de dilatation.
La stabilité du mouvement de la tête des électrodes s'explique par la rigidité de la tête de soudage qui empêche les oscillations à 100Hz et également par le volume relativement constant de liquide qui se forme sous les roues des électrodes une fois que la stabilité est atteinte. La stabilité de la résistance dynamique est influencée par les paramètres de soudage et des matériaux, le processus de soudage et l'étendue de la formation de la soudure. Ceci indique qu'il est possible d'utiliser la résistance dynamique pour contrôler la qualité de la soudure.
On a développé un modèle élémentaire de formation de soudure qui montre que la croissance d'une soudure dépend de la distribution de la résistance dans la zone de soudage et de la variation correspondante de la densité du courant dans cette zone.
A partir de ce modèle, on a conclu que les facteurs susceptibles de permettre une augmentation de la vitesse de soudage sont :
1) L'utilisation d'une plus grande force des électrodes et/ou d'électrodes de plus grand diamètre.
2) L'amélioration du refroidissement de la surface de la soudure à l'aide de systèmes plus efficaces de refroidissement par eau et/ou d'électrodes plus grandes.
3) L'utilisation d'un processus à deux étapes, à savoir un soudage à faible chaleur pour générer là metallisation, suivi d'une étape de forte chaleur qui garantit la bonne qualité de la soudure.
4) Dans les cas où la vitesse de soudage est limitée par la séparation des pépites, du courant continu ou du courant alternatif à haute fréquence peuvent se révéler bénéfiques.
Il faut noter que la vitesse maximum de soudage peut être augmentée dans beaucoup de cas en diminuant la largeur de la soudure, en tenant compte bien entendu du produit final requis.


XV-
SOMMAIRE PAGE
1. INTRODUCTION 1
2. RAYON DE L'ETUDE 1
2.1 Principes fondamentaux du soudage en ligne continue 1
2.2 Objectifs de l'étude 2
3. PROCEDURE EXPERIMENTALE 3
3.1 Matériaux étudiés 3 3.2 Equipement de soudage 4 3.3 Procédure de soudage 4 3.4 Evaluation de la qualité de la soudure 5 3.5 Instruments 5 3.5.1 Courant secondaire 5 3.5.2 Résistance dynamique 6 3.5.3 Mesure de la force des électrodes 7 3.5.4 Déplacement/mouvement de la tête 7 3.5.5 Elimination des signaux sonores 7 3.5.6 Mémorisation et rappel des données 8 4. SOUDABILITE DE L'ACIER DOUX NON REVETU 8 4.1 Influence de la qualité de l'acier 9 4.1.1 Influence de l'épaisseur de l'acier 9 4.1.1.1. Effet de l'épaisseur de l'acier sur l'oreille de
soudabilité 9 4.1.1.2. Effet de la tolérance d'épaisseur 10 4.1.2. Effet de L'huile de surface 11 4.1.3 Influença de la résistivité de masse 11 4.2 Influence de la forme d'onde de courant 12 4.2.1 Effet des programmes de courant interrompus 13 4.2.2. Courants continus de soudage 13 4.3 Effet de la force des électrodes 14 4.4 Effet de la configuration du soudage 15 4.5 Soudage pas à pas par molette 16 4.6 Soudage à indentation basse 17
5. SOUDABILITE DES ACIERS REVETUS 17
5.1 Soudage à recouvrement étroit 18 5.1.1. Aciers ternes 18 5.1.2 Aciers revêtus d'aluminium 18 5.1.3 Aciers revêtus de zinc 18 5.2 Soudage par fil soudronique 19 5.2.1 Soudage continu 19 5.2.2 Programmes de courant interrompus 20 5.2.3 Examen métallographique des soudures 21 5.2.4 Limite de la gamme de soudage 22 5.3 Fissuration des soudures à recouvrement étroit 23 5.3.1 Incidence des fissures 23 5.3.2 Mécanisme de la formation des fissures 24

XVI
6. CONTROLE DE LA SOUDURE EN LIGNE CONTINUE 25
6.1 Courant de soudage 26* 6.2 Tension entre les électrodes de soudage 26 6.3 Force des électrodes 26 6.4 Déplacement des électrodes 27 6.5 Résistance dynamique 27 6.5.1 Influence du programme de courant de soudage 28 6.5.2 Facteurs qui influencent la crête initiale 28 6.5.3 Facteurs qui influencent la stabilité 29
7. ETUDE METALLOGRAPHIQUE DE LA FORMATION DE SOUDURE 30
7.1 Aciers non revêtus 30 7.1.1 Structures des pépites de soudure 30 7.1.2 Position de départ de la soudure 31 7.1.3 Distribution du courant dans la zone de soudure 33 7.1.4 Influence des paramètres de soudage/matériaux 34 7.1.4.1 Soudures à recouvrement étroit 34 7.1.4.2 Soudures à recouvrement large 34 7.1.4.3 Soudures par écrasement 35 7.2 Aciers revêtus 36
8. MODELE GENERAL DE LA FORMATION DE SOUDURE 36
8.1 Acier doux non revêtu 36 8.1.1 Stades de la formation d'une soudure 37 8.1.2 Distribution du courant dans la zone de soudure 38 8.1.3 Facteurs qui influencent la gamme de soudures 39 8.2 Aciers revêtus 40
8.3 Principes d'augmentation de la vitesse de soudage 41
9. CONCLUSIONS 42
10. REFERENCES 45
TABLEAUX 47
FIGURES 70

- XVII -
LISTE DES TABLEAUX
1. Analyse chimique des aciers utilisés dans l'étude 2. Analyse chimique des aciers à haute résistance étudiés 3. Analyse chimique des aciers de faible teneur et des revêtements
des aciers revêtus étudiés 4. M Comparaison des vitesses maximum de soudage avec des courants continu
et alternatifs pour des soudages en ligne continue par écrasement et avec recouvrement étroit ou large
5. Comparaison des courants minimum continu et alternatif requis pour des soudages en ligne continue par écrasement et avec recouvrement étroit ou large
6. Comparaison des gammes de courant minimum continu et alternatif disdisponibles pour des soudages en ligne continue avec recouvrement étroit ou large et par écrasement
7. Effet des variables des aciers - étude métallographique 8. Valeurs de la résistivité pour les types d'acier utilisés 9. Effet de l'augmentation de la force des électrodes sur la vitesse
maximum de soudage pour de l'acier de 1,2/1,4mm d'épaisseur 10. Comparaison des vitesses de soudage maximum pour des aciers de
composition et d'épaisseur différentes - recouvrement étroit/courant alternatif continu
11. Courants de soudage minimum et maximum pour des aciers de 1,2/1,4mm ' d'épaisseur, doux et à haute résistance
12. Effet de la force des électrodes sur les vitesses maximum de soudage 13. Vitesses de soudage maximum pour des aciers revêtus et non revêtus 14. Comparaison des courants minimum alternatifs requis pour de l'acier
doux et de l'acier revêtu 15. Comparaison du courant de soudage alternatif provoquant des écla-
boussures /piqûres pour de l'acier doux et de l'acier revêtu 16. Diminution du courant de soudage pour la formation continue de soudage
en bouchon en utilisant du courant continu par comparaison à du courant alternatif
17. Résultats généraux des essais de soudage soudroniques 18. Comparaison de la gamme de soudage disponible - recouvrement étroit/
fil métallique 19. Comparaison des courants minimum peur la formation de soudure continue -
recouvrement étroit/fil métallique 20. Effet de la force des électrodes sur la résistance aux conditions
de soudage minimum et maximum, 6m/min 21. Niveau de résistance dynamique avec des courants de soudage minimum
et maximum pour des aciers d'épaisseur de 1,2/1,4mm de résistivité différente
22. Comparaison du niveau de résistance pour du courant alternatif et continu et un soudage en ligne continue à recouvrement étroit et large, à une vitesse de soudage de 6m/min


XIX-
LISTE DES FIGURES
1. Schéma du cycle courant/temps 2. Forme d'onde de tension secondaire dans un système de soudage rectifié 3. Types fondamentaux de soudage à résistance en ligne continue 4. Principes du processus soudronique 5. Machine de soudage à recouvrement étroit Kuka et génératrice de cou
rant continu British Federal, tableau d'instruments, micro-ordinateur et tables traçantes
6. Machine à souder soudronique, modèle Rdk 100 TEuP 7. Oreille de soudabilité typique obtenue par soudage en ligne continue
d'acier doux 8. Oreilles de soudabilité pour acier doux soudé en ligne continue avec
recouvrement étroit, courant alternatif 9. Oreilles de soudabilité pour acier doux soudé en ligne continue avec
recouvrement étroit, courant continu 10. Oreilles de soudabilité pour acier doux soudé en ligne continue avec
recouvrement large, courant alternatif 11. Oreilles de soudabilité pour acier doux soudé en ligne continue avec
recouvrement large, courant continu 12. Comparaison des oreilles de soudabilité pour le soudage par écrase
ment d'aciers doux de 0,6 et 1,2mm 13. Effet de la tolérance de l'acier sur la gamme de soudage 14. Rapport entre la largeur des pépites de soudage et la largeur des bou
chons de soudage 15. Effet du niveau d'huile de surface sur les oreilles de soudabilité 16. Oreilles de soudabilité pour des aciers rephosphorisés de 0,55, 0,7
et 1,2mm d'épaisseur 17. Oreilles de soudabilité pour des aciers à deux phases de 0,75 et
1,2mm d'épaisseur 18. Oreilles de soudabilité pour de l'acier traité au niobium, à
différents niveaux de force, (a) 4,5kN, (b) 6,75kN 19. Courbes de croissance de soudure pour de l'acier rephosphorisé
(recouvrement étroit, courant alternatif) 20. Soudures par points individuelles générées par soudage à impulsions
à une vitesse de 6m/min 21. Oreilles de soudabilité pour les soudures par écrasement dans de
l'acier doux de 0,6mm, (a) courant alternatif, (b) courant continu 22. Effet de la force des électrodes sur la soudabilité d'acier doux
de 1,2mm - soudage à recouvrement large/courant alternatif 23. Effet de la force des électrodes sur les courbes de croissance de soudure 24. Oreille de soudabilité pour le soudage pas à pas par molette d'acier
doux de 1,2mm (recouvrement large, courant alternatif) 25. Diagrammes de chaleur différents au fur et à mesure de l'augmentation
de la vitesse de soudage avec le soudage pas à pas par molette 26. Oreilles de soudabilité pour des soudages sans marquage dans de
l'acier doux de 1,2mm à trois niveaux de force 27. Sections transversales de soudures sans marquage 28. Oreilles de soudabilité pour de l'acier plombé-étamé 29. Oreilles de soudabilité pour de l'acier à l'aluminium 30. Oreilles de soudabilité pour HDG 31. Oreilles de soudabilité pour EZ 32. Oreilles de soudabilité pour IZ 33. Oreilles de soudabilité pour zinc avec 5% d'aluminium 34. Oreilles de soudabilité pour zinc avec 55% d'aluminium

-XX
35. Surface écaillée de soudure à basse température dans de l'acier galvanisé, montrant une fracture dans le zinc le long du bord de la soudure
36. Spécimen écaillé dans du zinc galvanisé électrolytiquement, montrant des fissures le long du bord du bouchon de soudage
37. Oreille de soudabilité pour de l'acier terne de 0,75mm - soudage soudronique 38. Oreille de soudabilité pour de l'acier 0,881IZ et 0,85HDG - soudage
soudronique 39. Exemples de structures de solidification différentes entre des aciers
revêtus différents - soudage par fil métallique 40. Exemple d'agglomération entre le fil des électrodes et la surface de
la tôle sous forte chaleur 41. Exemples de pénétration d'étain dans une soudure en zinc galvanisé
à chaud 42. Zinc galvanisé à chaud - illustrations de sonde électronique montrant
que le réseau intergranulaire se compose de Cu et de Zn 43. Diagramme des facteurs qui influencent le mouillage de la limite des
grains 44. Traces de courant et de tension pour de l'acier doux, double programme
courant/vitesse, conditions de courant maximum 45. Effet du courant continu et alternatif sur la force des électrodes 46. Effet des impulsions électriques sur le mouvement des électrodes 47. Résistance dynamique, force et mouvement des électrodes pour le
soudage pas à pas par molette à 2m/min 48. Résistance dynamique, force et mouvement des électrodes pour le
soudage pas à pas par molette à 6m/min 49. Résistance dynamique, force et mouvement des électrodes pour le
soudage pas à pas par molette à lOm/min 50. Courbes de résistance dynamique pour un programme de courant interrompu
de 3 cycles de marche/2cycles d'arrêt, montrant l'effet de la vitesse et du courant de soudage
51. Résistance dynamique pour des soudages à courant alternatif et continu sur de l'acier doux de 1,2mm (6m/min)
52. Traces de résistance dynamique et de courant au début du soudage d'acier doux de 0,6 et de 1,2mm
53. Effet de l'augmentation du courant de soudage sur le niveau de résistance dynamique stable pour une gamme d'aciers (2m/min)
54. Effet de la composition de l'acier et de la vitesse sur la résistance dynamique avec du courant minimum et maximum pour des aciers de 0,7/0,75mm d'épaisseur
55. Structure de soudure caractéristique, gravure Nital 56. Effet de la forme d'onde du courant sur la formation de pépites de
soudure 57. Effet de l'ouverture et de la mise au point sur la révélation de
bandes de soudure 58. Effet d'un programme de courant de 2 cycles de marche et d'un cycle
d'arrêt sur la formation de bandes 59. Génération de bandes dans des soudures par points 60. Influence de la vitesse sur la géométrie des pépites 61. Développement de pépites entre 2 et 4 cycles de courant de soudage 62. Modifications dans la zone de soudage au cours des quelques premiers
cycles de courant de soudage 63. Comparaison des diagrammes de chaleur, avec un cycle de courant de
soudage, pour de l'acier doux de 1,2 et 0,6mm d'épaisseur

-XXI
64. Diagramme de chaleur sous les électrodes à des vitesses de soudage de 2,6 et 10m/min
65. Effet du courant de soudage sur la géométrie des pépites 66. Effet de la vitesse de soudage sur la géométrie des pépites 67. Effet de la force des électrodes sur la géométrie des pépites 68. Effet de la résistivité sur la géométrie des pépites 69. Effet du courant alternatif et continu sur la géométrie des pépites 70. Effet de "Tunnel à haute température"constaté lors du soudage à
courant continu 71. Rotation de la pépite de soudage de la position horizontale à une
position sur l'interface inclinée se produisant au fur et à mesure que la vitesse de soudage augmente
72. Sections transversales provenant de la zone de formation de la soudure et montrant que "l'écrasement" se produit avant la formation de liquide à des vitesses de soudage basses et élevées
73. Comparaison de la formation de pépites avec du courant continu et alternatif dans le soudage en continu par écrasement
74. Soudure initiale formée après un cycle avec de l'acier doux, 2 cycles avec des revêtements de Pb (Sn) et 3 cycles avec de l'acier au zinc galvanisé à chaud
75. Sections longitudinales montrant le diagramme de chaleur dans la zone de formation de la soudure à 2,6 et lOm/min pour de l'acier doux
76. Sections longitudinales montrant le diagramme de chaleur dans la zone de formation de la soudure à 2,6 et 10m/min pour de l'acier au zinc galvanisé électrolytiquement
77. Sections longitudinales montrant le diagramme de chaleur dans la zone de formation de la soudure à 2,6 et 10m/min pour de l'acier au zinc galvanisé à chaud
78. Quatre étapes du développement d'une soudure représentées par la résistance dynamique
79. Parcours de la résistance entre les électrodes de soudage 80. Flux de courant entre les électrodes de soudage • 81. Effet de la vitesse de soudage sur le flux de courant

XXIII
Schnellwiderstandsnahtschweißen der unbeschichteten und beschichteten Stähle
Zusammenfassung
Stahlblech mit einer Dicke von 0,5-1,5 mm für Einsatz zur Serienherstellung von Haushaltsgeräten, Zentralheizkörpern, Brennstoff tanks, Containern und Trommeln wird zur Zeit in den Industriebranchen widerstandsnahtgeschweißt. Schweißgeschwindigkeiten von 2-4 m/min sind typisch in vielen Anwendungszwecken. Aus dem Grunde sind die verschiedenen, die Schweißgeschwindigkeit begrenzenden Faktoren für viele Varianten des Nahtschweißverfahrens ermittelt worden, und man hat einen Vergleich zwischen dem herkömmlichen Breitnahtschweißen und den Schmalrollen- und Drahtschweißnahtmethoden unter Einsatz von entweder WS- oder GS-Sekundärstrom gezogen.
In dieser Bewertung sind verschiedene unbeschichtete und beschichtete Weichstähle eingesetzt worden. Die Ergebnisse deuten darauf hin, daß man Schweißgeschwindigkeiten bis zu 14-16 m/min mit dem Schmal- und Quetschnahtschweißen der unbeschichteten Stähle erzielen könnte. Mit zunehmender Schweißgeschwindigkeit ist der verfügbare Strombereich zwischen der Schweißnahtbildung und dem Schweißnahtspritzen reduziert worden, und deshalb wurde auch der vorhandene Bereich an hinreichendem Schweißen reduziert. Die maximal erreichbare Geschwindigkeit ist von den Schweißbedingungen, der Stahldicke und der Art des eingesetzten Schweißnahtverfahrens abhängig gewesen. Man konnte die Abnahme des vorhandenen Schweißumfanges dem verhältnismäßig früheren Einsetzen des Schweißnahtspritzens wegen zunehmender Schweißgeschwindigkeit zuschreiben. Allgemein hatte das ein zunehmendes Ausmaß an Linsenwachstum zur Oberfläche der Schweißnaht hin und der anschließenden Ausscheidung der Flüssigkeit durch die Blechoberfläche zur Folge. Linsenwachstum in der Dickerichtung ist durch den größeren Anteil des Schweißstromes gefördert worden, der zur Ausgangsseite des Kontaktbogens zwischen den Schweißelektroden und dem zu schweißenden Stahlblech fließt. Aus diesem Grunde wird der Schweißstrom über einem kürzeren Abstand konzentriert, und das hat auch eine Abnahme des Wärmeentzugausmasses durch die Elektroden zur Folge. Faktoren, die den Stromfluß zur Ausgangsseite des Kontaktbogens zwischen den Elektroden gefördert haben, sind eine größere Stahldicke, das Vorliegen von Überzügen mit einem niedrigen Widerstand und größere Schweißgeschwindigkeiten. Das Schweißnahtlinsenwachstum in der Dickerichtung und das frühere Einsetzen des Schweißnahtspritzens sind auch durch niedrige Elektrodenkraftniveaus und durch den Einsatz von Stählen mit einem hohen, spezifischen Widerstand gefördert worden. Hinsichtlich der Schweißanordnung hat Breitnahtschweißen allgemein niedrigere, maximale Schweißgeschwindigkeiten, d.h., 6-8 m/min im Vergleich zu 14-16 m/min,
XXIV-
als entweder das . Schmal- oder Quetschnahtschweißen zur Folge gehabt. Man hat das der größeren, in diesem Verfahren erzeugten Menge an Flüssiglinsen zugeschrieben und ebenfalls der anschließenden Schwierigkeit, die erforderliche Erstarrung zu erzielen, bevor die Linsen den Kontaktbogen zwischen den Elektroden verlassen. Der Einfluß eines GS-Schweißstromes im Vergleich zu einem WS-Strom ist von den Faktoren abhängig gewesen, die die maximale Geschwindigkeit begrenzen, wenn ein WS-Schweißstrom eingesetzt wird. In Situationen, wo die Schweißgeschwindigkeit durch Schweißnahtspritzen begrenzt worden ist, hatte der Einsatz eines GS-Stromes allgemein eine geringe Abnahme der maximal erreichbaren Schweißgeschwindigkeit zur Folge. Man hat dies den höheren Oberflächentemperaturen wegen des GS-Stromes zugeschrieben, das das Ergebnis des NichtVorliegens eines Ni edrig-/NulIstrombereiches gewesen ist, der mit einer WS-Stromwellenform auftritt. In Situationen, wo die Schweißgeschwindigkeit durch Linsen-seigerung begrenzt worden ist, wenn ein WS-Strom eingesetzt wird, d.h. Quetschnahtschweißen, dann hat der Einsatz eines GS-Stromes eine Zunahme der maximal erreichbaren Schweißgeschwindigkeit von mindestens 30% zur Folge gehabt. Man hat bemerkt, daß das Vorliegen von unterschiedlich starken Ölniveaus auf der Oberfläche eine geringe Auswirkung auf die Schweißnahtbildung hat. Man konnte Schweißnähte mit minimalen Eindrücken für verschiedene Schweißströme und -geschwindigkeiten produzieren, und leichtes Ausbauchen auf der Seite ohne Eindrücke ist durch einen höheren Schweißstrom erzielt worden. Bei Schweißgeschwindigkeiten über 6 m/min ist der Welleneffekt auf der Schweißnahtoberfläche der begrenzende Faktor gewesen, und das liegt an dem oszillierenden Wesen des WS-Stromes. Im Falle von beschichteten Stählen lagen die maximalen Schweißgeschwindigkeiten unter denen, die man mit unbeschichteten Weichstählen während des Schmalnaht- und DrahtSchweißens, d.h., 8-12 m/min im Vergleich zu 14-16 m/min, erzielen konnte. Beschichtete Stähle haben engere Schweißbereiche aufgewiesen, und das hat an dem höheren, erforderlichen Strom für die Schweißnahtbildung und dem verhältnismäßig früheren Einsetzen des Schweiß-nahtspritzens gelegen. Dies ist der Effekt wegen des zusätzlichen Stromnebenschließens gewesen, das im Bereich des gebundenen Überzugs an der Peripherie der Nahtlinse eingetreten ist, d.h. durch den größeren Stromfluß zur Ausgangsseite des Kontaktbogens zwischen den Elektroden und durch die resultierenden hohen Oberflächentemperaturen. Schweißnahtrißbildung ist ein anderer Faktor gewesen, der den Schweißumfang im Falle von beschichteten Stählen begrenzt hat, und deshalb können diese Stähle z.B. aufgrund ihrer Rißbildungsempfindlichkeit in den folgenden drei Gruppen eingestuft werden:

-XXV-
- Hohe Rißbildungsempfindlichkeit - feuerverzinkte und elektro-plattierte Zinküberzüge
- Mittlere Rißbildungsempfindlichkeit - Eisen-Zinklegierung, Zink-5%. Aluminium- und Blei-Zinnüberzüge
- Niedrige Rißbildungsempfindlichkeit - 55% Aluminium- und Aluminiumüberzüge
Rißbildung ist das Ergebnis von intergranularer Durchdringung der flüssigen Kupfer-, Messing- und Bronzephasen gewesen, die auf der Schweißnahtoberfläche wegen Legierung zwischen dem Überzug und der Kupferelektrode gebildet wurden. Der Einsatz von Unterbrechungsstromprogrammen und relativ niedrigen Schweißgeschwindigkeiten hat den Wärmeentzug von der Schweißnahtoberfläche verbessert und das Problem der Schweißnahtrißbildung reduziert oder ausgeschaltet. Man hat den Schweißstrom, die Elektrodenkraft und -bewegung sowie den dynamischen Widerstand während des Schweißens überwacht. Im Falle vom Rollenpunktnahtschweißen haben die Parameter Reaktionen aufgewiesen, die denen ähnlich sind, die man während des Punktschweißens beobachtet hat, und im Falle von GS-Strom haben die Parameter während der ersten Schweißnahtbildung geschwankt, und dann einen Dauerzustand erreicht, der allgemein an der restlichen Naht beibehalten werden konnte. Das Schema der Elektrodenkraft ist während des Schweißens hauptsächlich eine Funktion der Maschinen- und Schweißstromeigenschaften gewesen. Jede Druckkraft, die zur Trennung der Elektrodenscheiben neigt, hat eine Zunahme der in jeder Maschine aufgezeichneten Kraft zur Folge, in der der Schweißkopf nicht schnell genug auf die Ausdehnungskräfte reagieren kann. Man hat den für die Elektrodenkopfbewegung aufgezeichneten Dauerzustand im Sinne der grundlegenden Steifheit des Schweißkopfes erklärt, der Oszillation bei 100 Hz und auch das ziemlich konstante Flüssigkeitsvolumen verhindert, das unter den Elektrodenscheiben gebildet wird, nachdem der Dauerzustand erreicht worden ist. Das Dauerzustandsniveau des dynamischen Widerstands wird von den Schweiß- und Werkstoffparametern, dem Schweißverfahren sowie dem Ausmaß an Schweißnahtbildung beeinflußt, und Letzteres deutet darauf hin, daß der Einsatz des dynamischen Widerstandes als eine Grundlage zur Überwachung der Schweißnahtgüte vielleicht möglich ist. Man hat ein grundlegendes Modell der Schweißnahtbildung entwickelt, mit dem man zeigen konnte, daß die Schweißnahtzunahme von der Widerstandsverteilung in der Schweißzone und der entsprechenden Schwankung der Stromdichte in dieser Zone bestimmt wird.

XXVI
Anhand des vorgeschlagenen Modells hat man gefolgert, daß die Faktoren, die eine Zunahme der erreichbaren Geschwindigkeit ermöglichen, wie folgt sind: 1. Einsatz von höheren Elektrodenkraftniveaus und/oder Einsatz
von Elektroden mit einem größeren Durchmesser 2. Bessere Kühlung der Schweißnahtoberfläche durch leistungs
fähigere Wasserkühlung und/oder durch Elektrodenvergrößerungssysteme
3. Einsatz eines zweistufigen Verfahrens, d.h. eine Schweißnaht bei niedriger Wärme zur Einleitung von Bindung, gefolgt von größerer Wärme zur Sicherstellung einer akzeptierbaren Schweißnahtgute
4. In Situationen, wo die Schweißgeschwindigkeit durch Linsen-seigerung begrenzt wird, kann ein GS-Strom oder WS-Schweißstrom bei höheren Frequenzen vorteilhaft sein.
In diesem Zusammenhang sollte darauf hingewiesen werden, daß die maximale Schweißgeschwindigkeit in vielen Fällen durch Reduzierung der Schweißnahtbreite auf die minimale Breite erhöht werden könnte, die mit den, an das Endprodukt gestellten Anforderungen kompatibel ist.

-XXVII
Inhaltsverzeichnis Seite 1. Einleitung 1 2. Umfang der Untersuchung 1 2.1 Grundlegende Prinzipien des Nahtschweißens 1 2.2 Ziele der Untersuchung 2 3. Experimentelles Verfahren 3 3.1 Untersuchte Werkstoffe 3 3.2 Schweißgeräte 4 3.3 Schweißverfahren 4 3.4 Bewertung der Schweißgüte 5 3.5 Instrumentierung 5 3.5.1 Sekundärstrom 5 3.5.2 Dynamischer Widerstand 6 3.5.3 Messung der Elektrodenkraft 7 3.5.4 Verschiebung/Kopfbewegung 7 3.5.5 Ausschaltung der Störsignale 7 3.5.6 Datenspeicherung und -Wiedergewinnung 8 4. Schweißbarkeit der unbeachichteten Weichstähle 8
Einfluß der Stahlgüte 9 Einfluß der Blechstärke 9 Effekt der Blechstärke auf das Schweißbarkeitsdiagramm 9 Effekt der Dicketoleranz 10 Effekt des Oberflächenöls 11 Einfluß des spezifischen Massenwiderstands 11 Einfluß der Stromwellenform 12 Effekt der Unterbrechungsstromprogramme 13 GS-Schweißstrom 13 Effekt der Elektrodenkraft 14 Effekt der Schweißanordnung 15 Rollenpunktschweißen 16 Schweißen mit geringen Eindrücken 17 Schweißbarkeit der beschichteten Stähle 17 Schmalnahtschweißen 18 Blei-Zinnbeschichtete Stähle 18 Aluminiumbeschichtete Stähle 18 Zinkbeschichtete Stähle 18 'Soudronic' Drahtschweißen 19 Kontinuierliches Schweißen 19 Unterbrechnungsstromprogramme 20 Metallographische Untersuchung der Schweißnähte 21 Den Schweißumfang begrenzende Faktoren 2 2 Rißbildung in Schmalschweißnähten 2 3 Rißbildungsvorkommen 2 3 Mechanismus der Rißbildung 24
4.1 4.1.1 4.1.1 4.1.1 4.1.2 4.1.3 4.2 4.2.1 4.2.2 4.3 4.4 4.5 4.6 5. 5.1 5.1.1 5.1.2 5.1.3 5.2 5.2.1 5.2.2 5.2.3 5.2.4 5.3 5.3.1 5.3.2

XXVIII
Seite
6. Überwachung des NahtSchweißverfahrens 2 5
6.1 Schweißstrom 26 6.2 Spannung zwischen den Schweißelektroden 26 6.3 Elektrodenkraft 26 6.4 Elektrodenverschiebung 27 6.5 Dynamischer Widerstand 27 6.5.1 Einfluß der Schweißstromprogramme 28 6.5.2 Die erste Hauptbelastung beeinflußende Faktoren 28 6.5.3 Den Dauerzustand beeinflußende Faktoren 29
7. Metallographisehe Untersuchung der Schweißnahtbildung 30
7.1 Unbeschichtete Stähle 30 7.1.1 Schweißlinsengefüge 30 7.1.2 Schweißstartposition 31 7.1.3 Verteilung des Stromes in der Schweißnahtzone 3 3 7.1.4 Einfluß der Schweiß-/Werkstoffparameter 34 7.1.4.1 Sehmalschweißnähte 34 7.1.4.2 BreitSchweißnähte 34 7.1.4.3 Quetschschweißnähte 3 5 7.2 Beschichtete Stähle 36
8. Allgemeines Modell der Schweißnahtbildung 36
8.1 Unbeschichtete Weichstähle 36 8.1.1 Stadien der Schweißnahtbildung 37 8.1.2 Stromverteilung in der Schweißnahtzone 38 8.1.3 Den vorhandenen Schweißumfang beeinflußende
Faktoren 39 8.2 Beschichtete Stähle 40 8.3 Richtlinien für eine erhöhte Schweiß
geschwindigkeit 41
9. Schlußfolgerungen 42
10. Literaturverzeichnis 45
Tabellen 47
Abbildungen 70

-xixx-
Aufstellung der Tabellen 1. Chemische Analyse der in der Untersuchung eingesetzten Weich
stähle 2. Chemische Analyse der untersuchten, hochfesten Stähle 3. Chemische Analyse der untersuchten Grundstoffstähle und der
Überzüge der beschichteten Stähle 4. Vergleich der maximalen Schweißgeschwindigkeiten für die
WS- und GS-Stromversorgung mit Schmal-, Breit- und Quetschnah t schweiß en
5. Vergleich des minimalen Strombedarfs für die WS- und GS-Stromversorgung mit Schmal-, Breit- und Quetschnahtschweißen
6. Vergleich des verfügbaren Schweißstromumfanges für die WS-und GS-Stromversorgung mit Schmal-, Breit- und Quetschnahtschweißen
7. Effekt der Stahlvariablen - metallographische Untersuchung 8. Für die eingesetzten Stahltypen festgelegte spezifische
Widerstandswerte 9. Effekt der erhöhten Elektrodenkraft auf die maximale Schweiß
geschwindigkeit für den 1,2/1,4 mm dicken Stahl 10. Vergleich der maximalen Schweißgeschwindigkeiten für ver
schieden zusammengesetzte und dicke Stähle - Schmalnaht-/ kontinuierlicher WS-Strom
11. Minimaler und maximaler Schweißstrom für 1,2/1,4 mm dicke Weich- und hochfeste Stähle
12. Effekt der Elektrodenkraft auf die maximal erreichbaren Schweißgeschwindigkeiten
13. Maximale Schweißgeschwindigkeiten für unbeschichtete und beschichtete Stähle
14. Vergleich des minimalen WS-Strombedarfs für Weich- und beschichtete Stähle
15. Vergleich des WS-Schweißstromes mit Zunahme von Spritzern/ Poren im Weich- und beschichteten Stahl
16. Abnahme des Schweißstromes für kontinuierliche Knopfbildung unter Einsatz von GS- anstatt von WS-Strom
17. Allgemeine Ergebnisse der 'Soudronic' Schweißversuche 18. Vergleich des vorhandenen Schweißumfanges, Schmalnaht- gegen
Drahtschweißen 19. Vergleich des minimalen Stroms für kontinuierliche Schweiß
nah tbildungen, Schmalnaht- gegen Drahtschweißen 20. Effekt der Elektrodenkraft auf den Widerstand bei minimalen
und maximalen Schweißbedingungen bei 6 m/min 21. Dynamisches Widerstandsniveau beim minimalen und maximalen
Schweißstrom für 1,2/1,4 mm dicke Stähle mit unterschiedlichem, spezifischem Widerstand
22. Vergleich des Widerstandsniveaus für WS- gegen GS-Strom und Schmal- gegen Breitnahtschweißen bei einer Geschwindigkeit von 6 m/min

•XXXI
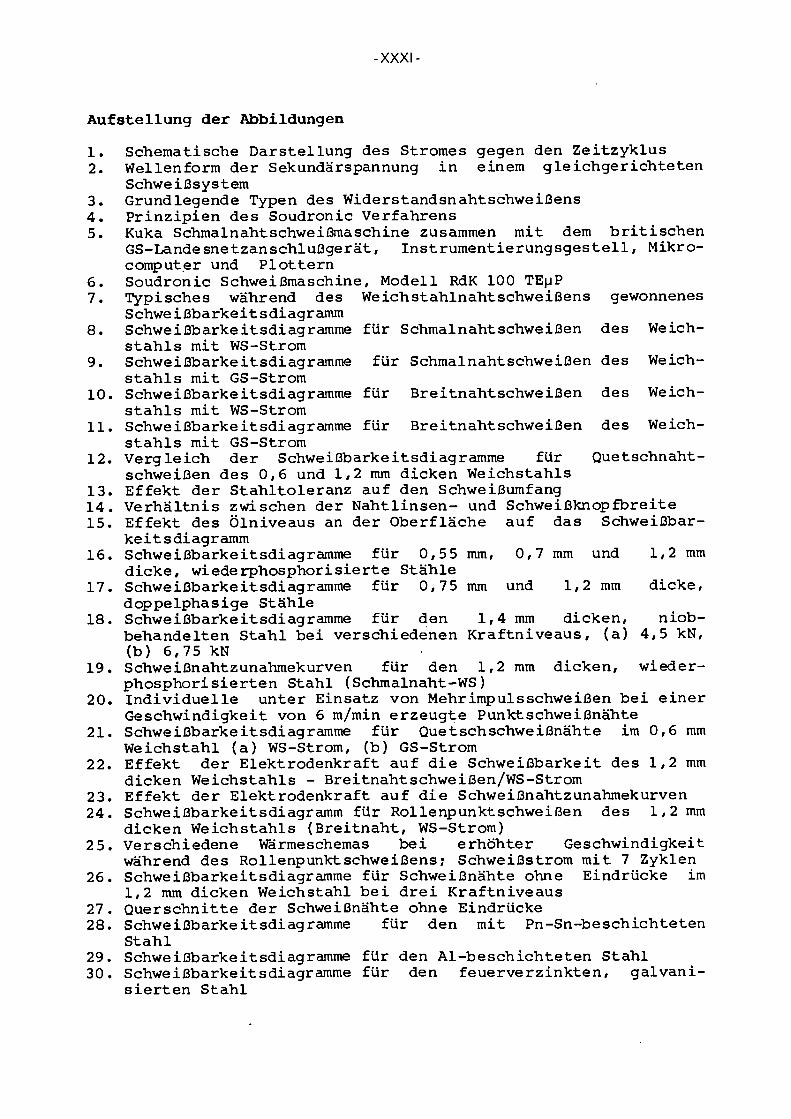
Aufstellung der Abbildungen 1. Schematische Darstellung des Stromes gegen den Zeitzyklus 2. Wellenform der Sekundärspannung in einem gleichgerichteten
Schweißsystem 3. Grundlegende Typen des Widerstandsnahtschweißens 4. Prinzipien des Soudronic Verfahrens 5. Kuka Schmalnahtschweißmaschine zusammen mit dem britischen
GS-Landesnetzanschlußgerät, Instrumentierungsgestell, Mikrocomputer und Plottern
6. Soudronic Schweißmaschine, Modell RdK 100 TEuP 7. Typisches während des Weichstahlnahtschweißens gewonnenes
Schweißbarkeitsdiagramm 8. Schweißbarkeitsdiagramme für Schmalnahtschweißen des Weich
stahls mit WS-Strom 9. Schweißbarkeitsdiagramme für Schmalnahtschweißen des Weich
stahls mit GS-Strom 10. Schweißbarkeitsdiagramme für Breitnahtschweißen des Weich
stahls mit WS-Strom 11. Schweißbarkeitsdiagramme für Breitnahtschweißen des Weich
stahls mit GS-Strom 12. Vergleich der Schweißbarkeitsdiagramme für Quetschnaht
schweißen des 0,6 und 1,2 mm dicken Weichstahls 13. Effekt der Stahltoleranz auf den Schweißumfang 14. Verhältnis zwischen der Nahtlinsen- und Schweißknopfbreite 15. Effekt des Ölniveaus an der Oberfläche auf das Schweißbar
keit s diagramm 16. Schweißbarkeitsdiagramme für 0,5 5 mm, 0,7 mm und 1,2 mm
dicke, wiederphosphorisierte Stähle 17. Schweißbarkeitsdiagramme für 0,75 mm und 1,2 mm dicke,
doppelphasige Stähle 18. Schweißbarkeitsdiagramme für den 1,4 mm dicken, niob-
behandelten Stahl bei verschiedenen Kraftniveaus, (a) 4,5 kN, (b) 6,75 kN
19. Schweißnahtzunahmekurven für den 1,2 mm dicken, wieder-phosphorisierten Stahl (Schmalnaht-WS)
20. Individuelle unter Einsatz von Mehrimpulsschweißen bei einer Geschwindigkeit von 6 m/min erzeugte PunktSchweißnähte
21. Schweißbarkeitsdiagramme für QuetschSchweißnähte im 0,6 mm Weichstahl (a) WS-Strom, (b) GS-Strom
22. Effekt der Elektrodenkraft auf die Schweißbarkeit des 1,2 mm dicken Weichstahls - Breitnahtschweißen/WS-Strom
23. Effekt der Elektrodenkraft auf die Schweißnahtzunahmekurven 24. Schweißbarkeitsdiagramm für Rollenpunktschweißen des 1,2 mm
dicken Weichstahls (Breitnaht, WS-Strom) 25. Verschiedene Wärmeschemas bei erhöhter Geschwindigkeit
während des Rollenpunktschweißens; Schweißstrom mit 7 Zyklen 26. Schweißbarkeitsdiagramme für Schweißnähte ohne Eindrücke im
1,2 mm dicken Weichstahl bei drei Kraftniveaus 27. Querschnitte der Schweißnähte ohne Eindrücke 28. Schweißbarkeitsdiagramme für den mit Pn-Sn-beschichteten
Stahl 29. Schweißbarkeitsdiagramme für den Al-beschichteten Stahl 30. Schweißbarkeitsdiagramme für den feuerverzinkten, galvani
sierten Stahl
-XXXII
31. Schweißbarkeitsdiagramme für den elektroplattierten Zinkstahl 32. Schweißbarkeitsdiagramme für den Eisen-Zinkstahl 33. Schweißbarkeitsdiagramme für den Zn 5%. Al Stahl 34. Schweißbarkeitsdiagramme für den Zn 5 5%. Al Stahl 3 5. Abgeblätterte Oberfläche der NiedrigtemperaturSchweißnaht im
galvanisierten Stahl, gezeigt wird der Bruch durch das Zink an der Schweißkante
36. Auf Abblätterung geprüfte Probe im elektroplattierten Zink, gezeigt werden die Risse an der Kante des Schweißknopfes
37. Schweißbarkeitsdiagramm für den 0,75 mm dicken Blei-Zinnbeschichteten Stahl - Soudronic Schweißen
38. Schweißbarkeitsdiagramm für den 0,88. Eisen-Zink und 0,85. feuerverzinkten, galvanisierten Stahl - Soudronic Schweißen
39. Beispiele der verschiedenen Erstarrungsgefüge in verschieden beschichteten Stählen - Drahtschweißen
40. Beispiel, wo eine Bindung zwischen dem Elektrodendraht und der Blechstahloberfläche bei hoher Wärmeeingabe gebildet wurde
41. Beispiele der Messingdurchdringung in der feuerverzinkten Schweißnaht
42. Feuerverzinkung - Elektronsondenbilder zeigen, daß das inter-granulare Netz aus Cu und Zn besteht
43. Schematische Darstellung der die Korngrenzenbenetzung beeinflußenden Faktoren
44. Strom- und Spannungsspuren für Weichstahl, Doppelström-/ Geschwindigkeitsprogramme, maximale Strombedingungen
45. Effekt des WS- und GS-Stromes auf die Elektrodenkraft 46. Effekt des Strompulsierens auf die Elektrodenbewegung 47. Dynamische Widerstands-, Elektrodenkraft- und -bewegungs-
spuren für Rollenpunktschweißen bei 2 m/min 48. Dynamische Widerstands-, Elektrodenkraft-
spuren für Rollenpunktschweißen bei 6 m/min 49. Dynamische Widerstands-, Elektrodenkraft-
spuren für Rollenpunktschweißen bei 10 m/min 50. Dynamische Widerstandskurven für ein Unterbrechungsstrom-
programm der 3 Zyklen an/2 Zyklen aus, gezeigt wird der Effekt der Schweißgeschwindigkeit und des Schweißstromes
51. Dynamischer Widerstand für WS- und GS-Schweißnähte im 1,2 mm dicken Weichstahl (6 m/min)
52. Dynamische Widerstands- und Stromspuren am Anfang der Schweißnaht des 0,6 und 1,2 mm dicken Weichstahls
53. Effekt des zunehmenden Schweißstromes auf das dynamische Widerstandsniveau im Dauerzustand für verschiedene Stähle (2 m/min)
54. Effekt der Stahlzusammensetzung und Geschwindigkeit auf den dynamischen Widerstand bei einem minimalen und maximalen Strom für 0,7/0,75 mm dicke Stähle
55. Typisches durch das Ätzmittel aus alkoholischer Salpetersäure gezeigtes Schweißnahtgefüge
56. Effekt der Stromwellenform auf die Schweißnahtlinsenbildung 57. Effekt der Lichtblende und des Fokusses auf die gezeigten
Schweißnahtbänder 58. Effekt des Einsatzes eines Stromprogrammes mit 2 Zyklen an/l
Zyklus aus auf die Bandbildung 59. Produktion der Bänder in Punkt Schweißnähten
und -bewegungs-und -bewegungs-

XXXII
60. Einfluß der Geschwindigkeit auf die Linsenform 61. Linsenbildung von 2 bis zu 4 'Zyklen des Schweißstroms 62. Veränderungen der Schweißzone während der ersten paar Zyklen
des Schweißstromes 63. Vergleich der Wärmeschemas mit einem Zyklus des Schweiß
stromes zwischen dem 1,2 und 0,6 mm dicken Weichstahl 64. Wärmeschema unter den Elektroden bei Schweißgeschwindigkeiten
von 2, 6 und 10 m/min 65. Effekt des Schweißstromes auf die Linsenform 66. Effekt der Schweißgeschwindigkeit auf die Linsenform 67. Effekt der Elektrodenkraft auf die Linsenform 68. Effekt des spezifischen Widerstandes auf die Linsenform 69. Effekt des WS- und GS-Stromes auf die Linsenform 70. Während des GS-Schweißens beobachteter "Hochtemperaturtunnel"
Effekt 71. Drehung der Schweißnahtlinse von der horizontalen zur einer
Lage entlang der geneigten Grenzfläche ist während der höheren Schweißgeschwindigkeit eingetreten
72. Aus dem Bereich der Schweißnahtbildung genommene Querprofile, gezeigt wird, daß das "Herunterquetschen" vor Bildung irgendeiner Flüssigkeit bei niedrigen und hohen Schweißgeschwindigkeiten eintritt
73. Vergleich der Linsenbildung mit WS- und GS-Strom während des Quetschnahtschweißens
74. Erste Schweißung, nach 1 Zyklus mit Weichstahl, 2 Zyklen mit Pb (Sn) Überzügen und 3 Zyklen mit feuerverzinktem, beschichteten Stahl gebildet
75. Längsprofile, gezeigt werden die Wärmeschemas im Bereich der Schweißnahtbildung bei 2, 6 und 10 m/min für Weichstahl
76. Längsprofile, gezeigt werden die Wärmeschemas im Bereich der Schweißnahtbildung bei 2, 6 und 10 m/min für elektro-plattierten, mit Zink beschichteten Stahl
77. Längsprofile, gezeigt werden die Wärmeschemas im Bereich der Schweißnahtbildung bei 2, 6 und 10 m/min für feuerverzinkten, beschichteten Stahl
78. Vier Stadien,durch den dynamischen Widerstand angezeigten Schweißnahtentwicklung
79. Widerstandsbahnen zwischen den Schweißelektroden 80. Stromfluß zwischen den Schweißelektroden 81. Effekt der Schweißgeschwindigkeit auf den Stromfluß

1 -
HIGH SPEED RESISTANCE SEAM WELDING OF UNCOATED AND COATED STEELS
British Steel Corporation
ECSC Agreement No. 7210.KA/809
Final Technical Report
1. INTRODUCTION
Sheet steel in the thickness range 0.5-1.5mm is currently resistance seam welded in mass production industries for domestic appliances, central heating radiators, vehicle parts and container/drum manufacture. While welding speeds of up to 10m/min are feasible in some of these applications, welding speeds of 2-4m/min are typical in industry. These limitations on welding speed can frequently be attributed to a lack of a basic understanding of the seam welding process.
Very little basic work has been carried out in this area and a greater understanding of the principles involved and, how the various factors influence weldability, could result in higher production rates with a lower incidence of poor or unsatisfactory weld quality. Such a development would assist greatly in maintaining the competitiveness of steel products in such applications.
In addition, quality requirements for seam welded components are becoming more stringent, for example, the need exists in many instances to produce welds of a good aesthetic appearance, i.e. non-marking or free from indentation on the exposed side of the joint. A requirement for fluid and/or pressure tightness can also impose limitations, particularly if high speed welding is used. Also, in many instances the buildup (i.e. total thickness) at the weld is frequently specified within tight tolerances which again causes difficulties in operating at high welding speeds. While considerable work*1-2) has been carried out to understand the factors limiting the attainment of high welding speeds, i.e. >30m/min in the field of canmaking using tinplate, very little attention has been given to high speed seam welding of thicker materials, i.e. greater than 0.5mm.
A programme of work was therefore undertaken to determine the various factors which control welding speed in the many variants of the seam welding process.
2. SCOPE OF INVESTIGATION
2.1. Basic Principles of Seam Welding
A seam weld corresponds to a series of overlapping spot welds. The main difference between seam welding and spot welding is that in the former process, current shunting occurs at all times and the weld is made continuously at speed.
The important operating parameters in resistance welding and their influence particularly in seam welding are:-
i) Welding current - the major factor governing the amount of heat generated during welding.
ii) Welding time - the overall weld time governs the relative balance between the time available to make and to consolidate the weld.
iii) Electrode force - controls the contact resistance between the welding electrodes and also assists to confine the molten weld nugget in the appropriate area. Too high an electrode force will cause the molten weld nugget to be splashed out at the weld interface. A similar effect is caused by too low an electrode force.
Conventional seam welding is carried out using a welding current supplied at 50Hz either in an interrupted or continuous manner. The latter is used if high welding speeds are to be achieved.

In continuous seam welding, using an alternating current type of waveform, a weld nugget is formed corresponding to each half cycle of the waveform. For example at 50Hz, there are 6,000 half cycles per minute and the maximum number of weld nuggets which can be produced within this time.when using a 50Hz welding current, is equal to this number. The extent to which overlapping weld nuggets and a leak proof seam can be formed under these conditions depends on both the welding current and the welding speed.
The maximum possible weld nugget length is governed by the number of half cycles in the current waveform and , the distance which the workpiece travels during each half cycle. Maximum pulse length Wixmai) can be calculated from the equation:
WL(max) = 1000 S (D 120 f
where S = welding speed m/min f = frequency Hz
However, a limiting speed is reached at each frequency level due to the inability to supply sufficient energy into the weld zone without burning the sheet or giving rise to excessive surface or interfacial splash.
Contact resistance is considered^3) to be an important factor in seam welding particularly:
1) At the start of each seam 2) In seam welding with interrupted current schedules 3) As the welding speed is increased to high values
The resistance at the faying surfaces is made up of two components, firstly, a constriction resistance due to concentration of the current at the points of contact and secondly, the contact resistance arising from the presence of surface films.
In practical situations, it has been observed that in some instances surface cleanliness can have a pronounced effect on the quality of the weld seam. This effect has been attributed^4) to the presence of surface films which influences the steel/steel contact resistance and the electrode/steel resistance. It is quite possible that during the welding operation, the electrode/steel resistance may be changed due to a progressive chemical reaction between the surface film and the electrode material. Differences in the surface topography of the steel sheet may also affect the contact resistance and therefore influence weld formation.
In high speed seam welding, it has been shownd) that the resistivity of the steel being welded can also influence the current level at which splash occurs. For example, increasing the carbon content of a steel and thereby the resistivity resulted in a narrowing of the weldability range. Similarly, narrow weldability ranges have been observed in the high speed mash seam welding of high strength low alloy steels.
It is quite possible that the surface and internal characteristics of the steel influence the total dynamic resistance between the welding electrodes. It is considered therefore, that a knowledge of the dynamic resistance, i.e. the change in resistance during welding, is necessary to gain an understanding of weld formation. While a number of investigations have been carried out to determine the dynamic resistance during spot welding, little is known regarding the dynamic resistance behaviour during seam welding.
A number of investigations ü.2> have been carried out on the high speed seam welding of tinplate and an understanding has been gained regarding the mechanism of weld formation in this situation. However, although some basic work*3"5) has been carried out on the mechanism of weld formation in thicker steels, i..e. 0.5 to 1.5mm, no general model of weld formation is available.
2.2. Objectives of Investigation
The basic objectives of the work programme undertaken may be sumarised as follows:-

- 3
(i) Determination of the factors which influence weld formation at high welding speeds for both uncoated (both unalloyed and high strength) and coated steels.
(li) Determination of the influence of material tolerances, i.e. analysis, thickness and surface condition on the ability to make acceptable welds at welding speeds up to 20m/min.
(iii) Comparison of the effectiveness of welding at high speed using the various variants of seam welding, i.e mash, wide,narrow seam and roller spot welding.
(iv) To determine the feasibility of producing non marking seam welds at high speeds.
(v) Investigation of the feasibility of high speed seam welding of coated steels, such as hot dip and electrolytic zinc, iron-zinc alloy, zinc-5% aluminium, zinc 55% aluminium, terne, and aluminium coatings.
Anumber of variants of the seam welding process were investigated which included:-
(a) Conventional single phase AC - Fig. 1. (b) Secondary rectified DC - Fig.2. (c) Wide and narrow seam welding techniques (d) Mash welding \. Fig. 3 (e) Wire welding
The majority of welding machines are single phase AC machines in which a welding current is supplied as a simple 50Hz sine wave. Recent developments in rectifier technology have led to a more widespread interest in DC machines. These machines are in fact rectified AC machines where the 3-phase primary supply is rectified into six uni-directional half phases, i.e. hexa-phase systems. The power requirement is therefore balanced over the three primary phases and this, together with the minimisation of inductive losses, makes the process more energy efficient than single-phase AC machines.
In wide seam welding, the electrode tread width is normally flat and set to 5Vt where t is the single sheet thickness in mm. "Mash welding", used in high speed seam welding of containers or coil joining applications, involves the use of a narrow overlap which is forged together under a high electrode force. This technique is used to reduce the amount of build up at the joint. In narrow seam welding, domed electrodes are used of thicknesses 8-10mm with a tip radius of 5-6mm resulting in a weld width of approximately 2-3Vt.
To enable a meaningful comparison of the different welding techniques , narrow, wide and mash seam welding, with both AC and DC current supplies were carried out on the same machine. By this means, it was possible to eliminate any variations in the response of the mechanical systems or electrode head assemblies which would be encountered if different machines were used.
Seam welding of coated steels presents problems of the coating being picked-up by the electrode. This pick-up results in a variable resistance between the electrode and the component to be welded thereby giving rise to a variable heating effect and inconsistent weld quality. The problem of electrode pick-up has been approached in different ways, e.g. "narrow seam" welding and "wire welding". In "narrow seam" welding an electrode wheel with a radiused profile is friction driven by a roller thereby breaking down any pick-up and maintaining a constant electrode/component resistance. In "wire welding" electrode pick-up is overcome by constantly presenting an uncontaminated electrode to the work piece. This is achieved by the use of a copper wire fed between the electrode and the work piece, Fig.4.
3. EXPERIMENTAL PROCEDURE
3.1. Materials Examined
A range of materials were investigated as follows:-
(a) Mild Steel - narrow, wide and mash seam welding trials were carried out on a range of mild steels of thicknesses between 0.60mm to 1.2mm. Details of these are given in Table 1.

- 4 -
(b) High Strength Steels. - three high strength steels were included in the studies, each steel being chosen to give pronounced differences in their resistivity. These steels may be summarised as follows:-
Rephosphorised: 0.55mm, 0.7mm and 1.2mm Niobium treated: 1.4mm Titanium treated: 1.2mm Dual-phase: 0.75mm and 1.2mm
Details of their chemical analyses are given in Table 2.
(c) Coated Steels - Various coated steels were examined as follows:
Hot dipped galvanised steel Electro-zinc Iron-zinc alloy Zinc - 5% aluminium Zinc - 55% aluminium Aluminium Lead-tin Details of these steels are given in Table 3.
3.2. Welding Equipment
Narrow, wide and mash seam welding operations were carried out on a KUKA narrow seam welding machine, type EWNR/K50/M150/6, of nominal rating 150 kVA, Fig.5. Modified side drive rollers were used to accommodate wide and mash seam welding electrodes.
-DC current welding was carried out on the same machine using a British Federal secondary rectified DC welding power unit transformer, type 310 HDC, connected to the machine in place of the conventional single phase AC welding current transformer.
Welding electrodes manufactured from a class A2/1 - IS05182 material (1% Cr/Cu) were used for welding the mild and high strength steels whereas, class A 2/2 - ISO 5182 electrodes (1% Cr/0.1% Zr/Cu) were used for welding the various coated steels. The electrodes were approximately 300mm diameter in all cases and were water cooled at a flow rate of 19 L/min
An Avil Presstotest oil filled load cell was used to set the initial electrode force prior to welding. Welding speed was set using the dial control on the welding machine and checked with a commercial tachometer.
The coated steels were welded using narrow seam and wire welding techniques. The latter employs an intermediate copper wire between the electrode wheel and sheet surface to maintain a constant electrode/sheet resistance, Fig.4. Any coating pick-up is continuously removed on the copper wire and the weld is effectively made by "clean" electrodes at all times. The trials were carried out on a High Performance Fully Automatic Contour Seam Welding Machine, Model Rdk 100, TEuP, Fig.6, made available by Soudronic AG at Dietikon, Switzerland. This machine had a nominal rating of lOOkV at 50%. duty cycle and was designed for the tight seam welding of coated steel fuel tanks. The position of the weld was controlled by using a toothed template, whose profile corresponded to the weld contour, and which was driven by means of a servo motor with reduction gear. The toothed template was pivoted about its centroid and the pivot point mounted on a pantograph arm. The pantograph arm was controlled by a screw shaft which was driven by a variable speed motor such that as the toothed template rotated, the welding wheels were always tangential to the desired weld line.
The Soudronic tri-elliptic wire welding system was used and during this process, a round copper wire was rolled to the required profile by means of two profiling units fitted to the welding machine and guided to the correspondingly profiled welding electrodes.
3.3. Welding Procedure
After setting the electrode force and welding speed, the welding current was progressively increased by means of phase shift control to determine the onset of weld formation and thereafter increased in regular
5 -
steps until weld splash occurred. This procedure was repeated at the selected welding speed until there was no obvious range between weld formation and weld splash. The maximum speed used during the trials was 22m/min.
3.4. Assessment of Weld Quality
Weldability lobes were constructed, the limits of which were defined as follows:-
(a) A lower limit corresponding to a stuck weld condition (b) Intermediate limits, which varied according to the steel and welding conditions, including:-
(i) The formation of a continuous weld (ii) The formation of a 4Vt weld (iii) The onset of pronounced surface bulging or convexity (iv) Pronounced brassing on the surface of the weld { For coated (v) Cracking of the weld J steels only
(c) An upper limit corresponding to liquid metal expulsion, or in the case of wire welding, high surface temperature resulting in, or likely to result in, breaking of the intermediate copper electrode wire.
The lower limit or minimum welding condition was determined by manually peel testing the seam produced. A more accurate indication of weld quality was subsequently determined using an automated peel test carried out in an Instron tensile testing machine. A 25mm length of weld, removed from the weld seam at a position 250mm from the weld start point, was used for this purpose.
This test was also used to give an indication of the onset of a continuous weld, the 4Vt weld limit and to show the presence of cracks at the edge of the weld plug. The presence of cracks in welds made using the wire process was determined by examining the surface of the weld at a magnification of X10 to X30.
The remaining limits were assessed from a visual examination of the welds. In some instances detailed metallographic studies were carried out to confirm or quantify the presence of the above features.
3.5. Instrumentation
An essential part of the work was the development of suitable instrumentation to allow monitoring of the various welding parameters. Consequently, an instrumentation and computerisation package was developed which allowed continuous mesurement of the following parameters:-
1. Welding current 2. Dynamic resistance 3. Electrode force 4. Electrode displacement
3.5.1. Secondary Current
In resistance welding, current measurements may be made either on the primary or secondary side of the welding transformer. Measurements on the primary side, which gave an indication of the input to the machine, are useful for line maintenance purposes. Measurements made on the secondary side provide information regarding the actual input to the workpeices and are useful for monitoring the weld operation. The three most commonly used values of weld current are peak current, average current and RMS (root-mean-square) current. As illustrated in Fig.l, the peak current is the maximum current attained in any half cycle whereas, the average current is usually expressed for the positive cycles or after rectification. The RMS current is calculated using the equation.
/ ; i2dt Irms=V— (2)
t-t o
6 -
Since the value of root-mean-square current represents the heating value of current, it is the most useful value which gives an indication of the available heat for weld growth. A typical instrument generally used for such measurements in resistance welding is the British Federal DWM/2 meter which, measures RMS values of either primary or secondary weld current in the range 20-200.000A. A digital display of the current value is obtained and utilises a toroid located around a limb of the secondary welding circuit as a means of sensing the current field. In the current study, this technique was used to set-up the welding current prior to welding.
This procedure does not lend itself to continuous monitoring of the current and in the presen t investigation, it was necessary to consider the use of an alternative system. Various methods are available to obtain the desired current measurements, viz
a) A shunt placed in the secondary current path. b) A Hall effect transducer c) A toroid
The shunt method is the most accurate, however, it adds additional resistance to the circuit and dissipates a fairly large amount of heat because of the large currents used in resistance welding. Hall effect transducers give excellent results and are linear over a wide range of field strengths. However, they suffer from the disadvantage that they are sensitive to location and usually cannot be moved after installation. The toroidal coil offers a linear response and while position sensitive, can be located to minimise such an effect.
A toroid was therefore used in the present investigation which gave an output proportional to the rate of change of net current flowing through the toroid. However, the output from the toroid does not have the same waveform as the net current flowing through the welding machine secondary circuit. Because of the need to obtain a continuous true current recording, it was necessary to integrate the waveform from a cosine to a sine output. The weld current integrator, processed the toroid signal such that it gives an output of the same waveform as the net current flowing through the secondary circuit. This principle was used by the monitor to give an output which can be calibrated in ranges of 0-1 kA, 0-1 OkA and 0-100kA. In order that rapid secondary weld current and voltage signal waveforms could be recorded accurately, it was found necessary to use a different technique to that employed for recording the slower output signals such as force and displacement etc. For this purpose, a Datalab DL1200 waveform recorder was used, this being a flexible high precision instrument with recorded signal resolution of 12 bits (0.025%) by means of a high resolution analogue to digital convertor.
3.5.2. Dynamic Resistance
(a) Measurement with AC Current
Some of the most interesting and relevant information, which can best give an indication of weld growth, can be obtained from the dynamic resistance. This can be calculated by dividing the weld voltage by the current. However, since there will in most instances be a phase shift between the welding voltage and current waveforms, simply dividing these waveforms point by point will yield incorrect results. It has been claimed that accurate calculations can be obtained by dividing the maximum voltage in each half cycle by the maximum current in the corresponding half cycle. This yields one resistance point in each half cycle which should be sufficient to allow analysis of the welding process unless very short-time welds are being evaluated. However, the peaks can be difficult to locate and evaluate precisely especially when sampling discrete points of data. Because of this a curve fitting routine has been used by a number of investigators but this procedure will only yield accurate results for a purely resistive load, e.g. in a pure DC system. In the case of a single phase AC resistance welding machine, the loading is inductive thereby, giving a lag between the maxima of the voltage and current waveforms. There is a need therefore to sense the true voltage when the current is at a peak i.e. when the inductance is zero. Circuitry has been developed which allows such a measurement and at the same time calculation of the resistance. This device, while less versatile, is more precise than numerical sampling as used by other investigators. Using the former technique, the true or dynamic resistance of the secondary circuit of any resistance welding machine can be measured at the high current levels used in resistance welding and under inductive loading. The monitor required two inputs from the secondary circuit of the machine being

tested, firstly a toroid output representing the current flowing in the circuit and secondly, the voltage across the points to be measured.
The position of the voltage sensing leads obviously affects the final resistance value calculated. In the present investigation, the voltage pick-up leads were placed on the machine at the ends of the transformer leads. Thus, the resistance value measured represented a background resistance from the machine circuit with the dynamic resistance in the weld zone superimposed. While the dynamic resistance value obtained was not absolute, it reflects changes in resistance which occur in the weld zone.
(b) Measurement with DC Current
The same system was used for measurement of dynamic resistance when welding with a DC current. In resistance welding, a DC waveform is produced either by frequency conversion or by secondary rectification. The waveforms obtained using these systems are shown in Fig.2, from which it can be seen that the DC rectified system corresponds to a low cycle ripple DC waveform. Consequently, the system devised calculated the resistance at the peak of each ripple cycle in the same way as for a conventional AC signal.
3.5.3. Electrode Force Measurement
Electrode force was measured using a Kistler load cell washer of the quartz piezo-electric type, placed into the frame of the seam welding machine immediately below the bottom wheel assembly and mounted on a solid pedestal base. This ensured that all the electrode force was transmitted directly through the load cell.
By this means the load cell washer acted as a transducer, converting any applied force into an electrical charge. The latter was converted into a proportional voltage by means of a Kistler charge amplifier for display, recording or data processing. Once the charge amplifier was adapted to the particular load cell washer, it allowed operation with fixed scales graded in mechanical units per volt (1 volt = lkN etc.) with a maximum voltage output of 10V.
3.5.4. Displacement/Head Movement
The thermal expansion/contraction which occurs during resistance welding as a result of the heating or cooling process causes the electrode head to move during the welding process. This movement follows the welding process extremely accurately and can be used to give an insight into the mechanism of weld growth.
An amplifying circuit was developed for use with the resistive potentiometer which gave an accurate output of voltage which was proportional to the position of the potentiometer wiper.
The potentiometer installed was of the hybrid track rectilinear type with infinite resolution and a stable temperature coefficient. It was fitted to the machine such that all the head movement was applied to the transducer. This was achieved by fitting the transducer to the upper or moving head attached to the pneumatic air cylinder. A Penny and Giles type HLP190 transducer with a 50mm full scale movement was used in the present investigation.
The voltage output from the device was proportional to the distance moved by the potentiometer wiper and was of the order of + 10V DC for full scale at maximum gain control settings.
3.5.5. Elimination of "Noise" Signals
All the recording monitors and instrumentation required a mains voltage input of 240V AC 50Hz. It was found that mains interference was picked up on the instruments during the welding operation, particularly on the recording oscilloscope and the computer system. This interference was generated by the welding machine transformer and affected the instruments via mains power cables.
To eliminate most of this interference, it was necessary to use power supplies remote from the machine on a different main circuit. In addition, all earth connections were disconnected from the monitor power supplies thereby removing the possibility of earth loop interference.

The monitor input signals from the toroid to the resistance meter and current integrator could not be shared and both monitors were fitted with separate input signals. Screened co-axial cable of impedance 50Í2 of the uniradio type was used throughout while most of the monitor input/output sockets were of the BNC type 50. Some difficulty was experienced in interfacing the monitors to the measuring devices. The computer to monitor connections were made with a 3-way DIN plug fitment on the analogue to digital convertor and all earth loops were kept to a minimum as previously described. By this means very little radiated interference was picked up.
All the cable connections used were suitable for recording differential voltage signals in the range 0 to + 10 volts DC. Further screening was necessary in some instances and this was achieved by using screened twisted pairs of cable. In addition, all the monitoring devices were positioned carefully to minimise any interference from the electric/magnetic field set up during welding.
3.5.6. Storage and Recovery of Data.
A Commodore series 4000 computer was used to process the instrument outputs after they were modified in a 12 bit 8 channel A/D convertor. A Wantanabe type WX4671 flat bed X-Y intelligent plotter and a Gould X-Y plotter were used for producing hard copies of the data obtained.
4. WELDABILITY OF UNCOATED MILD STEEL Weldability lobes were determined for the variants of the seam welding process, i.e. narrow, wide and mash seam welding, using either AC or DC current waveforms and programmes. Mild steel in the thickness range 0.6mm to 1.2mm was used in the studies. The effect of electrode force and the presence of surface oils was also determined.
A measure of weldability was determined from weldability lobes produced under a range of welding conditions, Fig.7. The main purpose being to determine the maximum welding speeds which could be attained for each variant of the process and to highlight the factors which limit the ability to achieve higher speeds.
To enable comparison of the maximum welding speed, the minimum welding range between continuous weld formation and weld splash was set as 750A, i.e. at the maximum welding speeds quoted the available current range or lobe width, was 750A. The width of the weldability lobes was observed to be dependent on how the minimum and maximum current varied with welding speed. For example, in the case of the minimum welding current, i.e. the current to give a continuous weld, it was observed that:
1) The minimum current increased as the welding speed increased. 2) The amount of increase and the rate of rise in the minimum welding current increased as
the sheet thickness increased.
The trends in the maximum welding current were more difficult to define since this limit was obtained by a visual assessment of splash which to some extent is subjective. However, the following points were noted:-
1) An initial decrease in the current to give splash was observed as the welding speed was increased
2) The rate of increase in the splash limit was less than the rate of increase in the minimum current. Therefore, the width of the weldability decreased as the welding speed increased, this being due to the relatively earlier onset of weld splash.
Other trends noted were that the current required to give a stuck weld was generally 500-1000A below that necessary for continuous weld formation in the case of narrow seam welding and, 1000-2000A below for wide seam welding.
Excessive surface convexity, which is generally associated with a high heat input and is in many applications a limiting factor, was found to occur at 500-2000A below the splash limit when using an AC welding current.

- 9
4.1. Influence of Steel Quality
A number of factors*4* concerning steel characteristics have been considered to influence weldability. For example, steel cleanness has been cited in the past as being a major factor influencing weld quality. Modern steelmaking practices have led to a significant improvement in steel cleanness and very few problems are encountered in seam welding applications which can be related to this factor. However, it should be stated that poor weld quality can be obtained if severe lamination is present in the sheet.
Surface films such as rust, heavy oxide films and surface contaminants have also been cited as having an adverse effect on the ability to satisfactory seam weld a material. It is general practice therefore to avoid such films since they can result in variations in surface resistance and consequently, variable weld quality.
The purpose of the present investigation was to determine the factors which limit the attainment of high welding speeds. In this context, material parameters could play an important role. For example, factors which could influence either surface resistance or bulk resistivity must be considered. In addition, factors which influence the geometry between the welding electrodes, e.g. sheet thickness, can affect either, the overall resistance path between the welding electrodes and/or, the heat flow characteristics. Consequently, in the current investigation, the effects of the following on weldability were investigated:-
(a) (b) (c)
Sheet thickness Surface oils Steel resistivity
4.1.1. Influence of Sheet Thickness
Two aspects of sheet thickness were studied viz.
(a) Determination of weldability lobes for various sheet thicknesses in the range 0.6-1.2mm in order to evaluate the influence of sheet thickness on weld formation.
(b) Determination of the tolerance of a predetermined welding condition, specified for a particular sheet thickness, to permitted variations in thickness as specified in international standards.
The first of these objectives was investigated for different welding configurations combined with either an AC or DC welding current. Wide seam welding using an AC current only was used to study the second objective.
4.1.1.1. Effect of Sheet Thickness on the Weldability Lobe
The effect of large differences in steel thickness on weldability depended on the welding configuration and, whether AC or DC welding current was used. The results obtained are summarised in Figs. 8-11 and Tables 4,5 and 6, and show the influence of steel thickness on the maximum welding speed, the minimum current requirement and, the available welding ranges respectively.
These results were obtained using electrode force settings recommended in BS6265-1982.
(a) Narrow Seam - With this welding configuration and using an AC current, the maximum welding speed which could be achieved was lower for the 1.2mm steel compared to the 0.6, 0.75 and 0.95mm steels, see Fig.8. Using a DC current increased the maximum speed from 8m/min to 20m/min, when the sheet thickness was decreased from 0.75mm to 0.60mm, Fig.9.
With respect to the minimum current requirement, a slight increase in the necessary current for weld formation was observed as the sheet thickness increased. Weldability lobes obtained using either an AC or DC current, Figs. 8 and 9, show that, the minimum current for weld formation increased progressively as the welding speed increased, and the rate of change in current requirement increased as the steel thickness was increased.
The shape of the line defining the splash limits also changed with steel thickness. With an AC current, the splash limit exhibited a mimimum at a speed of 8m/min for steels in the

10
thickness range 0.60 to 0.95mm, whereas for a sheet thickness of 1.2mm, the speed at which a minimum occurred was 6m/min.. With DC current, the splash limit exhibited a minimum at 8m/min for 0.60mm thick steel, 6m/min for the 0.75 and 0.95mm thick steels and at 2 to 4m/minforthe 1.2mm thick steel.
(b) Wide Seam- In the case of the wide seam welding configuration, the effect of thickness on the maximum welding speed was minimal, Table 4 and Figs. 10 and 11, within the range of steel thickness 0.75mm to 1.2mm. The current for weld formation increased progressively as the welding speed was increased whereas, the minimum current level and the gradient of the minimum current line was greater for the 1..2mm thick steel compared to the 0.75 and 0.95mm thick steels, for both AC and DC welding currents.
The shape of the splash limit was observed to change with steel thickness, Figs. 10 and 11. Using an AC welding current, the minimum occurred at welding speeds of 8m/min, 5m/min and 4m/min for 0.75mm, 0.95mm and 1.2mm thick steel respectively. In the case of DC welding, the minimum occurred at 4m/min for both the 0.75 and 0.95mm thick steels, whereas, with the 1.2mm thick steel the splash limit showed little change as the welding speed was increased.
(c) Mash Seam - Using mash seam welding and an AC current, the same maximum welding speed was observed for both 0.60mm and 1.2mm mild steel, i.e. 14m/min, see Fig. 12. This result can be attributed to nugget separation at this speed. However, in this instance, there was a large increase in the minimum current requirement for the thicker steel which, was attributed to the larger initial weld overlap used with the thicker steel. The most notable feature observed in mash seam welding was that, the available welding range was very much larger with the 1.2mm thick steel than with the 0.60mm steel, Table 6, this being contrary to the findings observed for narrow and wide seam welding.
4.1.1.2. Effect of Thickness Tolerance
To examine the effect of variations in steel thickness and composition within generally specified tolerances on welding performance, a selection of steels of nominal thicknesses 1.1mm was chosen. The permissible tolerances at this sheet thickness were 1.1mm ± 0.1mm. Consequently, sheet thicknesses between 1.0 and 1.2mm were examined, details of which are given in Table 1. Average thickness values measured varied between 0.99mm and 1.20mm. The eight steels were similar in composition and surface roughness.
Wide seam welding trials, carried out at a welding speed of 4m/min, gave acceptable welding ranges which are presented in Fig. 13. These indicate that, all the eight steels could be welded using similar welding currents. In general, the steels at the thicker end of the range required slightly higher welding currents (of the order of lkA) to achieve stuck welds and a continuous weld seam. The current at which weld splash occurred did not exhibit any obvious relationship with steel thickness in the range examined. This resulted in a slightly reduced welding range for steels at the thicker end of the range. However, the range would still be within normal production tolerances.
To examine the nugget width, sections were taken through peeled samples for meta l lographic examination. The results, Table 7 and Fig. 14, indicated that with steels in the range 1.0 to 1.2mm thick, the relationship between nugget size and weld plug size was not consistant. These results confirm well known findings observed for spot welding^ in that the weld plug width is dependent on the nugget width, the width and strength of the solid phase bond and the method of testing.
It can be concluded from the results that, it would be possible to weld mild steels in the thickness range 1.0 to 1.2mm using the same welding condition. Thus, with a nominal steel thickness of 1.1mm, it would be possible to accommodate the maximum thickness tolerance specified in BS1449 of ± 0.100mm. In the current study, welding was carried out at a speed of 4m/min, i.e. a typical production speed. It is considered that at a lower welding speed of 2m/min, the tolerance in welding conditions would be even greater.

11
4.1.2. Effect of Oil
Depending on the application, strip mill products may be supplied in the oiled condition in order to inhibit rust formation and/or assist in press forming. In general, the amount of oil applied is between 1.5 and 2.0g/m2 . A number of investigations have, in the past, suggested that the presence of this oil can influence weld quality. Consequently, welding trials were carried out in which the amount of the oil film was varied between 0.5-4.0g/m2. An electrostatic oiling system was used to coat samples on both sides immediately prior to welding and a typical mill applied oil was used, viz. Croda oil PQ6-
The weldability lobes obtained are shown in Fig. 15 from which it can be seen that coating oil levels between 0.5 and 4g/m2 had little or no influence on the maximum welding speed attained or the available welding current range. In addition, the necessary current for continuous weld formation was independent of oil level.
Weld growth curves, showed that the amount of surface oil, in the range investigated, had no obvious effect on the weld growth characteristics or the maximum width of the weld seam.
Observations made during welding indicated that the heat flow ahead of the welding wheel caused the oil to be burnt off prior to welding. Further, oil tended to flow away from immediately ahead of and from the side of the welding wheels. The effect of the heat upon the oil resulted in fumes which appeared to be more pronounced at the higher heat settings and higher oil levels.
While the results obtained indicated that weldability was independent of the amount of oil on the surface of the sheet, the effect of any oil may depend on the composition and properties of the oil and, whether the oil is effectively burnt off ahead of the welding electrodes. It is possible that different oils could influence weld formation and also, adversely affect electrode life depending on the residues left on either the sheet or electrode surface. This has been noted for spot welding but in this case, there is little chance of removing the oil from the weld zone during the welding operation. It is concluded therefore, that oil has a secondary effect on weldability.
4.1.3. Influence of Bulk Resistivity
In order to evaluate the influence of the resistivity of a steel on weld formation, weldability lobes were produced using a range of high strength steels. Such steels would, because of differences in composition, possess different resistivities, Table 8, and it is assumed in this investigation that steel strength per se would have no influence on weld growth. The steels were welded using a narrow seam welder with continuous AC current.
The following steels were used:
Rephosphorised: 0.55mm, 0.7mm and 1.2mm Niobium treated: 1.4mm Dual Phase : 0.75mm and 1.2mm
(a) Rephosphorised Steel - Weldability lobes for 0.55mm, 0.7mm and 1.2mm thick steels are given in Fig. 16. It was observed that, the current necessary to form a continuous weld nugget increased progressively as the welding speed was increased while at the same time, the current necessary to cause weld splash decreased only slightly as the welding speed was increased.
Increasing the electrode force by 50% resulted in a slightly wider weldability lobe but increase in the maximum welding speed was noted, Table 9. no
(b) Dual Phase Steel - Weldability lobes were also determined for both a 0.75mm and a 1.2mm thick dual phase steel, Fig. 17. It was observed that, the rate of increase in the minimum current necessary to produce a continuous weld was lower for the thinner steel than the thicker 1.2mm steel and the current necessary for weld splash was observed to decrease progressively as the welding speed was increased. Increasing the electrode force by 50% resulted in a marginal increase in the lobe width, but the maximum welding speed which could be achieved was increased by up to 50%, Table 9.

-12
(c) Niobium Treated HSLA Steel - Weldability lobes for a 1.4mm thick niobium treated steel, at two electrode force levels, are shown in Figi8. When using an electrode force level similar to that used for mild steel of equivalent thickness, it was difficult to obtain continuous plug failures using this steel. This was attributed to the fact that, the ability to pull a plug rather than an interface failure is related to the ratio of the weld width to the steel thickness. In the narrow seam welding trials carried out in the current studies, the weld width is limited to the electrode tread width which remained the same for different steel thicknesses. Thus at a sheet thickness of 1.4mm, the weld widths obtained were too narrow using conventional electrode force levels thereby, resulting in failure through the weld in a peel test. Thus, this mode of failure was more related to the weld geometry rather than the inherent properties of the steel. The ability to produce plug failures at higher force levels may be therefore attributed to the increased contact area of the electrode and, the development of slightly wider welds. A wide current range, i.e. over 4kA, was observed at a welding speed of 2m/min, between the stuck weld and weld splash conditions, but the current range between the formation of a continuous plug and weld splash was only 500 A. Increasing the electrode force by 50% to 6.75kN enabled a wider range of current to be obtained between the production of a continuous plug failure and weld splash, i.e. at 2m/min the range was 4kA. The minimum current for weld formation increased progressively as the welding speed increased. With respect to splash, the current level was constant between welding speeds of 2-6m/min and then increased progressively as the welding speed was increased above 6m/ min.
Conventional weld nugget growth curves were determined from the peel tests for the different steels and a typical example for a 1.2mm rephosphorised steel is shown in Fig.19. These curves indicated that:-
1) The rate of weld growth increased as the welding speed increased 2).The maximum plug width decreased as the welding speed increased 3) The rate of weld growth was greatest for the thicker steels 4) The rate of weld growth was slower at the higher electrode force levels
The maximum welding speeds attained with steels of different thickness and composition are summarised in Table 10. It can be seen that, as the steel thickness increased in the range 0.55 to 1.4mm the maximum welding speed which could be achieved without splash decreased. In addition, the results indicated that, as the resistivity of the steel increased, the maximum welding speed which could be achieved decreased.
The results obtained indicate that, the minimum current level necessary to produce continuous welds in steels of high resistivity was generally similar to that required for mild steel, Table 11. However, the current level at which splash occurred was lower in the case of the high resistivity steels compared to mild steel and generally, the splash current decreased as the alloy content/resistivity of the steel increased.
In general, the maximum welding speed which could be at tained with high resistivity steels was observed to be lower than that for mild steels. The reduced maximum welding speeds observed can be attributed to the higher resistivity of these steels as compared to mild steel which, results in a larger amount of heat being developed in the body of the steel. This will result in a lower temperature gradient between the weld interface and the electrode/sheet interface which in turn, causes a faster rate of growth of the weld nugget towards the outside sheet surface. Consequently, surface splash can occur at lower welding currents in high resistivity steels than in mild steel. The earlier onset of surface splash also reduces the available welding range and the maximum welding speed which can be attained as the resistivity of the steel is increased.
4.2. Influence of Current Waveform
Conventional seam welding is carried out using a welding current supplied at 50Hz. Although continuous current is required for high speed operation, interrupted current programmes are used at low welding speeds. Such current programmes minimise the effects of current shunting because of the larger gap between weld pulses. Also, a reduction in the surface temperature can be achieved because of the increased amount of heat abstraction during the off period.

-13
Because of the inherent cyclical nature of the AC current, low heat regions can be produced in the weld seam when high welding speeds are used. Therefore, weldability lobes were determined for the various combinations of welding configuration/steel thickness using a DC welding current. When high welding currents are required, DC welding can be beneficial in distributing the power required over the three incoming phases rather than the single phase used with conventional AC welding machines. This also gives a marked improvement in the power factor. Since the purpose of the work was to examine high speed welding, the majority of the effort was concentrated on DC welding rather than welding with an interrupted current programme, although work on the latter was included in order to give a progressive indication of weld growth through from roller spot welding to continuous welding.
4.2.1. Effect of Interrupted Current Programmes
Welds were made on 1.2mm mild steel using wide seam welding and AC current programmes of either 2 cycles on/2 cycles off, or 3 cycles on/2 cycles off. Continuous weld seams were observed at a welding speed of 2m/min. However, at a welding speed of 4m/min, there was virtually no available current range between the formation of a continuous weld seam and the splash condition and at 6m/min, it was not possible to produce a continuous weld seam see Fig.20. With these current programmes, the maximum welding speed which resulted in a continuous weld seam was less than 4m/min, whereas, when using a continuous AC welding current, the maximum welding speed was 8m/min. In situations where a pressure tight joint is not required, then interrupted current programmes could be used at higher speeds.
With interrupted current programmes, slightly higher welding currents were required to produce a continuous weld seam at a welding speed of 2m/min. Compared to continuous AC currents, the level necessary was approximately 10% higher for a 3 on/2 off and 30% higher for a 2 on/2 off current programme. The available welding current range at 2m/min using an interrupted AC current was similar to that obtained using a continuous AC current.
Welding with interrupted current programmes of 3 cycles on/2 cycles off and 2 cycles on/2 cycles off resulted in maximum welding speeds of less than 4m/min if standards representing continuous pressure tight seams were stipulated. With interrupted current programmes, a continuous seam could only be produced if heat conduction resulted in the formation of weld during the current off period. This was more difficult to achieve as the welding speed increased since, the length of seam corresponding to the off time increased proportionally. For example, at welding speeds of 4m/min and 6m/min, the seam length corresponding to 2 cycles off time was 2.6mm and 4mm respectively. With these welding conditions, it was considered that there was insufficient heat available to form a continuous weld over the whole seam length.
4.2.2. AC vs. DC Welding Current
The use of a DC welding current rather than an AC welding current can result in changes in the current requirements, the splash limit and the maximum welding speed which can be achieved in any welding situation. The influence of DC current was observed to depend on the welding configuration and the steel thickness, see Tables 4-6 and Figs. 8-11.
With a DC current, the minimum current required to produce a continuous weld was less than that necessary using an AC current, Table 5 and Figs. 8-11. On average, DC welding required a current level approximately 20% below that required with AC welding to give equivalent results. As with AC welding, the current levels at which splash occurred decreased as the welding speed was increased from 2m/min until a stage was reached when the current necessary for splash increased with welding speed. In the case of narrow seam welding, the minimum occurred at lower welding speeds with DC compared to AC welding at sheet thicknesses > 0.60mm. At these sheet thicknesses, the results obtained with AC and DC welding currents were similar in terms of the relationship between splash and welding speed. When wide seam welding of steels in the thickness range 0.75 to 1.2mm, the use of a DC welding current reduced the speed at which the minimum in the splash limit occurred whereas, in the case of mash welding a 0.6mm thick steel, the use of a DC current increased the welding speed at which the minimum in the splash limit occurred from 6 to 14m/min, Fig.21
With respect to the maximum welding speed developed in narrow and wide seam welding of steel of thickness in the range 0.75 to 1.2mm, use of a DC current reduced the maximum welding speed, see Figs. 8-11, Table 4. With a 0.60mm thick steel, using a DC current increased the maximum welding speed from

-14
14-16m/min to 18-20m/min compared with AC welding for both narrow seam and mash seam welding, Figs. 8,9 and 21.
The results suggest that in situations where an AC current is used and, the maximum speed is limited by weld splash rather than nugget separation, i.e. a non- continuous weld, then the use of DC current does not result in an increase in the maximum welding speed that can be achieved and in fact, a reduction would be expected. In situations where AC current is used, and the maximum welding speed is limited by the separation of individual weld nuggets, i.e. maximum speeds in the order of 14-16m/min, the use of a DC welding current can be beneficial in many instances and results in an increase in the maximum welding speed attainable.
Where weld splash is the limiting factor, DC current may lead to the earlier onset of splash due to one or both of the following: -
1) The high tendency for surface heating to occur in preference to heat generation at the weld interface.
2) The tendency for the weld nugget to grow towards the positive electrode, i.e. Peltier effect.
Evidence of pronounced surface heating with DC welding was observed in the current investigation. For example, severe blueing of the sheet surface was evident even when the heat input was insufficient to result in bonding across the interface. Additionally, with thicker steels, small ripples were observed on the surface of the weld seam which were considered to result from local surface melting rather than growth of the liquid nugget through to the sheet surface. The extensive surface heating which occurs with DC welding is considered to result from the absence of a current off-period which is typical of AC welding when the polarity of the current flow is reversed. As a consequence, the temperature of the welding electrode is higher in the case of DC welding and the amount of heat abstraction through the welding electrode is therefore decreased.
The second factor which could affect the splash limit in DC welding is the Peltier effect which causes the weld nugget to grow preferentially towards the positive electrode. Metallographic examination of welds did not show any pronounced nugget displacement in the vertical direction and the Peltier effects must therefore be a second or third order effect.
It is considered that the additional surface heating that was observed with DC current was a limiting factor responsible for the reduced welding ranges and lower maximum speeds obtained in some situations. In the other cases, where the maximum speed observed with AC current is limited by nugget separation, then the use of a DC current eliminated the low/zero current period and therefore a continuous weld seam resulted. This only applied to si tuations where heating of the surface was minimised, i.e. with thin material or, in situations where a high force was used for example, mash seam welding.
With DC mash welding, it is considered that welding speeds in excess of those obtained in the present investigation could be attained if weld splash could be minimised, i.e. welding speeds > 18m/min may be possible by the use of a higher electrode force. However, this was not possible to investigate in the present study due to the inability to maintain the pre-weld overlap with the available jigging arrangements and with high electrode force levels. It is considered that an increase in welding speed of 30% or more could be achieved by using a DC current in preference to an AC current at the higher electrode force levels.
4.3. Influence of Electrode Force
The effect of electrode force was determined for both narrow and wide seam welding using both AC and DC welding currents for mild steel in the thickness range 0.75 - 1.2mm. Typical weldability lobes for wide seam welding determined for the 1.2mm mild steel are shown in Fig.22. It can be seen that, increasing the electrode force within the range 2.4-7.2kN resulted in wider weldability lobes and, enabled higher welding speeds to be attained - speeds of up to 8m/min being achieved. The results obtained also indicated that much higher speeds could be achieved at sheet thicknesses < 1.2mm.
Similar trends were obtained with narrow seam welding, see Table 12.
It may be summarised that increasing the electrode force resulted in:-.

15
a) The need for higher currents for weld formation b) A larger available welding current range c) Higher maximum welding speeds for a particular seam welding configuration d) A lower rate of weld growth
In many instances, a value of electrode force was evident above which increasing the electrode force had little or no effect on the weldability lobe or, the maximum welding speed.
The increase in the current necessary for weld formation can be attributed to the larger arc of contact between the sheet being welded and the welding electrode and therefore, a higher current is required to achieve the necessary current density. Also, increasing the electrode force resulted in a lower contact resistance although, it is considered that the former is the dominant factor. Increasing the electrode force was observed to reduce the rate of weld growth in all cases, Fig.23.
4.4. Effect of Welding Configuration
The importance of welding configuration, i.e. narrow, wide or mash seam welding is dependent on the current type used, i.e. AC or DC current and on the steel thickness and as such, has already been discussed to some extent. However, there is a need to discuss these findings to determine the relevance, if any, of the process configuration on weldability.
It may be summarised from the results presented , see Figs. 8-12, that:-
a) The maximum welding speeds for wide seam welding were significantly lower than those achieved with narrow seam and mash seam.see Table 4.
b) The minimum current requirements for narrow seam welding were less than those required for either wide or mash seam welding, see Table 5.
c) The available welding ranges decreased much faster as the welding speed was increased in the case of wide seam compared with narrow welding.see Table 6.
The influence of the narrow, wide and mash configurations on the weldability can be related to the different electrode thicknesses and tread widths (overlap in the case of mash seam welding) together with the different force levels used in practice. These factors influence:-
1) The minimum current requirement to achieve the necessary current density 2) The arc of contact between the welding electrode and the sheet being welded 3) The volume of the weld nugget produced 4) The amount of heat abstraction from the surface of the weld through the welding electrode
The results showed that much higher welding speeds were achieved with narrow seam welding compared to wide seam welding. This increase in maximum welding speed was related to the lower welding currents required for weld development in narrow seam welding. It should be emphasised that for a given applied welding current, the effective current density is higher in narrow seam welding. Further, production of welds at lower current levels may result in a lowering of the heating effect at the electrode and thus, the narrow seam electrode configuration may be able to concentrate the heat more effectively at the faying surface thereby, allowing high welding speeds to be achieved before the onset of splash. The effective weld pressure may also be higher with narrow seam welding than with wide seam welding because of the smaller electrode contact area.
The arc of contact can be calculated from the equation:
,F D t = 0.029 V — . — (3)
W 2
where F = electrode force kp

16
W = electrode tread width mm D = electrode diameter mm i = length of contact mm
It should be noted that Equation (3) is an approximation and the actual value depends greatly on the current level and the amount of electrode indentation.
Metallographic examination of narrow seam welds in a 1.2mm mild steel made using an electrode force of 4kN indicated that the width of contact was approximately 2.75mm which in the current investigation was equal to half the width of a wide seam. Using the above equation indicated that, the arc of contact was approximately 3.35mm for wide seam and 4.3mm for narrow seam for a 1.2mm thick steel. This equated to an equivalent contact area of 18.4mm2 and 11.8mm2 for wide and narrow seam welding respectively, which in tu rn corresponded to electrode pressures of 0.26kN/mm2 and 0.34kN/mm2
respectively. Thus, as well as the nugget geometry, the increased arc of contact and electrode pressure may also account for some of the improvement in maximum welding speed, which was obtained with narrow seam welding.
The relatively large volume of liquid produced in wide seam welding makes it more difficult to solidify all the molten liquid before it exits from the arc of contact between the welding electrodes and the sheet being welded. .This can therefore promote the earlier onset of weld splash through the surface of the seam.
Although high current values are used for mash seam welding, the high electrode force values and the larger mass of the electrodes will result in more effective heat abstraction from the surface and also, an increase in the arc of contact as compared to the other seam welding processes. Both these factors will allow a wider current range between weld formation and weld splash and consequently, a higher maximum welding speed.
4.5. Roller Spot Welding
Roller spot welding trials were carried out on a 1.2mm mild steel using AC wide seam welding. A weld current on-time of 7 cycles was selected while the off-time was varied between 5-24 cycles to give a separation of between 15 to 20mm between weld nuggets. The weldability lobe obtained is shown in Fig.24 from which it can be seen that the maximum welding speed which could be allowed approximated to 8m/min. It was also noted that, the current necessary for weld nugget formation was similar to that required when producing a continuous seam weld. However, weld splash occurred at lower current levels in roller-spot welding, thereby resulting in a narrower welding current range compared with that obtained using a continuous current.
As the welding speed was increased, the individual weld nuggets became more elongated until a speed was reached at which, what were effectively small regions of seam weld were formed. Peel testing of roller-spot welds, revealed that, welds made at low welding speeds exhibited a single nugget. At speeds of 6m/min, the weld nugget separated into two distinct regions while at a welding speed of lOm/min, three distinct regions were observed, Fig.25. At 10m/min, the three separate regions of weld formation in the elongated spot corresponded to a high heat region at the start , a lower heat region in the middle and the lowest heat region at the end of the small seam weld which was formed at these speeds, Fig.25. Thus multiple welds were produced as the welding speed was increased, although the amount of heating in the separate heat regions decreased from the start to the end of welding. Similar effects were indicated at the start of seams produced with continuous current. These results indicated that shunting tended to occur in a definite pattern during the early stages of weld formation. During the first half cycle of current, no shunt path existed and a high resistance is recorded. After the first half cycle, the welding current tends to flow through the low resistance path created by the initial weld and consequently, the resistance falls.. When the distance between the point of current entry and the first weld reaches a critical value, some of the current flows through this weld and some flows directly through the path between the welding electrodes thereby, leaving a gap between the first weld and the second weld nugget. A similar effect gave rise to a gap between the second and third heat regions. Steady state conditions are eventually reached where part of the current shunts to the previous nugget and part is used to form the next nugget.

17-
4.6. Low Indentation Welding
In a number of applications, it is desirable to produce a "non-marking" or "minimum indentation" weld for aesthetic reasons. Such welds are difficult to produce in practice, since if the amount of heat generated is sufficient to produce a weld at the interface, then the combined action of the applied electrode force, together with the low strength of the steel at welding temperatures, results in indentation of the sheets by the welding electrodes. This indentation can be controlled and restricted to one side of the weld by using electrodes of a much larger width on the "minimum indentation" side. By this means, the heat generated during welding is spread over a much larger area and in addition, the applied welding load is distributed over a larger area. Both these factors combined, act to limit the amount of indentation on the sheet surface in contact with the larger electrode. A series of tests were carried out to assess the conditions under which "minimum indentation" welds could be produced in a 1.2mm mild steel. Welds were produced using different current programmes and different electrode configurations. The use of pulsed current programmes, i.e. 2 cycles on, 2 cycles off, and other on/off combinations, resulted in welds with no indentation at the edge of electrode on the minimum indentation side. However, a slight ripple effect was evident on the surface of the weld which corresponded to the on/off periods of the welding current. The use of a radiused tread profiled top electrode coupled with a flat electrode resulted in a slight convexity of the surface on the "minimum indentation "side of the weld.
Weldability lobes were therefore determined using a continuous current programme and a top electrode of tread width 5.5mm coupled with a lower electrode of 16mm tread width, the latter corresponding to the "minimum indentation" side of the joint.
Weldability lobes produced at the three force levels of 2.4kN, 4.8kN and 6.0kN, are shown in Fig.26. No evidence of indentation was observed, either visually or metallographically, in any of the welds produced and a typical weld section is shown in Fig.27. The factors which limited the available welding range and the maximum welding speed were excessive convexity of the upper surface coupled with weld ripple. These effects were observed to be more pronounced at the higher levels of heat input. It was noted that pronounced convexity of the upper surface was associated with slight convexity on the "non-indentation" side, Fig.27. The maximum welding range determined, between the formation of a continuous weld and surface convexity, corresponded to a welding speed of 2m/min and an electrode force of 4.8kN. At higher values of electrode force, surface convexity was considered excessive and occurred before a continuous weld was formed, Fig.26. It was noted that although the weld nugget was fairly central, there was a tendency for nugget growth to extend towards the narrow tread electrode thereby, giving more convexity at this side of the weld, Fig.27. Additionally, the high force level reduced the current necessary for splash at low welding speeds. This can be attributed to the action of the applied electrode force causing the molten weld nugget to be forced out either through the surface or at the interface.
The other factor which limited the available welding range for "non-indentation" welds was the formation of a ripple on the surface of the weld seam at welding speeds of 6m/min and above. This feature was generally very faint at the low heat settings but became more pronounced as the welding current was increased.
It can be concluded that, welds with no indentation on one side of the seam can be produced over a range of welding speeds. With the higher welding currents, slight bulging is produced on the non-indentation side and, at welding speeds of 6m/min and above, a faint ripple effect is observed due to the oscillating nature of the AC current.
5. WELDABILITY OF COATED STEELS
It is generally considered that, the resistance seam welding of coated steels is a critical process requiring very closely defined operating limits. As with resistance spot welding, the major problems encountered are the avoidance of electrode pick-up and difficulties in determining optimum welding conditions. In forming a seam weld, the electrodes are subjected to a more severe mechanical and thermal treatment than during spot welding. It is also more difficult to effectively water cool seam welding electrodes. Consequently, conventional seam welding practice is not recommended for the welding of most coated steels, particularly if zinc coated, because of the problems of excessive contamination of the electrode wheels, this resulting in the need for excessive wheel maintenance. However, modifications to the basic system can enable satisfactory resistance seam welding to be achieved, and a number of techniques are__
18
now available which allow effective seam welding without the problems of low electrode life and inconsistent weld quality.
5.1. Narrow Seam Welding
In narrow seam welding machines, high pressure profile rollers are used to clean and profile the welding wheels. These can result in a marked improvement in electrode life compared with conventional seam welding and typical values of electrode life of up to 30,000 meters of welded seam can be obtained with various types of zinc coated steels. The profiling rollers, which are hydraulically loaded, have a dual function. Firstly, their use as drive rolls results in a friction roll system which provides a welding speed independent of electrode diameter. The roller is knurled only on the angle sides of the electrode wheel, the root face of the roller being smooth and radiused. A second function of the profiling rollers is to maintain the profile of the electrode wheels and maintain a consistent surface condition. Under the action of the applied force, which is in the region of 10-15kN, the coating layer is broken up and removed from the surface. The electrode wheel thickness is between 8-10 mm with a tip radius of 5-6mm, this resulting in a weld width of about 2-3Vt where t = sheet thickness in mm.
In addition to the profiling rollers, a spring loaded scraper device located ahead of the rollers is beneficial in removing any heavy build-up of coating on the electrode. It should be emphasised that the action of the rollers should not remove completely the build-up on the electrode, but should result in a consistent electrode/workpiece geometry and surface condition. By this means, the current density and contact resistance at the electrode/workpiece interface is kept constant which in turn, results in a consistent weld quality over an extended production run.
Details of the coated steels examined are given in Table 3. All steels were narrow seam welded using AC and DC welding current.
5.1.1. Terne Coated Steel
Narrow seam welds were produced using continuous current and interrupted current programmes of 2 on/2 off or 3 on/1 off. The weldability lobes obtained are presented in Fig.28 from which it can be seen that, maximum welding speeds of 4,5 and 7m/min were achieved for 2 on/2 off, 3 on/ 1 off and continuous AC current respectively. It was observed that, the minimum currents required to produce a continuous weld were slighty lower with continuous current than when using an interrupted current programme. A maximum welding speed of 7m/min was also achieved using DC current but at lower current levels, Fig.28.
5.1.2. Aluminium Coated Steel
Weldability lobes produced using either a DC or an AC welding current are shown in Fig.29, from which it can be seen that maximum welding speeds of 5m/min and 10m/min respectively were obtained.
5.1.3. Zinc Coated Steels
The zinc coatings investigated included:-
Pure zinc Hot dip, electrolytic Iron-zinc alloy Hot dip Zinc-aluminium ( 5% Al and 55% Al) Hot dip
Weldability lobes determined for these steels using either AC or DC welding currents are shown in Figs. 30-34.
The maximum welding speed attainable when welding coated steels was found to be less than that obtained with mild steel of a similar thickness using either AC or DC welding currents, Table 13. It was observed that, for AC welding, the necessary current for welding was on average, between 50% and 100% higher than that required for the same thickness of uncoated mild steel, Table 14. Weld splash occurred at current levels, on average, between 10% and 35% higher than for mild steel of similar thickness, Table 15.
The maximum welding speeds attained with DC current were generally lower than those obtained with AC current, Table 13. In addition, with DC welding, the current necessary for weld formation was, on

19-
average, 20% to 40% less than that required when using an AC welding current, Table 16. Splash occurred at lower currents and, the current giving rise to surface splash was reduced by a larger amount than the current necessary for weld formation thereby, resulting in a narrower welding range. This situation was exacerbated by the fact that the weld "opened up" in some instances when the seam exited from between the welding electrode, i.e. sticking between the coating and the electrode was sufficient to pull open the low strength weld at the faying surface.
The main factor responsible for the lower maximum welding speeds which could be attained for coated steels, was the significantly higher current required for weld formation since this led to a reduction in the available welding range. This can be attributed to the lower contact resistance of the various coated steels investigated which was exacerbated by the fact that melting of the coating occurred at the surface. This resulted in a further decrease in the contact resistance and an increase in the effective area of contact between the electrodes and the sheet as a consequence of the spread of the molten coating to the edge of the welding electrode. By this means, the width of the current path was increased significantly which caused an effective reduction in the current density at the weld interface. Evidence of the bonding at the edge of the weld can be seen from Fig.35.
In the case of hot dipped and electroplated zinc coated steels, the limiting factor controlling the welding speed was observed to be surface cracking which was visible at the edge of the weld nugget, see Fig.36. These cracks were evident at relatively low welding currents and severely limited the available welding range. While these results indicated that the use of a DC welding current significantly reduced the incidence of cracking in these steels, this was not borne out during a more detailed metallographic examination, see Section 5.3.
With respect to the other zinc based coatings examined, severe cracking, as revealed by the test method used, was not observed at the edge of the tensile peel specimen in the iron-zinc alloy, Zn-5% A€ or Zn- 55% A€ coating even although pronounced brassing was observed in the case of the latter two coatings. It should be noted that cracking has been previously observed in such seam welds, i.e. in terne <7.8> and the iron zinc alloy coated steel (8)f near the maximum current level.
5.2. Soudronic Wire Welding
Narrow seam welding aims to overcome coating pick-up by the welding electrodes by the use of friction drive side rollers which compact the pick-up at the electrodes and thus maintain a constant interfacial resistance between the electrode and the sheet surface. In the case of the Soudronic wire system, the electrode/sheet resistance is maintained constant by feeding a copper wire between the electrode wheels and the sheet surface. By this means any coating pick-up is continuously removed on the copper wire and the weld is effectively made by "clean" electrodes at all times.
The present trials were carried out using a "High Performance, Fully Automatic Contour Seam Welding Machine, Model Rdk 100 TEuP". This machine was made available by Soudronic AG, Dietikon, Switzerland. Weldability lobes were produced by making a range of welds at welding speeds of 1.9m/min, 5.8m/min and 10m/min. The current was progressively increased from the stuck weld condition to the maximum tolerable current in each case. The effect of interrupted current programmes and electrode force levels were also examined.
5.2.1. Continuous Current Welding
A summary of the results obtained are given in Table 17, and typical weldability lobes are presented in Figs. 37 and 38. These results indicate that it was possible to weld all the coated steels investigated at welding speeds of 6m/min and 10m/min. The welding machine used in the trials was designed primarily to operate at welding speeds between 4 and 8m/min. However, in order to allow comparison with previous work on narrow seam welding, some welds were made at a speed of 2m/min. At this welding speed, it was not possible to obtain a satisfactory welding range using continuous current because, as shown previously, the amount of heat abstracted by the electrodes is large, at low welding speeds. In the case of the wire welding process, excess heat can result in overheating and breaking of the electrode wire before a satisfactory welding range can be achieved. At welding speeds of 6 and 10m/min, the amount of current which could be inputted into the weld was generally limited by the ability of the copper wire to carry the current. However, at these higher speeds, overheating of the wire occurred near the weld splash level and a workable range was evident between the minimum current for weld formation and the maximum current which could be tolerated. In general, the welding range was slightly larger at a welding speed of
-20
lOm/min than at 6m/min. This can be attributed to the decrease in the amount of heat abstracted by the electrode wheels as the welding speed is increased.
The effect of electrode force was studied using electroplated zinc and iron-zinc alloy coated steels. A welding speed of 10m/min was used and the electrode force was varied between 300daN and 500daN. The results obtained indicated that, increasing the electrode force resulted in an increased current requirement for weld formation. This can be attributed to the lower contact resistance, coupled with the increased contact area and thereby, better heat abstraction, obtained as a consequence of increasing the electrode force.
The higher force levels also resulted in an increase in the available current range between weld formation and the maximum current which could be tolerated. However, electrode force values within the range 300 to 500 daN had little effect on the available current range between weld formation and crack formation.
It was not possible to observe any consistent trends with respect to the effect of coating type on the minimum current requirement, Table 17. The minimum current required for continuous weld formation was similar in all the coating types examined.
With respect to the effect of coating type on the welding range, the results indicated that those steels susceptable to cracking showed a reduced welding range.
Cracking or intergranular penetration of the grain boundaries by a liquid phase is generally difficult to quantify. In the work carried out on narrow seam welding of coated steels, the extent of cracking was assessed by examining the edge of a tensile peel sample. Although this gave a good indication, in many instances, the presence of cracks was not always revealed. Also, with this technique, the area examined is necessarily limited. Metallographic examination of sections taken longitudinal to the weld seam revealed the presence of'cracks' where none had been indicated from the peel test. With respect to cracking in the Soudronic wire welds, the weld seams were scanned with a binocular microscope at a magnification of x 10 to x 30. This allowed a much larger area to be examined and the technique was able to reveal cracks irrespective of their position or orientation. One limitation of this technique however, was the inability to detect the extent of liquid metal penetration under a surface brass or oxide film.
Welding ranges between 0.50kA and 3.25kA were achieved at 6m/min the limiting factor in 5 out of the 7 coated steels examined being weld cracking, the exceptions being aluminium coated and zinc - 55% Al coated steels. It was observed that the cracks tended to lie within the weld seam depression and were not necessarily concentrated at the edge of the seam as in narrow seam welding. The current range between continuous weld formation and crack formation varied for the different coated steels and was observed to increase in the order, hot dipped zinc, electro-deposited zinc, iron zinc alloy, zinc - 5% Al, and finally the lead-tin coated steel.
At a welding speed of 10m/min, the "cracking order" was found to be similar although it was observed that there was a slight increase in the available welding range between weld formation and crack formation in the case of the hot dipped zinc, electrolytic zinc and iron-zinc alloy coatings.
5.2.2. Interrupted Current Programmes
Welding trials were also carried out using an interrupted current programme of 1 cycle on/ 1 cycle off at a welding speed of 4.8m/min. Under these conditions, the upper current limit was found to correspond to weld splash rather than overheating of the wire or weld cracking. Consequently, those coated steels where the welding range was limited by weld cracking when using a continuous welding current generally exhibited a wider weldability range at the lower welding speeds when using an interrupted current. In the case of hot dipped zinc coated steel, it was found that, if the welding speed was reduced from 4.8m/min to 3.3m/min and a current programme of 2 cycles on/2 cycles off was used, the welding range was increased to 2kA. It can be concluded that, where weld cracking is a problem, it can be beneficial to use an interrupted current programme and adjust the welding speed to give a suitable number of welds per unit length us dictated by the end application.
The use of an interrupted current also reduced the amount of surface brassing observed on the weld seam particularly in those coated steels which were prone to this effect.
-21
Observations made, with respect to cracking and brassing, indicated that the use of an interrupted current resulted in a relative increase in the amount of heat abstraction from the surface. The slightly higher peak current levels observed during the "on" cycles of current flow are, under these conditions, more than compensated for by the greatly increased cooling rate which is obtained during the current "off' period and the reduced energy input.
5.2.3. Results of Metallographic Examination
(a) Continuous Current Programme - Although the lead-tin and hot dipped zinc coated steels exhibited weld solidification structures similar to those observed in uncoated mild steels, the remainder of the coated steels showed a variety of solidifications structures, Fig.39. In the case of the iron-zinc alloy coated steel, a much more homogeneous structure was observed through the cross-section of the weld than was observed with the other coated steels. With respect to the aluminium coated steel, the weld pool was delineated by a light etching structure, with solidification chevrons just visible. The weld zone in the zinc - 55% Al coated steel also corresponded to a slightly lighter etching region. Electroplated zinc and zinc - 5% Al coated steels exhibited a less consistent solidification structure with indications of individual weld nuggets within the weld seam.
The differences in solidification structure which were observed can be explained in terms of:
(a) Differences in base steel chemistry. (b) Entrapment of the coating within the weld pool. (c) The influence of the coating on the current flow pattern.
In the thickness range 0.6mm to 0.85mm, welds in mild steel exhibited similar solidification structures. Therefore, any differences in base steel thickness were not considered to contribute to the differences observed in the solidification structures. In the majority of cases, the base steel chemistries of the coated steels were similar to those in the mild steels examined where minor differences in base steel chemistry did not significantly affect the solidification structure. The one exception with respect to base steel chemistry was the iron-zinc alloy coated steel. In this instance, the carbon content was very low, i.e. 0.009% compared to 0.048% to 0.064% in the remainder of the coated steels. The lower carbon level of the base steel used for the iron-zinc alloy coated steel may have resulted in reduced segregation differences during solidification of the weld nugget and therefore account for the more homogeneous weld structure observed in this coated steel.
With respect to the aluminium coated steel, the light etching structure of the weld, see Fig.39, probably resulted from some entrapment of the coating within the liquid weld nugget as confirmed by electron probe micro analysis. Weld structures observed in the zinc - 55% Al coated steels indicated that some entrapment of the coating had occurred.
The electroplated zinc and zinc - 5% Al coated steels exhibited less regular solidification patterns than the other coated steels. With these two coated steels, individual weld nuggets were observed within the weld seam and the structure and weld profile were similar to those in welds produced with interrupted current programmes. However, examination of the weld current traces, which were taken for every weld produced, confirmed that the current used was continuous with no abnormal effects. It is considered that, in the case of these two steels, the weld current passed through the nugget towards the exit side of the wheels and then shifted to a low resistance path created by contact of the coating near the entry side of the electrode wheels. This is similar to the current flow pattern observed for hot dipped galvanised steel in narrow seam welding.
(b) Interrupted Current Programme - With a welding programme of 1 cycle on/1 cycle off, a welding speed of 4.8m/min and a secondary current at 50 Hz, a weld is formed with the first two half cycles of current flow, during which time the seam has travelled 1.6mm. The weld cools during the next two half cycles when no current flows, while the seam travels a further 1.6mm. To determine the effect of the interrupted current programme on weld formation, longitudinal sections were taken through the welds. These welds exhibited a continuous weld bond with the individual weld nuggets immediately adjacent to each other.
- 2 2 -
It was observed that, using an interrupted current programme resulted in an increase in the amount of aluminium picked-up in the weld nugget, when welding aluminium coated steel. This occurred because of the reduction in temperature ahead of the weld during the current off-period thereby causing less melting and dispersion of the coating. This phenomena is more pronounced with an aluminium coating because of its higher melting point compared to lead or zinc coatings.
The interrupted current programme also resulted in a ripple effect, on the surface of the weld seam. During the current off-period, the material entering the weld zone is colder and stronger thereby resulting in a reduction in the amount of indentation. At the next weld current on-cycle, the material heats up and because of the reduction in strength the amount of indentation increases. The combined effect of this is to promote rippling ahead of the rotating welding electrodes. Another factor which may contribute to the formation of ripples is the effect of the electrode force on the hydrostatic pressure set up in the molten nugget.
At the leading edges of each weld nugget, the heat pattern expands to one or both surfaces of the weld seam if high heat inputs are used. The position of this increased heat development corresponds to the peak in the surface ripple described above, i.e. it corresponds to the extremity of the arc of contact between the electrode and the sheet surface at the exit side of the electrode. Therefore, it is considered that this heat pat tern resulted from the current flowing towards the exit side of the wheels and to there being less time available for heat abstraction from this area. This resulted in an increased rate of heat development near the sheet surface.
(c) Electrode Force - As in the case of mild steel, increasing the electrode force changed the nugget shape from nearly spherical to a more eliptical form. This is considered to result from the improved heat abstraction from the surface of the weld seam due to more effective contact between the sheet and the electrode at higher electrode force levels. Although this modification to weld formation can increase the overall welding range between weld formation and weld splash, it did not increase the practical welding range between weld formation and crack formation. This may be attributed to the fact that cracking is also influenced by the stresses developed in the weld zone. Thus, with higher forces the surface temperature may be reduced but the stress on the weld may be increased.
5.2.4. Factors Limiting the Welding Range
When using continuous current the factors limiting the welding range are cracking in the weld seam and overheating/breaking of the wire electrode. With interrupted current programmes the upper current limit was set by the onset of weld splash.
Although the maximum current that could be passed when using continuous current was limited by overheating/breaking of the electrode wire, the practical limit was generally set by the occurrence of weld cracks.
Fracture of the wire occurred when a brazed-type joint was formed between the wire and the surface of the weld seam and the resultant tension on the wire caused failure. An example of the bonding of the wire to the surface of the weld in zinc - 5% Al coated steel is shown in Fig.40. It can be seen that a layer of brass had formed in the copper wire and on the surface of the weld seam, some penetration of the brass into the steel substrate was also evident, Fig.40. It is probable that any problems with wire breaks could be overcome by using a larger wire.
However, before fracture or overheating of the wire become a problem, "cracking" generally occurred. As in the case of narrow seam welding, the cracks were always associated with in tergranular penetration of liquid copper/brass phases. Any stress applied to these regions would result in fracture through the low strength networks causing open cracks.
The third factor which limited the available welding range was the occurrence of weld splash. This was generally the limiting factor in the case of interrupted current programmes. Splash occurred through the surface of the seam from the leading edge of the weld nugget as it emerged from the region of electrode contact.

23
A comparison of the welding ranges obtained for both narrow seam welding and wire welding is shown in Table 18. At low welding speeds, (2m/min), and using a continuous welding current waveform there was no available welding range. This was related to the large amount of heat which is developed in the electrode wire thereby, causing overheating and possible wire breaks. Although this problem could be reduced by using larger wire dimensions, the results indicate that the narrow seam technique may be more flexible at the very low welding speeds. It should be emphasised that the Soudronic wire welding machine is designed specifically to operate at welding speeds of 4-8m/min and difficulties can therfore be encountered in operating the machine at a speed of 2m/min.
At a welding speed of 6m/min, the available welding ranges for wire welding and narrow seam welding were very similar whereas at 10m/min, larger welding ranges were attainable with the wire welding technique than with narrow seam technique. The increased range is greater than would be expected from the slightly higher force levels used in the wire welding trials.
With respect to the current levels used in wire welding, the current for continuous weld formation was on average 20% higher than that required in the narrow seam technique, Table 19. This slight difference can be accounted for in terms of the slightly higher forces used in wire welding. The contact width of the electrode was similar for both techniques.
It is the aim in both instances to produce a constant resistance between the electrode and the sheet surface. While narrow seam welding achieves this by creating a constant pick-up on the electrode, it would be considered that the constant replacement of the electrode, as in the wire welding technique, would result in a more consistent resistance path between the electrodes.
Another important point in the Soudronic technique is the built-in control of the welding speed and weld position within precise limits using more accurate electronic control systems .
5.3. Cracking in Seam Welds
It was concluded that cracking was a limiting factor when welding coated steels. In order to determine the mechanism of cracking, detailed examination of welds made by narrow seam welding was carried out, it being assumed that any conclusions drawn would be equally applicable to welds made by the Soudronic wire welding process.
5.3.1. Incidence of Cracking in Narrow Seam Welding
The weldability lobes obtained for narrow seam welding of coated steels showed that severe surface cracking could occur with the hot dipped and electroplated zinc coated steels. These observations were based on examination of the fracture edge of peel samples. To study this phenomenon, detailed metallographic examinations were carried out on welds produced, in the various coated steels, at a range of current settings at welding speeds of 2m/ min and 6m/min. Samples parallel to the weld seam were taken and polished back to the weld fusion line. The results indicated that the various coated steels examined could be classified into three groups based on their susceptability to cracking.
(a) High Susceptability to Cracking
Both hot dipped and electroplated zinc coated steels exhibited severe surface cracking in welds made using either AC or DC welding current. At high current levels, it was observed that the cracks penetrated into the sheet for distances up to approx. 800-880um. The depth of crack penetration in the electroplated steel was observed to be much less at 2m/min than at the higher welding speed, typical crack depths of 50 to 150pm being noted.
(b) Intermediate Susceptibility to Cracking
This group included iron-zinc alloy, zinc - 5% Al and lead-tin coated steels. With these steels, no cracks were observed until the applied current was close to the splash limit. When cracking occurred, the depth of penetration of the cracks was generally in the region of 50 to 100pm. However, at a welding speed of 6m/min, isolated large cracks were observed which penetrated up to 400pm into the sheet thickness which corresponded to half of the sheet thickness.
- 2 4 -
(c) Low Susceptibility to Cracking
This group which included aluminium and zinc - 55% Al coated steels, exhibited no significant cracking in the samples examined.
Metallographic examination indicated that cracking was associated with intergranular penetration of a copper or brass coloured phase along the grain boundaries. The distribution and appearance of these cracks in the case of hot dipped zinc coated steel are shown in Fig.41. Plane sections revealed a large number of the cracks and intergranular networks of brass in the heat-affected zone region, Fig. 11. (a). The cracks were oriented in a direction which was e i ther perpendicular to the weld seam or approximately at an angle of 45° to the weld seam. In severe cases, the cracks propagated across the full width of the weld, see top of Fig.41(a). Longidudinal surface cracking could also be observed along the centre of the weld, Fig.41(b). Sections polished into the edge of the weld showed that the brass had penetrated well below the surface, Fig.41(c).
Electron probe micro analysis indicated that the intergranular network in both the hot dipped zinc coated steel, Fig.42, and iron-zinc alloy coated steel, corresponded to a brass composition although the brass differed in each case. This brass arose from a reaction between the coating and the copper electrode. In the case of the lead-tin coated steel, the alloy phase formed was essentially copper with small amounts of lead and tin. The cracks in the case of the Zn-5% Al coated steel were extremely fine and were filled with a brass type alloy. In one instance, the fine networks had opened up and allowed liquid from the surface to fill the resultant crevice. Solidification of this liquid resulted in a concentration of an aluminium rich phase at the extremities of this back-filled region.
5.3.2. Mechanism of Crack Formation
Intergranular penetration of copper into steel is well known, typical examples being brazing cracks and, under certain conditions, hot shortness in mild steel'9"15 '. Similar effects have been observed in spot welding (16> and seam welding (17) of zinc and lead coated steels. For intergranular penetration to occur, the copper or copper alloys must first be in a liquid form on the surface of the steel. It has been shown (17) that in seam welding, the degree of penetration of the liquid phase is influenced by the amount of heat generated, i.e. the welding current and also, the degree of stress applied to the weld seam. The intergranular copper networks are generally orientated normal to the principal strain.
It has been suggested that intergranular attack occurs in three stages:-
i) Rapid attack of the base metal grain boundaries by copper atoms ii) A decrease in the grain boundary cohesive strength resulting in the formation of hot cracks
in the strain field iii) The backfilling of these cracks by liquid metal providing favourable interfacial energies
exist
Grain boundary penetration occurs when the interfacial surface energies are favourable to grain boundary wetting. The term wetting has been defined as "a phenomenon involving a solid and liquid in such intimate contact that the adhesive force between the two phases is greater than the cohesive force within the liquid". A measure of the tendency for wetting is gained from the dihedral angle which is a characteristic of a liquid phase when it meets two crystals of another phase, Fig.43. When the interfacial energy of the liquid phase is less than one-half the grain boundary interfacial energy, the dihedral angle is zero and the liquid phase tends to establish itself continuously along the grain boundary '12>. The extent to which a liquid phase penetrates along a grain boundary increases as the dihedral angle decreases'9 ' .
The dihedral angle between copper and mild steel attains a minimum value at the melting point of copper'10 ' . Further, it has been shown that the solid solubility of copper in mild steel attains its lowest value at 1100-1150°C. These two factors combined can account for the many experimental observations which have indicated that, the extent of penetration of liquid copper into mild steel is a maximum at a temperature slightly above the melting point of copper. It has also been shown that steel in the austenite condition is more susceptible to copper penetration'1 L12 '. With coated steels, alloy formation occurs between the coating and the copper electrode wheel and this will alter the composition of the
25
interpenatrative network. However, the basic mechanisms outlined above will still apply under these circumstances.
In the present work, the tendency for crack formation varied with the coating type. Cracking occurred at lower welding currents in the case of the hot-dipped and electroplated zinc coated steel compared to the other coatings, the highest propensity of cracks being observed with the thicker hot dipped coating. In the case of iron-zinc alloy, zinc-5% Al and lead-tin coated steels, cracking occurred at much higher welding currents, these in general being near the splash limit. No obvious cracking was observed when welding the aluminium and zinc - 55% Al coated steels .
The exact mechanism of crack formation in the different steels is not known, however, a number of factors which may contribute to the above results are discussed below. One of the factors which can account for the "cracking order" outlined above is the extent of alloying which occurs between the coating and the electrode and, the properties of the alloy so formed. During welding, the coating is picked-up by the welding electrode and forms an alloy at the surface of the electrode. In addition, some copper diffuses from the welding electrode to the surface of the sheet being welded and alloys with the coating. The exact mechanism of transfer is, at this stage, not fully defined but the final outcome of the phenomena is that a copper alloy is present on the surface of the weld.
In the case of zinc coatings, alloy formation with the copper electrode results in a series of complex brass type alloys of relatively low melting point, e.g. 60 Cu/40Zn has a melting point of 900°C compared to 1085° for pure copper. Consequently, intergranular liquid penetration can occur at lower temperatures than if pure copper was on the surface of the weld. This, therefore, results in cracking occurring at relatively low welding currents.
With lead-tin coated steel, the lead and copper does not alloy to any extent and the electron probe microanalysis indicated that, the alloy formed contained only small amounts of lead and tin with copper as the major constituent in the intergranular network. The melting point of this alloy would probably be much higher than 60/40 brass and would approach that of pure copper. Thus in the case of lead-tin coatings, higher surface temperatures can be tolerated before the surface alloy becomes liquid. This results in a wider available current range. Although the melting temperature of the surface alloy must play a part in the tendency for cracking, other factors must also be involved. In the case of the Zn-5% Al and Zn-55%A1 coatings, obvious "brassing" was evident on the surface of welds produced towards the top end of the welding range, however, there appeared to be little, if any, penetration of the bronze. The absence of bronze penetration must in this case be related to the particular properties of the bronze formed relative to the brass observed with other coating types or, to the presence of some penetration barrier. One possible factor which may inhibit penetration is the presence of interfacial alloys between the coating and the steel base. With electroplated zinc there is no alloy layer in the coating and with hot dipped zinc and lead-tin coatings, the interfacial alloy occupies less than 5% of the total coating thickness. Hence the thickness of the interfacial alloy is approximately 15% and 40% in the case of Zn-55% Al and Aludip respectively. It is considered that further work is required to determine the influence of the surface liquid alloy and the interfacial coating/steel alloy on intergranular penetration and crack formation before final conclusions can be drawn regarding the mechanism of cracking in seam welds.
6. MONITORING OF THE SEAM WELDING PROCESS
Any resistance welding process involves complex interactions between material characteristics and thermal, mechanical and electro-magnetic phenomena. Whilst there exists a good understanding of the interaction between these criteria for the spot welding process, very little effort has been devoted to determining similar information for the seam welding process. For spot welding, many physical aspects of the process of weld formation have been investigated in an attempt to determine which parameter contains most information which can be related to weld quality.
In such work, an essential criterion which must be satisfied is that the parameters measured must reflect as closely as possible the physical changes which take place during weld formation and growth. Of the many parameters investigated in the case of spot welding, the following were considered to be most applicable to the seam welding process:-
1. Welding current/voltage 2. Electrode force

26 -
3. Electrode displacement 4. Dynamic resistance
These parameters were therefore measured during the actual welding process using the techniques summarised in Section 3.5.
6.1. Welding Current
Welds were made at current levels corresponding to the minimum and maximum welding condition and mid-way between these conditions as depicted in the appropriate weldability lobe. A typical current recording is shown in Fig.44. Similar current profiles were obtained for all the welding configurations. The signals obtained were observed to be extremely clean and were considered to be representative of what would be expected in that, they show a modified sine wave corresponding with the use of phase shift control. It was observed that, the current level was fairly consistent along the weld length. Other features observed included:-
a) An upslope effect of the current over the first 8-10 cycles of current flow, this effect being more pronounced over the first 1-2 cycles.
b) When using a dual speed and current programme there was a lag between the change in current and the change in speed, this being due to the mechanical inertia of the welding machine. This affect was overcome by delaying the point at which the current was changed relative to when the speed was changed. When the speed was increased at a constant phase shift setting, the amount of current flowing decreased because of the higher resistance path between the welding electrodes.
6.2. Voltage between the Welding Electrodes
While the voltage drop across the welding electrodes was measured in all cases, the main purpose of the measurement was in its use to calculate dynamic resistance. However, some observations can be made from the voltage measurement itself. . For example, the voltage traces recorded showed spikes, Fig.44, possibly due to the effect of impedance or phase shift, and the height of the voltage peaks varied slightly along the weld length. As expected in situations where there is an impendance component, the voltage was slightly out of phase with the current and led the current.
6.3. Electrode Force
The results indicated that the force acting through the electrode wheels increased gradually to the preset value when the welding electrodes came into contact with the sheets being welded. It was noted that when the wheels began to rotate, there was an increase in the electrode force. This initial increase in force was found to correspond to the point of commencement of electrode rotation and not the onset of current flow.
With AC welding, the electrode force trace exhibited a cyclical variation of 100Hz, i.e. a peak corresponding to each half cycle of current, Fig.45. This effect was present even when passing current with only electrode/electrode contact, i.e. with no sheets between the electrode wheels. As expected, in the case of DC welding, a steady state condition of electrode force was obtained. It is considered that this cyclical variation in load can be attributed to a variation in the electro-magnetic attraction induced between the upper and lower welding arm as a consequence of the applied alternating current. Another factor which causes load fluctuations is the pulsing effect of nugget growth due to the sinusoidal characteristics of the AC current waveform. Similar trends were observed with both high strength steels and coated steels. The results indicated that, while the electrode force level necessary to produce a satisfactory weld was influenced by material properties, the force pa t t e rn dur ing welding was predominantly a function of machine and current characteristics. Any force which tends to separate the electrode wheels will result in an increase in the force recorded in any machine where the welding head cannot react quickly enough to the expansion forces. This effect would be more pronounced with a rigid welding machine as was the case in the present investigation.

- 27
6.4. Electrode Displacement
It has been established, in the case of spot welding, that a close linear relationship exists between weld nugget size and the magnitude of displacement of the movable head of the electrode assembly in relation to the fixed electrode. In order to develop an understanding of weld growth in seam welding, tests were carried out during roller spot welding and seam welding using interrupted and continuous welding current programmes. The former was included to give an intermediate stage between spot welding and continuous seam welding.
It may be summarised that the amount of head movement at any welding speed depended on the welding current and generally showed slight indentation by the welding electrodes at the minimum current condition. A pronounced convexity of the weld seam was observed at the maximum current condition. The maximum degree of expansion tended to decrease as the welding speed increased. These results can be explained in terms of the number of welds made per centimetre of weld length, the manner in which the weld formation occurs and, the characteristics of the head assembly of the welding machine used.
In the case of roller spot welding, a significant movement of the electrodes away from each other was observed corresponding to each weld, Fig.46. This movement corresponded to the expansion of the weld nugget during the heating cycle. This expansion continued until current flow ceased at which point, the electrodes moved towards each other as a consequence of contraction effects associated with the cooling cycle.
Similar trends were observed using a pulsation or interrupted current programme corresponding to 3 cycles on/ 2 cycles off, Fig.46. However, when using a 2 cycles on/ 2 cycles off current programme, the amount of electrode displacement was minimal and did not follow the formation of each weld nugget. This latter result was similar to that observed when using a continuous welding programme.
An interrupted current programme of 3 cycles on/ 2 cycles off produced a weld nugget every 5 cycles which at a welding speed of 2m/min coresponds to three welds/cm. At this frequency of weld formation, the welding head oscillated as each weld nugget was formed reflecting both the expansion and the contraction. With an interrupted current programme of 2 cycles on/ 2 cycles off a weld nugget is produced every 4 cycles, which, at a welding speed of 2m/min, corresponds to 3.75 welds/cm. At this frequency of weld formation, very little movement was detected in the welding head. These results suggest that, this frequency of weld formation was above the resonant frequency of the large mass associated with the welding head and also, its inherent rigidity.
Electrode displacement traces obtained with a continuous current programme indicated that when the welding current was initiated there was a corresponding movement on the electrode head assembly. With a continuous current programme no movement of the electrode head was detected after the initial period. With this current programme weld nuggets are formed at 30 welds/cm when welding at a speed of 2m/min. In this case the weld is formed by an extension of the molten nugget rather than in the form of discrete separate nugget formation, see Section 7. Under these conditions, the region under the electrode wheels remains relatively constant with respect to the volume of liquid present. This will result in very little movement of the welding head. Therefore, when using continuous current, the relatively smooth electrode movement trace can be attributed to two factors:-
1) The basic stiffness of the welding head preventing oscillation at 100 Hz. 2) The fairly constant volume of liquid which forms under the electrode wheels once a steady
state is reached.
6.5. Dynamic Resistance
Of the various physical parameters which have been used to study weld formation in resistance welding, most attention has been given to the measurement of dynamic resistance. A relatively good correlation has been obtained between weld size and dynamic resistance when welding uncoated mild steel to the extent that a large number of monitoring and feedback control systems have been developed which allow control of weld quality. In this context, the dynamic resistance curve has been found to be of real and practical value in giving an understanding of the weld process. Numerous investigators have shown that the dynamic resistance curve can be modified by changes in welding variables such as surface condition,

28 -
electrode force, fit-up, material type and most other external factors which influence weld quality. However very little information exists in the case of seam welding.
The relationship between weld resistance and weld time follows a characteristic curve when spot welding uncoated mild steel. The resistance decreases during the first one or two cycles of current flow and then increases to a maximum after which it decreases in a gradual manner for the remainder of the weld period. The initial drop in resistance is the result of the loss of contact resistance at the electrode/sheet and sheet/sheet interfaces and the subsequent increase in resistance, can be attributed to the increase in resistivity of the base material due to heating of the sheets being welded. Subsequent decreases in the resistance are due to electrode indentation and the extent of weld growth.
In order to determine whether similar trends are obtained in seam welding, dynamic resistance measurements were made corresponding to various stages in the formation of a continuous weld seam. This extended from roller spot welding and interrupted cur rent programmes, where discrete and seperated weld nuggets are formed, to the case of a continuous weld seam based on overlapping weld nuggets.
6.5.1. Influence of Current Programme
(a) Roller - Spot Welding. Roller spot welding at a speed of 2m/min resulted in resistance curves which corresponded to individual welds and in this respect, the dynamic resistance curves were similar to those obtained as for spot welding, Fig.47, i.e. a sudden increase to a peak value followed by a gradual reduction in the resistance value. The absence of the initial decrease, which has been postulated in previous work on spot welding, is considered to result from the fact that such a drop in resistance occurs before the first half cycle current peak, i.e. before the first calculated value of dynamic resistance. Increasing the welding speed, to between 6/min and 10m/min resulted in dynamic resistance curves which showed two or three peaks respectively, Figs. 48 and 49. These peaks corresponded to the two and three separate heat regions developed at this welding condition, Fig.25.
(b) Interrupted Current Programmes - The dynamic resistance curves obtained using a 3 cycles on/ 2 cycles off current programme at different welding speeds and current levels are shown in Fig. 50. As for roller spot welding, the flat regions corresponded to the current off period, with the resistance value corresponding to the final value reached from the previous current-on period. The resistance during each current-on period increased to a peak value and then decreased. In some circumstances, for example a t a low speed/high current welding condition, the resistance was observed to decrease progressively with each half cycle of current.
The peak values of resistance were observed to be similar at the different current levels and welding speeds investigated. In addition, at any welding speed, the final resistance value attained was observed to decrease as the current increased. The results showed that at the minimum welding condition, the final resistance values at ta ined were independent of welding speed. However, at the maximum welding current, the final resistance value was observed to increase significantly as the welding speed was increased.
(c) Continuous Current Programme - With a continuous current programme, the dynamic resistance curve exhibited an initial peak or peaks then dropped to a steady-state value, Fig.51.
In order to understand the resistance curves obtained, the factors affecting the peak and the steady-state level of resistance were determined.
6.5.2. Factors Influencing the Initial Peak
It was observed, that the initial resistance peak depended on steel thickness, welding current and welding speed. For example, with a 0.6mm steel, the resistance dropped more rapidly from the peak value to the steady state value (after 5 cycles of current) compared to a 1.2mm mild steel where the resistance drop was spread over 10 cycles of current flow, Fig. 52. It can be seen from Fig.52, that a high peak resistance resulted in a slightly lower level of current.
- 29 -
The steady state level of resistance decreased as the welding current was increased, thereby giving rise to a more obvious peak. This peak was less obvious as the welding speed was increased which was attributed to the fact that the resistance did not decrease to the same extent. At a welding speed of 2m/min, the maximum resistance was attained in the first peak whereas, at higher welding speeds, the various secondary peaks were similar and equated to the initial peak resistance.
6.5.3. Factors Influencing the Steady-State Condition
The steady state resistance level was observed to be influenced by the extent of weld formation, the welding parameters used, and the process used. This finding is considered to be important because, if the steady state resistance can be related to weld formation then it is possible that it could be used as a basis for monitoring weld quality. The trends observed in the current investigation may be summarised as follows:-
(a) Welding current - as the welding current was increased from the continuous weld limit to the splash limit, the steady state resistance value was observed to decrease progressively, Fig.53. In addition, if the welding current was increased along the length of a weld seam by approximately 100%, by means of upslope, the steady state resistance decreased by 50%.
It was noted that in addition to the current affecting the value of resistance measured, the resistance itself also controlled the current level drawn from the transformer this being explained in terms of the interactive effects of Ohms Law.
(b) Welding Speed - It was observed that when the welding speed was increased from 2m/min to 6m/min, a t the same phase shift setting when welding a 0.75mm mild steel, the steady state resistance increased by 25% and the current level dropped by 10%. This results in a lower heat input and therefore, in a smaller weld and a smaller current path. Consequently, the resistance in the circuit is increased while the amount of current flowing is decreased.
It was observed that, as the welding speed was increased, the steady state resistance level at the minimum current which resulted in a continuous weld seam decreased slightly. At the maximum permissible current, i.e. corresponding to the splash level, it was observed that, as the welding speed was increased the steady state resistance also increased, Fig. 54.
(c) Electrode Force - As the electrode force was increased, the steady state resistance was observed to decrease independent of welding current, see Table 20.
(d) Steel Thickness - The influence of steel thickness was such that , at welding currents corresponding to continuous weld formation, the steady state level of resistance was independent of sheet thickness between 0.7mm and 1.4mm. At the maximum current, i.e.
I corresponding to the splash level, the steady s ta te resistance increased as the sheet thickness was increased.
(e) Steel Composition/Resistivity - Steel composition/resistivity had li t t le influence on the steady state resistance at either the minimum or the maximum welding currents, see Fig.54 and Table 21.
(0 Narrow vs. Wide Seam - The steady-state resistance level was much higher in the case of narrow seam welding compared to wide seam welding, over the ent ire current range investigated, Table 22. The increase in the steady-state resistance, with narrow compared to wide seam welding was on average, 55% for AC welding and 88% for DC welding at the minimum welding current. This is considered to result from differences in tread width, i.e. the narrow seam has a smaller effective area for current flow and consequently, a higher resistance.
(g) AC vs. DC Current - The steady-state resistance was lower in the case of DC welding compared to AC welding, Table 22. This feature was more obvious in wide seam welding. With DC welding, the steady-state resistance showed more obvious fluctuations along the length of the seam, Fig.51. These fluctuations were more pronounced as the degree of current ripple increased. This effect may be due to the higher sampling rates which were
30
used when measuring dynamic resistance in the case of DC welding. Therefore the curves obtained may reflect more accurately the changes in resistance.
7. METALLOGRAPHIC STUDY OF WELD FORMATION
7.1. Uncoated Steels
Metallographic examination of selected welds was carried out in order to give an understanding of weld nugget formation and its growth. In addition, the factors limiting the maximum welding speed were considered.
It is general practice to use a nital etch to delineate the structure of resistance welds. Whilst this is true of spot welds, examination of seam welds in the current investigation indicated that, a l though directionality of the columner structures in the weld region could be delineated, the structure of the weld nugget itself was not clearly defined, Fig.55(a). This was considered to be due partly to differences in the thermal cycles between spot and seam welding and, because a nital etch is primarily used to reveal transformation products rather than solidification structures. At high magnifications, Fig. 55(b) it can be seen that the weld structure consisted of AC (ferrite with aligned carbides) and FC (ferrite with carbide aggregates) structures. These structures are similar to those obtained in spot welds produced in low carbon mild steel*18*.
In order to determine the structures associated with weld growth, it was considered necessary to delineate the weld nugget more clearly and therefore, tests were carried out using a number of etchants. The most suitable etchant was found to be a saturated solution of picric acid which gave a clearly defined weld nugget and showed the general solidification structure. Consequently, a picric acid etch was used for most of the work carried out.
Metallographic examination was concentrated on investigating the following:
1) Weld nugget structures 2) Weld formation at the start of the weld 3) Distribution of current flow in the weld zone 4) Influence of welding/material parameters on weld formation
7.1.1. Weld Nugget Structures
The structures developed in the weld nugget were determined from examination of transverse sections taken from welds chosen to highlight particular effects. A particular feature which was revealed was the presence of concentric bands within the weld structure, Fig. 56(a). Such bands were only pronounced in welds made using an AC welding current particularly at high levels of current phase shift, i.e. low heat potentiometer sett ings. A typical weld structure obtained when using a DC welding current , is illustrated in Fig.56(b). In this case, the directionality of the solidification structure continued uninterrupted from the perimeter to the centre of the weld nugget.
Because of the apparent relationship between the formation of these "bands" and the welding conditions used to make the weld seam , it was considered that a detailed study of "band" formation would give an insight into the pattern of weld nugget formation.
The general characterist ics of these bands was revealed by etching to various depths and using defocussing optical techniques in order to highlight the various features associated with the bands. Light etching of the samples revealed heavy dark lines which it is considered corresponded to the initial columner grain boundaries. These grain boundaries contained non-metallic inclusions, which were shown by SEM studies to be rich in manganese and sulphur. Deep-etching the samples revealed dark bands in the weld nugget which were made up of diffuse linear features. The bands were separated from each other by light etching regions, Fig.56. At a higher magnification, with a fully open light aperture, the carbide structure of the weld was revealed, Fig.57. The bands which were easily seen at low magnification were only evident at high magnification if a small light aperture setting was used and the sample defocused slightly. It can be seen from Fig. 57, that, the diffuse linear structure observed at low magnifications corresponded to lines of dark circular areas which, were oriented along the the same crystallographic plane within grain boundaries delineated by the dark-etching streaks. Detailed S.E.M. examination revealed that the circular areas corresponded to very fine etch-pits. It is considered that
- 31
these lines of etch pits were probably associated with a form of coring which occurred during the normal process of dendritic solidification growth in the molten weld pool.
Pronounced banding was observed, in welds made in the 0.6mm mild steel, at all phase shift levels, i.e. firing angles between a maximum of 108° and 0° (corresponding to current conduction of 40% and 100% of the full half wave). In the case of the 1.2mm thick mild steel, welds made with full wave conduction were virtually free of banding. Decreasing the length of current conduction resulted in a progressive development of banding until at a heat setting corresponding to 40% conduction banding was quite pronounced. In order to understand further, the conditions under which these bands were formed, the structure of weld nuggets produced using interrupted current programmes were determined and compared to weld nuggets produced by spot welding. In the case of a 0.6mm thick mild steel welded using a current programme of 2 cycles on/ 1 cycle off, a coarse banded structure was observed, Fig.58. In this figure, the light etching region corresponds to the period in which a rapid cooling rate prevailed, i.e. when no current flowed during the off period. It was observed that weld bands were readily produced in spot welds by using a dual pulse welding schedule. For example, a weld made with 6 cycles of "high current" (6.5kA) followed by a further 6 cycles at a "low current" (4kA) contained well developed bands as compared to the continuous structure obtained with a single impulse weld, Fig.59.
The influence of steel composition on the banding phenomenon was examined by producing welds in dual phase and rephosphorised steels. In the case of the dual phase steel, the coring within the weld bands was very pronounced, probably due to the higher alloy content. Welds made in a rephosphorised steel, when etched in Oberhoffers reagent, contained light etching s treaks within the weld bands which were indicative of segregation of phosphorus within these regions.
From these results, it can be concluded that the banding was the result of differences in the solute distribution/concentration resulting from fluctuations in the weld cooling rate which in turn, were related to the cyclical nature of the AC welding current. Further, it can be concluded that, the presence of the bands indicated that welding current passed through the liquid nugget as it solidified and the number of weld bands indicated the number of half cycles of current over which the weld solidified. Knowing the welding speed, the actual distance over which the weld solidified, can be easily calculated.
It was considered that an examination of the pattern of bands should allow a better understanding of weld formation by indicating the number of weld cycles and hence the time over which the weld pool remained molten. Transverse longitudinal and planar sections of narrow seam welds were therefore produced using a welding current chosen from the middle of the available current range at welding speeds of 2, 6 and 16m/min as indicated in the appropriate weldability lobes. Examination of longitudinal and planar sections, Fig. 60, indicated that the bands, as shown in the transverse section, corresponded to steps in the solidification front of the chevron-shaped molten pool. It was evident that, the shape of the molten weld pool became more elongated as the welding speed was increased from 2 to 6m/min. Examination of these sections at higher magnification indicated tha t the solidification pat tern was such as to result in columnar growth of the dendrites. This type of growth pattern predominated up to the final stages of solidification. The last portion to solidify was observed to be made up of small equiaxed grains. At a welding speed of 6m/min, overlapping of the weld nuggets had occurred whereas, at a welding speed of 16m/min the individual weld nuggets were separated although, heat spread along the weld had created a continuous weld. It may be noted that, wedge shaped weld nuggets have previously been observed in high speed welding of 0.2mm tinplate and in this case, the wedge shape was attributed to the spread of heat along the length of the weld seam*1).
It was noted that, although welds produced using a DC welding current generally showed no evidence of "bands", in some instances, very fine arrests in the solidification pattern were evident, particularly in the planar sections. The latter also showed that the solidification pattern in DC current welds also resulted in a chevron shaped molten weld pool. The fine arrests in solidification which occurred in the DC current welds were considered to result from the AC current ripple which was superimposed on the DC waveform as a natural characteristic of the haxaphase rectifier used to develop the current. The extent of this was more pronounced when phase shifted waveforms were used i.e. a low potentiometer setting to obtain low welding currents.
7.1.2. Weld Start Position
As previously shown, the dynamic resistance curve exhibited a peak at the start of the weld and then decreased within a few cycles of weld current flow to a steady-state value. To examine the conditions
32
appertaining to the first few cycles of welding, welds were produced with 1 cycle of current flow, 2 cycles of current flow etc. up to 25 cycles of current flow in the 1.2mm mild steel at a welding speed of 2m/min. A current level immediately below the splash limit was selected and both narrow and wide seam welds were produced.
Metallographie examination of welds indicated that, no weld or bonding had occurred after 1 cycle of current flow and that weld development commenced during the 2nd, 3rd and 4th cycles of current flow as shown in Fig. 61. After 2 cycles of current flow, some areas of solid phase bonding were evident whereas, at 3 cycles of current flow, a high temperature "mushy" region had developed. The development of a full weld nugget occurred after 4 cycles of current flow. It was noted that as the number of cycles increased, the trailing edge of the weld nugget became more tapered and the length of the high temperature "mushy" zone increased, Fig. 62. In addition, the extent of the region exhibiting some solid phase bonding increased.
It was concluded that:-
(i) No bonding occurred during the first full cycle of weld current flow. (ii) Solid phase bonds occurred over the whole contact area (~8mm) between one and two cycles of
current flow, (iii) At three cycles of current flow, a high temperature "mushy" zone had formed, (iv) A large weld nugget was formed between three and four cycles, (v) A high temperature "mushy" zone was formed behind the weld nugget after aproximately
ten cycles and the length of this region was on average 0.6mm. (vi) A region of solid phase bonding existed behind the weld nuggefmushy region, the length of
which increased until approximately ten cycles of welding current had flowed after which, the length of this zone was approximately 3mm.
(vii) A bond was formed over the entire contact area (~8mm) during the initial few cycles of welding current thereafter, each half cycle of weld current formed on average a length of approximately 0.33mm of weld at a welding speed of 2m/min.
(viii) Although no weld nugget was formed at the initial weld site during the first few cycles of current flow, in the final weld seam this region ended up with the largest weld nugget. This was due to the heat generated in this area as a result of shunting of the welding current back through the partly welded areas.
It can be concluded that the initial high value of resistance measured is due to the fact that no bond had been formed, and therefore, there was no available low resistance path for current flow. The reduction in the resistance after the initial peak had been reached, can be attributed to the increase in the length of the weld nugget coupled with the increase in the length of the mushy zone and solid phase region behind the weld nugget. It was noted that the length of the mushy zone and solid phase region increased until approximately ten cycles of current flow which corresponded to the number of cycles over which the dynamic resistance decreased, Fig. 52(b).
The formation of secondary resistance peaks appeared to be related to shunting of the current through the initial path as indicated by the high volume of liquid metal formed at this position. This continued until a stage was reached when the length of the current path became too great thereby, causing some of the current to pass through the region behind the original weld nugget. It is considered therefore, that the secondary resistance peak corresponded to a low heat region behind the original weld nugget.
As the welding speed increased, the initial resistance peak fell to a steady-state value after fewer cycles of current flow. This can be attributed to the fact that, in terms of shunting, the distance over which the current passes is more important than the number of cycles of current flow per se. For example, at a welding speed of 2m/min, a 5mm weld length corresponded to fifteen half cycles whereas at 10m/min, a 5mm length corresponded to three half cycles of current flow. Consequently, it is to be expected that the number of cycles over which the resistance falls will decrease as the welding speed is increased.
Although no weld nugget was formed with the 1.2mm thick steel until after three or four cycles of current flow, with the 0.6mm thick mild steel and using a current set below the maximum, a large weld nugget was formed after one cycle of current flow. This may account to some extent why the steady-state resistance was reached sooner with the thinner steel. The observation that a larger number of cycles was required to form a weld nugget in the thicker steel may be due to the fact that with the greater mass of the steel, the amount of heat abstration was larger. In addition, the greater spread of current which occurs in
33
the thicker steel, must influence weld formation. Typical heat patterns observed in the transverse and longitudinal direction after 1 cycle of current flow are shown for the 1.2 and 0.6mm thick steel in Fig.63. The width of contact of the electrodes was similar in both instances, however, the width of the heat-affected region at the faying surfaces was approximately 25% greater with the thicker steel.
Similar trends were noted for wide seam welds in 1.2mm thick steel, i.e no weld nugget was formed until the fourth cycle of welding current. It was also noted that the length of the weld nugget formed was less in the case of wide seam welding as compared to narrow seam welding, i.e. 4.3mm compared to 7.2mm.
7.1.3. Distribution of Current Flow in the Weld Zone
The limiting speed in seam welding can be related to the increased rate of weld growth which occurs through the sheet thickness as the welding speed is increased thereby, resulting in weld splash through the surface of the weld seam. Previous work (5) indicated that the welding current flowed more towards the exit side of the welding electrodes as the welding speed was increased. This could account for the increased weld growth in the vertical or through thickness direction. In order to improve the understanding of current flow in seam welding, the heat pattern between the welding electrode was examined by switching off the current flow during the welding operation. Metallographic sections were then taken from regions corresponding to the part of the weld where the current had been switched off.
Welds were produced in 1.2mm mild steel using a welding current chosen immediately below the splash limit. The heat patterns developed between the electrode wheels at welding speeds of 2,6 and 10m/min are shown in Fig. 64. It can be seen that, as the welding speed was increased, the welding current path moved from the entry side at the electrode/sheet interface to the exit side at the sheet/sheet interface. Also, the amount of indentation and the arc of contact of the welding electrode decreased as the welding speed was increased. The distance between nugget formation and the point of exit from the arc of contact of the welding electrode was observed to decrease as the welding speed increased thereby, giving less time for heat abstraction.
The shift in the current path towards the exit side as the welding speed is increased is likely to be influenced by shunting effects. Examination of sections taken from welds produced with one cycle of current flow at welding speeds of 2, 6 and 10m/min showed that the current tended to flow from the entry side to the exit side. This effect was more pronounced as the welding speed was increased. It has been highlighted in Section 7.2, that four cycles of welding current were required to produce a weld nugget, at a welding speed of 2m/min, even at welding currents immediately below splash. It is considered that the shift in the current path towards the exit side of the welding electrodes, was due to the shunting effects through the region of low resistance created during the first few half cycles. At low welding speeds, the distance between half cycle peaks was small, i.e. 0.33mm at a welding speed of 2m/min. However, at a speed of 10m/min, the distance between half cycle peaks is much longer, i.e. 1.67mm, and therefore the flow of current towards the exit side was more pronounced at the higher speeds.
The small individual heat-affected regions observed near the surface of welds made at a speed of 6m/min, Fig.64, were spaced at distances corresponding to each half cycle peak of current flow. The presence of individual half cycle pulses near the entry side suggested that a large proportion of the current entered the weld zone towards the entry side of the welding electrodes. This may be attributed to the fact that, the temperature between the welding electrode and the sheet surface increased from the entry to the exit side of the welding electrodes and also, the effective force was higher near the entry side. Both these factors act to reduce the resistance near the entry side at the electrode/sheet interface.
It may be summarised that in 1.2mm thick mild steel, the highest current concentration entered the weld seams nearer the entry side and because of shunting effects passed through the faying surface towards the exit side. This effect became more pronounced as the welding speed was increased.
In the case of welds in 0.6mm mild steel, examination of the heat pattern generated between the welding electrodes showed no evidence to suggest that current flowed from the entry side at the electrode/sheet interface towards the exit side at the sheet/sheet interface at welding speeds up to 14m/min. However, at this speed the current was observed to flow towards the exit side. The concentration of current at the faying surface caused weld formation at an earlier stage, at a thickness of 0.6mm than at 1.2mm and therefore, the extent to which the current flowed towards the exit side of the welding electrode, was much reduced in the case of the thinner steel . However, even with the thinner steel, the distance over which

34
shunting of the current occurred increased as the welding speed was increased. At high welding speeds ~14m/min and above, the individual weld nuggets separated and the flow towards the exit side became more pronounced.
7.1.4. Influence of Welding/Material Parameters
It was observed that.in general, weld splash occurred through the surface of the weld seam, and tended to be a limiting factor in terms of welding speed. Therefore, the effect of the different welding and material parameters on the aspect ratio, i.e. the ratio of nugget penetration to weld width, was investigated. Account was also taken of the number of weld bands to give a measure of solidification conditions/distance in this evaluation.
7.1.4.1. Narrow Seam Welds
The effect of increasing the welding current was determined from welds produced in a 0.6mm mild steel at a welding speed of 6m/min using an AC welding current. It was observed that as the welding current was increased, the aspect ratio of the weld nugget decreased only slightly. However, the size of the weld nugget and the distance over which it solidified increased progressively as indicated by the number of bands in the weld nugget, Fig.65. At the minimum current level used, it was calculated that the weld nugget had solidified over a length of approximately 2mm while, at the maximum current level, the weld nugget solidified over a length of approximately 15mm.
As the welding speed was increased from 2m/min to 12m/min at a constant electrode force and weld current, the aspect ratio of the weld nugget increased progressively from 0.24 to 0.88, see Fig.66. This can be attributed to the different lengths over which the weld nugget solidified, for example, at a welding speed of 2m/min, the nugget solidified over a length of approximately 2mm whereas at higher speeds, the solidification distance was much larger, i.e. 5 to 7mm.
Electrode force is an important parameter in controlling the heat input during welding and its effect, on weld geometry, was examined using a 1.2mm mild steel narrow seam welded with an AC current at 6m/min. When the electrode force was increased by 50%, i.e. from 4kN to 6kN, the aspect ratio of the weld nugget was decreased by approximately 25%, Fig.67. Therefore, increasing the electrode force had a similar effect on nugget geometry as reducing the welding speed.
In terms of thickness alone, a comparison of Figs. 65 and 67 indicated that an increase in steel thickness of 100%, i.e. from 0.6mm to 1.2mm, resulted in an increase of 70% in the nugget aspect ratio, i.e. from 0.5 to 0.86.
Both the heat input and the rate of heating during welding are markedly influenced by the resistivity of the base steel. From a comparison of welds made in a 1.2mm mild steel (low resistivity) and a dual phase steel (high resistivity), it was noted that a higher aspect ratio, i.e. 1.15 compared to 0.84, Fig.68, was obtained with the dual phase steel when using the same welding conditions.
The nugget geometry, as defined by the aspect ratio, was observed to be similar for welds produced using either an AC or DC welding current in a 1.2mm mild steel narrow seam welded at 6m/min see Fig.69. It can also be seen that, although the aspect ratios were similar, weld splash occurred at a smaller weld nugget size in DC welding. With an AC current, growth of the weld nugget caused severe bulging before eventually breaking through the sheet surface. With DC welding the weld nugget broke through the surface when the weld size was relatively small i.e. before pronounced bulging was noted. This effect was also observed in a 0.6mm mild steel welded with DC current at a speed of 16m/min, Fig.70. A "high temperature tunnel" was created at the centre of the contact width in the case of DC welding. It is considered that this high temperture region would possess a lower strength and is therefore, less able to contain the molten nugget. Consequently, weld splash through the surface would occur earlier with DC current in most situations.
7.1.4.2. Wide Seam Welds
The bands observed in narow seam welds were also visible in wide seam welds produced at a welding speed of 2m/min. However, at a welding speed of 6m/min, the solidification structure did not exhibit bands or any pronounced directionality. Increasing the welding speed also resulted in an increase in the aspect ratio which in wide seam welding was generally in the range 0.1 to 0.3.

- 35
Increasing the welding current at a welding speed of 2m/min, resulted in an increase in the number of weld bands, with up to twenty three bands being observed. The latter, it was calculated, corresponded to a solidification distance of approximately 8mm along the weld seam.
As in the case of narrow seam welding, the aspect ratio and the solidification structure of the weld nuggets were similar in welds produced with either an AC or DC welding current.
It was observed that the maximum welding current was limited by the onset of liquid expulsion through the surface of the weld seam for both AC and DC currents. In welds made using an AC current, pronounced bulging occurred before weld splash whereas, in the case of welds made with a DC current, splash occurred before pronounced bulging of the weld seam.
7.1.4.3. Mash Welds
Examination of transverse sections indicated that, as the welding speed increased, the weld nugget rotated from the horizontal plane to a position lying along the inclined weld interface, Fig.71. These results indicated that at low welding speeds, melting was concentrated at the mid-thickness position and was therefore contained by the surrounding solid metal and the solid phase bonds which formed at the edges of the faying surface. On the other hand, at high welding speeds, i.e. >14m/min, melting occurred along the inclined interface. Therefore, at these speeds the area of solid phase bonding available to contain the molten liquid at its point of formation was less. This allowed weld splash to occur more easily at the outer edges of the faying surfaces. The effect of this was to cause splash to occur at relatively lower welding currents thereby, leading to a reduction in the available welding current range at high welding speeds.
From previous work <19) on low speed mash welding, it was postulated that the weld nugget was developed at the mid-thickness of the section because plastic deformation or mash-down occurred prior to nugget development. To confirm this and, to examine the mechanism of weld formation at high welding speeds, a series of transverse sections were taken from the weld region corresponding to weld formation under the electrode wheels. The results, Fig.72, showed that significant plastic deformation or mash-down occurred before the first evidence of melting.
Examination of longitudinal sections of welds made using an AC current at welding speeds of less than 14m/min, showed that it was possible to eliminate the weld interface, whereas at speeds in excess of 14m/min, evidence of the original interface was noted at the area corresponding to the low/zero current region of each half cycle of current. In order to produce a continuous weld at a welding speed of 15m/min, it can be calculated that the heat developed during each half cycle of current flow must form a bond over a length of 2.5mm along the weld seam. However, the high welding currents necessary to enable adequate heat development along this length results in high peak currents which give rise to weld splash before the heat has effectively spread along the necessary length.
Surface defects were observed at high welding speeds with AC current. These were similar to "comma" defects previously observed with high speed welding of tinplate. These defects have been attributed^2* to melting near the surface of the seam which extends beyond the region of the arc of contact between the electrode and the sheets being welded. In the case of DC current, it was possible to achieve continuous weld formation along the entire length of the weld seam at speeds up to 22m/ min.
The solidification structure of welds in 0.6mm mild steel depended on the type of current used. With current levels close to the splash limit, the solidification structure of the nugget was diffuse in the case of AC current but exhibited a well defined outline with directional solidification in the case of DC current, Fig.73.
In general, it can be concluded that if either the welding speed or welding current was increased, the volume of molten metal formed outside the electrode arc of contact was also increased. Increased welding speed or reduced electrode force increased the rate of nugget growth in the vertical direction through the sheet thickness. If the bulk resistivity of the steel was increased an increase in the rate of nugget growth in the vertical direction was obtained. Compared to narrow seam welding, wide seam welding resulted in a greater volume of molten metal outside the electrode arc of contact. Further, the temperature gradient between the weld surface and the molten weld nugget was lower for DC welding. This caused liquid metal expulsion to occur in preference to the growth of a large weld nugget.

3 6 -
7.2. Coated Steels
In addition to examining the factors influencing weld cracking (see Section 5.3.), it was necessary to examine welds with a view of determining the relevance of the coating to weld formation. This work was confined to an examination of welds made by narrow seam welding techniques since it was asssumed that weld formation was similar for both this process and the wire welding process. It has been shown that, the the majority of the current entered the weld zone near the entry side of the electrode and as the welding speed increased, a greater proportion of the current flowed towards the exit side of the electrode.
Flow of current towards the exit side of the electrodes was considered to be related the number of cycles (i.e. the time) required to form the first weld and the distance travelled during this weld time at the different welding speeds. For example, when three cycles of current were required to form the first weld, the seam travelled forward 2mm and 10mm during this time at welding speeds of 2 and 10 m/min respectively. Therefore, at high welding speeds, the weld formation would be initiated more towards the exit side of the electrode arc of contact and consequently, the current would flow more towards this side.
Examination of welds produced by stopping the current flow after 1 cycle, 2 cycles, 3 cycles etc. showed that, a higher number of cycles of current flow was required to form a weld in the case of coated steels as compared to mild steel These welds were produced at a speed of 10m/min using current levels selected immediately below the splash limit. It was observed that, in the case of mild steel a weld was formed after 1 cycle of current flow, Fig.74.(a), whereas with electrolytic-zinc, iron-zinc alloy, aluminium and lead-tin coated steels, 2 cycles of current flow were necessary to form the weld, Fig. 74(b). In the case of the hot dipped zinc coated steel, a weld was formed after 3 cycles of current flow, Fig.74(c). This effect is to be expected in coated steels because of the lower contact resistance of these materials which reduces the heating effect for a given current level. In addition, a finite time is required to remove the coating from the weld interface. Consequently, during the first few cycles of current flow, the coating is squeezed out from the faying surface interface and weld formation occurs after the majority of the coating is dispersed from the interface. Since this requires a finite time, the onset of weld formation is delayed. Similar effects have been observed in spot welding (16,22).
Because a higher number of current cycles are required to form the initial weld in coated steels, it would be expected that the current would flow more towards the exit side of the weld zone in the case of the coated steels as compared to mild steel. This was confirmed from an examination of longitudinal sections taken from the region of weld formation under the electrode wheels (Figs. 75 and 76). However, there was little evidence to suggest that current flow occurred towards the exit side of the weld zone in the case of hot dipped zinc coated steel, Fig.77. In this case, part of the current flowed towards the exit side and part through current paths created ahead of the weld. This could result in a pulse-type effect along the length of the weld, i.e. the current would flow through the nugget towards the exit side A, then change to the path created near the entry side B. In the case of the iron-zinc alloy, the heat pattern under the electrode wheels was observed to be similar to that noted with mild steel. This may be attributed to the surface characteristics of the coating, i.e. high surface resistance and melting point relative to most of the other coatings.
8. GENERAL MODEL OF WELD FORMATION
In order to improve the general understanding of the seam welding process and; to determine the factors which limit the maximum welding speed attainable, it is desirable to develop a model of weld formation and weld growth. In addition, the factors controlling the incidence of weld splash need to be evaluated since results obtained in the current study suggest that surface splash is a limiting factor.
8.1. Uncoated Mild Steel
Important observations made in the present investigation may be summarised as follows:-
(1) The available welding current range decreased as the welding speed increased. (2) The relatively earlier onset of splash, observed as the welding speed was increased, resulted
from a corresponding increase in the rate of nugget growth towards the sheet surface. (3) The rate of growth of the weld nugget towards the sheet surface increased with increasing
sheet thickness, electrical resistivity and low electrode force levels.
37
(4) As would be expected, increasing the welding current resulted in larger weld nuggets which solidiñed over a significantly longer distance.
(5) The dynamic resistance exhibited a peak at the start of the weld and then attained a steady-state condition.
(6) Banding within the solidified nugget suggested that the welding current passed through the molten nugget during its solidification.
(7) The welding current flows more towards the exit side of the arc of contact between the sheet and the welding electrode in the thicker steels and at the higher welding speeds.
(8) The arc of contact between the welding electrode and the steel decreased as the welding speed was increased.
The development of a satisfactory weld model must take into account these factors as well as results from previous investigations. Heat generation in welding is controlled by the relationship,
Heat input = I2Rt (4)
Account must be taken therefore of the current, resistance and time when drawing up any model. The magnitudes of the current and resistance developed during welding are related by Ohm's Law, i.e. a high resistance reduces the current flow and vice-versa. With respect to resistance changes during weld formation, these form only a small proportion of the overall resistance of the secondary circuit and thus the corresponding changes in the secondary current are relatively small. Nevertheless, these small changes in resistance have a very pronounced effect on heat generation and weld formation.
8.1.1. Stages of Weld Formation
The distribution of the resistance in the weld zone, and the corresponding current paths control the manner in which the weld is formed. Information on weld development can be gained from a metallographic examination of welds in conjunction with an evaluation of the dynamic resistance characteristics developed during the welding operation.
Previous workUO) 0 n the measurement of the dynamic resistance during spot welding has shown that the final shape of the dynamic resistance curve depends on the relative contribution of a number of factors which are operative during the welding process. For example .breakdown of surface asperities and films results in a decrease in the resistance whereas, the increase in temperature results in an increase in the resistivity of the base steel . The dynamic resistance curves obtained in the current investigation were charcterised by an initial peak followed by a steady-state condition and can be defined in four stages in terms of the development of the weld nugget.as indicated in Fig.78.
Stage 1 Growth - Initial Resistance Peak
With the 1.2mm thick mild steel, the initial resistance peak was reached after 2,3 or 4 half cycles, depending on the welding conditions. Metallographic examination showed that no weld nugget was formed until between the 3rd and 4th cycle of welding current. Thus, during the first few half cycles of current flow, the increase in resistance due to the temperature effect on the resistivity of the steel outweighed the reduction in resistance at the faying surface due to the flattening of surface asperities and the breakdown of surface films.
With a 0.6mm mild steel, the initial peak was reached after the first or second half cycle of current flow. Metallographic examination indicated that a weld nugget was formed within the first cycle of current flow. The relatively larger amount of heat abstraction which occurs, via the welding electrodes, resulted in this case in less heating of the bulk steel and under these conditions the increase in resistance was more than counteracted by the reduction in resistance caused by the lower resistance path created during the early stages of weld formation. The overall effect in the case of 0.6mm mild steel was to cause an earlier drop in the resistance value.
Stage 2 Growth - Region of Resistance Drop
After the initial peak in resistance, the resistance falls steadily over the next few cycles of current flow, the number of which depends on the steel thickness and the welding conditions used. In the case of the 1.2mm mild steel welded at a speed of 2m/min, the resistance fell over 8 cycles of current flow. During

- 38 -
this phase, the effect of current shunting must outweigh the increase in resistance arising from the changes in resistance due to the increase in temperature.
Evidence which confirms that current shunting had occurred was obtained from an examination of the bands observed in the structure of the final weld nugget which, showed the number of half cycles of current which had passed through the molten nugget during its solidification. Evidence of shunting was also inferred from the fact that no weld was produced during the first few cycles of current flow. Approximately 4 cycles of current flow were necessary to develop a weld nugget. However, in the final weld seam, the weld start region exhibited the largest weld nugget. Metallographic examination also showed that as the time during which current flow increased, the region behind the weld nugget developed a "mushy" zone behind which a region of solid phase bonding only had formed. The length of these regions was found to increase until approximately 10 cycles of current flow after which no further growth occurred. These regions present a larger path for current flow which has a lower resistance than the molten nugget. Thus the reduction in resistance after the initial peak is considered to be due to the presence of a larger current path resulting from the shunting of current through the previously formed liquid/solid weld nugget and the area of mushy/solid phase located behind the molten nugget.
At high welding speeds, the fall in resistance occurred over a short period of time which can be attributed to two factors. Firstly, the extent of shunting of the current is controlled by the distance over which the current has to travel. At the higher welding speeds, the distance between each half cycle peak is large. Consequently, at higher welding speeds, the resistance falls over a smaller number of cycles. Secondly, at high welding speeds, the value of the steady/state resistance is higher than that measured at low welding speeds consequently, the steady state resistance is attained in a short time period. This is due to the fact that the weld is formed nearer the exit side of the arc of contact of the welding electrode thereby, giving a shorter current path.
A more rapid drop in resistance occurred with the 0.6mm mild steel which can be attributed to the faster rate of formation of the molten weld and the earlier onset of the steady state condition.
Stage 3 Growth - Secondary Resistance Peak
The third stage of weld formation consists of the development of a small secondary resistance peak, which is considered to result from changes in the available shunt paths. At the early stages of welding, the current flow tends to follow the low resistance paths created as a result of the breakdown of the high contact resistance at the faying surfaces. The current continues to spread over this region until the distance over which the current has to flow becomes too large. At this stage, some of the current then flows in the region behind the weld nugget. This results in a reduction in the length of the current path thereby, resulting in a slight increase in resistance.
Stage 4 Growth - Steady/State Condition
A steady-state value is finally attained during which the majority of the current enters the sheet in areas near the entry side of the arc of contact between the sheet and the welding electrode. This results from the lower temperature and higher effective electrode pressure at this position giving a lower resistance path, Fig.79. At this stage, the distribution of current through the weld zone reaches an equilibrium condition. The magnitude of the steady state resistance is influenced by the precise distribution pattern of the current, as is the mode of weld formation and the available welding range.
8.1.2. Current Distribution-Weld Zone
The distribution of the current through the sheets depends on the various resistance paths offered to the flow of current between the welding electrodes, see Fig.79. During welding, these resistances act in parallel and influence the distribution of current flow accordingly. The number of paths can be split up into six regions. Prior to the sheets entering the gap between the welding electrodes, there is no intimate contact between the sheets thereby preventing the passage of current between the sheets, see region A, Fig.79. As the sheets enter the electrode gap, the sheets are forced together but no bonding occurs. This results in a very high resistance path (B). The next region (C) exhibits solid phase bonding. In this region, two counteracting effects are operative, firstly, a reduction in resistance arising from the larger amounts of bonding which occurs and secondly, an increase in resistance due to the increase in temperature in this zone. Moving further towards the exit side of the arc of contact, zone (D), a mushy zone exists where the steel is between its liquidus and solidus temperature. This zone will exhibit a higher resistance path than

39 -
the preceeding solid phase region. The formation of the liquid zone (E) results in a step-wise increase in resistance. In the solidified zone corresponding to the weld nugget, i.e. zone(F), the resistance is again lowered and continues to fall as the temperature of the welded seam falls. Although the inherent resistance of this region may be low, the distance the current would have to flow to pass through this region gives a much higher effective resistance to current flow.
From an examination of the resistance paths in the weld area, it is considered that the majority of the welding current will pass through the region of solid phase bonding thereby, extending the weld nugget already formed, Fig. 80. However, part of the welding current is known to pass through the area of higher resistance offered by the molten nugget. The passage of an alternating current through this region will modify the solidification rate, thereby, influencing the solute size/distribution such as to result in the structural banding observed in the solidified weld nugget.
At low welding speed.although a small number of cycles of current flow are required to produce the first weld nugget, the relative movement of this region is small and therefore, the molten zone extends towards the entry side of the arc of contact. In this situation, the majority of the welding current will pass through the faying surface towards the entry side of the welding electrode. There is sufficient time available to form the weld and, to allow sufficient heat abstraction through the welding electrodes to ensure complete solidification of the molten liquid nugget so formed before it exits from the electrode arc of contact.
At high welding speeds, when a larger number of cycles of current flow is required to form the first weld nugget, there is a tendency for the original nugget to be displaced towards the exit side of the electrodes. The low resistance paths at the faying surface under these circumstances are developed near the exit side of the electrode arc of contact. However, the majority of the current still enters the sheet surface towards the entry side of the electrode arc of contact but flows through the faying surface towards the exit side of the electrode arc of contact. In this case, the current is concentrated over a shorter length and there is less time available for heat abstraction through the electrodes. Therefore, the molten nugget grows more rapidly towards the sheet surface. Consequently, the available current range between weld formation and nugget expulsion through the surface of the sheet is reduced.
Similar conditions apply to mash welding where at the higher welding speeds, the welding current tends to flow towards the exit side of the electrode contact arc and this, coupled with the short contact time between the electrodes and the sheet surface, results in a shallow temperature gradient between the surface and the weld centre. At both low and high welding speeds the majority of the heat is developed at the point of highest resistance, i.e. the faying surface. However, at low welding speeds there is sufficient time available between weld formation and exit from the electrodes to enable significant heat abstraction from the surface of the weld through the electrodes. This promotes weld nugget formation at the mid-thickness of the section. At high welding speeds, the amount of heat abstraction through the electrodes is reduced and this results in liquid formation along the inclined faying surface up to the edge of the overlap. This gives rise to the early onset of weld splash.
8.1.3. Factors Influencing the Available Welding Range
High welding speeds promote growth of the weld nugget through the sheet thickness and reduces the available welding range. Other factors which encourage nugget growth in the vertical direction exacerbate this situation, i.e. the available in current range between weld formation and surface splash is reduced with thicker steels and steels with a high resistivity.
Increasing the electrode force extends the arc of electrode contact which extends the length of the current path and increases the time available for heat abstraction and the avialable welding current range.
With larger currents, a greater amount of melting occurs but there is a limited volume of liquid metal which can be solidified in the time in which the electrodes are in contact with the sheet. At the splash limit, the amount of heat abstraction is insufficient to solidify the nugget before it exits from between the electrodes and consequently, the molten weld nugget can erupt through the surface of the seam.
The reduced arc of contact at the higher speed is related to the fact that less heat is generated towards the entry side. The work done by the electrodes in deforming the steel is concentrated towards the entry side of the arc of contact and, the reduction in temperature and consequent increase in strength, results in a reduced level of weld indentation for the same applied force, Fig.81.
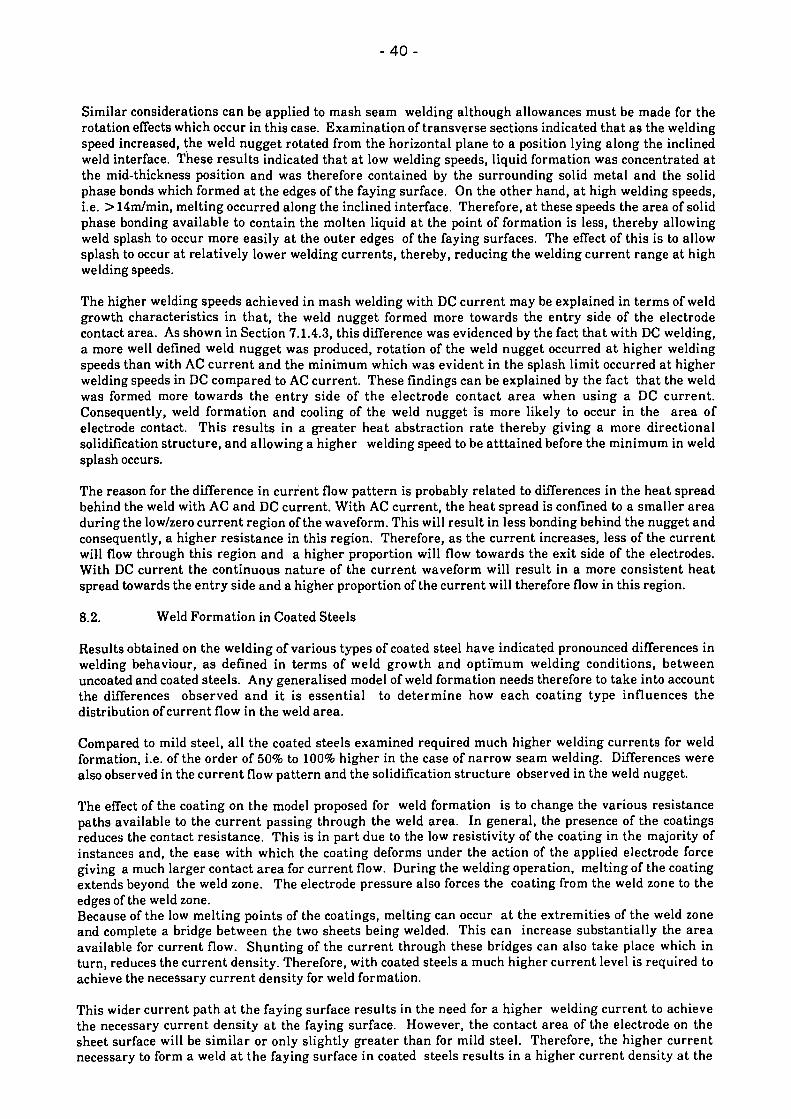
40
Similar considerations can be applied to mash seam welding although allowances must be made for the rotation effects which occur in this case. Examination of transverse sections indicated that as the welding speed increased, the weld nugget rotated from the horizontal plane to a position lying along the inclined weld interface. These results indicated that at low welding speeds, liquid formation was concentrated at the mid-thickness position and was therefore contained by the surrounding solid metal and the solid phase bonds which formed at the edges of the faying surface. On the other hand, at high welding speeds, i.e. > 14m/min, melting occurred along the inclined interface. Therefore, at these speeds the area of solid phase bonding available to contain the molten liquid at the point of formation is less, thereby allowing weld splash to occur more easily at the outer edges of the faying surfaces. The effect of this is to allow splash to occur at relatively lower welding currents, thereby, reducing the welding current range at high welding speeds.
The higher welding speeds achieved in mash welding with DC current may be explained in terms of weld growth characteristics in that, the weld nugget formed more towards the entry side of the electrode contact area. As shown in Section 7.1.4.3, this difference was evidenced by the fact that with DC welding, a more well defined weld nugget was produced, rotation of the weld nugget occurred at higher welding speeds than with AC current and the minimum which was evident in the splash limit occurred at higher welding speeds in DC compared to AC current. These findings can be explained by the fact that the weld was formed more towards the entry side of the electrode contact area when using a DC current . Consequently, weld formation and cooling of the weld nugget is more likely to occur in the area of electrode contact. This results in a greater heat abstraction rate thereby giving a more directional solidification structure, and allowing a higher welding speed to be atttained before the minimum in weld splash occurs.
The reason for the difference in current flow pattern is probably related to differences in the heat spread behind the weld with AC and DC current. With AC current, the heat spread is confined to a smaller area during the low/zero current region of the waveform. This will result in less bonding behind the nugget and consequently, a higher resistance in this region. Therefore, as the current increases, less of the current will flow through this region and a higher proportion will flow towards the exit side of the electrodes. With DC current the continuous nature of the current waveform will result in a more consistent heat spread towards the entry side and a higher proportion of the current will therefore flow in this region.
8.2. Weld Formation in Coated Steels
Results obtained on the welding of various types of coated steel have indicated pronounced differences in welding behaviour, as defined in terms of weld growth and optimum welding conditions, between uncoated and coated steels. Any generalised model of weld formation needs therefore to take into account the differences observed and it is essential to determine how each coating type influences the distribution of current flow in the weld area.
Compared to mild steel, all the coated steels examined required much higher welding currents for weld formation, i.e. of the order of 50% to 100% higher in the case of narrow seam welding. Differences were also observed in the current flow pattern and the solidification structure observed in the weld nugget.
The effect of the coating on the model proposed for weld formation is to change the various resistance paths available to the current passing through the weld area. In general, the presence of the coatings reduces the contact resistance. This is in part due to the low resistivity of the coating in the majority of instances and, the ease with which the coating deforms under the action of the applied electrode force giving a much larger contact area for current flow. During the welding operation, melting of the coating extends beyond the weld zone. The electrode pressure also forces the coating from the weld zone to the edges of the weld zone. Because of the low melting points of the coatings, melting can occur at the extremities of the weld zone and complete a bridge between the two sheets being welded. This can increase substantially the area available for current flow. Shunting of the current through these bridges can also take place which in turn, reduces the current density. Therefore, with coated steels a much higher current level is required to achieve the necessary current density for weld formation.
This wider current path at the faying surface results in the need for a higher welding current to achieve the necessary current density at the faying surface. However, the contact area of the electrode on the sheet surface will be similar or only slightly greater than for mild steel. Therefore, the higher current necessary to form a weld at the faying surface in coated steels results in a higher current density at the

41
sheet surface and consequently, higher surface temperatures with coated steels than with uncoated mild steels. Thus the balance of the proportion of the heat generated at the surface compared to that at the faying surface is increased with coated steels and consequently the welding current range is reduced.
With respect to the nugget aspect ratio in coated steels, the flow of current towards the exit side will increase the aspect ratio whereas, the increased width of current flow will tend to decrease the aspect ratio. These effects cancel each other out to some extent and metallographic examination showed similar nugget aspect ratios in coated and uncoated steels.
The effect of different coatings will depend on how they change the relative distribution of the resistance and current paths. Factors likely to influence this are:-
(1) The melting point of the coating, which will determine the distance adjacent to the weld over which the coating will melt and also how easily it flows from the weld zone.
2) The amount of coating in the weld area which in turn can depend on coating thickness. 3) The resistivity of the coating. 4) The presence of different phases within the coating. 5) Whether the coating forms "bridges" behind the nugget, i.e. towards the entry side, which
will present an alternative current path and may result in "intermittent" type weld formation.
In addition to affecting the current flow in the longitudinal direction, the surface coatings can also influence the current flow in the transverse direction. Spreading of the coatings to the edge of the weld zone creates a bridge through which current can flow thereby, effectively increasing the width of the current path. It may be noted that even in the molten state, the resistivity of zinc and aluminium are significantly lower than that of mild steel at the same temperature. The resistivity of lead is slightly higher than that of mild, however, the mere presence of a path will allow current to flow through.
Lead has the lowest melting point but the highest resistivity, aluminium the highest melting point and its lowest resistivity. Therefore, with a lead-tin coating, a larger current path exists compared to that obtained with aluminium. However, the resistivity in this area will be higher than with the aluminium coating. Thus there may be counteracting effects caused by each coating and the overall effect will depend on the relative balance between such factors. It was not possible to determine the relative contribution of these various factors within the framework of the present investigation and further work is necessary before a complete understanding of weld formation can be derived for coated steel.
8.3. Guidelines for Increasing Welding Speed
From the proposed model, it is possible to indicate factors which can be controlled to allow an increase in the maximum welding speed attainable. These may be summarised as follows:-
(i) Encouraging weld formation to occur more towards the entry end of the electrode arc of contact. It has been suggested'2' that a two stage process would be beneficial, i.e. a low heat weld to produce a bond followed by a high heat to form a weld of sufficient strength. By this means the previously formed bond prevents excess shunting towards the exit side of the electrode arc of contact.
(ii) A similar effect may be achieved by the use of larger electrode wheel diameters. This would increase the arc of electrode contact without increasing the indentation.
(iii) Reducing the likelihood of eruption or splash through the weld seam as the weld exits from between the electrodes. This can be achieved by:-
(a) Some means of cooling the surface of the weld seam between the electrodes and on exit from the electrode, e.g. water cooling.
(b) Application of force to the surface of the seam as it exits from the electrodes by using an electrode extension device similar to that suggested for high speed can-making machines <2'.

- 4 2 -
(iv) Any increase in speed above approximately 15m/min is limited in the case of 50Hz alternating current by separation of the weld nuggets. In such situations DC or square wave welding currents can prove beneficial in giving some further increase in speed. Alternatively, a higher frequency alternating current may be used.
Another method of increasing the maximum welding speed is to use narower seam welds.
The results presented in Section 4.4. showed that higher welding speeds could be achieved with narrow seam compared to wide seam welding configurations. This was attributed to the greater volume of liquid produced in wide seam welding and the inability of the electrodes to remove sufficient heat from the weld zone to enable solidification of the increased volume of weld metal before it exits from the electrode contact area. Therefore, the use of narrower weld seams may enable higher seam welding speeds.
In most wide seam welding operations, the electrode tread width generally specified is equal to 5Vt , where t is the sheet thickness in mm. It is general practice to recommend welding conditions which result in a weld width equal to the electrode tread width. The weld width is generally allowed to fall, as a result of electrode wear, to a minimum value equal to 80% of the electrode tread width. The öVt weld size concept originated from standards set for spot welding, which in turn, were based on rivet dimensions. With respect to spot welds, Janota <23>, has investigated the relationship between weld size, sheet thickness and the criteria governing the mode of fracture durng tensile-shear testing. This work indicated that the transition from shear to plug type failure was a function of joint geometry. It has also been shown(24>that the type of failure also depends on the testing procedure and the corresponding stress systems. Therefore, it is considered that 5Vt is not an absolute value and, in practice, acceptable welds can be achieved in many applications using smaller weld sizes. For example, in narrow seam welding of automotive fuel tanks, the weld widths are generally between 2 and 3 V t while in tinplate cans, the weld widths can be as low as l V t . The weld, in both these instances, must be capable of withstanding quite high internal pressures. In coil joining applications for steel processing lines, weld widths of 2.5 to 3.5Vt are typical. In this case the welds are subjected to quite high tensile stresses as the weld in the transverse direction is processed at high speed and, sometimes, high temperatures, e.g. hot dip coating lines.
The minimum width of weld seam that can be tolerated will obviously depend on the end application and the type and level of stress encountered. Where the stress is tensile-shear, weld widths in the range 2 to 3Vt result in failure in the parent metal rather than through the weld. In this situation increasing the weld width does not increase the effective strength of the end product. Although the minimum weld width required may depend on the exact stress regime encountered by the end product, the present width of 5 v t in the case of wide seam welding is considered excessive. In many applications the weld width could be significantly reduced with no adverse affects on the product quality, while higher welding speeds could be attained. It should be stated however, that closer control of the welding process would be required both from the viewpoint of the narrower welding range at higher speeds and also from the fact that the tolerance on the weld width would be more critical.
9. CONCLUSIONS
9.1. Uncoated Mild Steel
9 1.1 In all variants of seam welding, as the welding speed was increased, the necessary current for weld formation increased progressively. The width of the weldability lobe decreased with increasing speed due to the earlier onset of splash.
9.1.2. The maximum attainable welding speed depended on the welding configuration. With AC current speeds of up to. 14 to 16 m/min were attained for narrow and mash seam welding. However, with wide seam welding, the maximum welding speed was 6 to 8 m/min.
9.1.3. Factors which limited the maximum welding speed for seam welding of mild steel using an AC current were weld splash and nugget separation. Weld splash occurred through the surface of the weld seam in narrow and wide seam welding whereas, in mash seam welding, splash occurred at the edge of the faying surfaces.

- 4 3
9.1.4 The influence of DC current compared to AC current depended on the factor which limited the maximum welding speed. In situations where the welding speed was limited by weld splash through the surface of the weld seam, DC current generally resulted in a decrease in the maximum welding speed. If weld nugget separation was the limiting factor, then DC results in an increase in the maximum welding speed attainable. Welding with DC current required less current than that for AC welding.
9.1.5. Other factors which limited the welding speed were:-
(i) Low electrode force levels (ii) Interrupted current programmes (iii)Steels with high resistivity
9.1.6. With respect to thickness tolerances, it was shown that with a nominal thickness of 1.1mm, it would be possible to accommodate the permitted thickness variation specified in standards of ± 0.100mm with one welding condition. It was also shown that coating oil levels in the range 0.5 to 4g/m2 had little effect on weld formation or the maximum welding speed achieved with a 1.2mm thick mild steel.
9.1.7 The maximum welding speed which could be achieved in roller-spot welding was similar to that for continuous seam welding.
9.1.8. Minimum indentation welds could be produced over a wide range of welding currents and speeds. The limiting factor for welding current was bulging or convexity of the non-indentation side. The limiting factor concerning speed was rippling of the surface.
9.2. Coated Steels
9.2.1. The maximum welding speeds attainable when welding coated steels were found to be less than those obtained with mild steel of similar thickness using either narrow seam or wire welding.
9.2.2. At low welding speeds of 2m/min combined with a continuous cu r ren t p rog ramme , overheating of the electrode wire occurred in wire welding. At a welding speed of 6m/min, the available welding ranges for wire welding and narrow seam welding were very similar, whereas at 10m/min, larger welding ranges could be achieved using the wire welding technique.
9.2.3. The narrower welding ranges obtained with coated steels could be attributed to the higher currents necessary for weld formation coupled with the relatively earlier onset of weld splash or cracking formation depending on coating type.
9.2.4 Cracking encountered in coated steels was at t r ibuted to in tergranular penetrat ion of
copper/brass/bronze phases.
The susceptability of the coatings investigated to weld cracking was as follows:-
(a)High susceptability to cracking - hot dipped zinc and electroplated zinc
(b)Intermediate susceptability to cracking - iron zinc alloy, zinc - 5% aluminium and lead-tin
(c)Low susceptability to cracking - aluminium and zinc - 55% aluminium
Cracking can be minimised by the use of an interrupted current programme.
9.3. Monitoring of the Seam Welding Process
9.3.1. The welding current exhibited a slight upslope over the initial period of weld formation and subsequently, remained fairly consistent along the length of the weld seam.

- 4 4
9.3.2. While the electrode force level necessary to produce a satisfactory weld was influenced by material parameters, the force pattern during welding was predominantly a function of machine characteristics and current waveform.
9.3.3. The electrode movement measured in roller-spot welding was similar to that observed from spot welds, i.e. the electrode movement followed the expansion and contraction of the weld nugget. With continuous current, the electrode movement exhibited a slight movement at the start of the weld seam and then reached a steady-state level along the remainder of the weld seam.
9.3.4. With a continuous current programme, the dynamic resistance exhibited an initial peak and then dropped to a steady state value along the remainder of the seam. Fluctuations in this value were observed when weld splash occurred. In some instances subsidiary resistance peaks were observed.
9.3.5. The initial peak resistance was influenced by steel thickness, welding current and welding speed whereas the. steady-state level of resistance was influenced by the welding parameters used, the welding process and the extent of weld formation.
9.4. Weld Formation
9.4.1. Four stages of weld growth have been identified relative to the dynamic resistance characteristic developed in the weld zone. These stages may be summarised as:
Stage 1. An initial rise in resistance due to the effect of temperature on the resistivity of the steel outweighing the decrease in resistance ar is ing from deformation of the surface asperties-localised solid phase bonding occurs in this period.
Stage 2. A drop in resistance due to shunting of the current through the area of solid phase bonding - melting occurs leading to the development of the first weld nugget.
Stage 3. A secondary resistance peak due to changes in the available shunt path - this corresponds to the formation of the second and third weld nuggets.
Stage 4. Steady-state condition - corresponds to a balance between the heat input and heat abstraction thereby allowing the continuous development of the weld seam.
9.4.2. A model has been developed for weld formation and growth based on various current paths developed during the welding process. These current paths were determined by the distribution of resistance in the weld zone and its surrounding area.
9.4.3. As the welding speed is increased, the current flow tends to concentrate towards the exit side of the welding electrodes. Under these conditions, the molten weld nugget extends beyond the arc of contact between the welding electrodes and the sheet being welded. This increaes the likelihood of splash.
9.4.4 Factors which encourage current flow towards the exit side of the electrode arc of contact area:
(a) Increased welding speeds (b) Increased steel thickness levels (c) The presence of a surface coating
Other factors which encourage nugget growth towards the seam surface are:-
(a) Low electrode force levels (b) High resistivity steels
9.4.5. From the model developed, an increase in the maximum welding speed may be achieved by:-

- 4 5
(a) Encouraging weld formation towards the entry side of the electrode arc of contact, possibly by using a two stage process.
(b)Reducing the weld nugget aspect ratio by increasing the electrode force and/or the use of larger diameter electrodes.
(c)Increasing the ability of the process to retain the molten nugget within the material in order to delay the onset of splash, by improved cooling and in some situations, by the application of a force as the seam exits from the arc of contact by means of an electrode extension system.
(d)In applications where the welding speed is limited to 14 to 16m/min by nugget separation in the case of AC current, then DC current can be beneficial in increasing the welding speed attainable.
It should also be noted that the maximum welding speed may be increased in many instances by reducing the width of the weld seam to the minimum width compatable with the requirements of the end product.
10. REFERENCES
1. Williams, N.T., Thomas D.E., and Wood K., Metal Construction 1977, 9 (4), 157-160 and (5) 202-208
2. Waddell, W., Thomas D.E., and Williams N.T., Metal Construction 1986,18 (3) 156-161
3. Lheureux, G.E., Bellotte, E.J., Welding and Metal Fabrication, October 1964, pp 393-397
4. Ganowski F.J., Schweissen Und Schneiden, No. 11, November 1967
5. Yamamoto T., and Okuda T., IIW Doc. No. 111-504-74
6. Westgate S., Welding Institute, Private Communication
7. Torii.K., IIW Doc. 111-409-71
8. Oldroyd, P.S., and Williams N.T., Welding and Metal Fabrication, March 1980, pp. 97-105
9. Smith, CS., Trans, AIME, 175,(1948),ppl5-51
10. Salter, W.J.M., JISI, May 1966, pp.478-488
11. Savage, W.F., Nippes, E.P., and . Mushala., .M.C., Welding Journal, May 1978, pp.l45s-152s
13. Bredzs, N., and Schwartzbart, H., Welding Journal, August 1959, pp.305s-324s.
14. Savage, W.F.,Nipes, E.F., and Stanton, R.P., Welding Journal, January 1978, pp.9s-16s.
15. Nicholson, A., Murray, J.P., JISI October 1965, pp.1007-1018
16. Williams, N.T., Sheet Metal Industries Conference on Welding of Sheet Steel and Coil, Welding Institute, Kenilworth 1972.
17. Torii.K., Radono, Y., and Tamura, T., IIW Doc. 111-409-71
18. Williams, N.T., and Jones T.B., BSC Report No. FR65-7281, September 1982.
19. Funk, J., and Begeman, M.L., Welding Journal, June 1956, pp.265s-274s.
20. Dickenson, D.W., Welding Journal, 1980, pp.l70s-176s.

- 4 6
21. Yamamoto, T., and Okuda T., Journal of Japan Welding Society, 1979, pp.39-44.
22. Kelly, J., and Knowlson., P.M., Welding Journal, Research Supplement, 1967, 46,(3), 113s-125s
23. Janota, M., IIW Doc. Ill 455-72
24. Williams, N.T., and Jones, T.B., Metal Construction, October 1979, pp.541-546.

TABLE 1 (a)
CHEMICAL ANALYSIS OF STEELS FOR NARROW/WIDE/MASH SEAM WELDING
Steel Type
Mild
Steel
Thickness (mm)
1.2
1.2
1.2
0.95
0.75
0.6
Batch No.
1
1A
Mash
2
4
Narrow/ mash
Chemical Analysis (Wt.%)
C
0.027
0.060
0.036
0.034
0.056
0.05
S
0.008
0.020
0.012
0.007
0.016
0.012
P
0.005
0.005
0.005
0.007
0.005
0.010
Mn
0.31
0.22
0.28
0.29
0.28
0.27
Al. Sol
<0.01
0.046
0.068
<0.01
0.065
0.079
Al. Tot.
<0.01
0.064
0.068
<0.01
0.082
0.075
Si
0.001
0.001
0.005
0.001
0.001
0.015
N
0.0031
0.0082
0.0053
0.0032
0.0065
0.0054
Cr
0.034
0.026
0.040
0.040
0.039
0.010
Ni
0.005
0.008
0.012
0.005
0.005
0.011
Mo
<0.005
<0.005
0.01
<0.005
<0.005
<0.01
Cu
0.012
0.025
0.017
0.023
0.029
0.019
Nb
<0.01
<0.01
<0.01
<0.01
<0.01
<0.01
Ti
<0.01
<0.01
<0.01
<0.01
<0.01
<0.01

TABLE 1(b)
DETAILS OF STEELS USED TO DETERMINE THE EFFECT OF STEEL TOLERANCE ON WELDABILITY
Steel No.
1
2
3
4
5
6
7
8
Thickness mm Average of 20 Readings
0.99
1.0
1.06
1.08
1.17
1.18
1.19
1.20
Chemical Analysis Wt. %
C
0.044
0.044
0.050
0.046
0.055
0.049
0.040
0.046
S
0.023
0.014
0.021
0.008
0.016
0.012
0.015
0.009
P
0.010
0.012
0.012
0.008
0.005
0.006
0.009
0.005
Mn
0.28
0.26
0.27
0.29
0.22
0.27
0.25
0.27
Al . Tot.
0.037
0.048
0.060
0.049
0.056
0.042
0.052
0.004
Al . Sol.
0.036
0.046
0.063
0.051
0.050
0.039
0.055
0.003
Si
0.018
0.009
0.012
0.014
0.001
0.020
0.011
0.001
N
0.0080
0.0043
0.0041
0.0052
0.0075
0.0075
0.0059
0.0055
Ni
0.013
0.013
0.012
0.011
0.011
0.011
0.016
0.009
Mo
<0.01
<0.01
<0.01
<0.01
<0.01
<0.01
<0.01
<0.01
Cu
0.136
0.014
0.016
0.014
0.026
0.013
0.014
0.024
Nb
<0.01
<0.01
<0.01
<0.01
<0.01
<0.01
<0.01
<0.01
Ti
.001
.001
.001
.001
.001
.001
.001
.001
00

TABLE 1 (c)
SURFACE CLASSIFICATION OF STEELS USED TO DETERMINE THE EFFECTS OF STEEL TOLERANCE ON WELD ABILITY
Steel No.
1
2
3
4
5
6
7
8
Surface Classification
Ra
Top L
1.06
1.27
1.05
1.64
1.59
1.43
1.09
1.19
Top T
1.12
1.25
1.00
1.53
1.74
1.49
1.16
1.25
Bot T
1.14
1.41
1.12
1.35
1.66
1.49
0.85
1.64
Bot L
1.09
1.47
1.10
1.36
1.55
1.58
0.85
1.60
S(o)
Top L
248
273
148
119
228
203
258
267
Top T
274
214
214
134
169
195
210
245
Bot T
282
197
217
220
219
242
232
274
Bot L
320
195
264
250
205
223
188
239
co

TABLE 2
CHEMICAL ANALYSIS OF HIGH STRENGTH STEELS EXAMINED
Steel Type
Rephosphorised
Niobium
Dual Phase
Titanium
Thickness mm
0.55
0.7
1.2
1.4
0.75
1.2
1.2
C
0.076
0.079
0.043
0.056
0.107
0.108
0.010
Chemical Analysis (Wt. %)
s
0.022
0.016
0.016
0.022
0.005
0.005
0.018
P
0.096
0.092
0.094
0.028
0.012
0.011
0.013
Mn
0.45
0.47
0.52
0.42
1.23
1.24
0.13
Al Sol
0.043
0.061
0.045
0.029
0.030
0.035
0.048
Al Tot
0.057
0.062
0.049
0.038
0.031
0.040
0.048
Si
0.013
0.012
0.012
0.024
0.52
1.07
0.023
N
0.0067
0.0068
0.0065
0.0082
0.0075
0.0073
0.0056
Cr
0.010
0.010
0.013
0.031
0.42
0.42
0.013
Ni
0.012
0.013
0.016
0.016
0.019
0.017
0.013
Mo
<0.005
<0.005
<0.005
«C0.005
<0.005
<0.005
0.01
Cu
0.018
0.017
0.029
0.039
0.036
0.035
0.015
Nb
<0.01
<0.001
<0.01
0.090
<0.01
<0.01
<0.01
Ti
<0.01
<0.01
<0.01
<0.01
<0.01
<0.01
0.13
CTI
O
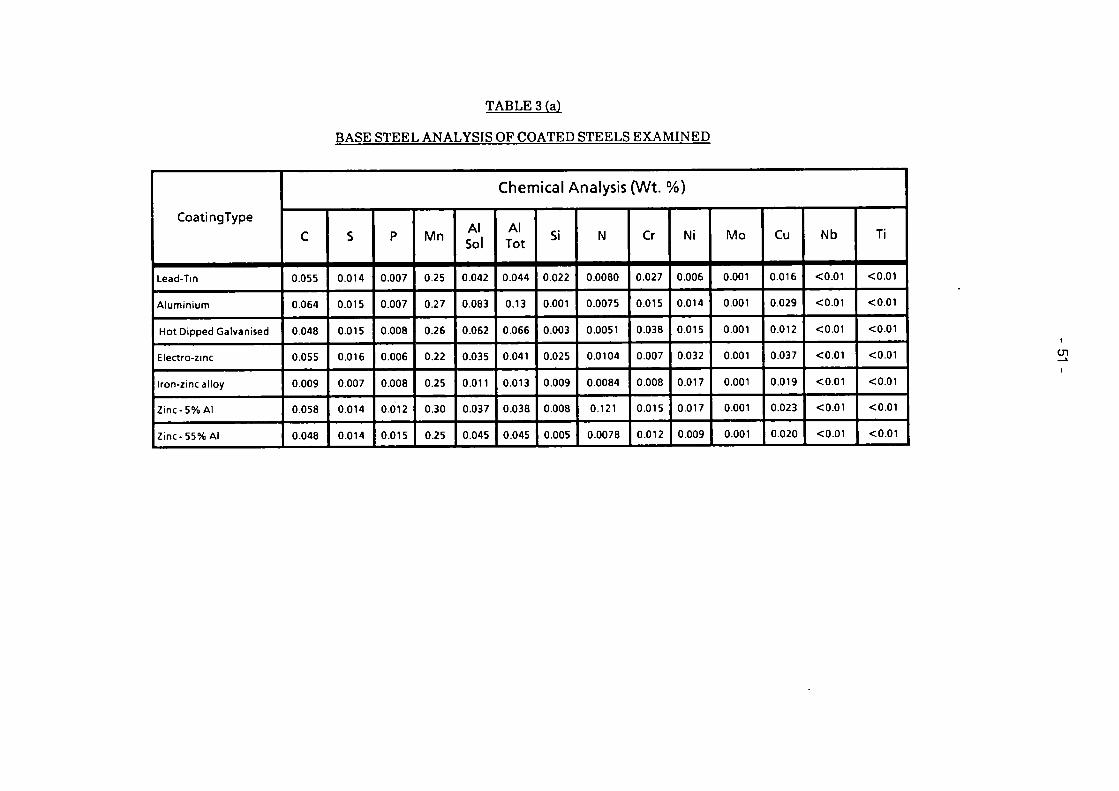
TABLE 3 (a)
BASE STEEL ANALYSIS OF COATED STEELS EXAMINED
Coati ngType
Lead-Tin
Aluminium
Hot Dipped Galvanised
Electro-zinc
Iron-zinc alloy
Zinc-5% Al
Zinc-55% Al
Chemical Analysis (Wt. %)
C
0.055
0.064
0.048
0.055
0.009
0.058
0.048
S
0.014
0.015
0.015
0.016
0.007
0.014
0.014
P
0.007
0.007
0.008
0.006
0.008
0.012
0.015
Mn
0.25
0.27
0.26
0.22
0.25
0.30
0.25
Al Sol
0.042
0.083
0.062
0.035
0.011
0.037
0.045
Al Tot
0.044
0.13
0.066
0.041
0.013
0.038
0.045
Si
0.022
0.001
0.003
0.025
0.009
0.008
0.005
N
0.0080
0.0075
0.0051
0.0104
0.0084
0.121
0.0078
Cr
0.027
0.015
0.038
0.007
0.008
0.015
0.012
Ni
0.006
0.014
0.015
0.032
0.017
0.017
0.009
Mo
0.001
0.001
0.001
0.001
0.001
0.001
0.001
Cu
0.016
0.029
0.012
0.037
0.019
0.023
0.020
Nb
<0.01
<0.01
<0.01
<0.01
<0.01
<0.01
<0.01
Ti
<0.01
<0.01
<0.01
<0.01
<0.01
<0.01
<0.01
Ü1
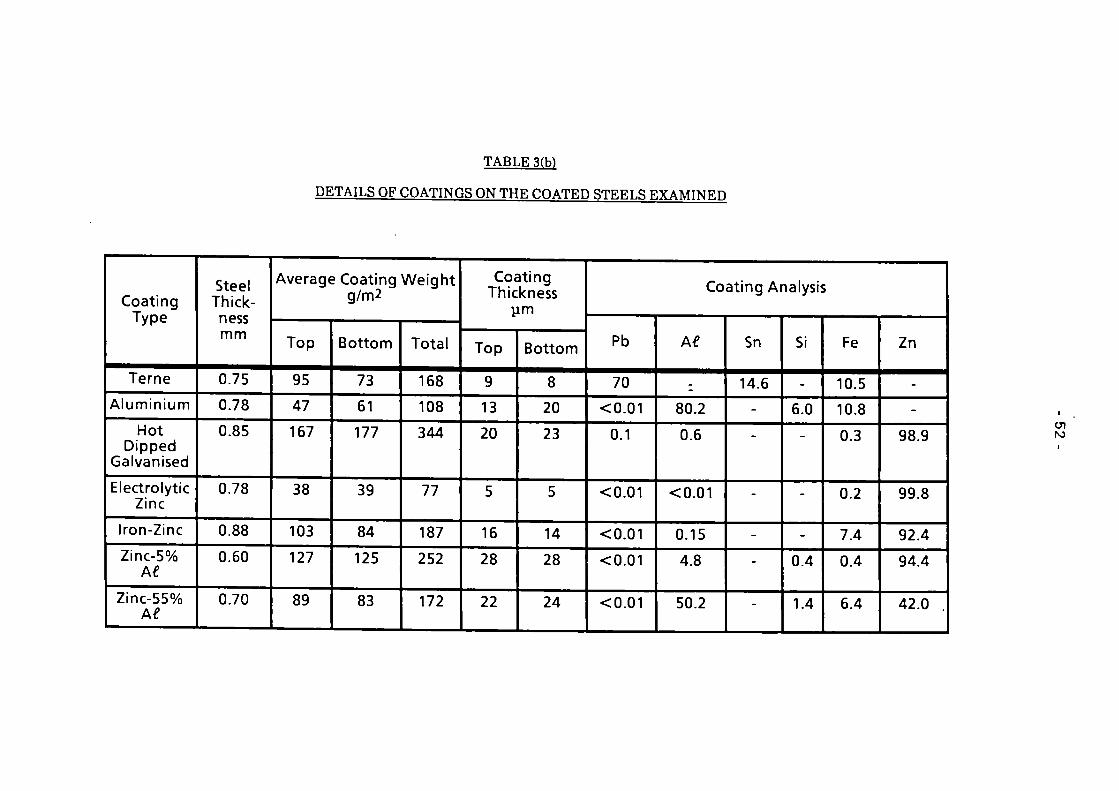
TABLE 3(b)
DETAILS OF COATINGS ON THE COATED STEELS EXAMINED
Coating Type
Terne
Aluminium
Hot Dipped
Galvanised
Electrolytic Zinc
Iron-Zinc
Zinc-5%
Zinc-55% M
Steel Thickness mm
0.75
0.78
0.85
0.78
0.88
0.60
0.70
Average Coating Weight g/m2
Top
95
47
167
38
103
127
89
Bottom
73
61
177
39
84
125
83
Total
168
108
344
77
187
252
172
Coating Thickness
pm
Top
9
13
20
5
16
28
22
Bottom
8
20
23
5
14
28
24
Coating Analysis
Pb
70
<0.01
0.1
<0.01
<0.01
<0.01
<0.01
A€
;
80.2
0.6
<0.01
0.15
4.8
50.2
Sn
14.6
-
-
-
-
-
-
Si
-
6.0
"
-
-
0.4
1.4
Fe
10.5
10.8
0.3
0.2
7.4
0.4
6.4
Zn
-
-
98.9
99.8
92.4
94.4
42.0
Ui ro
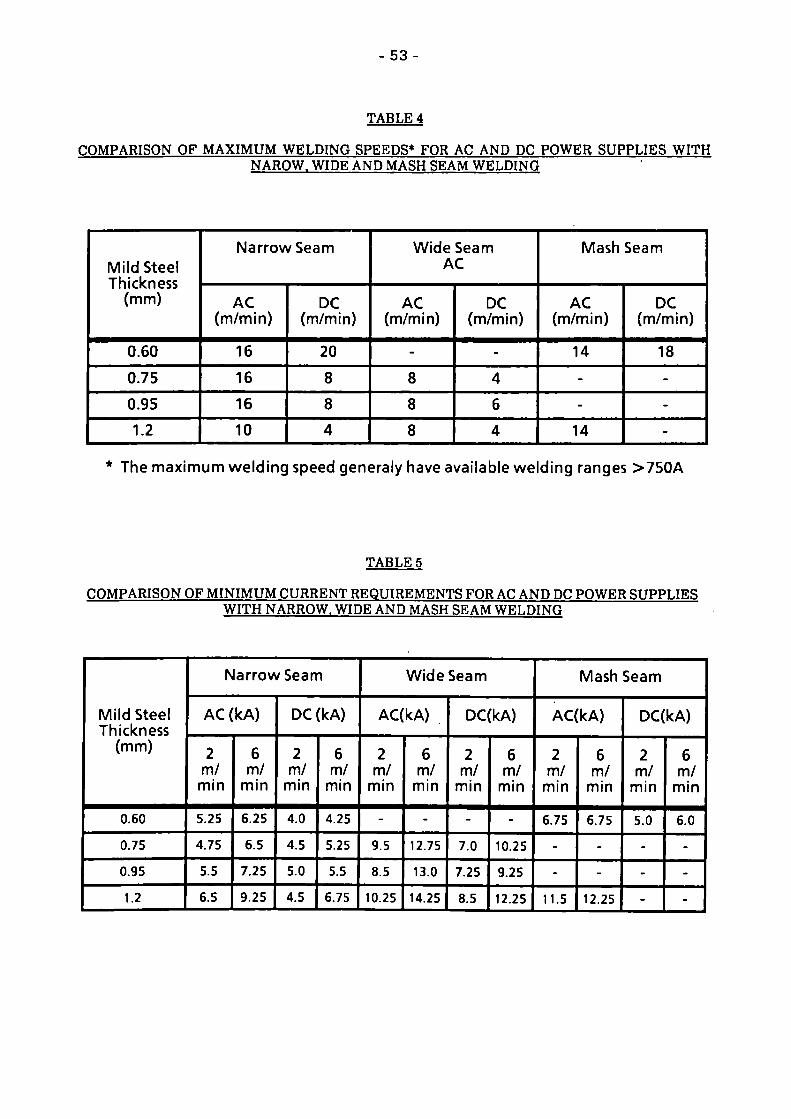
- 53
TABLE 4
COMPARISON OF MAXIMUM WELDING SPEEDS* FOR AC AND DC POWER SUPPLIES WITH NAROW. WIDE AND MASH SEAM WELDING
Mild Steel Thickness
(mm)
0.60 0.75 0.95 1.2
Narrow Seam
AC (m/min)
16 16 16 10
DC (m/min)
20 8 8 4
Wide Seam AC
AC (m/min)
-
8 8 8
DC (m/min)
-
4 6 4
Mash Seam
AC (m/min)
14 -
-
14
DC (m/min)
18 -
-
-
The maximum welding speed generaly have available welding ranges >750A
TABLE 5
COMPARISON OF MINIMUM CURRENT REQUIREMENTS FOR AC AND DC POWER SUPPLIES WITH NARROW. WIDE AND MASH SEAM WELDING
Mild Steel Thickness
(mm)
0.60
0.75
0.95
1.2
Narrow Seam
AC (kA)
2 m/ min
5.25
4.75
5.5
6.5
6 m/
min
6.25
6.5
7.25
9.25
DC (kA)
2 m/
min
4.0
4.5
5.0
4.5
6 m/
min
4.25
5.25
5.5
6.75
Wide Seam
AC(kA)
2 m/
min
-
9.5
8.5
10.25
6 m/
min
-
12.75
13.0
14.25
DC(kA)
2 m/
min
-
7.0
7.25
8.5
6 m/
min
-
10.25
9.25
12.25
Mash Seam
AC(kA)
2 m/
min
6.75
-
-
11.5
6 m/
min
6.75
-
-
12.25
DC(kA)
2 m/
min
5.0
-
-
-
6 m/
min
6.0
-
-
-
- 5 4
TABLE 6
COMPARISON OF THE AVAILABLE WELDING CURRENT RANGES FOR AC AND DC POWER SUPPLIES WITH NAROW. WIDE AND MASH SEAM WELDING
Mild Steel Thickness
(mm)
0.60
0.75
0.95
1.2
Narrow Seam
AC (kA)
2 m/ min
8.25
7.5
7.0
7.0
6 m/
min
6.75
4.0
4.0
2.5
DC (kA)
2 m/
min
6.0
4.5
425
2.75
6 m/
min
3.0
0.75
1.25
0.5
- Wide Seam
AC(kA)
2 m/
min
-
7.5
8.25
5.75
6 m/
min
-
1.25
1.25
1.25
DC(kA)
2 m/
min
-
5.5
2.5
3.5
6 m/
min
-
0.25
1.25
0.25
Mash Seam
AC(kA)
2 m/
min
2.75
-
-
7.0
6 m/
min
1.25
-
-
6.0
DC(kA)
2 m/
min
4.75
-
-
-
6 m/
min
3.0
-
-
-

- 55
TABLE 7
EFFECT OF STEEL VARIABLES - METALLOGRAPHIC EXAMINATION
Steel No.
1
2
3
4
5
6
7
8
Thickness mm
0.99
1.0
1.06
1.08
1.17
1.18
1.19
1.20
Welding Current
kA
13.7
13.95
I3.95
13.85
13.95
13.3
13.15
13.95
Measured Plug Width
mm (Vernier Calipers)
4.9
4.8
3.5
4.6
4.8
3.5
4.7
3.0
Metallographic Examination ofTensile
Test Welds (mm)
Nugget Width
3.7
3.5
3.5
3.5
2.9
1.6
2.3
0
Solid Phase Width
0.9
1.0
0.3
0.7
1.4
1.3
1.8
3.5
Total
4.6
4.5
3.8
4.2
4.3
2.9
4.1
3.5
56
TABLE 8
RESISTIVITY VALUES DETERMINED FOR THE STEEL TYPES USED
Steel Type
Typical Resistivity
pQcm
Mild Steel
12.5
Re-Phosphorised
15
Titanium Treated
17.5
Niobium Treated
22.5
Dual Phase
30
N.B. The actual value of resistivity depends on the composition and processing history
TABLE 9
EFFECT OF INCREASING ELECTRODE FORCE ON MAXIMUM WELDING SPEED FOR 1.2/1.4mm THICK STEEL (NARROW SEAM)
Thickness mm
1.2 1.4 1.2 1.4
Electrode Force kN
4 4.5 6
6.75
Maximum Welding Speed * m/min
Mild Steel
10
16
Re-Phosphorised
8
8
Niobium Treated
0
10
Dual Phase
4
8
* Maximum speed taken as welding speed at which there is at least 750A between current for continuous weld and weld splash.

-57 -
TABLE 10
COMPARISON OF MAXIMUM WELDING SPEEDS FOR STEELS OF DIFFERENT COMPOSITION AND THICKNESS - NARROW SEAM/CONTINUOUS AC CURRENT
Thickness mm
0.55 0.6 0.7
0.75 1.2
1.4
Electrode Force kN
2.5
3.0
4.0 4.5
Maximum Welding Speed * m/min
Mild Steel
16
16 10
Rephos-phorised
16
14
8
Niobium Treated
0/8 +
Dual Phase
12 4
* Maximum speed taken as welding speed at which there is at least 750A between current for continuous weld and weld splash.
+ Interface failures-first figure relates to maximum speed, for suitable current range between continuous plug failure and splash, second figure relates to maximum speed for suitable current range between stuck weld and splash

58
TABLE 11
MINIMUM AND MAXIMUM WELDING CURRENTS FOR 1.2/1.4mm THICK MILD AND HIGH STRENGTH STEELS
Welding Speed m/min
2
6
Current Parameter
Minimum
Maximum
Range
Minimum
Maximum
Range
Secondary Current kA Steel Type
Mild Steel
6.5 (6.0)
13.5
7(7.5)
9.25(9.0)
11.75
2.5(2.75)
Rephosph orised
8.1 (7.0)
12.9
4.8(5.9)
8.7 (8.3)
11.0
2.3 (2.7)
Niobium Treated
9.9(5.9)
10.4
0.5 (4.5)
9.9 (9.4)
10.3
0.4(0.9)
Dual Phase
6.5(6.0)
11.0
4.5 (5.0)
9.0 (8.0)
9.6
0.6(1.6)
N.B. Minimum current refers to current for continuous weld plug, figures in brackets refer to current for stuck weld. Maximum current refers to current giving weld splash.

59
TABLE 12
EFFECT OF ELECTRODE FORCE 'ON MAXIMUM WELDING SPEEDS ATTAINABLE
Maximum Welding Speed m/min
Steel Thickness
mm
0.75
1.2
Narrow Seam
Electrode Force
3.0 4.5 6.0 4.0 6.0 8.0
AC
-
10 16 16
DC
8 14 16 4
10 14
Wide Seam
Electrode Force
3.5 5.25
2.4 4.8 7.2
AC
6 10
4 8 8
DC
4
8
4 4 8
TABLE 13
MAXIMUM WELDING SPEEDS FOR UNCOATED AND COATED STEELS
AC or DC Current
AC
DC
Maximum Welding Speed m/min and Factors Limiting Maximum Speed
0.75mm Mild Steel
16
S 8 S
0.78mm Aí
Coated
10 S 6 S
0.75mm Terne
Lead-Tin
7
S 7
S + Opening
up
0.85mm Hot
Dipped Galvanised
6* Cracking
4
S + Opening
up
0.78mm Electroplated Zinc
2 Cracking
4 S +
Opening up
0.88mm Iron-zinc
12
S 8 S
0.6mm Galfan
Zn-5% M
14
S 4
S + Opening
up
0.7mm Zaiutite
Zinc-55% A€
10 S 0
S
N.B. 1. Maximum welding speed based on welding range of at least 750A 2. S refers to weld splash 3. * with HDG although there was a range of 1500A at 5m/min there the range was only 500A
at 2 and 4 m/min. 4. Cracking refes to brass filled cracks observed at the edge of the weld plug after tensile
testing
05 O
TABLE 14
COMPARISON OF MINIMUM AC CURRENT REQUIREMENT FOR MILD STEEL AND COATED STEELS
Welding Speed m/min
2
4
6
8
10
Average Increase in
Current compared to
mild steel
Minimum Current for Continuous Weld Plug f Percentage Increase ^ (Compared to Mild Steely
0.75mm Mild Steel
4.75
6.0
6.5
7.25
7.75
kA
%
0.78mm M
Coated
10.75 (125)
10.5 (75)
10.5 (60)
11.0 (50)
11.5 (50)
4.4
70
0.75mm Terne (Pb/Sn)
9.75 (105)
10.5 (75)
13.0 (100)
13.5 (85)
13.75 (75)
5.65
90
0.85mm Hot Dipped Galvanised
9.25 (95)
10.5 (75)
11.75 (80)
12.75 (75)
14.5 (85)
5.3
80
0.78mm Electroplated
Zinc
7.75 (65)
8.5 (40)
9.5 (45)
11.0 (50)
12.5 (60)
3.4
50
0.88mm Iron-Zinc
11.0 (130)
11.0 (85)
11.25 (75)
12.5 (70)
13.5 (75)
5.5
80
0.6mm Galfan Zn-5%
9.0 (90)
10.5 (75)
11.0 (70)
11.0 (50)
11.5 (50)
4.15
65
0.7 mm Zalutite Zn-55%
A€
10.75 (125)
10.5 (75)
10.75 (65)
10.75 (50)
11.5 (50)
4.3
75
O)

TABLE 15
COMPARISON OF AC WELDING CURRENT GIVING RISE TO SPLASH/PITTING FOR MILD STEEL AND COATED STELS
Welding Speed m/min
2
4
6
8
10
Average increase in current compared to mild steel
Current Giving Rise to Pitting or Splash-AC Current ( ) - Percentage Change
0.75mm Mild Steel
12.25
11.0
10.5
10.0
10.0
kA
%
0.78mm A£
Coated
12.75 (5)
12.0 (10)
12.0 (15)
11.75 (20)
12.25 (25)
1.4
15
0.75mm Terne (Pb/Sn)
13.5 (10)
14.75 (35)
14.5 (40)
13.5 (35)
13.75 (40)
3.25
30
0.85mm Hot
Dipped Galvanised
12.25 (0)
13.5 (25)
14.5 (40)
15.0 (50)
15.5 (55)
3.4
35
0.78mm Electroplated Zinc
10.75 (-10)
11.0 (0)
12.0 (15)
13.0 (30)
13.25 (35)
1.25
15
0.88mm Iron-Zinc
13.0 (5)
13.0 (20)
13.5 (30)
13.5 (35)
14.5 (45)
2.75
25
0.6mm Galfan Zn-5%
A€
10.0 (-20)
11.5 (5)
12.25 (15)
12.25 (25)
13.0 (30)
1.0
10
0.7mm Zaiutite Zn-55%
A£
12.0 (-5)
12.5 (15)
13.0 (25)
13.0 (30)
12.5 (25)
1.85
20
TABLE 16
DECREASE IN WELDING CURRENT FOR CONTINUOUS PLUG FORMATION WHEN USING DC COMPARED TO AC CURRENT
Welding Speed m/min
2
4
6
8
10
Average Decrease kA in Current wi th DC % compared to AC
Decrease in Minimum Current when using DC compared to AC Current kA (%)
0.75mm Mild Steel
0.25 (5)
-
1.25 (20)
-
1.75 (25)
1.1
15
0.78mm A€
Coated
3.25 (30)
3.75 (35)
3.25 (30)
-
-
3.5
30
0.75mm Terne (Pb/Sn)
3.0 (30)
3.75 (35)
5.57 (45)
-
-
4.2
35
0.85mm Hot Dipped Galvanised
2.25 (10)
3.0 (30)
4.25 (35)
2.75 (20)
-
3.1
25
0.78mm Electroplated Zinc
2.0 (25)
1.75 (20)
1.75 (20)
3.25 (30)
-
2.2
25
0.88mm Iron-Zinc
5.0 (45)
4.75 (45)
4.5 (40)
5.25 (40)
5.25 (40)
4.95
40
0.6mm Galfan Zn-5%
A€
2.5 (30)
3.25 (30)
3.5 (30)
2.75 (25)
-
3.0
30
0.7mm Zalutite Zn-55%
A € *
1.5 (15)
2.25 (25)
2.5 (25)
2.0 (20)
-
2.1
20
O l CO
N.B. DC Welding of Zalutite failed to produce continuous plugs, comparison based on stuck welds
TABLE 17
GENERAL RESULTS FROM SOUDRONIC WELDING TRIALS
Steel Coating
Hot Dipped Galvanised
Electroplated Zinc
Iron Zinc
Zn5%Al
Zn55% Al
Al
Pb (Sn)
Steel Thickness mm
0.85
0.71
0.88
0.60
0.70
0.78
0.75
Elect -rode Force daN
400
400
400
350
400
400
400
Current Level kA
Stuck
9.5
10.5
11.0
12.5
10.5
10.5
9.5
Conţii
Coot.
12.5
-
-
-
12.25
íuous Current 2m/min
Brau
12.5
-
12.25
13.0
-
13.5
-
Cracki
12.5
-
-
-
-
-
U u <
12.51
12.51
12.25"
13.01
12.251
13.51
13.5»
Continuous Current 6m/min
Stuck
13.0
11.75
12.0
13.0
12.5
10.5
11.5
Coat
13.75
12.5
13.0
14.0
14.5
13.5
13.5
Brau
14.5
-
15.0
14.5
15.5
14.5
-
Crack«
14.25
13.5
14.5
15.5
-
-
16.75
M u *
15.75»
15.253
15.252
16.251
16.51
15.25*
17.53
Continuous Current lOm/min
Stuck
14.25
13.0
13.0
13.5
13.0
12.5
13.0
Co lit.
15.75
13.5
14.25
14.0
15.0
14.25
14.75
Brau
-
-
16.0
15.0
16.5
16.0
-
Cracki
16.75
15.0
16.0
-
-
-
16.75
Mai . '
16.751
16.253
16.02
16.52
18.01
17.02
17.01
Pulse Current 1 on/1 off 4.8 m/min
Stuck
14.0 13.0
14.0
13.5
14.0
14.0
13.0
14.0
Co nt.
18.0 15.0
15.5
15.5
15.5
16.5
15.5
15.5
Brau
18.0
18.0
.
.
.
.
-
Crack*
18.0 17.0
-
.
.
.
.
-
Max.*
18.03 17.03 +
18.03
17.03
18.02
17.03
17.5s
18.03
1 - Too Hot for Wire 2 - Wire Broke 3 - Splash
+ Pulsed Current 2 cycles on/2 cycles off Welding Speed 3.3 m/min
CD

TABLE 18
COMPARISON OF AVAILABLE WELDING RANGE. NARROW SEAM VS. WIRE WELD
Welding speed m/min
2
6
10
Welding Technique
Narrow Seam Wire Weld
Narrow Seam Wire Weld
Narrow Seam Wire Weld
Hot Dipped Galvanised
0.5 0
1.5 0.50
0 1.0
Electroplated Zinc
2.75 0
0.5 1.0
0.25 1.5
Iron-Zinc
2 0
2.25 1.5 1.0 1.75
Zn-55% A€
1 0
1.25 1.5 1.5 2.5
Zn-55% A€
'1.25 0
2.25 2.0 1.0 3.0
A€
2 0
1.5 1.75 0.75
| 2.75
Pb (Sn)
3.75 1.25 1.5
3.25 0
2.0
N.B. Wire Welds produced with approx. 15-33% higher force
en oi

TABLE 19
COMPARISON OF MINIMUM CURRENTS FOR CONTINUOUS WELD FORMATION NARROW SEAM VS. WIRE WELD
Nv Coating \ Type
Weld ingX Technique^v
Narrow Seam
Soudronic
Percentage Increase in current wi th wire welding
Minimum Current for Continuous Weld Formation kA
Hot Dipped Galvanised
6m/ min
11.75
13.75
17
10m/ min
14.5
15.75
9
Electroplated Zinc
6m/ min
9.5
12.5
32
10m/ min
12.5
13.5
8
Iron-Zinc
6m/ min
11.25
13.0
16
10m/ min
13.5
14.25
6
Zn-5% A f
6m/ min
11.0
14.0
27
10m/ min
11.5
14.0
22
Zn-55% A€
6m/ min
10.75
14.5
35
10m/ min
11.5
15.0
30
A€
6m/ min
10.5
13.5
29
10m/ min
11.5
14.25
24
Pb(Sn)
6m/ min
13.0
13.5
4
10m/ min
13.75
14.75
7
N.B. Wire Weld produced with approx. 15-33% higher force levels
TABLE 20
THE EFFECT OF ELECTRODE FORCE ON THE RESITANCE AT THE MINIMUM AND MAXIMUM WELDING CONDITIONS AT 6m/min
Mild Steel Thickness mm
0.75
1.2
Narowor Wide Seam
Wide
Narrow
Wide
Narrow
AC or DC Current
AC
DC
AC
DC
AC
DC
AC
DC
Minmimum or Maximum
Welding Condition
Min Max
Min Max
Min Max
Min Max
Min Max
Min Max
Min Max
Min Max
Dynamic Resistance Level pQ
Standard Force -50%
135 135
110 110
Standard Force
125 115
90 90
195 135
180 165
110 105
85 80
170 165
165 150
Standard Force + 50%
105 95
80 70
140 110
100 90
75 70
130 125
Standard Force
+ 100%
130 100
125 100

- 6 8
TABLE 21
DYNAMIC RESISTANCE LEVEL AT MINIMUM AND MAXIMUM WELDING CURRENTS FOR 1.2/1.4mm THICK STEELS OF DIFFERENT RESISTIVITY
Welding Speed m/min
2
6
Current Parameter
Minimum Maximum Range
Minimum Maximm Range
Dynamic Resistance Level nii Steel Type
Mild Steel
200 (230) 135
65 (95)
175(195) 160
15(35)
Re-Phosphorised
180(220) 150
20 (70)
190(210) 164
26 (46)
Niobium Treated
200 (230) 128
72(102)
168(180) 152
16(28)
Dual Phase
200(220) 120
80(100)
172(180) 160
12(20)
Dynamic resistance at minimum current refes to value at continuous weld plug formation, the figure in brackets refers to the dynamic resistance at the formation of a stuck weld.

69
TABLE 22
COMPARISON OF RESISTANCE LEVEL FOR AC vs. DC AND NARROW V3. WIDE SEAM AT A WELDING SPEED OF 6m/min
Mild Steel Thickness
mm
0.75
0.95
1.2
Narrow or Wide Seam
Wide
Wide
Narrow
Narrow
Wide
Wide
Narrow
Narrow
Wide Wide Narrow Narrow
AC or DC
Current
AC
DC
AC
DC
AC
DC
AC
DC
AC DC AC DC
Electrode Force kN
3.5
3.5
3.0
3.0
4.0
4.0
3.5
3 5
4.8 4.8 4.0 4.0
Dynamic Resistance yß
Minimum Current
Condition
125
90
195
180
130
100
200
170
110 85 170 165
Maximum Current
Condition
115
90
135
165
120
90
155
155
105 80 165 150

7 0 -
PEAK CURRENT
/
r e
AVG CURRENT ( + PULSES) /
/
11-1/2 CYCLE l \ j
21 » I CYCLE
A
Irms' to t - t 0
F I G . 1 SCHEMATIC CURRENT VS. TIME CYCLE
l o w c y c l e r i p p l e DC w a v e f o r m
FIG.2 WAVEFORM OF SECONDARY VOLTAGE IN A RECTIFIED
WELDING SYSTEM

71 -
Wide
V Narrow
O
cz^ Mash
O Wire
FIG.3 BASIC TYPES OF RESISTANCE SEAM WELDING
-72
.Wire feed
gm şg
FIG. 4 PRINCIPLE OF THE SOUDRQNIC PROCESS

co
FIG.5 KUKA NARROW SEAM WELDING MACHINE TOGETHER WITH BRITISH FEDERAL DC POWER PACK, INSTRUMENTATION RACK, MICROCOMPUTER AND PLOTTERS

- 74-
FIG.6 SOUDRONIC WELDING MACHINE MODEL Rdk 100 TEuP
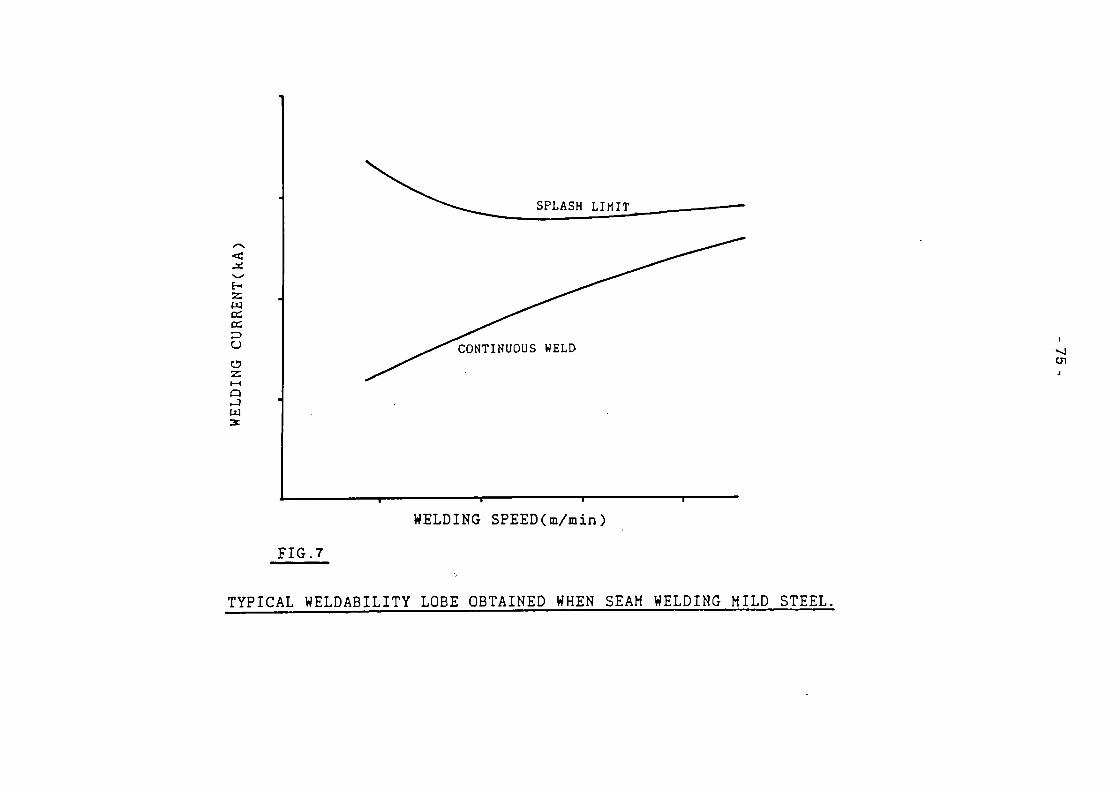
< JÉ
friz; w (X
ce
O z I—I
a w
SPLASH LIMIT
CONTINUOUS WELD ai
i » i
WELDING SPEED(m/min) FIG.7
TYPICAL WELDABILITY LOBE OBTAINED WHEN SEAM WELDING MILD STEEL.

•v] O)
FIG-8
WELDABILITY LOBES FOR NARROW SEAM WELDING OF MILD STEEL WITH a.c. CURRENT

03 WELDABILITY LOBES FOR NARROW SEAM WELDING OF MILD STEEL WITH d. c. CURRENT,
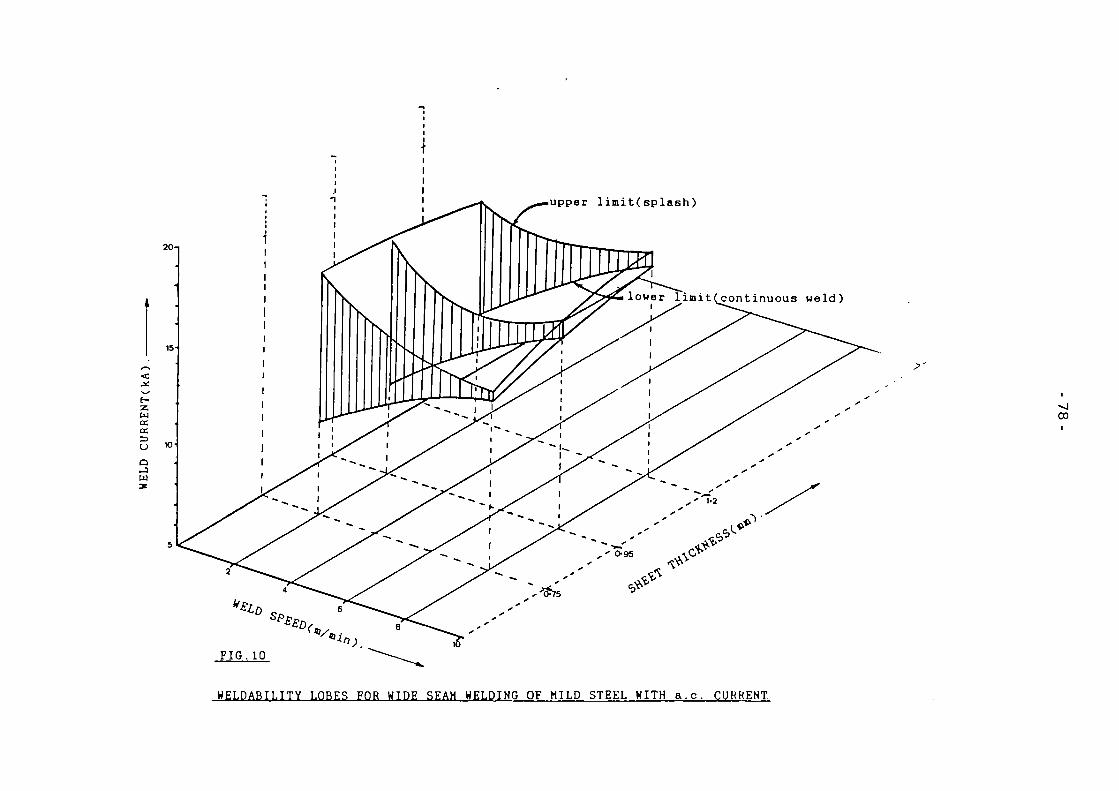
< ^ f-z W cc IX
Q ►J w
upper 1imit(splash)
00
FIG.10
WELDABILITY LOBES FOR WIDE SEAM WELDING OF MILD STEEL WITH a.c. CURRENT.
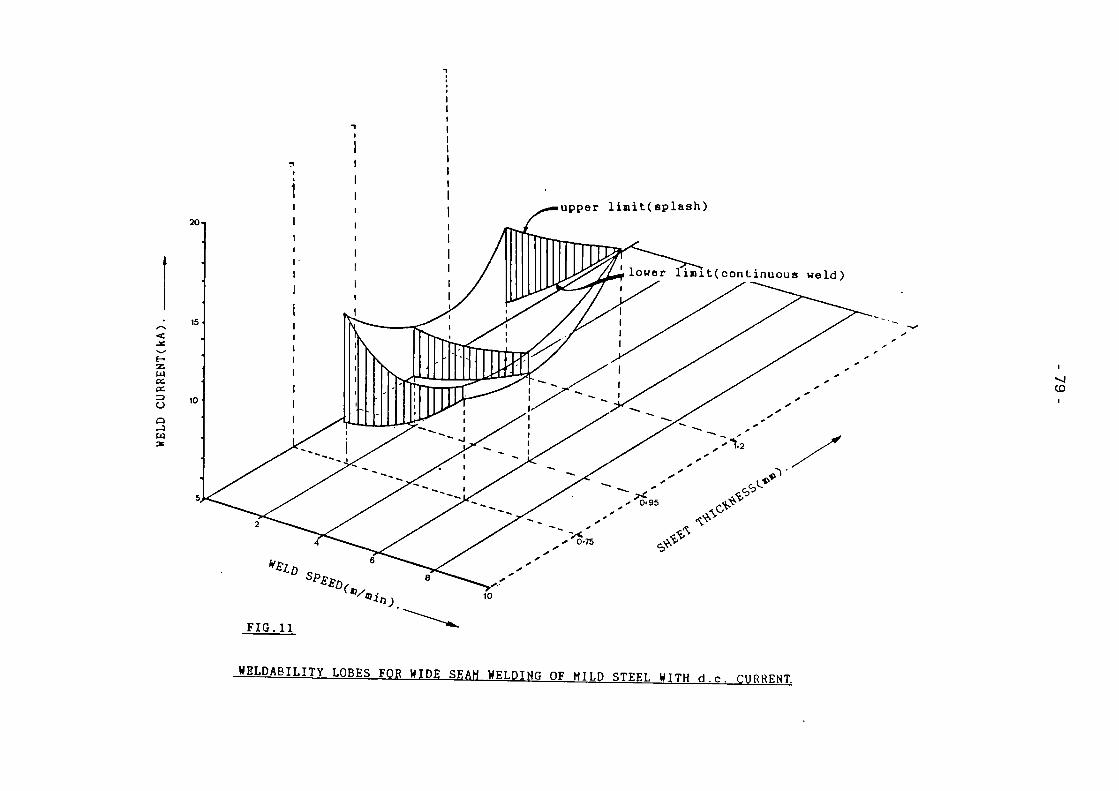
i n i t ( c o n t i n u o u a w e l d )
CD
"'«inj
F I G . l l
WBLDABILITY LOBES FOR WIDE SEAH WELDING OF HTLD STEEL WTTH d.c. CURRENT
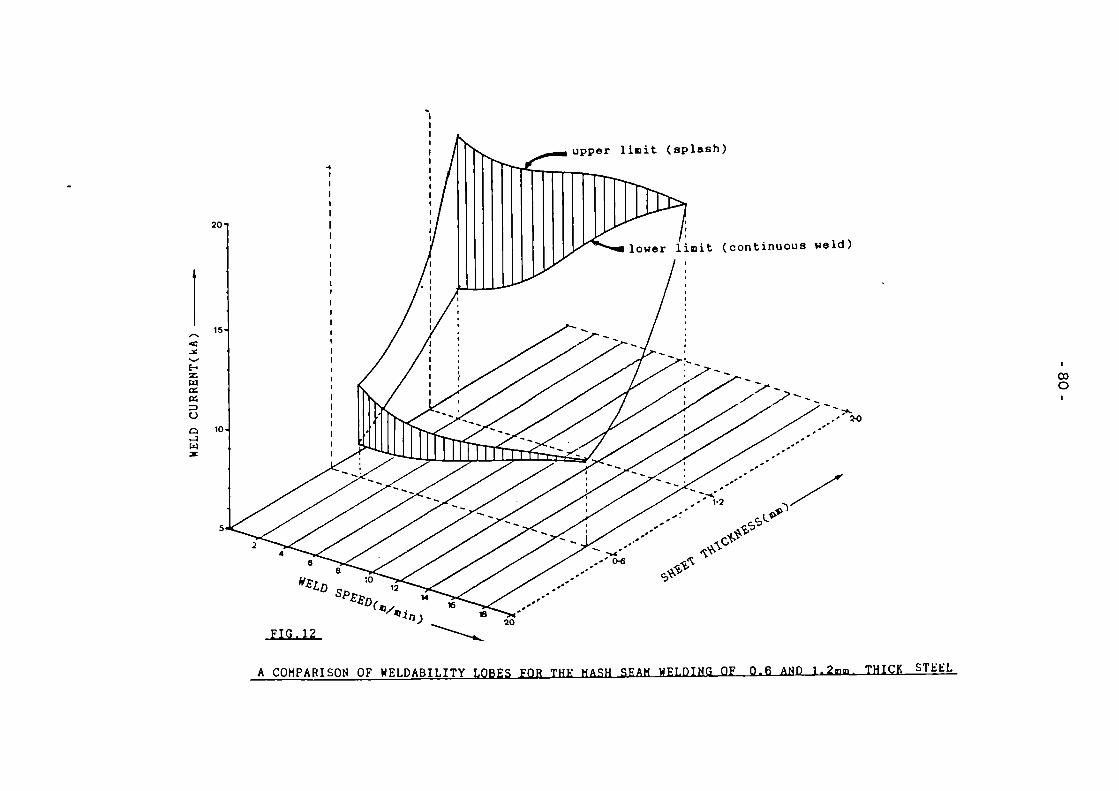
upper limit (splash)
imit (continuous weld)
00 O
A COMPARISON OF WELDABILITY LOBES FOR THK HASH SEAH WELDING QF Q.6 AND 1.2mm. THICK STKKL
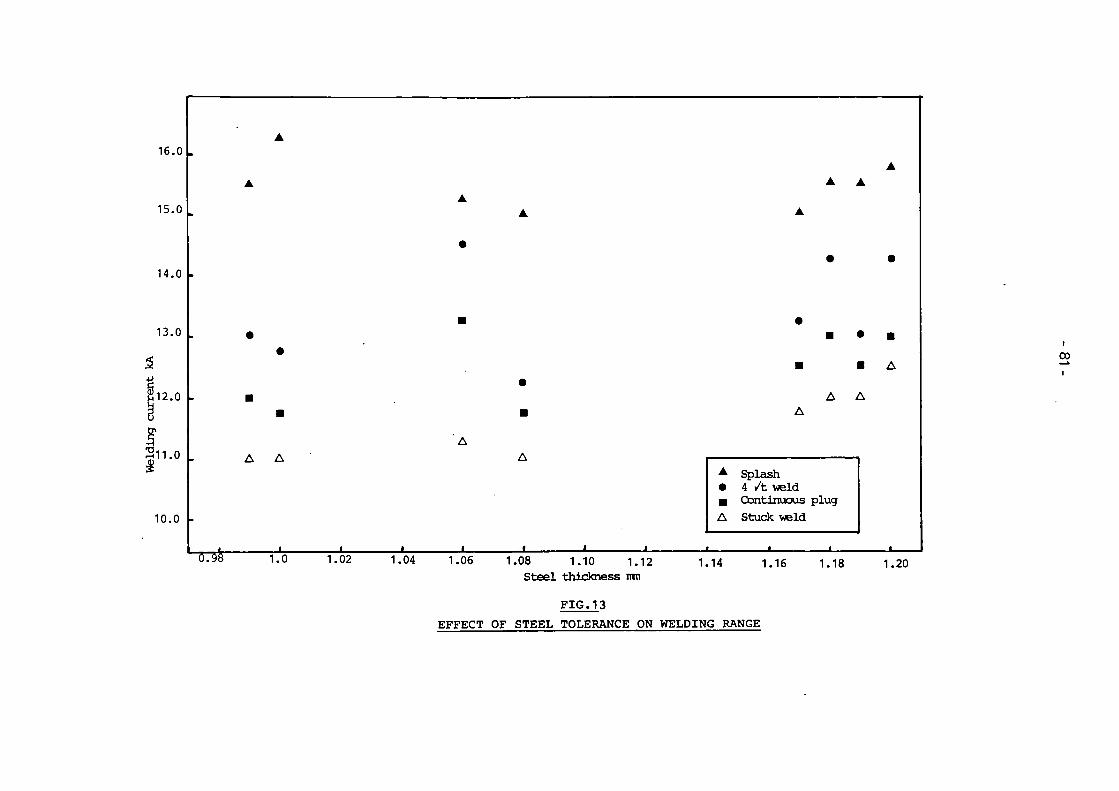
16.0 .
15.0
14.0
▲ ▲
13.0
12.0
■ •
A A
CO
T) 11.0
10.0
A A
"o£" _ i _
A Splash • 4 /t weld H Continuous plug A Stuck weld
1.0 1.02 1.04 1.06 1.08 1.10 1.12 Steel thickness ititi
1.14 1.16 1.18 1.20
FIG.13 EFFECT OF STEEL TOLERANCE ON WELDING RANGE
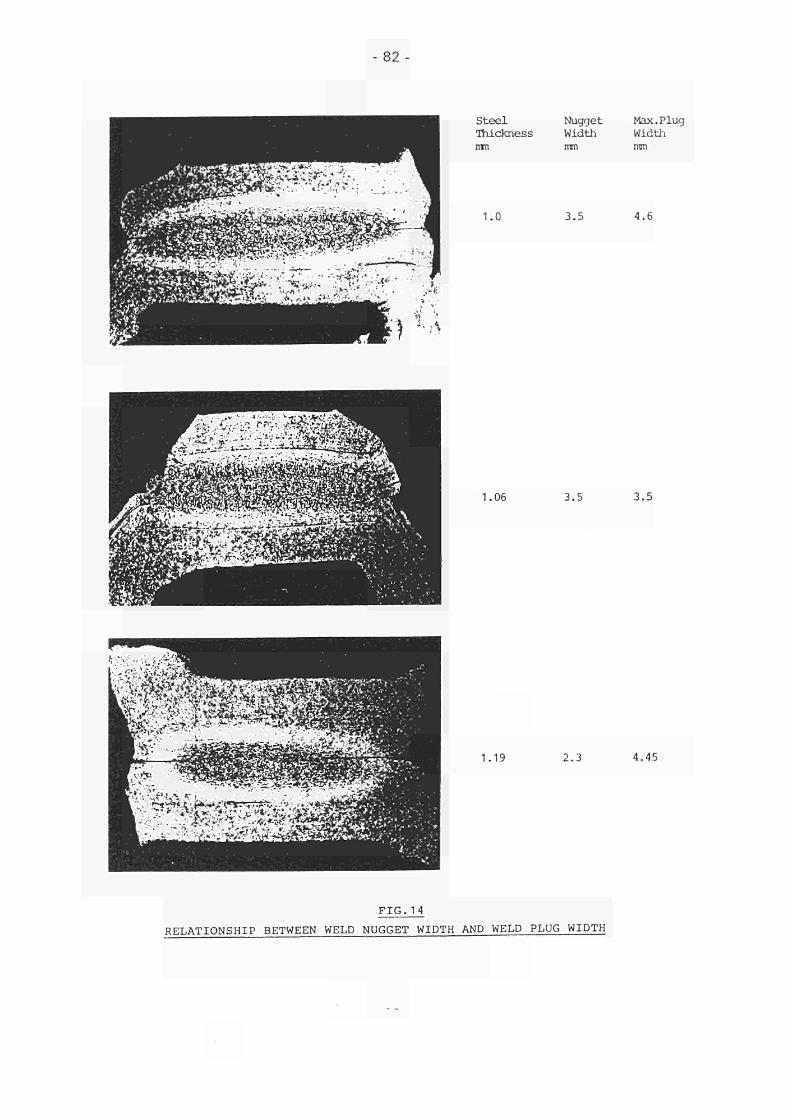
- 82-
Steel Thickness nm
Nugget Width nm
Max.Plug Width mm
1.0 3.5 4.6
1.06 3.5 3.5
1.19 2.3 4.45
FIG.14 RELATIONSHIP BETWEEN WELD NUGGET WIDTH AND WELD PLUG WIDTH
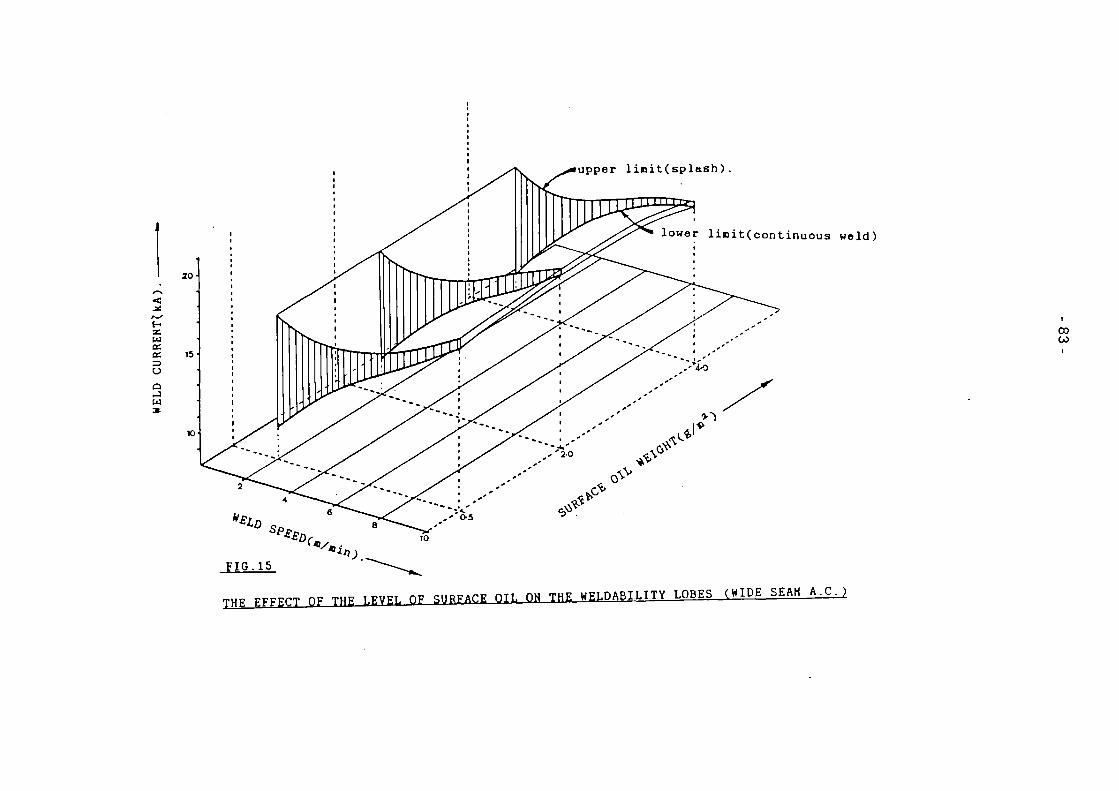
upper linit(splash)
lower lÌBÌt(continuous weld)
00 co
juv VVVVCT OF T » F T.FVKT. OF g.fp^m OTT. ON THF WK1.DABILITY T.ORKS (WIDE SEAM A.C.)
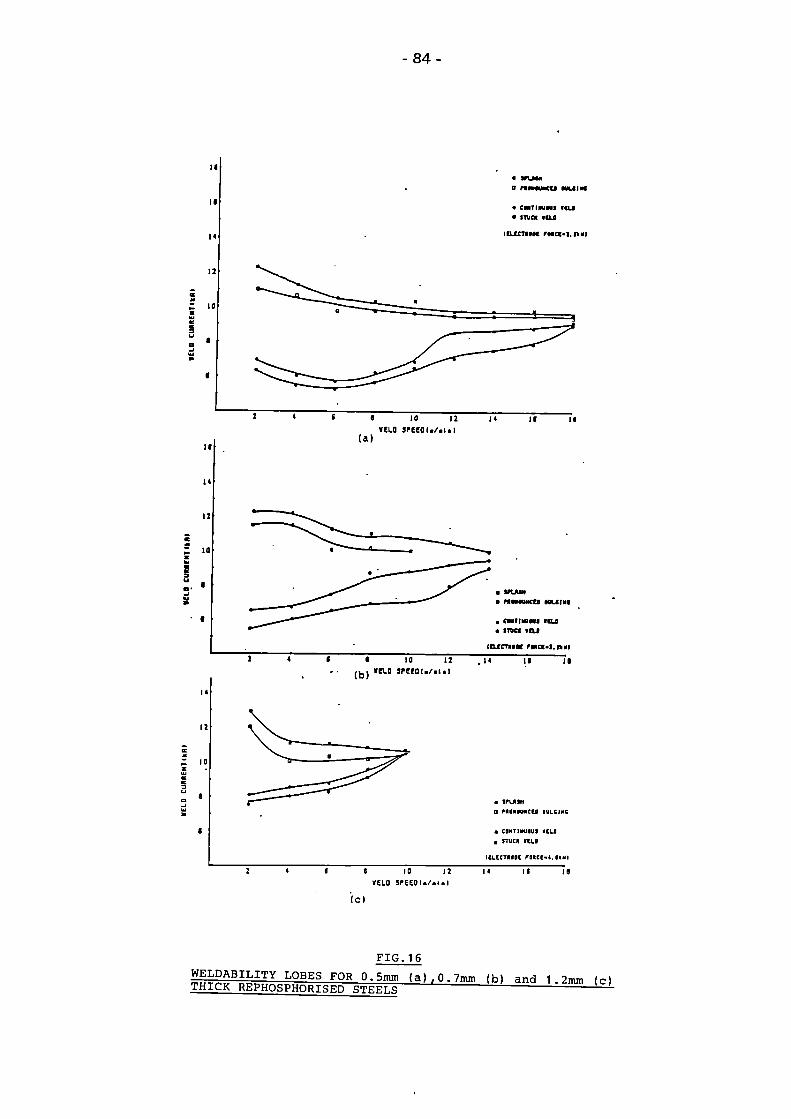
10
12
; io
84
« 10 12 •CLO Jr>EEO ( . / . ! ■ I
(a)
O f l M M I WUIM
• CMTIMMS «CU • ITUCK «CLJ
l u a i m rMcc-i.niii
14 11
• VLAM ■ racMuacu wiciac
a CMTIMIMJ «CU • i n o icu
¡curri«« 'Mct-I.mm
(b) • IO 12
»en.0 3P( to ( . / . i . i . i« i i
• irmi* Q PMMtMCCO IULCINC
• CONTINUOUS «CLO
, ITU» »IL«
ICLCCTMOC r»«CE-i. i««i
I IO 12 'ELO 5 Í - E E 0 I . / . I . I
M I I
( C )
F I G . 1 6
^ P ? " " ™ L0BES F0R ° -
5 n U n <a>'
0-
7""" (b) and 1.2mm t*\
THICK REPHOSPHORISED STEELS ~L
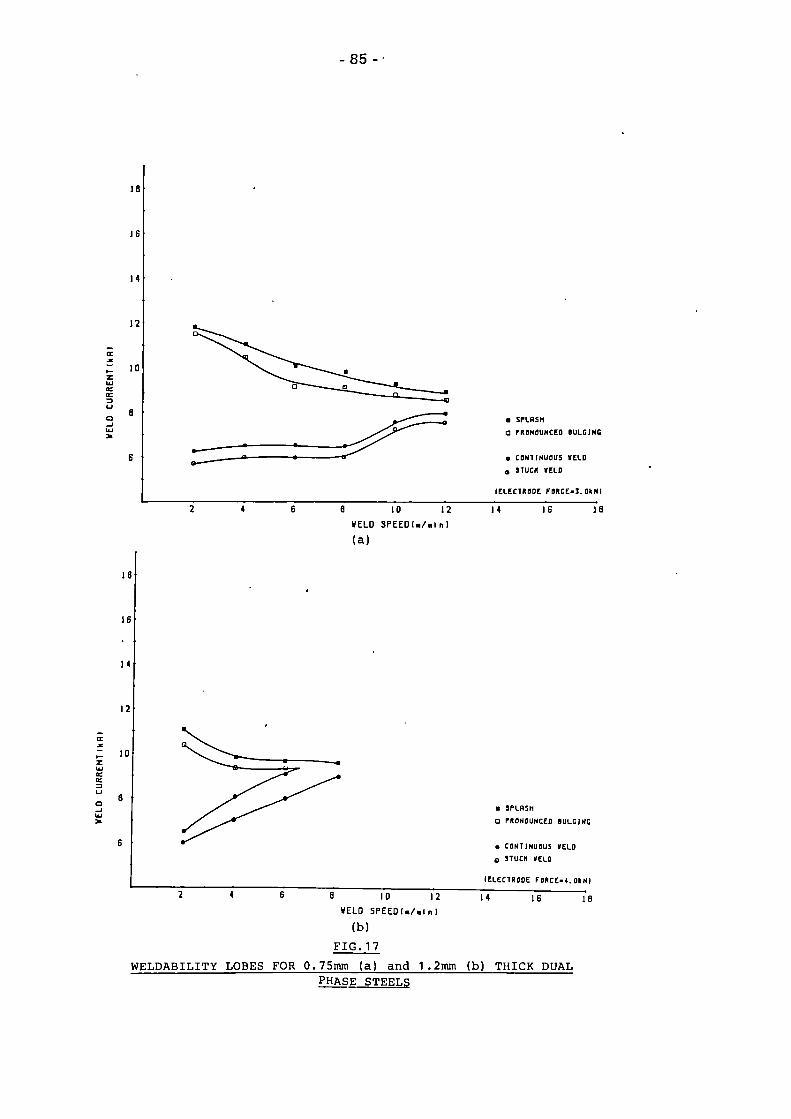
- 8 5 -
16
J6
14
12
i IO
8 ■ SPLSSM
O rRONOUNCED BULGING
• CONTINUOUS «ELO a STUCK VELO
(ELECTRODE FORCE-3.OkNI
10 12
WELD SPEED! . / . In )
( a )
14 16 IB
18
16
14
12
Z 10
■ SPLASH
O rRONOUNCEO BULGING
• CONTINUOUS VELO O STUCK «ELO
lELECTROOE FORCE- i .OkNl
16 2 * 6 8 10 12 14
WELD SPEEO(«/«lnl
(b)
F I G . 1 7
WELDABILITY LOBES FOR 0 .75mm ( a ) a n d 1.2mm (b) THICK DUAL
PHASE STEELS
16
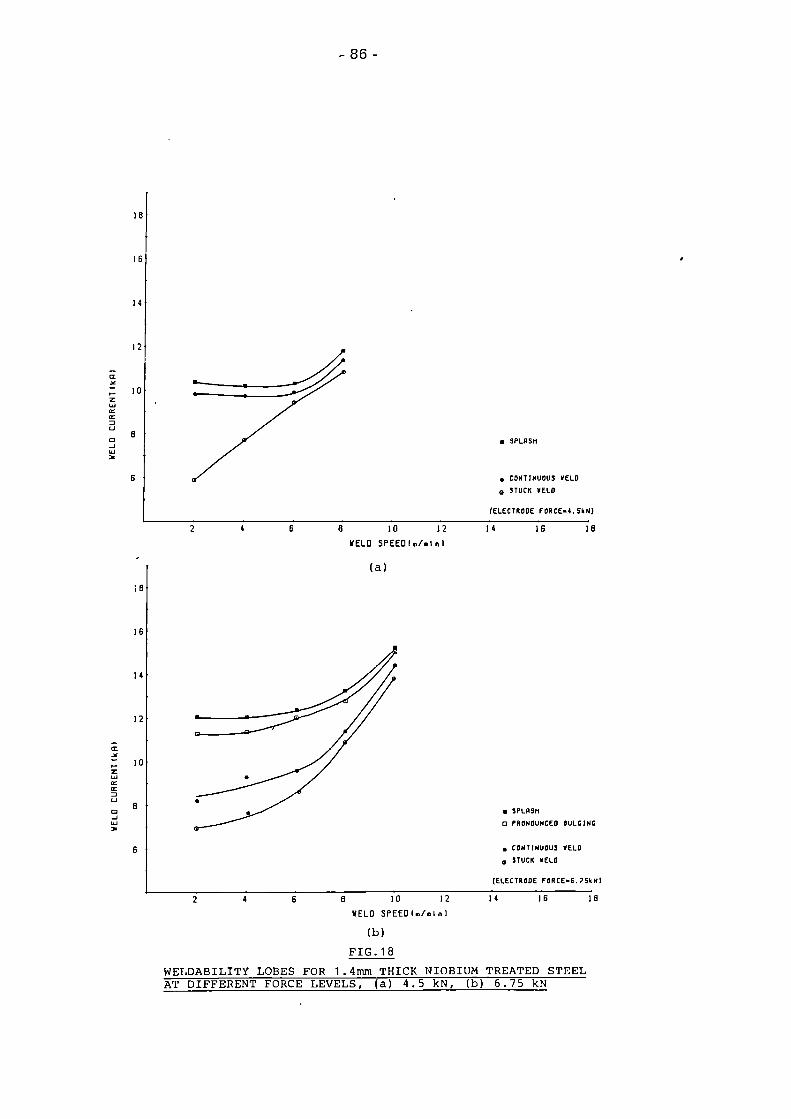
16
14
12
^ 10
86 -
8 10 12
WELD S P E E D ! « / . I n i
(a)
■ SPLOSH
• CONTINUOUS VELD a STUCK «ELO
[ELECTRODE FORCE-4.SkN)
M IS 18
18
16
14
12
ID
■ 5PLPSH
O PRONOUNCED BULGING
■ CONTINUOUS «ELO
„ STUCK «ELD
(ELECTRODE FORCE-6.?SkNl
8 10 12
WELD S P E E D ( « / « I n i
(b) FIG.18
M 16 18
WELDABILITY LOBES FOR 1.4mm THICK HIOBIUM TREATED STEEL AT DIFFERENT FORCE LEVELS, (a) 4.5 kN, (b) 6.75 kN
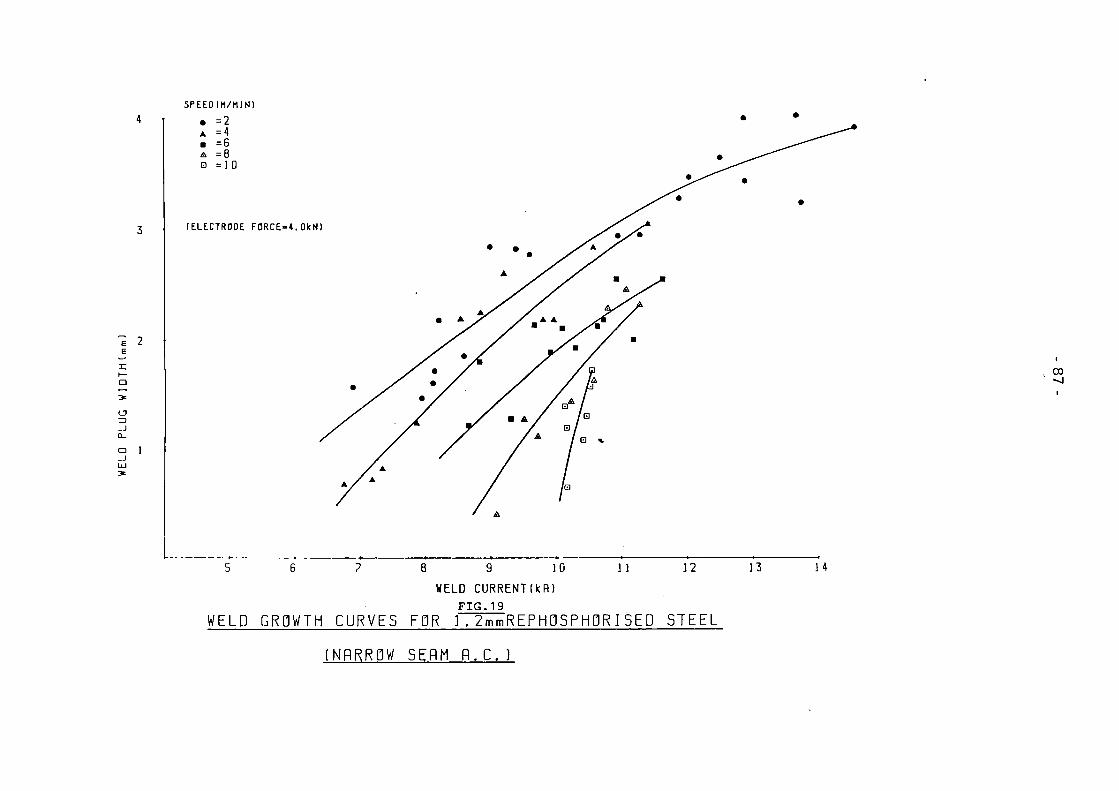
E 2 e x i— o
ZD _1 0_
a ] _ i LlJ
SPEED
• ▲ ■ A IH
IM/MJN)
= 2 = 4 = 6 = 8 = 10
IELECTR0DE FORCEM. OkN
CO
5 6 ? 8 9 10 11 12 WELD CURRENT!kR)
FIG.19 WELD GROWTH CURVES FOR 1 .2mmREPH0SPH0RI SED STEEL
13 in
ÍNRRR0W SERM fl.C.)

88
^ ' :"'
üÄ,
■&V*
Tensile test specimen
FIG.20 INDIVIDUAL SPOT WELDS PRODUCED WHEN USING
PULSATION WELDING AT A WELDING SPEED OF 6m/min

10
89
<
■p • c 0>
U 6 3 Ü
-O iH 0 , 5
■ nnxmud (SPLBSM/cRflcn I N C )
• LI OU I 0
A u i u m u l O STJCK rfELO
(ELECTRODE FOUCE«! Ok Klj
10
Sa •P C 01 u u? 3 u
I6
10 12 14
«ELO SPEED l « / « . ' n j
(a)
16 16 20 22
■ nRXIrtUMiSPLBSH/CRfll« INU
• LI OU I O ▲ niNinun
D I IU IK irfELO
(ELtCrHOOE FIIRCE-J.OnMj
2 « 6 8 IO 12 I * Ib 16
WELQ 5PEE0 l -Vm.nl
(b) F I G . 2 1
WELDABILITY LOBES FOR MASH SEAM WELDS IN 0.6mm MILD STEEL (a) AC c u r r e n t T&l DC c u r r e n t
20 22
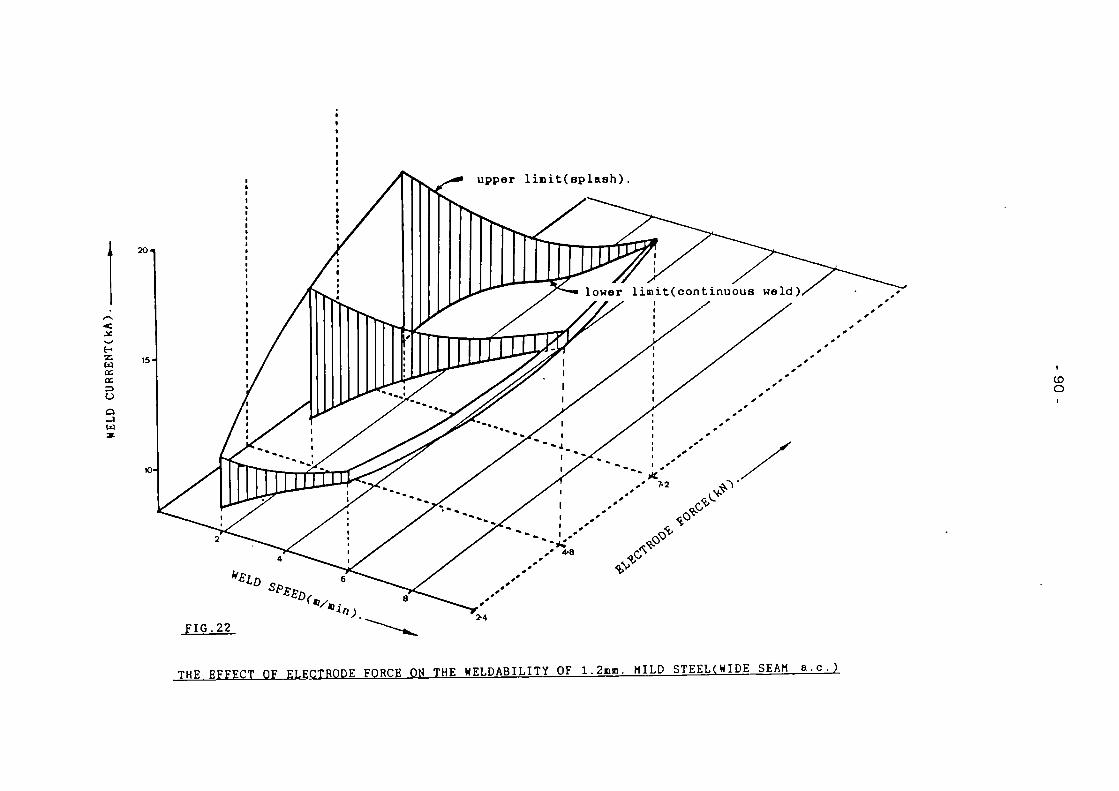
< JA
H ■zu W CC
a.
o J w
CD O
FIG.22
TH E EFFECT OF ELECTRODE FORCE ON THE WELDABILITY OF 1.2nn. MILD STEEL(WIDE SEAM a.c.

91
JPCOI.H/HJN) • =2 A = 4
(ELECTRODE FORCE-2. UN.)
10 12 14 WELD CURRENTIkfll
(a)
(ELECTRODE F0RCE-7.2kN; » y
12 14 16 VELO CURRENT(kB)
18
(b) FIG.23
EFFECT OF ELECTRODE FORCE ON WELD GROWTH CURVES, MILD STEEL, WIDE SEAM, AC CURRENT

92
16
14
12
10 ROLLER SPOT WELDING 7 c ? c I . . 0 N - 5 t o 2 4 0 F F (SPEED DEPENDENT! ..i.;n/n]N2«flFF-iõH7BiNSnrr
a SPLASH
* 4 VT »ELO ■ CONTINUOUS VELO O STUCK »ELO
(ELECTRODE FOItCC-t.OkN)
8 10 12 VELD SPEED(■/■Ini
FIG.24 14 J6 18
WELDABILITY LOBE FOR ROLLER-SPOT WELDING OF 1.2mm MILD STEEL (WIDE SEAM A.C.)
€>K
''y\k,' *
I' 'I 7/"/"/////"/"i|||l"| 100 110 120
I' 'M |M Mil |H|il| ID HI |M II I'MIIIU'I 130 140 150
I'HIiiini 160 170 110 IftO
•»llnilillllillllllllllllllllllllllllllllllllllllllllilllllllllllllllllililll FIG.25
DIFFERENT HEAT PATTERNS AS THE WELDING SPEED INCREASED WITH ROLLER-SPOT WELDING; WELDING CURRENT 7 CYCLES ON-TIME

20
< JÉ •*• E-z w os ae.
o o -j w
uppar liBit(splash).
CO CO
FIG.26
WELDABILITY LOBES FOR NON MARKING WELDS IN 1.2m«. MILD STEEL AT THREE FORCE LEVELS.
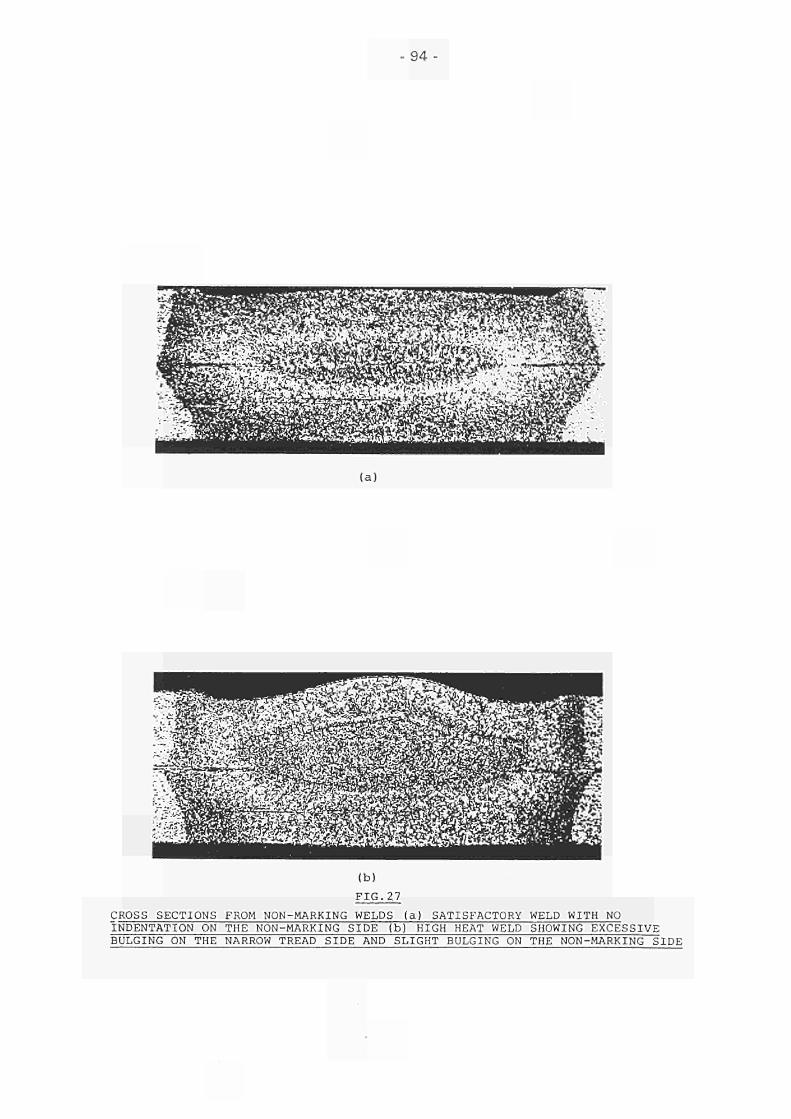
- 94-
(a)
(b) FIG. 2.7
CROSS SECTIONS FROM NON-MARKING WELDS (a) SATISFACTORY WELD WITH NO INDENTATION ON THE NON-MARKING SIDE (b) HIGH HEAT WELD SHOWING EXCESSIVE BULGING ON THE NARROW TREAD SIDE AND SLIGHT BULGING ON THE NON-MARKING SIDE

( ■ ) ( b )
( c )
1 1 5
WELD S P E E D d i / n i n )
X H
(d)
-ù. -^
rr^ WELD SPEED (n/nln)
■ BURN THROUGH
A SHEET SEPARATION
A START OF SURFACB BURNIW
• CONTINUOUS WELD
O STUCK WELD
CD Ol
FIG ?fl WELDABILITY LOBES FOR THE NARROW SEAN WELDING OF LEAD / TIN COATED STEEL (ELECTRODE FORCE=3.0kN)
(i) u.c.2 CYCLES ON, 2 CYCLES OFF (b) a.c.3 CYCLES ON. 1 CYCLE OFF
(c) m.c. CONTINUOUS CURRENT (d) d.c. CONTINUOUS CURRENT
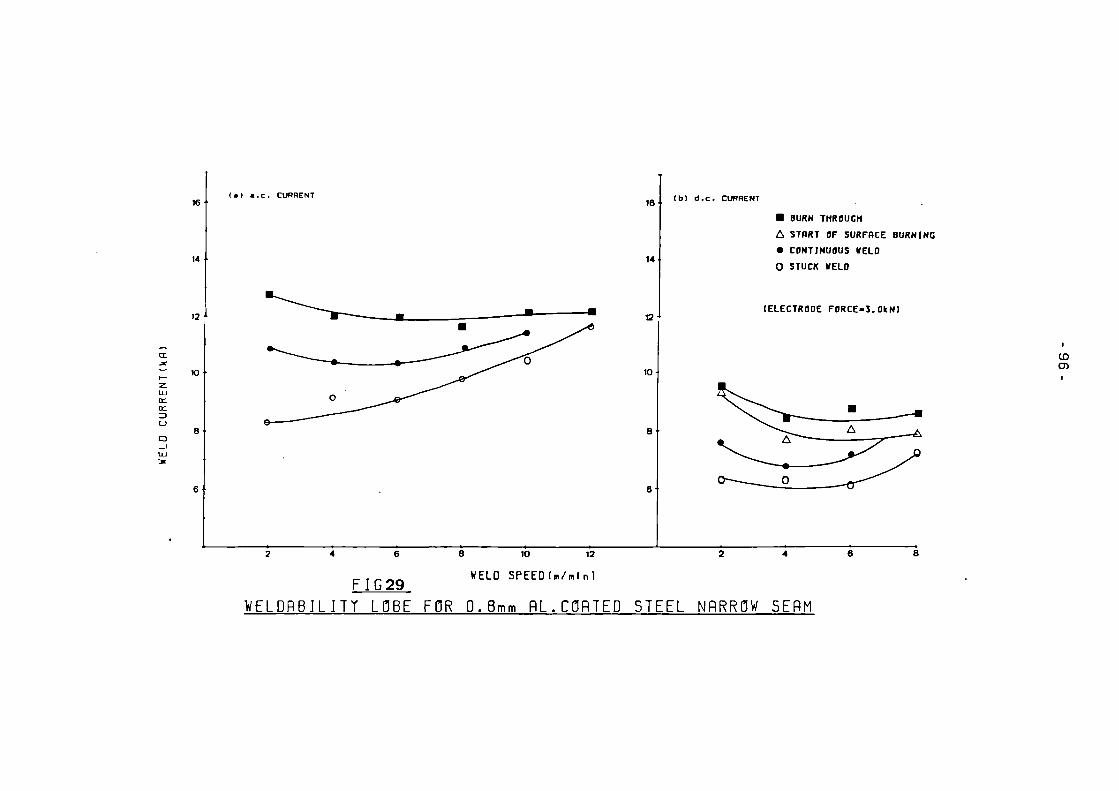
LU
16-( * ) « . c . CURRENT
12 •
- 10
16
14
oJ
10
( b ) d . c . CURRENT
6
10 12
■ BURN THROUGH A STBRT OF SURFACE BURNING • CONTINUOUS HELO O STUCK »ELD
(ELECTRODE FORCE-3.OkN)
WELD SPEEDlWmln)
V£LDRBJLITT LOBE FOR 0.8mm RL.CORTEO STEEL NRRROW 5ERM
CD CD
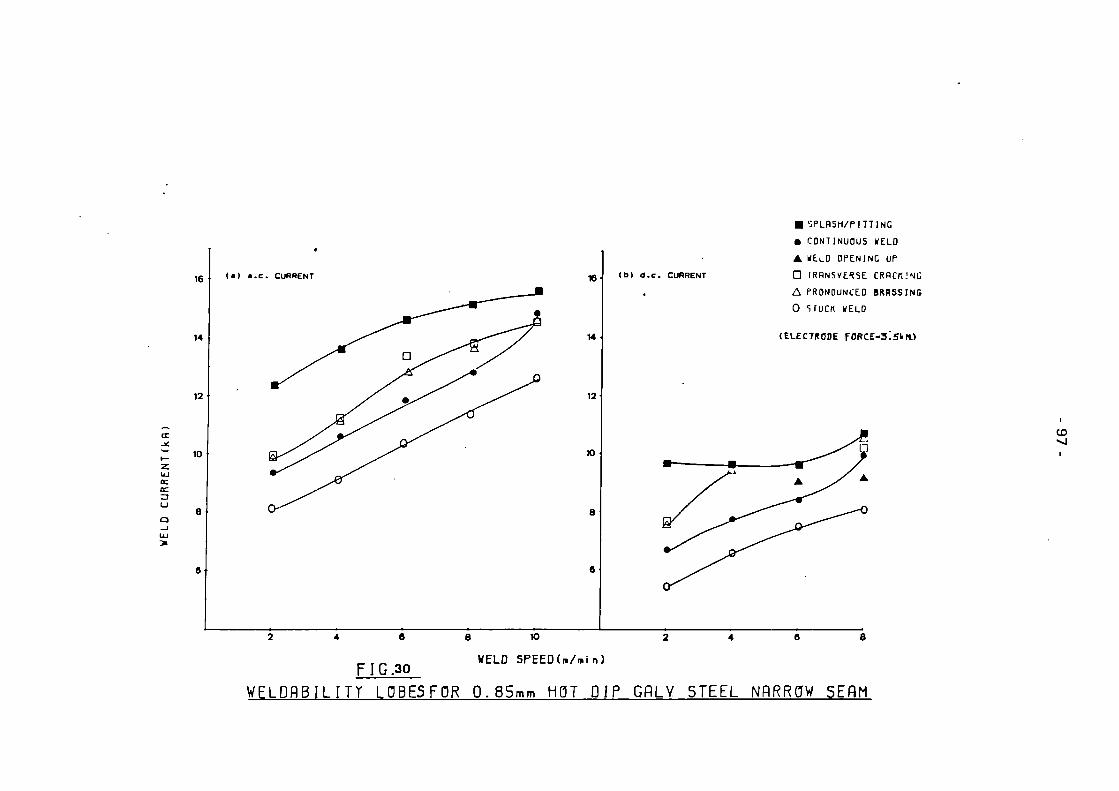
cr
3
16
14
12
10
( * ) a . c . CURRENT «•
M
12
10
( b ) d . c . CURRENT
e
F IG .30
a io
WELD SPEED(n/min)
■ SPLASH/PITTING
• CONTINUOUS WELD
▲ YUD OPENINC UP
D TRPNSVESSE CROCKING
A PRONOUNCED BRASSING
0 "HUCK KELD
(ELECTRODE FORCE-SiSkrO
CD
WELDHBIL f TT L0BE5F0R 0.85mm HOT DIP GflLV STEEL NARROW SEAM
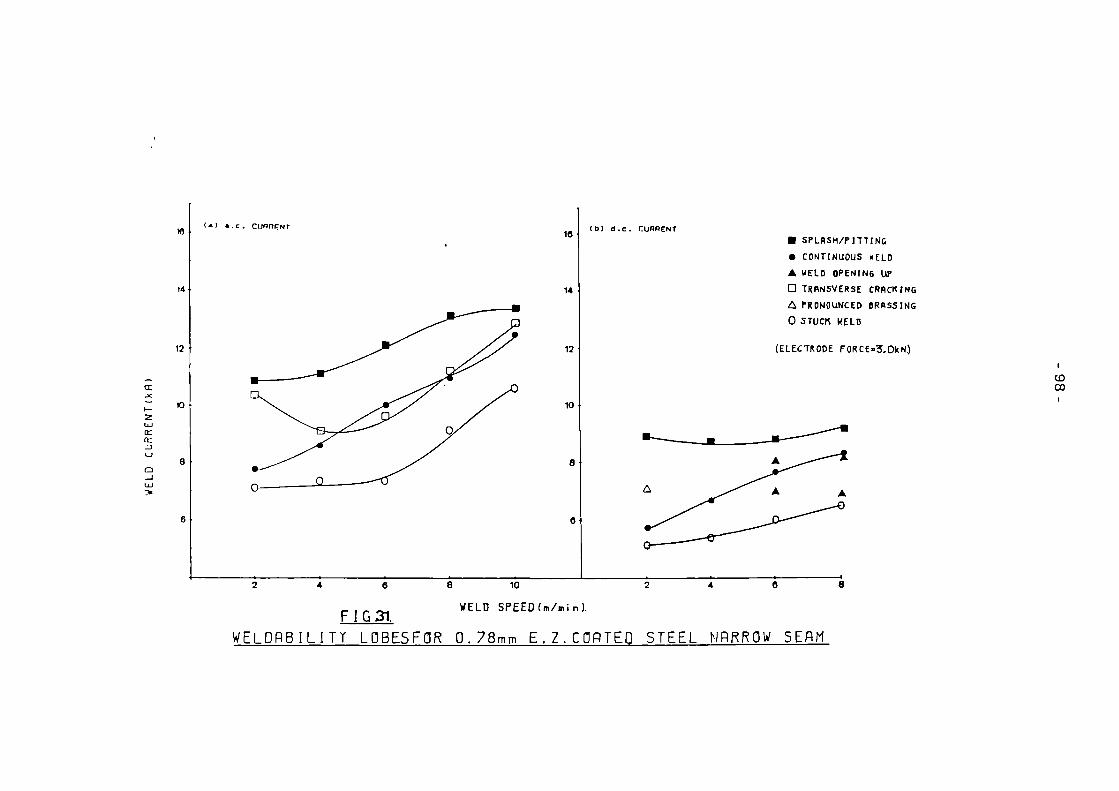
a: (t:
16 ( * ) « . c . C U R R E N T
12
10
12
10
( b l d . c . CURRENT
8
■ SPLASH/PITTINE • C O N T I N U O U S K E L D
▲ VELD OPENING UP
D T R A N S V E R S E C R A C K I N G
A T F O N O U N C E D B R A S S I N G
0 S T U C K K E L D
( E L E C T R O D E F O R C E J Ó N . )
2 4 6 8 10 2 4 6
WELD SPEED (m/min). F I G 31,
WELDPBILITT L0BE5F0R 0.78mm E.Z.CORTEO STEEL NRRROW SEflM
CD CO
ce ce
UJ
ie
14
12
< » ) a . c . CURRENT 16
14
12
10
( b l d . c . CURRENT
B 10 12
WELD SPEED(m/m¡n)
■ SF,LflSH/PrTTJN&
• CONTINUOUS HELD
0 STUCK WELD
(ELECTRODE FORCE-J. 5VU\
10
F I G .32 WELOf lBIL ITY LOBESFOR 0.88mm I .Z .COATED STEEL NRRRQW SERM
CD CD

ai ai 3
16
14
12
10
( * ) a . c . CURRENT 16
12
10
I b ) d . c . CURHtNf
FI G .33
8 10 12 WELD SPEED(m/min)
14
■ SPLASH/PITTING. • CONTINUOUS VELD A WELD OPEN INS UP A PRONOUNCED BRASSING. O STUCK WELD.
(ELECTRODE f0RCE»25kN).
O O
WELDABILITY LOBE FOR 0.6mm ZINC-5 7. ALUMINIUM COATED STEEL NARROW SEAM.

Œ
UJ te ai
o _ i tu
16
14
12
10
0
( • . c . ) CURRENT 1«
14
12
10
0
( d . c . ) CURRENT
2 4 S S 10 2 *
VELD SPEED (m/m In.) FIG. 34.
WELDABILITY LOBES FOR 0 . 7 n n . 30 'L ZINC-ALUHINIUH COATED STEEL HARROW SEAM.
■ 5PLRSM/PITTING
• CONTIGUOUS WELD
A "RONOUNCEO BR^S'INC
O STUCţ WELD
(ELECTRODE F0KCE«3.0kN)

-102
FIG.35 PEELED SURFACE ON LOW TEMPERATURE WELD IN GALVANISED STEEL SHOWS FRACTURE THROUGH THE ZINC ALONG THE EDGE OF THE WELD
FIG. 36 PEEL TESTED SPECIMEN IN ELECTROPLATED ZINC SHOWING CRACKS ALONG THE EDGE OF THE WELD PLUG

te en Z)
16
16
14
12
10
continuous
. ■ MRXJMUM ▲ CRACKING D BRRSSJNG « CONTINUOUS KELD 0 STUCK WELD
lELECTROOC F0RCE = *. OkNI
10 HELD SPEEDIm/min)
FIG.37
Ion 1 off
O CO
4.8
WELDRBILJTT LOBE FÜR 0.75 mm IERNE CARTED STEEL ( 5ÜU0RDNI C WELDING

-104
16
16
14
12
IO
continuous
16
16
14
12
z m
■ »PK I MUH A innen INL
• COU I IMU DU5 ULLO O ITUlít tftLO
i u t e n»o i r o m i c i n««i
m HELO SPEEOU/m.n l
(a)
continuous
■ nnxiHun A CROCA INI.
D iRtmiNi, • cflNiiNunus « tm 0 5 luin «tuo
KLUUtODE. FflItCL»! ai NI
2 * fa 5 in Í Í E L O SPEED I « / » , m
(b) F I G . 3 8
WELDABILITY LOBES FOR WIRE WELDING ZINC COATED STEELS (a) 0.85mm HDG (b) 0.88mm IZ coated steel
2on 2gff ion iivt
Ï6
33 4-8
1on 1off
4 . 6
-105-
Coating Type
Lead-tin
m^im^^sm -•■• •■1*''. -T ". ' *ƒ■• -'i !** ., -¿-..."T-' ;■* •'
*?*&%& Aluminium
Hot dipped zinc
Ironzinc alloy
Zinc 5%A1
FIG.39 EXAMPLES OF DIFFERENT SOLIDIFICATION STRUCTURES WITH DIFFERENT COATED STEELS WIRE WELDING ~~

-106
(a)
'Sh^.-y;
(b)
FIG.40 EXAMPLE WHERE BOND FORMED BETWEEN ELECTRODE WIRE AND SHEET
SURFACE AT HIGH HEAT IM PUT

107
(a) x25
(b) x250 (c)
FIG.41 EXAMPLES OF BRASS PENETRATION IN HOT-DIPPED ZINC WELD (a) and (b) PLANAR SECTIONS, (c) LONGITUDINAL SECTION
o 00
Zn Cu
HOT DIPPED ZINC FIG.42
ELECTRON PROBE IMAGES SHOWING THAT INTERGRANULAR NETWORK CONSISTS OF Cu and Zn

109
GRAIN A Grain
Boundary
GRAIN B
Liquid
B = DIHEDRAL ANGLE
WHEN -25J < i ass
0 AND THE LIQUID PHASE RUNS ALONG THE GRAIN BOUNDARY
WHERE STRESSES PRESENT LIQUID CAN PENETRATE AT DIHEDRAL ANGLES ABOVE ZERO
FIG. 43 SCHEMATIC DIAGRAM OF FACTORS AFFECTING GRAIN BOUNDARY WETTING

Current
I ! ! I! I ! 11 ! mm m l ï
3.3m/min
\l\l\ Ì I Ì Ì Ì V
i 'i i
II l i
us h i !
ill! "¡I
W s
40% Phase Shift 1 60% Phase Shift i
10 m/min.
I \ \ \ \ \ \ \ ' \ \ \ \ \ \ 1 '• \ •■ ',
i i I u s H M s 11 u n ; 1 ] 11.; i • Ì ; ;| v- 5Í1 M iJ\ iWl V\ ÍÜ: A/1 ig\ f i \ »J N\ 4 iJ\ Ai\ N
l .i1 JJ; ^ /¿I ?»
; ^ ?^ ^ ^ ^ * \ ţ \ \ \ i i i i ' .», i i 'ui I*: m i«! Li MI IA; \A: 'VU M IA: VI. VU a. i i .-, Ú ¡ J ; I
: ' I . 4. i : \i' H ! V o l t a g e : ' j¿! ;j'. ¿j 'j J¡\ ,{', ¡j; Jj: .,, „. „ . , .,, ,. ... ,. (,.
' AÍ i ¡ i: i.' ï ï ï ¡i! Ü¡ i1 i«; ni IA| Ü; t¡ ii¡ ü| ii v! ili \\ V -ii «I "i! 1- t; *¡ I j j l i í ¡ i I l i l i M I M í M I i I M ï i j j |
v i\h *• i\i¡í\\ i í ! ; i í i i
FIG.44 CURRENT MID VOLTAGE TRACSS FORMILD STEEL, DUAL CURRENT/SPEED PROGRAMME, MAXIMUM
— " CURRENT CONDITION
10 T
7.5
tu o oc o
IU a O ce t— C_l ÜJ _J ÜJ
Electrode Force - DC Current
Electrode Force - AC Current
1.0
WELD TJMEISECDNDS] 2.0 3.0
FIG.45 THE EFFECT OF AC AND DC CURRENT ON ELECTRODE FORCE
1.2mm Mild Steel Wide Seam Welding Welding Speech 2-4m/min
Current Programme
7 cycles on 24 " off (Roller spot) 3 cycles on 2 " off
Z3 0_ » — D UJ Œ.
-1^- 2 cycles on 2 " off
continuous
NJ
0.5 1.0 1.5 WELD TIMEISECONDS)
2.0 2.5 3.0
FIG.46 THE EFFECT OF CURRENT PULSATION ON ELECTRODE MOVEMENT

10 T
7.5
5.0 Z3 CL
UJ ta cr
£ 2.5-
r Dynamic Resistance r Electrode
Force
Electrode lovement
iT iT
Current programme 7 cycles on/24 cycles off
0.5 1.0 1.5 WELD T1MEÍSEC0NDS)
2.0
iT -
2.5
CO
FIG. 47 DYNAMIC RESISTANCE, ELECTRODE FORCE AND ELECTRODE MOVEMENT TRACES FOR ROLLER-SPOT WELDING AT 2m/min
10 T
7 .5 -
5.0 û_
E)
t3 Œ
£ 2.5-
Dynamic Resistance
V-JV Electrode Force
jwør.^-ifl^lir—y^w**-—Wr^~—*#*~ #»*r IP* *****
Electrode Movement
Current Programme 7 cycles ory^ cycles off
0.5 1.0 1.5 WELD TIME(SECONDS)
2.0 2.5 3.0
FIG.48 DYNAMIC RESISTANCE, ELECTRODE FORCE AND ELECTRODE MOVEMENT TRACES FOR ROLLER-SPOT WELDING AT 6m/min.
10
7.5-
5.0
Z2
IU
(X
? 2 .5
Dynamic Resistance
W^^^f'^W^V^HW^^ Electrode Force
W M p ^ ^
Electrode Movement
Current Programme 7 cycles on/5 cycles off
0.5 1.0 1.5 WELD TIMEfSECONDS)
2.0 2.5 3.0
en
FIG.49 DYNAMIC RESISTANCE, ELECTRODE FORCE AND ELECTRODE MOVEMENT TRACES FOR ROLLER-SPOT WELDING AT 10m/min.

116
Minimum Current
Mid-Range Current
Maximum Current
2m/min.
J4- f -JWH^ TJ lUi
uu
4m/min.
mm b-wh
6m/min.
r\ Ui fUU f l ru
FIG.50
DYNAMIC RESISTANCE CURVES FOR AN INTERRUPTED CURRENT PROGRAMME OF 3 CYCLES ON/2 CYCLES OFF SHOWING THE
EFFECT OF WELDING SPEED AND WELDING CURRENT
2 0 0 ,
- 3 5 0 .
UJ u z (X (— w w ÜJ or
100 .
50
ELECTRODE FDRCE=4.8kN
1.2mm Mild Steel Wide Seam Welding Welding Speed 6m/min
Dynamic Resistance - AC current
^y vrrrrfr*yrrY'ifTyrH*"H~MtT^^^
**\^/S¿X«M
*Yrv~WrtrVHrv*f^*fYlf^t*Vf~~w~'yrT*'
Dynamic Resistance - DC current
1-0 2.0 3.0 WELD TIME I SECONDS)
FIG.51 DTNRMJC RESJSTRNCE FOR R.C.RND D.C.WELDS ON 1.2mm MJLD STEEL(6m/mln)
-118 -
Dynamic Resistance
FIG.52 DYNAMIC RESISTANCE AND CURRENT WAVEFORM TRACES AT THE START OF THE WELD, NARROW SEAM, 2m/min (a) 0.6mm THICK MILD STEEL (b) 1.2mm THICK MILD STEEL

c 3.
ui > ÜJ
UI O z CE
UI OC
r cc 2 >-O
250
225
200
175
150
125
100
0.6MM MILD STEEL
0.55MM. 1 . 2 M M . t REPHOSPHORISED STEEL ♦ DUfìL PHfìSE STEEL
CD
5.0 7.5 10.0 12.5 5.0 7.5 10.0 12.5 5.0 10.0 12.5 J5.0
WELDIN6 CURRENT (left) FIG.53
THE EFFECT OF INCREASING WELDING CURRENT ON THE STEADY STñTE DYNfìMIC RESISTANCE LEVEL FOR ñ RñNGE OF STEELSC2M/MIN)
MILD STEEL REPHOSPHORISED STEEL DUñL PHfìSE STEEL
►-2 UJ
oc u X <r r Q 2 (C
UJ >
O 2 cr
UJ
i : <r 2 >-D
220
200
180
160 ..
140
120
100
DTNRM1C RESISTANCE
BT M1NIHUH CURRENT
DTNRMK RESISTANCE R7 HRXJMUM CURRENT
K) O
10 15 10 15 10 15 20
WELDING SPEED <M/MIN)
FIG.54
THE EFFECT OF STEEL COMPOSITION ñND SPEED ON THE DYNAMIC RESISTRNCE AT MINIMUM RND MAXIMUM CURRENT FOR 0.7/0.75nn THICK STEELS
121
(a)
Transverse x 42.5
Transverse (b)
FIG. 55 x 200
TYPICAL WELD STRUCTURE REVEALED BY NITAL ETCH (a) Low magnification (b) high magnification showing AC/FC
structures (0.75mm mild steel, narrow seam, 6m/min)

122
T r a n s v e r s e (a)
x 42.5
(b)
Transverse x 42.5
FIG. 56 EFFECT OF CURRENT WAVEFORM ON KELP NUCOUT FORMATION (a) AC current, (b) DC current (0.75mm mild steel,
narrow seams, 6m/min)

-123
Transverse x425 (a)
(b)
Transverse FIG.57
x425
EFFECT OF LIGHT APERTURE AND FOCUS ON REVELATION OF WELD BANDS (a)Light aperture fully open - showing dark streaks and carbide distribution (b)Light aperture reduced - showing etch pits along same crystallographic
planes with boundaries delineated by dark streaks
124
««.i.
FIG.58 EFFECT OF USING A CURRENT PROGRAMME OF 2 CYCLES ON/1 CYCLE OFF ON BAND FORMATION

125
(a)
¡ P m . ' « * * « * * * * * * ' t<Hl«í-1SSF+
UVÜQuÍtó/i
(b)
(a) (b)
FIG.59 PRODUCTION OF BANDS IN SPOT WELDS 6 cycles of weld current, 6.5 kA 6 cycles of weld current, 6.5 kA
plus 6 cycles of weld current, 4 kA

Welding Speed
Transverse Longitudinal Planar
2m/min.
6m/min.
16m/min.
W£>¡
O)
FIG.6 0 INFLUENCE OF SPEED ON NUGGET GEOMETRY (0.6mm MILD STEEL, NARROW SEAM, AC CURRENT x 25)

v?--'-*. •.-
2 Cycles Some solid phase bonds
3 Cycles High temp.mushy region - some melting
FIG-61
4 Cycles Large weld nugget formed
NUGGET DEVELOPMENT FROM 2 TO 4 CYCLES OF WELDING CURRENT IN 1.2mm MILD STEEL AT 2m/min (NB No bonding at 1 cycle of weld current)
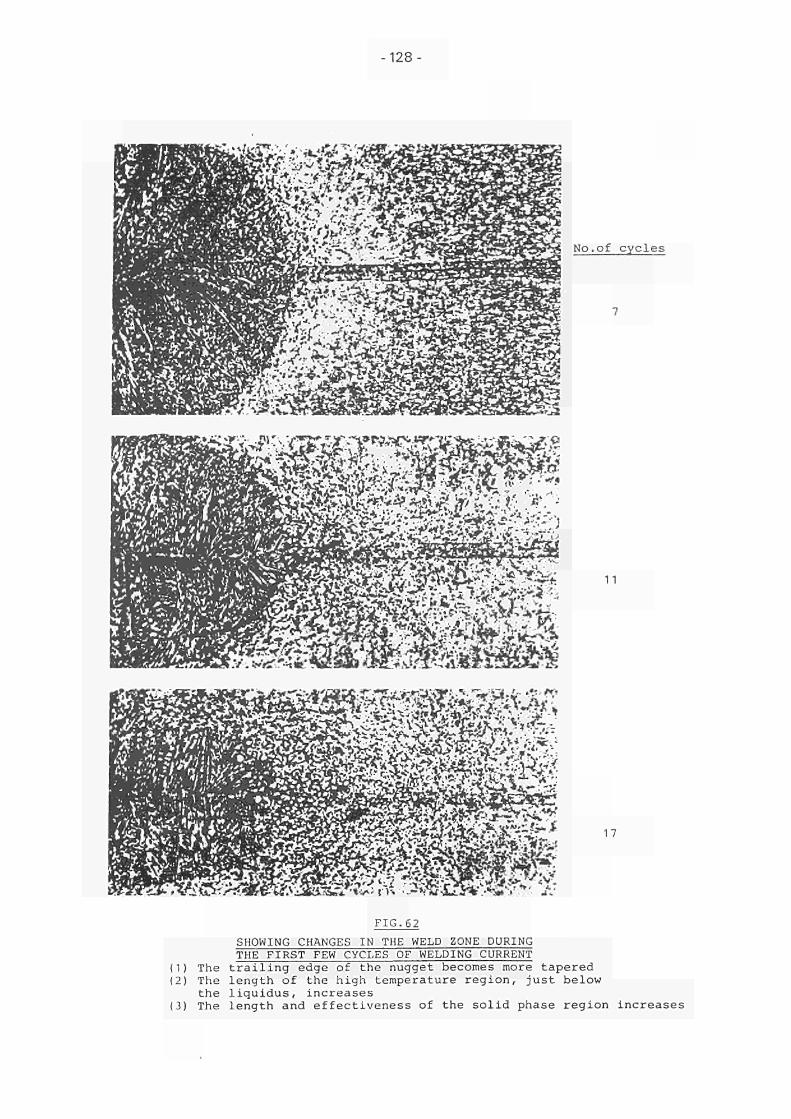
128
No.of cycles
11
17
FIG.62 SHOWING CHANGES IN THE WELD ZONE DURING THE FIRST FEW CYCLES OF WELDING CURRENT
(1) The trailing edge of the nugget becomes more tapered (2) The length of the high temperature region, just below
the liquidus, increases (3) The length and effectiveness of the solid phase region increases

Transverse Longitudinal
1 . 2mm 12.4kA
Ni (O
0 . 6mm 8.5kA
FIG.63 COMPARISON OF HEAT PATTERNS, WITH ONE CYCLE OF WELD CURRENT, BETWEEN 1.2 AND 0.6mm THICK MILD STEEL (10m/min.)"

130-
Welding speed m/min.
10
FIG.64 HEAT PATTERN UNDER ELECTRODES AT WELDING SPEEDS OF 2, 6 AND 10 m/min. 1.2mm MILD STEEL, JUST BELOW MAXIMUM CURRENT LEVEL
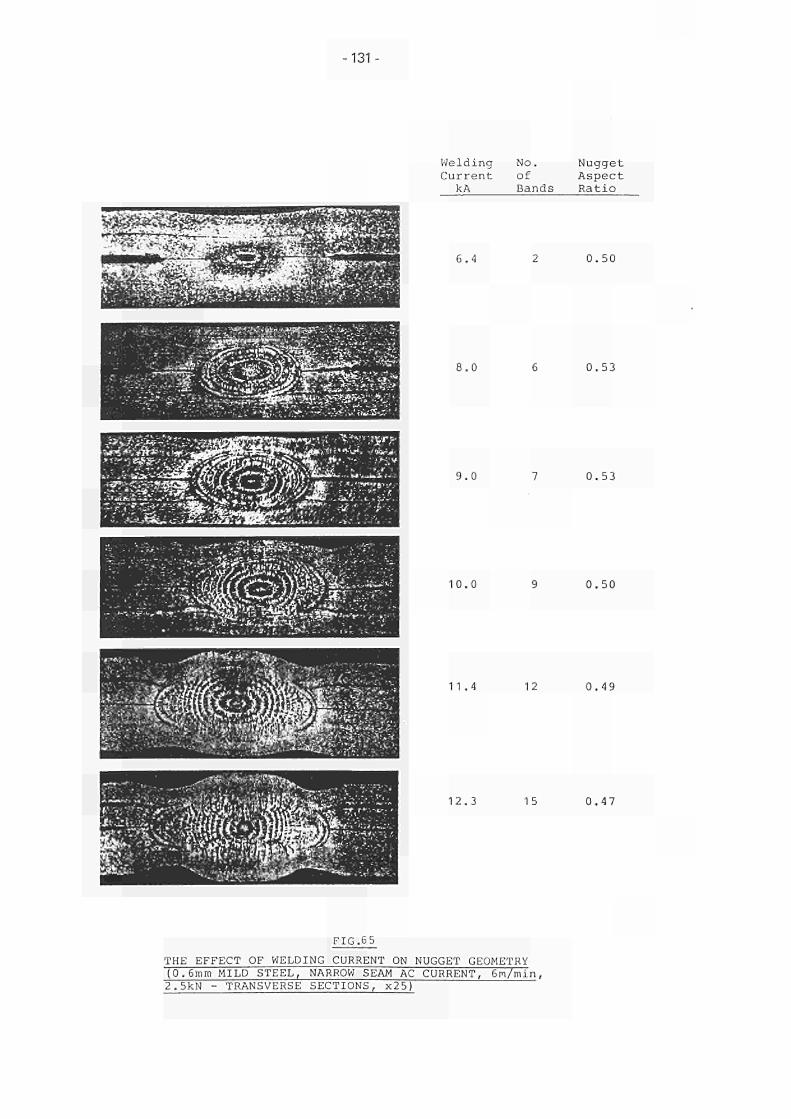
131
Welding Current
kA
6.4
8.0
9.0
10.0
11.4
12.3
No. of Bands
12
15
Nugget Aspect Ratio
0.50
0.53
0.53
0.50
0.49
0.47
FIG.65 THE EFFECT OF WELDING CURRENT ON NUGGET GEOMETRY (0.6mm MILD STEEL, NARROW SEAM AC CURRENT, 6m/min, 2.5kN - TRANSVERSE SECTIONS, x25)
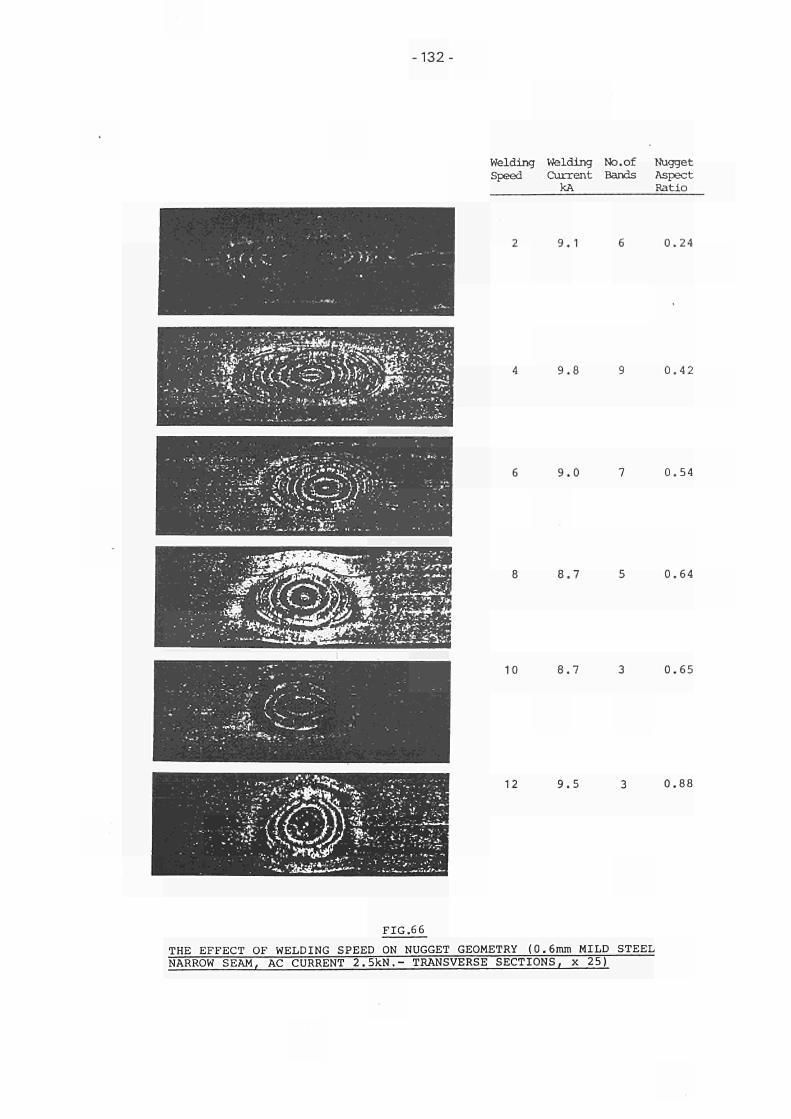
-132-
welding Welding No.of Nugget Speed Current Bands Aspect
kA Ratio
10
9.1
9.8
9.0
8.7
8.7
0.24
0.42
0.54
0.64
0.65
12 9.5 3 0.88
FIG.66 THE EFFECT OF WELDING SPEED ON NUGGET GEOMETRY (0.6mm MILD STEEL NARROW SEAM, AC CURRENT 2.5kN.- TRANSVERSE SECTIONS, x 25)

■133-
Nugget Aspect Ratio
0.85 0.61
0.82
í':^^>V-a!,'^'^A^
iA'jl¿^Í¿^i*
5iSSv>b^>: 0.91 0.68
:^¿^¿¿i¿^
4kN Electrode Force FIG.Ó7
6kN Electrode Force
THE EFFECT OF ELECTRODE FORCE ON NUGGET GEOMETRY (1.2mm MILD STEEL, NARROW SEAM, AC CURRENT, 6m/min TRANSVERSE SECTIONS, x25)

-134
Nugget Aspect Ratio
0.85 1.2
0.82 1.1
Mild Steel Dual Phase Steel
FIG.68 EFFECT OF STEEL RESISTIVITY ON NUGGET GEOMETRY (1.2mm, NARROW SEAM, AC CURRENT, 6m/min, 4kN - TRANSVERSE SECTIONS x 25)
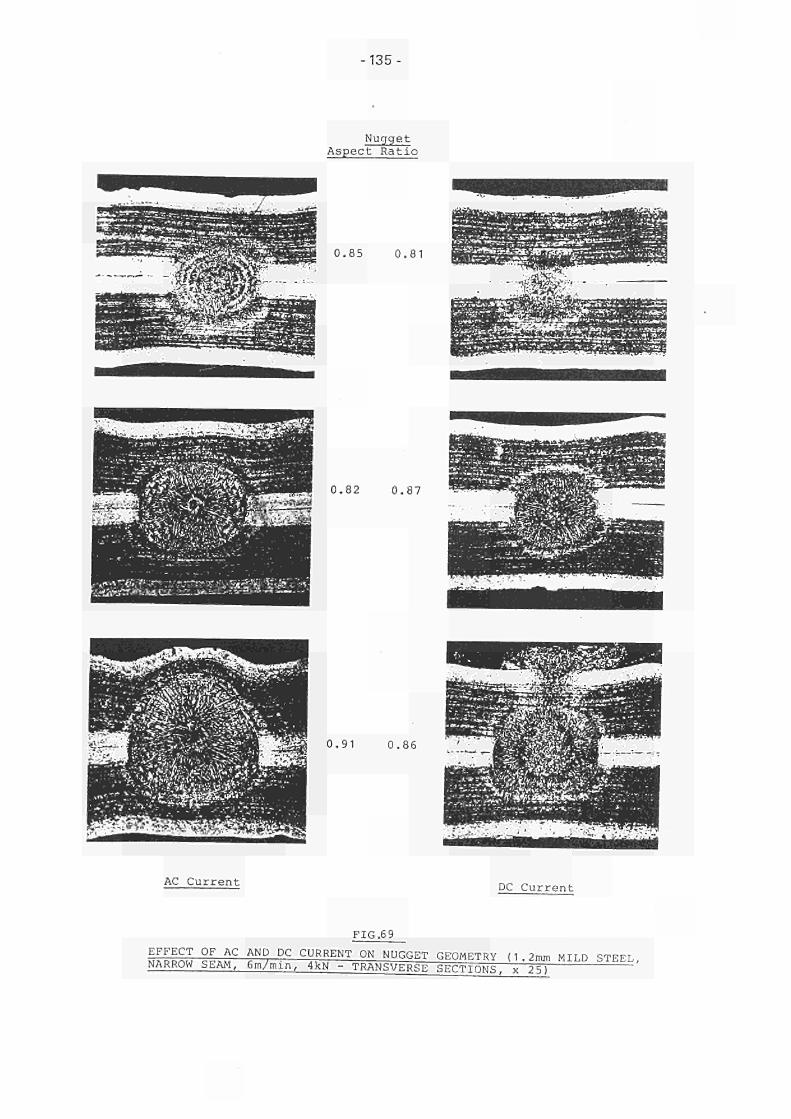
135
Nugget Aspect Ratio
0.85 0.81
0.82 0.87
0.91 0.86
AC Current DC Current
FIG.6 9 E ! ^ C T °l..tC ™D< D C C U R R E N T 0 N N"GGET GEOMETRY (1.2mm MILD STEEL. NARROW SEAM, 6m/mm, 4kN - TRANSVERSE SECTIONS, x 25)

136
Transverse x25
FIG.70 "HÌGH TEMPERATURE TUNNEL" EFFECT OBSERVED IN DC WELDING (0.6mm MILD STEEL, NARROW SEAM, 16m/min., 2.5 kN)

137
Welding Speed
10
14
18
FIG.71 ROTATION OF WELD NUGGET FROM HORIZONTAL TO A POSITION ALONG THE INCLINED INTERFACE OCCURRED AS THE WELDING SPEED WAS INCREASED

2 m/min. 14 m/min 18 m/min
ató ■-;>£*?
co 00 I
FIG.72 TRANSVERSE SECTIONS TAKEN FROM THE REGION OF WELD FORMATION SHOWING THAT 'MASH-DOWN' OCCURS BEFORE ANY LIQUID IS FORMED AT LOW AND HIGH WELDING SPEEDS
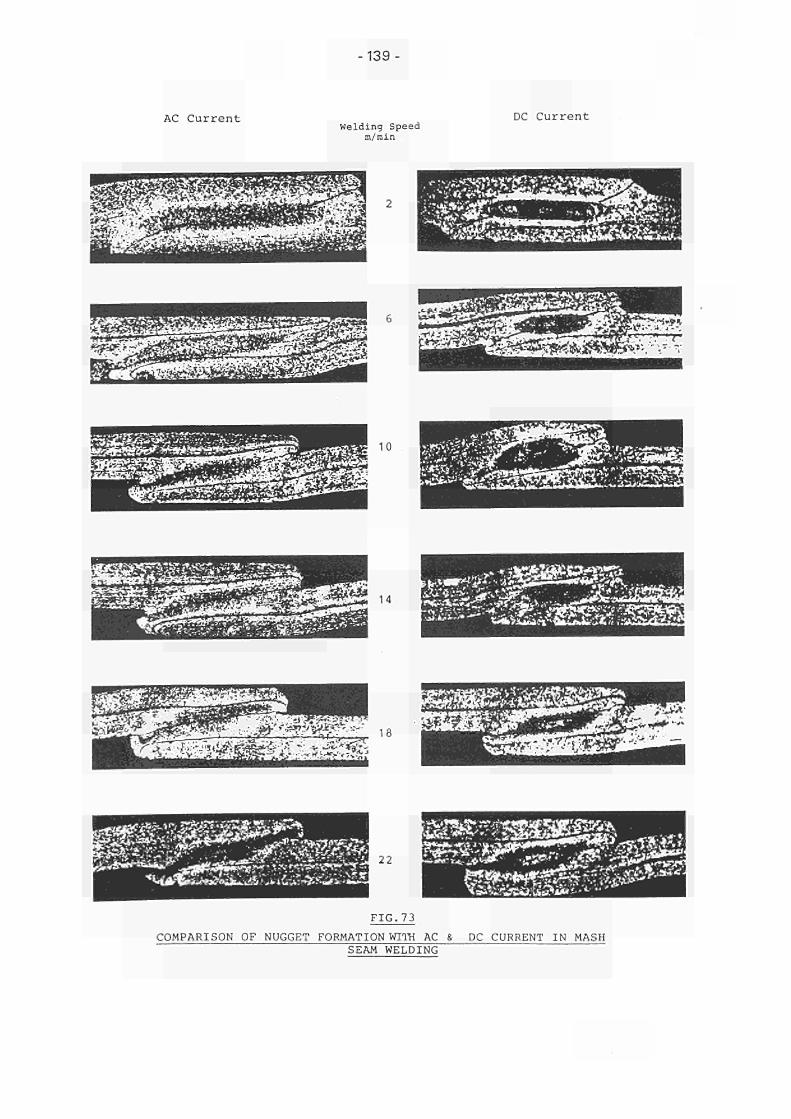
139
AC C u r r e n t Welding Speed m/rain
DC C u r r e n t
10
14
22
F I G . 7 3 COMPARISON OF NUGGET FORMATION WITH AC & DC CURRENT IN MASH
SEAM WELDING
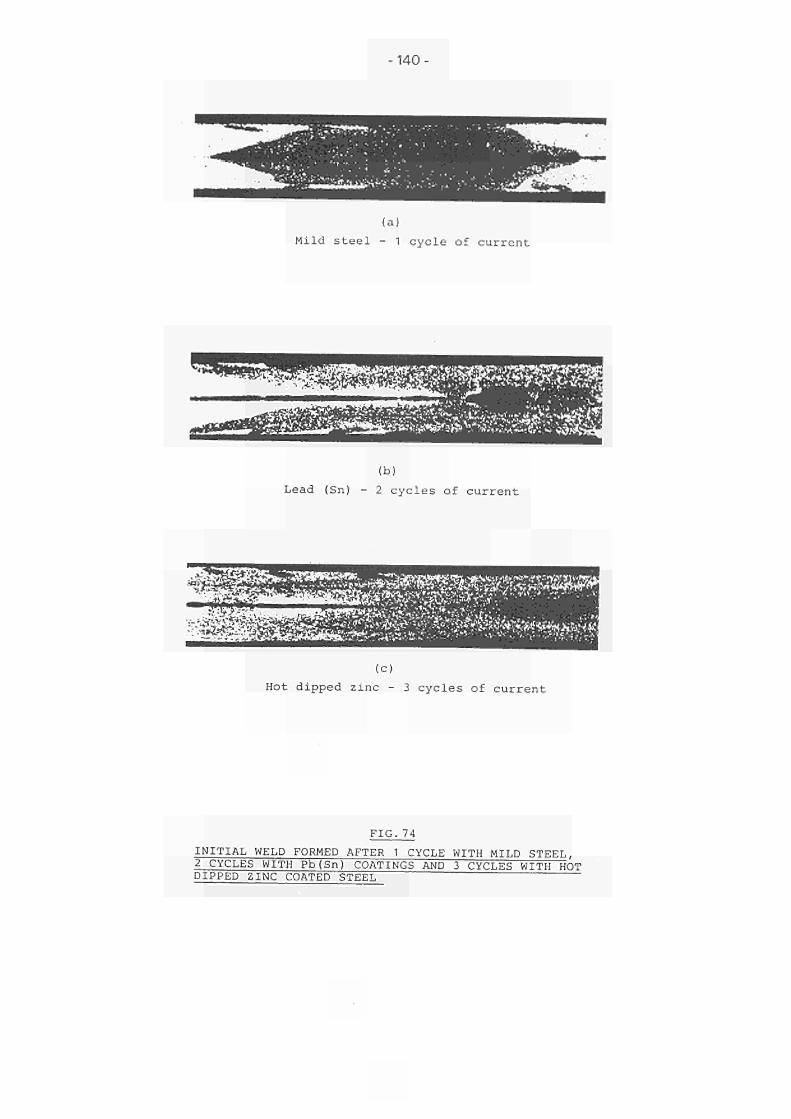
140
(a) Mild steel - 1 cycle of current
(b) Lead (Sn) - 2 cycles of current
(c) Hot dipped zinc - 3 cycles of current
FIG.74 INITIAL WELD FORMED AFTER 1 CYCLE WITH MILD STEEL, 2 CYCLES WITH Pb(Sn) COATINGS AND 3 CYCLES WITH HOT DIPPED ZINC COATED STEEL

-141-
Welding Speed m/min
10
FIG.75 LONGITUDINAL SECTIONS SHOWING HEAT PATTERN IN THE REGION OF WELD FORMATION AT 2, 6 AND 10 m/min, FOR MILD STEEL

-142
Welding Speed m/min
10
FIG.76 LONGITUDINAL SECTIONS SHOWING HEAT PATTERN IN THE REGION OF WELD FORMATION AT 2, 6 AND 10 m/min, FOR ELECTROPLATED
ZINC COATED STEEL

143
Welding Speed m/min
10
FIG.77 LONGITUDINAL SECTIONS SHOWING HEAT PATTERN IN THE REGION OF
WELD FORMATION AT 2, 6 AND 10 m/min, FOR HOT DIPPED ZINC COATED STEEL
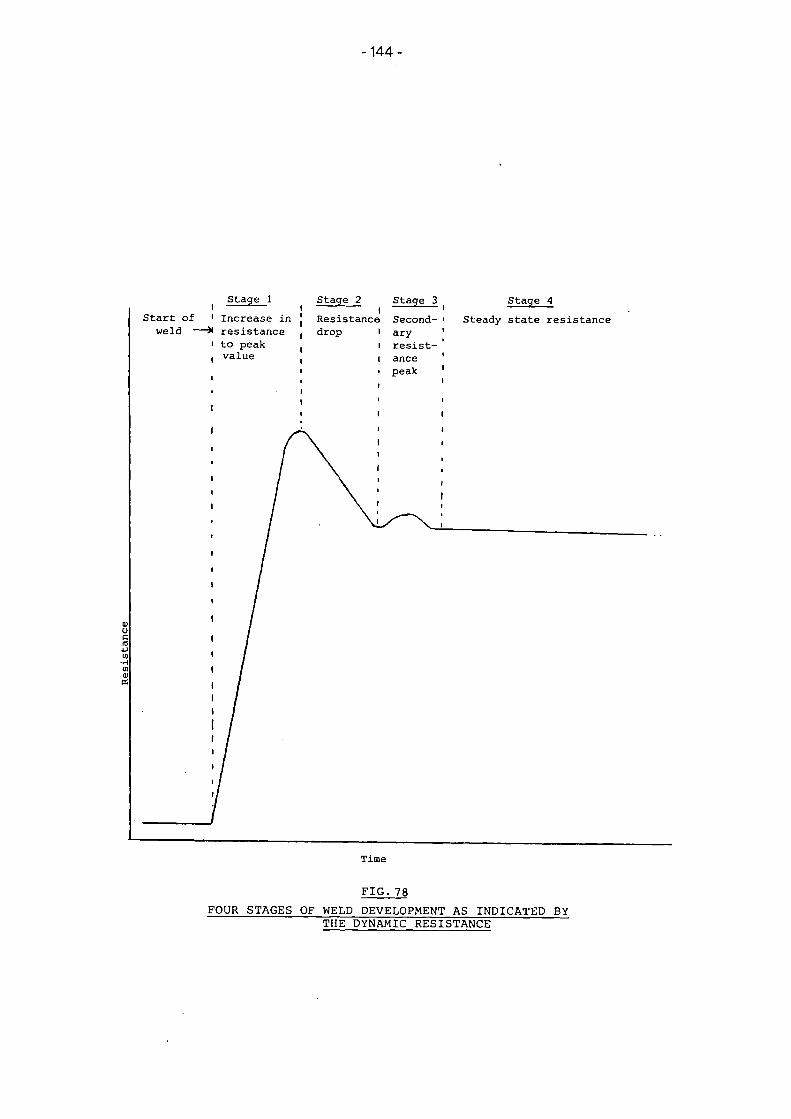
144 •
Start of weld -
01 m tí,
Stage 4 Steady state resistance
Time
FIG.78 FOUR STAGES OF WELD DEVELOPMENT AS INDICATED BY
THE DYNAMIC RESISTANCE
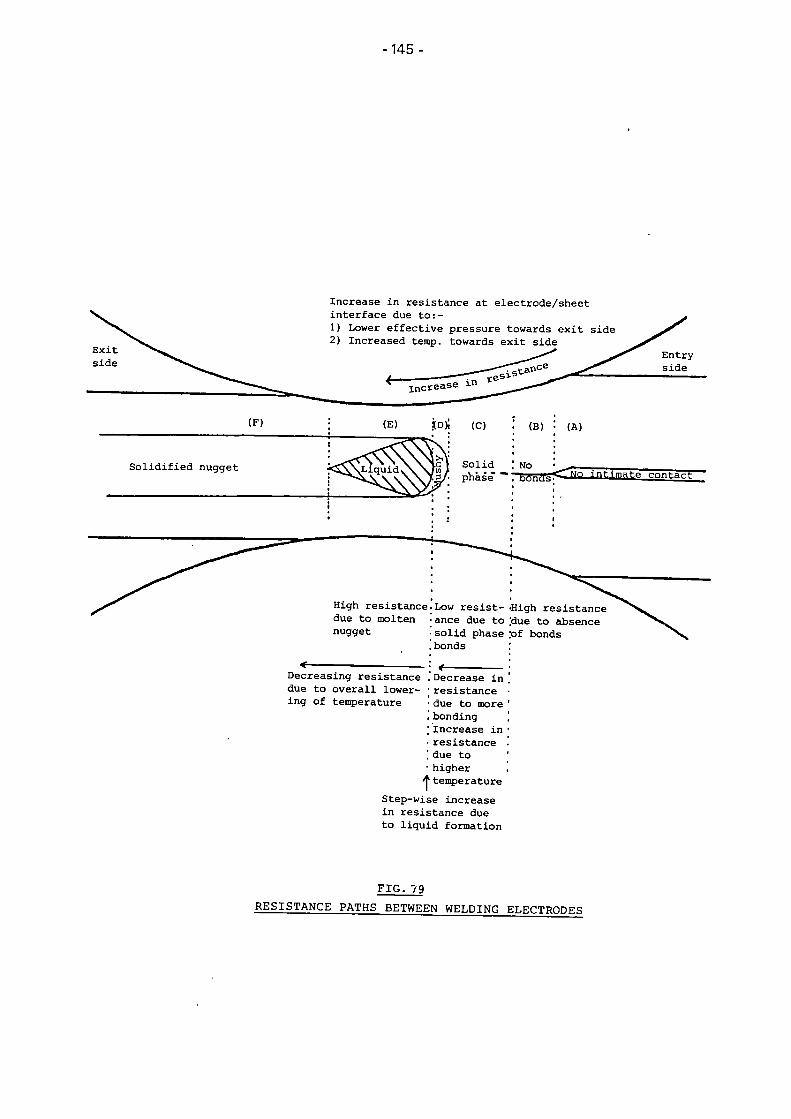
145
Increase in resistance at electrode/sheet interface due to:1) Lower effective pressure towards exit side 2) Increased temp, towards exit side
increase
(F)
Solidified nugget
High resistance due to molten nugget
Decreasing resistance due to overall lowering of temperature
JO)« (C)
Solid phase"
(B) (A)
Low resistance due to solid phase bonds
■High resistance [due to absence pf bonds
Decrease in resistance due to more bonding Increase in resistance due to higher
^ temperature Stepwise increase in resistance due to liquid formation
FIG.79 RESISTANCE PATHS BETWEEN WELDING ELECTRODE S

146
Low welding speed
(a) Near current peak during i cycle
Exit side
Less heating from current giving increased solidification rate and■the formation of one band
Relative intensity of current flow along electrode arc of contact
Heat spread still occurs in the horizontal direction
Near current minimum during i cycle Number of bands in solidified nugget indicates the number of half cycles of current which flowed through the molten nugget from its formation at A to its final solidification at B
FIG.80 CURRENT FLOW BETWEEN WELDING ELECTRODES
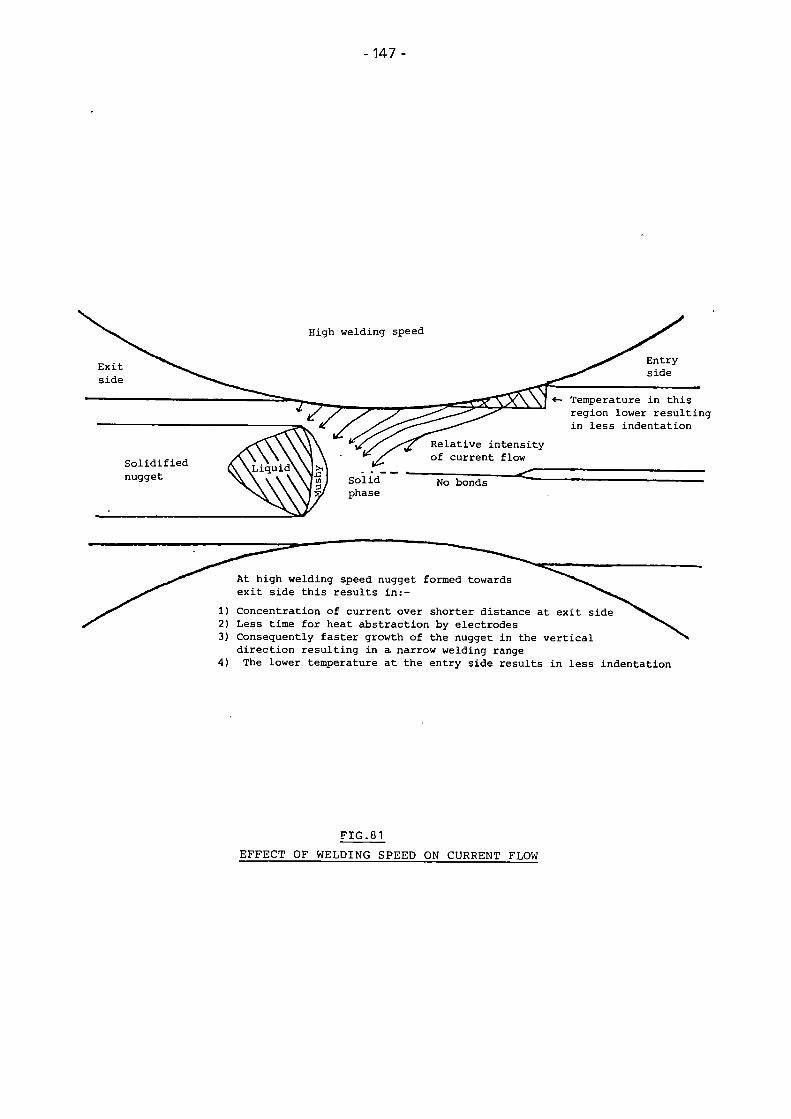
147
Entry s ide
Temperature in this region lower resulting in less indentation
Relative intensity of current flow
No bonds
At high welding speed nugget formed towards exit side this results in:-
1) Concentration of current over shorter distance at exit side 2) Less time for heat abstraction by electrodes 3) Consequently faster growth of the nugget in the vertical
direction resulting in a narrow welding range 4) The lower temperature at the entry side results in less indentation
FIG.81 EFFECT OF WELDING SPEED ON CURRENT FLOW