Seabridge goldcorp pres
32
S E A B R I D G E G O L D Corporate Presentation August 2013
-
Upload
company-spotlight -
Category
Technology
-
view
356 -
download
1
Transcript of Seabridge goldcorp pres
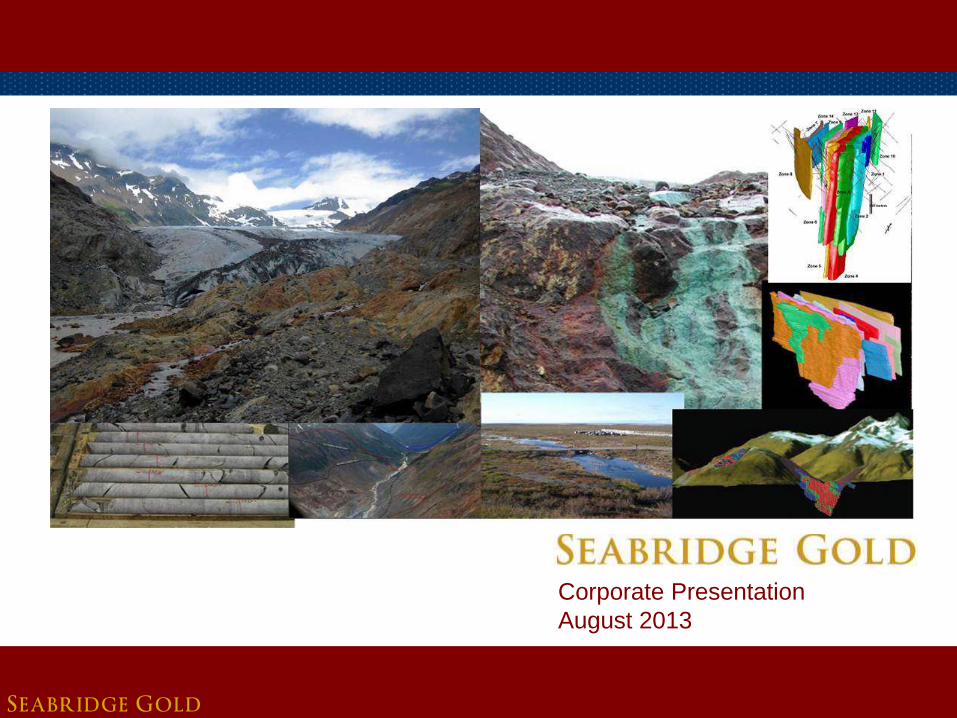
S E A B R I D G E G O L D
Corporate Presentation
August 2013

S E A B R I D G E G O L D
Forward Looking Statements
All reserve and resource estimates reported by the Company were calculated in accordance with the Canadian National Instrument 43-101 and the Canadian Institute of Mining and Metallurgy Classification system. These standards differ significantly from the requirements of the U.S. Securities and Exchange Commission. Mineral resources which are not mineral reserves do not have demonstrated economic viability. Statements relating to the estimated or expected future production and operating results and costs and financial condition of Seabridge, planned work at the Company’s projects and the expected results of such work are forward-looking statements within the meaning of the United States Private Securities Litigation Reform Act of 1995. Forward-looking statements are statements that are not historical facts and are generally, but not always, identified by words such as the following: expects, plans, anticipates, believes, intends, estimates, projects, assumes, potential and similar expressions. Forward-looking statements also include reference to events or conditions that will, would, may, could or should occur. Information concerning exploration results and mineral reserve and resource estimates may also be deemed to be forward-looking statements, as it constitutes a prediction of what might be found to be present when and if a project is actually developed. These forward-looking statements are necessarily based upon a number of estimates and assumptions that, while considered reasonable at the time they are made, are inherently subject to a variety of risks and uncertainties which could cause actual events or results to differ materially from those reflected in the forward-looking statements, including, without limitation: uncertainties related to raising sufficient financing to fund the planned work in a timely manner and on acceptable terms; changes in planned work resulting from logistical, technical or other factors; the possibility that results of work will not fulfill projections/expectations and realize the perceived potential of the Company’s projects; uncertainties involved in the interpretation of drilling results and other tests and the estimation of gold reserves and resources; risk of accidents, equipment breakdowns and labour disputes or other unanticipated difficulties or interruptions; the possibility of environmental issues at the Company’s projects; the possibility of cost overruns or unanticipated expenses in work programs; the need to obtain permits and comply with environmental laws and regulations and other government requirements; fluctuations in the price of gold and other risks and uncertainties, including those described in the Company’s Annual Information Form filed with SEDAR in Canada (available at www.sedar.com) for the year ended December 31, 2012 and in the Company’s Annual Report Form 40-F filed with the U.S. Securities and Exchange Commission on EDGAR (available at www.sec.gov/edgar.shtml). Forward-looking statements are based on the beliefs, estimates and opinions of the Company’s management or its independent professional consultants on the date the statements are made.
2

S E A B R I D G E G O L D
The Case for Seabridge
• 44.7M oz Au
• 10B lbs Cu
Proven and Probable Reserves
• 45.6M shares outstanding Low Share Dilution
• $10 enterprise value per ounce of gold reserves Low Valuation
• All reserves are located in Canada Low Political Risk
• New discoveries could add significant higher grade reserves to improve project economics Exploration Upside
3
S E A B R I D G E G O L D
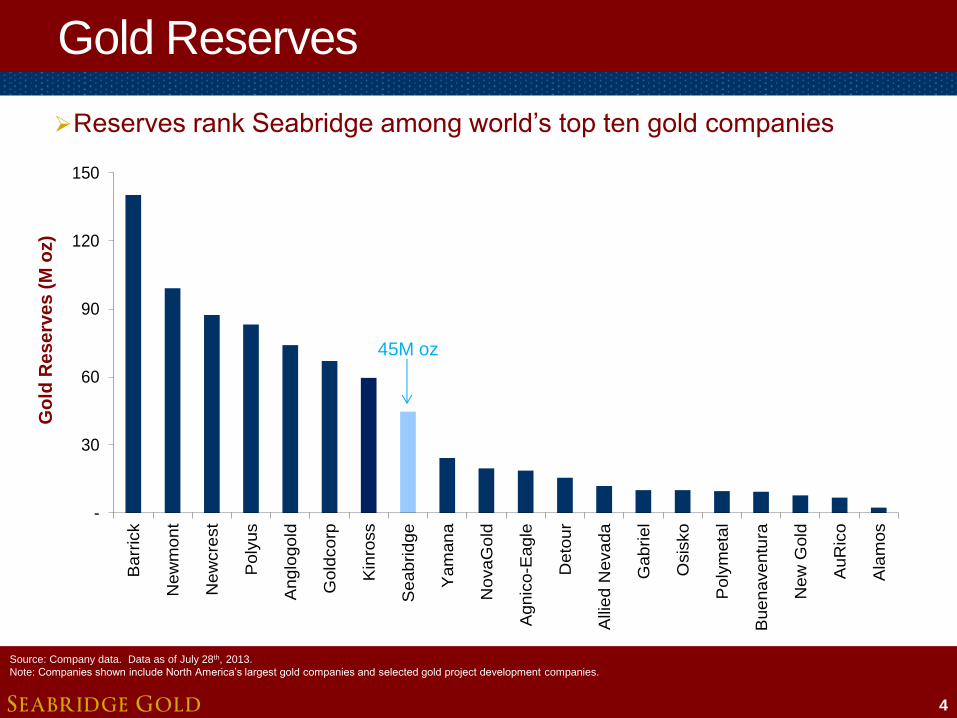
Gold Reserves
Reserves rank Seabridge among world’s top ten gold companies
4
Source: Company data. Data as of July 28th, 2013.
Note: Companies shown include North America’s largest gold companies and selected gold project development companies.
Go
ld R
es
erv
es
(M
oz)
-
30
60
90
120
150
Barr
ick
New
mo
nt
New
cre
st
Poly
us
Ang
logo
ld
Gold
co
rp
Kin
ross
Sea
brid
ge
Yam
an
a
NovaG
old
Agn
ico-E
ag
le
Deto
ur
Alli
ed
Neva
da
Gab
riel
Osis
ko
Poly
meta
l
Bue
nave
ntu
ra
Ne
w G
old
AuR
ico
Ala
mos
45M oz

S E A B R I D G E G O L D
Low Share Dilution
5
Seabridge ranks 1st in reserves per share among leading gold companies
Source: Bloomberg, Company data. Data as of July 28 28th, 2013.
Note: Companies shown include North America’s largest gold companies and selected gold project development companies.
Go
ld R
es
erv
es
pe
r C
om
mo
n S
ha
re
-
0.20
0.40
0.60
0.80
1.00
1.20
Sea
brid
ge
Ne
wm
on
t
Ang
logo
ld
Barr
ick
De
tou
r
Alli
ed
Neva
da
Ne
wcre
st
Agn
ico
-Eag
le
Gold
co
rp
No
vaG
old
Kin
ross
Bue
nave
ntu
ra
Yam
an
a
Poly
us
Gab
riel
Poly
meta
l
AuR
ico
Osis
ko
Ala
mos
Ne
w G
old
0.98 oz/share

S E A B R I D G E G O L D
-
10
20
30
40
50
60
70
80
90
-
10
20
30
40
50
60
70
80
90
2003 2004 2005 2006 2007 2008 2009 2010 2011 2012
Sh
are
s O
uts
tan
din
g (M
illion
s)
Ou
nce
s o
f G
old
(M
illio
ns)
Low Share Dilution (cont.)
6
Proven & Probable Gold Reserves Measured & Indicated Gold Resources Inferred Gold Resources Common Shares Outstanding
Resources have grown more than ten times faster than shares outstanding
Source: Company data. Data as of July 28, 2013.
Note: For a breakdown of Seabridge’s mineral reserves and resources by project, tonnes and grade, please visit http://seabridgegold.net/resources.php

S E A B R I D G E G O L D
En
terp
ris
e V
alu
e p
er
Re
se
rve
oz
Attractive Valuation
7
Seabridge has a very low enterprise value per ounce of gold reserves
Source: Company data. Data as of July 28th, 2013.
Note: Companies shown include North America’s largest gold companies and selected gold project development companies
(1) Enterprise Value calculated as market capitalization (basic) plus net debt and minority interest
-
$100
$200
$300
$400
$500
$600
$700
Ala
mos
Ne
w G
old
Poly
meta
l
Bue
nave
ntu
ra
Gold
co
rp
Yam
an
a
Agn
ico
-Eag
le
Ne
wm
on
t
Barr
ick
Osis
ko
AuR
ico
Ne
wcre
st
Kin
ross
De
tou
r
Ang
logo
ld
Poly
us
Gab
riel
NovaG
old
Alli
ed
Neva
da
Sea
brid
ge
$10/oz

S E A B R I D G E G O L D
Low Political Risk
• Illegal strikes and local opposition delay approved projects (Conga, Santa Anna, Tintaya) Peru
• Open pit mining and use of cyanide banned in certain areas
• 100% tax on export earnings for some resource projects (Famatina, San Jose) Argentina
• Increased taxes and royalties (Fruta del Norte) Ecuador
• Creeping expropriation through imposed local and government ownership (Batu Hiju, Grassberg, Tujuh Bukit) Indonesia
• Increased royalty structure and challenging power supply issues (all projects)
• Local opposition delays approved projects (El Morro) Chile
• Stable regulatory and tax regime Canada
8
Where would you rather be?
S E A B R I D G E G O L D
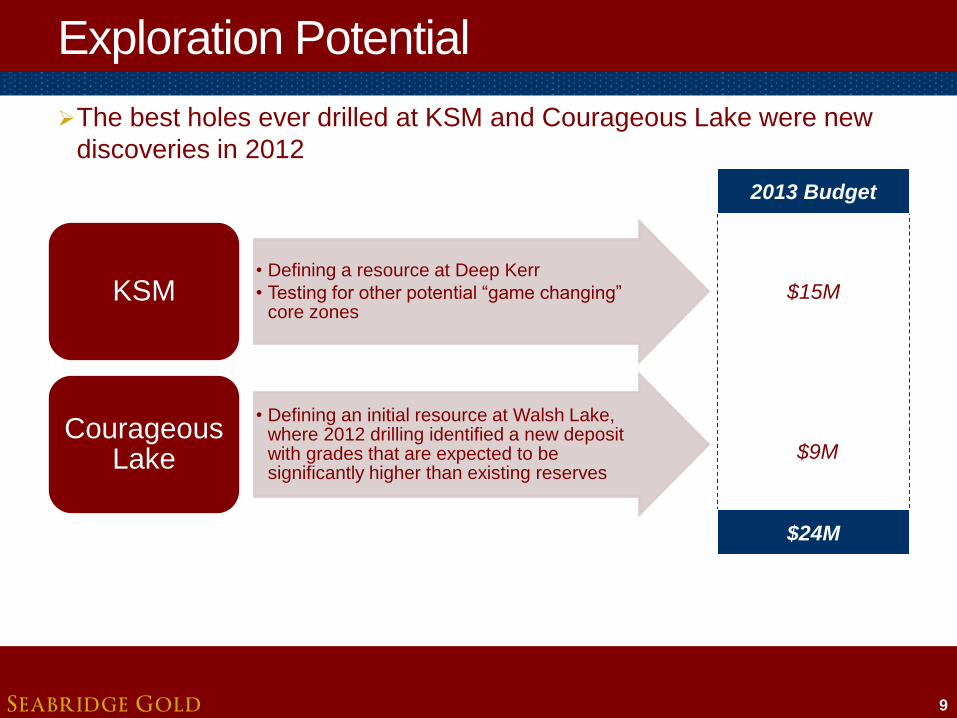
$15M
$9M
Exploration Potential
9
The best holes ever drilled at KSM and Courageous Lake were new
discoveries in 2012
• Defining a resource at Deep Kerr
• Testing for other potential “game changing” core zones
KSM
• Defining an initial resource at Walsh Lake, where 2012 drilling identified a new deposit with grades that are expected to be significantly higher than existing reserves
Courageous Lake
2013 Budget
$24M

S E A B R I D G E G O L D
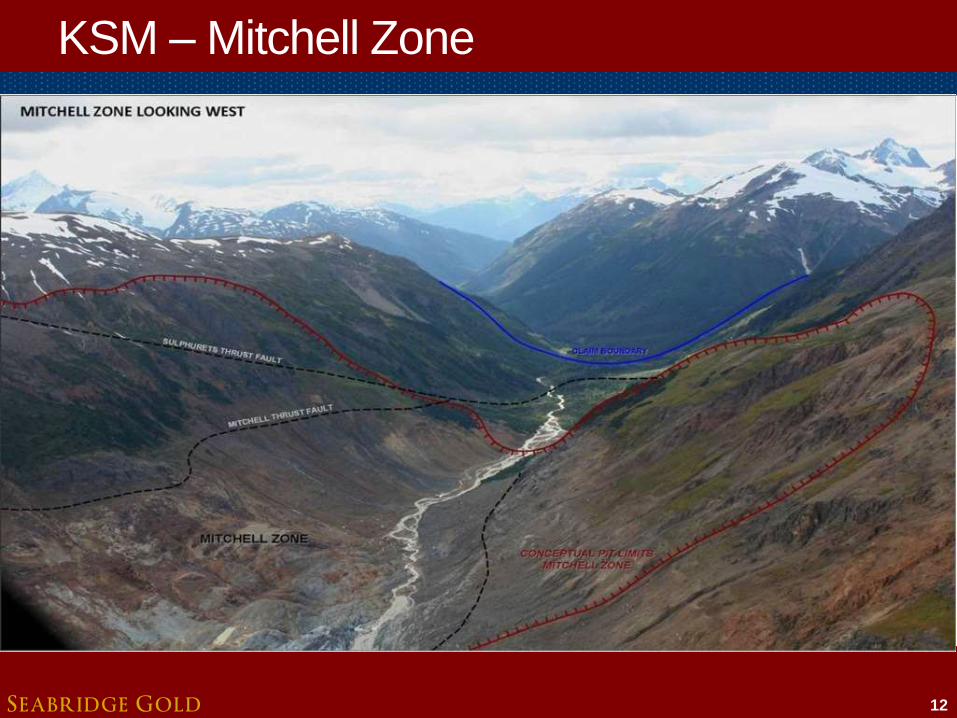
Kerr, Sulphurets and Mitchell
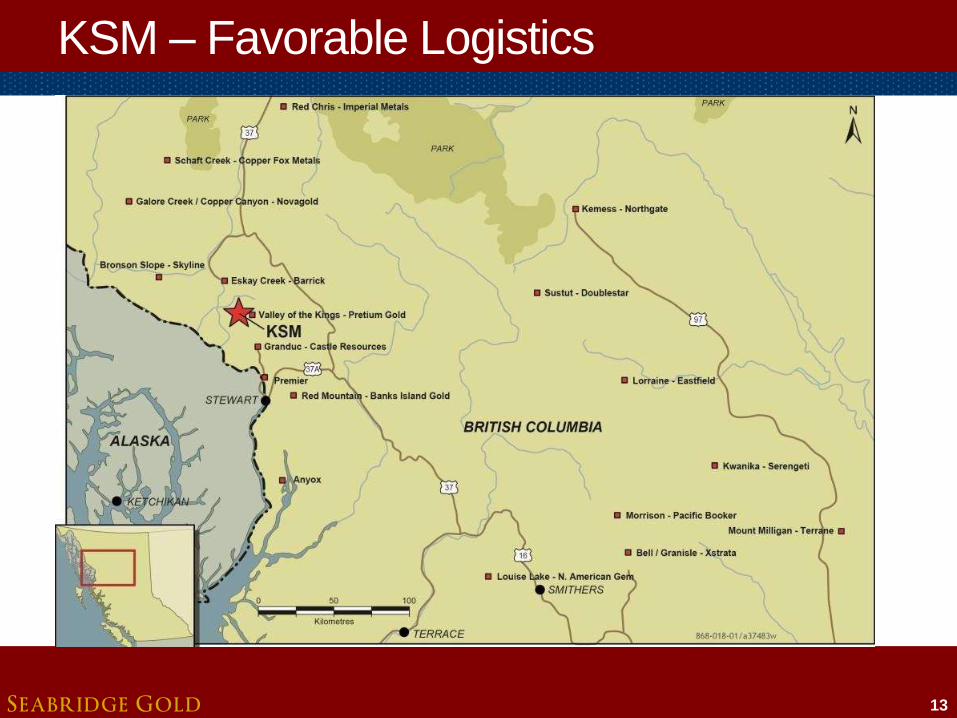
• Kerr, Sulphurets and Mitchell (“KSM”), is the world’s largest undeveloped gold/copper project (by reserves)
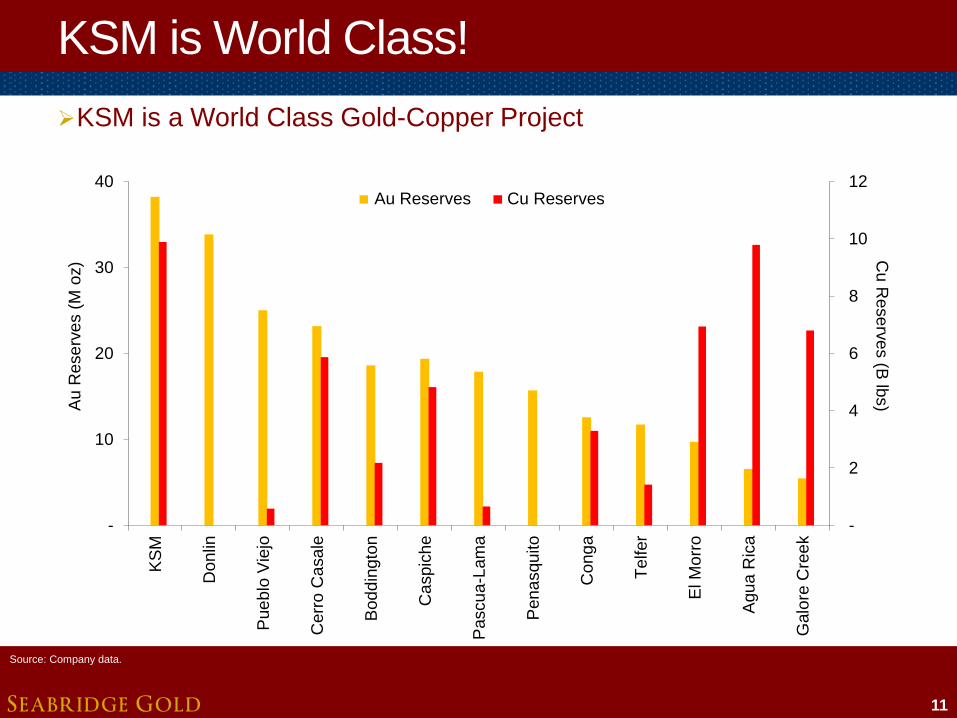
– KSM reserves at 38.2M oz Au and 10B lbs Cu
• Located in “mining friendly” British Columbia near past producers
• Highly favorable logistics – Access to inexpensive hydro power
– Nearby highway network and year-round operating seaport facility
• Estimated cash costs well below current industry averages
– Operating costs of $141/oz Au
– Total costs of $598/oz Au
– Less than $0.06/kwh to plug-into hydro power located less than 30 km away
• Base Case exhibits outstanding capital efficiency
– 50+ year mine life
– Payback of 6 years
10
S E A B R I D G E G O L D
KSM is World Class!
11
KSM is a World Class Gold-Copper Project
Source: Company data.
-
2
4
6
8
10
12
-
10
20
30
40
KS
M
Do
nlin
Pue
blo
Vie
jo
Ce
rro
Ca
sale
Bod
din
gto
n
Ca
sp
ich
e
Pascu
a-L
am
a
Pen
asqu
ito
Co
ng
a
Te
lfer
El M
orr
o
Agu
a R
ica
Galo
re C
ree
k
Cu
Re
se
rve
s (B
lbs)A
u R
ese
rve
s (
M o
z)
-
2
4
6
8
10
12
-
10
20
30
40
KS
M
Donlin
Pue
blo
Vie
jo
Cerr
o C
asale
Bod
din
gto
n
Ca
spic
he
Pascu
a-L
am
a
Pen
asqu
ito
Cong
a
Telfer
El M
orr
o
Agu
a R
ica
Galo
re C
ree
k
Cu R
ese
rve
s (B
lbs)A
u R
ese
rve
s (
M o
z)
Au Reserves Cu Reserves
-
2
4
6
8
10
12
-
10
20
30
40
KS
M
Donlin
Pue
blo
Vie
jo
Cerr
o C
asale
Bod
din
gto
n
Ca
spic
he
Pascu
a-L
am
a
Pen
asqu
ito
Cong
a
Telfer
El M
orr
o
Agu
a R
ica
Galo
re C
ree
k
Cu R
ese
rve
s (B
lbs)A
u R
ese
rve
s (
M o
z)
Au Reserves Cu Reserves
-
2
4
6
8
10
12
-
10
20
30
40
KS
M
Do
nlin
Pue
blo
Vie
jo
Ce
rro
Ca
sale
Bod
din
gto
n
Ca
sp
ich
e
Pascu
a-L
am
a
Pen
asqu
ito
Co
ng
a
Te
lfer
El M
orr
o
Agu
a R
ica
Galo
re C
ree
k
Cu
Re
se
rve
s (B
lbs)A
u R
ese
rve
s (
M o
z)
Au Reserves Cu Reserves
-
2
4
6
8
10
12
-
10
20
30
40
KS
M
Donlin
Pue
blo
Vie
jo
Cerr
o C
asale
Bod
din
gto
n
Ca
spic
he
Pascu
a-L
am
a
Pen
asqu
ito
Cong
a
Telfer
El M
orr
o
Agu
a R
ica
Galo
re C
ree
k
Cu R
ese
rve
s (B
lbs)A
u R
ese
rve
s (
M o
z)
Au Reserves Cu Reserves
S E A B R I D G E G O L D
KSM – Mitchell Zone
12
S E A B R I D G E G O L D
KSM – Favorable Logistics
13
S E A B R I D G E G O L D
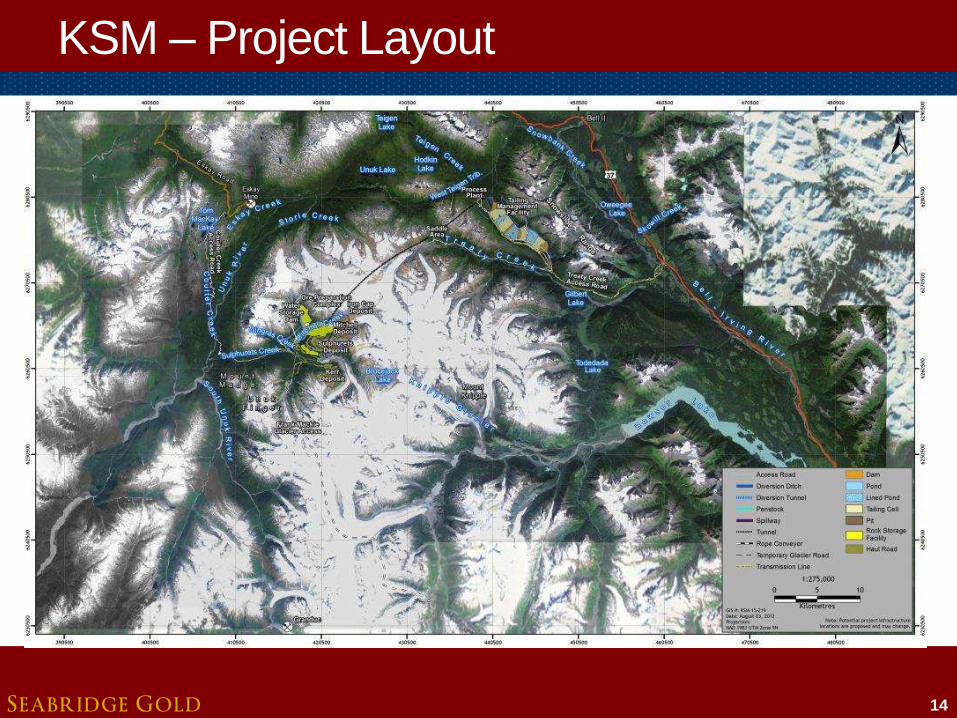
KSM – Project Layout
14
S E A B R I D G E G O L D
KSM – Preliminary Feasibility Study
15
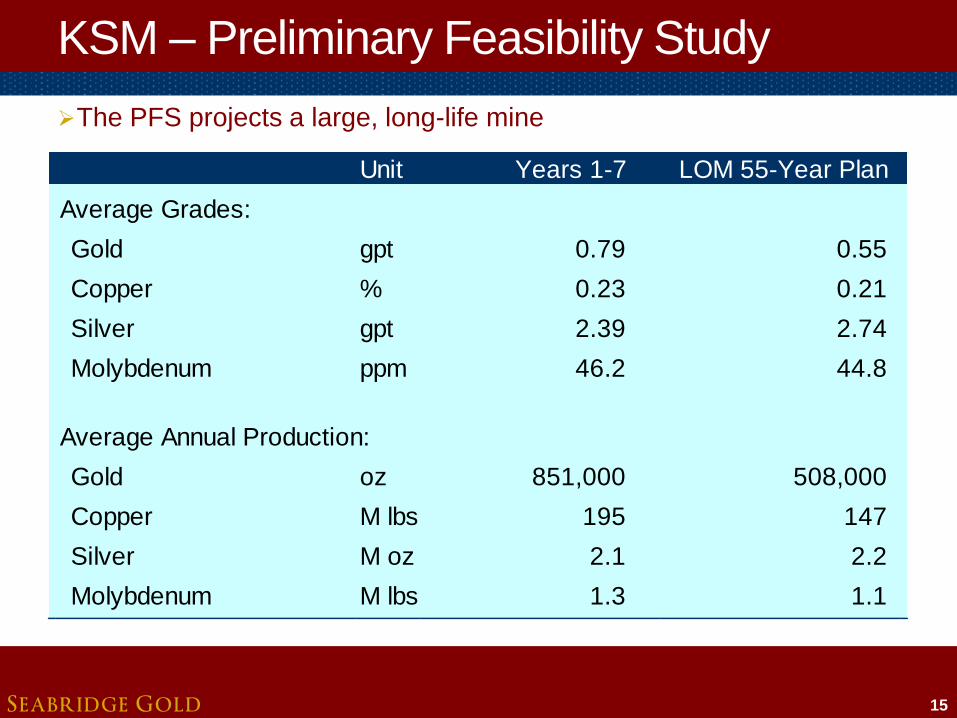
The PFS projects a large, long-life mine
Unit Years 1-7 LOM 55-Year Plan
Average Grades:
Gold gpt 0.79 0.55
Copper % 0.23 0.21
Silver gpt 2.39 2.74
Molybdenum ppm 46.2 44.8
Average Annual Production:
Gold oz 851,000 508,000
Copper M lbs 195 147
Silver M oz 2.1 2.2
Molybdenum M lbs 1.3 1.1
S E A B R I D G E G O L D
KSM – PFS Pre-Tax Summary
16
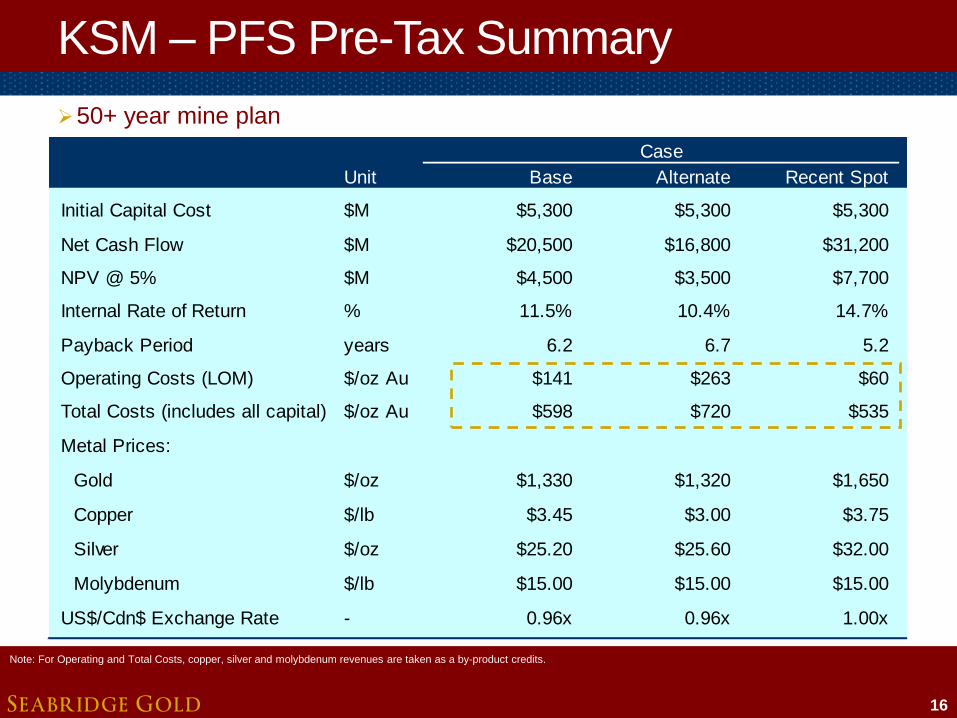
50+ year mine plan
Case
Unit Base Alternate Recent Spot
Initial Capital Cost $M $5,300 $5,300 $5,300
Net Cash Flow $M $20,500 $16,800 $31,200
NPV @ 5% $M $4,500 $3,500 $7,700
Internal Rate of Return % 11.5% 10.4% 14.7%
Payback Period years 6.2 6.7 5.2
Operating Costs (LOM) $/oz Au $141 $263 $60
Total Costs (includes all capital) $/oz Au $598 $720 $535
Metal Prices:
Gold $/oz $1,330 $1,320 $1,650
Copper $/lb $3.45 $3.00 $3.75
Silver $/oz $25.20 $25.60 $32.00
Molybdenum $/lb $15.00 $15.00 $15.00
US$/Cdn$ Exchange Rate - 0.96x 0.96x 1.00x
Note: For Operating and Total Costs, copper, silver and molybdenum revenues are taken as a by-product credits.
S E A B R I D G E G O L D
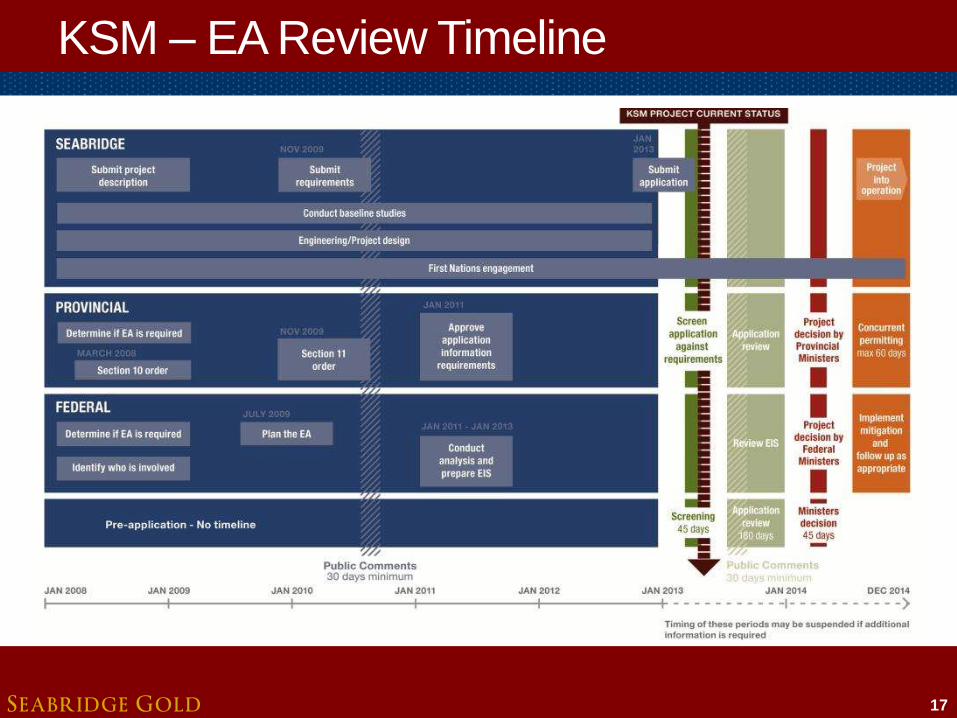
KSM – EA Review Timeline
17
S E A B R I D G E G O L D
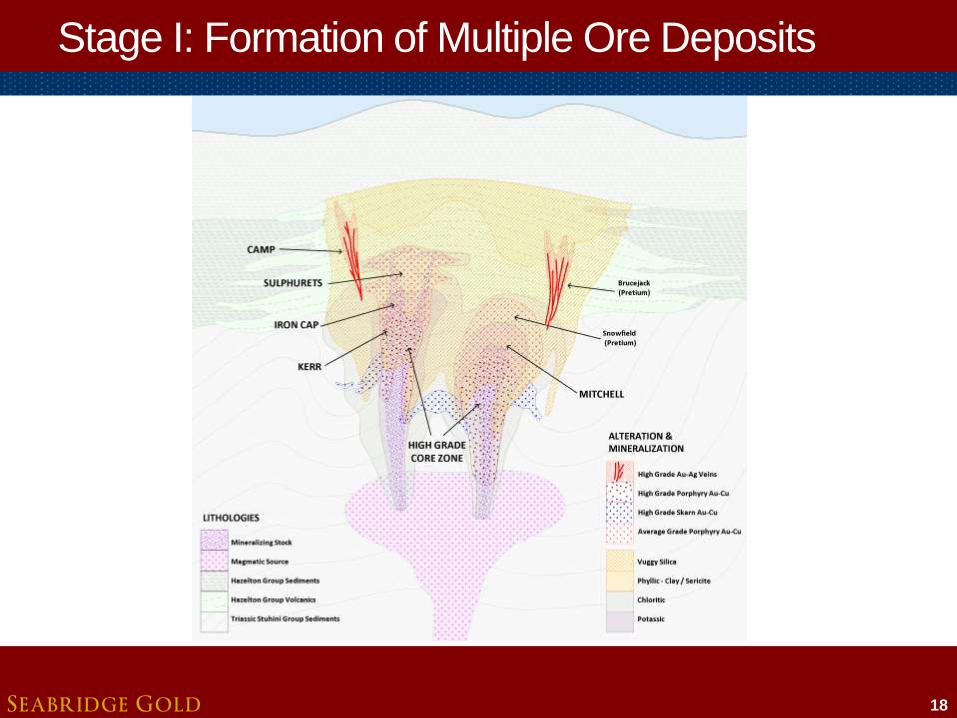
Stage I: Formation of Multiple Ore Deposits
18

S E A B R I D G E G O L D
Stage II: Compression, Thrust, Faulting, erosion
19
S E A B R I D G E G O L D
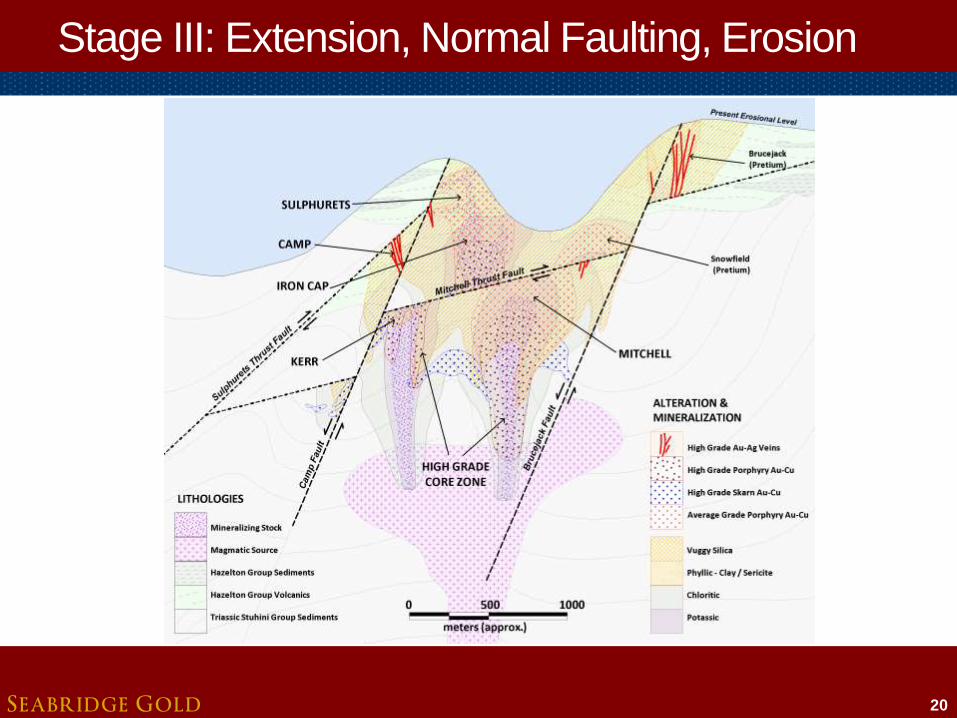
Stage III: Extension, Normal Faulting, Erosion
20

S E A B R I D G E G O L D 21

S E A B R I D G E G O L D 22

S E A B R I D G E G O L D
Courageous Lake
• At 6.5M oz, Courageous Lake (“CL”) is Canada’s 2nd largest undeveloped gold reserve (KSM is 1st)
• Excellent open pit grade of 2.2 gpt Au – More than twice the grade of Osisko and
Detour Gold’s new mines
• Recently completed Preliminary Feasibility Study shows viable project with exceptional leverage to higher gold prices
• Wholly owned 53 km greenstone belt provides excellent exploration potential
• Located in Northwest Territories within 100 km of Diavik and Ekati, two large operating open pit diamond mines
23

S E A B R I D G E G O L D
Courageous Lake – Project Location
• Project located on winter ice road, in close proximity to the Diavik and Ekati mines
– Demonstrating that year round
open pit bulk tonnage operations
are feasible
• Nearby mines provide “real-time” estimates for capital and operating costs
– Additionally, with mines scheduled
to close over the next several
years, a local and trained
workforce will be readily available
24
S E A B R I D G E G O L D
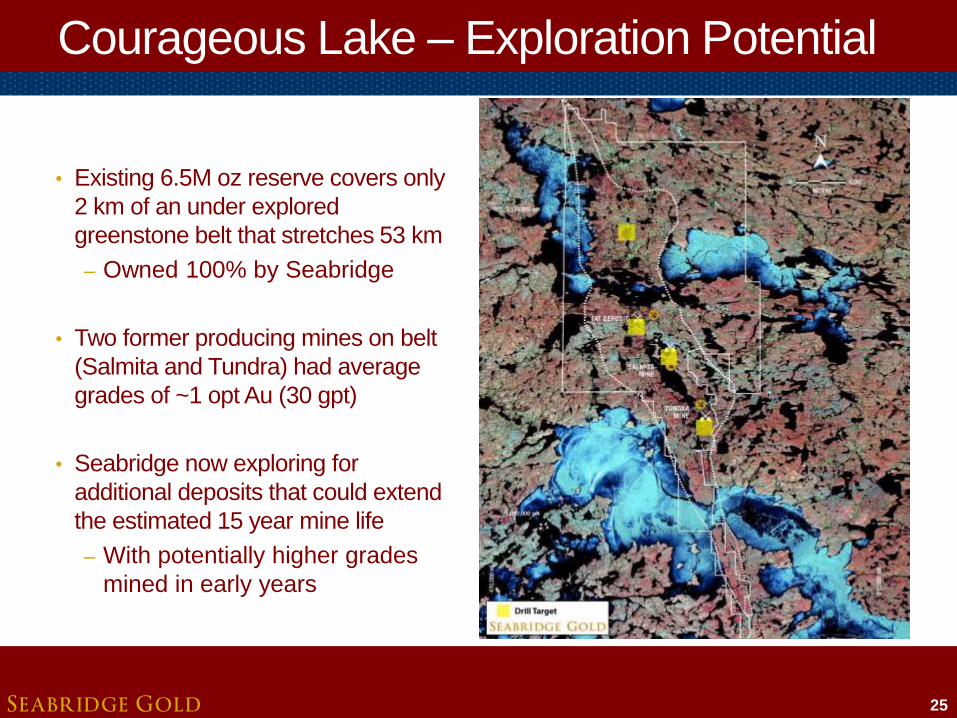
Courageous Lake – Exploration Potential
• Existing 6.5M oz reserve covers only
2 km of an under explored
greenstone belt that stretches 53 km
– Owned 100% by Seabridge
• Two former producing mines on belt
(Salmita and Tundra) had average
grades of ~1 opt Au (30 gpt)
• Seabridge now exploring for
additional deposits that could extend
the estimated 15 year mine life
– With potentially higher grades
mined in early years
25

S E A B R I D G E G O L D
Courageous Lake – 2012 PFS (July 2012)
26
Exceptional leverage to gold price
Case
Unit Base Alternate
Gold Price $/oz $1,384 $1,925
Initial Capital Cost $M $1,520 $1,520
Mine Life years 15.0 15.0
Average Annual Gold Production ounces 385,000 385,000
Net Cash Flow $M $1,507 $4,519
NPV @ 5% $M $303 $2,080
Internal Rate of Return % 7.3% 18.7%
Payback Period years 11.2 4.0
Operating Costs (years 1-5) $/oz Au $674 $689
Operating Costs (LOM) $/oz Au $780 $796
Total Costs (includes all capital) $/oz Au $1,123 $1,141
US$/Cdn$ Exchange Rate - 0.98x 0.99x

S E A B R I D G E G O L D
CL – Value Enhancing Opportunities
• Access to hydro-electric generated power
• Examine year round road access opportunities
Improve Capital and Operating
Costs
• Exploring for higher grade material that could be exploited in the early years of production
• History of high grade production along belt Higher Grades
• Exploring for additional bulk mineable deposits that could extend project life beyond the current 15 year estimate
Additional Deposits
27

S E A B R I D G E G O L D 28
S E A B R I D G E G O L D
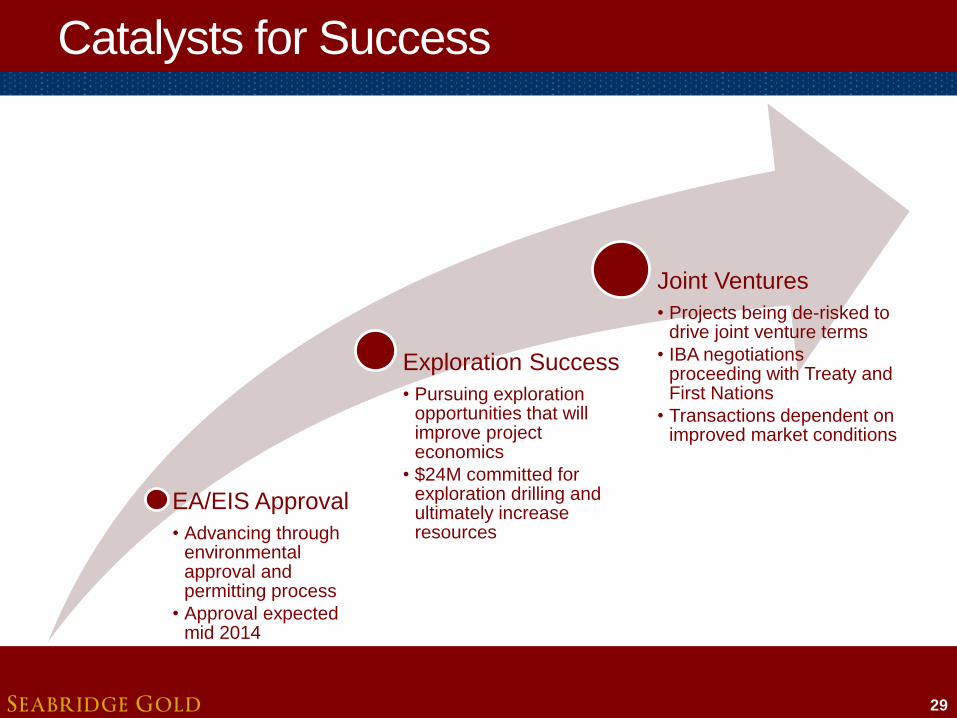
Catalysts for Success
29
EA/EIS Approval
• Advancing through environmental approval and permitting process
• Approval expected mid 2014
Exploration Success
• Pursuing exploration opportunities that will improve project economics
• $24M committed for exploration drilling and ultimately increase resources
Joint Ventures
• Projects being de-risked to drive joint venture terms
• IBA negotiations proceeding with Treaty and First Nations
• Transactions dependent on improved market conditions
S E A B R I D G E G O L D
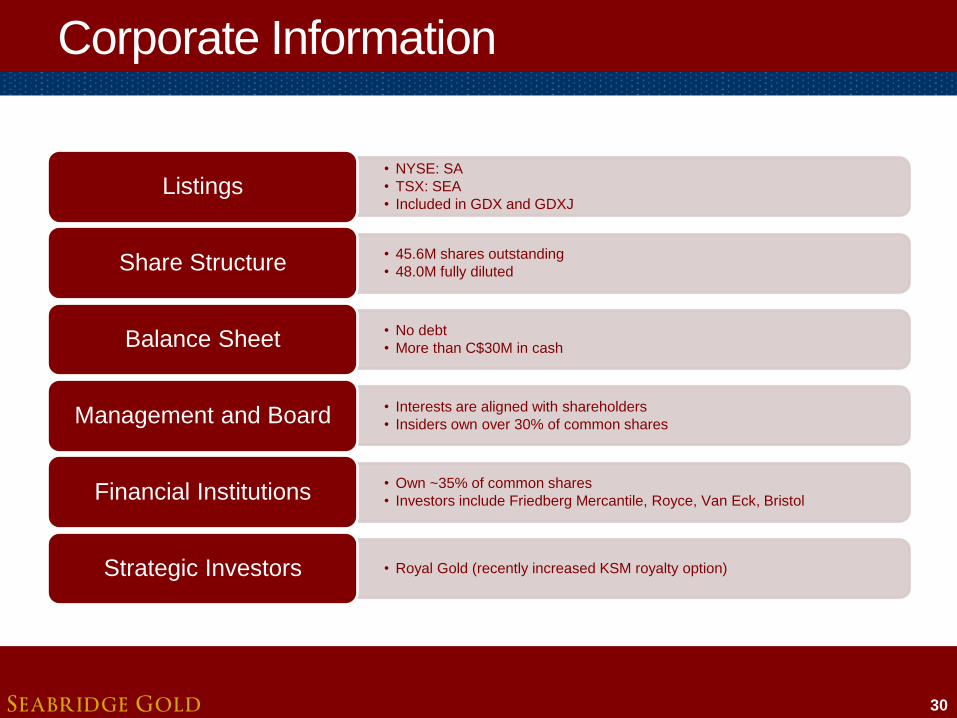
Corporate Information
• NYSE: SA
• TSX: SEA
• Included in GDX and GDXJ Listings
• 45.6M shares outstanding
• 48.0M fully diluted Share Structure
• No debt
• More than C$30M in cash Balance Sheet
• Interests are aligned with shareholders
• Insiders own over 30% of common shares Management and Board
• Own ~35% of common shares
• Investors include Friedberg Mercantile, Royce, Van Eck, Bristol Financial Institutions
• Royal Gold (recently increased KSM royalty option) Strategic Investors
30

S E A B R I D G E G O L D
Experienced Management
31
• Has over 30 years experience in the gold business, primarily as a senior officer and director of publicly traded companies including Greenstone Resources, Columbia Resources, Behre Dolbear & Company, Riverside Associates, Phibro-Salomon, Amax, and DRX
Rudi Fronk Co-Founder, Chairman & CEO
• Over 30 years of experience in the mining sector and is responsible for designing and managing the technical programs required to advance Seabridge's two main assets towards feasibility
• Former Vice President of Solutions and Innovation for Newmont Mining Company
Jay Layman Director, President & COO
• Over 30 years of exploration experience and is responsible for the design and execution of Seabridge’s exploration and resource delineation programs
• Previously served as Exploration Manager and Vice President with Placer Dome
Bill Threlkeld Senior VP, Exploration
• Over 30 years of experience in mine engineering, design, strategic analysis and start-up
• Formerly a Group Executive, Mine Engineering at Newmont Mining Corporation Peter Williams
Senior VP, Technical Services
• Has 20 years of mining industry and public accounting experience and has been a CGA since 1994
• Currently a director of Paramount Gold and Silver Christopher Reynolds
VP, CFO
• With over 20 years of experience, Mr. Murphy is responsible for developing and managing Seabridge's environmental programs and community engagement strategies
Brent Murphy VP, Environmental Affairs
• Has practiced law in the areas of corporate finance and securities, corporate and mining since 1993 and has been counsel to Seabridge Gold since 1999
Bruce Scott VP, Corporate Affairs

S E A B R I D G E G O L D
Board of Directors
• Founded Seabridge in 1999 and served as Chairman of the Board from 2002-2012
• Former advisor to a number of major corporations and venture capitalists focusing primarily on corporate strategy, and was a policy consultant to several government ministries
James Anthony Co-Founder
• Founder and Chairman of Mintec, Inc. and one of the original developers of MineSight™, recognized as the pre-eminent reserves modeling and mine design software system with more than 300 installations worldwide
Frederick Banfield
• Over 45 years of mining related experience, predominately in senior technical project management and operational roles, including Newmont and Freeport Scott Barr
• Over 40 years of accounting experience including senior audit partner with Deloitte Touche
Thomas Dawson Chairman of Audit and
Nomination Committees
• Over 25 years experience in precious metals trading, merchanting and merchant banking activities including J. Aron & Co,, Goldman Sachs and Gerald Metals Louis Fox
• With over 30 years of experience, Mr. Gonzalez-Urien is one of the most highly regarded exploration geologists in the mining industry. Ran global exploration for Placer Dome from 1989 through 2001 Eliseo Gonzalez-Urien
32