Seabirds as marine ecosystem indicators across the ... Reports/Seabirds as Indicators...Seabirds as...
27
1 Seabirds as marine ecosystem indicators across the Aleutian Archipelago Sarah Schoen, John Piatt, Mayumi Arimitsu, Erica Madison, Gary Drew, Martin Renner 1 , and Brielle Heflin U.S. Geological Survey, Alaska Science Center, Anchorage 1 Tern Again Consulting, Homer Annual Report June 2014 John Piatt
Transcript of Seabirds as marine ecosystem indicators across the ... Reports/Seabirds as Indicators...Seabirds as...

1
Seabirds as marine ecosystem indicators across the Aleutian
Archipelago
Sarah Schoen, John Piatt, Mayumi Arimitsu,
Erica Madison, Gary Drew, Martin Renner1, and Brielle Heflin
U.S. Geological Survey, Alaska Science Center, Anchorage
1 Tern Again Consulting, Homer
Annual Report
June 2014
John Piatt

2
Abstract
Forage fish play a vital role in marine ecosystems by funneling biomass and energy from lower trophic
levels to higher marine vertebrates, including commercial fish, seabirds and marine mammals. Often it is
useful to investigate factors influencing forage fish populations from the bottom up, and is equally fruitful
to monitor the status of predators that influence them from the top down. Seabirds are conspicuous,
highly mobile consumers of forage fish that go to great distances and depths to locate ephemeral prey.
They can be effective samplers of regional food webs, providing a valuable complement to traditional
fisheries sampling. We used the diet of Tufted Puffins (Fratercula cirrhata) to characterize forage fish
community composition in waters surrounding their colonies across the Aleutian Archipelago during mid-
August in 2012 and 2013. At colonies, we measured puffin chicks to obtain an index of their body
condition, which integrated the seasonal success of adults in finding and delivering food to their young.
Additionally, we conducted at-sea surveys around each puffin colony to measure seabird abundance and
distribution, and measured sea surface temperature and salinity simultaneously. Walleye pollock (Gadus
chalcogrammus) dominated the prey community in the eastern Aleutians in 2012, representing 74% of
individual prey items and 67% of total biomass delivered to puffin chicks. In the western Aleutians in
2013, walleye pollock were the most prevalent prey (29%), although they were less abundant than in the
east. Atka mackerel (Pleurogrammus monopterygius) led prey composition in terms of biomass (62%) in
the western islands. Tufted Puffin chick condition was significantly greater in the western then the eastern
islands, and condition of chicks in the eastern islands was influenced significantly by the size of their
primary prey. The density and composition of marine birds at sea varied among >570 km of strip-transect
surveys: Northern Fulmars (Fulmarus glacialis) were observed in highest overall abundance, followed by
Tufted Puffins, shearwaters, and auklets. Tufted Puffins were observed in significantly higher proportions
and densities in the eastern than the western islands. Oceanographic sampling suggested that puffin
colonies were clustered into four distinct water masses. The influence of these different water masses on
and around islands may explain spatial heterogeneity in biological characteristics of puffin and other
seabird communities and the forage fish they depend on along the Aleutian chain.
Introduction
Forage fish are a unique category of fishes and zooplankton defined by their key ecological role in marine
ecosystems. These small fish and large zooplankton (such as krill) are of exceptional energetic value to
predators owing to their high nutritional quality (often high in fat and protein), high abundance, and
tendency to form dense aggregations. Forage fish often constitute a large fraction of the diet of upper

3
trophic level species such as marine mammals, seabirds, and large predatory fish, and consequently play a
disproportionate role in the transfer of energy and carbon through marine food webs from primary
producers to secondary consumers and top predators. Being a common resource that affects a wide range
of taxa, the assessment of forage fish is particularly useful in understanding predator-prey relationships
(e.g., functional responses; Cury et al. 2011) and population dynamics (Hunsicker et al. 2011).
Understanding the spatio-temporal dynamics of forage fish is important to assess and forecast the
ecological status and health of marine ecosystems, as well as to assess the impact of human disturbances
from fishing and climate change. This is increasingly a prescribed mandate for fisheries management
(Zador 2013) and research (NPRB 2005) organizations.
The distribution and abundance of small, schooling forage fish in Alaska is known from some directed
small-scale studies that have employed traditional methods of capture (e.g., mid-water trawl, beach seine)
and/or hydroacoustic surveys (e.g., Sigler et al. 2004, Abookire and Piatt 2005); however forage fish
biology is often inferred from incidental catches in large-scale/large-mesh trawls that were not designed
(by gear or location) to sample them (M. Martin, p. 147-148 in: Zador 2011). In contrast to forage fish,
which are elusive and inefficient to monitor, seabirds are conspicuous, and are adept at finding and
collecting forage fish. Seabirds may target schools at great distances from their colonies and dive to great
depths to capture them, and many seabirds use communication to locate ephemeral prey patches with high
efficiency (Nevitt and Veit 1999). In turn, the availability and quality of prey resources is a central factor
influencing marine bird populations in Alaska (Boldt 2004, Piatt et al. 2007), with forage fish sustaining
more than 10 million breeding seabirds in the Gulf of Alaska and Bering Sea/Aleutian Island region of
Alaska alone (Byrd et al. 2005).
At colonies, most seabirds gather en masse annually to reproduce, so it is often possible to monitor large
numbers of them to estimate parameters of their biology or behavior such as their diet, timing of breeding
(phenology), breeding success, chick growth, and relative population status. Changes in many of these
parameters have been correlated with changes in food supply and/or with climate indices, presumably via
indirect effects of climate on food supplies (e.g., Sydeman et al. 2001, Gjerdrum et al. 2003, Fredericksen
et al. 2005, Reid et al. 2005, Renner et al. 2012). Moreover, their abundance and distribution appear to
correlate with variation in environmental variables such as temperature, salinity, current, and bathymetry,
making it possible to test related hypotheses about productivity and effects of climate change (Hunt and
Stabeno 2005, Ladd et al. 2005a).

4
Although seabird diets can provide information on the relative abundance, distribution, temporal
variability, condition, and community structure of local prey stocks (e.g., Hatch and Sanger 1992, Litzow
et al. 2000, Davorn and Montevecchi 2003), optimal foraging theory suggests that seabirds select prey
based on net energy maximization (MacArthur and Pianka 1966), and prey selection may vary with chick
development (Piatt and Kitaysky 2002). Thus seabird diets are unlikely to provide a completely unbiased
estimate of forage fish abundance and availability. Bias due to prey selectivity is minimized by targeting
generalist predators, like Tufted Puffins (Fratercula cirrhata), whose diverse diets reflect the availability
of a variety of prey species (Piatt and Kitaysky 2002).
We focused on several parameters of seabird ecology as indicators of the health and structure of forage
fish communities in the Aleutian Islands: diet composition and growth of Tufted Puffin chicks at
colonies, and the species composition and density of seabird communities at sea. These parameters were
chosen because in Alaska and elsewhere in the world they show strong connections with food resources in
the environment, a quality that is desirable for use as indicators (Durant et al. 2009). Tufted Puffins are an
ideal study subject because they are colonial piscivores with broad diets and they appear to consume
highly abundant and available prey near colonies (Piatt and Kitaysky 2002). Additionally, they also feed
their chicks whole food items, which can be easily identified and measured (Piatt and Kitaysky 2002). In
addition to studying forage fish through seabird parameters, we aimed to characterize the biophysical
attributes of pelagic habitats within the study area, and relate forage species and their predators to these
habitat characteristics.
Seabirds and fishes were identified as priority natural and cultural resources for the Aleutian and Bering
Sea Islands Landscape Conservation Cooperative (ABSI LCC), and seabirds were identified as affected
priority resources for all, and fishes for most of the landscape-scale stressors identified for the region
(https://absilcc.org/science/SitePages/Strategic%20Science%20Plan.aspx). Given their importance to the
character and function of this region, the ABSI LCC helped fund this research in support of their mission
to promote the “coordination, dissemination, and development of applied science to inform conservation
of natural and cultural resources”. In this annual progress report we present findings from our seabirds as
indicators study across the Aleutian Archipelago. We visited sixteen different seabird colonies scattered
throughout the Aleutian Islands, and we sampled the diet and growth of Tufted Puffin chicks at each
colony. Although constrained by a shortage of personnel and some equipment failures, we were able to
characterize the marine environment around many colonies. We conducted marine bird surveys and
oceanographic sampling (temperature and salinity) on systematic transects around colonies and while en
route between colonies.

5
Objectives
1. Assess changes in species composition, relative abundance and species richness of forage fish in
diet of Tufted Puffin chicks across the Aleutian Islands
2. Examine how changes in diet affect condition of Tufted Puffin chicks
3. Measure the relative abundance and density of marine birds at-sea near puffin colonies
4. Characterize the marine environment near puffin colonies
Methods
Study Area
Our study area spanned the entire Aleutian Archipelago, along the southern boundary of the Bering Sea,
Alaska (Fig. 1). The Aleutian Archipelago is a volcanic mountain range that extends nearly 2,000 km
from the Alaska Peninsula to the Kamchatka Peninsula. There is a general northward flow of waters from
the Gulf of Alaska or North Pacific into the Bering Sea through several major passes between the islands,
including Amchitka, Amukta, Samalga, and Unimak passes (Ladd et al. 2005a, Hunt and Stebeno 2005;
Fig. 1). Tidal mixing within the passes can influence local nutrient availability, temperature and salinity,
and contributes to differences in productivity on the north and south sides of the Aleutian Islands (Ladd et
al. 2005b, Ladd et al. 2005c). Additionally, productivity declines westward along the Aleutian
Archipelago as surface water nutrients become depleted (Hunt & Stabeno 2005).
These types of topographic, bathymetric, oceanographic, and biological variability are the basis for the
delineation of three marine ecoregion units within the Aleutian Islands: the eastern, central, and western
Aleutian Island units (Piatt and Springer 2007). These units represent areas with major physiographic and
minor oceanographic variation at a regional spatial scale, and incorporate mesoscale patterns in the
distribution of biological indicators, including segregation of some fish, birds, and mammal populations.
The eastern and central units are separated at Samalga Pass, and the central and western units at Amchitka
Pass.

6
Data Collection and Analyses
Sampling was focused on Tufted Puffin colonies. Work was based from the R/V 𝑇𝑖𝑔𝑙𝑎𝑥 during August
12-22 in both 2012 and 2013. We spent a day sampling on and around each of 16 islands (Table 1, Fig.
1). At each site we collected data on the: 1) diet and growth of Tufted Puffin chicks, 2) densities of
marine birds at sea, and, 3) sea surface temperature and salinity. Our general schedule was designed to
maximize visits to as many colonies as possible, spaced out across the entire Aleutian chain. We typically
sampled each colony from daybreak until 1700-1800 hours, and we processed prey samples in the lab
directly upon returning to the ship. At-sea survey work was typically conducted from 0800-1600 hours.
There are many puffin colonies scattered throughout this region, and we chose sampling locations based
largely upon logistic constraints (weather, suitable anchorages, accessibility of colonies, safe landing
conditions, potential for wildlife disturbances, etc.) as well as biological considerations (colony size and
burrow density, presence of historical data, etc.). At-sea survey work was constrained by logistics
(weather, coastal geography, time required to get to next colony) and availability of personnel.
Figure 1. Study area for biological and oceanographic sampling at Tufted Puffin colonies
located throughout the Aleutian Islands, Alaska during August, 2012 and 2013.
7
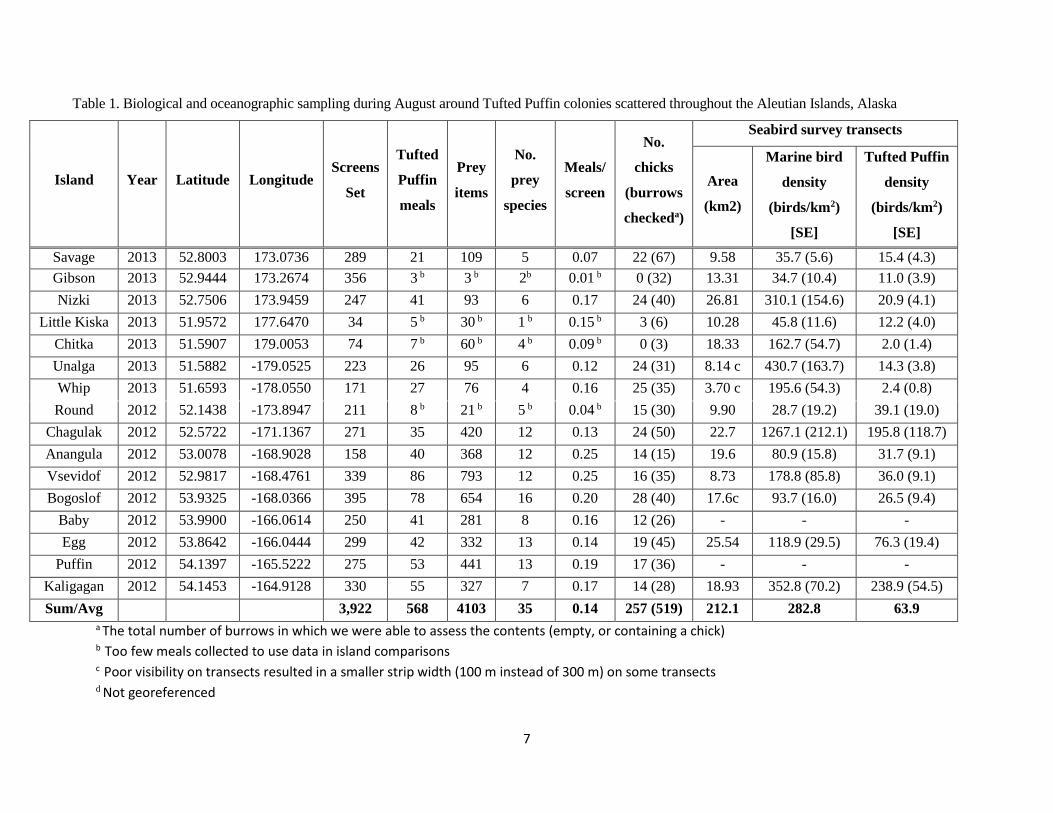
Table 1. Biological and oceanographic sampling during August around Tufted Puffin colonies scattered throughout the Aleutian Islands, Alaska
Island
Year Latitude Longitude Screens
Set
Tufted
Puffin
meals
Prey
items
No.
prey
species
Meals/
screen
No.
chicks
(burrows
checkeda)
Seabird survey transects
Area
(km2)
Marine bird
density
(birds/km2)
[SE]
Tufted Puffin
density
(birds/km2)
[SE]
Savage 2013 52.8003 173.0736 289 21 109 5 0.07 22 (67) 9.58 35.7 (5.6) 15.4 (4.3)
Gibson 2013 52.9444 173.2674 356 3 b 3 b 2b 0.01 b 0 (32) 13.31 34.7 (10.4) 11.0 (3.9)
Nizki 2013 52.7506 173.9459 247 41 93 6 0.17 24 (40) 26.81 310.1 (154.6)
(24.20)
20.9 (4.1)
Little Kiska 2013 51.9572 177.6470 34 5 b 30 b 1 b 0.15 b 3 (6) 10.28 45.8 (11.6) 12.2 (4.0)
Chitka 2013 51.5907 179.0053 74 7 b 60 b 4 b 0.09 b 0 (3) 18.33 162.7 (54.7) 2.0 (1.4)
Unalga 2013 51.5882 -179.0525 223 26 95 6 0.12 24 (31) 8.14 c 430.7 (163.7) 14.3 (3.8)
Whip 2013 51.6593 -178.0550 171 27 76 4 0.16 25 (35) 3.70 c 195.6 (54.3) 2.4 (0.8)
Round 2012 52.1438 -173.8947 211 8 b 21 b 5 b 0.04 b 15 (30) 9.90 28.7 (19.2) 39.1 (19.0)
Chagulak 2012 52.5722 -171.1367 271 35 420 12 0.13 24 (50) 22.7 1267.1 (212.1) 195.8 (118.7)
Anangula 2012 53.0078 -168.9028 158 40 368 12 0.25 14 (15) 19.6 80.9 (15.8) 31.7 (9.1)
Vsevidof 2012 52.9817 -168.4761 339 86 793 12 0.25 16 (35) 8.73 178.8 (85.8) 36.0 (9.1)
Bogoslof 2012 53.9325 -168.0366 395 78 654 16 0.20 28 (40) 17.6c 93.7 (16.0) 26.5 (9.4)
Baby 2012 53.9900 -166.0614 250 41 281 8 0.16 12 (26) - - -
Egg 2012 53.8642 -166.0444 299 42 332 13 0.14 19 (45) 25.54 118.9 (29.5) 76.3 (19.4)
Puffin 2012 54.1397 -165.5222 275 53 441 13 0.19 17 (36) - - -
Kaligagan 2012 54.1453 -164.9128 330 55 327 7 0.17 14 (28) 18.93 352.8 (70.2) 238.9 (54.5)
Sum/Avg 3,922 568 4103 35 0.14 257 (519) 212.1 282.8 63.9
a The total number of burrows in which we were able to assess the contents (empty, or containing a chick) b Too few meals collected to use data in island comparisons c Poor visibility on transects resulted in a smaller strip width (100 m instead of 300 m) on some transects d Not georeferenced

8
Diet and growth of Tufted Puffin chicks
Using methodology reported in Hatch and Sanger (1992), we placed small wire-mesh screens over the
entrances of puffin burrows so that adults returning with food for chicks could not enter their burrows, and
subsequently dropped their meal at the burrow entrance. We placed screens at several hundred (if possible)
burrow entrances on each island starting at approximately 0900 hours. Screens were left in place (and marked
with orange flagging tape) for 2-4 hours, then screens and prey items were retrieved and placed in whirlpacks
with salt water to retain freshness until they were identified. Adult puffins delivered meals to a fraction of all
burrows. On the vessel, samples were measured and identified to the lowest possible taxon. Total lengths of
individual prey were measured to the nearest mm and prey was weighed to the nearest 0.1 g. We did not
weigh every prey item; if a prey item was whole and was of a common species and size class we
occasionally measured only its total length. For those items we assigned an estimated mass: the average
mass of species of that length from that island or all islands if no prey items met those specifications.
We tested for differences in the number of chick meals collected per screen (catch per unit effort [CPUE])
between the eastern and western Aleutian Islands with a Mann-Whitney U test (data were not normally
distributed; JMP 5.0 [SAS Institute]). We were interested in both the community composition of forage
fish and the energetic contributions of forage fish to puffin chicks, thus we compared both the number of
prey species and the biomass (g) of prey. Because multiple prey items from each puffin meal (bill load)
were not statistically independent, prey items were summarized by meals as the sampling unit (e.g.
Thayer et al. 2008). We calculated both the proportional diet composition by number of prey items and
biomass for each meal at each island, including only those islands at which we collected over 20 puffin
meals in order to provide a representative sample of the fish delivered to each island (Table 1). We
analyzed the difference in species richness of forage fish between the eastern and western Aleutian
Islands using a non-parametric Mann-Whitney test, as the data did not meet the requirements for
parametric tests (JMP 5.0 [SAS Institute]). Because we were interested in richness at the island scale, we
used islands as replicates.
In addition to collecting chick meals, we removed (“grubbed”) Tufted Puffin chicks from burrows to
measure wing chord lengths (stretched, mm), mass (g), culmen (mm), and tarsus (mm) lengths (Table 1). To
limit disturbance, we attempted to grub chicks from different areas than those that we screened. We
recorded the number of occupied burrows and the total that we grubbed, giving us a rough idea of colony
occupancy (Table 1). We only included measurements for live chicks, and only present results from islands
with measurements of 14 or more chicks (n = 14) to give a representative sample of chick size (Table 1).
Because feather growth rate is a relatively fixed function of chick age (Wehle 1980), average wing lengths

9
obtained from brief visits to colonies can be used to assess breeding phenology (Hatch and Sanger 1992).
We calculated an index of chick condition by dividing chick mass (g) by wing chord length (mm), and
tested whether there was a difference in chick condition in the eastern and western islands using a Welch’s t
test as the samples had unequal variances (JMP 5.0 [SAS Institute]). We used regression analysis to test
whether chick condition was predicted by the mean length of the primary prey item in both the eastern
Aleutians, where the primary prey was walleye pollock, and in the western Aleutians, where the primary
prey by biomass was Atka mackerel (JMP 5.0 [SAS Institute]).
Marine bird densities
To evaluate marine bird abundance and distribution at-sea in our study area, we conducted surveys for
seabirds from the R/V 𝑇𝑖𝑔𝑙𝑎𝑥 using standard protocols (Gould and Forsell 1989). We censused seabirds
in a 300 m-wide strip on one side (left or right) of the ship's center line with the best visibility, including
birds abeam to 300 m in front of the vessel. A narrower strip was used occasionally when visibility was
reduced by fog. The vessel traveled at a consistent speed of approximately 10 knots whenever possible
along transects, which included spokes extending 5 km from the islands and transits among colonies (Fig.
2). One observer and one recorder identified and counted birds along transects, and sightings were
recorded using a computer-based system (dLog, R. G. Ford Consulting, Portland, Oregon) which assigned
GPS positions in real time. The observer identified and enumerated all birds on the water continuously,
and conducted instantaneous counts of flying birds every 300 m or 60 seconds, adjusting the count time
according to vessel speed. Both counts (on the water and the instantaneous flying) were combined to
calculate densities (number of birds/km2). To characterize the seabird communities surrounding puffin
colonies, we present results here only for the observations made along spokes near colonies, and not those
made along transit between colonies. All data, from spokes and transit surveys, have been archived in the
North Pacific Pelagic Seabird Database (http://alaska.usgs.gov/science/biology/nppsd/index.php/). We
analyzed the difference in the density and the proportion of total birds made up by Tufted Puffins along
transects in the eastern and western Aleutian Islands using a Mann-Whitney test (JMP 5.0 [SAS
Institute]).
Oceanographic sampling
We measured sea surface temperature and salinity using the ship’s hull-mounted thermosalinograph
(SeaBird® SBE 21). We collected thermosalinograph data continuously during transit, although some data
were not georeferenced (Round and Chagulak islands), and are consequently not included in analyses. We
used data processing software (SeaBird® Wild Edit) to identify and eliminate erroneous data values, and
then compared water masses around islands by breaking the data into 3 km by 3 km blocks and plotting the
10
mean salinity versus mean temperature values for each block. Finally, we used hierarchical clustering (JMP
5.0 [SAS Institute]) to group islands based on those temperature and salinity values.
Results
We collected data from 16 islands between Attu and Unimak Pass during August 12-22 in both 2012 and
2013 (Table 1, Fig. 1). We screened 3,922 puffin burrows and collected 568 chick meals composed of
4,103 individuals and at least 35 forage fish species (Table 1). Overall, 14% of the Tufted Puffin burrows
that we screened received a meal delivery from an adult puffin (Table 1). Additionally, out of the nearly
520 burrows of which we were able to determine occupancy, 259 of the burrows contained a live Tufted
Puffin chick; the remaining burrows were either empty or contained an egg or dead chick (Table 1).
Finally, we surveyed seabirds at sea in about 212 km2 of marine waters around Tufted Puffin colonies,
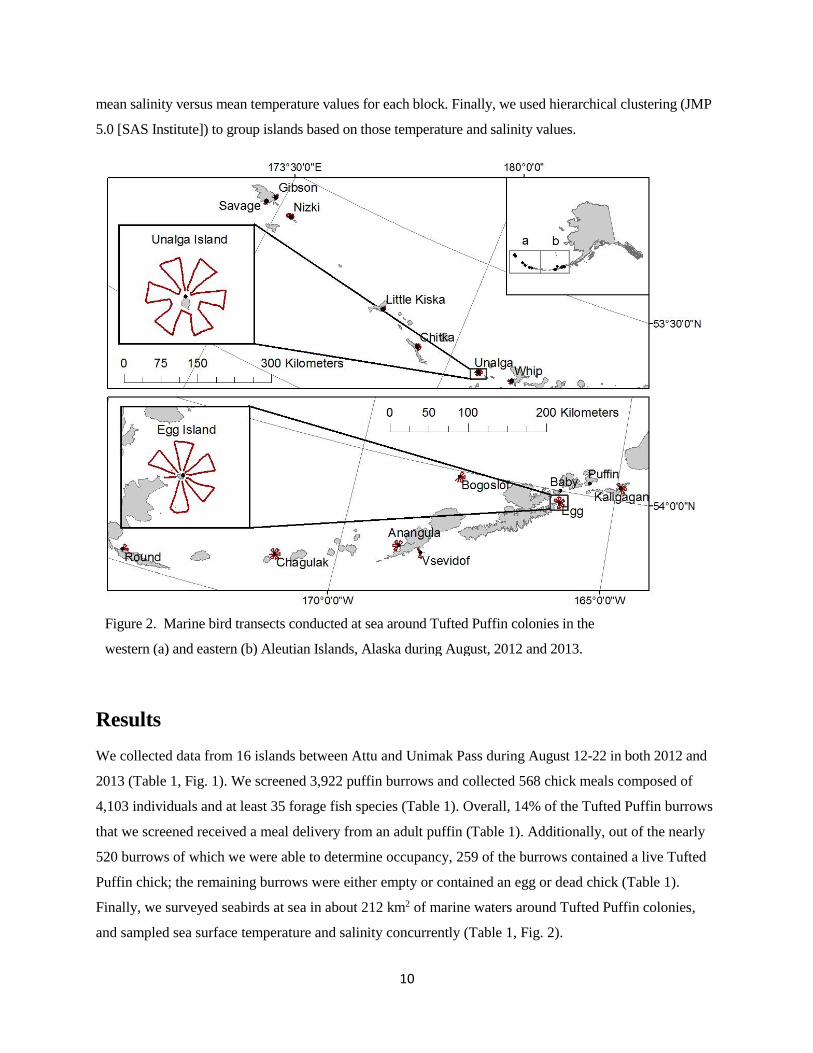
and sampled sea surface temperature and salinity concurrently (Table 1, Fig. 2).
Figure 2. Marine bird transects conducted at sea around Tufted Puffin colonies in the
western (a) and eastern (b) Aleutian Islands, Alaska during August, 2012 and 2013.

11
Tufted Puffin Chick Diets
Walleye pollock were the dominant species delivered to puffin chicks across the entire study area,
comprising 66% of total prey items (number of individuals) and 39% of total prey biomass (g; Fig. 3).
Other important species in chick diets included euphausiids, Pacific sand lance (Ammodytes hexapterus),
cephalopods (mostly squid), Pacific cod (Gadus macrocephalus), Atka mackerel, and several other
species (Fig. 3a). Although euphausiids were numerous, they contributed little to biomass owing to their
small size. Conversely, Atka mackerel were scarce but important in terms of biomass owing to their large
size (Fig. 3b).
Figure 3. Meal composition expressed as number of individuals (a) and biomass (b) of forage fish delivered
to Tufted Puffin chicks in the Aleutian Islands, Alaska during August, 2012 and 2013.
Regionally, walleye pollock dominated the prey delivered to chicks in the eastern Aleutians in 2012,
representing 74% of the total prey items and 67% of total biomass. Also important in the east were
euphausiids (12% of prey items), cephalopods (3% of prey items; 8% biomass), Atka mackerel (7%
biomass), and prowfish (5% biomass; Fig. 4). Walleye pollock were the most prevalent prey item (29%)
in the western Aleutians in 2013, but were much less dominant than in the east, especially in terms of
biomass (7% biomass). Other large contributors in the west, especially in terms of biomass, were Atka
mackerel (11% of prey items; 62% biomass), Pacific sand lance (23% of prey items; 7% biomass), and
cephalopods (18% prey items; 15% biomass; Fig. 4). The proportion of pollock in meals generally
increased from west to east (Fig. 4).
euphausiid
Pacific cod
prowfish
other
Pacific sand lance
cephalopod
Atka mackerel
walleye pollock
b a

12
The species richness of forage fish on islands was significantly higher in the eastern Aleutians than the
western (Z = -2.66; p = 0.008). At least 31 individual prey species were delivered to puffin chicks in the
eastern Aleutians, compared to only 11 species in the western Aleutians. The median species richness
(number of species per island) of forage fish delivered to chicks was 5.5 and 12 in the western and eastern
Aleutians respectively (Table 1). Additionally, we collected more puffin meals in the eastern than the
western Aleutian Islands. The CPUE across the entire study area was 0.14 (Table 1). CPUE was greater in
the eastern Aleutian Islands (0.17) than in the western Aleutian Islands (0.12; excluding Gibson Island),
although the difference was not significant (Z = -1.59, p = 0.112). Gibson Island, which had the lowest
0%
20%
40%
60%
80%
100%%
of
tota
l m
eal in
div
iduals
a
0%
20%
40%
60%
80%
100%
% o
f to
tal m
eal m
ass
Islands (west to east)
euphausiid
Pacific cod
prowfish
other
Pacific sand lance
cephalopod
Atka mackerel
walleye pollock
b
Figure 4. Meal composition at each colony (n = 12) expressed as number of individuals (a) and biomass
(b) of forage fish delivered to Tufted Puffin chicks during August in the Aleutian Islands, Alaska. The
dashed line denotes the separation between western (2013) and eastern (2012) islands.

13
CPUE that we measured (0.01), had many signs of a predatory rat population: droppings, scent, and
predated puffin chicks. We excluded Gibson from the analysis of CPUE because it was most likely
influenced by rats, and not representative of a normal island in the western Aleutian Islands. The average
mass of meals (±SE) delivered to Tufted Puffin chicks varied across the study area, with a mean of 18.62
(1.32) in the western islands and 11.08 (0.53) in the eastern islands (Fig. 5).
Tufted Puffin Chick Condition
Chick size varied considerably throughout the Aleutian chain (Table 1; Fig. 6). The largest (oldest) chicks
were on Whip Island and the smallest (youngest) were on Round and Chagulak islands (Fig. 6). Chicks in
the western islands were on average (mean [SE]) larger than those in the eastern islands in both wing
chord length (mm; western: 107 [2.68]; eastern: 92 [2.28]) and mass (g; western: 434 [11.50]; eastern:
345 [9.00]; Figs. 6). Likewise, chick body condition (mean [SE]) was significantly greater (t = -2.81; df =
234; p = 0.005) in the western (4.01 [0.05]) than the eastern (3.80 [0.05]) islands. The lowest mean chick
condition was found on Bogoslof Island (Fig. 7). In the eastern islands, where walleye pollock were the
primary prey, there was a significant positive linear relationship (R2 = 0.85; p = 0.001) between chick
condition and the mean length of pollock (Fig. 8). Conversely, in the west where Atka mackerel were the
primary prey by biomass, there was no significant relationship (p = 0.523) between the mean length of
Atka mackerel and chick condition.
0
8
16
24
32
Mean m
ass (
g)
of chic
k m
eals
Islands (west to east)
Figure 5. Mean (± SE) mass (g) of forage fish meals delivered to Tufted Puffin chicks at colonies (n =
12) during August in the Aleutian Islands, Alaska. The dashed line denotes the separation between
western (2013) and eastern (2012) islands.

14
0
100
200
300
400
500
600
0
20
40
60
80
100
120
140
Mean m
ass (
g) ±
SE
Mean w
ing c
hord
(m
m) ±
SE
Islands (west to east)
Wing chord
Mass
2.5
3
3.5
4
4.5
Chic
k c
onditio
n (
mass/w
ing)
Islands (west to east)
Figure 6. Mean (± SE) wing chord length (mm) and mass (g) of Tufted Puffin chicks at colonies (n =
13) during August in the Aleutian Islands, Alaska. The dashed line denotes the separation between
western (2013) and eastern (2012) islands.
Figure 7. Mean (± SE) condition (mass [g]/wing chord [mm]) of Tufted Puffin chicks at colonies (n =
13) during August in the Aleutian Islands, Alaska. The dashed line denotes the separation between
western (2013) and eastern (2012) Aleutian Islands.

15
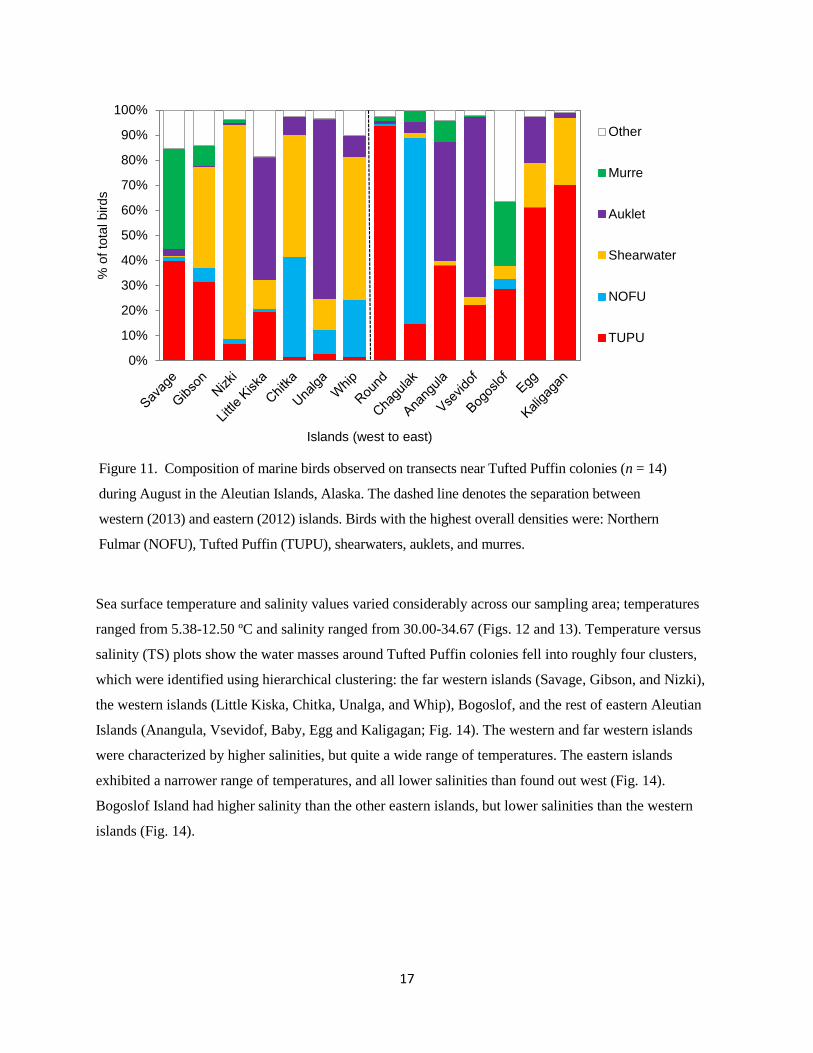
Distribution and Abundance of Marine Birds Around Tufted Puffin Colonies
We observed a total density of 283 marine birds/km2 on transects around Tufted Puffin colonies (Table
1). The density (birds/km2) of birds observed in the eastern and western islands was 354 and 185,
respectively, and mean species richness (± SE) was 13.43 (1.41) and 15.86 (0.89), respectively. The
highest bird densities were observed around Chagulak Island, near Amukta Pass, with a mean density
(birds/km2) per transect (±SE) of 1240 (212; Fig. 9). Unalga Island, near Amchitka Pass, had the next
highest mean density (506 [164]), followed by Kaligagan (351 [70]; near Unimak Pass) and Nizki islands
(214 [155]; Fig. 9). Tufted Puffin densities varied considerably throughout the study area, with the highest
densities observed around Kaligagan and Chagulak islands (Fig. 10). The median density of Tufted Puffins
was significantly greater (Z = -6.378; p < 0.001) in the eastern islands (median = 6.3) than the western
islands (median = 34.7; Fig. 10). Northern Fulmars (Fulmarus glacialis) were observed in the highest
density across the entire study area, and made up over 70% of birds observed at Chagulak Island (Fig.
11). Tufted Puffin was the next most common bird species observed, followed by shearwater species
(primarily Short-tailed Shearwater [Puffinus tenuirostris]), auklet species (primarily Whiskered Auklet
[Aethia pygmaea] and Least Auklet [Aethia pusilla]), and murre species (Thick-billed Murre [Uria lomvia]
and Common Murre [Uria aalge]; Fig. 11). Tufted Puffins made up a significantly larger (Z = -5.349; p <
0.001) proportion of birds observed (median) in the eastern (40% of birds) than in the western (11% of
birds) Aleutian Islands (Fig. 11).
R² = 0.85
3.1
3.4
3.7
4
4.3
45 49 53 57 61
Chic
k c
onditio
n (
mass/w
ing)
Mean length (mm) of walleye pollock
Figure 8. Relationship between mean length (mm) of walleye pollock (the primary diet item of Tufted
Puffin chicks) and chick condition (mass [g] /wing chord [mm]) at colonies (n = 8) in the eastern
Aleutian Islands, Alaska, 2012.

16
Islands (west to east)
Sav
age
Gibso
nNizki
Littl
e Kiska
Chitk
a
Una
lga
Whip
Rou
nd
Cha
gulak
Ana
ngula
Vse
vidof
Bog
oslof
Egg
Kaligag
an
Mean d
ensity o
f birds/t
ransect
0
200
400
600
1200
1350
1500
Islands (west to east)
Sav
age
Gibso
nNizki
Littl
e Kiska
Chitk
a
Una
lga
Whip
Rou
nd
Cha
gulak
Ana
ngula
Vse
vidof
Bog
oslof
Egg
Kaligag
an
Mean d
ensity o
f Tufted P
uffi
ns/t
ransect
0
25
50
75
100
200
300
400
Figure 9. Mean (± SE) density (birds/km2) of marine birds observed on transects near Tufted Puffin
colonies (n = 14) during August in the Aleutian Islands, Alaska. The dashed line denotes the
separation between western (2013) and eastern (2012) islands.
Figure 10. Mean (± SE) density (birds/km2) of Tufted Puffins observed on transects near Tufted Puffin
colonies (n = 14) during August in the Aleutian Islands, Alaska. The dashed line denotes the
separation between western (2013) and eastern (2012) islands.
17
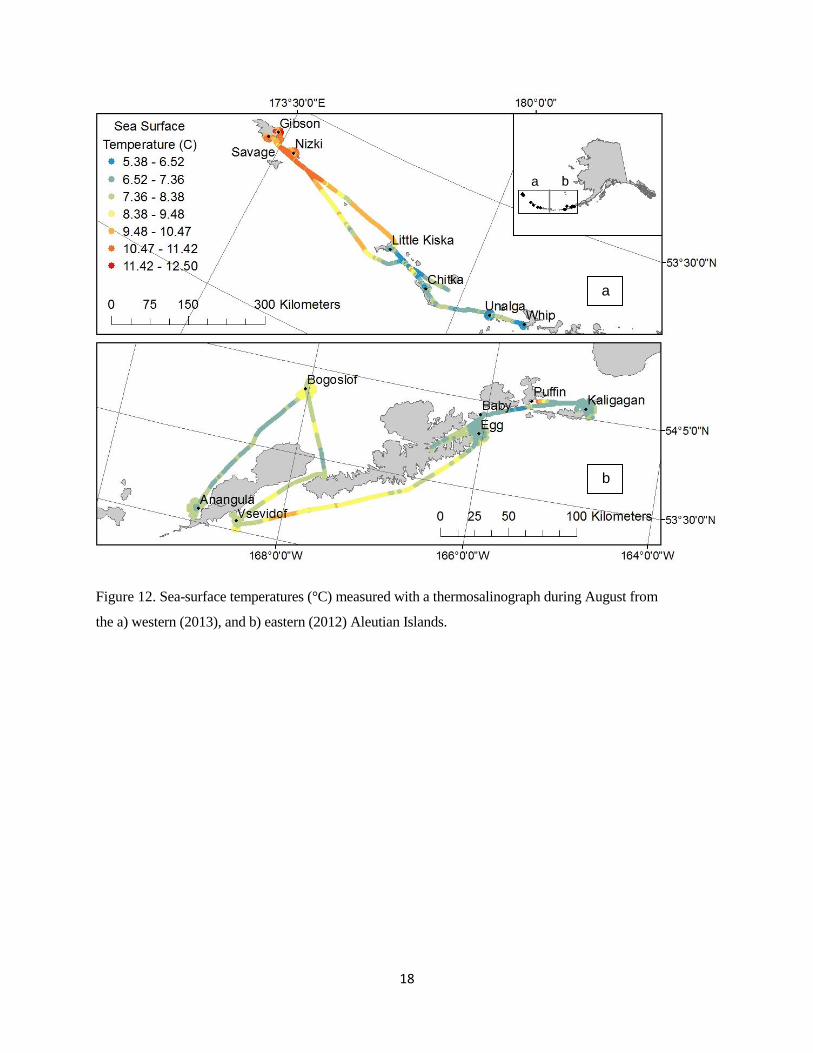
Sea surface temperature and salinity values varied considerably across our sampling area; temperatures
ranged from 5.38-12.50 ºC and salinity ranged from 30.00-34.67 (Figs. 12 and 13). Temperature versus
salinity (TS) plots show the water masses around Tufted Puffin colonies fell into roughly four clusters,
which were identified using hierarchical clustering: the far western islands (Savage, Gibson, and Nizki),
the western islands (Little Kiska, Chitka, Unalga, and Whip), Bogoslof, and the rest of eastern Aleutian
Islands (Anangula, Vsevidof, Baby, Egg and Kaligagan; Fig. 14). The western and far western islands
were characterized by higher salinities, but quite a wide range of temperatures. The eastern islands
exhibited a narrower range of temperatures, and all lower salinities than found out west (Fig. 14).
Bogoslof Island had higher salinity than the other eastern islands, but lower salinities than the western
islands (Fig. 14).
0%
10%
20%
30%
40%
50%
60%
70%
80%
90%
100%%
of
tota
l birds
Islands (west to east)
Other
Murre
Auklet
Shearwater
NOFU
TUPU
Figure 11. Composition of marine birds observed on transects near Tufted Puffin colonies (n = 14)
during August in the Aleutian Islands, Alaska. The dashed line denotes the separation between
western (2013) and eastern (2012) islands. Birds with the highest overall densities were: Northern
Fulmar (NOFU), Tufted Puffin (TUPU), shearwaters, auklets, and murres.
18
Figure 12. Sea-surface temperatures (°C) measured with a thermosalinograph during August from
the a) western (2013), and b) eastern (2012) Aleutian Islands.
a b
a
b

19
Figure 13. Sea-surface salinity (PPT) measured with a thermosalinograph during August in the a) western
(2013) and b) eastern (2012) Aleutian Islands, Alaska.
b
a b
a

20
Figure 14. Sea-surface salinity (PSU) versus temperature (°C) measured on transects (binned at 3 km
intervals) around Tufted Puffin colonies during August in the western (2013) and eastern (2012) Aleutian
Islands. Islands are listed in legend from west (top) to east (bottom), and grouped into four distinct clusters.
Discussion
We observed substantial variation in multiple biological and physical parameters across the length of the
Aleutian Archipelago, nearly 2,000 km in length and spanning almost 3 degrees of latitude. Our findings,
including distinctive ecological conditions between the western and eastern islands, are consistent with
others who have observed the partitioning of biological communities within the Aleutian Islands (Sinclair
and Zeppelin 2002, Hunt & Stabeno 2005, Ladd et al. 2005b). Recent studies have shown that abrupt
changes in oceanographic conditions, zooplankton and benthic fish community composition at Samalga
Pass in the eastern Aleutian Islands has a major influence on patterns of predator distribution, abundance
and diet (Sinclair and Zeppelin 2002, Hunt & Stabeno 2005, Ladd et al. 2005b). Among those patterns is
a decline in productivity as you move farther west along the Aleutians, forming two ecological regions
(Hunt and Stabeno 2005). With only two years of data we cannot assess the relative importance of annual
variability to the patterns we observed; however, we plan on analyzing long-term puffin diet datasets from
5
6
7
8
9
10
11
12
13
31.5 32 32.5 33 33.5
Tem
pera
ture
(°C
)
Salinity (PSU)
Savage
Gibson
Nizki
Little Kiska
Chitka
Unalga
Whip
Anangula
Vsevidof
Bogoslof
Baby
Egg
Kaligagan
21
islands in the eastern and western Aleutian Islands (Aiktak and Buldir islands; data collected by the
Alaska Maritime National Wildlife Refuge) to determine the typical range of variation and identify annual
trends.
We documented differences in the composition, relative abundance, and species richness of forage fish
delivered to puffin chicks across the Aleutian Islands. Walleye pollock were the dominant individual prey
item delivered to Tufted Puffin chicks across the entire Aleutian chain, yet their importance was markedly
greater (nearly 74%) in the eastern than the western (29%) islands. In terms of biomass, pollock were the
greatest (67%) contributor to chick diet in the east, but were minimal (7%) in chick diet in the west.
Instead, Atka mackerel represented the bulk of biomass (62%) in the west. The diets of two other
common marine predators, Steller sea lions and adult Pacific cod, were similarly dominated by walleye
pollock in the eastern Aleutians, and by Atka mackerel in the western islands (Sinclair and Zeppelin 2002,
Logerwell et al. 2005). Additionally, forage fish species richness at eastern islands was 2-fold greater than
at western islands. Similarly, the diets of Steller sea lions and adult Pacific cod were more diverse in the
eastern than western islands (Sinclair and Zeppelin 2002, Logerwell et al. 2005). Along with greater
species richness, the number of meals delivered per puffin burrow in the east was nearly double that
observed in the west. There are several possible explanations for the regional difference: 1) appropriate
prey may be more abundant and/or available to puffins in the east, 2) more of the island puffin
populations may have attempted breeding in the east than the west, 3) there may be regional differences in
food delivery rates, or, 4) there may be differences in breeding phenology among sites (i.e., meal
deliveries taper off near fledging; Harris 1984).
All of the metrics related to Tufted Puffin chicks that we measured varied between the western and
eastern Aleutian Islands, potentially in response to their prey. We observed larger, older Tufted Puffin
chicks in the western islands than in the eastern, suggesting that breeding was more advanced in 2013.
Seabirds have been shown to time their breeding based on food availability prior to egg laying (Shultz et
al. 2009), therefore foraging conditions in the spring may have influenced breeding phenology in our two
study years. In addition to advanced breeding phenology in the west, chick meals were nearly 70% larger
in mass than meals in the east. Because energetic demands of chicks increase with age (Piatt and Kitaysky
2002), adult puffins in the west may have been provisioning chicks with larger meals to keep up with
larger appetites of older chicks. Alternatively, the difference in mass of puffin meals between sampling
regions might simply indicate differences in the size (and age) of the available forage fish; the dominant
prey species by biomass in the west were age 1+ Atka mackerel, which were larger and heavier than the
dominant young of the year (age 0+) walleye pollock in the east. Furthermore, the body condition of

22
puffin chicks was significantly greater in western than eastern islands. In the eastern islands, the size of
the dominant prey, walleye pollock, was related to the condition of puffin chicks; chicks that were fed
larger fish had better body condition. The same relationship did not hold true for chicks in the west,
perhaps because chick diets had several key species in the west (including Atka mackerel, walleye
pollock, squid, and Pacific sand lance), compared to the pollock-centric diet of chicks in the east.
We observed higher densities of birds near island passes, which apparently provide attractive foraging
opportunities for seabirds (Ladd et al. 2005a). The highest densities of birds were around Chagulak
Island, which serves as one of the four breeding colonies for 99% of Northern Fulmars in Alaska (Mallory
et al. 2012). Like others (Jahncke et al. 2005), we observed significantly more Tufted Puffins in the
eastern than western islands. Out of all bird species observed, Tufted Puffins were over two times more
common in the eastern islands than the western, and the overall density of puffins was over 9 times
greater in the east than the west. We observed more fulmars in the central Aleutians, as did Jahncke et al.
(2005), but in contrast to their study, shearwaters were observed in greatest densities in the western than
eastern islands. In contrast to forage fish, bird species richness was similar among regions, but slightly
higher in the west than the east.
Oceanographic sampling identified four distinct water masses across the Aleutian Islands based on
temperature and salinity data. All of the western islands bore a Bering Sea salinity signature, in contrast to
the fresher influence of the North Pacific in the eastern islands. Bogoslof Island, located in the eastern
Aleutian Islands but farther north into the Bering Sea, had an intermediate salinity, likely due to its
location and ocean currents (Ladd et al. 2005b). We observed generally warmer waters in the eastern then
the western islands, but the far western islands exhibited the highest temperatures, perhaps due to surface
water warming during a calm, sunny period of sampling.
Temperature and salinity, as well as currents, distance to the continental shelf, and local bathymetry can
all influence trophic ecology in the Aleutians (Hunt & Stabeno 2005), and likely contributed to the
among-site differences we observed in this study. Specifically, islands in the eastern Aleutians were
characterized by higher forage fish CPUE at puffin burrows, higher forage fish species richness, a
dominance of walleye pollock in chick diet, lower meal masses and chick condition, and a higher
proportion and density of puffins than at islands in the western Aleutians. Correspondingly, western
islands had lower CPUE, lower forage fish species richness, a greater dependence on species other than
walleye pollock (especially Atka mackerel), greater meal masses and chick condition, and fewer puffins.
23
Acknowledgements
This work was funded by the U.S. Geological Survey (USGS), Ecosystems Mission Area, Landscape
Conservation Cooperative (LCC) support program. The U.S. Fish and Wildlife Service, Alaska Maritime
National Wildlife Refuge (AMNWR) also provided financial and logistic support. We are grateful to
AMNWR staff Steve Delehanty and Heather Renner for program support, and Jeff Williams, Captain
William Pepper and crew of the R/V 𝑇𝑖𝑔𝑙𝑎𝑥 for outstanding research support in the Aleutians. Last but
not least, we are sincerely grateful to those who joined us in the field work and contributed
enthusiastically to our data collection: Josh Adams, Allison Anholt, Tony DeGange, Amanda Gladics,
Keith Hobson, Forrest Piatt, Nora Rojek, and Ajay Varma. Any use of trade names is for descriptive
purposes only and does not represent endorsement by the federal government.
References
Abookire, A.A. and Piatt, J.F. 2005. Oceanographic conditions structure forage fishes into lipid-rich and
lipid-poor communities in lower Cook Inlet, Alaska, USA. Marine Ecology-Progress Series 287:
229–240.
Boldt, J. 2004. Ecosystem considerations for 2005. North Pacific Fishery Management Council
Groundfish Plan Team Document, November 2004, Dept. of Commerce, NMFS, NOAA, AFSC,
7600 Sand Point Way, N.E.
Byrd, V.G., Renner, H.M., and Renner, M. 2005. Distribution patterns and population trends of breeding
seabirds in the Aleutian Islands. Fisheries Oceanography 14: 139–159.
Cury, P.M., Boyd, I.L., Bonhommeau, S., Anker-Nilssen, T., Crawford, R.J.M., Furness, R.W., Mills,
J.A., Murphy, E., Osterblom, H., Paleczny, M., Piatt, J.F., Roux, J.P., Shannon, L., and Sydeman,
W.J. 2011. Global seabird responses to forage fish depletion – one-third for the birds. Science
334: 1703–1706. Supporting online material. Science 334.
Davoren, G.K. and Montevecchi, W.A. 2003. Signals from seabirds indicate changing biology of capelin
biology. Marine Ecology Progress Series 258: 253–261.
Demarchi, D.A. 1996. Introduction to ecoregions of British Columbia. B.C. Ministry of Environment,
Lands and Parks, Wildlife Branch,Victoria, B.C.
Durant, J.M., Hjermann, D.Ø., Frederiksen, M., Charrassin, J.B., Le Maho, Y., Sabarros, P.S., Crawford,
R.J.M., and Stenseth, N.C. 2009. Pros and cons of using seabirds as ecological indicators.
Climate Research 39: 115–129.
Gjerdrum, C.A., Vallée, M.J., St. Clair, C.C., Bertram, D.F., and Ryder, J.L. 2003. Tufted puffin
reproduction reveals ocean climate variability. Ecology 100: 9377–9382.

24
Gould, P.J. and Forsell, D.J., 1989. Techniques for shipboard surveys of marine birds: U.S. Department of
the Interior, Fish and Wildlife Service, Washington, DC, Fish and Wildlife Technical Report 25.
Harris, M.P. 1984. The puffin. Calton, UK: T & AD Poyser. 224 p.
Hatch, S.A. and Sanger, G. 1992. Puffins as samplers of juvenile walleye pollock and other forage fish in
the Gulf of Alaska. Marine Ecology-Progress Series 80: 1–14.
Hunsicker, M.E., Ciannelli, L., Bailey, K.M., Buckel, J.A., Wilson White, J., Link, J.S., Essington, T.E.,
Gaichas, S., Anderson, T.W., Brodeur, R.D., Chan, K.S., Chen, K., Englund, G., Frank, K.T.,
Freitas, V., Hixon, M.A., Hurst, T., Johnson, D.W., Kitchell, J.F., Reese, D., Rose, G.A., Sjodin,
H., Sydeman, W.J., van der Veer, H.W., Vollset, K., and Zador, S. 2011. Functional responses
and scaling in predator–prey interactions of marine fishes: contemporary issues and emerging
concepts. Ecology Letters 14: 1288–1299.
Hunt, G.L. and Stabeno, P.J. 2005. Oceanography and ecology of the Aleutian Archipelago: spatial and
temporal variation. Fisheries Oceanography 14: 292–306.
Jahncke, J., Coyle, K.O., and Hunt, G.L. 2005. Seabird distribution, abundance and diets in the central
and eastern Aleutian Islands. Fisheries Oceanography 14: 160–177.
Ladd, C., Jahncke, J., Hunt, G.L., Coyle, K.O., and Stabeno, P.J. 2005a. Hydrographic features and
seabird foraging in Aleutian Passes. Fisheries Oceanography 14: 178–195.
Ladd, C., Hunt, G.L., Mordy, C.W., Salo, S.A., and Stabeno, P.J. 2005b. Marine environment of the
eastern and central Aleutian Islands. Fisheries Oceanography 14: 22–38.
Ladd, C., Stabeno, P., and Cokelet, E.D. 2005c. A note on cross-shelf exchange in the northern Gulf of
Alaska. Deep Sea Research Part II: Topical Studies in Oceanography 52: 667–679.
Litzow, M.A., Piatt, J.F., Abookire, A.A., Prichard, A.K., and Robards, M.D. 2000. Monitoring temporal
and spatial variability in sandeel (Ammodytes hexapterus) abundance with pigeon guillemot
(Cepphus columba) diets. Ices Journal of Marine Science 57: 976–986.
Logerwell, E.A., Aydin, K., Barbeaux, S., Brown, E., Conners, M.E., Lowe, S., McDermott, S.,
Orr, J., Ortiz, I., Reuter, R., Spencer, P., and Thompson, G. 2005. Geographic patterns in the
ichthyofauna of the Aleutian Islands. Fisheries Oceanography 14: 93–112.
MacArthur, R.H. and Pianka, E.R. 1966. On the optimal use of a patchy environment. American
Naturalist 100: 603–609.
Mallory, M.L., Hatch, S.A., and Nettleship, D.N. 2012. Northern Fulmar (Fulmarus glacialis). The Birds
of North America Online (A. Poole, Ed.). Ithaca: Cornell Lab of Ornithology; Retrieved from the
Birds of North America Online: http://bna.birds.cornell.edu/bna/species/361doi:10.2173/bna.361
NPRB (North Pacific Research Board). 2005. North Pacific Research Board Science Plan. North Pacific
Research Board. Anchorage, AK. 198 p.
Nevitt, G. and Veit, R.R. 1999. Mechanisms of prey-patch detection by foraging seabirds. In: Adams, N.J.
& Slotow, R.H. (eds) Proc. 22 Int. Ornithol. Congr., Durban: 2072-2082. Johannesburg: BirdLife
South Africa.

25
Piatt, J.F., Harding, A.M.A., Shultz, M., Speckman, S.G., van Pelt, T.I., Drew, G.S., and Kettle, A.B.
2007. Seabirds as indicators of marine food supplies: Cairns revisited. Marine Ecology Progress
Series 352: 221–234.
Piatt, J.F. and Kitaysky, A.S. 2002. Tufted Puffin (Fratercula cirrhata), The Birds of North America
Online (A. Poole, Ed.). Ithaca: Cornell Lab of Ornithology; Retrieved from the Birds of North
America Online: http://bna.birds.cornell.edu/bna/species/708 doi:10.2173/bna.708
Piatt, J.F. and Springer, A.M. 2007. Marine ecoregions of Alaska. In: Spies, R. (ed.) Long-term
Ecological Change in the Northern Gulf of Alaska: 522-526. Elsevier, Amsterdam.
Reid, K., Croxall, J.P., Briggs, D.R., and Murphy, E.J. 2005. Antarctic ecosystem monitoring: quantifying
the response of ecosystem indicators to variability in Antarctic Krill. Ices Journal of Marine
Science 62: 366–373.
Renner, M., Arimitsu, M.L. and Piatt, J.F. 2012. Structure of marine predator and prey communities along
environmental gradients in a glaciated fjord. Canadian Journal of Fisheries and Aquatic Sciences
69: 2029–2045.
Shultz, M., Piatt, J.F., Harding, A.M.A., Kettle, A.B., and Van Pelt, T.I. 2009. Timing of breeding and
reproductive performance in murres and kittiwakes reflect mismatched seasonal prey dynamics.
Marine Ecology Progress Series 393: 247–258.
Sigler, M.F., Womble, J.N., and Vollenweider, J.J. 2004. Availability to Steller sea lions (Eumetopias
jubatus) of a seasonal prey resource: a prespawning aggregation of eulachon (Thaleichthys
pacificus). Canadian Journal of Fisheries and Aquatic Sciences. 61: 1475–1484.
Sinclair, E.H. and Zeppelin, T.K. 2002. Seasonal diet trends among the western stock of Steller sea lions
(Eumetopias jubatus). Journal of Mammalogy 83: 973–990.
Sydeman, W.J., Hester, M., Thayer, J.A., Gress, F., Martin, P., and Buffa, J. 2001. Climate change,
reproductive performance and diet composition of marine birds in the southern California Current
System, 1967-1997. Progress in Oceanography 49: 309–329.
Thayer, J.A., Bertram, D.F., Hatch, S.A., Hipfner, J.M., Slater, L, Sydeman, W.J., and Watanuki, Y.
2008. Forage fish of the Pacific Rim as revealed by diet of a piscivorous seabird: synchrony and
relationships with sea surface temperature. Canadian Journal of Fisheries and Aquatic Science 65:
1610–1622.
Wehle, D.H.S. 1980. The breeding biology of the puffins: Tufted Puffin (Lunda cirrhata), Horned Puffin
(Fratercula corniculata), and Rhinoceros Auklet (Cerorhinca monocerata). Ph.D. thesis, Univ.
Alaska, Fairbanks.
Zador, S. (ed.). 2011. Ecosystem considerations for 2012. North Pacific Fishery Management Council
Groundfish Plan Team Document, November 2011. NOAA, AFSC, 7600 Sand Point Way, N.E.
Zador, S. (ed.). 2013. Ecosystem considerations for 2013. North Pacific Fishery Management Council
Groundfish Plan Team Document, November 2013. NOAA, AFSC, 7600 Sand Point Way, N.E.
26
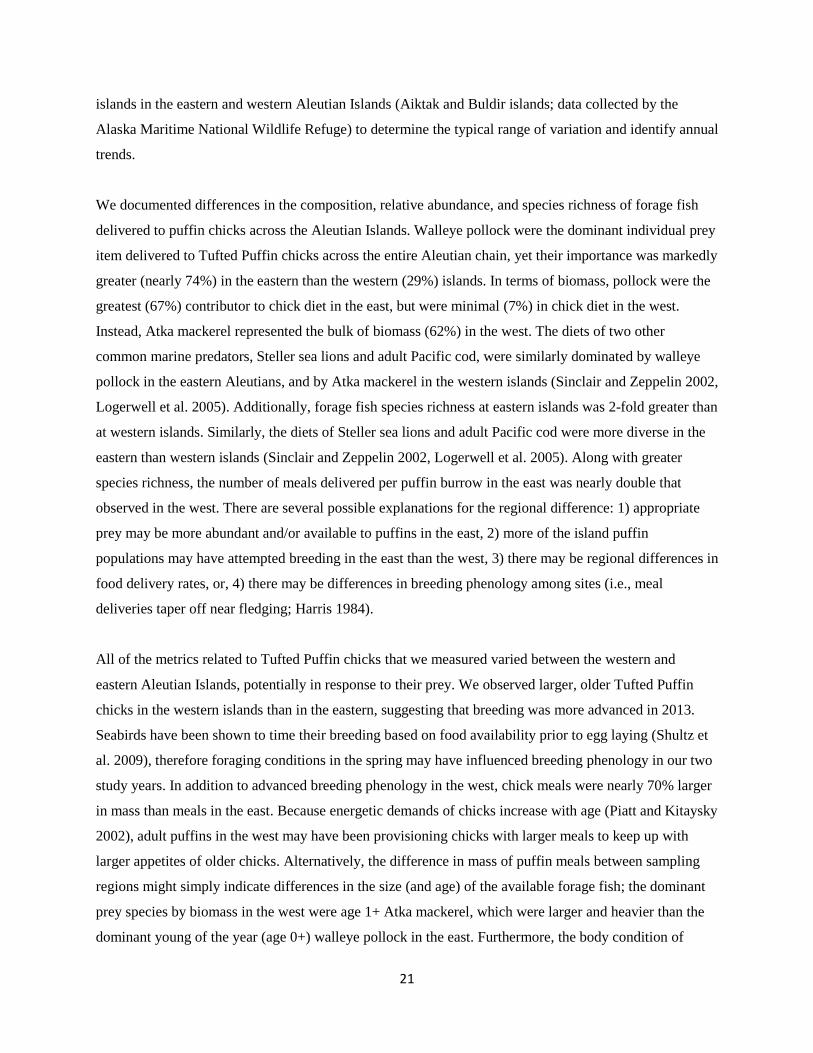
The field crew grubbing Tufted Puffin chicks on Kaligagan Island in August, 2012. Photo by Ajay Varma.
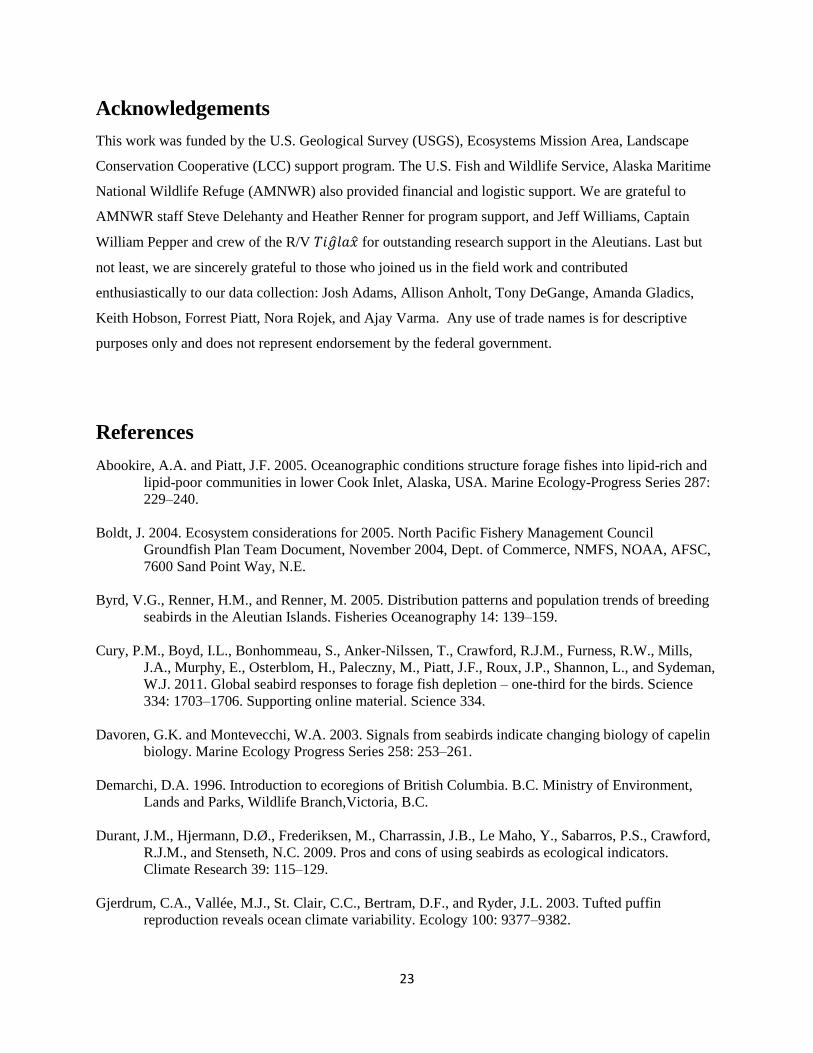
A Tufted Puffin flying over a puffin colony in the Eastern Aleutian Islands, August, 2012. Photo by Ajay Varma.
Ajay Varma
Ajay Varma
27
The R/V 𝑇𝑖𝑔𝑙𝑎𝑥 near Egg Island in August, 2012. Photo by Sarah Schoen.
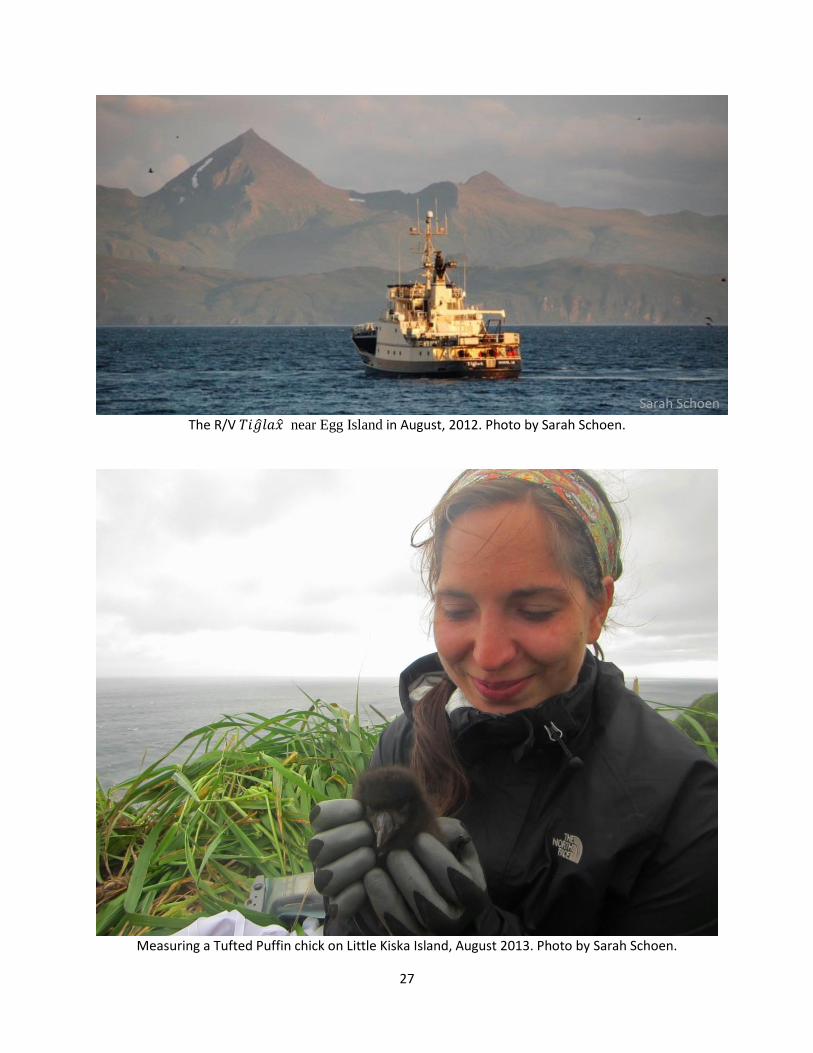
Measuring a Tufted Puffin chick on Little Kiska Island, August 2013. Photo by Sarah Schoen.
Sarah Schoen