Sea Level Rise Vulnerability Analysis of Mangrove ...
72
Nova Southeastern University Nova Southeastern University NSUWorks NSUWorks HCNSO Student Theses and Dissertations HCNSO Student Work 4-27-2020 Sea Level Rise Vulnerability Analysis of Mangrove Ecosystems Sea Level Rise Vulnerability Analysis of Mangrove Ecosystems Using GIS Using GIS Kayla Caldwell Follow this and additional works at: https://nsuworks.nova.edu/occ_stuetd Part of the Environmental Monitoring Commons, Marine Biology Commons, Oceanography and Atmospheric Sciences and Meteorology Commons, Population Biology Commons, and the Sustainability Commons Share Feedback About This Item NSUWorks Citation NSUWorks Citation Kayla Caldwell. 2020. Sea Level Rise Vulnerability Analysis of Mangrove Ecosystems Using GIS. Master's thesis. Nova Southeastern University. Retrieved from NSUWorks, . (526) https://nsuworks.nova.edu/occ_stuetd/526. This Thesis is brought to you by the HCNSO Student Work at NSUWorks. It has been accepted for inclusion in HCNSO Student Theses and Dissertations by an authorized administrator of NSUWorks. For more information, please contact [email protected].
Transcript of Sea Level Rise Vulnerability Analysis of Mangrove ...
Nova Southeastern University Nova Southeastern University
NSUWorks NSUWorks
HCNSO Student Theses and Dissertations HCNSO Student Work
4-27-2020
Sea Level Rise Vulnerability Analysis of Mangrove Ecosystems Sea Level Rise Vulnerability Analysis of Mangrove Ecosystems
Using GIS Using GIS
Kayla Caldwell
Follow this and additional works at: https://nsuworks.nova.edu/occ_stuetd
Part of the Environmental Monitoring Commons, Marine Biology Commons, Oceanography and
Atmospheric Sciences and Meteorology Commons, Population Biology Commons, and the Sustainability
Commons
Share Feedback About This Item
NSUWorks Citation NSUWorks Citation Kayla Caldwell. 2020. Sea Level Rise Vulnerability Analysis of Mangrove Ecosystems Using GIS. Master's thesis. Nova Southeastern University. Retrieved from NSUWorks, . (526) https://nsuworks.nova.edu/occ_stuetd/526.
This Thesis is brought to you by the HCNSO Student Work at NSUWorks. It has been accepted for inclusion in HCNSO Student Theses and Dissertations by an authorized administrator of NSUWorks. For more information, please contact [email protected].

Thesis of Kayla Caldwell
Submitted in Partial Fulfillment of the Requirements for the Degree of
Master of Science M.S. Coastal Zone Management
Nova Southeastern University Halmos College of Natural Sciences and Oceanography
April 2020
Approved: Thesis Committee
Major Professor: Paul Baldauf, Ph.D
Committee Member: J. Matthew Hoch, Ph.D
Committee Member: Matthew Johnston, Ph.D
This thesis is available at NSUWorks: https://nsuworks.nova.edu/occ_stuetd/526

I
HALMOS COLLEGE OF NATURAL SCIENCES AND OCEANOGRAPHY
Sea Level Rise Vulnerability Analysis of Mangrove Ecosystems Using GIS
By
Kayla Caldwell
Submitted to the Faculty of
Halmos College of Natural Sciences and Oceanography
in partial fulfillment of the requirements for
the degree of Master of Science with a specialty in:
Coastal Zone Management
Nova Southeastern University
April 2020

II
Acknowledgements
I would like to thank my major professor, Dr. Paul Baldauf, for his guidance and
encouragement throughout this process. It has been a long road with many redirections
through the ArcGIS world. I would also like to thank my committee members: Drs.
Matthew Johnston and Jeffrey Hoch for their thorough reviews and insights. I am very
grateful to Dr. Randall Parkinson, a professor from FIU, for provided me essential
information to the completion of this thesis. My friend Ricky was especially helpful
troubleshooting technical errors in ArcGIS. My friend Jessica was very helpful assisting
me in field surveys with her background in science. My mother, Lisa, my partner, Alicia
and my son, Jensen, have always been very supportive and instrumental to my success,
for which I feel truly blessed.

II
Table of Contents 1. List of Figures ....................................................................................................................... IV
2. List of Tables ......................................................................................................................... V
3. Abstract ................................................................................................................................... 1
4. Introduction ............................................................................................................................. 2
4.1 Study Region: Oleta River State Park .............................................................................. 2
4.1.1 Importance of This Study at Oleta River State Park ................................................. 2
4.1.2 Statement of Purpose ................................................................................................ 4
4.1.3 History....................................................................................................................... 4
4.1.4 Present condition Biscayne Bay and Oleta. .............................................................. 5
4.2 Mangrove Ecology ......................................................................................................... 11
4.2.1 Mangrove species in Florida. .................................................................................. 11
4.2.2 Soil building. ........................................................................................................... 13
4.2.3 Erosion buffer. ........................................................................................................ 14
4.2.4 Habitat provider. ..................................................................................................... 14
4.2.5 Importance to humans. ............................................................................................ 15
4.3 Climate Change and Sea Level Rise .............................................................................. 16
4.3.1 Mangroves and sea level rise. ................................................................................. 17
4.3.2 The use of remote sensing to study mangrove populations. ................................... 19
4.3.3 Coastal zone management plans to prepare for climate change. ............................ 20
5. Methodology ......................................................................................................................... 23
5.1 General Overview of Methods Used .............................................................................. 23
5.2 Mapping of Mangrove Extent Through Time ................................................................ 23
5.3 Determination of Mangrove Change Cause ................................................................... 27
5.4 Ground Truthing ............................................................................................................. 27
5.5 Interview with the Oleta Naturalist ................................................................................ 30
6. Results ................................................................................................................................... 31
6.1 General ........................................................................................................................... 31
6.2 Mapping of Mangrove Extent Through Time ................................................................ 31
6.3 Determination of the Change in Mangrove Area Compared To 1961 ........................... 41
6.4 Field Study ..................................................................................................................... 45
6.4.1 Species analysis. ..................................................................................................... 45
6.4.2 Tree height measurements. ..................................................................................... 49

III
6.4.3 Interview with the Oleta Naturalist. ........................................................................ 51
6.4.4 Stressed mangrove evaluation................................................................................. 51
7. Discussion ............................................................................................................................. 53
7.1 Mangrove Extent Through Time .................................................................................... 53
7.2 Field Study ..................................................................................................................... 54
8. Conclusions ........................................................................................................................... 56
8.1 Data Analysis Conclusion .............................................................................................. 56
8.2 Management Plan Suggestion ........................................................................................ 57
9. Works Cited .......................................................................................................................... 60

IV
1. List of Figures
Figure 1. Vicinity of Oleta River State Park.
Figure 2. The Boundaries of Oleta River State Park ((Division of Recreation and Parks, 2008).
Figure 3. Natural Communities Map.
Figure 4. The 2019 IPCC projected sea level rise through 2300 (IPCC, 2019).
Figure 5: The interaction of input and feedback considered throughout the decision making
process for Louisiana’s Management Plan (Peytonnin et al., 2013).
Figure 6: A graphic representation of the method of area calculation within ArcGIS.
Figure 7: The mangrove extent over time map with the areas of interest marked to visit in
person.
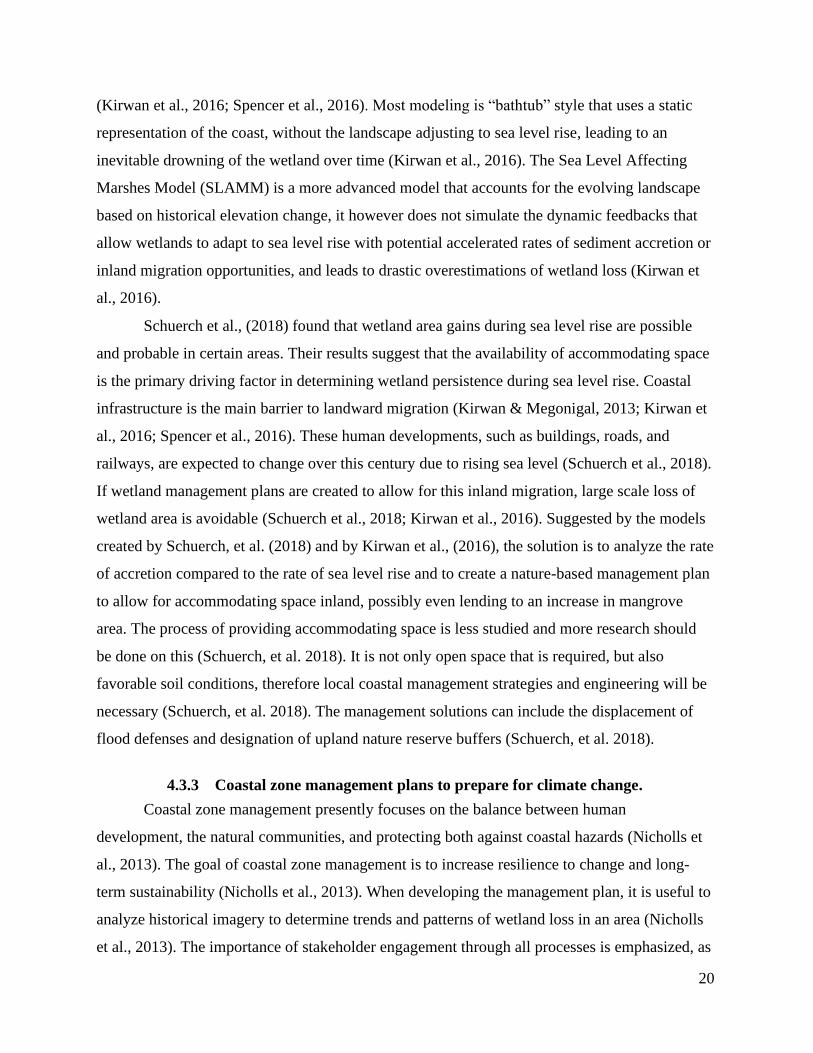
Figure 8: The photos map with a geotagged photograph displayed.
Figure 9: The geotagged photos map with the point icons indicating different tree species.
Figure 10: Photograph using Dioptera App to get the tan angle.
Figure 11: Mangrove cover from 1961. Full mangrove cover is 6.9 km2, partial mangrove cover
is 0.3 km2, and total mangrove area is 7.2 km2.
Figure 12: Mangrove cover from 1969. Full mangrove cover is 3.4 km2, partial mangrove cover
is 0.3 km2, and total mangrove area is 3.7 km2.
Figure 13: Mangrove cover from 1972. Full mangrove cover is 4.5 km2, partial mangrove cover
is 0.8 km2, and total mangrove area is 5.3 km2.
Figure 14: Mangrove cover from 1979. Full mangrove cover is 4.0 km2, partial mangrove cover
is 0.6 km2, and total mangrove area is 4.6 km2.
Figure 15: Mangrove cover from 1986. Full mangrove cover is 4.0 km2, partial mangrove cover
is 2.1 km2, and total mangrove area is 6.1 km2.
Figure 16: Mangrove cover from 2017. Full mangrove cover is 3.6 km2, partial mangrove cover
is 0.6 km2, and total mangrove area is 4.2 km2.
Figure 17: The change in total mangrove area from multiple year intervals between 1961 and
2017, shown in km2.
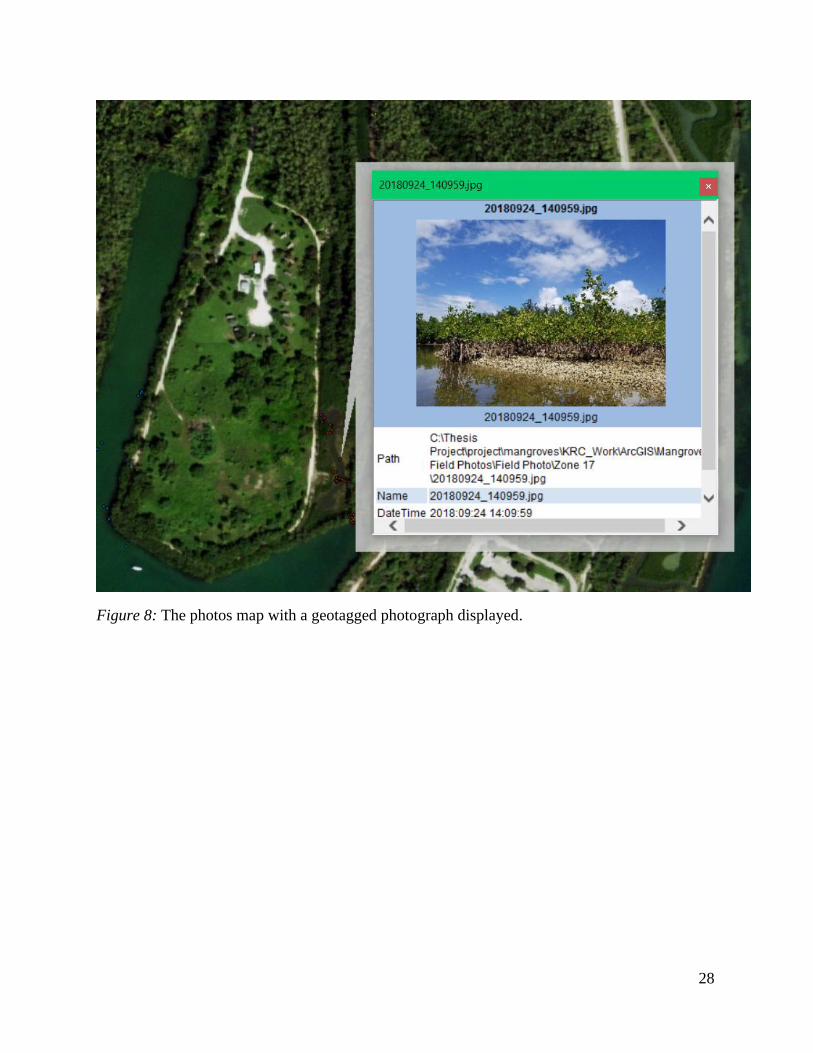
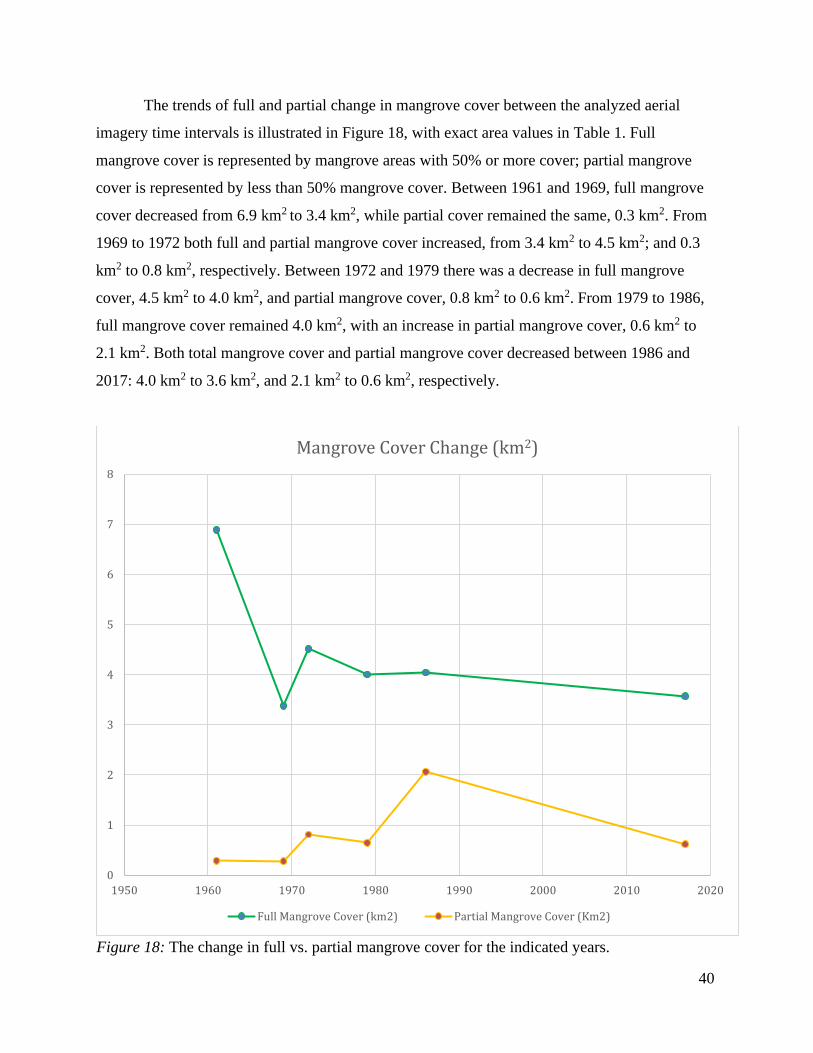
Figure 18: The change in full vs. partial mangrove cover for the indicated years.
Figure 19: The widening of the Oleta River illustrated by the 1961 mangrove area outline
displayed upon aerial imagery from 2017.
Figure 20: The present-day alteration of the 1961 mangrove forest, represented by polygons
depicting the cause of the mangrove loss.
Figure 21: The coverage of remaining mangrove area since 1961, along with the areas lost.
Figure 22a: Photograph embedded map with points depicting the ground truthing.
Figure 22b: Photograph embedded map with points depicting the ground truthing.
Figure 23: Shows the beginning of Australian pine encroachment into a Mangrove Forest (1986
on Left; Present Day on Right).
Figure 24: Tree height measurement results.
Figure 25: Fallen or dead trees seen in the field study.

V
2. List of Tables
Table 1: Data collected from polygon analysis.
Table 2: Area of remaining mangrove and cause of loss compared to 1961.
Table 3: Various tree height measurements taken at Oleta.

1
3. Abstract
Climate change is accelerating beyond what is natural due to excessive emissions from human
activities. The sea level has been rising for many years and is currently at a rate of 3.6 mm/yr.
Mangroves are known to only keep pace with a sea level rate of less than 1.2 mm/yr.
Mangroves are particularly vulnerable to rising sea levels if they are not able to keep pace
through vertical sediment accretion or inland migration. To test the vulnerability of the south
Florida mangrove ecosystems to sea level rise, this study analyzed changes in the mangrove
forest coverage of the Oleta River State Park over a period of 56 years. An analysis of Oleta
was chosen to be representative of a South Florida mangrove ecosystem due to its accessibility.
The mangrove population within Oleta River State Park, residing in an area with low
sedimentation rates and anthropogenic constraints on the landward side, is at risk due to sea
level rise. An ArcGIS analysis of archival aerial imagery from specific years available was
undertaken to determine mangrove area and the cause of change. The analysis found a
fluctuation in mangrove area over the past 50 years due to human development and mangrove
regrowth. Ultimately there was a 42% decrease and a total loss of 3.0 km2 in mangrove area
between 1961 and 2017. Field surveys discovered many stressors experienced by the
mangroves, including pollution, invasive species and sea level rise. The results suggest that
while the majority of change in area of the ecosystems was due to development, nonetheless,
11% of change was due to Australian pine growth and 2% due to shoreline loss. These results
support the need for effective management plans to conserve these important ecosystems.
Keywords: Mangrove, remote sensing, ArcGIS, climate change, wetlands, sea level rise

2
4. Introduction
4.1 Study Region: Oleta River State Park
4.1.1 Importance of This Study at Oleta River State Park
Oleta River State Park (Oleta) is a Florida State Park within Dade County, located in the
City of North Miami (Figure 1) (Blatt, 2018). This area was acquired in 1980 (Division of
Recreation and Parks, 2008) and established in 1986; it is the largest urban state park in Florida
with a total area of 422 hectares (Blatt, 2018). According to the Oleta River State Park Unit
Management Plan, the Oleta mangrove habitat is the largest remaining tidal swamp along
Biscayne Bay north of MacArthur Causeway (Division of Recreation and Parks, 2008). The
mangroves and river produce important habitat areas for many different species and is
considered the largest and most important native and wildlife habitat within the City (Blatt,
2018).
Oleta is valuable to the City of North Miami, providing approximately $46 million in
annual revenue and supporting 749 jobs in the Fiscal Year 2016-2017 (Blatt, 2018). Monthly
visitation to Oleta is equivalent to more than the entire population of the City (Blatt, 2018) with
annual visitation reaching half a million in the Fiscal Year 2016-2017 (Cutshaw, 2017).
Recreation services include kayaking, canoeing, biking trails, fishing, camping and hiking
(Blatt, 2018; Division of Recreation and Parks, 2008). Oleta has a 365 m long beach which
serves as the only public beach within the City (Blatt, 2018). Sandspur Island, also within
Oleta’s boundaries, has an area of 8 hectares and is located less than a half kilometer south of
Oleta’s mainland (Blatt, 2018). It is a popular site for kayakers and boaters (Blatt, 2018). Oleta
provides ecosystem services to humans by 1) serving as a natural storage area for flood waters,
2) reducing flooding, and 3) recharging groundwater (Lodge, 2016).
The mangrove community is a crucial component of the park’s natural ecosystem, and its
continued presence into the future is concerning. The habitats within Oleta are subject to
numerous stressors including invasive species, urban runoff, sewage spills, and toxic pollutants
from marinas and the adjacent Munisport Landfill (Division of Recreation and Parks, 2008). In
spite of these threats, Oleta has not been classified as an Area of Critical State Concern (as
defined in section 380.05, Florida Statues) or even considered for this designation (Division of
Recreation and Parks, 2008).

3
Figure 1: Vicinity of Oleta River State Park.
4
The City of North Miami has designated “The Oleta State Recreation Area and
Mangrove Preserve” as Environmentally Sensitive Land ("Natural Storage Areas," n.d.).
Management of the park is in collaboration between the Florida Park Service and the Biscayne
Bay Aquatic Preserve (Division of Recreation and Parks, 2008). Currently, the management
plan for the park does not include provisions for rising sea levels (Division of Recreation and
Parks, 2008).
The goal of this study is to determine whether mangrove habitat is likely to be inundated
by sea level rise. Predicting the effects of rising sea levels will provide useful insight for
managing these natural communities as our environment changes (Peyronnin et al., 2013).
Accurate predictions can provide sufficient lead time to minimize and offset anticipated loss
(Gilman, Ellison, Duke, & Field, 2008). Results from this study can be used to advise the next
management plan in their efforts to preserve and protect these mangroves and the continued
presence of the Oleta as a whole. If it is true that the mangrove habitat is threatened by sea level
rise, then specific management plans are required.
4.1.2 Statement of Purpose
Rising sea level, an existential threat to Oleta and other coastal parks, is currently not
included in the park management plan. The goal of this project is to assess whether, and to what
extent, the mangrove habitat at Oleta is threatened due to sea level rise. Threat assessment was
accomplished by analyzing historic imagery analysis and field checking the mangrove habitats of
Oleta. The results of this study provide a clear picture of the change in the mangroves over
recent history and indicate that rising sea level has already impacted this area. These data were
used to assess the resiliency of this habitat to change by analyzing current stressors on this area.
This information could be used by Oleta management planners to help mitigate the effects of
rising sea level on these mangrove habitats.
4.1.3 History.
Oleta, located at the north extent of Biscayne Bay, is within a shallow limestone
depression (Lodge, 2016). Lodge describes the Biscayne Bay as a historically narrow, isolated
lagoon. According to Lodge, sea level rose high enough to invade the lagoon 5,500 years ago,
transitioning it into estuarine and marine waters of the modern system by 3,200 years ago.

5
Prior to 1925, the natural ecosystem consisted of a large band of mangroves bordering a
freshwater marl prairie (Harlem, 1979; Teas, Wanless, & Chardon, 1976). This area had
historically been low lying between 0 and +0.3 m mean sea level, MSL (Division of Recreation
and Parks, 2008). Only a small (less than 0.4 hectare) zone resided above the intertidal zone,
representing small hammock islands scattered throughout the park area, at about 1.5 m above
MSL (Division of Recreation and Parks, 2008). A low salinity of approximately 4 parts per
thousand (ppt) (Division of Recreation and Parks, 2008) was maintained by freshwater input via
diffuse flows through wetlands, tidal creeks, springs, and groundwater seepage (Lodge, 2016).
Oleta is considered a historic outflow zone for the Everglades prior to anthropogenic impacts
within the past century (Division of Recreation and Parks, 2008).
The mangrove habitat that would become Oleta has been altered significantly over the
past century (Division of Recreation and Parks, 2008; Lodge, 2016). Mangroves were restricted
to the edges of Biscayne Bay prior to anthropogenic hydrological alteration of the Haulover inlet
in the early 1900s (Lodge, 2016). Biscayne Bay transitioned from a tidal estuary to the modern-
day marine lagoon due to a large decrease in freshwater input as a result of the flood control on
the Everglades (Lodge, 2016) through the Swamp and Overflowed Lands Grant Act (Division of
Recreation and Parks, 2008). The alteration to the natural hydrology allowed mangroves to
encroach on freshwater marl prairie communities (Division of Recreation and Parks, 2008).
Dense bands of red, black and white mangroves proliferated over the following half century,
despite the creation of numerous shallow ditches for mosquito control in 1935 through 1956
(Division of Recreation and Parks, 2008).
The mangrove habitat was reduced by approximately half due to dredging and filling for
development of the Interama project between 1962 and 1964 (Division of Recreation and Parks,
2008). This project was a failed attempt to build a large-scale trade and cultural center called the
InterAmerican Cultural and Trade Center, referred to as “Interama” (Blatt, 2018; Lejeune, 2010).
While Interama was never completed, the project left the park with 3 to 6 m wide canals at 0 to -
1.5 m below MSL, an open water lagoon, and elevated uplands at about 1.5 m above MSL, some
reaching up to 6 m above MSL (Division of Recreation and Parks, 2008).
4.1.4 Present condition Biscayne Bay and Oleta.
Oleta resides within south Florida at the north end of Biscayne Bay (Figure 1). Water
depth in the bay is generally shallow, with the center being 2-3.4 m deep at low tide (Lodge,

6
2016). Tides are semidiurnal with an amplitude of slightly over 0.6 m, measured at Virginia Key
(Lodge, 2016). Salinity varies greatly due to management by the South Florida Water
Management District on the upstream canal, fluctuating between 7 and 34 ppt with an average of
25 ppt (Division of Recreation and Parks, 2008).
Freshwater enters the bay through point source discharge (Lodge, 2016). The Snake
Creek Canal (Figure 2) north of Oleta, flows into northern Biscayne Bay (Lodge, 2016). Thirteen
canals discharge into the modern-day Biscayne Bay (Lodge, 2016). Freshwater from the canals
leads to stratification and prevents freshwater input to benthic communities that was provided in
the past by historic groundwater seepage (Lodge, 2016). Land acquired for the Interama project
now is divided between Oleta, Florida International University’s Biscayne Bay Campus, and the
delisted Munisport Superfund site that is now Sole Mia, a housing development and shopping
plaza (Figure 2) (Blatt, 2018).

7
Figure 2: The Boundaries of Oleta River State Park ((Division of Recreation and Parks, 2008).

8
4.1.4.1 Sediments.
Sands here are composed of silica (from the Appalachian Mountains) and locally
limestone composed of derived shell material (Lodge, 2016). The Natural Resources
Conservation Service identified five different soil types within the park region (Figure 3)
(Division of Recreation and Parks, 2008; Noble, Drew, & Slabaugh, 1996).
• Tidal Terra Ceia muck is in the mangrove forest along the Biscayne Bay, Oleta
River and an isolated triangular shaped mangrove area. Tidal Terra Ceia is a
poorly drained organic soil common in tidal swamps and marshes.
• Tidal Pennsuco marl soil occurs at the eastern fringes of the park. This marl soil is
thin, approximately 12 cm.
• Another marl origin soil, Tidal Perrine marl occurs in the northwest portion of the
park. Both areas are characterized by expanses of exotic vegetation. This is
unusual because the natural vegetation of these two soil types are typically
scattered and stunted red mangroves.
4.1.4.2 Significant Species Present in Oleta River State Park.
There are both riverine and fringe forest mangrove communities found at the park, along
with several small isolated mangrove areas “Estuarine Tidal Swamp” (Figure 4) (Division of
Recreation and Parks, 2008). The wide riverine forest lining the Oleta River, has an elevation
between 0 and +1.5 m MSL, consisting mainly of tall red mangroves (Rhisophora mangle) 8 to
15 m in height, along with less frequently occurring white mangroves (Laguncularia racemosa)
(Division of Recreation and Parks, 2008). Red and white mangroves seedlings populate the
understory (Division of Recreation and Parks, 2008). These mangroves were established after the
1925 Haulover Cut and 1945 aerial photographs show that a dense line of small mangroves was
already established (Division of Recreation and Parks, 2008). Since the 1970s, red mangroves
have fallen over along the shoreline, likely due to boat wake activity and boring isopods (Teas et
al., 1976).
Marine species found within Biscayne Bay include soft corals, sponges and species of
small hard corals along the deeper hard limestone bedrock substrate (Lodge, 2016). Marine
vegetation includes turtle grass and manatee grass, both abundant along the shallow benthic

9
habitat made from marine algae produced carbonate mud (marl) and sandy sediment substrates
(Division of Recreation and Parks, 2008; Lodge, 2016).
The elevated uplands have been populated by invasive vegetation including Australian
pine Casuarina equisetifolia, (Division of Recreation and Parks, 2008). Australian pine,
imported to Florida in 1887 is a prevalent invasive species within Oleta (Lodge, 2016). The
pines invade disturbed areas then shade out and smother herbaceous plants with leaf litter
(Lodge, 2016). Australian pine is damaging in beach dune areas as well, because roots can
obstruct turtle and crocodile nesting on low energy narrow beaches (Lodge, 2016), such as the
365 m stretch of public beach found in Oleta.
Oleta is a low-lying coastal area (Division of Recreation and Parks, 2008). As sea level
changes and mangrove species intolerant of new conditions perish, more resilient species may
colonize the area (Kirwan, Temmerman, Skeehan, Guntenspergen, & Fagherazzi, 2016;
Schuerch et al., 2018). Faster colonizers may dominate areas newly opened by sea level rise
(Lovelock, Bennion, Grinham, & Cahoon, 2011). A shift in mangrove composition and
distribution can only occur with enough time to recolonize and landward space in which to do so
(Kirwan et al., 2016; Schuerch et al., 2018).

10
Natural Communities Map
Figure 3: Natural Communities Map
Estuarine Tidal Swamp
Marine Unconsolidated
Substrate
Ruderal
Depression Marsh
Maritime Hammock

11
4.2 Mangrove Ecology
The following information on mangrove ecology is largely summarized by two sources,
“The Everglades Handbook, Fourth Edition” by Lodge (2016) and “Life Along the Mangrove
Shore” by Marsh & Bane (1995). Lodge (2016) defines mangrove forests as habitats comprised
mostly of mangrove trees located at the interface between terrestrial and marine systems. In
South Florida, mangrove forests evolved through a 3,000-year period of slowly rising sea levels
at a rate of 0.3 mm/yr, which created an accumulated coastal deposit of sand, marl, shell and
mangrove peat. The tidal nature of this environment subjects the mangrove trees to a great deal
of environmental stress, including periods of flooding, abruptly varying salinities (mostly due to
rainfall and evaporation), and temperature swings. Mangrove trees are specially adapted to live
in saline waters and anaerobic soils with high methane and hydrogen sulfide levels. Flora and
fauna in a mangrove forest need to be able to persist in a variety of conditions (Lodge, 2016).
Mangroves are found in tropical ecosystems around the world (Lodge, 2016). Ellison
and Stoddart (1991) found that mangroves reside mostly within the intertidal zone, mainly +/- 1
m between mean sea level and the level of mean high-water spring tides. In Tongatapu, Tonga
modern mangroves occur between 0.4 and 0.9 m above MSL, with mean tidal range of 1.07 m
(Ellison & Stoddart, 1991).
4.2.1 Mangrove species in Florida.
Within Florida, there are three mangrove species: Rhizophora mangal (red mangrove),
Aviccennia germinans (black mangrove) and Laguncularia racemose (white mangrove) (Lodge,
2016).
The red mangrove occurs at the most exposed, high wave action areas, typically at the
most seaward extend of the forest (Lodge, 2016). As described by Marsh and Bane (1995), red
mangroves in southern Florida as typically less than 6 m tall. Red mangroves are characterized
by 8-15 cm long leaves which are leathery, and elliptical shaped. This mangrove produces pale
yellow flowers, 2.5 cm in diameter, from stalks at the base of the leaves. Seedlings begin as
conical brown fruits, which germinate on the tree (Marsh & Bane, 1995).
Red mangroves do not require saltwater to thrive but do possess unique adaptations to life
in a saline environment. Lodge (2016) notes that aerial “prop” roots originate high up on the
trunk, sometimes even from branches, and extend downward towards the sea and soil beneath.

12
This serves to provide additional support, securing the trees, especially important in resistance to
hurricanes and high wave action. Further, Lodge notes that mangrove habitats have anaerobic
hydric soils from being continuously submerged with no atmospheric oxygen exposure To deal
with this, red mangroves have lenticels, small holes on the prop roots, which are used to
exchange gases with the atmosphere and supply the roots with oxygen. This also allows the red
mangrove to persist in the interior of a mangrove forest, as well, where conditions are
increasingly anaerobic. Excess salt is excluded from entering the tree at the roots. The roots also
serve an important ecological function below the surface by providing a secure substrate for
numerous sessile epifauna, such as barnacles, sponges, mussels and oysters (Marsh & Bane,
1995).
Red mangroves, unlike most other plants, are unable to re-sprout from branches and
trunks after the tree is damaged (Lodge, 2016). Other plants sprout from dormant buds under the
bark beneath growing branches when a branch breaks off (Lodge, 2016). Red mangroves can
initially produce dormant buds; however, damaged mangroves die within a few years because
older branches do not have the ability to sprout new branches (Lodge, 2016). This is a
vulnerability of the red mangrove in that it easily dies off when damaged (Lodge, 2016).
Black mangroves, like red mangroves, are also adapted to hydric soils but have different
adaptive features (Lodge, 2016). Their roots generate from beneath the soil and emerge as
upward extensions beyond the surface, called pneumatophores, up to 0.3 m above the soil. This
can lock in water and increase flooding duration in areas where these pneumatophores are very
dense. Black mangrove salt-balance system differs from other Florida mangrove species because
they have an internal system that excretes excess salt through glands in their leaves, rather than
exclusion at the roots (Lodge, 2016). Black mangroves are also identified by their blunt tipped
leaves, 5-15 cm long, with a dark green surface and lighter undersurface, often spotted with salt
crystals (Marsh & Bane, 1995). The bark of the black mangrove is dark brown to black in color
and divided into small rectangular shapes (Marsh & Bane, 1995). Small white flowers emerge in
clusters at the tips of short twigs (Marsh & Bane, 1995). The fruits are lima-bean shaped, conical
and compressed, 2.5 cm+ in diameter (Marsh & Bane, 1995). Black mangroves are the most
tolerant of cold weather (Lodge, 2016), which is useful in extreme weather situations, often seen
with increasing effects of climate change.
13
White mangroves grow anywhere throughout a mangrove forest, provided the shoreline is
protected (Lodge, 2016). They are, however, found most often in upland areas at the landward
extension of the forest (Lodge, 2016). There are two gland-like openings, petioles, where the leaf
stem meets the leaf (Lodge, 2016). When under stress, white mangroves form pneumatophores
as well as prop roots, albeit to a lesser extent than the black or red mangroves, respectively
(Lodge, 2016). They have thick leaves that are blunt and rounded with a notch at the apex and
colored dull light green on both sides (Marsh & Bane, 1995). Their fruits begin as white flowers
on spikes at the end of branches and later turn into small teardrop shaped fruits with a leathery
texture (Marsh & Bane, 1995).
Mangroves disperse through floating seeds, which settle in an adjacent area (Lodge,
2016). Red mangrove has a special seed dispersal through specially adapted propagule seeds
(Lodge, 2016). These grow while still on the tree and form the trunk of the seedling (Lodge,
2016). A propagule can drop straight from the parent tree and grow where it lands in very
shallow waters (Lodge, 2016). If the propagule lands in deeper water, it will float for several
days before its buoyancy is altered and it floats for an additional several weeks before sinking
and growing roots if the location is shallow with low wave energy (Lodge, 2016).
4.2.2 Soil building.
Mangroves facilitate soil building in two major ways: as mangroves die, matter from their
leaves, trunk, and stems decays and becomes mangrove peat; also, mangrove roots naturally trap
sediments such as sand, shells, and marl from coastal waters and materials carried in by storm
tides (Lodge, 2016; Moffett, Nardin, Silvestri, Wang, & Temmerman, 2015). The accumulation
of mangrove pollen (peat) in the upper half of the tidal range is a useful sea level indicator
(Engelhart, Horton, Roberts, Bryant, & Corbett, 2007). Tongatapu and Grand Cayman Mangal
stratigraphic analysis shows a peat accumulation rate of 0.8-0.9 mm/yr without coastal sediment
input (Ellison and Stoddart, 1991)
Lodge (2016) describes that the composition of mangrove soils includes the above
described mangrove peat and trapped sediments, as well as dissolved substances in seawater.
Lodge notes that methane (CH4) is produced through peat decay. Sulfate (SO4), abundant in
seawater, is converted to hydrogen sulfide (H2S) via sulfate-reducing bacteria and is responsible
for the characteristic rotten egg smell of mangrove forests (Lodge, 2016). Hydrogen sulfide,
14
toxic to most plants, is tolerated by mangrove species through their root-aeration adaptations
(Lodge, 2016).
It is important to note the difference between soil building and land building (Lodge,
2016). Often mistaken to be land builders, mangroves are soil builders. Lodge notes that land
building only occurs though an unusual event where a large storm or hurricane deposits enough
material to raise the mangrove swamp above high tide and this process usually causes mangrove
mortality, as described by Ellison (1999) (as cited in Moffett et al., 2015). Soil building occurs
through the process of accumulating mangrove peat (leaves, stems, branches), sand, shells and
other sediments (Lodge, 2016). Erosion must be minimal for soil building to occur (Godoy & De
Lacerda, 2015).
4.2.3 Erosion buffer.
Mangrove roots also provide coastal stabilization from erosion, buffering the land during
periods of high wave energy and storms (Gilman et al., 2008; McKee, Cahoon, & Feller, 2007).
Mangroves trap sediment and stabilize the substrate with roots (Moffett et al., 2015). By these
processes, mangroves can aid in buffering against sea level rise (Temmerman et al., 2013;
Costanza et al., 2008; Gedan et al., 2011; Moller et al., 2014; all as cited in Moffett et al., 2015).
4.2.4 Habitat provider.
Mangroves provide habitat for many organisms such as sponges, barnacles, crustaceans,
fishes, manatees, birds, mollusks and bacteria (Alongi, 2008, 2015). They increase coastal water
quality, biodiversity, and provide a nursery habitat for fishes and crustaceans (Gilman et al.,
2008). Gilman et al., (2008) also found these functions benefit adjacent habitats.
The shallow, protected, and tidal habitat that is associated with mangroves in south
Florida is well suited for the eastern oyster, also known as the American oyster, Crassostrea
virginica (Lodge, 2016). In turn, the presence of these oysters, particularly when formed into
oyster bars, are known to accelerate mangrove establishment, especially red mangroves (Lodge,
2016).
The mangrove trees themselves become nourishment for organisms through the decay of
their leaves, stems, and pollen (Lodge, 2016). First the decaying material becomes food for
larger marine life, broken down further, it becomes food for decomposing bacteria and fungi,
becoming a protein rich detritus which looks like a slimy brown film on the leaf surface (Lodge,

15
2016; Marsh & Bane, 1995). The detritus is then available for use by organisms such as small
crustaceans and fish, delivering energy to the base of the food web (Lodge, 2016). The benefits
of mangroves are then felt throughout the ecosystem by providing a nursery habitat for juvenile
animals (Lodge, 2016).
4.2.5 Importance to humans.
Mangrove forests provide many benefits for humans. Mangroves have a high economic
importance, providing over $1.6 billion/year in ecosystem services worldwide (Polidoro et al.,
2010). Wetland ecosystem services are valued up to $194,000 per hectare per year (Costanza, et
al., 2014, as cited in Schuerch et al., 2018). Wetlands trap pollution and increase water quality
(Teuchies, et al., 2013 as cited in Schuerch, et al. 2018). Mangrove restoration is economically
beneficial, as seen in a study conducted by The Ramsar Convention Secretariat (2001),
mangroves in Thailand cost $946 per hectare to restore but only $189 per hectare to protect. It is
important to focus on preservation of current mangrove forests before they die off, because once
wetlands are degraded, they are difficult to restore as suggested by high rates of failure in
coastal wetland restorations (Palmer, 2008; Hughes & Paramor, 2004; Williams & Orr, 2002;
Williams & Faber, 2001; all as cited in Moffett et al., 2015).
Consequences of mangrove loss include a reduction in biodiversity, nursery habitat,
human resources (such as products and tourism), water quality, as well as negative effects on
adjacent habitats (Ellison & Stoddart, 1991; Ewel, Twilley, & Ong, 1998; Mumby et al., 2004;
Nagelkerken et al., 2008; Walters et al., 2008). Mangrove degradation eliminates a major
resource for human communities that rely on mangrove products and services (Gilman et al.,
2008). Given that mangroves are important erosion and storm buffers, providing protection from
storm surges and flooding, loss in mangrove area results in the increase of threats to the
shoreline and human safety (Gilman et al., 2008).
Greenhouses gases, such as carbon dioxide (CO2), trap heat in the atmosphere and are
responsible for the anthropogenically accelerated change in climate (IPCC, 2013; Kristensen,
Bouillon, Dittmar, & Marchand, 2008). Mangroves are substantial sites for carbon storage
(Donato et al., 2011). Accumulated organic carbon in mangroves, which is not degraded by
microbes, becomes stored in sediments (Alongi, 2008). As such, mangroves are considered
carbon sinks, an environment that absorbs carbon, through their high rates of primary production
and carbon burial (Baur et al., 2013; Duarte et al., 2013; Pendleton et al., 2012; Mcleod et al.,

16
2011; all as cited in Moffett et al., 2015). Mangrove destruction would generate the release of a
large quantity of stored carbon and further contribute to greenhouse gas emissions (Gilman et
al., 2008).
4.3 Climate Change and Sea Level Rise
The climate is changing beyond what is natural due to excess greenhouse gas emissions
released into the atmosphere due to human activities (IPCC, 2013). Sea levels are rising through
thermal expansion of sea water and melting of glaciers, leading to increased coastal erosion,
flooding, storm surges, salt-water intrusions and other damaging effects (Pachauri et al., 2014).
These two conditions, melting of the polar ice caps and thermal expansion, are nearly equal
contributors to sea level rise (Lodge, 2016). Precipitation patterns are changing, increasing
runoff, which leads to eutrophication (algae blooms), increased frequency and severity of
flooding and more intense storms/hurricanes (IPCC, 2013).
The rate of sea level rise worldwide is not consistent (IPCC, 2019). This is due to
geologic instabilities, including glacial rebound, the process where melting glaciers lessen the
downward force on the earth’s crust, allowing it to rebound and raise up with buoyancy; in
contrast, areas with land subsidence will exhibit a greater than average sea level rise (IPCC,
2019). Land areas such as Florida that are free from the influence of glacial rebound or land
subsidence provide the most reliable rates of sea level rise (Lodge, 2016).
The rate of sea level rise has increased over the past century (Pachauri et al., 2014). It is
very likely that the rate of sea level rise between 1901 and 1990 was 1.4 mm/yr; and between
2006 and 2015 the rate increased 2.5 times to 3.6 mm/yr on average (Figure 5) (IPCC, 2019).
Under the IPCC RCP8.5 scenario, the rate of sea level rise will be 15 mm/yr in 2100 (IPCC,
2019).

17
Figure 4: The 2019 IPCC projected sea level rise through 2300 (IPCC, 2019)
4.3.1 Mangroves and sea level rise.
There are multiple factors to consider when determining the ability of a mangrove
population to persist in the face of rising seas. However, if the sea rises faster than the rate of
surface sediment accretion, the mangroves cannot keep pace (Alongi, 2008; Gilman et al., 2008;
Kirwan et al., 2016; Schuerch et al., 2018). Mangroves are threatened when there is no space
available for landward migrations; this is exacerbated in low-lying areas (Gilman et al., 2008;
Nicholls, Townend, Bradbury, Ramsbottom, & Day, 2013; Parkinson, DeLaune, & White,
1994).
The success of mangrove resilience to sea level rise depends upon the rate of sea level
rise compared to sediment accumulation (Alongi, 2008; Cahoon et al., 2006; Doyle, Krauss,
Conner, & From, 2010; Gilman, Ellison, & Coleman, 2007; Gilman et al., 2008). Sediment
accumulation, erosion and resultant elevation changes affect a mangrove forest's ability to
migrate during sea level rise (Godoy & De Lacerda, 2015). Mangroves are known to only be
able to keep pace with a rate of less than 1.2 mm/yr sea level rise (Ellison and Stoddart, 1991)
given that there is sufficient sediment input (Schuerch et al., 2018; Kirwan et al., 2016).
Historically, soil accretion rates in mangrove forests coincide with sea level rise, allowing
mangroves to migrate inland (Alongi, 2015). By contrast, climate is changing more rapidly than
ever before (Pachauri et al., 2014). Traill et al. (2011) found that mangrove migration inland

18
kept pace with the rate of mangrove loss seaward under minimal sea level rise scenarios but
could not keep pace under maximal sea level rise scenarios. For example, mangroves in
subtropical Australia are projected to not be able to keep up with the accelerating rate of sea
level rise (Traill et al., 2011).
In order to migrate inland there needs to be favorable conditions of the slope of the land,
and available space (Gilman et al., 2008). In areas with low sediment input and high
anthropogenic structure constraints, such as is found in the Caribbean Sea and the
southerneastern US coast, there could be a loss of 66% of current wetland cover (Schuerch et al.,
2018). Schuerch et al. (2018) found there to be a sediment deficiency of -20 to -5 mg l-1
surrounding Florida and the southern US east coast; this represents “the difference between the
suspended sediment concentration needed for coastal wetlands to build up vertically with current
(sea level rise) rates and the actual total suspended matter concentration derived from the
satellite borne GlobColour data (http://globcolour.info).” The effect of increased sea level
erosion of wetlands on the seaward side, while they are prevented from inland migration by
infrastructure, is termed “coastal squeeze” (Torio & Chmura, 2013; Wolters et al., 2005; both as
cited in Kirwan et al., 2016).
Since the severity of a disturbance to a habitat depends on its intensity and duration, the
current anticipated pattern of sea level rise is a long-term severe disturbance that is projected to
continue for the foreseeable future (Pachauri et al., 2014). Sea level rise will bring increased
erosion rates and a greater frequency and intensity of storms (Ellison & Stoddart, 1991).
According to a study conducted by Ellison and Stoddart (1991), a sea level rise rate of 0.8-0.9
mm/yr is conducive for mangroves to keep pace; However, rates above 1.2 mm/yr will cause
mangrove die off, given that sedimentation rates are low with no source of river input, as is the
situation in southeast Florida. Low-lying areas and islands are particularly vulnerable (Ellison &
Stoddart, 1991).
During rapidly rising sea level conditions, mangroves on the seaward side tend to
dieback from sea level effects, such as erosion and weakening of root structures and falling
trees, increased salinity and an excess in duration, frequency, and depth of inundation (Gilman
et al., 2008). Sedimentation and ecological processes are altered (Ellison & Stoddart, 1991).
The problem of rapidly rising sea levels on mangrove persistence is exacerbated through
mangrove tree death, which leads to the root decomposition and land subsidence on the seaward

19
end (Lodge, 2016). This effect is increased through burrowing organisms, which dig into the
soft decaying roots, such as burrowing shrimps (Lodge, 2016).
4.3.2 The use of remote sensing to study mangrove populations.
Remotely sensed imagery has been used in the past to analyze mangrove populations
to detect changes over time (Kirui et al., 2013; Li, Meng, Ge, & Zhang, 2015; Sulong, Mohd-
Lokman, Mohd-Tarmizi, & Ismail, 2002; Swetnam, Allen, & Betancourt, 1999; and many
others). Indeed, aerial photographs provide valuable historical data, illustrating vegetative
conditions, often spanning decades (Cohen, Behling, & Lara, 2005). Dahdouh-Guebas (2002)
described in detail the application of remote sensing and geographic information systems (GIS)
in retrospective as well as predictive studies on tropical coastal ecosystems, with an emphasis on
mangroves. This enables early detection of impending environmental degradation to allow for
appropriate mitigation measures to be taken (Cohen & Lara, 2003; Paine & Kiser, 2003).
Additionally, remote sensing is essential in monitoring and mapping highly threatened mangrove
ecosystems (Blasco, Aizpuru, & Gers, 2001; Kuenzer, Bluemel, Gebhardt, Quoc, & Dech,
2011). Remote sensing is the best option for long-term coastal vegetation monitoring, as opposed
to field surveys alone (Moffett et al., 2015). In order to test for multiple stable states in coastal
wetland systems, both spatially and temporally, extensive data at high resolution is required
(Moffett et al., 2015).
Through comparison with local-scale field measurements, Schuerch et al. (2018) and
Kirwan et al. (2016) concluded that most large-scale assessments overestimate the threat of sea
level rise to coastal wetlands. Most projections of coastal wetland vulnerability to the impending
sea level rise do not consider all essential factors, including geomorphological and socio-
economic (Schuerch et al., 2018). Schuerch et al. (2018) found that previous studies
overestimated the projected loss of mangroves regarding sea level rise. The results from the
study by Kirwan et al., (2016) found the vulnerability of marshes also being overestimated
through the failure to consider soil building processes and the potential for inland migration. It is
the rate of sea level rise compared to the vertical sediment accretion rate as well as the ability
for mangroves to migrate inland that determines success (Schuerch, et al. 2018). Taking the
above two factors into consideration is the shortcoming of many studies (Schuerch, et al. 2018)
and has been the main approach for over 30 years (Kirwan et al., 2016). These models are
limited by not accounting for sediment accretion and the space available for inland migration
20
(Kirwan et al., 2016; Spencer et al., 2016). Most modeling is “bathtub” style that uses a static
representation of the coast, without the landscape adjusting to sea level rise, leading to an
inevitable drowning of the wetland over time (Kirwan et al., 2016). The Sea Level Affecting
Marshes Model (SLAMM) is a more advanced model that accounts for the evolving landscape
based on historical elevation change, it however does not simulate the dynamic feedbacks that
allow wetlands to adapt to sea level rise with potential accelerated rates of sediment accretion or
inland migration opportunities, and leads to drastic overestimations of wetland loss (Kirwan et
al., 2016).
Schuerch et al., (2018) found that wetland area gains during sea level rise are possible
and probable in certain areas. Their results suggest that the availability of accommodating space
is the primary driving factor in determining wetland persistence during sea level rise. Coastal
infrastructure is the main barrier to landward migration (Kirwan & Megonigal, 2013; Kirwan et
al., 2016; Spencer et al., 2016). These human developments, such as buildings, roads, and
railways, are expected to change over this century due to rising sea level (Schuerch et al., 2018).
If wetland management plans are created to allow for this inland migration, large scale loss of
wetland area is avoidable (Schuerch et al., 2018; Kirwan et al., 2016). Suggested by the models
created by Schuerch, et al. (2018) and by Kirwan et al., (2016), the solution is to analyze the rate
of accretion compared to the rate of sea level rise and to create a nature-based management plan
to allow for accommodating space inland, possibly even lending to an increase in mangrove
area. The process of providing accommodating space is less studied and more research should
be done on this (Schuerch, et al. 2018). It is not only open space that is required, but also
favorable soil conditions, therefore local coastal management strategies and engineering will be
necessary (Schuerch, et al. 2018). The management solutions can include the displacement of
flood defenses and designation of upland nature reserve buffers (Schuerch, et al. 2018).
4.3.3 Coastal zone management plans to prepare for climate change.
Coastal zone management presently focuses on the balance between human
development, the natural communities, and protecting both against coastal hazards (Nicholls et
al., 2013). The goal of coastal zone management is to increase resilience to change and long-
term sustainability (Nicholls et al., 2013). When developing the management plan, it is useful to
analyze historical imagery to determine trends and patterns of wetland loss in an area (Nicholls
et al., 2013). The importance of stakeholder engagement through all processes is emphasized, as

21
well as the interconnectedness of all components (Nicholls et al., 2013). There are multiple
dimensions that come into play in terms of research, the level of management (local, regional,
national), and space and time (Nicholls et al., 2013).
Stakeholders in the management plan include businesses, industries, federal agencies,
academics, fisheries, nonprofits, and the public (Peyronnin et al., 2013). It is important to
consider businesses and residences that have been built in areas that would become future
coastline (Nicholls et al 2013; Peyronnin et al., 2013). Stakeholder engagement is often difficult
to put into practice (Nicholson-Cole & O’Riordan, 2009 as cited in Nicholls et al. 2013). The
public needs to be engaged and educated on erosion (Nicholls et al., 2013; Peyronnin et al.,
2013). Communities subject to erosion will need to be supported, possibly with government
buyout of property and relocation of residents (Nicholls et al., 2013). All stakeholders should be
considered and have the opportunity for involvement in the making of the management plan
(Nicholls et al., 2013; Peyronnin et al., 2013).
Due to the many variables at play, management plans are ever evolving and need to
include a regular monitoring program to adjust to the state of the changing environment
(Nicholls et al. 2013). The Louisiana 2012 Coastal Master Plan is dynamic and flexible (Figure
5) and updated every 5 years to allow for changing environmental and social systems and for
appropriate adjustments to be made when necessary (Peytonnin et al., 2013). It is essential to for
the management team to have detailed information about the coastline in current time, as well as
to know when changes occur, whether it be due to natural or human causes (Peytonnin et al.,
2013). The timing associated with different actions to implement will depend on the rate of
climate change and other unpredictable factors (Nicholls et al., 2013).

22
Figure 5: The interaction of input and feedback considered throughout the decision making
process for Louisiana’s Management Plan (Peytonnin et al., 2013).

23
5. Methodology
5.1 General Overview of Methods Used
A review of the literature indicates that an inventory of mangrove forest ecosystem for
Oleta has not been performed previously. Use of aerial photographs to analyze ecosystem
change is a frequently used technique (Kirui et al., 2013; Li, Meng, Ge, & Zhang, 2015; Sulong,
Mohd-Lokman, Mohd-Tarmizi, & Ismail, 2002; Swetnam, Allen, & Betancourt, 1999; and
many others). In this study, determination of changes in ecosystems was accomplished using 1)
analysis of aerial photographs, 2) ground truthing, and 3) interviews with Oleta personnel. Some
of the changes were documented losses related to development, others were gains related to
mitigation. Present-day conditions were accessed to determine if rising seas poses a threat to the
mangrove forest.
Historic imagery data was outlined to calculate mangrove coverage for available aerial
imagery from 1961 to present. In person field surveys of the study site allowed for ground-
truthing areas of mangrove cover, identifying Australian pine invasions and locating other
mangrove stressors. An interview of an Oleta Naturalist provided further insight on the
condition of the mangrove habitat and sea level rise concerns. The results from these analyses
were used here to construct an integrate strategy for conserving mangrove habitats at the Oleta,
with implications for managing forests throughout the region.
5.2 Mapping of Mangrove Extent Through Time
The change in mangrove area at Oleta was analyzed through a land cover analysis of
aerial photographs from 1961 through present day using ArcGIS. The historic aerial photographs
were acquired from the US Geological Survey (USGS) Center for Earth Resources Observation
and Science (EROS) Aerial Photos Single Frame collection (www.glovis.usgs.gov);
orthoimagery was acquired from USGS EROS Digital Orthophoto Quadrangle collection
(https://earthexplorer.usgs.gov/). Maps of the Oleta field area were created in ESRI’s ArcMap.
Archival photographs from the Earth Explorer’s Single Frame were imported into the maps and
rectified into a WGS 1984 coordinate system. Feature class polygons were created for the
mangrove habitat for each time frame and compared to determine change in area over time. Two
polygon types were created: full mangrove cover (>50%) and partial mangrove cover (<50%)
(Figure 6). An area field was added to the polygon shapefile’s attributes table (type: long

24
integer; precision: 9). Calculate geometry was performed on this area field to produce area
values in meters squared. This was converted into kilometers squared for graphic purposes.
The multiple polygon outline area values for each time frame were entered into an Excel
spreadsheet to sum the total cover for the respective year, then converted into kilometers
squared. The data calculated included: full cover, partial cover, total cover and percent loss
compared to the oldest image from 1961. Values for area at each time were tabulated and
graphed. This produced a table and two line-graph figures. Some areas were hard to distinguish
between mangrove trees and other foliage. Areas with unclear foliage were marked in a point
shapefile as “areas of interest” to visit in person for verification (Figure 7).

25
Figure 6: A graphic representation of the method of area calculation within ArcGIS.

26
Figure 7: Tree species which were hard to distinguish in the aerial imagery were marked
as “areas of interest” to visit in person.

27
5.3 Determination of Mangrove Change Cause
To determine total change in mangrove forest area since 1961, ArcMap was used to
create polygons using both 1961 and 2017 aerial imagery. These were toggled on and off to
create polygons outlining the remaining mangrove area seen today, the areas which have been
lost due to development, Australian pine, and change in shoreline.
Within ArcMap, the 2017 image layer along with the 1961 mangrove area layer were
used to create polygons outlining areas with development, dredging and Australian pine which
were previously mangrove area. The 1961 mangrove area polygon overlaid on top of the 2017
aerial imagery allowed for the polygon illustrating change in shoreline to be created.
To visualize the extent of change in shoreline since 1961, another map was created. This
was created by using ArcMap with the 1961 historic shoreline over top of the present-day
background.
5.4 Ground Truthing
To verify identification of mangrove and other tree species, as well as to assess the
health of the stands, assessible areas of the field area were groundtruthed. Not all areas of Oleta
are accessible due to thick undergrowth and waterlogged soils, but the fringe of the forests were
visited and used for verification of species, maturity, and forest health. Georeferenced
photographs of living and dead mangroves were collected, as well as representative Australian
pines and other invasive species, for comparison with imagery and for tree height calculations.
Georeferenced photographs were imported to create point shapefiles to incorporate into
ArcMap. Geotagged photos appear on the map as points in the georeferenced location where the
photograph taken. These were viewed in ArcMap using the “html popup” tool (Figure 8). A new
feature class was created and brought into the map for each kind of observation: white
mangrove, black mangrove, red mangrove, seedlings, Australian pine, drowned tree, fallen tree,
and tree height measurements (Figure 9).
28
Figure 8: The photos map with a geotagged photograph displayed.

29
Figure 9: The geotagged photos map with the point icons indicating different tree species.
Tree heights are useful indicators of the maturity of tree stands. Both mangrove and
Australian pine height measurements were taken. Tree height estimates were made using the app
“Dioptra” (Figure 10) to acquire the angle to the top of a tree, and distance from the camera to
the tree calculated using measuring tape. The distance from the tree, angle to the top of the tree,
and the height of the photographer was used to calculate tree height using the sine method
(Bragg, Frelich, Leverett, Blozan, & Luthringer, 2011):
tan(𝑎𝑛𝑔𝑙𝑒) ∗ 𝑑𝑖𝑠𝑡𝑎𝑛𝑐𝑒(𝑚) + ℎ𝑒𝑖𝑔ℎ𝑡 𝑜𝑓 𝑝ℎ𝑜𝑡𝑜𝑔𝑟𝑎𝑝ℎ𝑒𝑟(𝑚) = 𝑡𝑟𝑒𝑒 ℎ𝑒𝑖𝑔ℎ𝑡
Tree heights were represented within ArcMap by creating a height icon within a point
shapefile which was placed next to the photograph point where the tree heights were measured.
This was represented in a figure by adding a text field in Layout view with the tree species and
calculated height.

30
Figure 10: Photograph using Dioptera App to get the tan angle.
5.5 Interview with the Oleta Naturalist
The Oleta Park Naturalist, Jacob M. Bennett was interviewed on June 10th, 2017
(personal communication). Information inquired included 1) his knowledge on flooding in
Oleta, 2) what mangrove stressors were known, and 3) mangrove restoration projects. This
interview was recorded to accurately summarize in the results.

31
6. Results
6.1 General
Mangrove cover was calculated using ArcGIS using archival aerial imagery for the years
1961, 1969, 1972, 1979, 1986 and 2017. Total mangrove cover has fluctuated over this time, but
ultimately resulted in a 42%, 3 km2 total loss. The width at a location along the Oleta River was
calculated, using the measurement tool within ArcMap, to be an increase in 32 m between 1961
and 2017. The area is under stress, including extensive development, Australian pine forest
encroachment, and mangrove die off.
6.2 Mapping of Mangrove Extent Through Time
For each image year, full cover and partial cover were calculated (Figures 11-16). Full
cover is defined as being greater than 50% cover and partial cover is defined as being less than
50% cover. Total mangrove area is the sum of the partial and full mangrove cover in kilometers
squared. The change in cover compared to previous year was calculated by subtracting the
previous year’s total with the current year’s total. The percent change compared to 1961
mangrove cover was calculated as the percent change in area between the current year and the
area in 1961. The area calculations in ArcGIS provides detail to the 5th decimal place since an
area could only be accurately determined to the nearest tenth of a square kilometer.

32
Table 1: Data collected from polygon analysis.
Year Full
Mangrove
Cover
(Km2)
Partial
Mangrove
Cover
(Km2)
Total
Mangrove
Area (Km2)
Change in
cover
compared to
previous year
(Km2)
% Change
Compared to
1961
Mangrove
Cover
2017 3.6 0.6 4.2 -1.9 -42%
1986 4.0 2.1 6.1 1.5 -15%
1979 4.0 0.6 4.6 -0.7 -35%
1972 4.5 0.8 5.3 1.7 -26%
1969 3.4 0.3 3.7 -3.5 -49%
1961 6.9 0.3 7.2 null 0%

33
Figure 11: Mangrove cover from 1961. Full mangrove cover is 6.9 km2, partial mangrove cover
is 0.3 km2, and total mangrove area is 7.2 km2.

34
Figure 12: Mangrove cover from 1969. Full mangrove cover is 3.4 km2, partial mangrove cover
is 0.3 km2, and total mangrove area is 3.7 km2.

35
Figure 13: Mangrove cover from 1972. Full mangrove cover is 4.5 km2, partial mangrove cover
is 0.8 km2, and total mangrove area is 5.3 km2.

36
Figure 14: Mangrove cover from 1979. Full mangrove cover is 4.0 km2, partial mangrove cover
is 0.6 km2, and total mangrove area is 4.6 km2.

37
Figure 15: Mangrove cover from 1986. Full mangrove cover is 4.0 km2, partial mangrove cover
is 2.1 km2, and total mangrove area is 6.1 km2.

38
Figure 16: Mangrove cover from 2017. Full mangrove cover is 3.6 km2, partial mangrove cover
is 0.6 km2, and total mangrove area is 4.2 km2.

39
The total mangrove area at Oleta has fluctuated over the past 50 years (Figure 17). In
1961, at the time of the earliest available aerial imagery, total mangrove area was 7.2 km2. The
total area decreased in 1969, totaling 3.7 km2. The mangroves began to recover again,
repopulating previously cleared areas, in 1972, totaling 5.3 km2. In 1979, the mangrove
population decreased to a total area of 4.6 km2. The total mangrove area increased again in 1986
to 6.1 km2. The total mangrove area decreased again with a total of 4.2 km2 in 2017.
Figure 17: The change in total mangrove area from multiple year intervals between 1961 and
2017, shown in km2.
0.0
1.0
2.0
3.0
4.0
5.0
6.0
7.0
8.0
1950 1960 1970 1980 1990 2000 2010 2020
Total Mangrove Area at Oleta Over Time (km2)
40
The trends of full and partial change in mangrove cover between the analyzed aerial
imagery time intervals is illustrated in Figure 18, with exact area values in Table 1. Full
mangrove cover is represented by mangrove areas with 50% or more cover; partial mangrove
cover is represented by less than 50% mangrove cover. Between 1961 and 1969, full mangrove
cover decreased from 6.9 km2 to 3.4 km2, while partial cover remained the same, 0.3 km2. From
1969 to 1972 both full and partial mangrove cover increased, from 3.4 km2 to 4.5 km2; and 0.3
km2 to 0.8 km2, respectively. Between 1972 and 1979 there was a decrease in full mangrove
cover, 4.5 km2 to 4.0 km2, and partial mangrove cover, 0.8 km2 to 0.6 km2. From 1979 to 1986,
full mangrove cover remained 4.0 km2, with an increase in partial mangrove cover, 0.6 km2 to
2.1 km2. Both total mangrove cover and partial mangrove cover decreased between 1986 and
2017: 4.0 km2 to 3.6 km2, and 2.1 km2 to 0.6 km2, respectively.
Figure 18: The change in full vs. partial mangrove cover for the indicated years.
0
1
2
3
4
5
6
7
8
1950 1960 1970 1980 1990 2000 2010 2020
Mangrove Cover Change (km2)
Full Mangrove Cover (km2) Partial Mangrove Cover (Km2)

41
6.3 Determination of the Change in Mangrove Area Compared To 1961
The coastline of mangroves at Oleta between 1961 and present-day were compared in
Figure 19. The present-day aerial imagery has the outline from the 1961 polygon displayed on
top to visualize the change in shoreline. There is a clear widening of the Oleta River visible. A
polygon image was created to illustrate the mangrove area remaining and the area lost, and due
to what cause (Figure 20). Table 2 shows the areas analyzed in km2. Figure 21 displays the
current area percentages in a pie chart. The remaining mangrove area from the 1961 mangrove
forest is 4.4 km2, or 56% of the original cover. Dredging during the Interama project accounted
for a loss of 0.4 km2, or 6%. Development has caused the greatest loss of 1.9 km2, accounting
for 25% of the original forest cover. The Australian pine invasion is significant, nearly 1
kilometer squared (0.9 km2), accounting for the loss of 11% of the original mangrove habitat.
The shoreline has clearly receded, resulting in a loss of 0.2 km2 or 2% of the original habitat.

42
Figure 19: The widening of the Oleta River illustrated by the 1961 mangrove area outline
displayed upon aerial imagery from 2017.

43
Figure 20: The present-day alteration of the 1961 mangrove forest, represented by polygons
depicting the cause of the mangrove loss.

44
Table 2: Area of remaining mangrove and cause of loss compared to 1961.
Development Dredging Australian
pine
Shoreline
Loss
Remaining
Mangrove
Area
(km2)
1.9 0.4 0.8 0.2 4.4
Figure 21: The coverage of remaining mangrove area since 1961, along with the areas lost.
25%
6%
11%
2%
56%
PERCENTAGE OF AREA FROM 1961 TO 2017
Development Dredging Australian Pine
Shoreline Loss Remaining Mangrove

45
6.4 Field Study
6.4.1 Species analysis.
Figure 22a and 22b show the results of the analysis of the photographs taken at the field.
There are many areas with prevalent invasive Australian pine trees along the fringes of
mangrove forest. In some areas, they have formed their own forest, devoid of other species
(Figure 23). In addition, the invasive species beach naupaka was also present or identified in the
western extent of Oleta. All three species of mangrove were present: red mangrove, black
mangrove and white mangrove. There was erosion seen at the southernmost extent of the park,
subject to high wave energy. A methane seep was also found.

46
.
Figure 22a: Photograph embedded map with points depicting the ground truthing.

47
Figure 22b: Photograph embedded map with points depicting the ground truthing.

48
Figure 23: Shows the beginning of Australian Pine encroachment into a Mangrove Forest (1986
on Left; Present Day on Right).

49
6.4.2 Tree height measurements.
Six tree height measurements were taken (Table 3). The mangroves surveyed at Oleta
are around 6-8 meters tall, indicating a mature stand comparable to the mangrove forest in
Everglades National Park (Simard et al., 2006). The Australian pine trees surveyed had much
taller trees, reaching 27.7 meters tall, this indicates the Australian pine stand is mature (Xie,
Roberts, & Johnson, 2008) and prevalent at Oleta.
Table 3: Various tree height measurements taken at Oleta.
Tree Species Calculated Tree Height (m)
Black Mangrove 6.9
Black Mangrove 8.5
Red Mangrove 8.7
Australian Pine 27.7
Australian Pine 10.0
Australian Pine 23.6

50
Figure 24: Tree height measurement results.

51
6.4.3 Interview with the Oleta Naturalist.
The following information was acquired during an interview with Jacob Bennett, the
Oleta Park Naturalist, on local concerns regarding the mangroves. Bennett noted that it is
possible the park is already experiencing negative effects from rising sea levels; this area is
extremely flood prone. All the canals, certain roads within the park, the ranger station parking
lot and the entire beach will flood during the highest tides of the year, called King Tides.
There is an area of mangroves which have largely died off, referred to as the “dead zone”
by Bennett. This patch of mangroves originally had a drainage canal which would allow the tidal
influx to come in to supply the mangroves with saltwater, it has since been impacted. With
freshwater influx from rain and decreased nutrient input from the clogged canal, the mangroves
perished. Bennett estimated this dead zone at less than 1 hectare. Some smaller mangroves on
the outskirts of that pond and a few sporadic larger ones are still living mangroves, but
according the naturalist, over 99% of the mangroves in that area have died. Oleta management,
working with DERM’s Josh Mahoney, a different environmental agency through the county,
was applying for grants in efforts to set up a couple hundred thousand dollar project to fund a
new canal and prefabricated bridge to allow the tidal influx back to that area.
It is difficult locating areas for planting new mangroves, seedlings are washed away with
high tides. Most of the mangrove saplings planted by local elementary and middle schools have
been washed away during times of flooding according to Bennett, although some survive.
Bennett recommends this be taken into consideration when proposing management solutions.
There are multiple sources of negative anthropogenic effects. A sewage treatment facility
near Oleta has leaked twice, resulting in a temporary Oleta shut down. Illegal cutting of
mangroves has been observed with fishermen seeking better access to the river. Enforcement is
difficult because the authorities are often unable to find the culprits.
6.4.4 Stressed mangrove evaluation
Fallen or dead trees found in the field survey were photographed and marked in the
geotagged map (Figure 25). An entire section of dead mangroves, referred to at Oleta as the
“dead zone”, is due to anthropogenic stress. There was a large drainpipe which would allow sea
water influx to this zone that became clogged. With the influx of sea water from tides cut off,
over time freshwater input from rainfall decreased the salinity of this area as well as nutrient

52
input, potentially causing the death of mangroves in that location.
Figure 25: Fallen or dead trees seen in the field study.
53
7. Discussion
7.1 Mangrove Extent Through Time
The mangrove population at Oleta has suffered a significant loss of 3 km2, amounting to
42% total area loss since 1961, largely due to human development. Oleta mangrove accretion
rates are low with a poor influx of sediments due to the low-lying coastal nature with
anthropogenically altered historic river outputs. The historical imagery analysis shows a
significant loss in mangrove habitat over the last 60 years. The image analysis also indicates a
clear receding of the shoreline over time, the Oleta river was estimated to have widened by 32
meters. According to the relative sea level tide data from the NOAA station in Key West,
Florida, sea level has risen by 0.243 m between 1961 and 2017. Loss could be due to the
increasing sea level and associated increase in erosion, supporting the hypothesis that rising sea
level is a vulnerability to the mangrove habitat at Oleta.
The mangrove forest at Oleta had an area of 7.2 km2 in 1961 before the Interama project,
which reduced the mangrove area 49% by 1969. This project caused the entire total loss of 3.5
km2, resulting in a mangrove forest total area of just 3.7 km2 . While the project was never
completed, it left wide canals, an open water lagoon and elevated uplands.
Over the next three years, from 1969 to 1972, mangroves regrew by 1.7 km2, resulting in
a total mangrove area of 5.3 km2. This is likely due to the failure of the Interama project, as the
majority of the regrowth, at least 75%, is from areas within the Interama area.
Throughout the majority of the 1970s, from 1972 to 1979, mangrove area again
decreased by 0.7 km2, with a total mangrove area of 4.6 km2. Measurements of the aerial
imagery show a loss in mangrove area of 0.3 km2 due to the development of a wastewater
treatment facility towards the northwest extent of Oleta. The loss due to the Munisport Landfill
development on the central west extent of Oleta totaled 0.7 km2. The loss due to both
developments, 1.0 km2 is greater than the total loss because the loss was offset by 0.3 km2 gain
in the central east section of Oleta.
There was an increase in mangrove area from 1979 to 1986 of 1.5 km2, resulting in a total
mangrove area of 6.1 km2. There was no change in full mangrove cover, the increase is from
partial mangrove area increase alone. This is seen in the imagery as land previously cleared was
recolonized by mangroves in the southwest extent of Oleta, being less than 50% so recorded as
partial mangrove cover. Mangrove stands on the west side of the park also increased in area.

54
Mangrove area has been again decreasing since 1986: with a loss of 1.9 km2 in area from
1986 to 2017 and a total mangrove area of 4.2 km2. This is due to increased development with
Sole Mia, located to the west of the Munisport Landfill, accounting for 0.9 km2 of the loss,
development within the Florida International University East Campus, accounting for a loss of
0.5 km2 and extensive Australian pine growth seen in the imagery, which encroached on 0.5 km2
of previously colonized mangroves. A restoration project in 2007 helped to mitigate the
Australian pine damage by removing the invasive species and planting mangroves in an area
estimated 0.07 km2 (Miami-Dade County Division of Environmental Resources Management,
2007).
The imagery analysis clearly illustrates widening of the Oleta River, along with an
estimated 32 km increase in river width since 1961, supports the hypothesis that sea level rise is
a vulnerability of Oleta.
This study is limited by the availability of only specific images in time. Some images are
very close in years while there are large gaps between others. Additionally, it is impossible to
ground truth the past, only make inferences based on the present condition and species
composition.
7.2 Field Study
The field study analysis was to assess the current health and maturity of the mangrove
population at Oleta to gain further insight into its management needs, as well as to ground-truth
the work done in the historical imagery analysis. Areas which appeared to be Australian pine in
the aerial photographs were confirmed with this field study. Field studies are limited by only
being able to analyze accessible areas.
All three Florida mangrove species are present within Oleta. The mangrove forests are
well developed with mature mangrove trees averaging 6-9 meters in height. The mangrove
habitat at Oleta is under stress from invasive species, as many Australian pines were found. The
Australian pine sightings included new younger Australian Pine growth, along with areas of
well-developed Australian pine forests with very large trees reaching 28 meters. Younger
Australian pine trees were sighted near the fringes of mangroves, indicating the beginning of
new encroachment on the mangrove habitat. It is not a surprise Australian pine trees are
proliferating; the success of Australian pine in saline soils and windy areas has been
55
documented (Bezona et al., 2009). The well-developed areas of Australian pine trees had
outcompeted all other foliage by creating their own forests in the upland areas of Oleta.
Most of the mangrove trees appear to be healthy. Fallen and dead trees noted in the field
study were recorded with their location marked via a geotagged photograph. A problem with a
clogged drainage pipe resulted in the death of an entire section of mangroves. Dead mangrove
trees were sighted in other areas of the park as well. People coming to fish have been known to
cut down mangrove trees illegally in this area. Boat wake has also caused erosion. The
mangroves are subjected to pollution from a nearby sewage treatment facility leakages. Flooding
is an issue at Oleta with many roadways, parking lots and the public beach becoming flooded
during king tides. Mangrove restoration at Oleta is difficult as most of the saplings end up being
washed away.
Development has decreased the 1961 mangrove forest by 25%, 31% if you include
dredging of the canals. Australian pine growth has invaded 11% of the mangrove forest, totaling
0.9 km2. The shoreline has clearly receded, accounting for a loss of 0.2 km2, or 2% of the habitat
since 1961. The sea level is rising at a rate faster than mangroves can keep pace, and without
sufficient sediment input in this region, the mangroves will not be able to keep up with this
impending change. The various stress factors found in the field study supports the vulnerability
of the mangroves at Oleta to impending sea level rise because any stress decreases a habitats
resilience to change. This supports the hypothesis: since this mangrove habitat appears to be
vulnerable to climate change induced sea level rise, management plans regarding resilience to
sea level rise are necessary.
56
8. Conclusions
8.1 Data Analysis Conclusion
If it is true that the mangrove habitat at Oleta is vulnerable to sea level rise, then a
management plan regarding the resilience to impending sea level rise should be created. Despite
the intervals of mangrove growth, the area lost since 1961 amounts to 42%, or 3 km2 through
environmental degradation by human infrastructure as well as widening of the rivers by,
potentially, rising seas. The review of historic imagery and field surveys discovered that the
mangrove habitat at Oleta is threatened by many stressors, including climate change induced sea
level rise.
Mangroves are known to only be able to keep pace with a sea level rate of less than 1.2
mm/yr, given there is enough sediment input (Ellison and Stoddart, 1991). The local rate of sea
level over the past 89 years was 2.92 mm/yr (NOAA station at Virginia Key). Since the current
rate of sea level rise is 3.6 mm/yr and projected to increase (IPCC, 2019), and the sediment input
is not sufficient (Schuerch et al., 2018), with no space for inland migration, the mangrove forest
at Oleta is threatened by sea level rise. Its resilience is decreased due to various stressors
including invasive species, pollution, habitat degradation, and erosion. The mangrove population
at Oleta is threatened by sea level rise because the ability to build soil vertically is low and the
space for inland migration is non-existent. The best, and arguably only, solution would be to
provide for inland migration of Oleta’s mangrove forest through the repurposing of developed
areas. Development will need to be altered into natural areas to allow for managed retreat. This
would be most beneficial in areas which are projected to become flooded in the near future.
However, efforts should be made to first focus on converting Australian pine habitat into
greenspace for inland migration of mangroves. Converting the adjacent buildings and roadways
into greenspace will be a large project needed further into the future. Removing the invasive
Australian pines for future mangrove habitat is more pressing and should be addressed first.
An analysis over time is valuable and would be useful to other studies as well. The
current condition and history of an area provides data in predictive studies and would be used by
others in the construction of a management plan. The methods presented here are a usable
strategy in creating management plans for mangrove ecosystems. When establishing what is
happening in the parks now through GIS, it is useful to have recorded information that explains
57
what happened in that location over time. A GIS database could be an effective part of a
management plan.
8.2 Management Plan Suggestion
The Oleta mangrove habitat is very important to the City of North Miami (DEP, 2008). It
is within the Florida Statues that the objective of the Division of Recreation and Parks to
“conserve these natural values for all time… in such a manner as to enable the people of Florida
and visitors to enjoy these values without depleting them… to provide for the perpetual
preservation of historic sites.” (DEP 2018). In contrast, within the Unit Management Plan, and in
the strategy recommendations by the City of Miami’s Economic Development Manager, place a
greater emphasis on the recreation potential rather than the preservation of natural resources
(Blatt, 2018; DEP, 2008).
Mangrove forests are important ecosystems that provide many benefits to the
environment as well as to humans. Mangroves preserve the wetland habitat and protect the
coastline and coastal human populations (Schuerch, et al. 2018). Mangroves provide increased
biodiversity, a habitat for many organisms, resources used by humans, increased water quality, a
buffer from wave action and carbon sequestration (Ewel et al. 1998, Mumby et al. 2004,
Nagelkerken et al. 2008, Walters et al. 2008, Kristensen et al. 2008). Wetlands, once degraded,
are difficult to restore as suggested by high rates of failure in coastal wetland restorations
(Palmer, 2008; Hughes & Paramor, 2004; Williams & Orr, 2002; Williams & Faber, 2001; all as
cited in Moffett et al., 2015). Therefore, this mangrove population needs to be considered in a
carefully executed coastal zone management plan.
Oleta management’s current goals align with the restoration and conservation of their
mangrove communities (DEP, 2008). The park management is interested in surveys on the local
vegetation to note changes which are occurring. Mangroves are mentioned frequently; their
persistence and restoration are of great importance to the ecosystem and park management.
However, there is not a plan for landward migration in place.
Coastal Zone Management Plans have been successful in providing sustainability for
mangrove populations in the past (Schuerch, et al., 2018). Suggestions for the management of
this area to help conserve the mangrove population at Oleta were given upon review of this data.
There are many factors to consider when developing a coastal zone management plan including
58
stakeholders, environmental integrity, human populations, uncertainties, adaptability, and
economics (Nicolls et al., 2013). Developing a management plan requires multiple parties to
form committees, have meetings, educate the public, agree upon goals and the decision-making
process for when analyzing various project proposals (Nicolls et al., 2013; Peyronnin et al.,
2013).
The elimination of stress not directly related to climate change will help assist in
increasing the health, and therefore the resilience, of this population. Stress such as high boating
activity, invasive species (particularly the Australian pine invasion), and pollution need to be
addressed. The Friends’ of Oleta River State Park host cleanups, invasive species removal, and
dune planting (https://friendsofoletariverstatepark.org/). Their efforts should be supplemented
through projects developed within a comprehensive park management plan.
A plan for the mangrove ecosystem’s persistence through sea level rise needs to be
added to the current Oleta management plan. Measures in the plan for mangrove resilience will
need to be implemented and modified as needed to best support this habitat during sea level rise.
Combining historic knowledge of how the mangrove population has changed within Oleta
through field assessments to determine the current state of the coastal area along with land use
data will provide valuable information critical to the conservation and preservation of these
mangroves and the ecosystem they support.
It is important to conduct studies which predict the response of local mangrove
communities under different sea level and climate change scenarios. Local monitoring of the
mangrove communities' response and landward migration is needed due to the uncertainties
associated with climate change and the rate of sea level rise. Developments and roadways will
need to be abandoned to provide inland space, as sea level would floods these areas regardless.
The process of providing accommodating space is less studied and more research should be
done on this (Schuerch, et al. 2018). As with any other important environmental issue, the public
should be educated. The public needs to be informed about the importance of mangroves (for the
environment as well as ecosystem services) to reduce damage done on mangroves by people,
encourage the public to contact policymakers in regards of protecting and enhancing local
mangroves, and to hopefully persuade people to take steps in reducing their carbon footprint in
efforts to mitigate future climate change.

59
It would be a useful future project to use the classification tool in ArcGIS to reclassify
the various tree areas using the automated program. This would allow for a more accurate land
cover analysis eliminating risk of human error. Another idea for future research would be to
analyze the rate of the Australian pine invasion and shoreline loss to determine how quickly
these stressors are making an impact. Additionally, there is a useful software called
Visual_HEA: Habitat Equivalency Analysis which can calculate the value associated with
natural resource damage (Kohler & Dodge, 2006). This program could be applied to Oleta to
determine the amount of habitat restoration required for the loss of habitat which has already
occurred.
The City of North Miami should develop a management plan in a similar manner to the
one developed by the state of Louisiana for their coastal environment. This plan would need to
include the participation of all stakeholders relative to Oleta and needs to be a public involved
process. Goals should include a plan for inland migration, invasive species management and
pollution management.

60
9. Works Cited
Alongi, D. M. (2008). Mangrove forests: resilience, protection from tsunamis, and responses to
global climate change. Estuarine, Coastal and Shelf Science, 76(1), 1-13.
Alongi, D. M. (2015). The impact of climate change on mangrove forests. Current Climate
Change Reports, 1(1), 30-39.
Bezona, N., Hensley, D., Yogi, J., Tavares, J., Rauch, F., Iwata, R., . . . Clifford, P. (2009). Salt
and Wind Tolerance of Landscape Plants for Hawai'i.
Blasco, F., Aizpuru, M., & Gers, C. (2001). Depletion of the mangroves of Continental Asia.
Wetlands Ecology and Management, 9(3), 255-266.
Blatt, S. (2018). Strengthening North Miami's Ties to Oleta River State Park.
Bragg, D. C., Frelich, L. E., Leverett, R. T., Blozan, W., & Luthringer, D. J. (2011). The sine
method: An alternative height measurement technique. Research Note SRS-RN-22.
Asheville, NC: USDA-Forest Service, Southern Research Station. 12 p., 22, 1-12.
Cahoon, D. R., Hensel, P. F., Spencer, T., Reed, D. J., McKee, K. L., & Saintilan, N. (2006).
Coastal wetland vulnerability to relative sea-level rise: wetland elevation trends and
process controls. In Wetlands and natural resource management (pp. 271-292):
Springer.
Cohen, M. C. L., Behling, H., & Lara, R. J. (2005). Amazonian mangrove dynamics during the
last millennium: The relative sea-level and the Little Ice Age. Review of Palaeobotany
and Palynology, 136(1-2), 93-108. doi:10.1016/j.revpalbo.2005.05.002
Cohen, M. C. L., & Lara, R. J. (2003). Temporal changes of mangrove vegetation boundaries in
Amazonia: application of GIS and remote sensing techniques. Wetlands Ecology and
Management, 11(4), 223-231.
Cutshaw, S. A. (2017). Economic Impact Assessment - Florida State Park System. Retrieved
from
https://floridadep.gov/sites/default/files/Economic%20Impact%20Assessment%202016-
2017.pdf
Dahdouh-Guebas, F. (2002). The use of remote sensing and GIS in the sustainable management
of tropical coastal ecosystems. Environment, Development and Sustainability, 4(2), 93-
112.
Division of Recreation and Parks. (2008). Oleta River State Park Unit Management Plan. State
of Florida Department of Environmental Protection Division of Recreation and Parks
61
Donato, D. C., Kauffman, J. B., Murdiyarso, D., Kurnianto, S., Stidham, M., & Kanninen, M.
(2011). Mangroves among the most carbon-rich forests in the tropics. Nature geoscience,
4(5), 293.
Doyle, T. W., Krauss, K. W., Conner, W. H., & From, A. S. (2010). Predicting the retreat and
migration of tidal forests along the northern Gulf of Mexico under sea-level rise. Forest
Ecology and Management, 259(4), 770-777.
Ellison, J. C., & Stoddart, D. R. (1991). Mangrove Ecosystem Collapse during Predicted Sea-
Level Rise: Holocene Analogues and Implications. Journal of Coastal Research, 7(1),
151-165. doi:10.2307/4297812
Engelhart, S. E., Horton, B. P., Roberts, D. H., Bryant, C. L., & Corbett, D. R. (2007).
Mangrove pollen of Indonesia and its suitability as a sea-level indicator. Marine
Geology, 242(1-3), 65-81.
Ewel, K., Twilley, R., & Ong, J. (1998). Different kinds of mangrove forests provide different
goods and services. Global Ecology & Biogeography Letters, 7(1), 83-94.
Gilman, E., Ellison, J., & Coleman, R. (2007). Assessment of mangrove response to projected
relative sea-level rise and recent historical reconstruction of shoreline position.
Environmental Monitoring and Assessment, 124(1-3), 105-130.
Gilman, E., Ellison, J., Duke, N. C., & Field, C. (2008). Threats to mangroves from climate
change and adaptation options: a review. Aquatic Botany, 89(2), 237-250.
Godoy, M. D. P., & De Lacerda, L. D. (2015). Mangroves Response to Climate Change: A
Review of Recent Findings on Mangrove Extension and Distribution. Anais da
Academia Brasileira de Ciências, 87, 651-667. Retrieved from
http://www.scielo.br/scielo.php?script=sci_arttext&pid=S0001-
37652015000200651&nrm=iso
Harlem, P. (1979). Aerial photographic interpretation of the historical changes in northern
Biscayne Bay, Florida: 1925 to 1976. Sea Grant Tech. Bull(40), 151.
IPCC, W. (2013). IPCC, 2013: summary for policymakers. Climate change.
Kirui, K. B., Kairo, J. G., Bosire, J., Viergever, K. M., Rudra, S., Huxham, M., & Briers, R. A.
(2013). Mapping of mangrove forest land cover change along the Kenya coastline using
Landsat imagery. Ocean & Coastal Management, 83, 19-24.
doi:http://dx.doi.org/10.1016/j.ocecoaman.2011.12.004
Kirwan, M. L., & Megonigal, J. P. (2013). Tidal wetland stability in the face of human impacts
and sea-level rise. Nature, 504(7478), 53-60.
Kirwan, M. L., Temmerman, S., Skeehan, E. E., Guntenspergen, G. R., & Fagherazzi, S. (2016).
Overestimation of marsh vulnerability to sea level rise. Nature Climate Change, 6(3),
253.

62
Kohler, K. E., & Dodge, R. E. (2006). Visual_HEA: Habitat Equivalency Analysis Software to
Calculate Compensatory Restoration Following Natural Resource Injury Marine &
Environmental Sciences Faculty Proceedings, Presentations, Speeches, Lectures. 37.
. Retrieved from https://nsuworks.nova.edu/occ_facpresentations/37
Kristensen, E., Bouillon, S., Dittmar, T., & Marchand, C. (2008). Organic carbon dynamics in
mangrove ecosystems: A review. Aquatic Botany, 89(2), 201-219.
doi:http://dx.doi.org/10.1016/j.aquabot.2007.12.005
Kuenzer, C., Bluemel, A., Gebhardt, S., Quoc, T. V., & Dech, S. (2011). Remote sensing of
mangrove ecosystems: A review. Remote Sensing, 3(5), 878-928.
Lejeune, J.-F. (2010). Interame: Miami and the Pan-American Dream. South Florida History.
Retrieved from
https://web.archive.org/web/20100612183743/http://www.hmsf.org/exhibits/interama/int
erama.pdf
Li, S., Meng, X., Ge, Z., & Zhang, L. (2015). Evaluation of the threat from sea-level rise to the
mangrove ecosystems in Tieshangang Bay, southern China. Ocean & Coastal
Management, 109, 1-8.
Lodge, T. E. (2016). The Everglades handbook: understanding the ecosystem: Crc Press.
Lovelock, C., Bennion, V., Grinham, A., & Cahoon, D. (2011). The Role of Surface and
Subsurface Processes in Keeping Pace with Sea Level Rise in Intertidal Wetlands of
Moreton Bay, Queensland, Australia. Ecosystems, 14(5), 745-757. doi:10.1007/s10021-
011-9443-9
Marsh, G. A., & Bane, L. L. (1995). Life Along The Mangrove Shore: A Guide To Common
Estuarine Plants And Animals Of Southern Florida. Hobe Sound, Florida: Florida
Classics Library.
McKee, K. L., Cahoon, D. R., & Feller, I. C. (2007). Caribbean mangroves adjust to rising sea
level through biotic controls on change in soil elevation. Global Ecology and
Biogeography, 16(5), 545-556. doi:10.1111/j.1466-8238.2007.00317.x
Miami-Dade County Division of Environmental Resources Management. (2007). Preserving
our Natural Resource Resilience [PowerPoint Slides]. Retrieved from
https://www.miamidade.gov/planning/library/presentations/2014-03-07-preserving-our-
natural-resilience.pdf
Moffett, K., Nardin, W., Silvestri, S., Wang, C., & Temmerman, S. (2015). Multiple Stable
States and Catastrophic Shifts in Coastal Wetlands: Progress, Challenges, and
Opportunities in Validating Theory Using Remote Sensing and Other Methods. Remote
Sensing, 7(8), 10184-10226. doi:10.3390/rs70810184

63
Mumby, P. J., Edwards, A. J., Ernesto Arias-Gonzalez, J., Lindeman, K. C., Blackwell, P. G.,
Gall, A., . . . C. Llewellyn, G. (2004). Mangroves enhance the biomass of coral reef fish
communities in the Caribbean. Nature, 427, 533+. Retrieved from
https://www.nature.com/articles/nature02286
Nagelkerken, I., Blaber, S. J. M., Bouillon, S., Green, P., Haywood, M., Kirton, L. G., . . .
Somerfield, P. J. (2008). The habitat function of mangroves for terrestrial and marine
fauna: A review. Aquatic Botany, 89(2), 155-185.
doi:http://dx.doi.org/10.1016/j.aquabot.2007.12.007
Natural Storage Areas. (n.d.). Retrieved from https://www.northmiamifl.gov/313/Natural-
Storage-Areas
Nicholls, R., Townend, I., Bradbury, A., Ramsbottom, D., & Day, S. (2013). Planning for long-
term coastal change: experiences from England and Wales. Ocean Engineering, 71, 3-
16.
Noble, C. V., Drew, R. W., & Slabaugh, J. D. (1996). Soil survey of Dade county area, Florida:
The Service.
Pachauri, R. K., Allen, M. R., Barros, V. R., Broome, J., Cramer, W., Christ, R., . . . Dasgupta,
P. (2014). Climate change 2014: synthesis report. Contribution of Working Groups I, II
and III to the fifth assessment report of the Intergovernmental Panel on Climate Change:
Ipcc.
Paine, D., & Kiser, J. (2003). Aerial photography and image interpretation. In: John Wiley and
Sons, Inc., Hoboken, New Jersey, USA.
Parkinson, R. W., DeLaune, R. D., & White, J. R. (1994). Holocene sea-level rise and the fate of
mangrove forests within the wider Caribbean region. Journal of Coastal Research, 1077-
1086.
Peyronnin, N., Green, M., Richards, C. P., Owens, A., Reed, D., Chamberlain, J., . . . Belhadjali,
K. (2013). Louisiana's 2012 coastal master plan: overview of a science-based and
publicly informed decision-making process. Journal of Coastal Research, 67(sp1), 1-15.
Polidoro, B. A., Carpenter, K. E., Collins, L., Duke, N. C., Ellison, A. M., Ellison, J. C., . . .
Yong, J. W. H. (2010). The Loss of Species: Mangrove Extinction Risk and Geographic
Areas of Global Concern. PLoS ONE, 5(4), e10095. doi:10.1371/journal.pone.0010095
Schuerch, M., Spencer, T., Temmerman, S., Kirwan, M. L., Wolff, C., Lincke, D., . . . Vafeidis,
A. T. (2018). Future response of global coastal wetlands to sea-level rise. Nature,
561(7722), 231.
Simard, M., Zhang, K., Rivera-Monroy, V. H., Ross, M. S., Ruiz, P. L., Castañeda-Moya, E., . .
. Rodriguez, E. (2006). Mapping Height and Biomass of Mangrove Forests in Everglades
National Park with SRTM Elevation Data. Photogrammetric Engineering & Remote
Sensing, 72(3), 299-311. doi:10.14358/PERS.72.3.299

64
Spencer, T., Schuerch, M., Nicholls, R. J., Hinkel, J., Lincke, D., Vafeidis, A., . . . Brown, S.
(2016). Global coastal wetland change under sea-level rise and related stresses: The
DIVA Wetland Change Model. Global and Planetary Change, 139, 15-30.
Sulong, I., Mohd-Lokman, H., Mohd-Tarmizi, K., & Ismail, A. (2002). Mangrove mapping
using Landsat imagery and aerial photographs: Kemaman District, Terengganu,
Malaysia. Environment, Development and Sustainability, 4(2), 135-152.
Swetnam, T. W., Allen, C. D., & Betancourt, J. L. (1999). Applied historical ecology: using the
past to manage for the future. Ecological Applications, 9(4), 1189-1206.
Teas, H. J., Wanless, H. R., & Chardon, R. E. (1976). Effects of man on the shore vegetation of
Biscayne Bay: University of Miami Sea Grant Program.
The Ramsar Convention Secretariat. (2001). Wetland values and functions: climate change
mitigation. Gland, Switzerland Retrieved from
https://www.ramsar.org/sites/default/files/documents/tmp/pdf/info/values_climate_e.pdf
Traill, L. W., Perhans, K., Lovelock, C. E., Prohaska, A., McFallan, S., Rhodes, J. R., & Wilson,
K. A. (2011). Managing for change: wetland transitions under sea-level rise and
outcomes for threatened species. Diversity and Distributions, 17(6), 1225-1233.
doi:10.1111/j.1472-4642.2011.00807.x
Walters, B. B., Rönnbäck, P., Kovacs, J. M., Crona, B., Hussain, S. A., Badola, R., . . .
Dahdouh-Guebas, F. (2008). Ethnobiology, socio-economics and management of
mangrove forests: A review. Aquatic Botany, 89(2), 220-236.
doi:http://dx.doi.org/10.1016/j.aquabot.2008.02.009
Xie, Z., Roberts, C., & Johnson, B. (2008). Object-based target search using remotely sensed
data: A case study in detecting invasive exotic Australian Pine in south Florida. ISPRS
Journal of Photogrammetry and Remote Sensing, 63(6), 647-660.