Sea Level Rise Adaptation Strategy - City of Imperial …6283CA4C-E2BD-4DFA-A7F7... · Sea Level...
133
Sea Level Rise Adaptation Strategy for San Diego Bay January 2012 Prepared by ICLEI Local Governments for Sustainability for the project’s Public Agency Steering Committee, with the support of The San Diego Foundation.
Transcript of Sea Level Rise Adaptation Strategy - City of Imperial …6283CA4C-E2BD-4DFA-A7F7... · Sea Level...

Sea Level RiseAdaptation Strategy
forSan Diego Bay
January 2012
Prepared by ICLEI Local Governments for Sustainability for the project’s Public AgencySteering Committee, with the support of The San Diego Foundation.

PROJECT PARTNERS
ICLEI Local Governments for Sustainability USA
ICLEI Local Governments for Sustainability USA (ICLEI) is a membershipassociation of more than 500 local governments in the United Statescommitted to advancing climate protection and sustainability. By providingtechnical assistance, innovative tools and other resources, and training andnetworking opportunities, ICLEI strives to empower local governments toset and achieve their emissions reduction and sustainability goals. Formore information, visit www.icleiusa.org.
The San Diego Foundation
With a dynamic mix of leadership, grantmaking, and civic engagement, TheSan Diego Foundation makes the San Diego region a better place to live.The San Diego Foundation launched its Climate Initiative in 2006, a multiyear effort to bring government, business, the research community, andnonprofits together to tackle one of the greatest challenges of our time.For more information, visit rgwww.sdfoundation.o .
Tijuana River National Estuarine Research Reserve –
Coastal Training Program
The Coastal Training Program (CTP) is part of the National Oceanographicand Atmospheric Administration’s (NOAA) National Estuarine ResearchReserve System (NERRS) and provides training and technical assistance toindividuals who are responsible for making decisions that affect coastalresources. At the Tijuana River NERR, CTP works to improve decisionmaking at local and regional levels by equipping coastal decision makerswith science based information and tools they need to address coastalresource management issues in the San Diego and Baja California regions.

TABLE OF CONTENTS
Credits and Acknowledgements.......................................................................................................i
Executive Summary.........................................................................................................................iii
1. Project Description..................................................................................................................... 11.1 Project Participants and Rationale ...................................................................................... 11.2 Guiding Principles ................................................................................................................ 31.3 Planning Process.................................................................................................................. 41.4 Planning Area Description ................................................................................................... 5
2. Vulnerability Assessment Overview.......................................................................................... 82.1 Sea Level Rise Science and Planning Scenarios ................................................................... 82.2 Sea Level Rise Impacts....................................................................................................... 102.3 Assessment Methodology ................................................................................................. 182.4 Summary of Findings ......................................................................................................... 20
3. Comprehensive Strategies ...................................................................................................... 22
4. Sector Vulnerabilities and Targeted Strategies ...................................................................... 27Ecosystems and Critical Species........................................................................................ 28Contaminated Sites........................................................................................................... 34Stormwater Management ................................................................................................ 36Wastewater ...................................................................................................................... 38Potable Water................................................................................................................... 40Energy Facilities ................................................................................................................ 42Local Transportation Facilities.......................................................................................... 44Building Stock ................................................................................................................... 46Emergency Response Facilities ......................................................................................... 49Parks, Recreation and Public Access................................................................................. 50Regional Airport Operations ............................................................................................. 52Vulnerable Populations..................................................................................................... 54
5. Management Practices Toolbox ............................................................................................. 56
6. Conclusion and Next Steps ..................................................................................................... 69
Appendix I. Survey Questionnaire .................................................................................................IAppendix II. Flooding and Inundation Exposure Maps .............................................................. XVIAppendix III. Targeted Strategy Evaluation Matrices .................................................................XLII
LIST OF FIGURES
1.1 Five Milestones of Adaptation 2
2.1 Observed Sea Level in San Diego 8
2.2 Historic and Projected Global Sea Level 9
2.3 Daily Conditions – Inundation in 2050 12
2.4 Extreme Event – Flooding in 2050 13
2.5 Daily Conditions – Inundation in 2100 14
2.6 Extreme Event – Flooding in 2100 15
2.7 Current Extreme Events FEMA Designated Flood Zones 16
2.8 Rising Water Tables 17
2.9 Components of Vulnerability 19
4.1 Sweetwater Marsh 28
4.2 Eelgrass Habitat 30
4.3 Flooded Storm Drain Outfall 36
4.4 Construction in Pipe Trenches, Coronado 40
4.5 Hotel in Downtown San Diego 46
4.6 Shoreline Path, Coronado 50
4.7 West End of Runway, San Diego International Airport 52
LIST OF TABLES
2.1 Primary Vulnerabilities by Sector 20
3.1 Exposure of Significant Local Roads 45

CREDITS AND ACKNOWLEDGEMENTS
The authors and members of the Public Agency Steering Committee extend their sincere appreciation toeveryone who volunteered their time—totaling over 1,500 hours—to contribute to this project.
We extend special thanks to Kristen Goodrich at Tijuana River National Estuarine Research Reserve –Coastal Training Program. Without Ms. Goodrich’s support and insight into stakeholder engagement andcoastal resource management, this project truly would not have been possible.
We also gratefully acknowledge Leslie Ryan, Chair of the Landscape Architecture Department at NewSchool of Architecture and Design, New School Instructor Megan Willis, and Ms. Ryan’s team of studentsSteven Schroeder, Jason Offineer, and Thomas Ross. This team dedicated many thoughtful hours towardsthe development of workshop presentations and Section 5 – Management Practices Toolbox.
Many of the photographs in this document are provided by volunteers with the San Diego King Tide PhotoInitiative. The project provided a platform for documenting shoreline conditions during the highest tides of2010 and 2011, through a partnership between Tijuana River National Estuarine Research Reserve, SanDiego Coastkeeper, and Surfrider San Diego Chapter. More information can be found athttp://www.flickr.com/groups/sandiegokingtides/.All photos are licensed through Creative Commons.
Cover, top: Kristen GoodrichCover, 2nd: Port of San DiegoCover, 3rd: Flickr, User: Jeff KubinaCover, bottom: Lisa A. CoxFigure 4.1: Lisa A. CoxFigure 4.2: Wikimedia Commons, User : TewyFigure 4.3: Kristen GoodrichFigure 4.4: San Diego CoastkeeperFigure 4.5: Kristen GoodrichFigure 4.6: San Diego CoastkeeperFigure 4.7: Kristen Goodrich
The Strategy was prepared by Daniella Hirschfeld, Program Officer, and Brian Holland, Director of ClimatePrograms, with ICLEI Local Governments for Sustainability USA.
Financial support for the project was provided by The San Diego Foundation through its Climate Initiative.Many thanks go to Dr. Emily Young, Senior Director of Environmental Analysis and Strategy, and NicolaHedge, Climate Initiative Program Manager, for their leadership and support in efforts to build a moreresilient and sustainable San Diego region.
i

ii
Steering Committee
Brendan Reed, City of Chula Vista, Co-Chair Michelle White, San Diego Unified Port District, Co-Chair Marisa Lundstedt, City of Chula Vista Scott Huth, City of Coronado Jim Nakagawa, City of Imperial Beach Raymond Pe, City of National City Nancy Bragado, City of San Diego Linda Pratt, City of San Diego
Dr. Emily Young, The San Diego FoundationNicola Hedge, The San Diego FoundationJames Hirsch, San Diego Unified Port District Cody Hooven, San Diego Unified Port District Paul Manasjan, San Diego County Regional Airport Authority Ted Anasis, San Diego County Regional Airport Authority
Stakeholder Working Group
Diana Lilly, California Coastal Commission Sherilyn Sarb, California Coastal Commission Darren Smith, California State Parks Abe Doherty, California Ocean Protection CouncilFranco Garcia, Environmental Health Coalition Laura Hunter, Environmental Health Coalition Ed Curtis, FEMA, Region IX Raymond Lenaburg, FEMA, Region IX Sharon Cloward, Port Tenants Association Lee Wilson, Port Tenants Association Andrew Martin, SANDAG Ron Saenz, SANDAG Jen Kovecses, San Diego Coastkeeper
Bridget Johnson, San Diego Convention and Visitors Bureau Claudia Valenzuela, San Diego Gas & Electric Carl Nettleton, San Diego Regional Chamber of CommerceBruce Coons, Save Our Heritage Organization Mike McCoy, Southwest Wetlands Interpretive AssociationChandra Krout, Urban Land Institute Kurt Roblek, US Fish and Wildlife Service Bruce Shafer, US Navy, Naval Base Coronado Terrance Smalls, US Navy, Naval Base Coronado Peter Kennedy, US Navy, Navy Region Southwest Katie Westfall, WiLDCOAST
Technical Advisory Committee
Tom Jones, BDS Engineering Ross Kunishige, BDS Engineering Robert Becera, California American Water Chris Mattis, California American Water Tom Adler, City of Chula Vista Rachel Hurst, City of Coronado Guy Nelson, City of Imperial Beach Peter Lau, City of Imperial Beach Charles Nissley, City of National City Luis Sainz, City of National City Gwann Huang, City of San Diego Afshin Oskoui, City of San Diego Cheryl Lester, City of San Diego Gene Matter, City of San Diego James Naglevoort, City of San Diego Mark Nasser, City of San Diego Tibor Varga, City of San Diego
Steven Messner, Environ Laura Moran, Environ Leslie Ryan, New School of Architecture Becky Lunde, NOAA Coastal Services Center Bryan Clementson, San Diego Gas and Electric Mike Klingbeil, San Diego Gas and Electric Dr. Rick Gersberg, San Diego State University Dr. Dan Cayan, Scripps Institute of Oceanography, UC San Diego Dr. Reinhardt Flick, Scripps Institute of Oceanography, UC San Diego Carole Farr, Stantec Hector Martinez, Sweetwater Authority Dr. Jeff Crooks, Tijuana River NERR Wes Danskin, United States Geological Survey Dr. Bart Chadwick, US Navy, Space and Naval Systems Warfare Command (SPAWAR)

iii
EXECUTIVE SUMMARY
The San Diego region is a center of economic activity, diversity, and culture in Southern California. Theregion has long been known for its remarkable landscape, biological diversity, economic prowess, andprestigious academic institutions, and many have acclaimed it as one of the nation’s most livablecommunities. While the region’s growth and status as an economic center is projected to continue for theforeseeable future, real threats to this status are posed by the impacts of climate change. Among theseexpected climate change impacts, perhaps none poses a greater risk than sea level rise. This century,elevation of average high tide could change by as much as 1.5 meters, or approximately five feet.
San Diego is a region defined by its relationship with the coast and heavily invested in its coastalcommunities. San Diego Bay, in particular, is a treasured asset, the anchor of the regions’ tourism andmilitary economies. With so much at stake, it is critical to begin considering policy responses long beforethe worst impacts associated with sea level rise are projected to occur, because developing andimplementing solutions will require unprecedented collaboration with long lead times, and becauseinfrastructure is being built now that will be vulnerable to impacts in the future. To begin, a Public AgencySteering Committee comprised of staff from the five bayfront cities, the San Diego Unified Port District, andthe San Diego County Regional Airport Authority came together to develop this Sea Level Rise AdaptationStrategy for San Diego Bay (Adaptation Strategy). The Adaptation Strategy consists of two primarycomponents: a Vulnerability Assessment that evaluates how community assets could be impacted by sealevel rise, and Recommendations for building the resilience of those community assets.
The Adaptation Strategy was prepared by ICLEILocal Governments for Sustainability through acollaborative, regional stakeholder process thatincluded most of the public agencies and privatesector representatives with a major interest inthe future of San Diego Bay. Over the course ofmultiple workshops, stakeholders and technicaladvisors developed common assumptions andconsensus based recommendations that shouldform the basis of the region’s climate adaptationplanning going forward. The Adaptation Strategyis a living document that can be implemented bylocal agencies and re evaluated as newinformation becomes available in the comingyears.
Sea Level Rise Scenarios and Impacts
Greenhouse gas emissions from human activities are trapping heat within the Earth’s atmosphere, leadingto a well documented warming trend in average global temperatures. As the Earth warms, oceans undergothermal expansion and sea levels rise; over the past century, sea level in San Diego has risen by just underone inch per decade on average. The scientific community expects the rate of sea level rise to increase as

iv
higher concentrations of emissions lead to faster warming and the melting of glaciers into the ocean. Risingseas can lead to widespread flooding and erosion in low lying areas, as well as impacts such as shiftinghabitats and rising water tables.
While these concepts are widely agreed upon, there remains significant uncertainty around the timing andseverity of sea level rise, particularly in the latter half of the century. The State of California the use ofprojections of between 10 and 17 inches (26 to 43 cm) in 2050 and of 31 to 69 inches (78 to 176 cm) in2100.1 The Adaptation Strategy project utilized sea level rise assumptions on the upper end of this range toensure a risk averse approach to planning.
Vulnerability Assessment Findings
The Vulnerability Assessmentevaluates where and when sealevel rise impacts may occur, aswell as the extent to whichexposed community assetswould be impaired by an impactand whether they may be ableto cope or adapt on their own.The assessment was conductedthrough a combination ofmodeling, mapping, andintensive consultation with theproject’s Technical Advisorycommittee. Key findings of theVulnerability Assessmentinclude:
In the next few decades, the greatest cause for concern will be an increase in the kind offlooding that the region already experiences due to waves, storm surge, El Nino events,and very high tides. When planning for this period, an emphasis should be placed onpreparing for more common and more severe extreme events.
Starting around mid century, the Bay may become more vulnerable to regularlyoccurring inundation of certain locations and assets, some of which are being plannedand built today. As a result, this longer term risk of inundation should be aconsideration in today’s decision making.
The most vulnerable sectors in the community include stormwater management,wastewater collection, shoreline parks and public access, transportation facilities,commercial buildings, and ecosystems.
1 State of California, Sea Level Rise Task Force of the Coastal and Ocean Working Group of the California Climate Action Team
(CO-CAT), Sea Level Rise Interim Guidance Document. October 2010.

v
Primary Vulnerabilities by SectorEcosystems and Critical Species
Bay ecosystems, which provide habitat for many endangered and threatened species, are extremelyvulnerable to inundation that is expected to result in habitat shift. These shifts could cause the loss ofirreplaceable habitats for critical species in many areas.
Upland areas are vulnerable to erosion, and subtidal ecosystems are threatened by erosion of uplandareas when it results in degraded water quality.
Contaminated Sites
Hazardous waste sites are highly vulnerable to flooding and inundation as storage tanks in the areacould be opened or moved, or motors and pumps could be impaired thus releasing contamination intoflood waters or area soils.
Stormwater Management
In all scenarios, storm sewers are highly vulnerable to flooding and inundation in the Bay due tohigher sea levels, a condition that would result in localized flooding in very low lying inland areas.
Wastewater
Sanitary sewers in low lying locations will be vulnerable to floodwater inflow which could exceed theircapacity, potentially resulting in discharge of wastewater to the Bay.The entire wastewater collection system in the planning area will be vulnerable to inundation impacts.
Potable Water
Above ground water distribution components such as valves, meters, and service points will bevulnerable to flooding and inundation.
Energy Facilities
Above ground electricity transmission and distribution in limited areas will be vulnerable to erosion,particularly after 2050 and during major storm events. Erosion could undermine infrastructure,causing outages or safety issues.
Above ground electricity transmission and distribution will be moderately vulnerable to flooding andinundation, particularly in the 2100 timeframe when more components are likely to be exposed toregularly occurring flood events.
Local Transportation Facilities
Access provided by local transportation facilities will be vulnerable to flooding and inundation,particularly in the 2100 timeframe when more components are likely to be exposed to regularlyoccurring inundation.
Roads and other facilities could also be vulnerable to flooding and inundation due to saturated soilsand impacts on road substructure and pavement degradation.

vi
Building Stock
Residential buildings have a low vulnerability to flooding in the 2050 scenario due to limited exposure.They are highly vulnerable to flooding and inundation in the 2100 scenarios as exposure expands tolarge portions of residential neighborhoods and major commercial facilities.
Emergency Response Facilities
Fire stations in San Diego and Coronado are moderately vulnerable to flooding in the 2100 ExtremeEvent scenario.
Parks, Recreation, and Public Access
Shoreline parks and recreational facilities are extremely vulnerable to regular inundation due toextensive exposure around the Bay and high sensitivity to inundation impacts.The system is highly vulnerable to flooding because of extensive exposure and high sensitivity, butadaptive capacity to cope with flooding is higher than for most other systems.
Regional Airport Operations
Parts of the Airport site will be vulnerable to localized flooding from blocked storm outfalls in the Bay.In the 2100 scenarios, Airport operations will be extremely vulnerable to Bay flooding and inundation,particularly from impacts on access roads, future terminal areas, and portions of the runway/airfield.
Vulnerable Populations
Many groups that are currently vulnerable – such as low income residents, the homeless, elderly, andethnic minorities – will face even greater threats from future flooding, particularly in the 2100timeframe.
Residents that work in sectors that could be adversely impacted by future flooding are also a keyvulnerability for the region.
Adaptation Strategies
As described above, the region faces a multitude of threats from a rising Bay. While it is critical that theregion play its part in reducing the global greenhouse gas emissions that cause sea level rise, it must also berecognized that the seas are already rising and this trend is expected to intensify. Preparing for thesechanges through climate adaptation is necessary to fulfill the public obligation to protect public safety,health, and quality of life. Participants in this project identified the following ten “comprehensivestrategies,” designed to address multiple impacts, sectors, assets, and timeframes. In addition to thesecomprehensive strategies, a set of “targeted strategies” were developed to address the specificvulnerabilities of each community sector; these targeted strategies are described in the main body of theAdaptation Strategy.

vii
Comprehensive Strategies
1. Create a staff level regional sea level rise (SLR) adaptation working group consisting of representativesfrom public agencies around San Diego Bay to implement the Adaptation Strategy.
2. Provide regular opportunities for stakeholder engagement around implementation of the AdaptationStrategy.
3. Create and enhance existing outreach, education, training, and peer exchange programs tailored topublic agency staff, stakeholders, and the general public.
4. Establish and promote a regional research agenda to advance understanding of sea level rise impacts,vulnerabilities, and adaptation responses in the San Diego region.
5. Engage regulatory agencies to advocate for clear and consistent regulatory guidance on how to addresssea level rise impacts in development permitting.
6. Engage the Federal Emergency Management Agency (FEMA) to encourage the incorporation of futurerisks from sea level rise into non regulatory maps associated with upcoming Flood Insurance Studies(FIS).
7. Institutionalize or mainstream sea level rise adaptation by incorporating sea level rise and associatedimpacts into relevant local and regional plans and projects.
8. Consistently utilize guidance provided by the State of California Climate Action Team in developing sealevel rise assumptions for planning purposes.
9. Perform more detailed vulnerability assessments at a site specific level as significant plans or capitalprojects are undertaken.
10. Develop decision making frameworks in each jurisdiction for selecting and implementing appropriatemanagement practices in communities vulnerable to inundation or regular flooding, utilizing suchframeworks as risk management and cost/benefit analysis.
Next Steps
Many of the recommendations in this Strategy are intended for consideration and implementation in eachof the participating local jurisdictions in their own planning processes, such as Climate Mitigation andAdaptation Plans in the City of San Diego and Port of San Diego, and in bayfront planning in Chula Vista. Akey next step will be to communicate these recommendations to local officials and stakeholders foradoption in local plans. Regional coordination in building resilience to sea level rise will continue to becritical, and the Public Agency Steering Committee will continue to meet to begin implementing theAdaptation Strategy, with support from ICLEI and The San Diego Foundation, in 2012.

1
1. PROJECT DESCRIPTION
The San Diego region is a center of economic activity, diversity, and culture in Southern California. Theregion has long been known for its remarkable landscape, biological diversity, economic prowess, andprestigious academic institutions, and many have acclaimed it as one of the nation’s most livablecommunities. While the region’s growth and status as an economic center is projected to continue for theforeseeable future, real threats to this status are posed by the impacts of climate change to the social,economic, and environmental well being of the San Diego region. Among these expected climate changeimpacts, perhaps none poses a greater risk than sea level rise. By 2100, elevation of the mean high waterline could change by as much as 1.5 meters, or approximately five feet.
San Diego is a region defined by its relationship with the coast and heavily invested in its coastalcommunities. With so much at stake, many jurisdictions are beginning to evaluate and manage risks fromsea level rise and other climate impacts through a planning process known as climate adaptation planning.These communities recognize that it is critical to begin considering policy responses long before the worstimpacts associated with sea level rise are projected to occur, because developing and implementingsolutions will require unprecedented collaboration with long lead times, and because infrastructure isbeing built now that will be vulnerable to impacts in the future.
It is in that spirit that a Public Agency Steering Committee comprised of staff from the five bayfront cities,the San Diego Unified Port District, and the San Diego County Regional Airport Authority came together todevelop this Sea Level Rise Adaptation Strategy for San Diego Bay (Adaptation Strategy).
1.1 Project Participants and Rationale
The Adaptation Strategy is intended to provide participating Steering Committee jurisdictions with policyrecommendations that will aide in making bay front communities more resilient to sea level rise and itsassociated impacts, such as coastal flooding, erosion, and ecosystem shifts. The Steering Committeeconsists of staff from:
City of Chula VistaCity of CoronadoCity of Imperial BeachCity of National CityCity of San DiegoPort of San DiegoSan Diego County Airport Authority
The planning effort complements several related initiatives in the region. The City of Chula Vista recentlyadopted one of the first stand alone climate adaptation plans in the nation. Both the City of San Diego andthe Port of San Diego are developing adaptation policies in their climate action plans, targeted for adoptionin 2012, and the City of National City also recently adopted a climate action plan.
2
Significant research is being performed by The San Diego Foundation and researchers from University ofCalifornia San Diego, Scripps Institution of Oceanography, and San Diego State University around climatechange projections and sea level rise scenarios for the greater San Diego Bay area. This multi jurisdictionalAdaptation Strategy draws upon and informs these local efforts. Because the Port of San Diego isdeveloping its own Climate Mitigation and Adaptation Plan, the Strategy does not address specific facilitiesor sites managed by the Port, but rather focuses on issues requiring inter jurisdictional collaboration or thatare explicitly under the jurisdiction of Steering Committee cities or the Airport Authority.
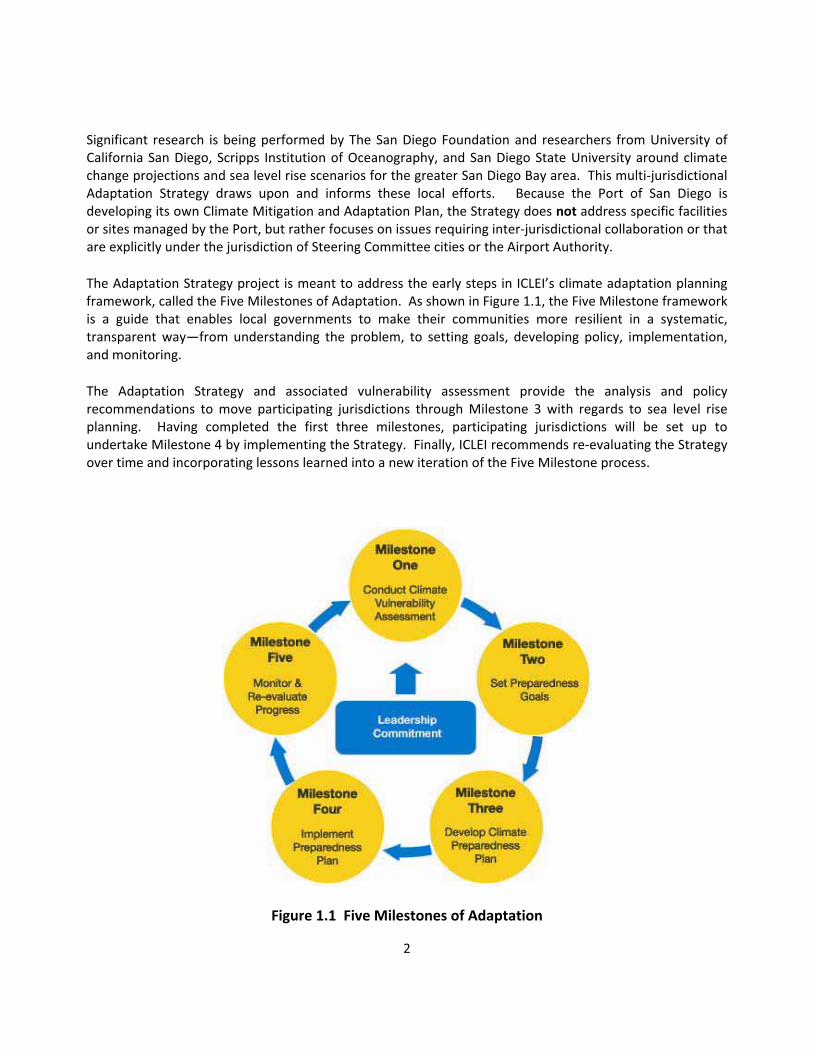
The Adaptation Strategy project is meant to address the early steps in ICLEI’s climate adaptation planningframework, called the Five Milestones of Adaptation. As shown in Figure 1.1, the Five Milestone frameworkis a guide that enables local governments to make their communities more resilient in a systematic,transparent way—from understanding the problem, to setting goals, developing policy, implementation,and monitoring.
The Adaptation Strategy and associated vulnerability assessment provide the analysis and policyrecommendations to move participating jurisdictions through Milestone 3 with regards to sea level riseplanning. Having completed the first three milestones, participating jurisdictions will be set up toundertake Milestone 4 by implementing the Strategy. Finally, ICLEI recommends re evaluating the Strategyover time and incorporating lessons learned into a new iteration of the Five Milestone process.
Figure 1.1 Five Milestones of Adaptation

3
1.2 Guiding Principles
Early in the planning process, the Steering Committee and stakeholders came to consensus around thefollowing principles for guiding the San Diego Bay initiative, many of which are adapted from the 2009California Climate Adaptation Strategy to align the region with the State’s approach.
1) The San Diego region must begin now to adapt to the impacts of climate change. We can no longeract as if nothing is changing.
2) Use the best available science in identifying climate change risks and adaptation strategies.
3) Understand that data continues to be collected and that knowledge about climate change is stillevolving. As such, an effective adaptation strategy is “living” and will itself be adapted to accountfor new science.
4) Involve all relevant stakeholders in identifying, reviewing, and refining the adaptation strategy, andin ensuring that emissions reduction is also prioritized in local efforts.
5) Establish and retain strong partnerships with federal, state, and local governments, tribes, privatebusiness and landowners, and non governmental organizations to develop and implementadaptation strategy recommendations over time.
6) Utilize a precautionary approach to minimize risk borne by local communities.
In addition to these overarching principles, a set of principles were also established to guide thedevelopment of the Strategy’s recommendations:
7) When possible, give priority to adaptation strategies that modify and enhance existing policiesrather than solutions that require new funding and new staffing.
8) Understand the need for adaptation policies that are effective and flexible enough forcircumstances that may not yet be fully predictable.
9) Ensure that climate change adaptation strategies are coordinated with local, state, national andinternational efforts to reduce GHG emissions.
10) Give priority to adaptation strategies that initiate, foster, and enhance existing efforts that improveeconomic and social well being, public safety and security, public health, environmental justice,species and habitat protection, and ecological function.
11) The San Diego region must protect public health and safety and critical infrastructure.
4
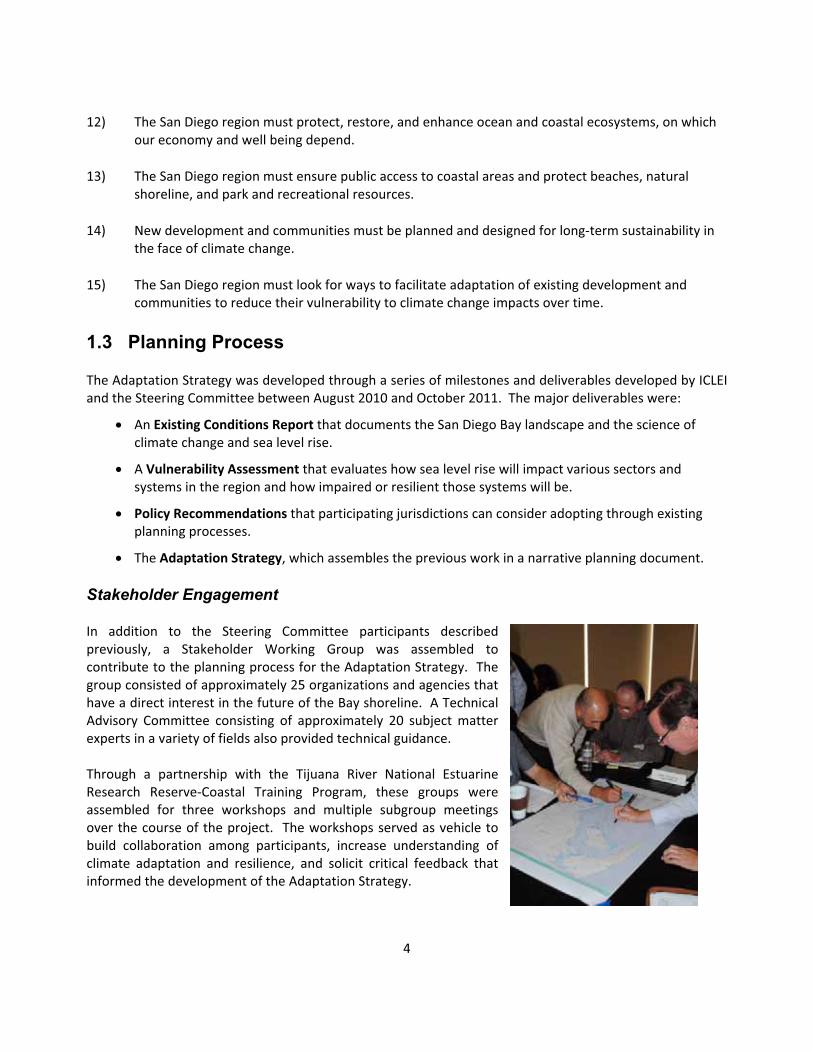
.3 Planning Process
The Adaptation Strategy was developed through a series of milestones and deliverables developed by ICLEI
aluates how sea level rise will impact various sectors and
ing through existing
egy, which assembles the previous work in a narrative planning document.
Stakeholder Engagement
In addition to the Steering Committee participants describedao
hrough a partnership with the Tijuana River National Estuarine
12) The San Diego region must protect, restore, and enhance ocean and coastal ecosystems, on whichour economy and well being depend.
13) The San Diego region must ensure public access to coastal areas and protect beaches, naturalshoreline, and park and recreational resources.
14) New development and communities must be planned and designed for long term sustainability inthe face of climate change.
15) The San Diego region must look for ways to facilitate adaptation of existing development andcommunities to reduce their vulnerability to climate change impacts over time.
1
and the Steering Committee between August 2010 and October 2011. The major deliverables were:
An Existing Conditions Report that documents the San Diego Bay landscape and the science ofclimate change and sea level rise.
A Vulnerability Assessment that evsystems in the region and how impaired or resilient those systems will be.
Policy Recommendations that participating jurisdictions can consider adoptplanning processes.
The Adaptation Strat
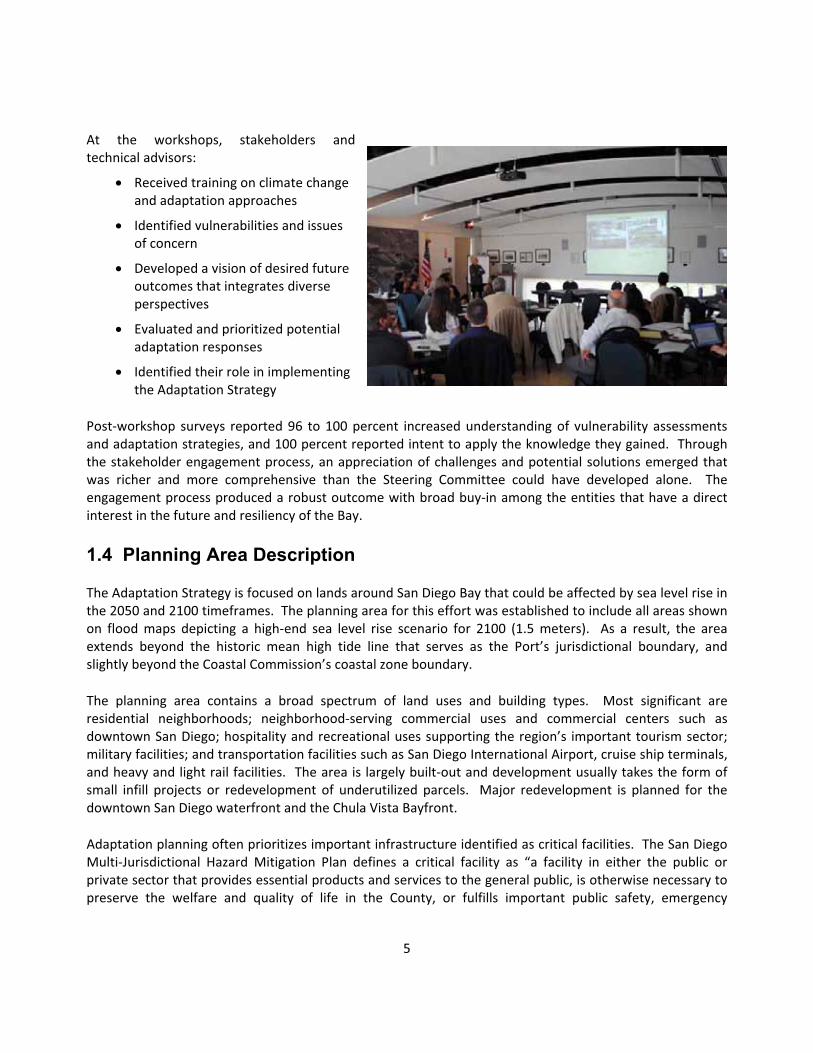
previously, Stakeholder Working Group was assembled tocontribute t the planning process for the Adaptation Strategy. Thegroup consisted of approximately 25 organizations and agencies thathave a direct interest in the future of the Bay shoreline. A TechnicalAdvisory Committee consisting of approximately 20 subject matterexperts in a variety of fields also provided technical guidance.
TResearch Reserve Coastal Training Program, these groups wereassembled for three workshops and multiple subgroup meetingsover the course of the project. The workshops served as vehicle tobuild collaboration among participants, increase understanding ofclimate adaptation and resilience, and solicit critical feedback thatinformed the development of the Adaptation Strategy.
5
At the workshops, stakeholders anda
aining on climate change
issues
vision of desired future
prioritized potential
implementing
Post workshop surveys reported 96 to 100 percent increased understanding of vulnerability assessments
1.4 Planning Area Description
ound San Diego Bay that could be affected by sea level rise inthe 2050 and 2100 timeframes. The planning area for this effort was established to include all areas shown
building types. Most significant areresidential neighborhoods; neighborhood serving commercial uses and commercial centers such as
entified as critical facilities. The San DiegoMulti Jurisdictional Hazard Mitigation Plan defines a critical facility as “a facility in either the public or
technical dvisors:
Received trand adaptation approaches
Identified vulnerabilities andof concern
Developed aoutcomes that integrates diverseperspectives
Evaluated andadaptation responses
Identified their role inthe Adaptation Strategy
and adaptation strategies, and 100 percent reported intent to apply the knowledge they gained. Throughthe stakeholder engagement process, an appreciation of challenges and potential solutions emerged thatwas richer and more comprehensive than the Steering Committee could have developed alone. Theengagement process produced a robust outcome with broad buy in among the entities that have a directinterest in the future and resiliency of the Bay.
The Adaptation Strategy is focused on lands ar
on flood maps depicting a high end sea level rise scenario for 2100 (1.5 meters). As a result, the areaextends beyond the historic mean high tide line that serves as the Port’s jurisdictional boundary, andslightly beyond the Coastal Commission’s coastal zone boundary.
The planning area contains a broad spectrum of land uses and
downtown San Diego; hospitality and recreational uses supporting the region’s important tourism sector;military facilities; and transportation facilities such as San Diego International Airport, cruise ship terminals,and heavy and light rail facilities. The area is largely built out and development usually takes the form ofsmall infill projects or redevelopment of underutilized parcels. Major redevelopment is planned for thedowntown San Diego waterfront and the Chula Vista Bayfront.
Adaptation planning often prioritizes important infrastructure id
private sector that provides essential products and services to the general public, is otherwise necessary topreserve the welfare and quality of life in the County, or fulfills important public safety, emergency

6
Despite being mostly developed, the area also includes a number of important habitat areas, including
Jurisdictional Authority and Boundaries
Multiple local, regional, state, and federal agencies are responsible for managing the San Diego Bay coastal
San Diego Unified Port District. The San Diego Unified Port District is a public benefit corporation
Cities. Five cities border San Diego Bay: San Diego, National City, Chula Vista, Imperial Beach, and
San Diego County Regional Airport Authority. The San Diego County Regional Airport Authority has
California Coastal Commission. Under the California Coastal Act of 1976 (Coastal Act), the California
U.S. Navy. San Diego Bay is home to a large naval fleet and multiple facilities related to research, training,
U.S. Fish and Wildlife Service. The Fish and Wildlife Service manages San Diego Bay National WildlifeRefuge, which includes Sweetwater Marsh, the Salt Ponds, and part of the Otay River floodplain. Most of
response, and/or disaster recovery functions.” Critical facilities in the planning area include water,wastewater, and energy utilities, transportation facilities, and emergency response facilities.
Sweetwater Marsh, the Salt Ponds, Silver Strand, and eelgrass beds. Many of the habitat areas in South Bayare protected in the San Diego Bay National Wildlife Refuge, managed by US Fish and Wildlife Service. TheBay is home to a wide diversity of plant and animal life, including several threatened or endangeredspecies.
area. This section provides a brief overview of these responsibilities.
established in 1962 by an act of the California State legislature and ratified by the voters of the Port’s fivemember cities—Chula Vista, Coronado, Imperial Beach, National City and San Diego. This legislationestablished the Port to manage the development of commerce, navigation, fisheries, and recreation onbehalf of the state of California. The lands are conveyed to the Port as a trustee of the state by the StateLands Commission, and include approximately 2,500 acres of land and 3,400 acres of water. The Port isgoverned by a Board of Commissioners appointed by the five member cities.
Coronado. These cities regulate land use in the planning area, except in Port managed areas where thePort retains land use authority. For Port tenant projects, the Port defers to the member cities for review ofbuilding permits under applicable building codes, and relies on the cities to provide potable water andwastewater facilities.
planning and operational jurisdiction for the 661 acres that comprise San Diego International Airportlocated on state tidelands. It is governed by an appointed board representing all areas of San DiegoCounty.
Coastal Commission regulates development along the coast to ensure compliance with Coastal Actstandards for public access, recreation, views, environmental protection, and hazards. The Commission’sjurisdiction is applicable inside the Coastal Zone boundary.
cargo handling, storage and other uses by Naval Base San Diego, Naval Base Coronado, and Naval BasePoint Loma. The Navy owns and has sole regulatory authority over approximately 1,900 acres in theplanning area.

7
on. California Department of Parks and Recreation managesSilver Strand State Beach for recreation, under a land grant from the State Lands Commission.
these lands are managed under a lease from the State Lands Commission and are under protection forthreatened and endangered species.
California Department of Parks and Recreati

2. VULNERABILITY ASSESSMENT OVERVIEW
A climate change vulnerability assessment evaluates the degree to which important community assetsare susceptible to, and unable to accommodate, the adverse effects of climate change. By identifyinglikely impacts and the vulnerabilities of critical systems, this vulnerability assessment starts to define theproblem of sea level rise on San Diego Bay. The assessment informs policymaking in several ways. First,it identifies the functional systems or sectors—such as buildings, utilities, emergency response, orcritical habitat—that are likely to be affected by climate change related impacts. Secondly, it enhancesunderstanding of the causes and components of each system’s vulnerabilities, explicitly identifyingvulnerable points in the system. Finally, it provides information about the relationships betweenvulnerabilities of different systems to allow both for prioritization and for a systems approach to policymaking.
This section describes the contemporary scientific understanding of sea level rise and associatedimpacts; sea level rise scenarios developed for planning purposes; the vulnerability assessmentmethodology; and a summary of assessment findings.
2.1 Sea Level Rise Science and Planning Scenarios
Global, or eustatic, sea level rise is caused by two principal factors – the thermal expansion of water andthe melting of land based ice (commonly called glaciers) – both of which are influenced by climatechange. Globally, oceans rose at an average rate of 0.7 inches (18 mm) per decade from 1961 to 2003.2
Local, or relative, sea level rise is affected by global sea level rise, as well as key additional factors suchas El Nino events, circulation patterns, and land elevations changes. As shown in Figure 2.1, sea levelrise has been documented in the San Diego Bay since 1906 with a rise of 0.8 inches (20.6mm) perdecade over the past century.
Figure 2.1 Observed Sea Level in San Diego
2 Intergovernmental Panel on Climate Change (IPCC). 2007. Climate Change 2007: Synthesis Report for the Fourth Assessment Report of the Intergovernmental Panel on Climate Change. Available Online: www.ipcc.ch/pdf/assessment-report/ar4/syr/ar4_syr.pdf
8
Moving from documentation of past sea level rise to prediction of future sea level rise, scientists rely onseveral methods including trend analysis and modeling of both thermal expansion and melting of landbased ice. Based on these methods, scientists currently predict that the rate of sea level rise willincrease in the coming century. Although there is deepening understanding of sea level rise trends,there remains uncertainty around the rate and timing of sea level rise. This uncertainty stems both fromunknown future greenhouse gas emissions and from uncertainty about the precise relationshipsbetween emissions, temperature, and glacial melt.
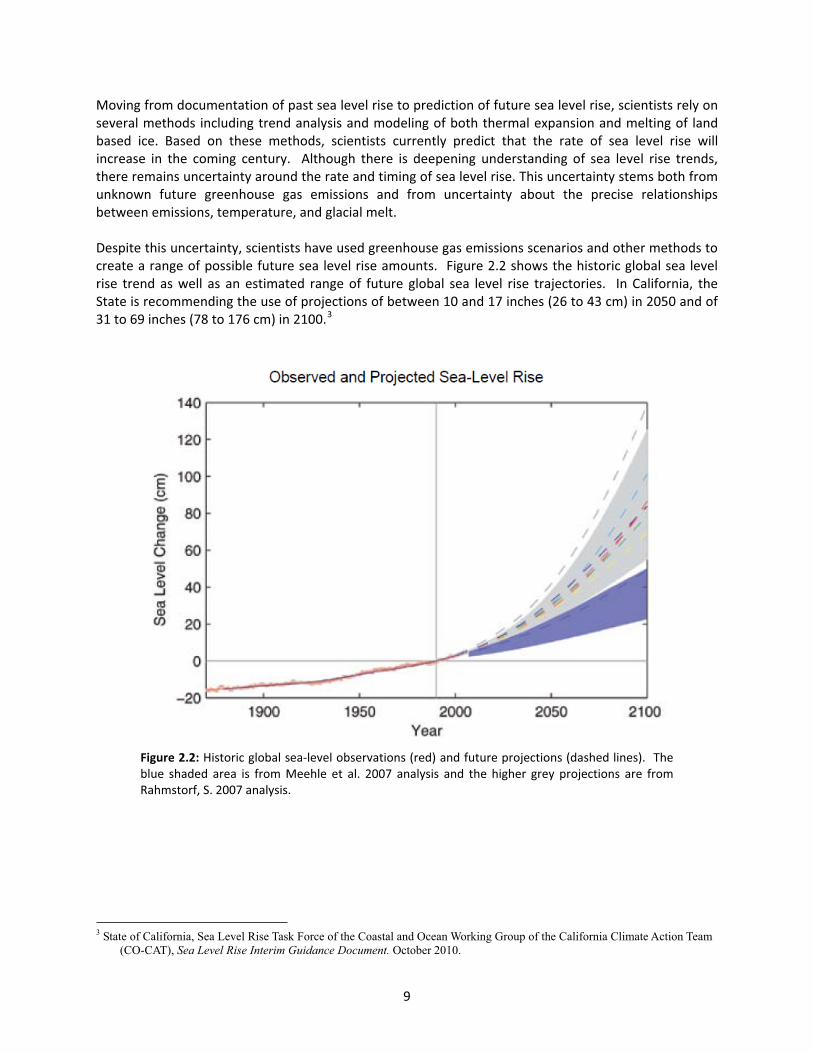
Despite this uncertainty, scientists have used greenhouse gas emissions scenarios and other methods tocreate a range of possible future sea level rise amounts. Figure 2.2 shows the historic global sea levelrise trend as well as an estimated range of future global sea level rise trajectories. In California, theState is recommending the use of projections of between 10 and 17 inches (26 to 43 cm) in 2050 and of31 to 69 inches (78 to 176 cm) in 2100.3
Figure 2.2: Historic global sea level observations (red) and future projections (dashed lines). Theblue shaded area is from Meehle et al. 2007 analysis and the higher grey projections are fromRahmstorf, S. 2007 analysis.
3 State of California, Sea Level Rise Task Force of the Coastal and Ocean Working Group of the California Climate Action Team (CO-CAT), Sea Level Rise Interim Guidance Document. October 2010.
9
10
Four sea level rise “planning scenarios” are considered in this Strategy. Embodied in these scenarios arethree considerations that assist in the development of policy: amount of sea level rise, horizon year, andvariability. This assessment utilizes a 20 inch (0.5 meter) increase in sea level in 2050 and a 59 inch (1.5meter) increase in sea level in 2100. Higher end sea level rise scenarios are chosen from the range ofpossibilities to encourage a risk averse approach to planning, as recommended by the State guidance,and to leverage existing research and data. Variability in the occurrence of flood events is another keyconsideration in sea level rise planning; policy responses will vary depending on how often a communityasset is exposed to flooding, whether on a daily, annual, or once a century basis, for example. Thefollowing planning scenarios are referred to throughout this document:
Sea Level Rise Planning Scenarios
2050 Daily Conditions—Mean high tide in 2050 with 0.5 meters of sea level rise
2050 Extreme Event – 100 year extreme high water event in 2050, with 0.5 meters of sealevel rise, including such factors as El Nino, storm surge, and unusually high tides
2100 Daily Conditions – Mean high tide in 2100 with 1.5 meters of sea level rise
2100 Extreme Event – 100 year extreme high water event in 2100, with 1.5 meters of sealevel rise, including such factors as El Nino, storm surge, and unusually high tides
2.2 Sea Level Rise Impacts
Rising sea levels are generally associated with a number of different impacts, including flooding,inundation, erosion, salt water intrusion, and water table rise. This section briefly describes theseimpacts.
Flooding and Inundation
Flooding refers to the circumstance of normally dry land being covered by water for a limited period oftime. These events are often described in terms of their statistical potential to occur. For example, aflooding event referred to as the one percent chance storm event (often called the 100 year storm) hasa one percent chance of occurring in a given year and on average occurs once every 100 years. TheExtreme Event scenarios considered in this report are the 100 year high water event, which accounts fora number of local water level factors including El Niño effects and storm surge, but does not account forprecipitation and riverine flooding from storms. In the San Diego Bay area, it is expected that sea levelrise will cause coastal flooding to reach farther inland and to occur more often. These extreme floodevents for the two time horizons are shown in Figure 2.4 and 2.6.
Inundation, on the other hand, is when land that was once dry becomes permanently wet. Sea level risecould result in certain currently dry locations around the Bay being inundated by daily high tides. Thesepotential future inundation scenarios for the two time horizons are shown in Figure 2.3 and 2.5. In

addition to the clear threats inundation poses to the built environment, this impact is also predicted toimpact natural systems or ecosystems in several key ways. Inundation is expected to cause thelandward migration of intertidal and upland natural environments, such as marshes, tidal flats, anddunes. However, if there is nowhere for these features to migrate due to adjacent development, theninundation could result in the complete loss or fracturing of these systems. The loss of these intertidalhabitats would be highly destructive to the many species that rely heavily on their existence. Thisdynamic is explored further in Section 3.
All flooding and inundation maps are based upon research performed by Rick Gersberg of San DiegoState University with support from a grant by the San Diego Foundation. GIS layers showing floodingwere created through a “bathtub” modeling method, which does not account for a number of factors—such as topography of the Bay floor, wave run up, and erosion—that could increase or decrease theextent of the inundation and flooding. The method also does not account for existing shorelineprotection infrastructure such as sea walls or revetments. Finally, this model cannot account for futurechanges to land use and land form. Despite these drawbacks, the maps provide meaningful informationon low lying areas that could be exposed to inundation or flooding under various sea level risescenarios.
These future inundation and flood maps can be compared to current FEMA flood zones delineated onFlood Insurance Rate Map (FIRMs), shown in Figure 2.7. The FIRM shows the estimated extent offlooding during a hypothetical storm. It shows both the hypothetical “100 year storm” (also called a 1%storm) and “500 year storm” (also called a 0.2% storm). These are storms that have an estimated 1%chance and 0.2% chance respectively of being equaled or exceeded during any given year. Additionally,the map for the San Diego Bay area shows the levee protection area of Coronado Cays and theunstudied areas associated with military facilities. It is important to note that FEMA’s mapping methodsare different from those used to derive the sea level rise flood and inundation maps. Specifically,FEMA’s map use a run up analysis that includes the potential force of water associated with stormevents. Additionally FEMA’s maps include considerations of freshwater riverine flooding. Despite thesedifferences it is useful to note that there is some meaningful overlap and some differences betweencurrent and future flood zones.
Erosion
Erosion, which is defined as the wearing away of the earth's surface by any natural process, often occursat the intersection of land and water. In coastal areas, there are thought to be two major erosionprocesses. The first is episodic erosion, which occurs during a major storm event and results in extremeshifts in shorelines. Natural environments typically recover from these episodic shifts returning to theirpre storm state over time; however, if either the frequency or the intensity of these episodic erosionevents were to increase, a natural system might not be able to recover. Though the exact effects onerosion under the future extreme events scenarios are not known, it can be said that in both 2050 and2100 episodic erosion is likely to increase in terms of the quantity of sediment that is lost.
The other type of erosion is chronic erosion, which is the slow migration of sand away from the shore (orshifting to a different location). Sea level rise, which will alter daily conditions and cause heightened seaevents to persist for longer periods, could also exacerbate chronic erosion on non hardened surfacesaround the Bay.4
4 Focus 2050 p. 14
11

12

13

14

15

16

Saltwater Intrusion
Saltwater intrusion is the physical migration of saltwater into freshwater aquifers. This is a naturalprocess that is regulated by a number of factors including groundwater pumping, precipitation, theexistence of channels, storm events, and sea level. The San Diego Formation aquifer, which runs northsouth from the La Jolla area to the US Mexico border and east west from approximately Interstate 805to the coast, could experience salt water intrusion from the San Diego Bay depending on thecombination of these factors. To this point, research has shown that the relationship between the risingBay and the aquifer could put the aquifer at risk of greater saltwater intrusion.5 The details regardingthe effects of the daily changes versus the extreme events are not known; however, the hydrodynamicsof this aquifer are being studied in depth by the US Geological Survey in its San Diego Hydrogeologyproject and more information will likely be available through this initiative in the future.
In many places, saltwater intrusion into aquifers is a concern as it relates to the quality of groundwaterused for potable water supply. Groundwater comprises approximately three percent of San DiegoCounty’s water supply currently. In the planning area, groundwater is utilized only in the SweetwaterAuthority district, which serves National City and the central and western parts of Chula Vista. Thiswater is desalinated at a facility located outside the planning area; an increase in the salt content of thiswater could affect operation of the desalination plant. However, the Sweetwater Authority groundwatersupply is pumped from deep in the aquifer. Seawater infiltrates into shallow aquifers earlier and in thiscase, is unlikely to reach the Sweetwater water source for many decades. The hydrodynamics of thisarea are only beginning to be understood, and more research is needed to draw conclusions about theSweetwater supply’s exposure to saltwater intrusion. Until then, the sentiment among project technicaladvisors is that the region’s potable water system is less vulnerable to saltwater intrusion than toflooding and rising water tables. As a result, saltwater intrusion is not addressed further in thevulnerability assessment or recommendations.
Water Table Rise
The water table is the top of thefreshwater aquifer. Comprehensive dataabout water table elevations is notavailable for the area, but generally, watertables currently lie at sea level nearest thecoast and gradually rise inland, toapproximately 30 feet above sea level afew miles east of the Bay. Though theresponse of water tables to sea level rise inthe Bay region has not yet been modeled,it is generally understood that if sea levelswere to rise, the water table could alsorise, impacting subsurface infrastructure,
Figure 2.8: Rising Water Tables. A depiction of a salt wateraquifer rising causing the water table to rise into the pipe zone.
as illustrated in Figure 2.8.
5 Personal communication with Wes Danskin, USGS, February 18 2011.
17
A rising water table would pose many risks to infrastructure, including stormwater facilities, sewermains, potable water distribution, electricity and natural gas distribution, and transportation facilities.In general, concerns include structural integrity of surface infrastructure, maintenance of buriedinfrastructure, and groundwater infiltration into buried pipes. Subsurface structures such as parkinggarages and basements would also be at risk of flooding from groundwater, requiring expensivedewatering facilities, as is already the case at the Convention Center parking structure.
While these impacts are possible, too little is currently known about the water table and how it willrespond to sea level rise to accurately assess these potential vulnerabilities. The response of watertables to sea level rise in the Bay region has not been modeled, so it is not possible to determineexposure of infrastructure in the 2050 or 2100 horizons. As a result, water table rise is not addressedfurther in the vulnerability assessment or recommendations sections of this document.
2.3 Assessment Methodology
The vulnerability assessment is intended to provide a comprehensive picture of the vulnerabilities ofvarious functional systems in both the built and natural environment of San Diego Bay, with a focus onsystems under City jurisdiction or cross jurisdictional control. The vulnerability assessment analyzedthree components of vulnerability – exposure, sensitivity, and adaptive capacity – relative to sea levelrise impacts – flooding, inundation, erosion, salt water intrusion, and water table rise.
Exposure is a determination of whether community assets will experience a specific changing climatecondition.
Sensitivity is the degree to which community assets would be impaired by the impacts of climate changeif they were exposed those impacts. Systems that are greatly impaired by small changes in climate havea high sensitivity, while systems that are minimally impaired by the same small change in climate have alow sensitivity.
Adaptive capacity is the ability of a community asset to make adjustments or changes in response toclimate impacts, in order to maintain its primary functions. This does not mean that the system mustlook the same as before the impact, but it must provide the same services and functions as it did beforethe impact occurred.
The combination of sensitivity and adaptive capacity determine a system’s overall vulnerability level.Sensitivity has a positive relationship with vulnerability, meaning that as a system’s sensitivity increasesits overall vulnerability also increases. Adaptive capacity has an inverse relationship with vulnerability,thus as adaptive capacity increases the system’s vulnerability decreases, as shown in Figure 2.9.
This vulnerability assessment used three methods depending on the sector and the sea level rise impactbeing assessed. For several sectors, exposure to flooding and inundation was estimated throughGeographic Information Systems analysis (GIS is a suite of computer tools for mapping and spatialanalysis). The physical location of each sector’s core regional components was compared with floodmapping of each of the four planning scenarios (Figures 2.3 through 2.6). Based on this data overlay, itwas determined if a location could experience future flooding or inundation. The flood exposure overlaymaps are presented in Appendix II. Exposure to erosion, saltwater intrusion, and water table rise weredetermined primarily through information provided by experts in both their survey responses as well asin specific follow up.
18

Figure 2.9: Components of Vulnerability. A depiction of therelationship between sensitivity, adaptive capacity, andvulnerability.
Additionally, the effect of inundation on habitat shifts was assessed based on the Sea Level AffectingMarshes Model (SLAMM) performed Dr. Rick Gersberg at San Diego State University. This modelsimulates dominant processes – inundation, erosion, overwash, saturation, and salinity – that determinethe makeup of coastal ecosystems, thus providing information on potential habitat shifts. The modelwas calibrated to location conditions and run for five different sea level rise scenarios. This assessmentevaluated ecosystem exposure based on the general habitat trends that the model produced.
In conjunction with these exposure analyses, this vulnerability assessment used a written survey togauge the sensitivity and adaptive capacity of all the systems addressed in this report. The steps of thesurvey method are provided below:
1. Several local technical experts for each system were identified and invited to serve as technicaladvisors based upon the depth of their knowledge in appropriate fields.
2. Technical advisors were provided with an information packet and a webinar explaining thetenants of sensitivity and adaptive capacity.
3. A detailed survey on sensitivity and adaptive capacity was developed in SurveyMonkey.com withthe guidance of the Steering Committee. The survey required that applicants take some time tothink about and answer guiding questions related to a system’s sensitivity and adaptivecapacity, then rate sensitivity and adaptive capacity on a scale of 1 to 5. The surveyquestionnaire can be found in Appendix I.
4. Finally, based upon answers to the survey, subsequent follow up with local experts, and theappropriate exposure assessment, primary vulnerabilities for each system were determined.Complete assessments of primary vulnerabilities for each sector are presented in section 3.
19
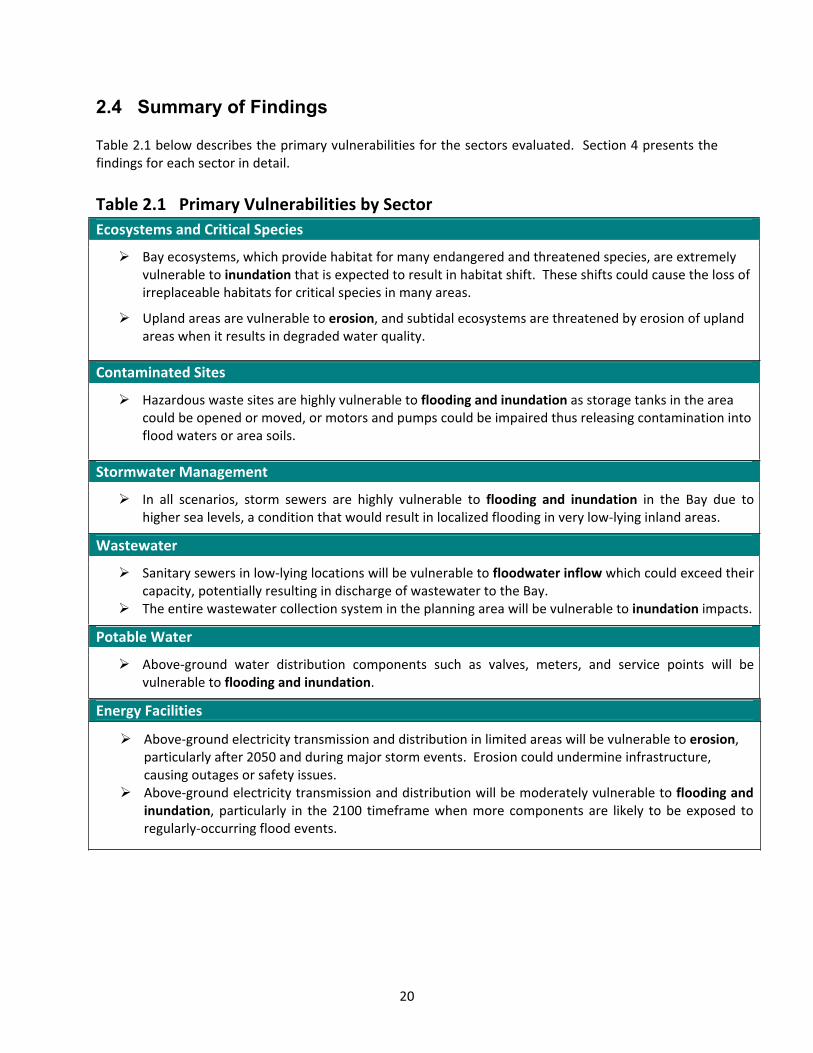
2.4 Summary of Findings
Table 2.1 below describes the primary vulnerabilities for the sectors evaluated. Section 4 presents thefindings for each sector in detail.
Table 2.1 Primary Vulnerabilities by SectorEcosystems and Critical Species
Bay ecosystems, which provide habitat for many endangered and threatened species, are extremelyvulnerable to inundation that is expected to result in habitat shift. These shifts could cause the loss ofirreplaceable habitats for critical species in many areas.
Upland areas are vulnerable to erosion, and subtidal ecosystems are threatened by erosion of uplandareas when it results in degraded water quality.
Contaminated Sites
Hazardous waste sites are highly vulnerable to flooding and inundation as storage tanks in the areacould be opened or moved, or motors and pumps could be impaired thus releasing contamination intoflood waters or area soils.
Stormwater Management
In all scenarios, storm sewers are highly vulnerable to flooding and inundation in the Bay due tohigher sea levels, a condition that would result in localized flooding in very low lying inland areas.
Wastewater
Sanitary sewers in low lying locations will be vulnerable to floodwater inflow which could exceed theircapacity, potentially resulting in discharge of wastewater to the Bay.The entire wastewater collection system in the planning area will be vulnerable to inundation impacts.
Potable Water
Above ground water distribution components such as valves, meters, and service points will bevulnerable to flooding and inundation.
Energy Facilities
Above ground electricity transmission and distribution in limited areas will be vulnerable to erosion,particularly after 2050 and during major storm events. Erosion could undermine infrastructure,causing outages or safety issues.Above ground electricity transmission and distribution will be moderately vulnerable to flooding andinundation, particularly in the 2100 timeframe when more components are likely to be exposed toregularly occurring flood events.
20

Local Transportation Facilities
Access provided by local transportation facilities will be vulnerable to flooding and inundation,particularly in the 2100 timeframe when more components are likely to be exposed to regularlyoccurring inundation.
Roads and other facilities could also be vulnerable to flooding and inundation due to saturated soilsand impacts on road substructure and pavement degradation.
Building Stock
Residential buildings have a low vulnerability to flooding in the 2050 scenario due to limited exposure.They are highly vulnerable to flooding and inundation in the 2100 scenarios as exposure expands tolarge portions of residential neighborhoods and major commercial facilities.
Emergency Response Facilities
Fire stations in San Diego and Coronado are moderately vulnerable to flooding in the 2100 ExtremeEvent scenario.
Parks, Recreation, and Public Access
Shoreline parks and recreational facilities are extremely vulnerable to regular inundation due toextensive exposure around the Bay and high sensitivity to inundation impacts.The system is highly vulnerable to flooding because of extensive exposure and high sensitivity, butadaptive capacity to cope with flooding is higher than for most other systems.
Regional Airport Operations
Parts of the Airport site will be vulnerable to localized flooding from blocked storm outfalls in the Bay.In the 2100 scenarios, Airport operations will be extremely vulnerable to Bay flooding and inundation,particularly from impacts on access roads, future terminal areas, and portions of the runway/airfield.
Vulnerable Populations
Many groups that are currently vulnerable – such as low income residents, the homeless, elderly, andethnic minorities – will face even greater threats from future flooding, particularly in the 2100timeframe.
Residents that work in sectors that could be adversely impacted by future flooding are also a keyvulnerability for the region.
21

3. CO NSIVE ST EGIESMPREHE RAT
Recommendations in the Adaptation Strategy take the form of either “comprehensive” strategies or
The first six comprehensive strategies are intended to be implemented collaboratively at a regional
trategies for Regional Implementation
1. Create a staff level regional sea level rise (SLR) adaptation working group consisting ofn
A working group consisting of staff from the public agencies with jurisdiction around San Diego Bay
Formation and facilitation of a working group can be executed efficiently by building off existing
2. Provide regular opportunities for stakeholder engagement around implementation of the
The working group should look to host regular forums for stakeholders to be involved in
“targeted” strategies. While the targeted strategies are specific to certain impacts, vulnerabilities,sectors, or timeframes, the following 10 comprehensive strategies are designed to advance regional sealevel rise adaptation planning broadly. Most of the strategies address both the 2050 and 2100 planninghorizon timeframes; both new daily conditions and extreme high water events; multiple impacts andvulnerabilities; and multiple functional systems and sectors.
level. The final four strategies are intended to be considered for implementation at a local level amongeach of the Steering Committee jurisdictions.
S
representatives from public agencies around San Diego Bay to implement the AdaptatioStrategy.
would be formed to provide a venue for collaboration and peer exchange on technical andadministrative topics. The working group will work to implement other regional strategies such asmonitoring climate change science, promoting research, and providing stakeholder engagementopportunities. Additionally, the working group will pursue adaptation related funding, monitorprogress in implementing the Adaptation Strategy, and update the Strategy every five years or asneeded.
groups such as the Adaptation Strategy Steering Committee. Other regional models can be adaptedin devising a structure for the group, such as the Workgroup for the San Diego Bay Watershed UrbanRunoff Management Program (WURMP) or the Regional Climate Protection Network, a group ofagency staff working on climate mitigation coordinated by The San Diego Foundation.
Adaptation Strategy.
implementation of the Adaptation Strategy. This strategy may also be implemented throughexisting channels and should build off of regional successes. Specifically, the group may be able tocollaborate with the Tijuana River National Estuarine Research Reserve (TRNERR) Coastal TrainingProgram, which has led a number of successful climate change adaptation stakeholder meetings inpartnership with The San Diego Foundation and ICLEI.
22

3. Create and enhance existing outreach, education, training, and peer exchange programs tailoredto public agency staff, stakeholders, and the general public.
Sea level rise adaptation planning is a new and complex field, and outreach and education arecritical in building capacity to adapt in the region. Many jurisdictions have articulated the need forincreased outreach and communication around climate change, including climate change impactsand adaptation. In the San Diego Bay area, the City of Chula Vista’s Climate Adaptation Strategies—Implementation Plans call for ongoing public education and outreach efforts.
To implement this strategy, the working group should consider developing a communications planthat identifies target audiences and appropriate ways to reach those audiences. Some examples ofpossible communications actions include the creation of interpretive information at publiclyaccessible shoreline sites, the inclusion of sea level rise information in regional websites, thecreation of training programs or brown bag lunch information sessions for agency staff, and eventhe utilization of social media to raise awareness of the region’s efforts to increase resilience. Inaddition to building support for needed adaptation actions, improved public outreach aroundflooding can provide points for jurisdictions that may choose to participate in FEMA’s CommunityRating System (CRS), which can help to lower insurance premiums in communities around the Bay.6
4. Establish and promote a regional research agenda to advance understanding of sea level riseimpacts, vulnerabilities, and adaptation responses in the San Diego region.
The science of climate change is rapidly evolving, and the Adaptation Strategy vulnerabilityassessment revealed a number of gaps in understanding sea level rise dynamics in the region. Bycreating and promoting a research agenda, the region can greatly enhance local understanding offuture impacts of sea level rise to inform more effective planning.
This strategy may be best implemented through developing strategic partnerships with the region’sworld class universities and research centers, including UCSD/Scripps Institute of Oceanography, SanDiego State University, Hubbs SeaWorld Research Institute, NOAA’s California and NevadaApplications Program, and the Center for Bay and Coastal Dynamics. Research should also becoordinated and leveraged with the research initiatives of state and federal agencies in the region,such as US Fish and Wildlife Service, US Geological Survey, TRNERR, and California Department ofFish and Game. The following research items have been identified and should be considered for theinitial research agenda:
Precipitation, storms, and flooding. The Adaptation Strategy vulnerability assessmentevaluated flooding from higher sea levels and high water events, but precipitation patternswill also influence flooding and water table dynamics on the Bay. Greater understanding ofclimate related precipitation changes and their relationship to San Diego Bay flooding,water quality, and water table elevation will enhance adaptation planning.
Aquifer hydrodynamics. As described in Section 2, water table rise may pose a risk toburied infrastructure around the Bay. While less of a concern, saltwater intrusion into SanDiego Formation aquifer could eventually affect one source of the South Bay’s drinkingwater. More information is needed about these processes, especially to inform the design,
6 Targeted Strategy, Building Stock #2
23
construction, and maintenance of buried utilities, transportation facilities, andunderground structures.
Survey of shoreline protection infrastructure. There is currently no comprehensive data onthe type, condition, and elevation of shoreline protection infrastructure on San Diego Bay.This information is critical to performing site specific vulnerability assessments andengineering of capital projects.
Cost Benefit analysis. Economic analysis of sea level rise related impacts and adaptationpractices is needed to evaluate the cost of possible actions as compared to the cost ofinaction.
Ecosystem valuation. Analysis of the economic value of ecosystem services would help toinform decision making about resource management as the Bay’s ecosystems areincreasingly threatened by sea level rise.
Sediment transport and SLAMM modeling. The composition of Bay ecosystems is greatlyinfluenced by the amount of sediment that is being eroded or deposited in differentlocations. More information about coastal and fluvial sediment transport will help naturalresource managers better understand how nearshore environments will respond to sealevel rise, and the extent to which they will act as critical habitat and natural protectivebarriers for adjacent infrastructure. Sediment transport data also improves the precision ofthe Sea Level Affecting Marshes Model (SLAMM), which models change in ecosystem typesdue to sea level rise.
5. Engage regulatory agencies to advocate for clear and consistent regulatory guidance on how toaddress sea level rise impacts in development permitting.
Many state and federal agencies play a role in regulating development around San Diego Bay. Clearand concise guidance or common regulations from these agencies would reduce uncertainty aboutappropriate planning and development practices, thereby reducing economic and political barriersto adaptation planning.
Relevant agencies include the Regional Water Quality Control Board, the Coastal Commission, theGovernor’s Office of Planning and Research, and the Army Corps of Engineers. Prior to engagingthese agencies, the working group may wish to identify areas of permitting conflicts as well as areasthat would most directly benefit from the inclusion of sea level rise considerations.
6. Engage the Federal Emergency Management Agency (FEMA) to encourage the incorporation offuture risks from sea level rise into non regulatory maps associated with upcoming FloodInsurance Studies (FIS).
Developed by FEMA, flood insurance studies and the flood insurance rate maps (FIRMs) that theyinform are often used by local governments for regulatory purposes. Although local governmentcan create their own improved flood maps and can regulate to higher standards using the existingflood maps, FIRMs are the authoritative benchmark for regulating and insuring development inflood prone areas. Currently, flood risk in these documents must be based on current risk, asdetermined from historical observation. However, working with FEMA to create non regulatory
24

25
maps that reflect changing risks due to sea level rise would help to institutionalize adaptationplanning into traditional local floodplain management procedures. In implementing this strategy,the group should work directly with FEMA to understand what the near term options are forimproved mapping. The next Flood Insurance Study update is planned for the San Diego region in2012.
Strategies for Local Implementation
While the previous strategies were geared towards collaborative regional implementation, the followingfour strategies are intended to be considered by each Steering Committee jurisdiction forimplementation at the agency level. These strategies address at a high level many of the vulnerabilitiesidentified in the vulnerability assessment.
7. Institutionalize or mainstream sea level rise adaptation by incorporating sea level rise andassociated impacts into relevant local and regional plans and projects.
Public agencies on San Diego Bay are designing infrastructure, permitting development projects, andrestoring critical habitat that is expected to serve community needs well into the 21st century. Localgovernments can ensure that these investments stand the test of time by incorporating sea levelrise adaptation directly into local plans and policies. Stand alone adaptation strategies can be usefulin educating the community and coordinating action, but ultimately, climate adaptation mustbecome “standard operating procedure” across a variety of departments and disciplines. Thefollowing plans include goals and policies that will be affected by sea level rise and as such areappropriate documents for integrating sea level rise adaptation:
General Plans;Specific or Community Plans;Local Coastal Programs;Port of San Diego Master Plan;San Diego International AirportMaster PlanRegional Aviation Strategic Plan;Flood Mitigation Plans;Multi jurisdictional HazardMitigation Plan;Habitat Conservation Plans;
Regional Comprehensive Plan andSmart Growth Concept Map;Regional Climate Action Strategy;Regional TransportationPlan/Sustainable CommunitiesStrategy;San Diego Integrated RegionalWater Management Plan;Green Book Design Standards forCapital Projects.
8. Consistently utilize guidance provided by the State of California Climate Action Team in developingsea level rise assumptions for planning purposes.
The California Climate Action Team is an inter agency group tasked with helping the state meet itsclimate mitigation and adaptation goals. The Coastal and Ocean Resources Working Group (CO CAT)

has issued guidance for sea level rise assumptions that should be referred to in local decisionmaking: 7
i. Use the ranges of SLR presented in the December 2009 Proceedings of National Academy ofSciences publication by Vermeer and Rahmstorf8 as a starting place and select SLR valuesbased on agency and context specific considerations of risk tolerance and adaptive capacity.
ii. Consider timeframes, adaptive capacity, and risk tolerance when selecting estimates of SLR.iii. Coordinate with other state agencies when selecting values of SLR and, where appropriate
and feasible, use the same projections of SLR.iv. Future SLR projections should not be based on linear extrapolation of historic sea level
observations.v. Consider trends in relative local mean sea level.vi. Consider storms and other extreme events.vii. Consider changing shorelines.
9. Perform more detailed vulnerability assessments at a site specific level as significant plans orcapital projects are undertaken.
Looking carefully at specific locations will enable local agencies to more thoroughly determine thevulnerabilities associated with future sea level rise projects. This assessment could be in the form ofa land survey that would better inform developers of the nature and type of future flooding andother sea level rise impacts. This strategy would best be implemented by identifying the types andlocations of projects that would trigger additional analysis in advance. This pre identification wouldhelp to ensure that projects that should be thoroughly reviewed for future vulnerabilities areproperly analyzed.
10. Develop decision making frameworks in each jurisdiction for selecting and implementingappropriate management practices in communities vulnerable to inundation or regular flooding.
Sea level rise management practices can include hard defenses, soft defenses, accommodation,managed retreat, and limitations on new development, each of which presents particularlyopportunities and constraints.9 Collaboration with other jurisdictions will be critical whenimplementation of these management practices needs to be coordinated, such as when a sea wallextends across jurisdictional boundaries.
7 State of California Sea Level Rise Interim Guidance Document8 Vermeer, M. & Rahmstorf, S. (2009). Global sea level linked to global temperature. Proceedings of the National Academy of
Sciences of the United States of America. Available Online: http://www.pnas.org/content/106/51/21527.full.pdf+html9 The Management Practices Toolbox in Section 5 can be used to better understand and ultimately implement this
strategy. The toolbox provides information on four different management approaches and the opportunitiesand constraints of these approaches as identified at the Adaptation Strategy Stakeholder Workshop #2.
26

4. SECTOR VULNERABILITIES AND TARGETED STRATEGIES
This section presents the vulnerability assessment findings in greater detail, and offers recommendationsfor potential adaptation policy responses to each primary vulnerability. The section is organized by thefollowing 11 functional sectors that framed the vulnerability assessment and recommendations:
Ecosystems and critical species
Contaminated sites
Stormwater management
Wastewater
Potable water
Local transportation facilities
Building stock
Emergency response facilities
Parks, recreation, and public access
Regional airport operations
Vulnerable populations
The targeted strategies were developed through an intensive process of evaluation in consultation withthe Technical Advisory Committee and Stakeholder Working Group. The evaluation was guided by thefollowing evaluation criteria identified in Workshop #2:
A) Is the strategy within the purview of a Steering Committee jurisdiction?
B) Does the strategy build off existing policies and funded programs?
C) Is the strategy flexible enough to respond to changing circumstances?
D) Does the strategy complement efforts to reduce GHG emissions?
E) Does the strategy protect and promote:
Economic and social well beingPublic safety and securityPublic healthEnvironmental justiceSpecies and habitat protectionEcological functionPublic access to coastal beaches, natural shoreline, parks and recreational facilitiesCritical infrastructureCommunity character
F) Does the strategy address the planning and design of new development?
G) Does the strategy facilitate adaptation in existing communities?
27

Ecosystems and Critical Species
The San Diego region is valued by tourists and residents alike for its natural beauty and biodiversity. Theregion, which is known to be home to many threatened or endangered species, created a regionalMultiple Species Conservation Program (MSCP) that designated approximately 23 percent the planningarea as being of high species value. This section evaluates the vulnerabilities of upland ecosystems,nearshore transitional ecosystems, and subaquatic ecosystems around San Diego Bay, and suggestsresponses that could contribute to their resilience.
The most vulnerable ecosystems and habitat on the Bay are intertidal ecosystem types, whichexperience both dry and wet patterns on a regular basis. In the Bay, these include marshes, tidal flats,tidal creeks, and the rocky intertidal zone. Regionally significant locations include the SweetwaterMarsh, Paradise Marsh, J Street Marsh and tidal flats, and the vernal pools of Otay Mesa. Whileprotected by dikes, the South Bay Salt Ponds are also home to many of the species prominent inintertidal ecosystems. Intertidal ecosystems in South Bay are a key location on migratory bird routes,and support multiple federally listed plant and animal species, including:
California least tern (endangered)Light footed clapper rail (endangered)Western snowy plover (threatened)Salt marsh bird’s beak (endangered)
The San Diego Bay upland ecosystem consists primarily of undeveloped dry lands around the Bay. Theseareas can be found directly adjacent to transitional or aquatic ecosystems, as well as interspersed withthe built environment. On the north side of the Bay, the area around Famosa Slough and the Least Ternnesting habitat in the airport provide significant upland habitat. On the southern portion of the Bay,upland ecosystems include the Silver Strand dune system and upland areas east of Sweetwater Marshand south of the salt ponds that falls within the National Wildlife Refuge. Although the upland areashave experienced extensive human disturbance, portions of these uplands provide important habitat forground nesting birds.
San Diego Bay’s subtidal ecosystem is defined byits warm nutrient rich composition, the shelter itprovides from waves, and the protection itprovides from marine predators. Eelgrass beds inSan Diego Bay play a crucial role for area wildlifeand economic life. These beds, which make upnearly 20% of all eelgrass habitat in California,support a variety of ecologically importantspecies and play a key role in supporting areafisheries. Specifically, the endangered EasternPacific green sea turtle forages in the eelgrassbeds in San Diego Bay. The shallow, hypersalinesubtidal waters around the South San Diego Bayshoreline also support a great diversity of fishindigenous to the area.
Figure 4.1 Sweetwater Marsh, King Tide. 02.17.11, morning :~7.0 feet above mean low tide.
28

Primary Vulnerabilities
Bay ecosystems, which provide habitat for many endangered and threatenedspecies, are extremely vulnerable to inundation that is expected to result inhabitat shift. These shifts could cause the loss of irreplaceable habitats for criticalspecies in many areas.
Upland areas are vulnerable to erosion, and fisheries, piscivorous birds andaquatic plants are threatened by erosion of upland areas when it results indegraded water quality.
Primary Vulnerability – Inundation and Habitat Loss
San Diego Bay’s ecosystems are extremely vulnerable to the effects of inundation, chief among themhabitat loss. Intertidal ecosystems and habitat, in particular, are finely calibrated to the environmentalconditions created by water level and tidal dynamics, such as water salinity, water temperature, andsediment erosion and accretion. When sea level rises, more intertidal areas will be inundated orregularly flooded, creating wetter and higher salinity conditions that place stress on ecosystemsadapted to existing conditions. In response, ecosystems and the species they support will try to shift,generally towards higher elevations landward that could become more like today’s marshes andwetlands when water level rises.
Unfortunately, most of these upland areas around the Bay have been developed, and ecosystems arelikely to be squeezed against adjacent developed areas, limiting their ability to adapt and ultimatelyresulting in habitat loss. This dynamic could drastically impact intertidal and upland ecosystems and theendangered and threatened species that depend on them. Moreover, intertidal ecosystems helpprotect and sustain subtidal ecosystems, which will also be vulnerable as neighboring biodiversity is lostand the water quality benefits of wetlands are compromised.
ExposureOf different habitat types around the Bay, intertidal ecosystems are most exposed to inundation in boththe 2050 and 2100 planning scenarios, followed by upland habitat in a few areas. Inundation is limitedin the 2050 horizon, and becomes systemic towards end of century. The following exposure patternsare likely in intertidal areas:
Sweetwater Marsh and J Street Marsh and tidal flats will gradually experience greaterinundation going forward, with the rate of this change accelerating over time.
A portion of the South Bay Salt Ponds may be exposed under the 2050 sea level rise scenario,with inundation affecting the majority of the ponds under the 2100 sea level rise scenario. Itshould be noted that these exposure estimates do not account for the levees that may protectthe ponds from inundation.
29

In upland areas, the following exposure patterns are indicated in the inundation mapping:
Silver Strand dune system could experience regular inundation and periodic flooding underboth the 2100 and the 2050 sea level rise scenarios. In the 2100 sea level rise scenario theflooding will encompass the entire dune area, while in the 2050 sea level rise scenario, theflooding will be limited to lower elevations.
The upland habitats east of Sweetwater Marsh could experience a combination of inundationand flooding under both the 2100 and 2050 sea level rise scenarios.
The upland habitats south of the salt ponds may not experience inundation in either 2050 or2100. However, the areas could experience significant periodic flooding during both scenarioyears, depending on the functioning and height of the salt pond levees.
The Least Tern nesting habitat in the airport will not be exposed except under the 2100Extreme Event scenario.
Other Least Tern nesting habitat throughout the planning area, including Navy managed sites,the D street fill and the Navy’s mitigation wildlife island, are likely to be exposed under the2100 Extreme Event scenario.
Habitat shift is an expected outcome of exposure to inundation. Habitat shift on San Diego Bay has beenevaluated through a SLAMM (Sea Level Rise Affecting Marshes Model) model run developed by Dr. RickGersberg at San Diego State University. Although there is uncertainty in the results of the SLAMM, themodel does provide information on the range of habitat shifts that are possible for different ecosystemtypes. The model shows a decline in intertidal ecosystems as a whole, as well as upland habitatdeclines. Subtidal ecosystems are expected to expand as existing salt marsh is inundated.
SensitivityWhile coastal ecosystems are generally not impaired byperiodic flooding events, they are highly sensitive to longterm changes in sea level. Ecosystems are highly dependenton specific patterns of tidal fluctuation, water salinity, watertemperature, sediment erosion and accretion, sedimentsaturation, interaction with the water table, and interactionwith riverine freshwater sources. When these conditionschange significantly over an extended period of time—as isseen with rising water levels—many coastal ecosystems andhabitat cannot be sustained in place. Intertidal and uplandecosystems are particularly sensitive to these types ofchanges. Subtidal ecosystems are less sensitive, since theyare already submerged, but they may be sensitive both toimpaired water quality from the loss of adjacent wetlandsand to increased water depths that change temperature andsalinity.
Figure 4.2 Eelgrass provides importanthabitat for such species as the Bay Pipefish
In addition to the sea level rise related factors described above, San Diego Bay ecosystems are mademore sensitive to inundation by human activities in the region. Neighboring development contributes tothe degraded water quality of the Bay and reduces the amount of necessary sediment that the areasreceive. Pollutants from runoff and from contaminated sites contribute to the sensitivity of thesehabitats. Specifically, there are 274 water body segments in the area listed as impaired through the
30
Clean Water Act (303(d) List). Adverse conditions related to both sea level rise and regionaldevelopment make San Diego Bay ecosystems highly sensitive to inundation and related habitatpressure. In the future, a more finely tuned SLAMM analysis with refined sediment transport analysiscould provide a better quantified sensitivity level.
Adaptive Capacity Ecosystems and habitat around the Bay have some capacity to cope with periodic flooding in the nearterm, but limited capacity to adapt to regular, sustained inundation. With regards to short term copingcapacity, intertidal ecosystems are already resilient to periodic high water levels that result from springtides, El Niño events, and storm surge. Similarly, upland plants generally are tolerant to salt sprayoccurring during high water events. What is unclear is how much more frequently these periodic eventscan occur before a threshold is reached in terms of flood coping capacity.
In their natural state, the types of ecosystems found on San Diego Bay generally also have a highcapacity to adapt to regularly occurring inundation. A key adaptive response is to migrate to higherelevations where tidal dynamics and salinity are similar to the previous location before sea level rise.However, this adaptive response is not available to many ecosystems on San Diego Bay, becauseadjacent, higher elevation lands have been intensively developed over the past century. For example,coastal salt marsh in the Sweetwater Marsh and Paradise Creek Marsh areas may be pressured to shifteastward, but will be unable to do so as it encounters hardened shoreline at Interstate 5 and adjacentdeveloped areas. This dynamic is likely to play out in intertidal and upland ecosystems throughout theregion, resulting in low natural adaptive capacity for many ecosystem and habitat types, and for thespecies that rely on them.
Adaptive capacity is improved by the civic and institutional assets available for natural resourcemanagement in the region. These include designation of South Bay as a National Wildlife Refuge,managed by US Fish and Wildlife Service; capacity building and research activities at Tijuana RiverNational Estuarine Research Reserve (TRNERR); an active environmental community; and a generalpopulation that values the region’s natural resources. In spite of these assets, the overall adaptivecapacity of Bay ecosystems and critical species is limited.
Overall, the vulnerability of ecosystems and critical species to inundation and habitat loss generally isvery high, due to extensive exposure, high sensitivity, and low adaptive capacity. Intertidal and uplandecosystems and resident species are especially vulnerable to these impacts.
Targeted Strategies
The following strategies are options for addressing the flooding, inundation, and habitat lossvulnerabilities of ecosystems and critical species, as prioritized by the Stakeholder Working Group andTechnical Advisory Committee.
1) Strive to create habitat mitigation projects that are resilient to sea level rise. Evaluate howmitigation projects will be affected and encourage acquisition of upland areas also when analysisindicates that acquired nearshore habitat will be lost to sea level rise.
2) Expand or preserve ecological buffers around development, where feasible, to allow for inlandmigration of ecosystems and habitats.
31

3) Promote soft and hard low impact development (LID) strategies to reduce stormwater runoff andprotect water quality.
4) Evaluate threats to habitat connectivity, and protect habitat corridors to facilitate species shift toviable adjacent habitat as an adaptive response to sea level rise.
Primary Vulnerability – Erosion
Sea level rise related erosion poses a threat to upland and subtidal ecosystems of San Diego Bay.Erosion depends in part on the amount of along shore transport caused by water flow, the frequencyand intensity of storms, the amount of re supply (i.e. sand or soil) available, as well as the managementpractices and planning decisions. Taken together these factors indicate that higher sea levels are likelyto result in increased erosion in upland ecosystems, bringing more sediment and turbidity to fragileshallow water ecosystems.
SensitivityMost completely natural, unaltered environments would not be greatly impaired by erosion. Anexception is a narrow dune system bordered by both ocean and Bay waters—such as that found onSilver Strand—which would have a higher sensitivity even in a natural state. Ecosystems around theBay, however, are more sensitive to erosion due to human activity in the region. Neighboringdevelopment and ever increasing development pressure make upland ecosystems more sensitive, whilethe lack of natural buffers and the presence of contaminated sediments make subtidal ecosystems moresensitive. The Bay’s sediment is contaminated by a variety of different toxins including copper, mercury,PAHs, PCBs, and zinc. These toxins, which resulted in 20 federal listings of the Bay’s sediments beingimpaired according to the Clean Water Act (303(d) List), pose a serious threat to the health of thesubtidal aquatic ecosystem. These factors suggest that upland and subtidal ecosystems are moderatelysensitive to erosion. Further research around the area’s erosion and sediment transport processes andaquatic species’ ability to tolerate certain turbidity levels could provide a more precise sensitivity level.
Adaptive Capacity Upland ecosystems have a very limited capacity to adapt to systemic erosion over the long term. Thesubtidal system has mechanisms that currently help it to cope with the amount of erosion itexperiences. A dramatic increase in erosion, however, could bring its adaptive capacity to a tippingpoint and prevent the system from functioning in the way it currently does. The governmental and socialassets describing in the inundation section – state and federal resource management agencies, localnonprofits and citizen concern – may help build ecosystem adaptive capacity. Specifically, theimplementation of the Otay River Habitat Restoration Plan and the pending completion of the Sub AreaManagement Plan (SAMP) for the Otay watershed could reduce erosion and enhance accretion of saltmarsh habitat. This system’s ability to maintain its current dynamics is relatively low, and although thenatural environment is likely to evolve into a new steady state, it may not be one that can maintain thearea’s valued species or supply the region with other highly valued ecosystem services.
The overall vulnerability of the upland ecosystems to erosion is very high due to definite futureexposure, high sensitivity and low adaptive capacity. The vulnerability of subtidal ecosystems is moremoderate, due to lower sensitivity to erosion and greater adaptive capacity.
32

Targeted Strategies
The following strategies are options for addressing the erosion vulnerabilities of ecosystems and criticalspecies, as prioritized by the Stakeholder Working Group and Technical Advisory Committee.
1) Pursue research on sediment transport dynamics that improves understanding of both erosionand sedimentation. Adjust sediment management practices in response to research findings.
2) Improve the health of wetlands that provide natural buffers between sediments and subtidalhabitat.
33

Primary Vulnerabilities
Hazardous waste sites are ooding events as storage
ccording to the databases of the California Department of Toxic Substance Control and the California
Tow Basin Facility, covering 1.41 acres in Harbor Island East Basin in San Diego.e homeporting
d
ill (Formerly PACO terminals) located in National City near
ter.12
San Diego International
a 5.7 acre underwater confined disposal facility (CDF) site in the northern part of
p site under the Convention Center expansion.
rimary Vulnerability – Flooding and Inundation
looding and inundation pose a threat to hazardous waste sites throughout the San Diego Bay region.
xposureanalysis indicates that potential flooding and inundation in 2050 would expose a very
Contaminated Sites
AWater Resources Control Board, there are more than 400 sites in the planning area that have undergonereview or clean up for being contaminated. These sites include operating hazardous waste sites, schoolclean up sites, voluntary clean up sites, leaking underground storage tanks (LUST), and others. Amongthese sites, local stakeholders have articulated concerns about the following:
Several waste sites located at Naval Air Station North Island (NASNI), including thpier, Installation Restoration (IR) Site 9 (commonly referred to as fiery marsh), and the North IslanHazardous Waste Facility Complex.10
The 24th Street Marine Terminal Landfthe intersection of Terminal Avenue and West 32nd Street.11
Campbell’s Shipyard, located just south of the convention cenThe former Teledyne Ryan Aeronautical (TRA) facility adjacent to theAirport.13
Convair Lagoon,the Bay near the airport.The former San Diego dum
highly vulnerable to major fltanks in the area could be opened or moved, or motors and pumps could beimpaired, thus releasing contamination into flood waters or area soils.
P
FThis section describes the vulnerability of the system as a whole in terms of exposure, sensitivity, andadaptive capacity looking specifically at exposure to both flooding and inundation under the variousplanning scenarios, as shown in Maps 5 8 in Appendix III.
EGIS exposurelimited number of contaminated sites, and none of the sites of stakeholder concern. Inundation andflooding under the 2100 sea level rise scenarios could affect many more sites, including 24th StreetMarine Terminal Landfill, Campbell’s Shipyard, TRA, the former San Diego dump site, and several NavalAir Station North Island sites.
10 80001272 in EnviroStor 11 L10005363930 in GeoTracker (http://www.geotracker.swrcb.ca.gov/)12 T0607391327 in GeoTracker 13 SL209054180 in GeoTracker
34

SensitivityThe strict regulatory process that governs hazardous waste clean up and management greatly affectsthe system as a whole. Generally, these high standards help to ensure that sites are thoroughly cleanedup and well managed; however, sites are not required to be cleaned up to a 100% standard and thereare trace levels left behind. The high level of rigor involved in this process greatly reduces the system’soverall sensitivity, helping to ensure that few factors (including shifts in environmental conditions) willcause regional problems.
Adaptive Capacity This system as a whole has a number of regulatory, technological, and civic resources available to help itadapt. Despite these resources, the system could be overwhelmed by significant amounts of floodingand the lack of financial resources available to achieve a high enough level of clean up, and there wasdisagreement among technical advisors on adaptive capacity. Acknowledging this, the system ofcontaminated sites could be said to have a medium level of adaptive capacity.
Due to limited exposure, low sensitivity, and moderate adaptive capacity, the overall vulnerability ofcontaminated sites to flooding and inundation is low to moderate.
Targeted Strategies
The following strategies are options for addressing the flooding and inundation vulnerabilities ofcontaminated sites, as prioritized by the Stakeholder Working Group and Technical Advisory Committee.
1) Conduct a targeted assessment of specific high risk contaminated sites, resulting in a map ofthese sites and utilize findings to prioritize adaptation responses where sites are vulnerable.
2) Conduct an improved regional assessment, in conjunction with the Navy, focused on thedifferent types of sites and their specific vulnerabilities to future conditions.
3) In new remediation, ensure that BMPs are designed to be resilient to end of century sea levelrise.
35

Stormwater Management
The stormwater management system in the San Diego Bay area consists of storm drains and a variety ofbest management practices (BMPs) that are designed to manage the volume, flow, and water quality ofrunoff during storm events. These BMPs include detention ponds, in line BMPs that restrict runoff flowinside the storm drain, and infiltration BMPs—such as bioswales and rain gardens—that allow runoff topercolate into the ground instead of entering the storm drain system. Stormwater systems in the areaare municipal separate storm sewer systems, which convey runoff separately from wastewater. Thesesystems are designed, constructed, and operated by the individual local jurisdictions on the Bay.
Primary Vulnerabilities
In all scenarios, storm sewers are very vulnerable to flooding and inundation ofBay drain outfalls due to higher sea levels, a condition that would result inlocalized flooding in very low lying inland areas.
This vulnerability will be compounded during storm conditions, when runoff inthese drains would be obstructed by inundated outfalls, resulting in backwaterflooding in low lying areas.
Primary Vulnerability—Flooding and Inundation
The stormwater management system is vulnerable to impacts relating to flooding and inundation. Thisanalysis addresses impacts on the stormwater system and the system’s ability to minimize flooding andprotect water quality; it does not evaluate all the impacts of storm related flooding on other systemssuch as buildings. This section describes the vulnerability of the stormwater management system interms of exposure, sensitivity, and adaptive capacity to flooding and inundation.
ExposureThe primary exposure concern is the inundation ofstorm drain outfalls on the Bay as sea level rises.Under high water conditions, water from the Bay flowsthrough the outlet into the storm drain to the currentsea level elevation. These conditions are exacerbatedduring storms, when stormwater runoff cannot draindue to inundation of the Bay outlets. This dynamic isof particular concern in inland areas located at orbelow sea level with shallow, minimally slopeddrainage systems, and some areas already haveoutfalls that are tidally influenced, including parts ofthe Airport and Midway districts, Shelter Island Drive,National City near Kimball Elementary School, andparts of Coronado generally within 100 feet of theshoreline.
Figure 4.3. Flooded Storm Drain Outfall. 01.20.11,morning : ~7.2 feet above mean low tide.
36

It is beyond the scope of this project to assemble comprehensive GIS data on storm drain elevation andevaluate site specific exposure under the four planning scenarios. However, as described above, manysites are already exposed, and technical advisors expect the number of exposed sites to multiply underthe 2050 scenarios.
The Chula Vista Bayfront is a notable exception. Plans for the redevelopment of the Bayfront call forelevating infrastructure to allow for gravity flow to higher outfalls that would not be submerged,thereby reducing their exposure. This response is designed to mitigate a 19 inch sea level rise by the2050 timeframe. Even with this effort, several advisors concluded that the 2100 scenarios would resultin systemic inundation of drainage systems across the Bay region.
SensitivityStormwater management systems described above would be highly sensitive to inundation, particularlyduring storm events. Drainage systems will be impaired and flooding likely will result if drains areobstructed for a significant period of time.
Adaptive Capacity Technical advisors consider the adaptive capacity of the stormwater system to be very low. In the shortterm, the system cannot cope with obstructed outfalls and flooding could persist until they areunobstructed. In the longer term, adaptation could require expensive reconstruction of drainagesystems and financial resources are limited. However, advisors noted that well established standardsand governance structures, as well as civic support for improving water quality, could support adaptivecapacity in the long run.
In conclusion, the stormwater management system in the Bay region is highly vulnerable to flooding andinundation impacts from sea level rise.
Targeted Strategies
The following strategies are options for addressing the flooding and inundation vulnerabilities ofstormwater management facilities, as prioritized by the Stakeholder Working Group and TechnicalAdvisory Committee.
1) Prioritize low impact development (LID) stormwater practices that encourage infiltration tominimize reliance on storm sewers that could be impaired by SLR.
2) Update stormwater management plans and capital improvement programs to account for sealevel rise related challenges such as flooded Bay outfalls. Include strategic consideration ofsystemic reconstruction of stormwater facilities in the later century timeframe.
3) Develop a detailed vulnerability assessment of stormwater management at the facility level forthe most at risk facilities, including drain outfalls and areas that could be exposed to localizedflooding from Bay water inflow into drains.
4) Increase capacity of stormwater management facilities to accommodate more common andmore extensive coastal flooding.
37
WastewaterThe regional wastewater system consists of facilities that collect and treat wastewater. Wastewatercollection infrastructure in the planning area includes gravity mains, force mains, pump stations, holdingtanks, and metering stations. There are no treatment facilities in the planning area. Local sanitarysewers are operated by each of the cities and fed into a regional collection system operated by the Cityof San Diego’s Metropolitan Wastewater District (MWD). Port lands are served by these city operatedsewers within each city’s boundaries.
Primary Vulnerabilities
Sanitary sewers in low lying locations will be vulnerable to flooding and couldexceed their capacity during the 2050 Extreme Event scenario, potentially resultingin discharge of wastewater into the Bay.
The entire wastewater collection system in the planning area will be vulnerable toinundation impacts by 2100.
Primary Vulnerability—Flooding and Inundation
The sanitary sewer system is vulnerable to future flooding and inundation impacts. This sectiondescribes the vulnerability of major system components in terms of exposure, sensitivity, and adaptivecapacity under the four planning scenarios.
ExposureBuried sewer infrastructure will be exposed to surface flooding under each of the planning scenarios.Sewer mains buried below flooded areas will be exposed to the extent that they are susceptible toinflow, where flood waters penetrate through manholes and other surface components. In 2050, it islikely that exposure to periodic flooding will be the main concern. In 2100, perhaps hundreds of linearmiles of mains would be exposed below inundated lands on a daily basis. In addition to sewer mains,many pump stations and metering stations are buried in potentially exposed areas. Several pumpstations are located in above ground buildings that could be exposed to flooding as well. GIS analysiswas performed to determine potentially exposed pump stations and metering stations under the fourplanning scenarios; the region’s most significant facilities—Pump Stations 1, 2, 4, and the TransbayPump Station—are not exposed in 2050, but are exposed in 2100. Exposure is also shown in Maps 9 and10 in Appendix III.
SensitivityComponents of the wastewater collection system would be sensitive to flooding or flood related inflowif exposed. Gravity sewer mains are more sensitive to inflow than potable water mains because they arenot pressurized. Significant floodwater inflow into sewer mains would cause their flow capacity to beexceeded, resulting in sewage backups potentially overflowing out of manholes and through stormdrains into the Bay. Wastewater collection would be similarly impaired by pump station damage fromexposure to floodwaters if conveyance was interrupted. Segments of the sanitary sewer not directlyexposed to flooding would still be sensitive to impacts “downstream” due to the linear nature of thesystem. If exposed to severe flooding or inundation, the ability of the area’s sewer systems to performtheir function in a way that protects public health and water quality could be seriously compromised.
38
Adaptive Capacity In the short term, the wastewater collection system’s ability to cope with flooding impacts is very low.Wastewater is conveyed through a linear system with a series of “chokepoints” and if a part of thissystem is impaired, there is little redundancy in the system to rely on. Over the longer term, the systemmay benefit from substantial assets related to governance, environmental advocacy, and technologythat may enable adaptive measures such as increased preventive maintenance, construction of overflowtanks, or reconstruction of mains.
Overall Vulnerability to Flooding and Inundation Above ground facilities are not very vulnerable to surface flooding and inundation until the 2100scenarios.14 Buried infrastructure will be vulnerable to periodic floodwater inflow in limited areas in the2050 Extreme Event scenario, and would be vulnerable to inflow from regularly occurring inundation inmany areas by 2100.
Targeted Strategies
The following strategies are options for addressing the flooding and inundation vulnerabilities ofwastewater management facilities, as prioritized by the Stakeholder Working Group and TechnicalAdvisory Committee.
1) Update wastewater management plans and capital improvement programs to account for sealevel rise related challenges.
2) Develop a detailed vulnerability assessment of wastewater facilities including future sea levelrise impacts for the most at risk facilities, and work towards a map of these facilities.
3) Update wastewater emergency response and maintenance procedures to account for morecommon and more extensive coastal flooding of vulnerable infrastructure.
4) Depending on facility design, elevate pump stations and emergency generators as they arerehabilitated or in new construction.
5) Ensure that new sewer mains and manholes are sealed against floodwater inflow andgroundwater infiltration. Expand programs to reduce inflow and infiltration throughrehabilitation of sewer mains and manholes, prioritizing areas where risk of flooding is highest.
14 City of Imperial Beach and City of National City above ground facilities were not evaluated in detail due tounavailability of data.
39

Potable Water Potable water systems in the planning area consist of distribution facilities such as pressurized watermains, pressure reducing valves, and meter vaults. The only water source in the planning area isgroundwater drawn from the San Diego Formation aquifer by the Sweetwater Authority. There are nowater collection facilities (such as reservoirs) or water purification facilities. Potable water distributionis operated by the City of San Diego within San Diego city limits, the Sweetwater Authority in Chula Vistaand National City, and California American Water in Imperial Beach, Coronado, and a small part ofsouthwest Chula Vista. Port lands are also served by these entities.
Primary Vulnerabilities
Above ground water distribution components such as valves, meters, and servicepoints will be vulnerable to flooding and inundation, particularly in the 2100timeframe when more components are likely to be exposed to regularly occurringinundation.
Primary Vulnerability – Flooding and Inundation
The potable water system is moderately vulnerable to flooding and inundation in the 2050 scenarios,and more vulnerable in the 2100 scenarios. Much of the potable water distribution system is buriedunderground and would not be exposed to surface flooding. However, some components such ashydrants, valves, service access, and meters could be exposed under the four planning scenarios. Dataon the location of these components was not available for the entire planning area. However, ananalysis performed by the City of San Diego Public Utilities Department found that 12 hydrants, 77service points, 30 valves, and 28 meters in the planning area could be exposed in a 2050 “dailyconditions” scenario. While a complete spatial analysis of the region could not be performed, floodexposure in the 2050 scenarios would appear to be minor relative to the total number of facilities in thecoastal area.
Exposed mechanical equipment in the waterdistribution system would be sensitive to theflooding impacts. In the short term, however,the capacity of the broader system to adapt toperiodic flooding is good, due to the ability toisolate impaired parts of the distributionsystem and maintain service to the rest. Thesystem does not have capacity to cope withregular, daily inundation. Over the longerterm, the system’s adaptive capacity maybenefit from access to substantial resourcesassociated with being one of the most criticalfacilities in the region.
Figure 4.4. Construction in pipe trenches,Coronado. 02.17.11, 8:50am : ~6.7 feet abovemean low tide.
40

Overall, the area’s potable water systems are not very vulnerable to flooding impacts in the 2050timeframe, as exposure is likely to be limited and adaptive capacity is substantial. Vulnerability in the2100 timeframe is likely to be high, however, as more of the system is exposed to daily inundation.
Targeted Strategies
The following strategies are options for addressing the flooding and inundation vulnerabilities ofpotable water facilities, as prioritized by the Stakeholder Working Group and Technical AdvisoryCommittee.
1) Develop a detailed vulnerability assessment of potable water facilities including future sea levelrise impacts for the most at risk facilities. Evaluate the flood resistance of specific mechanicalequipment in areas vulnerable to future SLR related flooding.
2) Update potable water emergency response and maintenance procedures to account for morecommon and more extensive coastal flooding in vulnerable areas.
41
Energy Facilities Energy facilities in the San Diego Bay area consist mostly of electricity and natural gas transmission anddistribution systems. High voltage transmission lines run north south near the eastern shore of the Bay,above ground in many areas and buried in the vicinity of the Chula Vista bayfront. Lower voltagedistribution lines are located throughout the planning area. Additionally there are several electricalsubstations around the Bay. There are no major electricity generation facilities in the area; the SouthBay Power Plant on the southern Chula Vista bayfront was taken out of operation in January 2011.Natural gas infrastructure includes pressurized distribution lines and auxiliary equipment such asmaintenance stations and meters. San Diego Gas and Electric (SDG&E) is the primary provider ofelectricity and natural gas throughout the San Diego region, including in the Bay cities and Port lands.
Primary Vulnerabilities
Above ground electricity transmission and distribution in limited areas will bevulnerable to erosion, particularly after 2050 and during major storm events.Erosion could undermine infrastructure, causing outages or safety issues.
Above ground electricity transmission and distribution will be moderatelyvulnerable to flooding and inundation, particularly in the 2100 timeframe whenmore components are likely to be exposed to regularly occurring flood events.
Primary Vulnerability—Erosion
ExposureLocal electricity distribution is likely to be the component of the energy sector most exposed to erosion,as most high voltage regional transmission and gas distribution is either buried or well protected fromflooding. The extent of exposure to erosion in the future is unknown due in part to the fact that theamount of future erosion is related to the management practices and planning decisions yet to be made.However, most energy infrastructure in the coastal area is adjacent to hardened shoreline, which is lessaffected by erosion, so exposure will likely be limited to such areas as beaches and open space that havenon hardened shorelines. In addition to shoreline erosion, local distribution lines may be affected byerosion caused by storm related runoff and localized flooding in inland areas such as the Midway andthe Paradise Creek area; storm related flooding is likely to be exacerbated by higher Bay water levelsimpairing storm drains.
SensitivityErosion can wash away supporting soils around utility poles and protective fences, causing serioussystem wide impacts that could require significant time and expense to repair. Additionally, theseimpacts could cause safety concerns such as fire for nearby communities.
Adaptive Capacity In the short term, parts of the system are able to cope with erosion events; for example, substation sitesare graded to divert waters away from facilities and to prevent erosion. However, the system’s longterm adaptive capacity is low because primary solutions such as relocation are very costly and couldrequire the de energization of affected facilities.
42

The overall vulnerability of energy facilities to erosion is somewhat unclear, due to a lack ofunderstanding of the location, timing, and severity of exposure. However, much of the system will beprotected, particularly in the 2050 timeframe. As exposure to erosion expands later in the century, thesystem will be highly sensitive and not very adaptable, and is likely to be very vulnerable as a result.
Primary Vulnerability—Flooding and Inundation
ExposureThe exact flooding exposure locations have not been identified for this assessment due to theunavailability of spatial data for the electricity and natural gas systems. However, generally the systemis not significantly exposed in either of the 2050 planning scenarios. In 2100, electricity transmissionand distribution could be exposed during both daily conditions and extreme events, including parts ofthe high voltage line on the eastern Bay shoreline.
SensitivityThe electricity transmission and distribution system is only moderately sensitive to flooding. Energizedequipment is not at ground level and is structurally engineered to withstand some flood events, sominor flooding is not expected to cause equipment failure. However, as the number and severity offlooding events increase later in the century, the system may become more impaired.
Adaptive Capacity In the short term, the electric facilities system has a high coping capacity because underground andoverhead utility structures and energized lines are designed to withstand a flood event current minorflood events. However, the long term adaptive capacity options for this system are highly costly andinclude the relocation of lines and potentially the need to de energize facilities.
Overall Vulnerability to Flooding and Inundation It is not possible to judge the exact electric facilities system’s overall vulnerability to flooding andinundation, due to a lack of comprehensive data on the location of specific facilities. Vulnerability islikely to spike during major storm and high water events, with vulnerability increasing after the midcentury timeframe. When infrastructure is exposed, it will be moderately sensitive and not veryadaptable, and is likely to be moderately vulnerable as a result.
Targeted Strategy
The following strategy is an option for addressing the flooding, inundation, and erosion vulnerabilitiesof energy facilities.
1) Work with SDG&E to evaluate site specific vulnerabilities of energy infrastructure, and to designnew facilities to be resilient to end of century sea level rise.
43

Local Transportation Facilities Transportation facilities in the planning area include roads, transit facilities, marine facilities, and SanDiego International Airport (SDIA), which is addressed in the Regional Airport Operations section of thisassessment. Because planning for state roads and transit facilities are under SANDAG jurisdiction andmarine facilities are exclusively under Port jurisdiction, this section focuses on facilities under localcontrol, namely local roads.
Primary Vulnerabilities
Local transportation facilities will be vulnerable to flooding and inundation,particularly in the 2100 timeframe when more components are likely to beexposed to regularly occurring inundation.
Primary Vulnerability—Flooding and Inundation
ExposureLocal roads are not at great risk of exposure in the 2050 time frame, but are likely to be impacted inevery Bay jurisdiction by 2100. Major local roads that could be exposed are described in Table 4.1.
SensitivityTransportation facilities are sensitive to flood related impacts, as the access function of roads would beimpaired if exposed to flooding. Local transportation systems as a whole would be less sensitive,however, as most traffic could be re routed onto unaffected streets. In the 2100 Daily Conditionsscenario, access on significant local streets could be permanently impaired and would be very sensitiveto regular inundation.
Adaptive Capacity Local streets do not have significant capacity to cope with flooding and inundation when they areexposed. Over the longer term, adaptive capacity is also minimal. Potential adaptive responses arelimited because local access streets in hazardous areas cannot be relocated; by their nature, they mustbe located to serve development where it exists, even if in flood prone areas. Overall, adaptive capacityof local transportation facilities is very low.
Due to limited exposure, vulnerability of local transportation facilities around San Diego Bay in the 2050timeframe is low, though specific facilities noted in the table above are more vulnerable. In laterscenarios, vulnerability is high as more facilities are exposed, and because sensitivity is high andadaptive capacity is very low.
44

Table 4.1 Exposure of Significant Local Transportation Facilities
2050 Daily Conditions 2050 Extreme Event 2100 Daily Conditions 2100 Extreme Event
None National City—18th
and 24th Streets atParadise Creek
National City—18th and24th Streets at ParadiseCreek
San Diego—ShelterIsland Drive at ShelterIsland entrance
San Diego—N. HarborDrive at Laurel St.
San Diego—HarborDrive between W.Market St. and 5th Ave.
Chula Vista—parts ofthe Bayfront, dependingon form ofredevelopment
National City—18th and24th Streets at ParadiseCreek
San Diego—Shelter IslandDrive at Shelter Islandentrance
San Diego—Multiplestreets in the Midway
San Diego—Most of N.Harbor Drive
San Diego—Harbor Drivebetween W. Market St.and 5th Ave.
Chula Vista—parts of theBayfront, depending onform of redevelopment
Targeted Strategies
The following strategies are options for addressing the flooding and inundation vulnerabilities of localtransportation facilities, as prioritized by the Stakeholder Working Group and Technical AdvisoryCommittee.
1) Design new local transportation projects to be resilient to sea level rise. Consider policies thatrequire sea level rise to be factored into the design of all transportation projects and majorrepairs in areas vulnerable to flooding over the life of the project.
2) Work with SANDAG and Caltrans to evaluate the vulnerabilities of existing regionaltransportation facilities and to consider adaptation in the design of new facilities and inimprovements to existing infrastructure in vulnerable areas.
3) Monitor changes in design standards relating to drainage, and consider applying floodplain levelstandards in areas vulnerable to flooding in the life of the project but that may not be in existing100 year floodplain.
45

Building Stock Residential buildings in the planning area are concentrated in the San Diego Barrio Logan, National City,and Coronado areas. Other concentrations of residential buildings are the Imperial Beach BernardoShores RV Park and senior housing in the San Diego Midway area. High density housing is planned forthe Chula Vista Bayfront and the San Diego Centre City area. Housing is not an allowable use on Portmanaged lands. For the purposes of this assessment, “commercial” buildings are all non residentialoccupied structures, including office, retail, hospitality, institutional, and industrial uses. The AdaptationStrategy does not address structures or operations on Port managed lands, because the Port ispreparing a Climate Mitigation and Adaptation Plan accounting for these facilities. Therefore, thissection only evaluates vulnerabilities of buildings under City jurisdiction.
Primary Vulnerabilities
The building stock has a low vulnerability to flooding and inundation in the 2050scenarios due to limited exposure. Buildings are highly vulnerable to flooding andinundation in the 2100 scenarios as exposure expands to large portions ofresidential neighborhoods and major commercial districts.
Primary Vulnerability—Flooding and Inundation
The building stock in the planning area is vulnerable to flooding and inundation impacts. This sectiondescribes the vulnerability of commercial buildings in terms of exposure, sensitivity, and adaptivecapacity under the four planning scenarios.
ExposureIn the 2050 planning scenarios, floodingaffects very few commercial facilitiesunder City jurisdiction, primarily inNational City at Kimball School and autoshops near Paradise Creek and HooverAvenue. In the 2100 planning scenarios,exposed facilities multiply considerably. InSan Diego, commercial buildings on bothsides of the Naval Boat Channel and in theMidway District are affected, particularlyeast of Rosecrans Street. The north side ofHarbor Drive is exposed from MarketStreet to the railyards, including suchcommercial facilities as Petco Park stadiumand multiple large hotels.
In Chula Vista, much of the Bayfrontredevelopment area is exposed to floodingin the 2100 scenarios; most commercialuses in the Bayfront redevelopment will be
Figure 4.5 Hotel in Downtown San Diego. 01.20.11, 8:20am :~7.1 feet above mean low tide.
46

under Port jurisdiction, however. One exception that is exposed in the 2100 scenarios is the GoodrichAerostructures manufacturing facility. Commercial building exposure to flooding and inundation isshown in Maps 11 14 in Appendix III.
Residential exposure in each of the planning scenarios is shown in Maps 15 18 in Appendix III. Very fewresidential neighborhoods are exposed in the 2050 planning scenarios; one potential area of concern isthe Coronado Cays, but more analysis is needed to ascertain the effect of existing shoreline protectioninfrastructure in this area. In the 2100 scenarios, exposure occurs in the following residential areas:
San Diego
East of Rosecrans Street, near Southwestern Yacht Club
Multi family neighborhood in the Midway district, north of Barnett Street and east ofRosecrans Street
Multi family buildings north of Harbor DriveNational City
Single family neighborhood west of Paradise Creek, near Interstate 5Chula Vista
Residential areas in the BayfrontImperial Beach
Part of the Bernardo Shores RV park
Single family homes on 7th Street and 8th StreetCoronado
Coronado Cays
All housing on the east side of 1st Street
SensitivityBuilding sensitivity depends to a large degree on design and construction techniques, as set forth inbuilding codes and standards. By participating in FEMA’s National Flood Insurance Program (NFIP), all ofthe local jurisdictions have been required to adopt minimum building standards for flooding. Floodrelated building codes were not standardized prior to NFIP requirements, which took effect in 1968. Asa result, some structures built before 1968 will be more sensitive to flooding than their successors. Oneestimate concludes that buildings pre dating NFIP experience 70 percent more damage on average thanpost NFIP buildings when exposed to flooding.15 This contrast suggests that year of construction is animportant indicator of flood sensitivity. Of the exposed commercial buildings described above, almostall were constructed after 1968, with few exceptions in the lower Gaslamp area near Harbor Drive andat the Goodrich Aerostructures site. Older, more flood sensitive homes are found in the Paradise Creekarea in National City and 1st Street in Coronado. While these areas are likely to be most sensitive, allbuildings are likely to be impaired if exposed to flooding.
Adaptive Capacity Generally, buildings in the San Diego Bay area do not have the ability to cope with flooding in the shortterm. Over the longer term, individual building owners exposed to inundation will struggle to adapt astheir property becomes unviable. The NFIP provides insurance for property owners in the case offlooding, but few models currently exist for allowing property owners to recover their losses and
15 Thompson, A., Katzman, G., and Johann, M.A., “Building Design for Extreme Events.” Structure. National
Council of Structural Engineering Associations, May 2007.
47

relocate as their property succumbs to inundation. For these reasons, the adaptive capacity of thebuilding stock is very low.
Overall Vulnerability to Flooding and Inundation In the 2050 scenarios, buildings under City jurisdiction have a low vulnerability to flooding andinundation due to limited exposure. In the 2100 scenarios, the building stocks become highly vulnerableas exposure becomes widespread and affects major commercial facilities. Vulnerability is heighteneddue to high sensitivity and low adaptive capacity to flooding and inundation impacts.
Targeted Strategies
The following strategies are options for addressing the flooding and inundation vulnerabilities of thebuilding stock, as prioritized by the Stakeholder Working Group and Technical Advisory Committee.
1) In areas vulnerable to projected SLR related flooding and in the existing 100 year floodplain,consider strengthening floodplain management regulations through participation in the FEMACommunity Rating System or through incorporation of more flood resistant building codeprovisions.
2) Work with FEMA to improve Flood Insurance Rate Maps (FIRMs) and create additional mapsthat include future sea level rise.
3) Create financial incentives for buildings constructed to higher standards.
4) Create a real estate disclosure statement that requires more explicit statements regardingfuture risks.
5) Develop, enhance and distribute outreach and education materials for building owners andtenants in flood prone areas.
6) Gather more specific elevation data creating a better understanding of current base floorbuilding elevations.
7) In areas vulnerable to projected SLR related flooding that are not in the existing 100 yearfloodplain, consider applying NFIP minimum requirements to new development.
48

Emergency Response FacilitiesEmergency response facilities evaluated in this assessment consist of police and fire stations operatedby the 5 Bay cities, as well as hospitals with emergency care facilities in the planning area.
Primary Vulnerabilities
Fire stations in San Diego and Coronado are moderately vulnerable to flooding inthe 2100 Extreme Event scenario.
Primary Vulnerability—Flooding
Emergency response facilities are moderately vulnerable to flooding impacts. Flood exposure is limitedto the 2100 Extreme Event scenario. Potentially affected facilities are Coronado Fire Station 14 (nearCoronado Cays) and San Diego Fire Station 20 (in the Midway District), as shown in Maps 19 and 20 inAppendix III. These fire stations would be very sensitive to flooding when exposed. In addition tobuilding damage, the stations could be impaired by damage to equipment and flooding of streetsaccessing the facility. In the short term, the coping capacity of emergency response facilities ismoderate. Exposure occurs during a rare extreme event, not on a regular basis, so the system would becoping with a temporary impact. Until flooding subsided, emergency response services could besupplemented from nearby stations. Over the longer term, resources would likely be available torelocate the fire stations serving these communities out of flood exposed areas, so adaptive capacity inthis respect is high.
The vulnerability of emergency response facilities to sea level rise is low. Exposure is limited to floodingimpacts during extreme events in the 2100 timeframe. Sensitivity of affected facilities is high, butmechanisms to cope with a facility outage are available, and stations could be relocated out of the floodarea.
Targeted Strategies
The following strategies are options for addressing the flooding vulnerabilities of emergency responsefacilities, as prioritized by the Stakeholder Working Group and Technical Advisory Committee.
1) Set higher standards for all emergency response facilities that could be exposed to floodingduring their life span.
2) Gather more specific information about each critical facility and ensure that a regional databasecontains key information on flood heights and building elevation levels.
49
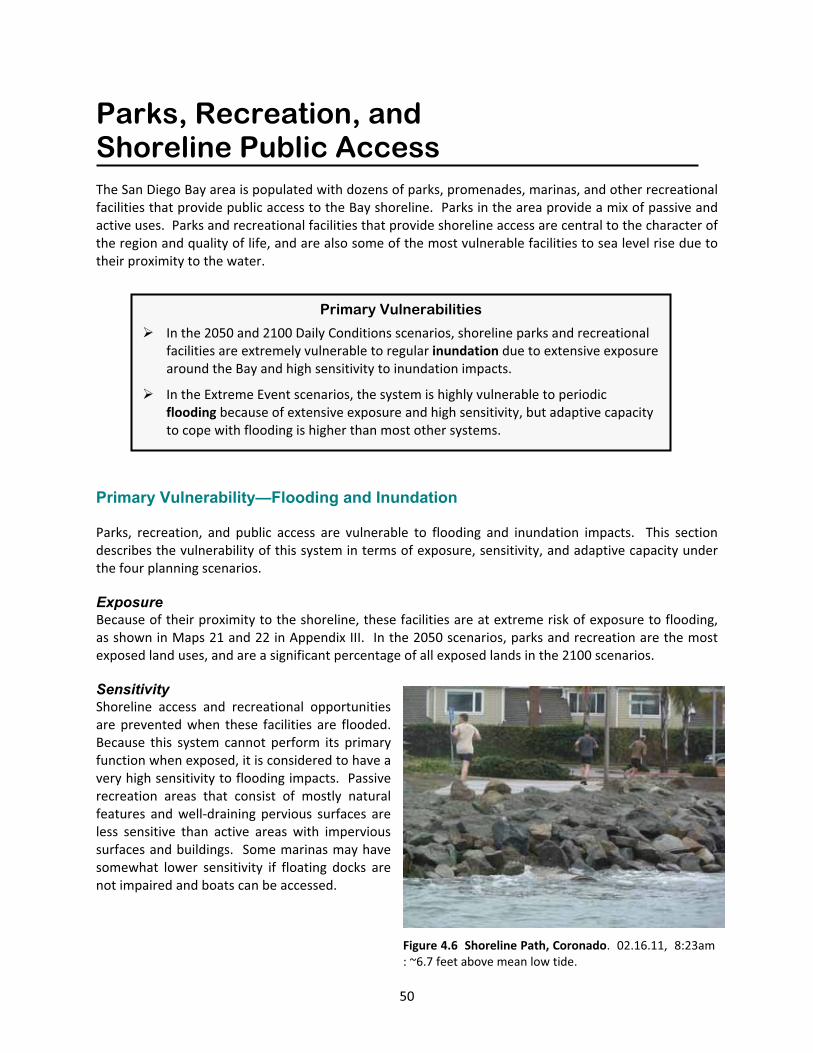
Parks, Recreation, andShoreline Public Access The San Diego Bay area is populated with dozens of parks, promenades, marinas, and other recreationalfacilities that provide public access to the Bay shoreline. Parks in the area provide a mix of passive andactive uses. Parks and recreational facilities that provide shoreline access are central to the character ofthe region and quality of life, and are also some of the most vulnerable facilities to sea level rise due totheir proximity to the water.
Primary Vulnerabilities
In the 2050 and 2100 Daily Conditions scenarios, shoreline parks and recreationalfacilities are extremely vulnerable to regular inundation due to extensive exposurearound the Bay and high sensitivity to inundation impacts.
In the Extreme Event scenarios, the system is highly vulnerable to periodicflooding because of extensive exposure and high sensitivity, but adaptive capacityto cope with flooding is higher than most other systems.
Primary Vulnerability—Flooding and Inundation
Parks, recreation, and public access are vulnerable to flooding and inundation impacts. This sectiondescribes the vulnerability of this system in terms of exposure, sensitivity, and adaptive capacity underthe four planning scenarios.
ExposureBecause of their proximity to the shoreline, these facilities are at extreme risk of exposure to flooding,as shown in Maps 21 and 22 in Appendix III. In the 2050 scenarios, parks and recreation are the mostexposed land uses, and are a significant percentage of all exposed lands in the 2100 scenarios.
SensitivityShoreline access and recreational opportunitiesare prevented when these facilities are flooded.Because this system cannot perform its primaryfunction when exposed, it is considered to have avery high sensitivity to flooding impacts. Passiverecreation areas that consist of mostly naturalfeatures and well draining pervious surfaces areless sensitive than active areas with impervioussurfaces and buildings. Some marinas may havesomewhat lower sensitivity if floating docks arenot impaired and boats can be accessed.
Figure 4.6 Shoreline Path, Coronado. 02.16.11, 8:23am: ~6.7 feet above mean low tide.
50
Adaptive Capacity Generally, shoreline parks and recreational facilities would have a moderate capacity to adapt toflooding in the Extreme Events scenarios. Individual facilities would not be able to cope with flooding inthe short term, but while these facilities recovered, other unaffected sites could be relied on for accessand recreational opportunities, so the system as a whole would have coping capacity. In the DailyConditions inundation scenarios, coping capacity would be lower as facilities would be lost completely,resulting in fewer access and recreational opportunities for the region.
Longer term adaptive capacity to inundation is mixed. As shoreline parks and recreational facilitiesbecome flooded more regularly or inundated altogether, it likely will be very difficult to maintainshoreline access by developing new facilities that would themselves be highly vulnerable. Most siteslandward of shoreline parks are already developed, and acquisition and redevelopment into a “lower”use could be challenging. Decision makers may also encounter resistance to spending funds onshoreline facilities that will be, by nature, vulnerable to future flooding. This vulnerability may also bean opportunity, however; as coastal land use evolves in the context of sea level rise, creating lowimpact, passive open space in vulnerable areas may be appealing, since these uses require lessinvestment and are more capable of coping with flooding than buildings and other infrastructure.
Overall Vulnerability to Flooding and Inundation Shoreline parks and recreational facilities are highly vulnerable to flooding and inundation, due to theirextensive exposure and high sensitivity. These uses will be more exposed to flooding and inundationthan any other land use, and they are unable to serve their function when flooded. However, the parksand recreation system is fairly adaptable to the periodic flooding of the Extreme Event scenarios, asmany activities can be shifted to unaffected facilities for short periods of time and passive parks withbetter stormwater infiltration capabilities may recover from flooding more quickly than other types offacilities. This coping capacity may provide good reason to continue investing in passive shoreline usesas sea levels rise, despite potential difficulties in land acquisition and in justifying public investment invulnerable areas.
Targeted Strategies
The following strategies are options for addressing the flooding and inundation vulnerabilities of parks,recreation, and open space, as prioritized by the Stakeholder Working Group and Technical AdvisoryCommittee.
1) Prioritize the development of passive, naturalized parks, open space, and habitat land in areasthat are vulnerable to flooding, to minimize risk to higher value infrastructure; to promotepublic access as shoreline conditions change; and to promote low impact developmentstormwater management.
2) Evaluate site specific vulnerabilities, identifying structures such as buildings, docks, and piersthat may be at risk. Identify adaptation responses as plans or projects are developed.
51

Regional Airport Operations The San Diego County Regional Airport Authority is responsible for compatible land use planning for theSan Diego County airport system, which includes 12 public use airports. The largest of these, San DiegoInternational Airport (Airport), is located at the northern end of San Diego Bay. It is the third busiestairport in California with over 17 million passengers annually, accommodating commercial passengerservices, air cargo, and general aviation.
Primary Vulnerabilities
Parts of the Airport site will be vulnerable to localized flooding from blocked stormoutfalls into the Bay.In the 2100 scenarios, Airport operations will be extremely vulnerable to Bayflooding, particularly from impacts on access roads, future terminal areas, andportions of the runway/airfield.In the 2100 scenarios, Airport operations will be highly vulnerable to Bayinundation, particularly from impacts on access roads.
Primary Vulnerability—Flooding and Inundation
Regional airport operations are vulnerable to flooding and inundation impacts. This section describesthe vulnerability of airport operations in terms of exposure, sensitivity, and adaptive capacity under theplanning scenarios.
ExposureIn the 2050 scenarios, the Airport is not exposed to flooding from the shoreline. Parts of the site may beexposed to localized flooding from inundated Bay storm drains in 2050, but the precise nature of thisflooding is not known, as described in the Stormwater Management section.
In the 2100 Daily Conditions scenario, North HarborDrive north of the Coast Guard station is inundatedregularly, thereby limiting access to passengerterminals from the east. The far western end of thesite, west of the runway, is inundated in thisscenario also. Flooding of the runway area ismagnified in the 2100 Extreme Event scenario.Flooding is present on both the eastern andwestern North Harbor Drive approaches to thepassenger terminals. The south side of the site,including the location of a planned passengerterminal, is flooded extensively. In addition to thiscoastal inundation, localized flooding during astorm would compound these effects.
Figure 4.7 West End of Runway (background), SanDiego International Airport. 01.19.11, morning :~7.1 feet above mean low tide.
52

SensitivityOperation of the Airport is extremely sensitive to flooding. Harbor Drive is currently the only accesspoint to terminals and flooding would shut down passenger access. The Airport has only one runway,and it cannot be used if it is flooded. Flooding as described in the 2100 scenarios would likelynecessitate closure of the facility on a regular basis. The risk of regular closure and potential damage toequipment would strongly deter airlines from operating at the facility. Despite many years of study,there are currently no plans to relocate major commercial aviation to other locations in the region. As itstands, if the Airport were to become unviable due to sea level rise impacts, the region would not have afunctional commercial passenger and air cargo airport to meet the needs of a growing metropolitanarea.
Adaptive Capacity The Airport has no capacity to cope with the flooding impacts described in the 2100 scenarios, ascurrently operated. The coping capacity of the regional airport system, as currently operated, is minimalas well; McClellan Palomar Airport in Carlsbad is the only other airport in the region with commercialpassenger aviation operations, and its capacity to accept SDIA commercial air traffic is very limited dueto a shorter runway. Because of the importance of aviation facilities to the region, the regional airportsystem does have the capacity to adapt to these challenges over the long term. Resources could bemade available to reconfigure the Airport—for example, by moving passenger access to a planned multimodal terminal on the north side of the site—or to relocate commercial aviation operations to anotherlocation within the region.
Overall Vulnerability to Flooding and Inundation Regional airport operations are very highly vulnerable to flooding and inundation impacts in the 2100timeframe, due to extensive flood exposure, very high sensitivity to flood impacts, and low short termadaptive capacity.
Targeted Strategies
The following strategies are options for addressing the flooding and inundation vulnerabilities ofregional airport operations, as prioritized by the Stakeholder Working Group and Technical AdvisoryCommittee.
1) Incorporate sea level rise flood scenarios at SDIA into the Regional Aviation Strategic Plan (RASP)process and the consideration of alternative sites.
2) In the SDIA Master Plan, explore potential for reconfiguring airport access away from key roadsthat may experience significant flooding and are threatened by inundation.
53
Vulnerable Populations The planning area is home to many populations that would traditionally be considered vulnerable.These groups, including low income residents, the homeless, elderly, ethnic minorities, and recentimmigrants, often have more difficulty in accessing services and participating in planning processes thatcould help them increase resilience. Though a hub of commercial activity and higher end residentialunits, the Centre City area also includes many single resident occupancy residences that are inhabitedby low income and housing insecure populations. There are also several homeless shelters and socialservice organizations in the area, and a large homeless population is based here to access these services.Additionally, the Barrio Logan area to the south is a predominantly Latino neighborhood populatedmostly by long time, working class residents, but with a significant population of recent immigrants andlow income people as well. National City and Imperial Beach have a similar demographic profile ofvulnerable populations. Elderly populations are more significant in Coronado and in the Midway area,home to several nursing home complexes. Finally, in addition to the traditionally vulnerablepopulations, certain economic activities may be adversely affected by flooding and those employed inthese activities may be vulnerable.
Primary Vulnerabilities
Many groups that are currently vulnerable – low income residents, the homeless,elderly, ethnic minorities, etc. – will face even greater threats from futureflooding, particularly in the 2100 time frame.
Residents that work in sectors that could be impacted due to future flooding arealso a key vulnerability for the region.
Primary Vulnerability – Flooding
Traditionally vulnerable populations will remain vulnerable in the face of flooding impacts. Additionallysome new populations – those working in specific job sectors – could become more vulnerable toflooding. This section describes the vulnerability of area populations based on exposure to flooding. Italso touches on sensitivity and adaptive capacity considerations.
ExposureTraditionally vulnerable populations face no major additional flooding threats in the 2050 time frame.In 2100 flooding expands to impact a greater number of vulnerable populations. The homelesspopulation and the social services in Centre City could be exposed to future flooding impacts. Also,National City’s single family neighborhood west of Paradise Creek could be exposed to future flooding.In Imperial Beach, the flood exposed Bernardo Shores RV park and single family homes on 7th Street and8th Street may also be home to traditionally vulnerable populations. Finally, elderly populations,concentrated in Coronado and in the Midway area, will be more exposed under the 2100 floodingscenario. These exposures can be seen most explicitly in Maps 15 18 in Appendix III – ResidentialBuilding Stock.
Employment sector exposure faces a similar pattern, with very limited exposure in 2050 and higherflooding exposure in 2100. In 2100, those employed by the hospitality sector, which ranges from airportstaff, hotel workers and even personal home care staff, could be affected by job loss from flood
54

exposure. The other sector most likely to be impacted by future flooding is shorefront industrial work,which may have to relocate due to increased frequency of flooding.
SensitivityTraditionally vulnerable populations are typically considered to have a high sensitivity to floodingimpacts. These populations often cannot relocate, and they have fewer resources to rebuild after theirhomes have been destroyed by flooding. Additionally, these populations may have more difficultyevacuating during emergencies. Thus, even minor increases in flooding could have major impacts onthese populations.
Adaptive Capacity Generally, traditionally vulnerable populations in San Diego Bay have a relatively low adaptive capacity;however, the dynamics of different groupings of traditionally vulnerable populations have not beenassessed for their adaptive capacity in this report. In general, vulnerable populations have feweroptions for adapting to many challenges, and fewer financial, civic, and political resources on which torely. This lack of resources can make many different adaptive activities less feasible—such as relocatingor floodproofing homes, evacuating in an emergency, coping in the aftermath of flooding, or findingother employment when laid off from an affected job.
Overall Vulnerability to Flooding Traditionally vulnerable populations as well as those employed in service functions of the hospitalitysector are highly vulnerable to flooding in the 2100 timeframe. However, further research into specificsub populations and their sensitivity and adaptive capacity would be needed to better understand thedynamics of traditionally vulnerable populations around San Diego Bay, and to identify targetedstrategies for responding to these vulnerabilities.
55

56
5. MANAGEMENT PRACTICES TOOLBOX
This section presents a toolbox of options for managing sea level rise that are generally more aggressivethan the strategies recommended in previous sections. The comprehensive and targeted strategiespresented in previous sections are mostly “no regrets” approaches that can be implemented atrelatively low cost, that can be integrated into existing work programs, and that have co benefits forreaching other community goals. However, in the long run, no regrets strategies will not be sufficientto ensure resiliency in the region’s coastal zone. Successful implementation of the managementpractices described in this section will require significant technical and management capabilities,regional collaboration, financial investment, and political commitment.
Generally, sea level rise management practices can be classified into four categories: hard defense; softdefense; accommodation; and withdrawal. This toolbox illustrates specific practices in each of thesecategories through section diagrams and photographs. It also documents the opportunities andconstraints of these four approaches, as determined in a map based exercise in the second StakeholderWorking Group workshop. Each approach presents significant opportunities and constraints, anddecision making around these practices will require careful deliberation around the tradeoffs.Ultimately, a mix of hard defenses, soft defenses, accommodation, and withdrawal will likely emerge asthe most optimal management approach, but existing frameworks for making these difficult decisionsneed to be enhanced, as recommended in Comprehensive Strategy #10.

HA
RD
STRU
CTU
RE STR
ATEGIES
option A - Seawall - retaining
Seawalls are engineered, permanent barriers built parallel to shoreline to
-ing and erosion caused by wave action. Seawalls may be vertical or sloping, and massive gravity concrete walls or constructed of steel or timber.
Ex./New Urban Setback San Diego Bay
existing sea level
future sea level
scale: 1/16” = 1’-0”
Development Dimensions will be site
1
strategy: HARD STRUCTUREHard defenses are designed to be impermeable structures intended to protect land, structures and investments along the water edge. Examples includes hard, impermeable defenses such as seawalls, revetments, dikes, and storm surge barriers that armor or “draw the line” between water and develop-
opportunities:• Stabilizes upland areas• Protects existing development and infrastructure• Maintains property values for bayfront and low-lying development• Setbacks can be used for recreation, infrastructure and non-habitable structures.constraints:• Expensive to construct, with annual maintenance required• Areas outside of protective zone are often more subject to erosion and ecological degradation• Shoreline habitats will be lost as space to migrate is eliminated unknowns:• Potential loss of public access and aesthetic link to waterfront
Seawall at Lake Michigan, Chicago

option
HA
RD
STRU
CTU
RE STR
ATEGIES
2
option C - Levee
Levees are engineered, permanent, impermeable barriers constructed to protect low-lying inland areas from
of earth, sand and clay; the sloped sides are stabilized and protected from erosion and wave action by rip-rap or concrete armor units.
scale: 1/16” = 1’-0”
future sea level
existing sea level
Urban Setback San Diego BayDevelopment
existing sea level
future sea level
Seawalls may be stepped on both the bay and city sides, allowing for easier access and greater public uses while working to dissipate wave and tidal energy. More land would be required for this option, and construction expenses would increase
scale: 1/16” = 1’-0”
Urban Setback San Diego BayDevelopment

HA
RD
STRU
CTU
RE STR
ATEGIES
option E - Rip-rap
Rip-rap is large, angular stone placed on existing beach, embankment, cliff or other shore edge to prevent erosion and help dissipate wave energy. Concrete armor units, such as tetrapods and cubes, perform similar functions.
future sea level
scale: 1/16” = 1’-0”
existing sea level
option
are engineered, perma-nent walls that retain land and provide erosion-protection. Secondary use to stabilize and protect upland areas from
structures that may be constructed of concrete, rip-rap, or pilings with steel or timber.
existing sea leve
future sea level
scale: 1/16” = 1’-0”
l
Development
Urban Setback San Diego BayDevelopment
3

SOFT STR
UC
TUR
E STRATEG
IES
4
strategy: SOFT STRUCTURESoft structures use natural systems and ecosystem services to protect development, investments, and ecosystem well-being. Soft defenses typically protect development through increasing the distance be-
and runoff. Examples include wetland preservation and enhancement, and stormwater management
opportunities:
correspondingly reducing size and cost of any required seawalls or hard structures• Preserves or increases valuable habitat• Provides recreation and open space areas• Reduces water pollution in bay and enhances groundwater recharge
constraints:
• Continued maintenance required• Green infrastructure is typically cost effective
unknowns:
432.7879
option
and their
energy, and shoreline stabilization. Wetlands are also particularly sensitive and will “naturally” shift upland with the increasing salinity and water depth that results from sea level rises. Wetlands provide ecosystem services to local communities in the form of improved water quality, support for
scale: 1/16” = 1’-0”

SOFT STR
UC
TUR
E STRATEG
IES
5
option
Infrastructure work with natural systems to maximize the retention and percolation of stormwater. Green infrastructure includes the open, permeable spaces within a community, and seeks to adapt traditional “gray”
provide potential habitat.
scale: 1/16” = 1’-0”
option
are engineered basins that collect stormwater, either allowing it to percolate on-site or releasing it after the major storm event has passed. Upstream basins help to prevent
the bay.
scale: 1/16” = 1’-0”
Development Detention basin Development
Development permeable Detention Basinsurface

SOFT STR
UC
TUR
E STRATEG
IES
6
option
uses plants and
stormwater, and create habitat areas. Examples are stormwater parks, rain gardens and small “pocket” wetlands that allow for
scale: 1/16” = 1’-0”
option
away from development, slow runoff, and allow for percolation of
scale: 1/16” = 1’-0”

AC
CO
MM
OD
ATION
STRATEG
IES
7
strategy: ACCOMMODATION Accommodation realigns traditional methods of planning and building with changing conditions of
opportunities:
• Property owner can control elevation of structure
constraints:
other habitat
unknowns:• Accessibility
temporary
future sea level
existing sea level
existing elevation
future elevation
option
raise elevations of pads for new structures, infrastructure, and other land uses. Earth or gravel, or raised foundation walls, can be used to raise building pads and infrastructure up out
Depending on edge conditions, elevated grades may require rip-rap and other armoring for protection. It may be possible to raise the land surface of wetlands.
scale: 1/16” = 1’-0”

AC
CO
MM
OD
ATION
STRATEG
IES
8
existing sea level
future sea level
existing sea level
option
built in known
scale: 1/16” = 1’-0”
option
allows for
area is designated as uninhabitable, and while habitable space is restricted to upper levels of development. Shore edge parks and plazas can also be
scale: 1/16” = 1’-0”
Future bldg. at new elevation to accomodate higher sea level
Existing min. elevation for structures
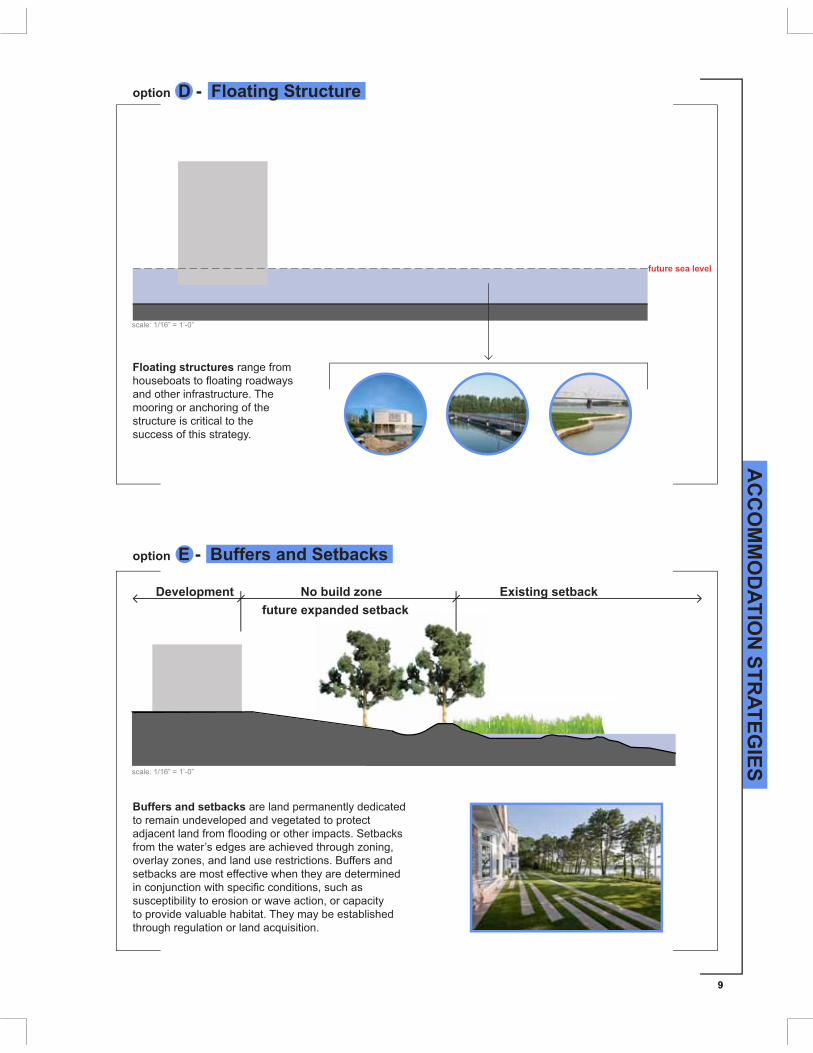
AC
CO
MM
OD
ATION
STRATEG
IES
9
future sea level
option D - Floating Structure
Floating structures range from
mooring or anchoring of the structure is critical to the success of this strategy.
scale: 1/16” = 1’-0”
432.7879
are land permanently dedicated to remain undeveloped and vegetated to protect
from the water’s edges are achieved through zoning,
setbacks are most effective when they are determined
susceptibility to erosion or wave action, or capacity
through regulation or land acquisition.
scale: 1/16” = 1’-0”
option
432.7879
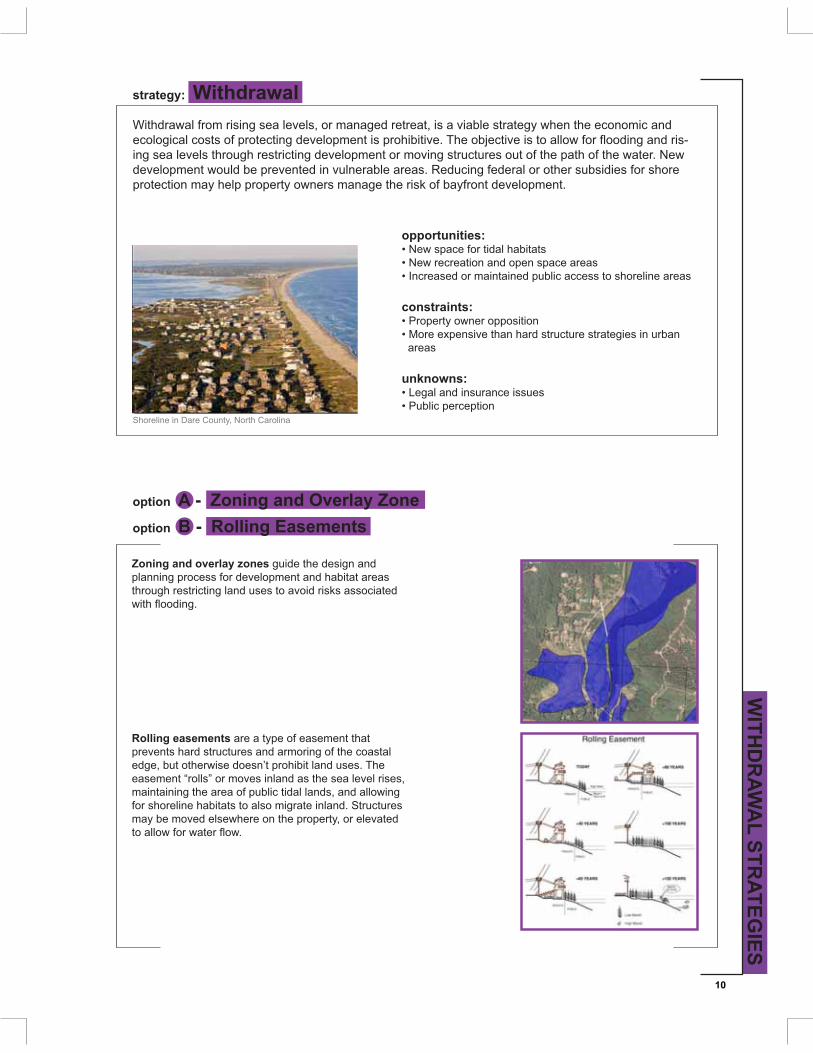
WITH
DR
AWA
L STRATEG
IES
10
strategy:
Withdrawal from rising sea levels, or managed retreat, is a viable strategy when the economic and -
development would be prevented in vulnerable areas. Reducing federal or other subsidies for shore protection may help property owners manage the risk of bayfront development.
opportunities:
• Increased or maintained public access to shoreline areas
constraints:• Property owner opposition• More expensive than hard structure strategies in urban areas
unknowns:• Legal and insurance issues• Public perception
432.7879
option B - Rolling Easementsoption
432.7879
guide the design and planning process for development and habitat areas through restricting land uses to avoid risks associated
Rolling easements are a type of easement that prevents hard structures and armoring of the coastal
easement “rolls” or moves inland as the sea level rises, maintaining the area of public tidal lands, and allowing for shoreline habitats to also migrate inland. Structures may be moved elsewhere on the property, or elevated

WITH
DR
AWA
L STRATEG
IES
11
Design for Disassembly is a building process that plans for the future disassembly and reuse of building materials.
option C - Design for Disassembly
option
water-land interface. Structures may be removed or relocated inland as sea level rises and the existing shoreline erodes. Plans for withdrawal from the water’s edge can be incorporated in long-range plans and visions, and include the planned relocation and/or disassembly of valuable existing structures and land uses as well as planned abandonment of less essential structures.
existing sea levelfuture sea level
existing sea levelfuture sea level
existing sea levelfuture sea level
Phase 2: Shoreline buildings removed, dune built up with vegetative coastal buffer
scale: 1/32” = 1’-0”
scale: 1/32” = 1’-0”
scale: 1/32” = 1’-0”

6. CONCLUSION AND NEXT STEPS
Management of the San Diego Bay coastal zone has long been a challenge, due to the complexinteraction of physical and socio economic processes at work. Through coordination with a broad set ofpublic agencies, property owners, and other stakeholders over many decades, the region has created aninstitutional and legal framework that helps protect important interests, but the outcomes of decisionmaking are not always ideal. This dynamic will only become more challenging as the pace of sea levelrise quickens in the coming years, leading to more frequent and severe extreme flood events as well as aslow and steady trend towards inundation of developed areas and loss of important habitat this century.
The assessments and recommendations presented here represent the best thinking of a large body ofregional stakeholders and experts, based on the most current available science. They are a startingpoint. Going forward, the recommendations are intended as a resource for local agencies as theydevelop and implement tools for protecting important community assets. In the near term,opportunities to incorporate these recommendations include the climate action plans underdevelopment in the City of San Diego and the Port of San Diego, as well as the regulations andinvestments directed towards redevelopment of the Chula Vista Bayfront. Over the longer term, thefindings will be helpful in integrating sea level rise adaptation into many of the mechanisms formanaging the coastal zone, such as Local Coastal Programs, capital improvement programs, and habitatconservation plans.
While many adaptation actions will be implemented by individual local agencies, regional coordinationwill be critically important in developing integrated, cost effective solutions that respond to theinterconnectedness of Bay systems and processes. Through renewed support from the San DiegoFoundation, ICLEI will continue to convene the project’s Public Agency Steering Committee, StakeholderWorking Group, and Technical Advisory Committee through 2012 to move forward with theComprehensive Strategies that lend themselves to region wide implementation.
Through the Adaptation Strategy process, regional practitioners have taken the first step towardsbuilding resilience to sea level rise by learning how to communicate about the issues, and by starting toidentify community vulnerabilities and appropriate adaptation responses. The work to come will bedifficult, but it will also present real opportunities to improve quality of life in the region and avoid thesignificant costs presented by sea level rise on San Diego Bay.
69

APPENDIX I – VULNERABILITY ASSESSMENT SURVEY QUESTIONNAIRE
The following survey was administered to the Technical Advisory Committee via surveymonkey.com inJanuary 2011.
I


APPENDIX II – FLOODING AND INUNDATION EXPOSURE MAPS
This appendix presents the GIS maps that were generated during the Vulnerability Assessment overlayanalysis.
XVI


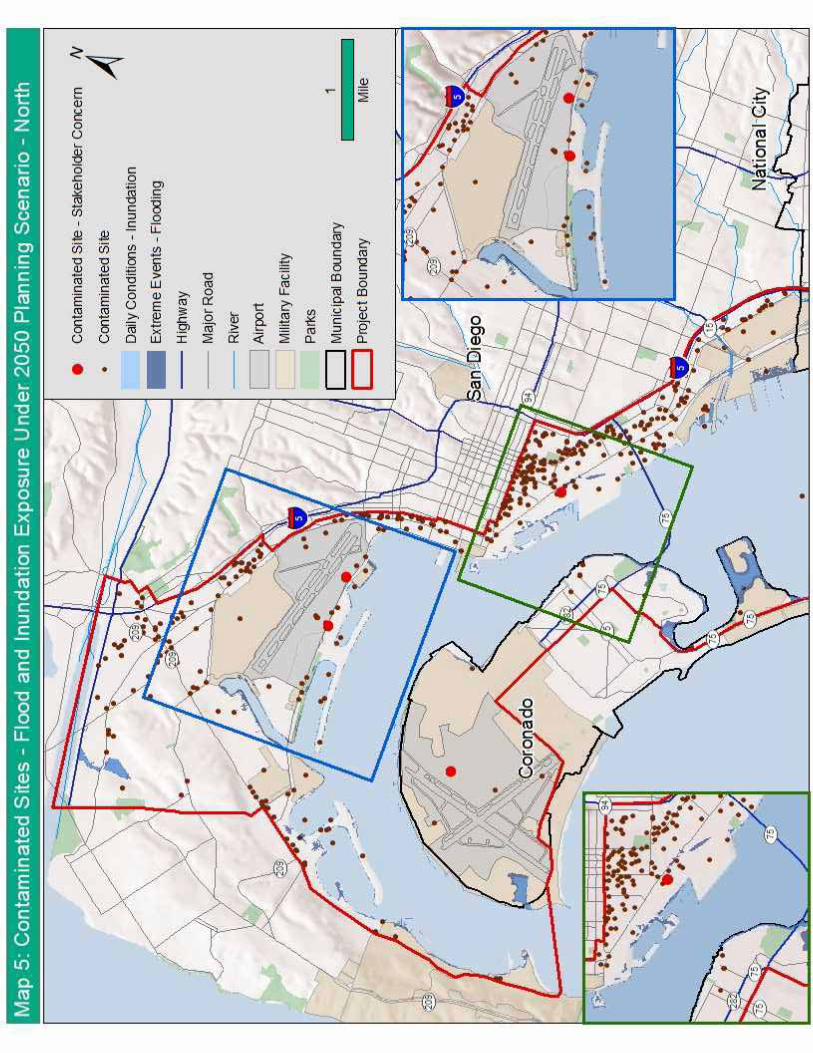


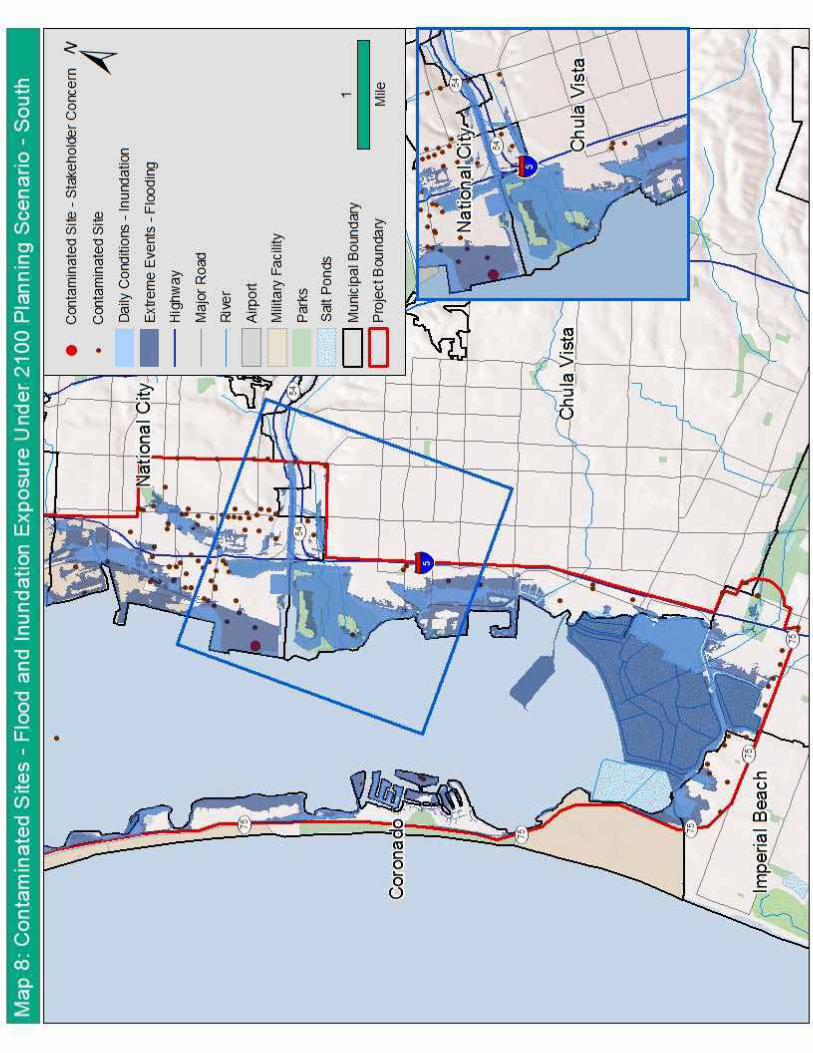


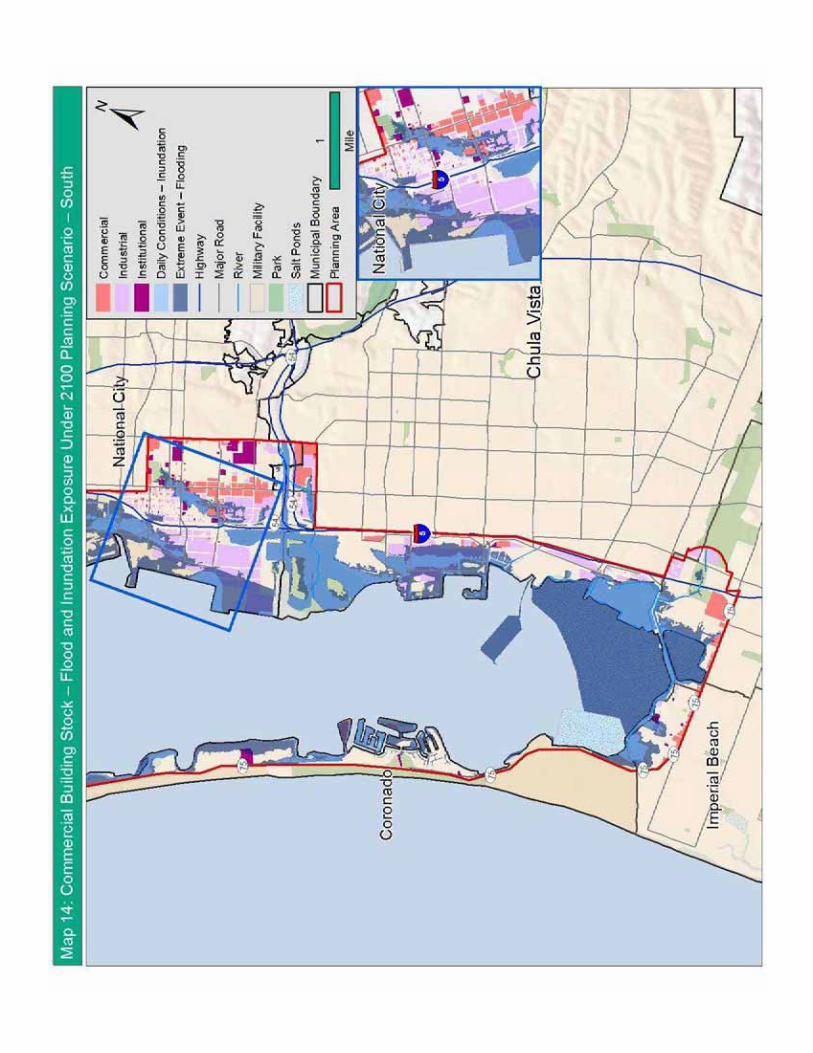
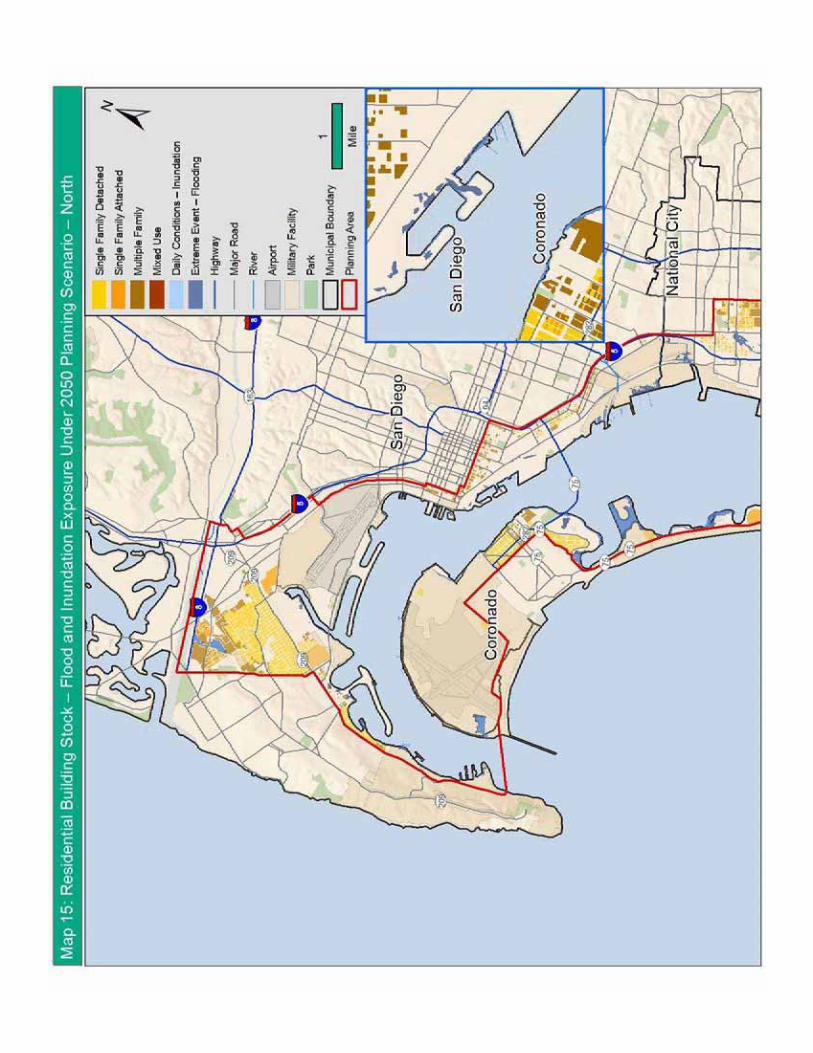


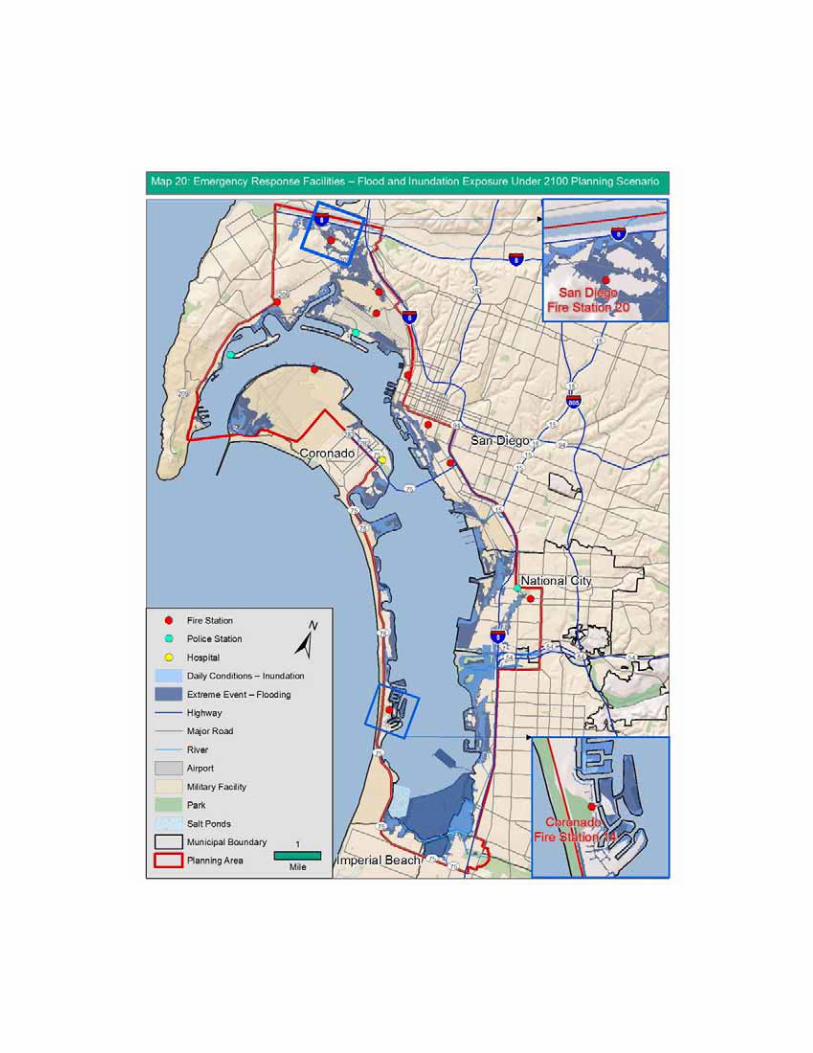


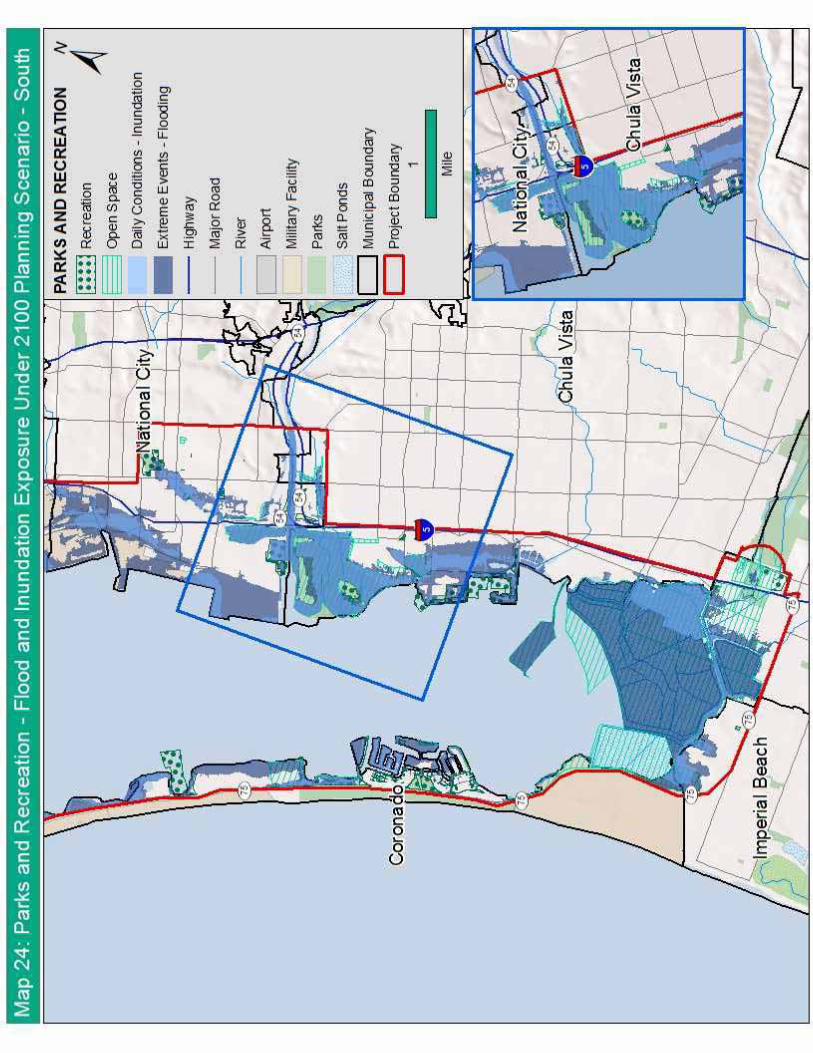
APPENDIX III – TARGETED STRATEGY EVALUATION MATRICES
This appendix presents the Excel based spreadsheets that were used to evaluate potential targetedstrategies. A key to the matrix format can be found on the following page.
XLII

XVI

SC jurisdiction
Existing Programs
Flexibility
Mitigation co-benefit
Econ/Social wellbeing
Public safety
Public health
Environmental justice
Habitat protection
Ecological function
Public access
Critical infrastructure
Community character
Address new development
Address existing communities
Flo
od
ing
an
d
Inu
nd
atio
n
Als
o a
C
om
pre
hen
sive
S
trat
egy
1W
ork
with
FE
MA
to im
prov
e F
lood
Insu
ranc
e R
ate
Map
s (F
IRM
s) a
nd c
reat
e ad
ditio
nal m
aps
that
in
clud
e fu
ture
sea
leve
l ris
e.+
+0
0+
++
++
00
0+
0+
+10
2In
are
as v
ulne
rabl
e to
pro
ject
ed S
LR-r
elat
ed fl
oodi
ng a
nd in
the
exis
ting
100-
year
floo
dpla
in, c
onsi
der
stre
ngth
enin
g flo
odpl
ain
man
agem
ent r
egul
atio
ns th
roug
h pa
rtic
ipat
ion
in th
e F
EM
A C
omm
unity
R
atin
g S
yste
m o
r th
roug
h in
corp
orat
ion
of m
ore
flood
-res
ista
nt b
uild
ing
code
pro
visi
ons.
++
00
++
++
+0
00
00
++
09
3In
are
as v
ulne
rabl
e to
pro
ject
ed S
LR-r
elat
ed fl
oodi
ng th
at a
re n
ot in
the
exis
ting
100-
year
floo
dpla
in,
cons
ider
app
lyin
g N
FIP
min
imum
req
uire
men
ts to
new
dev
elop
men
t.
++
00
++
++
+0
00
00
++
09
4E
stab
lish
build
ing
setb
acks
from
floo
d lin
es &
ens
ure
that
they
app
ly to
red
evel
opm
ent o
f any
bu
ildin
gs d
estr
oyed
in fl
oodi
ng e
vent
s.+
0+
0+
+0
0+
++
0+
+0
9
5C
reat
e fin
anci
al in
cent
ives
for
build
ings
con
stru
cted
to h
ighe
r st
anda
rds.
+0
+0
++
+0
+0
00
0+
+8
6S
et h
ighe
r bu
ildin
g co
de s
tand
ards
- r
equi
ring
hom
es to
be
build
abo
ve m
inim
um F
EM
A
requ
irem
ents
.+
0+
0+
+0
00
00
0+
++
+8
7G
athe
r m
ore
spec
ific
elev
atio
n da
ta c
reat
ing
a be
tter
unde
rsta
ndin
g of
cur
rent
bas
e flo
or b
uild
ing
elev
atio
ns.
++
+0
0+
++
00
00
00
0+
7
8C
reat
e a
real
est
ate
disc
losu
re s
tate
men
t tha
t req
uire
s m
ore
expl
icit
stat
emen
ts r
egar
ding
futu
re
risks
.+
0+
0+
++
00
00
00
0+
6
9D
evel
op, e
nhan
ce a
nd d
istr
ibut
e ou
trea
ch a
nd e
duca
tion
mat
eria
ls fo
r bu
ildin
g ow
ners
and
tena
nts
in
flood
pro
ne a
reas
.+
00
0+
++
+0
00
0+
00
6
Wat
er T
able
Ris
e
Als
o a
C
om
pre
hen
sive
S
trat
egy
10E
valu
ate
wat
er ta
ble
rise
scen
ario
s an
d in
fras
truc
ture
vul
nera
bilit
ies,
in c
once
rt w
ith o
ther
loca
l ju
risdi
ctio
ns, a
cade
mic
res
earc
hers
, US
GS
, and
oth
er r
elev
ant e
ntiti
es.
Dev
elop
ada
ptat
ion
resp
onse
s ba
sed
on v
ulne
rabi
lity
anal
ysis
.+
+-
00
++
00
00
0+
0+
+6
Als
o a
C
om
pre
hen
sive
S
trat
egy
11E
valu
ate
geot
echn
ical
ana
lyse
s an
d de
wat
erin
g pe
rmits
to a
ssem
ble
a da
taba
se o
f wat
er ta
ble
inte
ract
ion.
+
+-
00
++
00
00
0+
0+
+6
Bui
ldin
gs h
ave
a lo
w v
ulne
rabi
lity
to fl
oodi
ng in
the
2050
sce
nario
due
to li
mite
d ex
posu
re.
The
y ar
e hi
ghly
-vul
nera
ble
to fl
oodi
ng in
the
2100
sce
nario
s as
exp
osur
e ex
pand
s to
larg
e po
rtio
ns o
f dev
elop
ed
area
s.
Sub
-sur
face
str
uctu
res
such
as
park
ing
gara
ges
and
base
men
ts c
ould
be
vuln
erab
le to
a r
isin
g w
aste
r ta
ble
if ex
pose
d.
Bay
Sea
Lev
el R
ise
Str
ateg
y E
valu
atio
n M
atri
x -
Bu
ildin
g S
tock
Str
ateg
ies
Eva
luat
ion
Cri
teri
a
To
tal
Ran
kK
ey V
uln
erab
ility
/ A
dap
tati
on
Str
ateg
yS
ea L
evel
Ris
e Im
pac
t to
S
an D
ieg
o B
ay
1 of
11

SC jurisdiction
Existing Programs
Flexibility
Mitigation co-benefit
Econ/Social wellbeing
Public safety
Public health
Environmental justice
Habitat protection
Ecological function
Public access
Critical infrastructure
Community character
Address new development
Address existing communities
Flo
od
ing
an
d
Inu
nd
atio
nA
San
itary
sew
ers
in lo
w-ly
ing
loca
tions
will
be
vuln
erab
le to
floo
dwat
er in
flow
whi
ch c
ould
exc
eed
thei
r ca
paci
ty, p
oten
tially
res
ultin
g in
dis
char
ge o
f was
tew
ater
to th
e B
ay.
Als
o a
dd
ress
es
Was
tew
ater
V
uln
erab
ility
C1
Ens
ure
that
new
sew
er m
ains
and
man
hole
s ar
e se
aled
aga
inst
floo
dwat
er in
flow
and
gro
undw
ater
in
filtr
atio
n. E
xpan
d pr
ogra
ms
to r
educ
e in
flow
and
infil
trat
ion
thro
ugh
reha
bilit
atio
n of
sew
er m
ains
an
d m
anho
les,
prio
ritiz
ing
area
s w
here
ris
k of
floo
ding
is h
ighe
st+
++
00
++
++
00
+0
+0
++
++
13
2M
onito
r in
cide
nces
of r
esid
ents
rem
ovin
g sa
nita
ry s
ewer
man
hole
s du
ring
stor
m e
vent
s, a
nd in
itiat
e or
exp
and
prog
ram
s to
red
uce
this
pra
ctic
e as
nec
essa
ry.
++
++
0+
++
++
00
+0
+0
0+
12
3U
pdat
e w
aste
wat
er m
anag
emen
t pla
ns a
nd c
apita
l im
prov
emen
t pro
gram
s to
acc
ount
for
sea
leve
l ris
e-re
late
d ch
alle
nges
. +
++
+0
++
++
+0
00
+0
++
12
Flo
od
ing
BS
urfa
ce in
fras
truc
ture
suc
h as
maj
or p
ump
stat
ions
vul
nera
ble
to fl
oodi
ng a
nd in
unda
tion.
4D
epen
ding
on
faci
lity
desi
gn, e
leva
te p
ump
stat
ions
and
em
erge
ncy
gene
rato
rs a
s th
ey a
re
reha
bita
ted
or in
new
con
stru
ctio
n.+
+0
0+
++
+0
0+
0+
+0
++
11
Als
o a
C
om
pre
hen
sive
S
trat
egy
5D
evel
op a
det
aile
d vu
lner
abili
ty a
sses
smen
t of w
aste
wat
er fa
cilit
ies
incl
udin
g fu
ture
sea
leve
l ris
e im
pact
s fo
r th
e m
ost a
t-ris
k fa
cilit
ies,
and
wor
ked
tow
ards
a m
ap o
f the
se fa
cilit
ies.
++
-0
0+
++
++
00
0+
0+
+9
6U
pdat
e w
aste
wat
er e
mer
genc
y re
spon
se a
nd m
aint
enan
ce p
roce
dure
s to
acc
ount
for
mor
e co
mm
on
and
mor
e ex
tens
ive
coas
tal f
lood
ing
of v
ulne
rabl
e in
fras
truc
ture
. +
00
0+
++
+0
0+
0+
0+
+9
Wat
er T
able
Ris
eC
Mai
ns v
ulne
rabl
e to
gro
undw
ater
infil
trat
ion,
dam
age,
and
mai
nten
ance
cha
lleng
es if
exp
osed
to th
e w
ater
tabl
e
Als
o a
dd
ress
es
Was
tew
ater
V
uln
erab
ility
A.
7E
nsur
e th
at n
ew s
ewer
mai
ns a
re s
eale
d ag
ains
t flo
odw
ater
inflo
w a
nd g
roun
dwat
er in
filtr
atio
n.
Exp
and
prog
ram
s to
red
uce
inflo
w a
nd in
filtr
atio
n th
roug
h re
habi
litat
ion
of s
ewer
mai
ns a
nd
man
hole
s, p
riorit
izin
g ar
eas
whe
re r
isk
of fl
oodi
ng is
incr
easi
ng d
++
00
0+
++
0+
00
++
++
+11
Als
o a
C
om
pre
hen
sive
S
trat
egy
8E
valu
ate
wat
er ta
ble
rise
scen
ario
s an
d in
fras
truc
ture
vul
nera
bilit
ies,
in c
once
rt w
ith o
ther
loca
l ju
risdi
ctio
ns, a
cade
mic
res
earc
hers
, US
GS
, and
oth
er r
elev
ant e
ntiti
es.
Dev
elop
ada
ptat
ion
resp
onse
s ba
sed
on v
ulne
rabi
lity
anal
ysis
.+
+-
00
++
00
00
0+
0+
+6
Bay
Sea
Lev
el R
ise
Str
ateg
y E
valu
atio
n M
atri
x -
Was
tew
ater
Str
ateg
ies
Eva
luat
ion
Cri
teri
a
To
tal
Ran
kK
ey V
uln
erab
ility
/ A
dap
tati
on
Str
ateg
yS
ea L
evel
Ris
e Im
pac
t to
S
an D
ieg
o B
ay
2 of
11
SC jurisdiction
Existing Programs
Flexibility
Mitigation co-benefit
Econ/Social wellbeing
Public safety
Public health
Environmental justice
Habitat protection
Ecological function
Public access
Critical infrastructure
Community character
Address new development
Address existing communities
Flo
od
ing
an
d
Inu
nd
atio
n
1P
riorit
ize
low
-impa
ct d
evel
opm
ent (
LID
) st
orm
wat
er p
ract
ices
that
enc
oura
ge in
filtr
atio
n to
min
imiz
e re
lianc
e on
sto
rm s
ewer
s th
at c
ould
be
impa
ired
by S
LR.
++
++
++
++
++
++
+0
+0
++
16
2E
valu
ate
tech
nolo
gies
that
can
sea
l off
drai
n ou
tfalls
aga
inst
Bay
wat
er in
flow
dur
ing
high
wat
er
even
ts, a
nd in
stal
l via
ble
tech
nolo
gies
on
outfa
lls th
at c
ould
be
expo
sed
over
the
lifes
pan
of th
e fa
cilit
y du
e to
sea
leve
l ris
e.+
++
+0
++
++
++
00
0+
0+
+13
3U
pdat
e st
orm
wat
er m
anag
emen
t pla
ns a
nd c
apita
l im
prov
emen
t pro
gram
s to
acc
ount
for
sea
leve
l ris
e-re
late
d ch
alle
nges
suc
h as
floo
ded
Bay
out
falls
. In
clud
e st
rate
gic
cons
ider
atio
n of
sys
tem
ic
reco
nstr
uctio
n of
sto
rmw
ater
faci
litie
s in
the
late
r-ce
ntur
y tim
efra
me.
++
++
+0
++
++
+0
00
+0
++
13
4In
crea
se c
apac
ity o
f sto
rmw
ater
man
agem
ent f
acili
ties
to a
ccom
mod
ate
mor
e co
mm
on a
nd m
ore
exte
nsiv
e co
asta
l flo
odin
g.+
++
+0
++
++
++
00
0+
0+
+13
5D
evel
op a
det
aile
d vu
lner
abili
ty a
sses
smen
t of s
torm
wat
er m
anag
emen
t at t
he fa
cilit
y le
vel f
or th
e m
ost a
t-ris
k fa
cilit
ies,
incl
udin
g dr
ain
outfa
lls a
nd a
reas
that
cou
ld b
e ex
pose
d to
loca
lized
floo
ding
fr
om B
ay w
ater
inflo
w in
to d
rain
s.+
+-
00
++
++
+0
00
+0
++
9
Wat
er T
able
Ris
e
6E
valu
ate
wat
er ta
ble
rise
scen
ario
s an
d in
fras
truc
ture
vul
nera
bilit
ies,
in c
once
rt w
ith o
ther
loca
l ju
risdi
ctio
ns, a
cade
mic
res
earc
hers
, US
GS
, and
oth
er r
elev
ant e
ntiti
es.
Dev
elop
ada
ptat
ion
resp
onse
s ba
sed
on v
ulne
rabi
lity
anal
ysis
.+
+-
00
++
00
00
0+
0+
+6
Sto
rm d
rain
s an
d B
MP
s w
ould
be
vuln
erab
le if
exp
osed
to a
ris
ing
wat
er ta
ble,
but
mor
e in
form
atio
n is
ne
eded
to d
eter
min
e th
e na
ture
of p
oten
tial e
xpos
ure.
Sto
rm s
ewer
s ar
e ve
ry v
ulne
rabl
e to
floo
ding
and
inun
datio
n of
Bay
dra
in o
utfa
lls d
ue to
hig
her
sea
leve
ls,
a co
nditi
on th
at w
ould
res
ult i
n lo
caliz
ed fl
oodi
ng in
ver
y lo
w-ly
ing
inla
nd a
reas
, esp
ecia
lly d
urin
g st
orm
ev
ents
Bay
Sea
Lev
el R
ise
Str
ateg
y E
valu
atio
n M
atri
x -
Sto
rmw
ater
an
d F
loo
d C
on
tro
l Str
ateg
ies
Eva
luat
ion
Cri
teri
a
To
tal
Ran
kK
ey V
uln
erab
ility
/ A
dap
tati
on
Str
ateg
yS
ea L
evel
Ris
e Im
pac
t to
S
an D
ieg
o B
ay
3 of
11

SC jurisdiction
Existing Programs
Flexibility
Mitigation co-benefit
Econ/Social wellbeing
Public safety
Public health
Environmental justice
Habitat protection
Ecological function
Public access
Critical infrastructure
Community character
Address new development
Address existing communities
Flo
od
ing
an
d
Inu
nd
atio
n
Als
o a
C
om
pre
hen
sive
S
trat
egy
1D
evel
op a
det
aile
d vu
lner
abili
ty a
sses
smen
t of p
otab
le w
ater
faci
litie
s in
clud
ing
futu
re s
ea le
vel r
ise
impa
cts
for
the
mos
t at-
risk
faci
litie
s. E
valu
ate
the
flood
-res
ista
nce
of s
peci
fic m
echa
nica
l equ
ipm
ent
in a
reas
vul
nera
ble
to fu
ture
SLR
-rel
ated
floo
ding
.+
0+
0+
++
+0
00
0+
0+
+9
2U
pdat
e po
tabl
e w
ater
em
erge
ncy
resp
onse
and
mai
nten
ance
pro
cedu
res
to a
ccou
nt fo
r m
ore
com
mon
and
mor
e ex
tens
ive
coas
tal f
lood
ing
in v
ulne
rabl
e ar
eas.
+
00
0+
++
00
00
+0
0+
+7
Wat
er T
able
Ris
e
Als
o a
C
om
pre
hen
sive
S
trat
egy
3E
valu
ate
wat
er ta
ble
rise
scen
ario
s an
d in
fras
truc
ture
vul
nera
bilit
ies,
in c
once
rt w
ith o
ther
loca
l ju
risdi
ctio
ns, a
cade
mic
res
earc
hers
, US
GS
, and
oth
er r
elev
ant e
ntiti
es.
Dev
elop
ada
ptat
ion
resp
onse
s ba
sed
on v
ulne
rabi
lity
anal
ysis
.+
+-
00
++
00
00
0+
0+
+6
Abo
ve-g
roun
d w
ater
dis
trib
utio
n co
mpo
nent
s su
ch a
s va
lves
, met
ers,
and
ser
vice
poi
nts
will
be
vuln
erab
le
to fl
oodi
ng.
Wat
er d
istr
ibut
ion
syst
ems
wou
ld b
e vu
lner
able
if e
xpos
ed to
a r
isin
g w
ater
tabl
e, p
artic
ular
ly r
elat
ing
to
dam
age
and
mai
nten
ance
of b
urie
d m
ains
.
Bay
Sea
Lev
el R
ise
Str
ateg
y E
valu
atio
n M
atri
x -
Po
tab
le W
ater
Str
ateg
ies
Eva
luat
ion
Cri
teri
a
To
tal
Ran
kK
ey V
uln
erab
ility
/ A
dap
tati
on
Str
ateg
yS
ea L
evel
Ris
e Im
pac
t to
S
an D
ieg
o B
ay
4 of
11
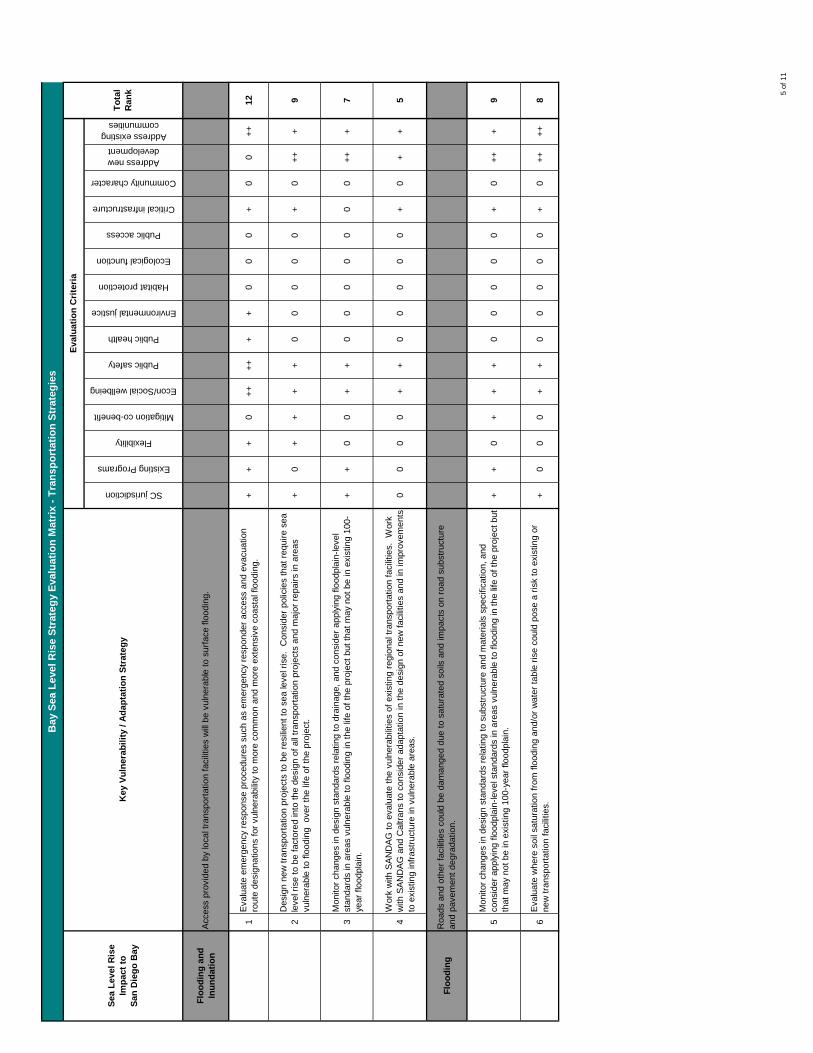
SC jurisdiction
Existing Programs
Flexibility
Mitigation co-benefit
Econ/Social wellbeing
Public safety
Public health
Environmental justice
Habitat protection
Ecological function
Public access
Critical infrastructure
Community character
Address new development
Address existing communities
Flo
od
ing
an
d
Inu
nd
atio
n
1E
valu
ate
emer
genc
y re
spon
se p
roce
dure
s su
ch a
s em
erge
ncy
resp
onde
r ac
cess
and
eva
cuat
ion
rout
e de
sign
atio
ns fo
r vu
lner
abili
ty to
mor
e co
mm
on a
nd m
ore
exte
nsiv
e co
asta
l flo
odin
g.+
++
0+
++
++
+0
00
+0
0+
+12
2D
esig
n ne
w tr
ansp
orta
tion
proj
ects
to b
e re
silie
nt to
sea
leve
l ris
e. C
onsi
der
polic
ies
that
req
uire
sea
le
vel r
ise
to b
e fa
ctor
ed in
to th
e de
sign
of a
ll tr
ansp
orta
tion
proj
ects
and
maj
or r
epai
rs in
are
as
vuln
erab
le to
floo
ding
ove
r th
e lif
e of
the
proj
ect.
+0
++
++
00
00
0+
0+
++
9
3M
onito
r ch
ange
s in
des
ign
stan
dard
s re
latin
g to
dra
inag
e, a
nd c
onsi
der
appl
ying
floo
dpla
in-le
vel
stan
dard
s in
are
as v
ulne
rabl
e to
floo
ding
in th
e lif
e of
the
proj
ect b
ut th
at m
ay n
ot b
e in
exi
stin
g 10
0-ye
ar fl
oodp
lain
.+
+0
0+
+0
00
00
00
++
+7
4W
ork
with
SA
ND
AG
to e
valu
ate
the
vuln
erab
ilitie
s of
exi
stin
g re
gion
al tr
ansp
orta
tion
faci
litie
s. W
ork
with
SA
ND
AG
and
Cal
tran
s to
con
side
r ad
apta
tion
in th
e de
sign
of n
ew fa
cilit
ies
and
in im
prov
emen
ts
to e
xist
ing
infr
astr
uctu
re in
vul
nera
ble
area
s.0
00
0+
+0
00
00
+0
++
5
Flo
od
ing
5M
onito
r ch
ange
s in
des
ign
stan
dard
s re
latin
g to
sub
stru
ctur
e an
d m
ater
ials
spe
cific
atio
n, a
nd
cons
ider
app
lyin
g flo
odpl
ain-
leve
l sta
ndar
ds in
are
as v
ulne
rabl
e to
floo
ding
in th
e lif
e of
the
proj
ect b
ut
that
may
not
be
in e
xist
ing
100-
year
floo
dpla
in.
++
0+
++
00
00
0+
0+
++
9
6E
valu
ate
whe
re s
oil s
atur
atio
n fr
om fl
oodi
ng a
nd/o
r w
ater
tabl
e ris
e co
uld
pose
a r
isk
to e
xist
ing
or
new
tran
spor
tatio
n fa
cilit
ies.
+0
00
++
00
00
0+
0+
++
+8
Roa
ds a
nd o
ther
faci
litie
s co
uld
be d
aman
ged
due
to s
atur
ated
soi
ls a
nd im
pact
s on
roa
d su
bstr
uctu
re
and
pave
men
t deg
rada
tion.
Bay
Sea
Lev
el R
ise
Str
ateg
y E
valu
atio
n M
atri
x -
Tra
nsp
ort
atio
n S
trat
egie
s
Eva
luat
ion
Cri
teri
a
To
tal
Ran
kK
ey V
uln
erab
ility
/ A
dap
tati
on
Str
ateg
yS
ea L
evel
Ris
e Im
pac
t to
S
an D
ieg
o B
ay
Acc
ess
prov
ided
by
loca
l tra
nspo
rtat
ion
faci
litie
s w
ill b
e vu
lner
able
to s
urfa
ce fl
oodi
ng.
5 of
11

SC jurisdiction
Existing Programs
Flexibility
Mitigation co-benefit
Econ/Social wellbeing
Public safety
Public health
Environmental justice
Habitat protection
Ecological function
Public access
Critical infrastructure
Community character
Address new development
Address existing communities
Flo
od
ing
Als
o a
dd
ress
es
tran
spo
rtat
ion
vu
lner
abili
ties
1E
valu
ate
emer
genc
y re
spon
se p
roce
dure
s su
ch a
s em
erge
ncy
resp
onde
r ac
cess
and
eva
cuat
ion
rout
e de
sign
atio
ns fo
r vu
lner
abili
ty to
mor
e co
mm
on a
nd m
ore
exte
nsiv
e co
asta
l flo
odin
g.+
++
0+
++
++
+0
00
+0
0+
+12
2G
athe
r m
ore
spec
ific
info
rmat
ion
abou
t eac
h cr
itica
l fac
ility
and
ens
ure
that
a r
egio
nal d
ata
base
co
ntai
ns k
ey in
form
atio
n on
floo
d he
ight
s an
d bu
ildin
g el
evat
ion
leve
ls.
+0
00
++
++
00
00
++
00
+8
3S
et h
ighe
r st
anda
rds
for
all e
mer
genc
y re
spon
se fa
cilit
ies
that
cou
ld b
e ex
pose
d to
floo
ding
dur
ing
thei
r lif
e sp
an.
+0
00
++
++
00
00
++
0+
08
4C
reat
e re
gion
al a
gree
men
ts fo
r eq
uipm
ent s
harin
g an
d ex
chan
ges
in o
rder
to e
nhan
ce a
bilit
y to
re
spon
d du
ring
extr
eme
even
ts.
00
+0
++
++
00
00
++
00
07
Tw
o fir
e st
atio
ns in
Cor
onad
o an
d S
an D
iego
are
mod
erat
ely
vuln
erab
le to
floo
ding
in th
e 21
00 E
xtre
me
Eve
nt s
cena
rio o
nly.
Bay
Sea
Lev
el R
ise
Str
ateg
y E
valu
atio
n M
atri
x -
Em
erg
ency
Res
po
nse
Fac
iliti
es S
trat
egie
s
Eva
luat
ion
Cri
teri
a
To
tal
Ran
kK
ey V
uln
erab
ility
/ A
dap
tati
on
Str
ateg
yS
ea L
evel
Ris
e Im
pac
t to
S
an D
ieg
o B
ay
6 of
11

SC jurisdiction
Existing Programs
Flexibility
Mitigation co-benefit
Econ/Social wellbeing
Public safety
Public health
Environmental justice
Habitat protection
Ecological function
Public access
Critical infrastructure
Community character
Address new development
Address existing communities
Flo
od
ing
an
d
Inu
nd
atio
n
1E
valu
ate
resp
onse
s fo
r ad
dres
sing
futu
re fl
oodi
ng fr
om th
e bo
at c
hann
el a
t the
eas
t end
of t
he
runw
ay.
++
++
0+
+0
00
00
++
00
++
10
2In
corp
orat
e se
a le
vel r
ise
flood
sce
nario
s at
SD
IA in
to th
e R
egio
nal A
viat
ion
Str
ateg
ic P
lan
(RA
SP
) pr
oces
s an
d th
e co
nsid
erat
ion
of a
ltern
ativ
e si
tes.
++
++
0+
+0
00
00
++
00
++
10
3In
the
SD
IA M
aste
r P
lan,
exp
lore
pot
entia
l for
rec
onfig
urin
g ai
rpor
t acc
ess
away
from
key
roa
ds th
at
may
exp
erie
nce
sign
ifica
nt fl
oodi
ng a
nd a
re th
reat
ened
by
inun
datio
n.+
+0
0+
+0
00
00
++
0+
+8
Par
ts o
f the
Airp
ort s
ite w
ill b
e vu
lner
able
to lo
caliz
ed fl
oodi
ng fr
om b
lock
ed s
torm
out
falls
into
the
Bay
. In
th
e 21
00 s
cena
rios,
Airp
ort o
pera
tions
will
be
extr
emel
y vu
lner
able
to B
ay fl
oodi
ng, p
artic
ular
ly fr
om
impa
cts
on a
cces
s ro
ads,
futu
re te
rmin
als,
and
por
tions
of t
he r
unw
ay/a
irfie
ld.
Bay
Sea
Lev
el R
ise
Str
ateg
y E
valu
atio
n M
atri
x -
Reg
ion
al A
irp
ort
Op
erat
ion
s S
trat
egie
s
Eva
luat
ion
Cri
teri
a
To
tal
Ran
kK
ey V
uln
erab
ility
/ A
dap
tati
on
Str
ateg
yS
ea L
evel
Ris
e Im
pac
t to
S
an D
ieg
o B
ay
7 of
11

SC jurisdiction
Existing Programs
Flexibility
Mitigation co-benefit
Econ/Social wellbeing
Public safety
Public health
Environmental justice
Habitat protection
Ecological function
Public access
Critical infrastructure
Community character
Address new development
Address existing communities
Flo
od
ing
an
d
Inu
nd
atio
n
1In
new
rem
edia
tion,
ens
ure
that
BM
Ps
are
desi
gned
to b
e re
silie
nt to
end
-of-
cent
ury
sea
leve
l ris
e.+
++
+0
++
++
++
++
+0
0+
+0
+16
2C
ondu
ct a
targ
eted
ass
essm
ent o
f spe
cific
hig
h-ris
k co
ntam
inat
ed s
ites,
res
ultin
g in
a m
ap o
f the
se
site
s an
d ut
ilize
find
ings
to p
riorit
ize
adap
tatio
n re
spon
ses
whe
re s
ites
are
vuln
erab
le.
++
++
0+
++
++
++
++
00
++
0+
16
3C
ondu
ct a
n im
prov
ed r
egio
nal a
sses
smen
t, in
con
junc
tion
with
the
Nav
y, fo
cuse
d on
the
diffe
rent
ty
pes
of s
ites
and
thei
r sp
ecifi
c vu
lner
abili
ties
to fu
ture
con
ditio
ns.
+0
+0
++
++
++
++
+0
0+
+0
+14
4D
eepe
n co
llabo
ratio
n w
ith S
tate
, Cou
nty
DE
H, a
nd R
egio
nal W
ater
Qua
lity
Con
trol
Boa
rd+
0+
0+
++
++
++
++
00
+0
0+
13
Hig
hly
vuln
erab
le to
maj
or fl
oodi
ng e
vent
s as
sto
rage
tank
s in
the
area
cou
ld b
e op
ened
or
mov
ed, o
r m
otor
s an
d pu
mps
cou
ld b
e im
paire
d th
us r
elea
sing
con
tam
inat
ion
into
floo
d w
ater
s or
are
a so
ils
Bay
Sea
Lev
el R
ise
Str
ateg
y E
valu
atio
n M
atri
x -
Co
nta
min
ated
Sit
es S
trat
egie
s
Eva
luat
ion
Cri
teri
a
To
tal
Ran
kK
ey V
uln
erab
ility
/ A
dap
tati
on
Str
ateg
yS
ea L
evel
Ris
e Im
pac
t to
S
an D
ieg
o B
ay
8 of
11

SC jurisdiction
Existing Programs
Flexibility
Mitigation co-benefit
Econ/Social wellbeing
Public safety
Public health
Environmental justice
Habitat protection
Ecological function
Public access
Critical infrastructure
Community character
Address new development
Address existing communities
Flo
od
ing
an
d
Inu
nd
atio
n
1P
riorit
ize
the
deve
lopm
ent o
f pas
sive
, nat
ural
ized
par
ks, o
pen
spac
e, a
nd h
abita
t lan
d in
are
as th
at
are
vuln
erab
le to
floo
ding
, to
min
imiz
e ris
k to
hig
her-
valu
e in
fras
truc
ture
; to
prom
ote
publ
ic a
cces
s as
sh
orel
ine
cond
ition
s ch
ange
; and
to p
rom
ote
low
-impa
ct d
evel
opm
ent s
torm
wat
er m
anag
emen
t.+
++
++
++
++
++
++
++
++
++
+20
2D
evel
op in
terp
retiv
e si
gnag
e an
d in
stal
latio
ns in
sho
relin
e pu
blic
acc
ess
area
s, d
escr
ibin
g cl
imat
e ch
ange
impa
cts
and
resp
onse
s on
San
Die
go B
ay.
++
++
0+
++
+0
0+
+0
+0
011
Als
o a
C
om
pre
hen
sive
S
trat
egy
3E
valu
ate
site
-spe
cific
vul
nera
bilit
ies,
iden
tifyi
ng s
truc
ture
s su
ch a
s bu
ildin
gs, d
ocks
, and
pie
rs th
at
may
be
at r
isk.
Ide
ntify
ada
ptat
ion
resp
onse
s as
pla
ns o
r pr
ojec
ts a
re d
evel
oped
.+
0+
0+
+0
++
0+
+0
+0
+10
The
sys
tem
is h
ighl
y vu
lner
able
to fl
oodi
ng b
ecau
se o
f loc
atio
n in
floo
d-pr
one
shor
elin
e ar
eas,
but
ad
aptiv
e ca
paci
ty to
cop
e w
ith fl
oodi
ng is
hig
her
than
for
mos
t oth
er s
yste
ms.
Bay
Sea
Lev
el R
ise
Str
ateg
y E
valu
atio
n M
atri
x -
Par
ks, R
ecre
atio
n, a
nd
Sh
ore
line
Pu
blic
Acc
ess
Str
ateg
ies
Eva
luat
ion
Cri
teri
a
To
tal
Ran
kK
ey V
uln
erab
ility
/ A
dap
tati
on
Str
ateg
yS
ea L
evel
Ris
e Im
pac
t to
S
an D
ieg
o B
ay
9 of
11
SC jurisdiction
Existing Programs
Flexibility
Mitigation co-benefit
Econ/Social wellbeing
Public safety
Public health
Environmental justice
Habitat protection
Ecological function
Public access
Critical infrastructure
Community character
Address new development
Address existing communities
Hab
itat
Sh
ift
1E
xpan
d or
pre
serv
e ec
olo
gic
al b
uff
ers
aro
und
deve
lopm
ent w
here
feas
ible
to a
llow
for
inla
nd
mig
ratio
n of
wet
land
s, s
alt m
arsh
es, a
nd o
ther
hab
itat s
yste
ms
++
+0
++
00
++
++
+0
+0
011
2D
evel
op a
dec
isio
n-m
akin
g fr
amew
ork
for
sele
ctin
g an
d im
plem
entin
g S
LR
man
agem
ent
pra
ctic
es
such
as
hard
def
ense
s, s
oft d
efen
ses,
acc
omm
odat
ion,
and
man
aged
ret
reat
that
incl
udes
co
nsid
erat
ion
of e
cosy
stem
and
hab
itat g
oals
and
vul
nera
bilit
ies.
+0
++
++
00
++
+0
0+
+10
3R
esea
rch
and
iden
tify
loca
tions
with
the
grea
test
pot
entia
l for
land
war
d m
igra
tion
of w
etla
nds
++
+0
+0
+0
++
++
00
+0
010
4E
xpan
d or
adj
ust c
onse
rvat
ion
area
s to
enh
ance
the
resi
lienc
e of
eco
syst
ems.
In
the
acq
uis
itio
n o
f ne
w c
onse
rvat
ion
land
s in
the
San
Die
go r
egio
n, c
onsi
der
how
eco
syst
ems
will
cha
nge
due
to s
ea
leve
l ris
e, p
riorit
izin
g ar
eas
that
cou
ld e
volv
e in
to e
cosy
stem
s th
reat
ened
by
sea
leve
l ris
e el
sew
here
.+
+0
0+
00
0+
++
++
0+
00
9
5E
valu
ate
thre
ats
to h
abit
at c
on
nec
tivi
ty, a
nd p
rote
ct h
abita
t cor
ridor
s to
faci
litat
e sp
ecie
s sh
ift to
vi
able
adj
acen
t hab
itat a
s an
ada
ptiv
e re
spon
se to
sea
leve
l ris
e.+
++
0+
00
0+
++
+0
0+
00
9
6W
here
feas
ible
, des
ign
low
-impa
ct s
torm
wat
er B
MP
s to
als
o pr
ovid
e ha
bita
t. +
00
++
00
0+
++
+0
00
++
9
7E
nsur
e th
at e
colo
gica
l res
tora
tio
n p
roje
cts
are
desi
gned
to b
e re
silie
nt to
sea
leve
l ris
e, to
the
exte
nt
feas
ible
.+
0+
++
00
0+
++
+0
00
00
8
8E
valu
ate,
min
imiz
e an
d m
itig
ate
eco
log
ical
imp
acts
of
sho
relin
e h
ard
enin
g p
roje
cts
dev
elop
ed in
re
spon
se to
sea
leve
l ris
e.+
00
0+
+0
0+
++
+0
0+
00
8
9P
ursu
e re
sear
ch to
iden
tify
spec
ies
rang
es, m
on
ito
rin
g h
abit
at s
hif
t an
d id
entif
ying
any
em
ergi
ng
conf
licts
bet
wee
n ex
istin
g an
d in
com
ing
habi
tat t
ypes
.
++
+0
+0
00
++
+0
00
00
7
Pri
ori
ty f
or
TA
C10
Pur
sue
rese
arch
stu
dies
to fu
rthe
r id
entif
y ec
osys
tem
ben
efits
, esp
ecia
lly th
roug
h ec
on
om
ic
valu
atio
n o
f eco
syst
em s
ervi
ces,
to a
id in
cos
t-be
nefit
ana
lysi
s of
con
serv
atio
n an
d re
stor
atio
n pr
ojec
ts th
at r
educ
e se
a le
vel r
ise
vuln
erab
ilitie
s.
++
+0
+0
00
++
00
00
06
Pri
ori
ty f
or
TA
C11
En
han
ce t
he
SL
AM
M m
od
el a
nd p
erfo
rm o
ther
ass
essm
ents
that
will
hel
p to
det
erm
ine
the
mos
t vu
lner
able
hab
itat t
ypes
and
loca
tions
. +
++
0+
00
0+
+0
00
00
6
12S
triv
e to
cre
ate
hab
itat
mit
igat
ion
pro
ject
s a
re r
esili
ent t
o se
a le
vel r
ise.
Eva
luat
e ho
w m
itiga
tion
proj
ects
will
be
affe
cted
by
SLR
and
enc
oura
ge a
cqui
sitio
n of
upl
and
area
s al
so w
hen
anal
ysis
in
dica
tes
that
con
serv
ed n
ears
hore
hab
itat w
ill b
e lo
st to
sea
leve
l ris
e.+
0+
0+
00
0+
++
00
00
06
Bay
Sea
Lev
el R
ise
Str
ateg
y E
valu
atio
n M
atri
x -
Eco
syst
em S
trat
egie
s
Eva
luat
ion
Cri
teri
a
To
tal
Ran
kA
dap
tati
on
Str
ateg
yS
ea L
evel
Ris
e Im
pac
t to
S
an D
ieg
o B
ay
10 o
f 11
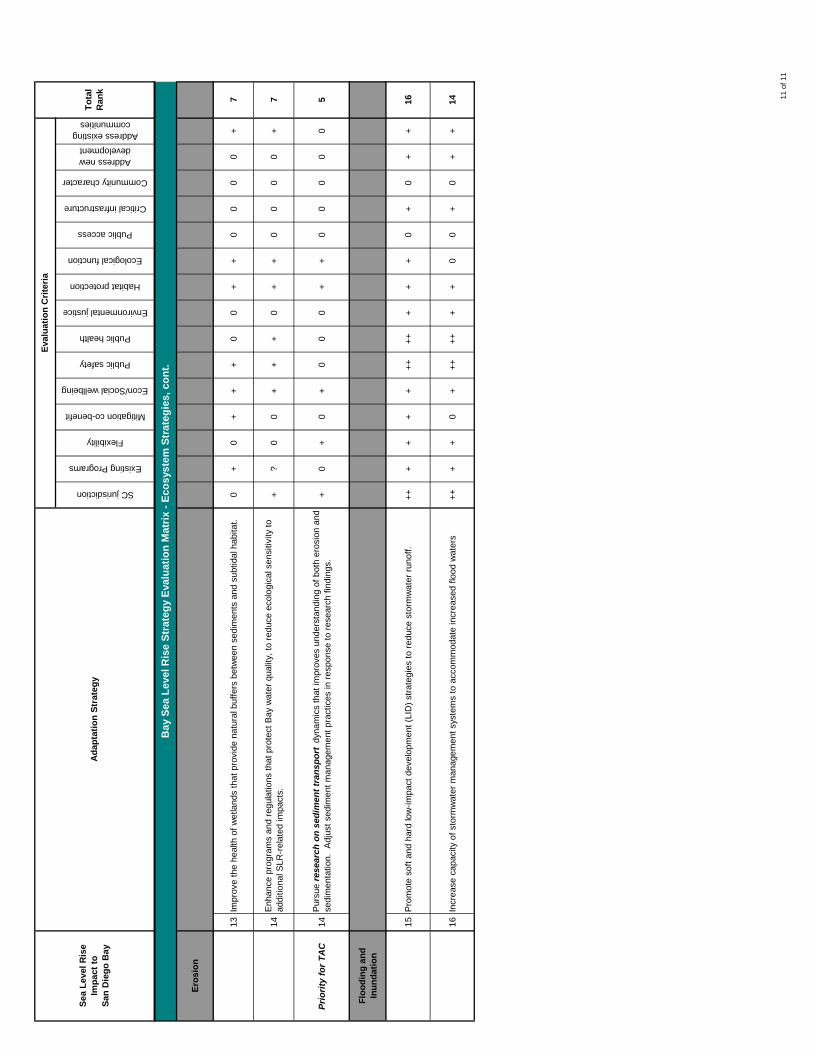
SC jurisdiction
Existing Programs
Flexibility
Mitigation co-benefit
Econ/Social wellbeing
Public safety
Public health
Environmental justice
Habitat protection
Ecological function
Public access
Critical infrastructure
Community character
Address new development
Address existing communities
Eva
luat
ion
Cri
teri
a
To
tal
Ran
kA
dap
tati
on
Str
ateg
yS
ea L
evel
Ris
e Im
pac
t to
S
an D
ieg
o B
ay
Ero
sio
n
13Im
prov
e th
e he
alth
of w
etla
nds
that
pro
vide
nat
ural
buf
fers
bet
wee
n se
dim
ents
and
sub
tidal
hab
itat.
0+
0+
++
00
++
00
00
+7
14E
nhan
ce p
rogr
ams
and
regu
latio
ns th
at p
rote
ct B
ay w
ater
qua
lity,
to r
educ
e ec
olog
ical
sen
sitiv
ity to
ad
ditio
nal S
LR-r
elat
ed im
pact
s.+
?0
0+
++
0+
+0
00
0+
7
Pri
ori
ty f
or
TA
C14
Pur
sue
rese
arch
on
sed
imen
t tr
ansp
ort
dyn
amic
s th
at im
prov
es u
nder
stan
ding
of b
oth
eros
ion
and
sedi
men
tatio
n. A
djus
t sed
imen
t man
agem
ent p
ract
ices
in r
espo
nse
to r
esea
rch
findi
ngs.
+0
+0
+0
00
++
00
00
05
Flo
od
ing
an
d
Inu
nd
atio
n
15P
rom
ote
soft
and
hard
low
-impa
ct d
evel
opm
ent (
LID
) st
rate
gies
to r
educ
e st
orm
wat
er r
unof
f.
++
++
++
++
++
++
+0
+0
++
16
16In
crea
se c
apac
ity o
f sto
rmw
ater
man
agem
ent s
yste
ms
to a
ccom
mod
ate
incr
ease
d flo
od w
ater
s+
++
+0
++
++
++
+0
0+
0+
+14
Bay
Sea
Lev
el R
ise
Str
ateg
y E
valu
atio
n M
atri
x -
Eco
syst
em S
trat
egie
s, c
on
t.
11 o
f 11