Sea Ice Concentration Estimation Method with Satellite ...
7
(IJARAI) International Journal of Advanced Research in Artificial Intelligence, Vol. 2, No.5, 2013 7 | Page www.ijarai.thesai.org Sea Ice Concentration Estimation Method with Satellite Based Visible to Near Infrared Radiometer Data Based on Category Decomposition Kohei Arai 1 Graduate School of Science and Engineering Saga University Saga City, Japan Abstract—Unmixing method for estimation of mixing ratio of the components of which the pixel in concern consists based on inversion theory is proposed together with its application to sea ice estimation method with satellite based visible to near infrared radiometer data. Through comparative study on the different unmixing methods with remote sensing satellite imagery data, it is found that the proposed inversion theory based unmixing method is superior to the other methods. Also it is found that the proposed unmixing method is applicable to sea ice concentration estimations. Keywords—Unmixing; Inversion theory; Category decomposition; Remote Sensing I. INTRODUCTION Estimation of mixing ratio of the components of which the pixel in concern consists is called as “Unmixing”. Inversion theory based method is proposed together with its application to sea ice estimation method with satellite based visible to near infrared radiometer data. There are previously proposed methods such application oriented unmixing methods for hyperspectral instrument data, inversion theory based methods, etc. On the other hands, there are many ice concentration estimation methods. Most of the methods utilize relations between brightness temperature and ice concentration. Estimation accuracy of the methods, however, is not good enough. In order to improve ice concentration estimation accuracy, inversion theory based unmixing method is introduced. Through comparative study on the different unmixing methods with remote sensing satellite imagery data, it is found that the proposed inversion theory based unmixing method is superior to the other methods. Also it is found that the proposed unmixing method is applicable to sea ice concentration estimations. The following section describes the proposed ice concentration estimation method followed by some experiments. Then conclusion is described with some discussions. II. PROPOSED SEA ICE CONCENTRATION ESTIMATION METHOD A. Conventional Method The conventional method for sea ice concentration estimation method uses relation between brightness temperature which is acquired with microwave scanning radiometer onboard remote sensing satellite, T B and sea ice concentration, C. Figure 1 shows an example of the relation. US Navy proposed this relation for sea ice concentration estimation. It is assumed empirically that brightness temperature of sea water is around 135K while that of sea ice is around 240K which is derived from NIMBUS-5/ESMR. Fig. 1. Relation between brightness temperature and sea ice concentration Glosen et al., proposed the equation (1) for sea ice concentration. (1) Where Tb and Ts denotes brightness temperature of sea ice and the ocean derived from NIMUS-7/ESMR and ε denotes emissivity of sea ice (around 0.92).
Transcript of Sea Ice Concentration Estimation Method with Satellite ...
(IJARAI) International Journal of Advanced Research in Artificial Intelligence, Vol. 2, No.5, 2013
7 | P a g e www.ijarai.thesai.org
Sea Ice Concentration Estimation Method with
Satellite Based Visible to Near Infrared Radiometer
Data Based on Category Decomposition
Kohei Arai 1
Graduate School of Science and Engineering
Saga University Saga City, Japan
Abstract—Unmixing method for estimation of mixing ratio of
the components of which the pixel in concern consists based on
inversion theory is proposed together with its application to sea
ice estimation method with satellite based visible to near infrared
radiometer data. Through comparative study on the different
unmixing methods with remote sensing satellite imagery data, it
is found that the proposed inversion theory based unmixing
method is superior to the other methods. Also it is found that the
proposed unmixing method is applicable to sea ice concentration estimations.
Keywords—Unmixing; Inversion theory; Category
decomposition; Remote Sensing
I. INTRODUCTION
Estimation of mixing ratio of the components of which the pixel in concern consists is called as “Unmixing”. Inversion theory based method is proposed together with its application to sea ice estimation method with satellite based visible to near infrared radiometer data. There are previously proposed methods such application oriented unmixing methods for hyperspectral instrument data, inversion theory based methods, etc.
On the other hands, there are many ice concentration estimation methods. Most of the methods utilize relations between brightness temperature and ice concentration. Estimation accuracy of the methods, however, is not good enough. In order to improve ice concentration estimation accuracy, inversion theory based unmixing method is introduced.
Through comparative study on the different unmixing methods with remote sensing satellite imagery data, it is found that the proposed inversion theory based unmixing method is superior to the other methods. Also it is found that the proposed unmixing method is applicable to sea ice concentration estimations.
The following section describes the proposed ice concentration estimation method followed by some experiments. Then conclusion is described with some discussions.
II. PROPOSED SEA ICE CONCENTRATION ESTIMATION
METHOD
A. Conventional Method
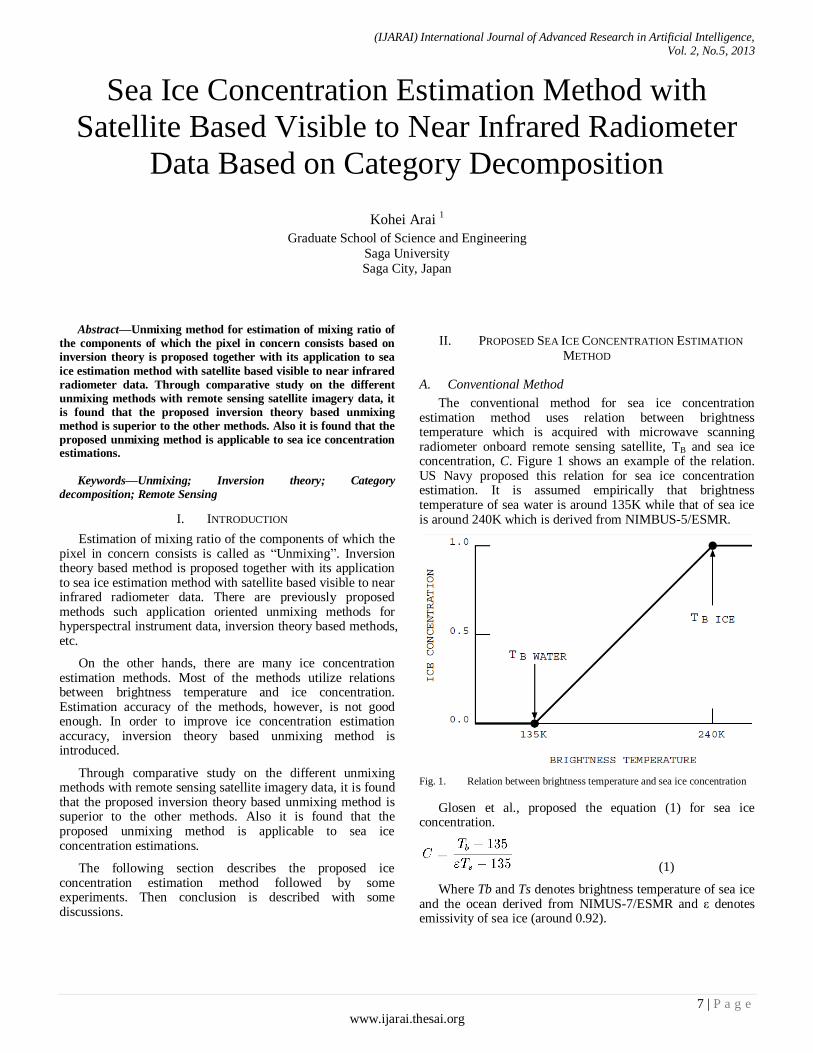
The conventional method for sea ice concentration estimation method uses relation between brightness temperature which is acquired with microwave scanning radiometer onboard remote sensing satellite, TB and sea ice concentration, C. Figure 1 shows an example of the relation. US Navy proposed this relation for sea ice concentration estimation. It is assumed empirically that brightness temperature of sea water is around 135K while that of sea ice is around 240K which is derived from NIMBUS-5/ESMR.
Fig. 1. Relation between brightness temperature and sea ice concentration
Glosen et al., proposed the equation (1) for sea ice concentration.
(1)
Where Tb and Ts denotes brightness temperature of sea ice and the ocean derived from NIMUS-7/ESMR and ε denotes emissivity of sea ice (around 0.92).

(IJARAI) International Journal of Advanced Research in Artificial Intelligence, Vol. 2, No.5, 2013
8 | P a g e www.ijarai.thesai.org
NASDA (Current JAXA) proposed the following equation for sea ice concentration estimation,
(2)
Where D denotes digital number which corresponds to the brightness temperature derived from vertical polarization of 37 GHz of frequency channel of MOS-1/MSR (Marine Observation Satellite-1/ Microwave Scanning Radiometer).
Meanwhile, NASA Team (SSIAWT) proposed the following method with horizontal and vertical polarization of 19 GHz channels and vertical polarization of 37GHz channel of digital count of data.
(3)
Where CT, CF, CM denotes total sea ice concentration, first year ice concentration, multiyear sea ice concentration. PR, GR denotes Polarization Ratio and Gradient Ratio, and D denotes digital number. Water vapor content in the atmosphere may affect to sea ice concentration estimations. In order to remove the influence due to water vapor, the following equation is utilizing,
(4)
Then the following Comisso Bootstrap algorithm is widely used method for sea ice concentration estimation.
(5)
The Bootstrap algorithm takes into account ocean area dependency (Antarctic and Arctic ocean areas are different treatments). Also open water is detected with the following equation,
(6)
Seasonal changes and ocean area dependency are taken into account.
B. Inversion Theory Based Unmixing Method
Mixing ratio of component of which the observed pixel consists of the components, aj can be estimated as follows,
(7)
Where Mj denotes represented spectral characteristic of the component in concern, j and P denotes spectral characteristic of the observed pixel. Equation (7) can be rewritten by the following equation,
(8)
where
If M is nonsingular matrix (square matrix), then mixing ratio vector can be estimated as follows,
(9)
Even if M is singular matrix (rectangle matrix), then mixing ratio vector can be expressed using the following Moore Penrose Inverse Matrix, M+.
(10)
It is possible to solve the equation with the following conditions,
(11)
Introducing Lagrange multiplier, then the equation can be solved as follows,
(12)
Thus mixing ratio vector A can be estimated through solving the following equations,
(13)
Equation (13) can be rewritten as follows, in the vector form,
(14)

(IJARAI) International Journal of Advanced Research in Artificial Intelligence, Vol. 2, No.5, 2013
9 | P a g e www.ijarai.thesai.org
Thus
(15)
Where
(16)
Then A is rewritten from the equation (15) as follows,
(17)
Thus the mixing ratio vector can be estimated.
Although M denotes the representative observation vector, it contains error vector E as follows,
(18)
Namely, M is different from the true representative observation vector of M0. Then the true mixing ratio is expressed as follows,
(19)
Then estimation error of mixing ratio vector is expressed as follows,
(20)
where denotes the angle between and
while denotes the angle between u and . Then estimation error can be expressed as follows,
(21)
Meanwhile the equation can be solved with the following conditions,
(22)
These conditions are corresponding to the following conditions,
(23)
Introducing Langrange multiplier, then
(24)
Minimizing the error, M+-N, then
(25)
Introducing the following equation,
(26)
With the following conditional equations,
(27)
Then V can be rewritten as follows in the vector representation,
(28)
and then Langrange multiplier can be expressed as follows,
(29)
Thus all unknown variables are estimated as follows,
(30)
Estimated mixing ratio A2 and estimation error, are expressed as follows,
(31)
M includes observation error so that P can be expressed with the following equation by considering the error ε,

(IJARAI) International Journal of Advanced Research in Artificial Intelligence, Vol. 2, No.5, 2013
10 | P a g e www.ijarai.thesai.org
(32)
This method is referred to “Least Square Method”.
If the components of M are followed by normal distribution as follows,
(33)
where
Then the probability of observation vector M can be expressed as follows,
(34)
It is rewritten in the vector form as follows,
(35)
Best estimation of mixing ratio vector is to maximizing probability of observation vector so that,
(36)
All of the meshed points of equation (36) can be calculated then the maximum probability of the observation vector can be found which results in estimation of mixing ratio. This method is referred to “Maximum Likelihood Method”.
III. EXPERIMENTS
C. Data Used
ADEOS/AVNIR (Advanced Earth Observing Satellite/Advanced Visible to Near Infrared Radiometer) imagery data of Saroma Lake in Hokkaido, Japan which is acquired on February 1997 is used for the experiments. AVNIR consist of four spectral bands, blue (B1), green (B2), red (B3) and near infrared (B4) wavelength regions.
From the original imagery data, 400 by 400 pixels of portion of image are extracted for the experiments. Instantaneous Field of View: IFOV is 16 meters. Figure 2 shows the averaged image among the four spectral bands of imagery data. The typical digital numbers of the spectral bands are shown in Table 1.
TABLE I. TYPICAL PIXEL VALUE OF THE COMPONENTS FOR ALL
SPECTRAL BANDS OF ADEOS/AVNIR
Figure 2 shows the ADEOS/AVNIR image for experiments. Figure 3 (a), (b), and (c) shows open water, thin sea ice, and thick sea ice estimated by Maximum Likelihood Method.
Fig. 2. ADEOS/AVNIR (Advanced Earth Observing Satellite/Advanced
Visible to Near Infrared Radiometer) imagery data of Saroma Lake in
Hokkaido, Japan which is acquired on February 1997 is used for the
experiments. AVNIR consist of four spectral bands, blue (B1), green (B2), red
(B3) and near infrared (B4) wavelength regions. This image is averaged image among the four spectral bands
On the other hands, Figure 4 (a), (b), and (c) shows three components estimated by Least Square Method. Through comparisons between Figure 3 and 4, Maximum Likelihood Method derived open water, thin and thick sea ice is more likely in comparison to the visual perception.

(IJARAI) International Journal of Advanced Research in Artificial Intelligence, Vol. 2, No.5, 2013
11 | P a g e www.ijarai.thesai.org
(a)Open Water
(b)Thin Sea Ice
(c)Thick Sea Ice
Fig. 3. Estimated three components, open water, thin and thick ice derived
from Maximum Likelihood Method
(a)Open Water

(IJARAI) International Journal of Advanced Research in Artificial Intelligence, Vol. 2, No.5, 2013
12 | P a g e www.ijarai.thesai.org
(b)Thin Sea Ice
(c)Thick Sea Ice
Fig. 4. Estimated three components, open water, thin and thick ice derived from Least Square Method
Figure 5 shows the extracted “Lead” which is defined as breaking portion of sea ice. The percentage ratio of open water ranged from 7 to 50% is defined as Lead. By using unmixing method, mixing ratio of open water can be estimated.
Therefore, the Lead is extracted. The extracted lead, however, is disconnected. Therefore, some consideration of connectivity of the piece of the disconnected lead is required.
Fig. 5. Estimated “Lead” of which mixing ratio of open water ranges from 7 to 50% derived from Maximum Likelihood Method
ADEOS/AVNIR Band 1 image is shown in Figure 6. By using band 1 of imagery data, connectivity between disconnected portions of lead can be found. This information is called as contextual information and can be extracted by using 3 by 3 or 5 by 5 pixel windows. For instance, connectivity between the pixel in concern and the 8 surrounding pixels can be checked with 3 by 3 windows. Using the connectivity, it is possible to connect between disconnected portions of lead. Figure 7 shows the connected lead using contextual information.
Fig. 6. ADEOS/AVNIR Band 1 image of Saroma, Hokkaido, Japan acquired on February 3 1997.

(IJARAI) International Journal of Advanced Research in Artificial Intelligence, Vol. 2, No.5, 2013
13 | P a g e www.ijarai.thesai.org
Fig. 7. Connected lead using contextual information.
IV. CONCLUSION
Unmixing method for estimation of mixing ratio of the components of which the pixel in concern consists based on inversion theory is proposed together with its application to sea ice estimation method with satellite based visible to near infrared radiometer data.
Through comparative study on the different unmixing methods with remote sensing satellite imagery data, it is found that the proposed inversion theory based unmixing method is superior to the other methods. Also it is found that the proposed unmixing method is applicable to sea ice concentration estimations. It is also found that contextual information is effective to connect disconnected portion of lead.
ACKNOWLEDGMENT
The author would like to thank Ms. Izumi Fujio for her effort to conduct the experiments.
REFERENCES
[1] N. Keshava, J. Kerekes, D. Manolakis, and G. Shaw, “An Algorithm Taxonomy for Hyperspectral Unmixing,” SPIE 4049, 2000, pp. 42–63.
[2] A. Tarantola and B. Valette, “Generalized Nonlinear Inverse Problems
Solved Using the Least Squares Criterion,” Rev. Geophys. Space Phys. 20 (2), 1982, pp. 219–232.
AUTHORS PROFILE
Kohei Aarai He received BS, MS and PhD degrees in 1972, 1974 and 1982, respectively. He was with The Institute for Industrial Science and Technology of the University of Tokyo from April 1974 to December 1978 and also was with National Space Development Agency of Japan from January, 1979 to March, 1990. During from 1985 to 1987, he was with Canada Centre for Remote Sensing as a Post Doctoral Fellow of National Science and Engineering Research Council of Canada. He moved to Saga University as a Professor in Department of Information Science on April 1990. He was a councilor for the Aeronautics and Space related to the Technology Committee of the Ministry of Science and Technology during from 1998 to 2000. He was a councilor of Saga University for 2002 and 2003. He also was an executive councilor for the Remote Sensing Society of Japan for 2003 to 2005. He is an Adjunct Professor of University of Arizona, USA since 1998. He also is Vice Chairman of the Commission-A of ICSU/COSPAR since 2008. He wrote 30 books and published 332 journal papers.