SDK Environmental Consulting & Services University of Toronto ...
74
SDK Environmental Consulting & Services 298 John Street, P.O. Box. 87592, Thornhill, Ontario, L3T 5W0, 416‐992‐4116, [email protected] University of Toronto 2015 Solid Non-Hazardous Waste Audit Ontario Regulation 102/94 Prepared for: University of Toronto Facilities & Services 255 McCaul Street, 4th Level Toronto, Ontario M5T 1W7 Prepared by: SDK Environmental Consulting & Services 298 John Street, PO Box 87592 Thornhill, Ontario, L3T 5W0 Phone 416.992.4116 June 2015
Transcript of SDK Environmental Consulting & Services University of Toronto ...

SDK Environmental Consulting & Services
298 John Street, P.O. Box. 87592, Thornhill, Ontario, L3T 5W0, 416‐992‐4116, [email protected]
University of Toronto 2015 Solid Non-Hazardous Waste Audit
Ontario Regulation 102/94
Prepared for:
University of Toronto Facilities & Services
255 McCaul Street, 4th Level Toronto, Ontario
M5T 1W7
Prepared by:
SDK Environmental Consulting & Services 298 John Street, PO Box 87592
Thornhill, Ontario, L3T 5W0 Phone 416.992.4116
June 2015

2015 Solid Non-Hazardous Waste Audit University of Toronto, St. George Campus SDK Environmental P0481 June 2015
ii
Executive Summary The Facilities & Services Department of the University of Toronto (UofT) retained the services of SDK Environmental to conduct a solid non‐hazardous waste audit in the Spring of 2015 at it’s St. George Campus located in downtown Toronto, Ontario. The waste audit examined representative samples of garbage from eighteen buildings over a five (5) day period to gain an understanding of the quantities and composition of solid wastes generated on campus. A multi‐day compactor study was also conducted to visually assess compactor loads for contamination with source separated recyclables. A total waste sample weighing approximately 458.2 kg was collected from the institution and audited between April 20 and 24, 2015. Waste was collected from the various waste generation areas in the facility, including cafeterias, offices, public areas, laboratories, washrooms, and miscellaneous areas. The following list summarizes the average overall waste composition determined from the audit:
Other/Non‐recyclable 58.0%
Paper Towels: 13.5%
Organic Waste 12.1%
Total Mixed Papers: 6.1%
Total Mixed Containers: 5.8%
Coffee Cups: 3.9%
#6 Plastics (Styrofoam): 0.5%
Cardboard 0.1%
Scrap metals: 0.1% Through discussions with UofT personnel and service providers, estimates of the annual amounts of waste materials generated were determined. It was estimated that the facility generated a total of 6458.48 metric tonnes (MT) of solid non‐hazardous waste between May 2013‐April 2014.
Materials diverted from landfill through existing 3Rs programs include cardboard, mixed papers, mixed containers (plastics and metals), scrap wood, scrap metal, paper towel, coffee cups, batteries, light bulbs, electronic goods, yard waste, animal bedding, soil, asphalt, polystyrene, and organics. The total amount of waste material diverted from landfill over this period through existing 3R programs was approximately 4555.43 MT, as summarized in the following table:

2015 Solid Non-Hazardous Waste Audit University of Toronto, St. George Campus SDK Environmental P0481 June 2015
iii
Material Total Waste(Metric Tonnes)
Percent
Waste Disposed to Landfill 1903.05 29.5%
Material Reduced 123.90 1.92%
Material Reused 208.03 3.2%
Material Recycled 2876.03 44.5%
Material Composted 1347.47 20.9%
Total Waste Generated 6458.48 100%
Based on the total amount of waste generated and materials diverted, the waste diversion rate through existing programs at UofT is approximately 70.5%. The facility’s waste diversion rate significantly exceeds the MOE’s provincial objective of 60% diversion to be achieved by year 2008. UofT’s management team are interested in reducing wastes disposed to landfill and maintaining a high waste diversion rate.
2015 Solid Non-Hazardous Waste Audit University of Toronto, St. George Campus SDK Environmental P0481 June 2015
iv
Table of Contents
Executive Summary .............................................................................................................................. ii 1 Introduction ................................................................................................................................ 1 1.1 Purpose ....................................................................................................................................... 1 1.2 Scope of Work ............................................................................................................................ 2 2 Waste Audit Results .................................................................................................................... 2 2.1 Methodology .............................................................................................................................. 2 2.2 Waste Quantities and Distribution ............................................................................................. 4 2.3 Waste Composition .................................................................................................................... 5 2.3.1 Public Areas ................................................................................................................................ 6 2.3.2 Cafeterias .................................................................................................................................... 6 2.3.3 Washrooms ................................................................................................................................. 7 2.3.4 Laboratories ................................................................................................................................ 7 2.3.5 Office & Administrative Areas .................................................................................................... 7 2.3.6 Office Areas ................................................................................................................................ 8 2.3.7 Miscellaneous Areas ................................................................................................................... 9 2.4 Percentage of Recyclables in Trash ............................................................................................ 9 3 Diversion Programs & Waste Systems ..................................................................................... 11 3.1 Waste Diversion Programs ....................................................................................................... 11 3.2 Waste Disposal Systems ........................................................................................................... 12 3.3 Waste Diversion Rate ............................................................................................................... 12 3.4 Capture Rate ............................................................................................................................. 13 3.5 Year over Year Change in Waste Generation ........................................................................... 15 3.5.1 Year‐over‐Year Change in 3Rs Quantities ................................................................................. 15 3.5.2 Year‐over‐Year Change in Trash Disposed ................................................................................ 15 4 Waste Audit Summary & Waste Reduction Work Plan ............................................................ 16 5 Conclusions & Recommendations ............................................................................................ 16
Appendices
Appendix A ................................................................................................ Supporting Documentation Appendix B ................................................................................................................ Waste Audit Data Appendix C ........................................................................................................ Waste Audit Summary Appendix D ............................................................................... Waste Reduction Work Plan Summary

2015 Solid Non-Hazardous Waste Audit University of Toronto, St. George Campus SDK Environmental P0481 June 2015
1
1 Introduction
The Facilities & Services Department of the University of Toronto (UofT) retained the services of SDK Environmental to conduct a solid non‐hazardous waste audit in the Spring of 2015 at it’s St. George Campus located in downtown Toronto, Ontario. The waste audit examined representative samples of garbage from eighteen buildings over a five (5) day period to gain an understanding of the quantities and composition of solid wastes generated on campus. A multi‐day compactor study was also conducted to visually assess compactor loads for contamination with source separated recyclables.
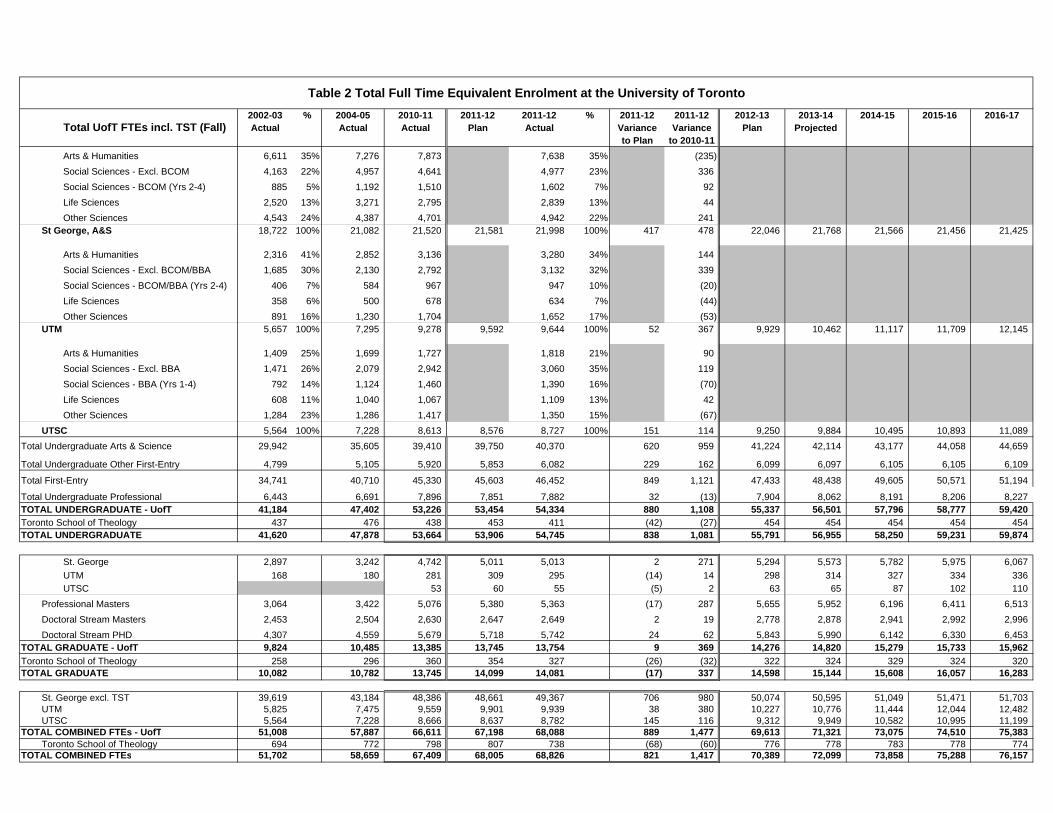
UofT is a large multi‐building community with approximately 60,000 students, staff and faculty occupying approximately 140 buildings that generate waste and recycling materials. According to UofT’s website, 58,866 Full‐Time Equivalent (FTE) undergraduate students attended the university in 2014‐15 (Refer to Appendix A).
UofT conducted the audit proactively to remain in compliance with O.Reg. 102/94. Separation programs are currently implemented at the institute that comply with O.Reg. 103/94. UofT is interested in waste reduction solutions to reduce the amount of wastes disposed to landfills and reduce their impact on the environment.
1.1 Purpose The purpose of the solid non‐hazardous waste audit was to:
Comply with Ontario Regulation 102/94 – Waste Audits and Waste Reduction Work Plans Part XI, which requires educational institutions to conduct a waste audit covering the waste generated by the establishment, and prepare and implement a waste reduction work plan on an annual basis if, at the location or campus, at any time during the calendar year, more than 350 persons are enrolled.
Ensure compliance with Section 14 of O.Reg.103/94 ‘Industrial, Commercial and Institutional Source Separation Programs’ and Part X ‘Educational Institutions’ of the Schedule attached to the Regulation.
Determine the annual waste diversion rate for the facility resulting from existing waste reduction, reuse, and recycling programs;
Identify and quantify the composition and point of generation of waste at the facility;
Identify any additional opportunities for waste reduction and diversion that may exist at the facility; and
Address any specific concerns or opportunities identified during the study.
2015 Solid Non-Hazardous Waste Audit University of Toronto, St. George Campus SDK Environmental P0481 June 2015
2
1.2 Scope of Work
To satisfy the purpose of the waste audit, the following scope of work was completed:
Collected data pertaining to waste composition and collection practices at UofT between April 20 and 24, 2015;
Conducted compactor study at off‐site transfer station between April 27 and May 1, 2015;
Determined the total quantity of waste diverted from landfill through current reduction, reuse, and recycling initiatives at the facility; and
Completed a Waste Audit Report (per MOE protocol) that addressed the amount, nature and composition of the waste, the manner by which the waste was generated, including management decisions and policies that relate to the production of waste, and the way in which the waste is managed on campus; and
Completed a Waste Reduction Work Plan (per MOE protocol) regarding plans to reduce, reuse and recycle waste on campus. The report set out who will implement each part of the plan, when each part will be implemented and what the expected results shall be.
2 Waste Audit Results
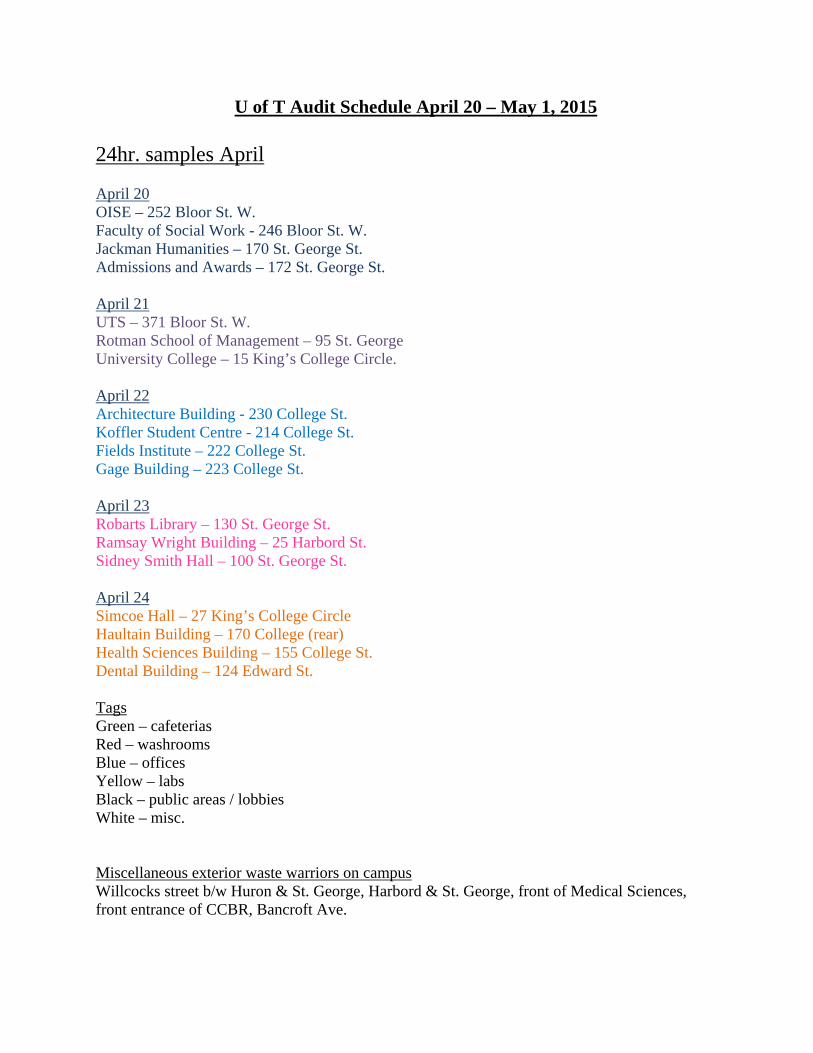
2.1 Methodology The Facilities & Services Department conducts a waste audit of UofT’s St. George Campus twice per year, alternating specific buildings being audited and time of year. Per discussions with UofT personnel, the following locations, summarized in Table 1, were to be audited in the Spring of 2015. Table 1: Spring 2015 Waste Audit Sample Summary
Date Building/Location
April 20, 2015 Jackman Humanities, Admissions and Awards, Faculty of Social Work & OISE
April 21, 2015 Rotman School of Management, University College & UTS
April 22, 2015 Architecture Building, Fields Institute, Gage Building & Koffler Student Centre
April 23, 2015 Ramsay Wright Building, Sydney Smith Hall & Robarts Library
April 24, 2015 Dental Building, Health Sciences Building, Simcoe Hall & Haultain Building
A copy of the original schedule is attached in Appendix A. In coordination with the UofT staff, one (1) twenty‐four hour sample of waste was collected from each of the identified buildings on the audit schedule. Bags of trash were collected and tagged with coloured labels describing the functional area within the building that generated the waste material, as summarized in Table 2:

2015 Solid Non-Hazardous Waste Audit University of Toronto, St. George Campus SDK Environmental P0481 June 2015
3
Table 2: 2014 Waste Audit Functional Area Summary
Colour Tag Functional Areas
Blue Office / Administrative Areas
Yellow Laboratories
Black Public Areas (Class rooms, lobbies, lounges, libraries, corridors, etc.)
Green Cafeterias
Red Washrooms
White Miscellaneous
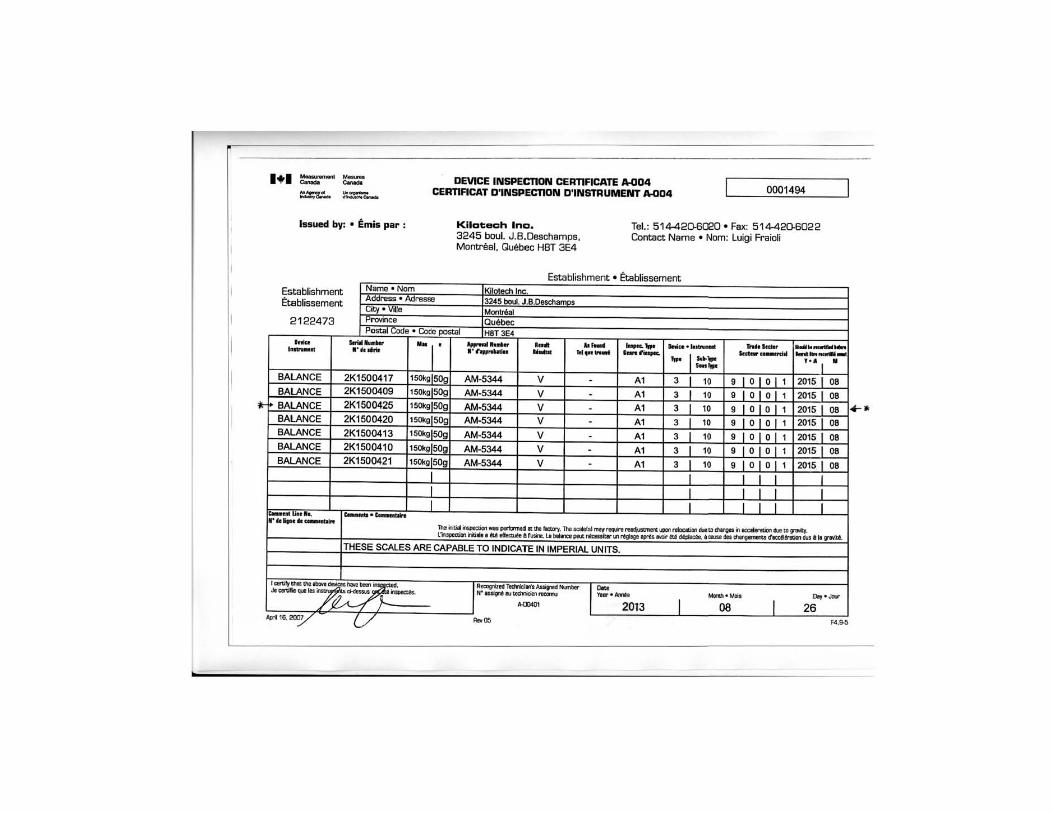
The tagged bags of wastes were brought to designated collection areas by UofT staff and placed into temporary plastic containers. The total bagged weight of all trash collected from each functional area per building were recorded. Refer to Appendix A for a copy of the Scale Calibration Certificate. Waste materials were then unloaded, sorted into individual waste categories, weighted, re‐bagged and disposed of in the appropriate garbage or recycling bins. Samples of garbage were sorted by qualified Waste Reduction Group staff. Some of the source separated materials collected by UofT for recycling (i.e. cardboard, organics, ewastes, printer toners, etc) were not collected and categorized during the audit (due to infrequency of generation) however the annual quantity of each material was reviewed and included in the audit results. Waste material categories were established prior to the audit based on O.Reg.103/94 requirements for source separation at educational institutions:
Aluminum food or beverage cans (including cans made primarily of aluminum);
Cardboard (corrugated);
Fine paper;
Glass bottles and jars for food or beverages;
Newsprint; and
Steel food or beverage cans (including cans made primarily of steel). In addition to these standard categories other important waste streams such as other mixed containers (PET, HDPE, polypropylene, gable top, aseptic), organic wastes, paper towels, mixed plastics, Styrofoam, yard waste, electronic waste (ewaste), scrap wood, scrap metal and special wastes (i.e. batteries, bulbs and ballasts) were included depending on what auditors found in the samples. Visual inspections of waste compactor loads were conducted between April 28 and 30th, 2015 to identify obvious divertible wastes that do not belong in the trash. Emphasis was placed on recyclable materials, large and special items such as furniture, electronics, scrap metals, construction waste, large plastic items, and source separated recyclables that should not have been thrown in the garbage compactor by staff. Compactor audit results can be found in Appendix A.

2015 Solid Non-Hazardous Waste Audit University of Toronto, St. George Campus SDK Environmental P0481 June 2015
4
2.2 Waste Quantities and Distribution A key aspect of O. Reg. 102/94 is for waste generators to gain a good understanding of the areas of their operation that generate the most waste, how it is generated, as well as the waste composition. One can use this information to focus their recycling and waste reduction efforts efficiently and effectively. In total, 458.2 kg of waste was collected as a 24‐hour sample. Table 3 ranks the amount of trash generated per building based on the audit results. Table 3: 2015 Waste Audit – Sample of Garbage per Audited Building
Building Name Sample Percentage(1)
kg %
Robarts Library 80.10 17.5%
Dental Building 70.95 15.5%
Rotman School of Management 55.25 12.1%
UTS 34.65 7.6%
Architecture Building 34.10 7.4%
OISE 33.70 7.4%
Sydney Smith Hall 28.50 6.2%
Jackman Humanities 17.35 3.8%
University College 17.05 3.7%
Simcoe Hall 16.85 3.7%
Fields Institute 16.35 3.6%
Admissions and Awards 13.95 3.0%
Health Sciences Building 13.55 3.0%
Koffler Student Centre 8.75 1.9%
Haultain Building 6.00 1.3%
Ramsay Wright Building 4.65 1.0%
Faculty of Social Work 4.60 1.0%
Gage Building 1.85 0.4%
Total 458.20 100.0%
Note 1: Percentage based on 24‐hr garbage sample results from the waste audit. Based on the 24‐hour results, Robarts Library, the Dental Building and Rotman School of Management are the most significant waste generators. Table 4 ranks trash generated per building functional area based on the audit results.
2015 Solid Non-Hazardous Waste Audit University of Toronto, St. George Campus SDK Environmental P0481 June 2015
5
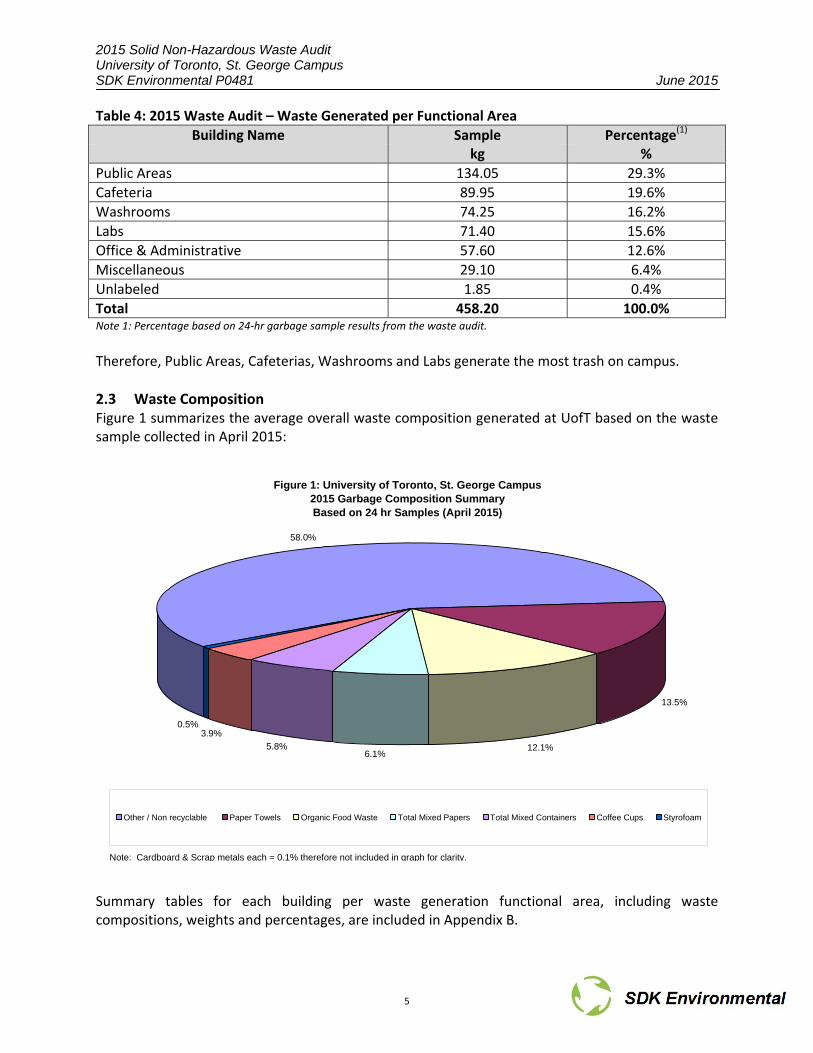
Table 4: 2015 Waste Audit – Waste Generated per Functional Area
Building Name Sample Percentage(1)
kg %
Public Areas 134.05 29.3%
Cafeteria 89.95 19.6%
Washrooms 74.25 16.2%
Labs 71.40 15.6%
Office & Administrative 57.60 12.6%
Miscellaneous 29.10 6.4%
Unlabeled 1.85 0.4%
Total 458.20 100.0%Note 1: Percentage based on 24‐hr garbage sample results from the waste audit.
Therefore, Public Areas, Cafeterias, Washrooms and Labs generate the most trash on campus.
2.3 Waste Composition Figure 1 summarizes the average overall waste composition generated at UofT based on the waste sample collected in April 2015:
Summary tables for each building per waste generation functional area, including waste compositions, weights and percentages, are included in Appendix B.
Figure 1: University of Toronto, St. George Campus2015 Garbage Composition Summary Based on 24 hr Samples (April 2015)
58.0%
13.5%
12.1%6.1%
5.8%
3.9%0.5%
Other / Non recyclable Paper Towels Organic Food Waste Total Mixed Papers Total Mixed Containers Coffee Cups Styrofoam
Note: Cardboard & Scrap metals each = 0.1% therefore not included in graph for clarity.
2015 Solid Non-Hazardous Waste Audit University of Toronto, St. George Campus SDK Environmental P0481 June 2015
6
2.3.1 Public Areas Based on the total amount of waste audited from public areas, the largest primary categories (i.e. >5%) of waste generated were as follows:
o Other/Non‐Recyclable: 67.5% o Organics: 17.0% o Coffee Cups: 6.2% o Total Mixed Containers: 5.3%
The percentage of organic materials is quite high. UofT may wish to investigate the feasibility of adding some additional organics bins in busy public areas. The percentages of coffee cups and mixed containers are fairly high, especially since recycling programs have been implemented for these materials in public areas. Results suggest that better collection systems are required, improved signs and/or improved staff/student education to improve the capture rate of these materials. Public Areas in the following buildings were found to generate the most trash compared to all public areas that were audited:
o Rotman School of Management: 20.9% o Robarts Library: 14.8% o OISE: 12.9% o UTS: 11.4% o Sydney Smith Hall: 10.7%
2.3.2 Cafeterias Based on the total amount of waste audited from cafeterias, the largest primary categories (i.e. >5%) of waste generated were as follows:
o Other/Non‐Recyclable: 56.5% o Organics: 24.4% o Total Mixed Containers: 9.3%
The percentages of organic materials and mixed containers are quite high, especially since recycling programs have been implemented for these materials in cafeterias. Results suggest that better collection systems are required, improved signs and/or improved staff/student education to improve the capture rate of these materials. Cafeterias in the following buildings were found to generate the most trash compared to all cafeterias that were audited:
o Robarts Library: 30.9% o Fields Institute: 12.9% o Dental Building: 11.8% o Sydney Smith Hall: 9.3%
2015 Solid Non-Hazardous Waste Audit University of Toronto, St. George Campus SDK Environmental P0481 June 2015
7
o Rotman School of Management: 8.3%
2.3.3 Washrooms Based on the total amount of waste audited from washrooms, the largest primary categories (i.e. >5%) of waste generated were as follows:
o Paper Towels: 81.2% o Other/Non‐Recyclable: 11.4% o Total Mixed Papers: 6.2%
The percentage of paper towels is quite high. UofT may wish to investigate the feasibility of implementing paper towel recycling in all washrooms to reduce the amount of this material disposed to landfill. Washrooms in the following buildings were found to generate the most trash compared to all washrooms that were audited:
o UTS: 16.8% o Robarts Library: 12.8% o Rotman School of Management: 10.7% o Admissions and Awards: 9.8% o Jackman Humanities: 9.2%
2.3.4 Laboratories Based on the total amount of waste audited from labs, the largest primary categories (i.e. >5%) of waste generated were as follows:
o Other/Non‐Recyclable: 78.6% o Total Mixed Papers: 13.6% o Total Mixed Containers: 5.0%
The percentage of mixed papers is quite high, especially since a recycling program has been implemented for this material in labs. Results suggest that better collection systems are required, improved signs and/or improved staff/student education to improve the capture rate of the material. Labs in the following buildings were found to generate the most trash compared to all labs that were audited:
o Dental Building: 64.5% o Architecture Building: 30.6%
2.3.5 Office & Administrative Areas Based on the total amount of waste audited from office/administrative areas, the largest primary categories (i.e. >5%) of waste generated were as follows:
2015 Solid Non-Hazardous Waste Audit University of Toronto, St. George Campus SDK Environmental P0481 June 2015
8
o Other/Non‐Recyclable: 63.5% o Organics: 10.2% o Total Mixed Papers: 9.7% o Total Mixed Containers: 8.2% o Coffee Cups: 7.5%
The percentage of mixed papers is quite high especially since a recycling program has been implemented for this material. Results suggest that better collection systems are required and/or improved staff education to capture more of the paper materials. The organics content suggests that staff eat meals at their desks. The percentage of mixed containers suggests that improved staff education may be required to capture more of the containers. Office / Administrative Areas in the following buildings were found to generate the most trash compared to all office/administrative areas that were audited:
o Rotman School of Management: 20.7% o Health Sciences Building: 13.8% o Robarts Library: 8.3% o Admissions and Awards: 8.1% o UTS: 7.4%
2.3.6 Office Areas Based on the total amount of waste audited from office/administrative areas, the largest primary categories (i.e. >5%) of waste generated were as follows:
o Other/Non‐Recyclable: 63.5% o Organics: 10.2% o Total Mixed Papers: 9.7% o Total Mixed Containers: 8.2% o Coffee Cups: 7.5%
The percentage of mixed papers is quite high especially since a recycling program has been implemented for this material. Results suggest that better collection systems are required and/or improved staff education to capture more of the paper materials. The organics content suggests that staff eat meals at their desks. The percentage of mixed containers suggests that improved staff education may be required to capture more of the containers. Office / Administrative Areas in the following buildings were found to generate the most trash compared to all office/administrative areas that were audited:
o Rotman School of Management: 20.7% o Health Sciences Building: 13.8% o Robarts Library: 8.3% o Admissions and Awards: 8.1%
2015 Solid Non-Hazardous Waste Audit University of Toronto, St. George Campus SDK Environmental P0481 June 2015
9
o UTS: 7.4%
2.3.7 Miscellaneous Areas Based on the total amount of waste audited from miscellaneous areas, the largest primary categories (i.e. >5%) of waste generated were as follows:
o Other/Non‐Recyclable: 79.6% o Total Mixed Containers: 8.4% o Organics: 5.3%
Miscellaneous areas in the following buildings were found to generate the most trash compared to all miscellaneous areas that were audited:
o Robarts Library: 62.5% o University College: 32.3%
2.4 Percentage of Recyclables in Trash O.Reg. 103/94 requires that ‘educational institutions’ source separate the following materials (at a minimum):
Aluminum food or beverage cans (including cans made primarily of aluminum);
Cardboard (corrugated);
Fine paper;
Glass bottles and jars for food or beverages;
Newsprint; and
Steel food or beverage cans (including cans made primarily of steel). Figure 2 summarizes the quantity of these ‘mandatory’ recyclable materials found in the 24‐hour garbage sample compared to ‘other recyclable’ materials (i.e. organics, coffee cups, paper towels, etc), as well as to ‘non‐recyclable’ materials found in the garbage sample.

2015 Solid Non-Hazardous Waste Audit University of Toronto, St. George Campus SDK Environmental P0481 June 2015
10
The waste audit data (based on the 24‐hour garbage sample) suggests that University of Toronto has a very low ‘mandatory’ recyclable content (i.e. 12.0%) in the combined garbage from all areas at the university. Based on our experience, a ‘mandatory’ recyclable content of less than 20% is an impressive result for a university campus. Again, ‘mandatory’ recyclables include aluminum cans, cardboard, fine paper, glass bottles, newsprint and steel cans. The functional areas generating the most ‘mandatory’ recyclables were laboratories and office/administrative areas. ‘Other Recyclables’ were found in fairly high quantities in washrooms, food service and public areas. These ‘Other Recyclable’ materials consisted mainly of organic food waste, coffee cups and paper towels. Approximately 58.0% of the waste sample consisted of non‐recyclable items, including but not limited to mixed materials, binders, non‐recyclable food wrappers, waxed cups, office supplies, foreign wastes (small bags full of mixed garbage typical from other sources such as cars), liquids, non‐recyclable plastics, non‐recyclable take‐out/fast food containers, contaminated materials (i.e. cardboard covered with paint), latex gloves, fabrics/clothes, shoes, non‐recyclable packaging materials, hygiene products, floor sweepings, single coffee capsules, diapers, plus other miscellaneous wastes.
Figure 2: University of Toronto, St. George Campus % of Recyclables Found in Garbage (Based on 24-Hour Sample):
O.Reg. 103/94 "Mandatory Recyclables" vs "Other Recyclables" vs "Non-Recyclables"
0%
10%
20%
30%
40%
50%
60%
70%
80%
90%
100%
Office & Admin Labs Public Areas Cafeteria Washrooms Miscel. Unlabeled Total
O.Reg.103 - Mandatory Recyclables Other Recyclable Non-Recyclable
2015 Solid Non-Hazardous Waste Audit University of Toronto, St. George Campus SDK Environmental P0481 June 2015
11
3 Diversion Programs & Waste Systems 3.1 Diversion Programs
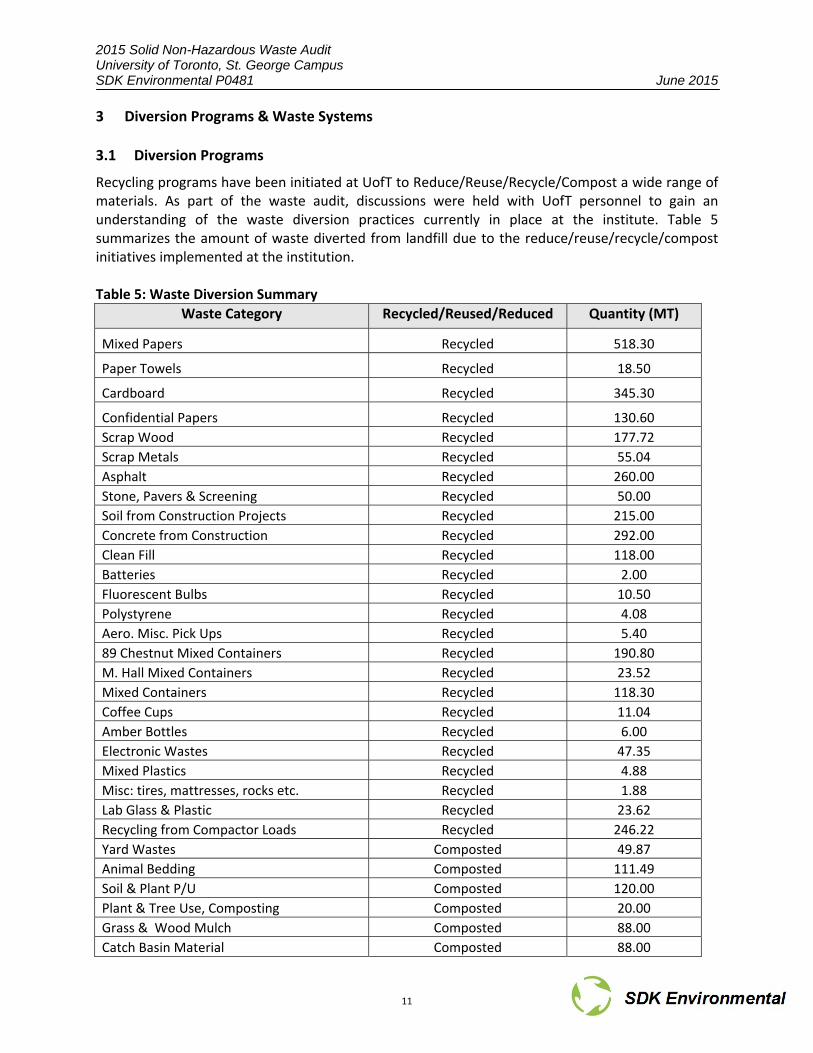
Recycling programs have been initiated at UofT to Reduce/Reuse/Recycle/Compost a wide range of materials. As part of the waste audit, discussions were held with UofT personnel to gain an understanding of the waste diversion practices currently in place at the institute. Table 5 summarizes the amount of waste diverted from landfill due to the reduce/reuse/recycle/compost initiatives implemented at the institution. Table 5: Waste Diversion Summary
Waste Category Recycled/Reused/Reduced Quantity (MT)
Mixed Papers Recycled 518.30
Paper Towels Recycled 18.50
Cardboard Recycled 345.30
Confidential Papers Recycled 130.60
Scrap Wood Recycled 177.72
Scrap Metals Recycled 55.04
Asphalt Recycled 260.00
Stone, Pavers & Screening Recycled 50.00
Soil from Construction Projects Recycled 215.00
Concrete from Construction Recycled 292.00
Clean Fill Recycled 118.00
Batteries Recycled 2.00
Fluorescent Bulbs Recycled 10.50
Polystyrene Recycled 4.08
Aero. Misc. Pick Ups Recycled 5.40
89 Chestnut Mixed Containers Recycled 190.80
M. Hall Mixed Containers Recycled 23.52
Mixed Containers Recycled 118.30
Coffee Cups Recycled 11.04
Amber Bottles Recycled 6.00
Electronic Wastes Recycled 47.35
Mixed Plastics Recycled 4.88
Misc: tires, mattresses, rocks etc. Recycled 1.88
Lab Glass & Plastic Recycled 23.62
Recycling from Compactor Loads Recycled 246.22
Yard Wastes Composted 49.87
Animal Bedding Composted 111.49
Soil & Plant P/U Composted 120.00
Plant & Tree Use, Composting Composted 20.00
Grass & Wood Mulch Composted 88.00
Catch Basin Material Composted 88.00

2015 Solid Non-Hazardous Waste Audit University of Toronto, St. George Campus SDK Environmental P0481 June 2015
12
Organics Composted 285.12
89 Chestnut Organics Composted 585.00
Swap Shop ‐ Out, Including Pad Reused 19.29
In‐Swap Reused 12.00
Campus Furniture Projects Reused 164.74
Wood Pallets Reused 12.00
Reduction via Various Programs Reduced 123.90
4555.43
Therefore, the total amount of waste material diverted from landfill from May 2013‐April 2014 was approximately 4555.43 MT.
3.2 Waste Disposal Systems
Based on the information provided by UofT, approximately 1903.05 MT of solid non‐hazardous waste was disposed from the site to landfill from May 2013‐April 2015. Wastes are collected throughout the facility and transferred into various compactors located throughout campus.
3.3 Waste Diversion Rate Waste Diversion Rate is the percentage of waste materials that a facility diverts from landfill due to reduce, reuse and recycling (i.e. 3Rs) initiatives versus the total amount of waste generated (i.e. 3Rs plus landfilled). According to the Ontario Ministry of the Environment, Waste Diversion Rate is calculated as follows:
%100*)3(
GeneratedWasteTotal
RsDivertedWasteTotalRateDiversionWaste
Based on the total amount of waste generated, as well as materials recycled and reused, the annual waste diversion rate through existing programs at UofT is approximately 70.5%. Table 6 and Figure 3 summarize the overall quantities of wastes disposed, reduced, reused, recycled and composted at UofT’s St. George Campus. The MOE’s provincial objective is 60% waste diversion (to be achieved by the year 2008).

2015 Solid Non-Hazardous Waste Audit University of Toronto, St. George Campus SDK Environmental P0481 June 2015
13
Table 6: Waste Quantities Disposed, Recycled & Reused
Material Total Quantities
(Metric Tonnes) Percent
Waste Disposed to Landfill 1903.05 29.5%
Material Reduced 123.90 1.92%
Material Reused 208.03 3.2%
Material Recycled 2876.03 44.5%
Material Composted 1347.47 20.9%
Total Waste Generated 6458.48 100%
Diversion Rate 70.5%
3.4 Capture Rate Capture rate is the proportion of divertible waste materials which are successfully diverted from disposal compared to the total amount of the divertible waste materials generated. According to the Recycle Council of Ontario, Capture Rate is calculated as follows:
%100*)3(
GeneratedMaterialDivertibleTotal
RsCapturedMaterialDivertibleTotalRateCapture
Thus, capture rate assists in determining the effectiveness of recycling programs. Table 7 summarizes the capture rate for the main divertible materials at UofT:
Total Recycled, 44.5%
Total Reused, 3.2%
Total Reduced, 1.92%
Total Composted, 20.9%
Total Disposed, 29.5%
Figure 3: University of Toronto, St George CampusSpring 2015 Waste Audit Summary

2015 Solid Non-Hazardous Waste Audit University of Toronto, St. George Campus SDK Environmental P0481 June 2015
14
Table 7: Capture Rate Summary Divertible Material Annualized Material
Generated Metric Tonnes
Annualized 3Rs Quantity Captured Metric Tonnes
Capture RatePercent
Mixed Papers 634.63 518.30 81.7% Paper Towels 274.76 18.50 6.7% Cardboard 346.96 345.30 99.5% Confidential Papers 130.60 130.60 100.0% Scrap Wood 177.72 177.72 100.0% Scrap Metals 56.70 55.04 97.1% Asphalt 260.00 260.00 100.0% Stone, Pavers & Screening 50.00 50.00 100.0% Soil from Construction Projects 215.00 215.00 100.0% Concrete from Construction 292.00 292.00 100.0% Clean Fill 118.00 118.00 100.0% Batteries 2.00 2.00 100.0% Fluorescent Bulbs 10.50 10.50 100.0% Polystyrene 14.26 4.08 28.6% Aero. Misc. Pick Ups 5.4 5.40 100.0% Mixed Containers 442.9 332.6 75.1% Coffee Cups 85.2 11.0 13.0% Amber Bottles 6.0 6.0 100.0% Electronic Wastes 47.3 47.3 100.0% Mixed Plastics 4.9 4.9 100.0% Misc: tires, matresses, rocks etc. 1.9 1.9 100.0% Lab Glass & Plastic 23.6 23.6 100.0% Recycling from Compactor Loads 246.2 246.2 100.0% Yard Wastes 49.9 49.9 100.0% Animal Bedding 111.5 111.5 100.0% Soil & Plant P/U 120.0 120.0 100.0% Plant & Tree Use, Composting 20.0 20.0 100.0% Grass & Wood Mulch 88.0 88.0 100.0% Catch Basin Material 88.0 88.0 100.0% Organics 514.8 285.1 55.4% 89 Chestnut Organics 585.0 585.0 100.0% Swap Shop ‐ Out, Including Pad 19.3 19.3 100.0% In‐Swap 12.0 12.0 100.0% Campus Furniture Projects 164.7 164.7 100.0% Wood Pallets 12.0 12.0 100.0% Overall Facility 5231.8 4431.5 84.7% Capture rates of most materials were very high, ranging from approximately 55% to 100%. Paper towels, coffee cups and polystyrene had the only values less than 55%, being approximately 7%, 13% and 29% respectively. The overall capture rate of all recyclables on campus is very high at approximately 85%.

2015 Solid Non-Hazardous Waste Audit University of Toronto, St. George Campus SDK Environmental P0481 June 2015
15
3.5 Year over Year Change in Waste Generation Waste diversion rate and capture rate do not always demonstrate how effective a site’s 3R programs are operating. This is due to the continual change of many important factors involved in waste and recyclable material generation on campus, such as number of students enrolled, floor area of buildings, etc. As student numbers change or more buildings are added to the campus, quantities of waste and recyclables change making it difficult to have a direct comparison of data between years. It is recommended that UofT track ‘Year over Year’ changes in the amount of wastes disposed and/or materials recycled per standard unit. This allows direct comparison of data from year to year, thus assisting the university in gaining an understanding of the effectiveness of their 3Rs programs. For UofT, the most applicable standard unit is Full‐time equivalent students, or FTE.
3.5.1 Year‐over‐Year Change in 3Rs Quantities The ‘Year‐over‐Year Change in 3Rs Quantities’ is the indicator of the amount of materials diverted from disposal through reduce, reuse and/or recycle activities per FTE compared to previous data. Table 8 summarizes the results for the 2013‐14 year compared to previous years back to 2010‐11. A positive year‐over‐year change indicates 3Rs programs are improving over time. Table 8: Yr‐over‐Yr Change in 3Rs Quantities
Period Total Materials Reduced, Reused Recycled (MT)
FTE Annual 3R Quantity (kg/FTE)
Yr‐over‐Yr Change in 3Rs Quantity
(kg)
2013‐2014 4555.43 57,919 78.65 +0.52
2012‐2013 4418.23 56,547 78.13 +2.48
2011‐2012 4141.3 54,745 75.65 +4.64
2010‐2011 3,810.68 53,664 71.01 ‐‐
Results indicate that the amount of material per student diverted from landfill has been increasing since every year since 2010‐11.
3.5.2 Year‐over‐Year Change in Trash Disposed The ‘Year over Year Change in Trash Disposed’ is the indicator of the amount of reduction in waste materials disposed to landfill due to reduction, reuse and recycling activities on campus. Table 9 summarizes the results for the 2013‐14 year compared to previous years back to 2010‐11. A reduction in the year over year value will indicate the university is continually reducing wastes disposed to landfill. Table 9: Yr‐over‐Yr Change in Trash Disposed
Period Total Materials Disposed to Landfill (MT)
FTE Annual Disposed Quantity (kg/FTE)
Yr‐over‐Yr Change in Disposed Quantity (kg)
2013‐2014 1903.05 57,919 32.86 +0.67
2012‐2013 1820.37 56,547 32.19 +1.94
2011‐2012 1655.9 54,745 30.25 ‐2.88
2010‐2011 1777.5 53,664 33.12 ‐‐
2015 Solid Non-Hazardous Waste Audit University of Toronto, St. George Campus SDK Environmental P0481 June 2015
16
4 Waste Audit Summary & Waste Reduction Work Plan Refer to Appendix C and Appendix D for the Waste Audit Summary and the Waste Reduction Work Plan respectively. The last page of each set of forms in the appendices need to be signed by an authorized person at the University. According to O.Reg. 102/94, the Waste Reduction Work Plan (Appendix D) or a summary of the plan must be posted at the University in a place where staff/students can review it. If a summary is posted, the entire Work Plan should also be made available for review by any staff/student upon request: 5 Conclusions & Recommendations
Based on the results of the solid non‐hazardous waste audit conducted for UofT, the following conclusions can be made. Recommendations presented below are intended to assist UofT in maximizing their waste diversion potential at the facility.
Bewteen April 2013 and May 2014, UofT disposed of approximately 1903.05 tonnes of solid waste in landfills. Approximately 4555.43 tonnes of waste materials were diverted through existing reduce, reuse, recycle and compost activities. This represents a waste diversion rate of approximately 70.5%. The provincial objective is 60% diversion to be achieved by 2008.
Based on the waste audit results, it was estimated that approximately 13.5% (or 256 tonnes) of solid waste disposed to landfill consisted of paper towels. Washroom areas generated the majority of this material. UofT may wish to investigate the feasibility of implementing paper towel recycling in washrooms on campus to reduce the amount of this material disposed to landfill.
Based on the waste audit results, it was estimated that approximately 12.1% (or 230 tonnes) of solid waste disposed to landfill consisted of organic materials (i.e. food wastes). Organics were found in relatively high amounts in food service areas, public and office areas. An organics compost program exists at UofT in some designated areas. The results suggest that improved collection systems are required, improved signage and/or student/staff education programs are required to improve source separation of this material.
Based on the waste audit results, it was estimated that approximately 6.1% (or 116 tonnes) of solid waste disposed to landfill consisted of mixed papers (fine papers, newsprint, boxboard, other paper fibres). Labs and office areas had the highest percentage of mixed papers. A mixed paper recycling program exists at UofT. This data suggests that better collection systems are required, improved signage and/or student/staff education programs are required to improve source separation of this material.
Based on the waste audit results, it was estimated that approximately 5.8% (or 110 tonnes) of solid waste disposed to landfill consisted of mixed containers (aluminum cans, glass jars, plastic bottles, tetra packs, milk cartons, etc). Cafeterias, miscellaneous and office areas had the highest percentages of mixed containers. The most common types of materials found were PET bottles, glass bottles, and aluminum cans. A mixed container recycling program exists at UofT. This data suggests that better collection systems are required, improved signage and/or student/staff education programs are required to improve source separation of this material.

2015 Solid Non-Hazardous Waste Audit University of Toronto, St. George Campus SDK Environmental P0481 June 2015
17
Continue to make use of multi‐compartment containers (i.e. recycling depots) for waste collection and recycling as much as possible. Remove all “solitary” waste bins at the facility. We recommend only having waste bins that are attached to or close to multi‐compartment recycling containers.
Increase awareness of new and existing recycling programs at U of T through staff and student education programs. Such programs can include brief training programs as well as placement of posters in strategic locations around the building in worker areas. Staff should evaluate, improve and expand the waste reduction systems in their own areas. Management should actively seek out opinions and ideas from employees on issues relating to recycling programs. Employee and student involvement will generate cooperation and enthusiasm. A suggestion box may be helpful in communicating employee concerns and suggestions when developing or changing existing diversion programs.
Add and maintain signs at recycling depots to assist staff and students in sorting wastes easily and correctly. Signs should be easily visible and instructive, such as those having pictograms. The following is an example of pictogram signs that have significantly helped to improve recycling rates at many facilities:
Such signs are inexpensive (costing approximately $5 per sign), can be custom made depending on what can and what can’t be recycled in the Windsor area. Signs are a very effective method of increasing participation, reducing contamination and increasing material capture rates.
Provide easy access to contact information for help with questions regarding all recycling programs. Each recycling program should have as much consistency as possible across the entire campus.
Ensure UofT’s Environmental Policy is clearly displayed to emphasize the facility’s commitment to environmental stewardship, which can also be demonstrated in its newsletters, brochures, annual reports and contracts. Regular newsletters promoting the campus’ waste reduction programs, goals and concerns will increase employee/student cooperation.
All recyclables and wastes should be collected in clear plastic garbage bags instead of black plastic garbage bags. This allows maintenance staff to monitor waste collection, as well as to ensure that separated waste streams are disposed of in the correct containers.
It is recommended that desk side recycling bins for paper collection be added in all office/administrative areas. Side saddles can be added to each recycling bin for waste. This forces staff to think about where they dispose of their waste. Larger paper bins should be

2015 Solid Non-Hazardous Waste Audit University of Toronto, St. George Campus SDK Environmental P0481 June 2015
18
positioned in central office/administrative areas to allow workers to dispose of papers collected in smaller desk‐side bins.
Support and encourage the purchase and use of “environmentally friendly”, reusable or recyclable materials and packaging, and/or those that contain recycled content. This is applicable to U of T’s office paper and paper towel purchases.
According to O.Reg. 102/94, the Waste Reduction Work Plan (Appendix D) or a summary of the plan must be posted at the facility in a place where employees can review it. If a summary is posted, the entire Waste Reduction Work Plan should also be made available for review by any of the facility employees upon request.
According to O.Reg. 102/94, the waste audit and waste reduction work plan must be updated on an annual basis.
According to O.Reg. 102/94, a report of the waste audit and waste reduction work plan must be retained on file for a minimum of five years.
Ensure that the waste diversion program has the full support of U of T’s management team.
UofT boasts an impressive waste diversion rate, and employs a wide variety of diversion techniques. This is a very impressive result for an institution of their size (generally, the more people involved, the harder it is to control the proper disposal of waste), and should be commended.
Appendix A
Supporting Documentation

2002-03 % 2004-05 2013-14 2014-15 2014-15 % 2014-15 2014-15 2015-16 2016-17 2017-18 2018-19 2019-20
Total UofT FTEs incl. TST (Fall) Actual Actual Actual Plan Actual Variance Change Plan Projected Projected Projected Projectedto Plan from 2013-14
Arts & Humanities 6,611 35% 7,276 5,700 5,233 23% (467)
Social Sciences - Excl. BCOM 4,163 22% 4,957 6,317 6,179 27% (139)
Social Sciences - BCOM (Yrs 2-4) 885 5% 1,192 1,622 1,601 7% (21)
Life Sciences 3,960 21% 4,861 4,978 4,971 22% (7)
Other Sciences 3,103 17% 2,797 4,067 4,623 20% 556
St George, A&S 18,722 100% 21,082 22,684 22,622 22,608 100% (14) (76) 22,891 23,139 23,346 23,549 23,558
Arts & Humanities 1,891 33% 2,425 2,708 2,678 25% (30)
Social Sciences - Excl. BCOM/BBA 2,111 37% 2,556 4,204 4,201 39% (2)
Social Sciences - BCOM/BBA (Yrs 2-4) 406 7% 584 987 953 9% (34)
Life Sciences 761 13% 738 1,125 1,164 11% 39
Other Sciences 489 9% 992 1,459 1,733 16% 274
UTM 5,657 100% 7,295 10,482 11,182 10,729 100% (453) 247 11,377 11,907 12,327 12,680 12,831
Arts & Humanities 1,409 25% 1,699 1,934 1,855 18% (80)
Social Sciences - Excl. BBA 1,471 26% 2,079 2,945 3,007 30% 62
Social Sciences - BBA (Yrs 1-4) 792 14% 1,124 1,417 1,422 14% 5
Life Sciences 608 11% 1,040 1,224 1,284 13% 60
Other Sciences 1,284 23% 1,286 2,159 2,521 25% 361
UTSC 5,564 100% 7,228 9,680 10,318 10,088 100% (230) 408 10,627 10,986 11,286 11,476 11,511
Total Undergraduate Arts & Science 29,942 35,605 42,846 44,121 43,425 (696) 579 44,894 46,032 46,960 47,704 47,901
Total Undergraduate Other First-Entry 4,799 5,105 6,870 7,195 7,293 98 423 7,289 7,226 7,290 7,079 7,103
Total First-Entry 34,741 40,710 49,716 51,317 50,718 (599) 1,001 52,183 53,258 54,249 54,783 55,004
Total Undergraduate Second-Entry Professional 6,443 6,691 7,811 7,635 7,840 204 29 7,173 7,172 7,231 7,163 7,161
Total Undergraduate Conjoint TST Programs 360 374 321 308 309 1 (12) 318 318 318 318 318
TOTAL UNDERGRADUATE - UofT 41,544 47,776 57,848 59,260 58,866 (393) 1,019 59,674 60,749 61,798 62,264 62,483
St. George 2,897 3,242 5,717 6,260 6,185 (75) 468 6,680 7,242 7,520 7,679 7,769
UTM 168 180 308 339 342 3 34 419 446 458 458 458 UTSC 74 81 87 6 13 92 105 110 110 110
Professional Masters 3,064 3,422 6,099 6,680 6,614 (66) 515 7,191 7,793 8,089 8,247 8,337
Doctoral Stream Masters 2,453 2,504 2,785 2,804 2,773 (31) (12) 2,844 2,944 3,019 3,062 3,082
Doctoral Stream PHD 4,307 4,559 5,959 6,030 6,040 10 81 6,056 6,235 6,421 6,642 6,841
Graduate Conjoint TST Programs 188 221 221 226 223 (3) 2 226 213 228 222 220
TOTAL GRADUATE - UofT 10,012 10,706 15,064 15,739 15,650 (89) 586 16,317 17,185 17,757 18,173 18,481
St. George excl. TST 39,619 43,184 51,826 52,545 52,738 193 912 52,932 53,959 54,827 55,174 55,515 UTM 5,825 7,475 10,790 11,521 11,072 (450) 281 11,796 12,354 12,785 13,138 13,290 UTSC 5,564 7,228 9,754 10,399 10,175 (224) 421 10,719 11,091 11,396 11,586 11,621 TST Conjoint Programs 548 595 541 534 532 (2) (10) 544 531 547 540 538
TOTAL COMBINED FTEs - UofT 51,555 58,482 72,912 74,999 74,516 (483) 1,605 75,991 77,934 79,555 80,438 80,964
Table 2 Total Full Time Equivalent (FTE)
10
SDK
Oval
SDK
Highlight

2002-03 % 2004-05 2012-13 2013-14 2013-14 % 2013-14 2013-14 2014-15 2015-16 2016-17 2017-18 2018-19Total UofT FTEs incl. TST (Fall) Actual Actual Actual Plan Actual Variance Variance Plan Projected Projected Projected Projected
to Plan to 2012-13
Arts & Humanities 6,611 35% 7,276 6,186 5,700 25% (486)
Social Sciences - Excl. BCOM 4,163 22% 4,957 6,308 6,317 28% 9
Social Sciences - BCOM (Yrs 2-4) 885 5% 1,192 1,642 1,622 7% (21)
Life Sciences 3,960 21% 4,861 4,506 4,978 22% 472
Other Sciences 3,103 17% 2,797 3,830 4,067 18% 237 St George, A&S 18,722 100% 21,082 22,473 22,203 22,684 100% 481 211 22,622 22,849 22,919 22,972 22,926
Arts & Humanities 1,891 33% 2,425 2,728 2,708 26% (20)
Social Sciences - Excl. BCOM/BBA 2,111 37% 2,556 3,968 4,204 40% 236
Social Sciences - BCOM/BBA (Yrs 2-4) 406 7% 584 984 987 9% 3
Life Sciences 761 13% 738 1,051 1,125 11% 74
Other Sciences 489 9% 992 1,328 1,459 14% 131 UTM 5,657 100% 7,295 10,059 10,425 10,482 100% 57 423 11,182 11,840 12,346 12,618 12,682
Arts & Humanities 1,409 25% 1,699 1,862 1,934 20% 72
Social Sciences - Excl. BBA 1,471 26% 2,079 3,226 2,945 30% (280)
Social Sciences - BBA (Yrs 1-4) 792 14% 1,124 1,421 1,417 15% (4)
Life Sciences 608 11% 1,040 1,122 1,224 13% 102
Other Sciences 1,284 23% 1,286 1,566 2,159 22% 594
UTSC 5,564 100% 7,228 9,196 9,725 9,680 100% (45) 484 10,318 10,900 11,191 11,471 11,539
Total Undergraduate Arts & Science 29,942 35,605 41,728 42,353 42,846 494 1,118 44,121 45,588 46,456 47,060 47,146
Total Undergraduate Other First-Entry 4,799 5,105 6,594 6,797 6,870 73 276 7,195 7,267 6,985 7,051 7,041
Total First-Entry 34,741 40,710 48,322 49,149 49,716 567 1,394 51,317 52,856 53,441 54,111 54,187
Total Undergraduate Second-Entry Professional 6,443 6,691 7,835 8,058 7,811 (247) (24) 7,635 7,207 7,241 7,271 7,225 TOTAL UNDERGRADUATE - UofT 41,184 47,402 56,157 57,207 57,527 320 1,370 58,952 60,063 60,682 61,382 61,413
Toronto School of Theology 437 476 390 416 392 (24) 2 399 399 399 399 399 TOTAL UNDERGRADUATE 41,620 47,878 56,547 57,623 57,919 296 1,372 59,351 60,462 61,081 61,782 61,812
St. George 2,897 3,242 5,293 5,661 5,717 56 424 6,260 6,856 7,304 7,503 7,622
UTM 168 180 296 309 308 (1) 12 339 369 379 389 394
UTSC 57 59 74 15 17 81 91 104 109 109
Professional Masters 3,064 3,422 5,646 6,029 6,099 70 453 6,680 7,315 7,786 8,000 8,124
Doctoral Stream Masters 2,453 2,504 2,655 2,735 2,785 50 130 2,804 2,858 2,905 2,932 2,935
Doctoral Stream PHD 4,307 4,559 5,852 5,941 5,959 18 107 6,030 6,129 6,274 6,448 6,629 TOTAL GRADUATE - UofT 9,824 10,485 14,154 14,705 14,843 138 689 15,513 16,303 16,966 17,381 17,688
Toronto School of Theology 258 296 344 338 317 (21) (27) 321 307 277 263 258 TOTAL GRADUATE 10,082 10,782 14,498 15,042 15,160 118 662 15,835 16,610 17,243 17,644 17,946
St. George excl. TST 39,619 43,184 50,702 51,394 51,826 432 1,124 52,545 53,167 53,628 54,177 54,377 UTM 5,825 7,475 10,355 10,734 10,790 56 435 11,521 12,208 12,724 13,006 13,076 UTSC 5,564 7,228 9,253 9,784 9,754 (30) 501 10,399 10,991 11,295 11,580 11,648
TOTAL COMBINED FTEs - UofT 51,008 57,887 70,311 71,912 72,370 459 2,059 74,465 76,366 77,647 78,763 79,101 Toronto School of Theology 694 772 734 754 709 (45) (25) 721 707 677 663 658
TOTAL COMBINED FTEs 51,702 58,659 71,045 72,666 73,079 413 2,034 75,186 77,073 78,324 79,426 79,758
Table 2 Total Full Time Equivalent Enrolment at the University of Toronto
10
SDK
Oval
SDK
Oval
SDK
Highlight
SDK
Highlight
2002-03 % 2004-05 2010-11 2011-12 2011-12 % 2011-12 2011-12 2012-13 2013-14 2014-15 2015-16 2016-17Total UofT FTEs incl. TST (Fall) Actual Actual Actual Plan Actual Variance Variance Plan Projected
to Plan to 2010-11
Arts & Humanities 6,611 35% 7,276 7,873 7,638 35% (235)
Social Sciences - Excl. BCOM 4,163 22% 4,957 4,641 4,977 23% 336
Social Sciences - BCOM (Yrs 2-4) 885 5% 1,192 1,510 1,602 7% 92
Life Sciences 2,520 13% 3,271 2,795 2,839 13% 44
Other Sciences 4,543 24% 4,387 4,701 4,942 22% 241 St George, A&S 18,722 100% 21,082 21,520 21,581 21,998 100% 417 478 22,046 21,768 21,566 21,456 21,425
Arts & Humanities 2,316 41% 2,852 3,136 3,280 34% 144
Social Sciences - Excl. BCOM/BBA 1,685 30% 2,130 2,792 3,132 32% 339
Social Sciences - BCOM/BBA (Yrs 2-4) 406 7% 584 967 947 10% (20)
Life Sciences 358 6% 500 678 634 7% (44)
Other Sciences 891 16% 1,230 1,704 1,652 17% (53) UTM 5,657 100% 7,295 9,278 9,592 9,644 100% 52 367 9,929 10,462 11,117 11,709 12,145
Arts & Humanities 1,409 25% 1,699 1,727 1,818 21% 90
Social Sciences - Excl. BBA 1,471 26% 2,079 2,942 3,060 35% 119
Social Sciences - BBA (Yrs 1-4) 792 14% 1,124 1,460 1,390 16% (70)
Life Sciences 608 11% 1,040 1,067 1,109 13% 42
Other Sciences 1,284 23% 1,286 1,417 1,350 15% (67)
UTSC 5,564 100% 7,228 8,613 8,576 8,727 100% 151 114 9,250 9,884 10,495 10,893 11,089
Total Undergraduate Arts & Science 29,942 35,605 39,410 39,750 40,370 620 959 41,224 42,114 43,177 44,058 44,659
Total Undergraduate Other First-Entry 4,799 5,105 5,920 5,853 6,082 229 162 6,099 6,097 6,105 6,105 6,109
Total First-Entry 34,741 40,710 45,330 45,603 46,452 849 1,121 47,433 48,438 49,605 50,571 51,194
Total Undergraduate Professional 6,443 6,691 7,896 7,851 7,882 32 (13) 7,904 8,062 8,191 8,206 8,227 TOTAL UNDERGRADUATE - UofT 41,184 47,402 53,226 53,454 54,334 880 1,108 55,337 56,501 57,796 58,777 59,420 Toronto School of Theology 437 476 438 453 411 (42) (27) 454 454 454 454 454 TOTAL UNDERGRADUATE 41,620 47,878 53,664 53,906 54,745 838 1,081 55,791 56,955 58,250 59,231 59,874
St. George 2,897 3,242 4,742 5,011 5,013 2 271 5,294 5,573 5,782 5,975 6,067
UTM 168 180 281 309 295 (14) 14 298 314 327 334 336 UTSC 53 60 55 (5) 2 63 65 87 102 110
Professional Masters 3,064 3,422 5,076 5,380 5,363 (17) 287 5,655 5,952 6,196 6,411 6,513
Doctoral Stream Masters 2,453 2,504 2,630 2,647 2,649 2 19 2,778 2,878 2,941 2,992 2,996
Doctoral Stream PHD 4,307 4,559 5,679 5,718 5,742 24 62 5,843 5,990 6,142 6,330 6,453 TOTAL GRADUATE - UofT 9,824 10,485 13,385 13,745 13,754 9 369 14,276 14,820 15,279 15,733 15,962
Toronto School of Theology 258 296 360 354 327 (26) (32) 322 324 329 324 320 TOTAL GRADUATE 10,082 10,782 13,745 14,099 14,081 (17) 337 14,598 15,144 15,608 16,057 16,283
St. George excl. TST 39,619 43,184 48,386 48,661 49,367 706 980 50,074 50,595 51,049 51,471 51,703 UTM 5,825 7,475 9,559 9,901 9,939 38 380 10,227 10,776 11,444 12,044 12,482 UTSC 5,564 7,228 8,666 8,637 8,782 145 116 9,312 9,949 10,582 10,995 11,199
TOTAL COMBINED FTEs - UofT 51,008 57,887 66,611 67,198 68,088 889 1,477 69,613 71,321 73,075 74,510 75,383 Toronto School of Theology 694 772 798 807 738 (68) (60) 776 778 783 778 774
TOTAL COMBINED FTEs 51,702 58,659 67,409 68,005 68,826 821 1,417 70,389 72,099 73,858 75,288 76,157
Table 2 Total Full Time Equivalent Enrolment at the University of Toronto
SDK
Oval
SDK
Oval
U of T Audit Schedule April 20 – May 1, 2015 24hr. samples April April 20 OISE – 252 Bloor St. W. Faculty of Social Work - 246 Bloor St. W. Jackman Humanities – 170 St. George St. Admissions and Awards – 172 St. George St. April 21 UTS – 371 Bloor St. W. Rotman School of Management – 95 St. George University College – 15 King’s College Circle. April 22 Architecture Building - 230 College St. Koffler Student Centre - 214 College St. Fields Institute – 222 College St. Gage Building – 223 College St. April 23 Robarts Library – 130 St. George St. Ramsay Wright Building – 25 Harbord St. Sidney Smith Hall – 100 St. George St. April 24 Simcoe Hall – 27 King’s College Circle Haultain Building – 170 College (rear) Health Sciences Building – 155 College St. Dental Building – 124 Edward St. Tags Green – cafeterias Red – washrooms Blue – offices Yellow – labs Black – public areas / lobbies White – misc. Miscellaneous exterior waste warriors on campus Willcocks street b/w Huron & St. George, Harbord & St. George, front of Medical Sciences, front entrance of CCBR, Bancroft Ave.

Compactors April April 27 Dental Building, 124 Edward St. Earth Sciences Building, 33 Willcocks St. April 28 Medical Sciences Building, 1 King’s College Circle Goldring Centre – 100 Devonshire Place April 29 Robarts Library, 369 Huron St. Sidney Smith Hall, 100 St. George April 30 Rotman School, of Management, 95 St. George St. CCBR – 160 College May 1 Best Institute, 112 College Sanford Fleming – 10 King’s College Rd.

UofT Waste Audit Spring 2015 - Compactor Summary
Page 1 of 1
April 28, 2015: Load #1 – Medical Sciences Building, 1 King’s College Circle Amidst the garbage the following items were found:
- Full bags Styrofoam cups - Plastic pails full of broken glassware - Full bags of mixed containers (multiple) - Cardboard - Scrap wood - Large plastic containers - Scrap metal
April 28, 2015: Load #2 – Goldring Centre, 100 Devonshire Place Amidst the garbage the following items were found:
- Full bags of clothes/shoes - Bag full of Styrofoam - Yard waste (small tree) - Full bags of shredded papers - Cardboard - Considerable amounts of loose mixed papers - Considerable amounts of plastic flower pots
April 29, 2015: Load #1 – Robarts Library, 369 Huron Street Amidst the garbage the following items were found: - Loose Cardboard and full bags of Cardboard - Full bags of mixed papers - Full bags of shredded papers - Considerable amounts of Styrofoam food containers - Considerable amounts of plastic flower pots April 29, 2015: Load #2 – Sidney Smith Hall, 100 St. George Street Amidst the garbage the following items were found: - Cardboard boxes - Full bags of Styrofoam packing chips - Scrap metal (several rigid metal frames) - Two (2) rolled up carpets - Large plastic pails April 30, 2015: Load #1 – Rotman School of Management, 95 St. George Street Amidst the garbage the following items were found: - Multiple full bags of mixed containers - Cardboard boxes - Scrap woods (wood box) - Full bag of Styrofoam - Full bags of mixed papers

Appendix B
Waste Audit Data

Waste Audit ReportUniversity oF Toronto, St George Campus
SDK Environmental P0481
Table B1: Waste Audit Sample Summary
Site Building Name Address Date GARBAGE SAMPLE COLLECTEDS te u d g a e dd ess ate G G S CO C
Blue Yellow Black Green Red White Unlabeled
Offices Labs Public Areas Cafeteria Washrooms Miscel. Unlabeled
1 Jackman Humanities 170 St George St Apr‐20‐15 Yes Yes Yes Yes Yes No No
2 Admissions and Awards 172 St George St Apr‐20‐15 Yes No Yes Yes Yes No No
3 Faculty of Social Work 246 Bloor St W Apr‐20‐15 Yes No No No Yes Yes No
4 OISE 252 Bloor St W Apr‐20‐15 Yes No Yes Yes Yes No Nop
5 Rotman School of Management 95 St. George Apr‐21‐15 Yes No Yes Yes Yes No No
6 University College 15 King’s College Circle Apr‐21‐15 Yes No Yes No Yes Yes No
7 UTS 371 Bloor St. W Apr‐21‐15 Yes No Yes Yes Yes No No
8 Architecture Building 230 College St Apr‐22‐15 Yes Yes Yes Yes Yes No No
9 Fields Institute 222 College St Apr‐22‐15 Yes No Yes Yes Yes No No
10 Gage Building 223 College St Apr‐22‐15 No Yes Yes Yes Yes No No
11 Koffler Student Centre 214 College St Apr‐22‐15 Yes No Yes No Yes No No
12 Ramsay Wright Building 25 Harbord St Apr‐23‐15 Yes Yes Yes No Yes No Yes
13 Sydney Smith Hall 100 St. George St Apr‐23‐15 Yes No Yes Yes Yes No No
14 Robarts Library 130 St. George St Apr‐23‐15 Yes No Yes Yes Yes Yes No
15 Dental Building 124 Edward St Apr‐24‐15 No Yes Yes Yes Yes No No
16 Health Sciences Building 155 College St Apr‐24‐15 Yes Yes Yes Yes No No No
17 Simcoe Hall 27 King’s College Circle Apr‐24‐15 Yes No Yes Yes Yes No No
18 Haultain Building 170 College (rear) Apr‐24‐15 Yes Yes Yes No Yes No No

Waste Audit Report
University of Toronto, St George Campus
SDK Environmental P0481
Table B2: GARBAGE Waste Audit Sample Summary
Audit Location Audited Building Name
Audit Date
Total Sample
kg
1 Jackman Humanities Apr‐20‐15 17.35
2 Admissions and Awards Apr‐20‐15 13.95
3 Faculty of Social Work Apr‐20‐15 4.60
4 OISE Apr‐20‐15 33.70
5 Rotman School of Management Apr‐21‐15 55.25
6 University College Apr‐21‐15 17.05
7 UTS Apr‐21‐15 34.65
8 Architecture Building Apr‐22‐15 34.10
9 Fields Institute Apr‐22‐15 16.35
10 Gage Building Apr‐22‐15 1.85
11 Koffler Student Centre Apr‐22‐15 8.75
12 Ramsay Wright Building Apr‐23‐15 4.65
13 Sydney Smith Hall Apr‐23‐15 28.50
14 Robarts Library Apr‐23‐15 80.10
15 Dental Building Apr‐24‐15 70.95
16 Health Sciences Building Apr‐24‐15 13.55
17 Simcoe Hall Apr‐24‐15 16.85
18 Haultain Building Apr‐24‐15 6.00
Total Sample: 458.20
TableB3: Overall GARBAGE Composition Summary
Area of Collection: Office & Admin Labs Public Areas Cafeteria Washrooms Miscel. Unlabeled Total
Total Weight of Sample (in kg):
Total Percent of Sample (in %):
Composition of Garbage: kg % kg % kg % kg % kg % kg % kg % kg %
Total Mixed Papers 5.60 9.7% 9.70 13.6% 4.85 3.6% 2.25 2.5% 4.61 6.2% 1.00 3.4% 0.00 0.0% 28.01 6.1%
Total Mixed Containers 4.75 8.2% 3.60 5.0% 7.10 5.3% 8.35 9.3% 0.30 0.4% 2.45 8.4% 0.00 0.0% 26.55 5.8%
Corrugated Cardboard 0.00 0.0% 0.00 0.0% 0.25 0.2% 0.00 0.0% 0.15 0.2% 0.00 0.0% 0.00 0.0% 0.40 0.1%
Coffee Cups 4.30 7.5% 0.36 0.5% 8.30 6.2% 3.50 3.9% 0.45 0.6% 0.90 3.1% 0.05 2.7% 17.86 3.9%
Styrofoam 0.40 0.7% 0.00 0.0% 0.00 0.0% 2.05 2.3% 0.00 0.0% 0.00 0.0% 0.00 0.0% 2.45 0.5%
Organic Food Waste 5.85 10.2% 1.30 1.8% 22.85 17.0% 21.95 24.4% 0.00 0.0% 1.55 5.3% 1.80 97.3% 55.30 12.1%
Paper Towels 0.00 0.0% 0.30 0.4% 0.00 0.0% 1.05 1.2% 60.30 81.2% 0.05 0.2% 0.00 0.0% 61.70 13.5%
E‐waste/electronics 0.00 0.0% 0.00 0.0% 0.00 0.0% 0.00 0.0% 0.00 0.0% 0.00 0.0% 0.00 0.0% 0.00 0.0%
Metal 0.15 0.3% 0.00 0.0% 0.25 0.2% 0.00 0.0% 0.00 0.0% 0.00 0.0% 0.00 0.0% 0.40 0.1%
Wood 0.00 0.0% 0.00 0.0% 0.00 0.0% 0.00 0.0% 0.00 0.0% 0.00 0.0% 0.00 0.0% 0.00 0.0%
LDPE Plastic Films 0.00 0.0% 0.00 0.0% 0.00 0.0% 0.00 0.0% 0.00 0.0% 0.00 0.0% 0.00 0.0% 0.00 0.0%
Other / Non recyclable 36.55 63.5% 56.14 78.6% 90.45 67.5% 50.80 56.5% 8.44 11.4% 23.15 79.6% 0.00 0.0% 265.53 58.0%
QAQC Check 57.60 100.0% 71.40 100.0% 134.05 100.0% 89.95 100.0% 74.25 100.0% 29.10 100.0% 1.85 100.0% 458.20 100.0%
Table B4: Garbage to Landfill Compostion (Ranked)
Total Weight of waste shipped off‐site: 1903.05 Table B5: Mixed Container Summary Table B6: Mixed Paper Summary
Composition Percent Tonnes Recycle?
Assumed Capture Amount Material
Garbage Sample Percent Disposed Recycled Material
Garbage Sample Percent Disposed Recycled
26.55 110.27 332.62 28.01 116.33 518.30
Y/N MT(1) kg % MT MT kg % MT MT
Other / Non recyclable 58.0% 1102.83 No PET (#1 Plastic) 11.12 41.9% 46.20 139.37 Fine Papers 8.77 31.3% 36.41 162.23
Paper Towels 13.5% 256.26 Yes 153.8 HDPE (#2 Plastic) 1.17 4.4% 4.85 14.64 Newsprint 7.03 25.1% 29.20 130.09
Organic Food Waste 12.1% 229.68 Yes 137.8 PP (#5 Plastic) 1.04 3.9% 4.30 12.97 Boxboard 8.60 30.7% 35.71 159.12
Total Mixed Papers 6.1% 116.33 Yes 69.8 Aluminum 3.88 14.6% 16.10 48.56 Other Fibres 3.61 12.9% 15.01 66.86
Total Mixed Containers 5.8% 110.27 Yes 66.2 Steel 1.01 3.8% 4.19 12.64
Coffee Cups 3.9% 74.18 Yes 44.5 Glass 4.19 15.8% 17.42 52.55
Styrofoam 0.5% 10.18 Yes 6.1 Gable Top 2.31 8.7% 9.59 28.94
Corrugated Cardboard 0.1% 1.66 Yes 1.0 Aseptic 1.83 6.9% 7.61 22.95
Scrap Metal 0.1% 1.66 Yes 1.0 Total 26.55 100.0% 110.27 332.62 Total 28.01 100.0% 116.33 518.30
Total 100.0% 1903.05
Note 1: Assume 60% capture rate Recycling/Reuse Potential 480.1
Table B7: Mandatory vs Other Recyclable vs Non‐Recyclable
Waste Generating Area Office & Admin Labs Public Areas Cafeteria Washrooms Miscel. Unlabeled Total
O.Reg.103 ‐ Mandatory Recyclable 10.35 18.0% 13.30 18.6% 12.20 9.1% 10.60 11.8% 5.06 6.8% 3.45 11.9% 0.00 0.0% 54.96 12.0%
Other Recyclable 10.70 18.6% 1.96 2.7% 31.40 23.4% 28.55 31.7% 60.75 81.8% 2.50 8.6% 1.85 100.0% 137.71 30.1%
Non‐Recyclable 36.55 63.5% 56.14 78.6% 90.45 67.5% 50.80 56.5% 8.44 11.4% 23.15 79.6% 0.00 0.0% 265.53 58.0%
QAQC Check 57.60 100.0% 71.40 100.0% 134.05 100.0% 89.95 100.0% 74.25 100.0% 29.10 100.0% 1.85 100.0% 458.20 100.0%
TRUE TRUE TRUE TRUE TRUE TRUE TRUE TRUE
6.4% 0.4% 100.0%12.6% 15.6% 29.3% 19.6% 16.2%
458.2029.10 1.8557.60 71.40 134.05 89.95 74.25

Waste Audit Report
Brock University
WRG Project P0439
Table B8: Office/Admin Garbage Summary
1 2 3 4 5 6 7 8 9 10 11 12 13 14 15 16 17 18
Material category
Jackman
Humanities
Admissions and Awards
Faculty of Social W
ork
OISE
Rotm
an School of Mngt
University College
UTS
Architecture Building
Fields Institute
Gage Building
Koffler Studen
t Cen
tre
Ram
say Wright Building
Sydney Smith Hall
Robarts Library
Den
tal Building
Health Scien
ces Building
Simcoe Hall
Haultain Building
Overall
kg kg kg kg kg kg kg kg kg kg kg kg kg kg kg kg kg kg kg %
Mixed Papers 0.1 0.0 0.0 0.0 3.7 0.0 0.1 1.1 0.1 0.0 0.1 0.0 0.3 0.2 0.0 0.1 0.0 0.0 5.60 9.7%
Mixed Containers 0.2 1.2 0.4 0.2 0.8 0.3 0.4 0.1 0.1 0.0 0.1 0.2 0.1 0.4 0.0 0.3 0.1 0.1 4.75 8.2%
Corrugated Cardboard0.0 0.0 0.0 0.0 0.0 0.0 0.0 0.0 0.0 0.0 0.0 0.0 0.0 0.0 0.0 0.0 0.0 0.0 0.00 0.0%
Coffee Cups 0.2 0.4 0.2 0.2 0.7 0.1 0.6 0.1 0.1 0.0 0.1 0.1 0.3 0.3 0.0 0.7 0.2 0.3 4.30 7.5%
Styrofoam 0.0 0.0 0.0 0.0 0.0 0.0 0.0 0.0 0.0 0.0 0.0 0.0 0.0 0.0 0.0 0.0 0.0 0.4 0.40 0.7%
Organic Food Waste 0.9 0.3 0.4 0.9 0.8 0.4 0.9 0.0 0.0 0.0 0.0 0.0 0.6 0.0 0.0 0.6 0.0 0.2 5.85 10.2%
Paper Towels 0.0 0.0 0.0 0.0 0.0 0.0 0.0 0.0 0.0 0.0 0.0 0.0 0.0 0.0 0.0 0.0 0.0 0.0 0.00 0.0%
E‐waste/electronics 0.0 0.0 0.0 0.0 0.0 0.0 0.0 0.0 0.0 0.0 0.0 0.0 0.0 0.0 0.0 0.0 0.0 0.0 0.00 0.0%
Metal 0.0 0.0 0.0 0.0 0.0 0.0 0.0 0.0 0.0 0.0 0.0 0.0 0.2 0.0 0.0 0.0 0.0 0.0 0.15 0.3%
Wood 0.0 0.0 0.0 0.0 0.0 0.0 0.0 0.0 0.0 0.0 0.0 0.0 0.0 0.0 0.0 0.0 0.0 0.0 0.00 0.0%
LDPE Plastic Films 0.0 0.0 0.0 0.0 0.0 0.0 0.0 0.0 0.0 0.0 0.0 0.0 0.0 0.0 0.0 0.0 0.0 0.0 0.00 0.0%
Other / Non recyclable 0.7 2.8 1.3 1.9 5.9 1.0 2.4 0.9 0.9 0.0 2.9 0.8 1.6 4.0 0.0 6.4 2.9 0.5 36.55 63.5%
Total 2.10 4.65 2.30 3.10 11.90 1.70 4.25 2.15 1.10 0.00 3.05 1.00 3.00 4.80 0.00 7.95 3.05 1.50 57.60 100.0%
Percentage 3.6% 8.1% 4.0% 5.4% 20.7% 3.0% 7.4% 3.7% 1.9% 0.0% 5.3% 1.7% 5.2% 8.3% 0.0% 13.8% 5.3% 2.6% 1.00 TRUE
Table B9: Labs Garbage Summary
1 2 3 4 5 6 7 8 9 10 11 12 13 14 15 16 17 18
Material category
Jackman
Humanities
Admissions and Awards
Faculty of Social W
ork
OISE
Rotm
an School of Mngt
University College
UTS
Architecture Building
Fields Institute
Gage Building
Koffler Studen
t Cen
tre
Ram
say Wright Building
Sydney Smith Hall
Robarts Library
Den
tal Building
Health Scien
ces Building
Simcoe Hall
Haultain Building
Overall
kg kg kg kg kg kg kg kg kg kg kg kg kg kg kg kg kg kg kg %
Mixed Papers 0.3 0.0 0.0 0.0 0.0 0.0 0.0 8.6 0.0 0.0 0.0 0.0 0.0 0.0 0.5 0.1 0.0 0.3 9.7 13.6%
Mixed Containers 0.0 0.0 0.0 0.0 0.0 0.0 0.0 3.3 0.0 0.0 0.0 0.0 0.0 0.0 0.2 0.1 0.0 0.0 3.6 5.0%
Corrugated Cardboard0.0 0.0 0.0 0.0 0.0 0.0 0.0 0.0 0.0 0.0 0.0 0.0 0.0 0.0 0.0 0.0 0.0 0.0 0.0 0.0%
Coffee Cups 0.0 0.0 0.0 0.0 0.0 0.0 0.0 0.3 0.0 0.0 0.0 0.0 0.0 0.0 0.1 0.0 0.0 0.0 0.4 0.5%
Styrofoam 0.0 0.0 0.0 0.0 0.0 0.0 0.0 0.0 0.0 0.0 0.0 0.0 0.0 0.0 0.0 0.0 0.0 0.0 0.0 0.0%
Organic Food Waste 0.2 0.0 0.0 0.0 0.0 0.0 0.0 1.2 0.0 0.0 0.0 0.0 0.0 0.0 0.0 0.0 0.0 0.0 1.3 1.8%
Paper Towels 0.0 0.0 0.0 0.0 0.0 0.0 0.0 0.0 0.0 0.3 0.0 0.0 0.0 0.0 0.0 0.0 0.0 0.0 0.3 0.4%
E‐waste/electronics 0.0 0.0 0.0 0.0 0.0 0.0 0.0 0.0 0.0 0.0 0.0 0.0 0.0 0.0 0.0 0.0 0.0 0.0 0.0 0.0%
Metal 0.0 0.0 0.0 0.0 0.0 0.0 0.0 0.0 0.0 0.0 0.0 0.0 0.0 0.0 0.0 0.0 0.0 0.0 0.0 0.0%
Wood 0.0 0.0 0.0 0.0 0.0 0.0 0.0 0.0 0.0 0.0 0.0 0.0 0.0 0.0 0.0 0.0 0.0 0.0 0.0 0.0%
LDPE Plastic Films 0.0 0.0 0.0 0.0 0.0 0.0 0.0 0.0 0.0 0.0 0.0 0.0 0.0 0.0 0.0 0.0 0.0 0.0 0.0 0.0%
Other / Non recyclable 0.4 0.0 0.0 0.0 0.0 0.0 0.0 8.6 0.0 0.0 0.0 0.5 0.0 0.0 45.3 0.8 0.0 0.6 56.1 78.6%
Total 0.8 0.0 0.0 0.0 0.0 0.0 0.0 21.9 0.0 0.3 0.0 0.5 0.0 0.0 46.1 1.0 0.0 0.9 71.4 100.0%
Percentage 1.1% 0.0% 0.0% 0.0% 0.0% 0.0% 0.0% 30.6% 0.0% 0.4% 0.0% 0.7% 0.0% 0.0% 64.5% 1.4% 0.0% 1.3% 1.0 TRUE
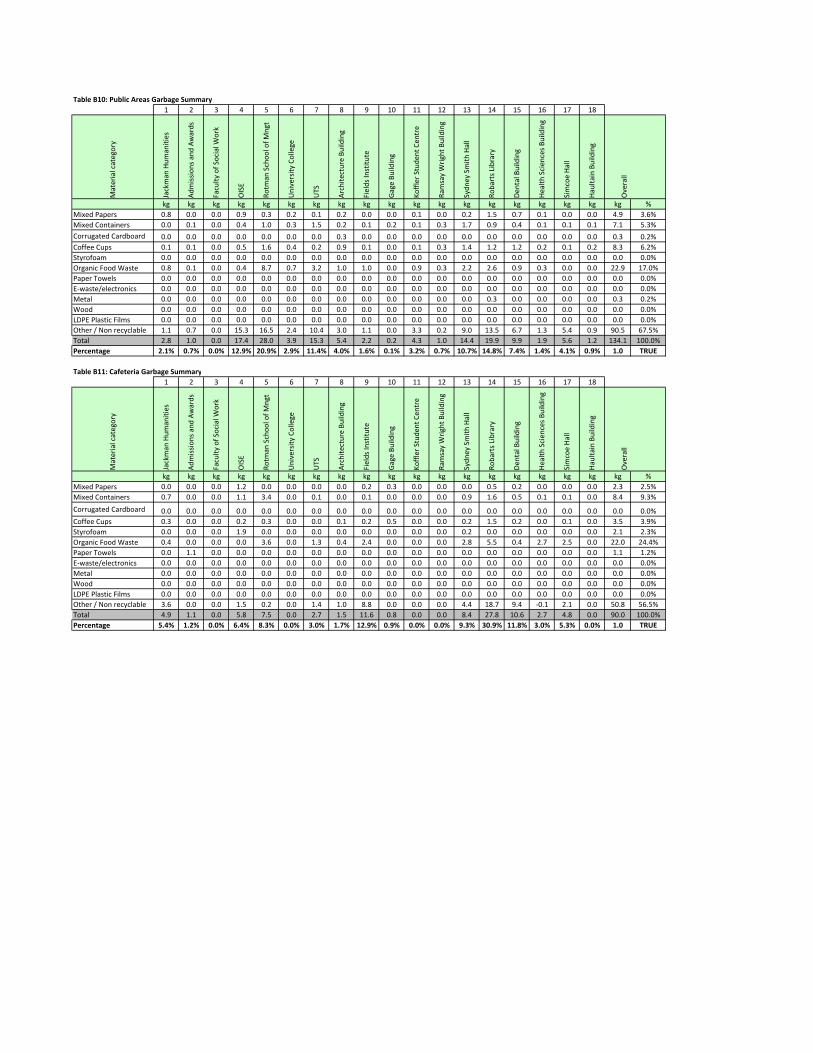
Table B10: Public Areas Garbage Summary
1 2 3 4 5 6 7 8 9 10 11 12 13 14 15 16 17 18Material category
Jackman
Humanities
Admissions and Awards
Faculty of Social W
ork
OISE
Rotm
an School of Mngt
University College
UTS
Architecture Building
Fields Institute
Gage Building
Koffler Studen
t Cen
tre
Ram
say Wright Building
Sydney Smith Hall
Robarts Library
Den
tal Building
Health Scien
ces Building
Simcoe Hall
Haultain Building
Overall
kg kg kg kg kg kg kg kg kg kg kg kg kg kg kg kg kg kg kg %
Mixed Papers 0.8 0.0 0.0 0.9 0.3 0.2 0.1 0.2 0.0 0.0 0.1 0.0 0.2 1.5 0.7 0.1 0.0 0.0 4.9 3.6%
Mixed Containers 0.0 0.1 0.0 0.4 1.0 0.3 1.5 0.2 0.1 0.2 0.1 0.3 1.7 0.9 0.4 0.1 0.1 0.1 7.1 5.3%
Corrugated Cardboard 0.0 0.0 0.0 0.0 0.0 0.0 0.0 0.3 0.0 0.0 0.0 0.0 0.0 0.0 0.0 0.0 0.0 0.0 0.3 0.2%
Coffee Cups 0.1 0.1 0.0 0.5 1.6 0.4 0.2 0.9 0.1 0.0 0.1 0.3 1.4 1.2 1.2 0.2 0.1 0.2 8.3 6.2%
Styrofoam 0.0 0.0 0.0 0.0 0.0 0.0 0.0 0.0 0.0 0.0 0.0 0.0 0.0 0.0 0.0 0.0 0.0 0.0 0.0 0.0%
Organic Food Waste 0.8 0.1 0.0 0.4 8.7 0.7 3.2 1.0 1.0 0.0 0.9 0.3 2.2 2.6 0.9 0.3 0.0 0.0 22.9 17.0%
Paper Towels 0.0 0.0 0.0 0.0 0.0 0.0 0.0 0.0 0.0 0.0 0.0 0.0 0.0 0.0 0.0 0.0 0.0 0.0 0.0 0.0%
E‐waste/electronics 0.0 0.0 0.0 0.0 0.0 0.0 0.0 0.0 0.0 0.0 0.0 0.0 0.0 0.0 0.0 0.0 0.0 0.0 0.0 0.0%
Metal 0.0 0.0 0.0 0.0 0.0 0.0 0.0 0.0 0.0 0.0 0.0 0.0 0.0 0.3 0.0 0.0 0.0 0.0 0.3 0.2%
Wood 0.0 0.0 0.0 0.0 0.0 0.0 0.0 0.0 0.0 0.0 0.0 0.0 0.0 0.0 0.0 0.0 0.0 0.0 0.0 0.0%
LDPE Plastic Films 0.0 0.0 0.0 0.0 0.0 0.0 0.0 0.0 0.0 0.0 0.0 0.0 0.0 0.0 0.0 0.0 0.0 0.0 0.0 0.0%
Other / Non recyclable 1.1 0.7 0.0 15.3 16.5 2.4 10.4 3.0 1.1 0.0 3.3 0.2 9.0 13.5 6.7 1.3 5.4 0.9 90.5 67.5%
Total 2.8 1.0 0.0 17.4 28.0 3.9 15.3 5.4 2.2 0.2 4.3 1.0 14.4 19.9 9.9 1.9 5.6 1.2 134.1 100.0%
Percentage 2.1% 0.7% 0.0% 12.9% 20.9% 2.9% 11.4% 4.0% 1.6% 0.1% 3.2% 0.7% 10.7% 14.8% 7.4% 1.4% 4.1% 0.9% 1.0 TRUE
Table B11: Cafeteria Garbage Summary
1 2 3 4 5 6 7 8 9 10 11 12 13 14 15 16 17 18
Material category
Jackman
Humanities
Admissions and Awards
Faculty of Social W
ork
OISE
Rotm
an School of Mngt
University College
UTS
Architecture Building
Fields Institute
Gage Building
Koffler Studen
t Cen
tre
Ram
say Wright Building
Sydney Smith Hall
Robarts Library
Den
tal Building
Health Scien
ces Building
Simcoe Hall
Haultain Building
Overall
kg kg kg kg kg kg kg kg kg kg kg kg kg kg kg kg kg kg kg %
Mixed Papers 0.0 0.0 0.0 1.2 0.0 0.0 0.0 0.0 0.2 0.3 0.0 0.0 0.0 0.5 0.2 0.0 0.0 0.0 2.3 2.5%
Mixed Containers 0.7 0.0 0.0 1.1 3.4 0.0 0.1 0.0 0.1 0.0 0.0 0.0 0.9 1.6 0.5 0.1 0.1 0.0 8.4 9.3%
Corrugated Cardboard 0.0 0.0 0.0 0.0 0.0 0.0 0.0 0.0 0.0 0.0 0.0 0.0 0.0 0.0 0.0 0.0 0.0 0.0 0.0 0.0%
Coffee Cups 0.3 0.0 0.0 0.2 0.3 0.0 0.0 0.1 0.2 0.5 0.0 0.0 0.2 1.5 0.2 0.0 0.1 0.0 3.5 3.9%
Styrofoam 0.0 0.0 0.0 1.9 0.0 0.0 0.0 0.0 0.0 0.0 0.0 0.0 0.2 0.0 0.0 0.0 0.0 0.0 2.1 2.3%
Organic Food Waste 0.4 0.0 0.0 0.0 3.6 0.0 1.3 0.4 2.4 0.0 0.0 0.0 2.8 5.5 0.4 2.7 2.5 0.0 22.0 24.4%
Paper Towels 0.0 1.1 0.0 0.0 0.0 0.0 0.0 0.0 0.0 0.0 0.0 0.0 0.0 0.0 0.0 0.0 0.0 0.0 1.1 1.2%
E‐waste/electronics 0.0 0.0 0.0 0.0 0.0 0.0 0.0 0.0 0.0 0.0 0.0 0.0 0.0 0.0 0.0 0.0 0.0 0.0 0.0 0.0%
Metal 0.0 0.0 0.0 0.0 0.0 0.0 0.0 0.0 0.0 0.0 0.0 0.0 0.0 0.0 0.0 0.0 0.0 0.0 0.0 0.0%
Wood 0.0 0.0 0.0 0.0 0.0 0.0 0.0 0.0 0.0 0.0 0.0 0.0 0.0 0.0 0.0 0.0 0.0 0.0 0.0 0.0%
LDPE Plastic Films 0.0 0.0 0.0 0.0 0.0 0.0 0.0 0.0 0.0 0.0 0.0 0.0 0.0 0.0 0.0 0.0 0.0 0.0 0.0 0.0%
Other / Non recyclable 3.6 0.0 0.0 1.5 0.2 0.0 1.4 1.0 8.8 0.0 0.0 0.0 4.4 18.7 9.4 ‐0.1 2.1 0.0 50.8 56.5%
Total 4.9 1.1 0.0 5.8 7.5 0.0 2.7 1.5 11.6 0.8 0.0 0.0 8.4 27.8 10.6 2.7 4.8 0.0 90.0 100.0%
Percentage 5.4% 1.2% 0.0% 6.4% 8.3% 0.0% 3.0% 1.7% 12.9% 0.9% 0.0% 0.0% 9.3% 30.9% 11.8% 3.0% 5.3% 0.0% 1.0 TRUE

Table B12: Washrooms Garbage Summary
1 2 3 4 5 6 7 8 9 10 11 12 13 14 15 16 17 18Material category
Jackman
Humanities
Admissions and Awards
Faculty of Social W
ork
OISE
Rotm
an School of Mngt
University College
UTS
Architecture Building
Fields Institute
Gage Building
Koffler Studen
t Cen
tre
Ram
say Wright Building
Sydney Smith Hall
Robarts Library
Den
tal Building
Health Scien
ces Building
Simcoe Hall
Haultain Building
Overall
kg kg kg kg kg kg kg kg kg kg kg kg kg kg kg kg kg kg kg %
Mixed Papers 2.0 2.0 0.0 0.1 0.3 0.1 0.1 0.2 0.0 0.0 0.0 0.0 0.0 0.0 0.0 0.0 0.0 0.0 4.6 6.2%
Mixed Containers 0.0 0.0 0.0 0.0 0.0 0.1 0.0 0.0 0.0 0.0 0.0 0.0 0.0 0.1 0.1 0.0 0.0 0.1 0.3 0.4%
Corrugated Cardboard 0.0 0.0 0.0 0.0 0.0 0.0 0.0 0.0 0.0 0.0 0.2 0.0 0.0 0.0 0.0 0.0 0.0 0.0 0.2 0.2%
Coffee Cups 0.0 0.0 0.0 0.0 0.1 0.0 0.0 0.0 0.0 0.0 0.0 0.1 0.1 0.1 0.0 0.0 0.1 0.1 0.5 0.6%
Styrofoam 0.0 0.0 0.0 0.0 0.0 0.0 0.0 0.0 0.0 0.0 0.0 0.0 0.0 0.0 0.0 0.0 0.0 0.0 0.0 0.0%
Organic Food Waste 0.0 0.0 0.0 0.0 0.0 0.0 0.0 0.0 0.0 0.0 0.0 0.0 0.0 0.0 0.0 0.0 0.0 0.0 0.0 0.0%
Paper Towels 4.8 5.3 0.8 5.9 7.7 2.0 12.4 3.0 1.5 0.6 0.0 0.3 2.6 9.3 4.4 0.0 0.0 0.0 60.3 81.2%
E‐waste/electronics 0.0 0.0 0.0 0.0 0.0 0.0 0.0 0.0 0.0 0.0 0.0 0.0 0.0 0.0 0.0 0.0 0.0 0.0 0.0 0.0%
Metal 0.0 0.0 0.0 0.0 0.0 0.0 0.0 0.0 0.0 0.0 0.0 0.0 0.0 0.0 0.0 0.0 0.0 0.0 0.0 0.0%
Wood 0.0 0.0 0.0 0.0 0.0 0.0 0.0 0.0 0.0 0.0 0.0 0.0 0.0 0.0 0.0 0.0 0.0 0.0 0.0 0.0%
LDPE Plastic Films 0.0 0.0 0.0 0.0 0.0 0.0 0.0 0.0 0.0 0.0 0.0 0.0 0.0 0.0 0.0 0.0 0.0 0.0 0.0 0.0%
Other / Non recyclable 0.0 0.0 0.0 1.6 0.0 0.0 0.0 0.0 0.0 0.0 1.3 0.0 0.0 0.0 0.0 0.0 3.4 2.2 8.4 11.4%
Total 6.8 7.3 0.8 7.5 8.0 2.1 12.5 3.2 1.5 0.6 1.4 0.3 2.7 9.5 4.4 0.0 3.5 2.4 74.3 100.0%
Percentage 9.2% 9.8% 1.1% 10.1% 10.7% 2.8% 16.8% 4.3% 2.0% 0.8% 1.9% 0.4% 3.6% 12.8% 5.9% 0.0% 4.7% 3.2% 1.0 TRUE
Table B13: Miscellaneous Garbage Summary
1 2 3 4 5 6 7 8 9 10 11 12 13 14 15 16 17 18
Material category
Jackman
Humanities
Admissions and Awards
Faculty of Social W
ork
OISE
Rotm
an School of Mngt
University College
UTS
Architecture Building
Fields Institute
Gage Building
Koffler Studen
t Cen
tre
Ram
say Wright Building
Sydney Smith Hall
Robarts Library
Den
tal Building
Health Scien
ces Building
Simcoe Hall
Haultain Building
Overall
kg kg kg kg kg kg kg kg kg kg kg kg kg kg kg kg kg kg kg %
Mixed Papers 0.0 0.0 0.5 0.0 0.0 0.0 0.0 0.0 0.0 0.0 0.0 0.0 0.0 0.6 0.0 0.0 0.0 0.0 1.0 3.4%
Mixed Containers 0.0 0.0 1.0 0.0 0.0 0.3 0.0 0.0 0.0 0.0 0.0 0.0 0.0 1.2 0.0 0.0 0.0 0.0 2.5 8.4%
Corrugated Cardboard 0.0 0.0 0.0 0.0 0.0 0.0 0.0 0.0 0.0 0.0 0.0 0.0 0.0 0.0 0.0 0.0 0.0 0.0 0.0 0.0%
Coffee Cups 0.0 0.0 0.0 0.0 0.0 0.0 0.0 0.0 0.0 0.0 0.0 0.0 0.0 0.9 0.0 0.0 0.0 0.0 0.9 3.1%
Styrofoam 0.0 0.0 0.0 0.0 0.0 0.0 0.0 0.0 0.0 0.0 0.0 0.0 0.0 0.0 0.0 0.0 0.0 0.0 0.0 0.0%
Organic Food Waste 0.0 0.0 0.0 0.0 0.0 0.0 0.0 0.0 0.0 0.0 0.0 0.0 0.0 1.6 0.0 0.0 0.0 0.0 1.6 5.3%
Paper Towels 0.0 0.0 0.1 0.0 0.0 0.0 0.0 0.0 0.0 0.0 0.0 0.0 0.0 0.0 0.0 0.0 0.0 0.0 0.1 0.2%
E‐waste/electronics 0.0 0.0 0.0 0.0 0.0 0.0 0.0 0.0 0.0 0.0 0.0 0.0 0.0 0.0 0.0 0.0 0.0 0.0 0.0 0.0%
Metal 0.0 0.0 0.0 0.0 0.0 0.0 0.0 0.0 0.0 0.0 0.0 0.0 0.0 0.0 0.0 0.0 0.0 0.0 0.0 0.0%
Wood 0.0 0.0 0.0 0.0 0.0 0.0 0.0 0.0 0.0 0.0 0.0 0.0 0.0 0.0 0.0 0.0 0.0 0.0 0.0 0.0%
LDPE Plastic Films 0.0 0.0 0.0 0.0 0.0 0.0 0.0 0.0 0.0 0.0 0.0 0.0 0.0 0.0 0.0 0.0 0.0 0.0 0.0 0.0%
Other / Non recyclable 0.0 0.0 0.0 0.0 0.0 9.2 0.0 0.0 0.0 0.0 0.0 0.0 0.0 14.0 0.0 0.0 0.0 0.0 23.2 79.6%
Total 0.0 0.0 1.5 0.0 0.0 9.4 0.0 0.0 0.0 0.0 0.0 0.0 0.0 18.2 0.0 0.0 0.0 0.0 29.1 100.0%
Percentage 0.0% 0.0% 5.2% 0.0% 0.0% 32.3% 0.0% 0.0% 0.0% 0.0% 0.0% 0.0% 0.0% 62.5% 0.0% 0.0% 0.0% 0.0% 1.0 TRUE
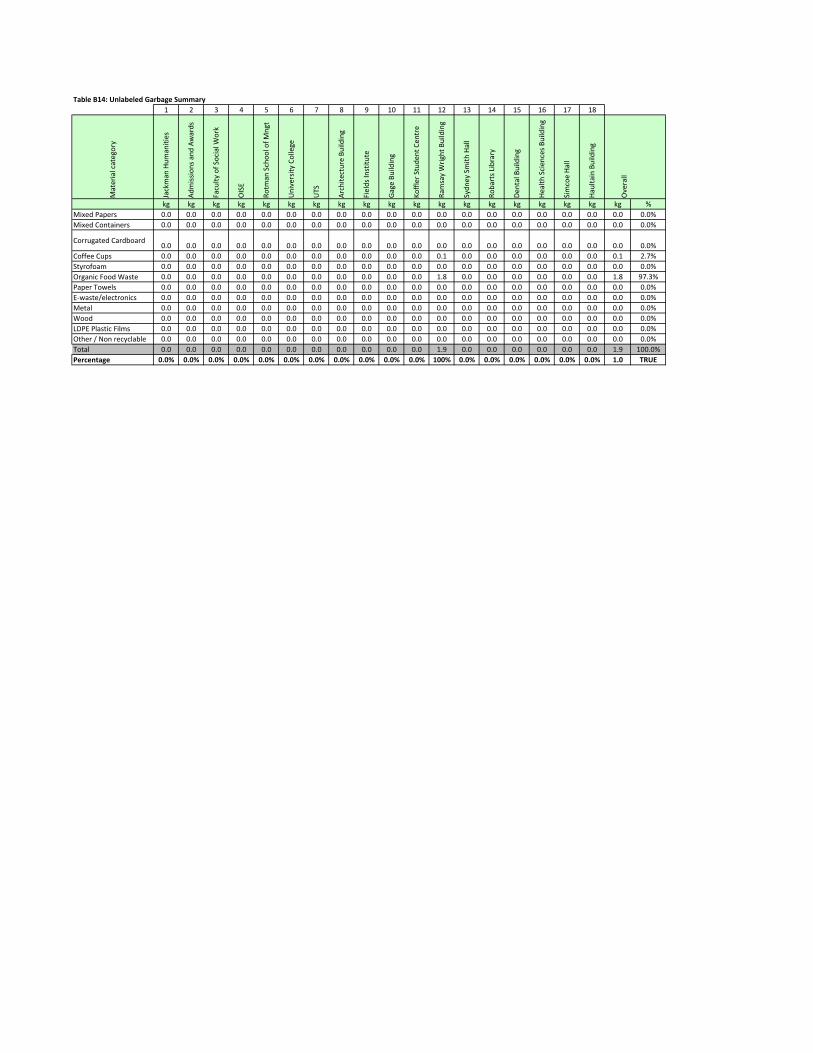
Table B14: Unlabeled Garbage Summary
1 2 3 4 5 6 7 8 9 10 11 12 13 14 15 16 17 18Material category
Jackman
Humanities
Admissions and Awards
Faculty of Social W
ork
OISE
Rotm
an School of Mngt
University College
UTS
Architecture Building
Fields Institute
Gage Building
Koffler Studen
t Cen
tre
Ram
say Wright Building
Sydney Smith Hall
Robarts Library
Den
tal Building
Health Scien
ces Building
Simcoe Hall
Haultain Building
Overall
kg kg kg kg kg kg kg kg kg kg kg kg kg kg kg kg kg kg kg %
Mixed Papers 0.0 0.0 0.0 0.0 0.0 0.0 0.0 0.0 0.0 0.0 0.0 0.0 0.0 0.0 0.0 0.0 0.0 0.0 0.0 0.0%
Mixed Containers 0.0 0.0 0.0 0.0 0.0 0.0 0.0 0.0 0.0 0.0 0.0 0.0 0.0 0.0 0.0 0.0 0.0 0.0 0.0 0.0%
Corrugated Cardboard0.0 0.0 0.0 0.0 0.0 0.0 0.0 0.0 0.0 0.0 0.0 0.0 0.0 0.0 0.0 0.0 0.0 0.0 0.0 0.0%
Coffee Cups 0.0 0.0 0.0 0.0 0.0 0.0 0.0 0.0 0.0 0.0 0.0 0.1 0.0 0.0 0.0 0.0 0.0 0.0 0.1 2.7%
Styrofoam 0.0 0.0 0.0 0.0 0.0 0.0 0.0 0.0 0.0 0.0 0.0 0.0 0.0 0.0 0.0 0.0 0.0 0.0 0.0 0.0%
Organic Food Waste 0.0 0.0 0.0 0.0 0.0 0.0 0.0 0.0 0.0 0.0 0.0 1.8 0.0 0.0 0.0 0.0 0.0 0.0 1.8 97.3%
Paper Towels 0.0 0.0 0.0 0.0 0.0 0.0 0.0 0.0 0.0 0.0 0.0 0.0 0.0 0.0 0.0 0.0 0.0 0.0 0.0 0.0%
E‐waste/electronics 0.0 0.0 0.0 0.0 0.0 0.0 0.0 0.0 0.0 0.0 0.0 0.0 0.0 0.0 0.0 0.0 0.0 0.0 0.0 0.0%
Metal 0.0 0.0 0.0 0.0 0.0 0.0 0.0 0.0 0.0 0.0 0.0 0.0 0.0 0.0 0.0 0.0 0.0 0.0 0.0 0.0%
Wood 0.0 0.0 0.0 0.0 0.0 0.0 0.0 0.0 0.0 0.0 0.0 0.0 0.0 0.0 0.0 0.0 0.0 0.0 0.0 0.0%
LDPE Plastic Films 0.0 0.0 0.0 0.0 0.0 0.0 0.0 0.0 0.0 0.0 0.0 0.0 0.0 0.0 0.0 0.0 0.0 0.0 0.0 0.0%
Other / Non recyclable 0.0 0.0 0.0 0.0 0.0 0.0 0.0 0.0 0.0 0.0 0.0 0.0 0.0 0.0 0.0 0.0 0.0 0.0 0.0 0.0%
Total 0.0 0.0 0.0 0.0 0.0 0.0 0.0 0.0 0.0 0.0 0.0 1.9 0.0 0.0 0.0 0.0 0.0 0.0 1.9 100.0%
Percentage 0.0% 0.0% 0.0% 0.0% 0.0% 0.0% 0.0% 0.0% 0.0% 0.0% 0.0% 100% 0.0% 0.0% 0.0% 0.0% 0.0% 0.0% 1.0 TRUE

Waste Audit ReportUniversity of Toronto, St George Campus
SDK Project P0481
Table B15: Annual Waste Management & Recycling Quantities
Waste MaterialRecycled/ Reused, Disposed
kg MT %2013-2014 Total
Waste/Garbage Disposed 1903.05 100.0%Sub-Total 1903.05
Mixed Papers Recycled 518.30 11.4%Paper Towls Recycled 18.50 0.4%Cardboard Recycled 345.30Confidential Papers Recycled 130.60 2.9%Scrap Wood Recycled 177.72 3.9%Scrap Metals Recycled 55.04 1.2%Asphalt Recycled 260 00Asphalt Recycled 260.00Stone, Pavers & Screening Recycled 50.00 1.1%Soil from Construction Projects Recycled 215.00 4.7%Concrete from Construction Recycled 292.00 6.4%Clean Fill Recycled 118.00 2.6%Batteries Recycled 2.00 0.0%Fluorescent Bulbs Recycled 10.50Polystyrene Recycled 4.08Aero. Misc. Pick Ups Recycled 5.4089 Chestnut Mixed Containers Recycled 190.80M. Hall Mixed Containers Recycled 23.52 0.5%Mixed Containers Recycled 118.30 2.6%Coffee Cups Recycled 11.04Amber Bottles Recycled 6.00Electronic Wastes Recycled 47.35Mixed Plastics Recycled 4.88Misc: tires, matresses, rocks etc. Recycled 1.88Lab Glass & Plastic Recycled 23.62Recycling from Compactor Loads Recycled 246.22 5.4%Yard Wastes Composted 49.87 1.1%Yard Wastes Composted 49.87 1.1%Animal Bedding Composted 111.49Soil & Plant P/U Composted 120.00Plant & Tree Use, Composting Composted 20.00Grass & Wood Mulch Composted 88.00Catch Basin Material Composted 88.00 1.9%Organics Composted 285.1289 Chestnut Organics Composted 585.00Swap Shop - Out, Including Pad Reused 19.29 0.4%In-Swap Reused 12.00 0.3%Campus Furniture Projects Reused 164 74 3 6%Campus Furniture Projects Reused 164.74 3.6%Wood Pallets Reused 12.00 0.3%Reduction via Various Programs Reduced 123.90 2.72%
Sub-Total 4555.43
Total Generated 6458.48 100.0%Total Recycled 2876.03 44.5%Total Reused 208.03 3.2%Total Reduced 123.90 1.92%T t l C t d 1347 47 20 9%Total Composted 1347.47 20.9%Total Disposed 1903.05 29.5%
Achieved Waste Diversion Rate 70.5%Additioanl Recyclable Materials in Wastes Disposed to Landfill (MT) 480.13Potential Waste Diversion Rate 82.2%Notes:Detailed records of annual weights provided by UofT. Most recent complete data available.

Waste Audit Data Collection Sheet
Client: University of Toronto, St. George Campus
Site: Jackman Humanities 170 St George St
Date: Apr‐20‐15
Area of Collection: Offices Labs Public Areas Cafeteria Washrooms Miscel. Unlabeled Total
Colour Code Blue Yellow Black Green Red White Unlabeled
Total Weight of Sample (in kg):
Total Percent of Sample (in %):
C i i f G b k % k % k % k % k % k % k % k %
4.90
0.0% 100.0%
17.35
28.2% 0.0%
6.80
39.2%12.1%
2.10 0.80 2.75
4.6% 15.9%
Composition of Garbage: kg % kg % kg % kg % kg % kg % kg % kg %
Total Mixed Papers 0.100 4.8% 0.30 37.5% 0.80 29.1% 0.00 0.0% 2.00 29.4% 3.20 18.4%
Total Mixed Containers 0.200 9.5% 0.00 0.0% 0.00 0.0% 0.70 14.3% 0.00 0.0% 0.90 5.2%
Corrugated Cardboard 0.000 0.0% 0.00 0.0% 0.00 0.0% 0.00 0.0% 0.00 0.0% 0.00 0.0%
Coffee Cups 0.200 9.5% 0.00 0.0% 0.10 3.6% 0.25 5.1% 0.00 0.0% 0.55 3.2%
St f 0 000Styrofoam 0.000 0.0% 0.00 0.0% 0.00 0.0% 0.00 0.0% 0.00 0.0% 0.00 0.0%
Organic Food Waste 0.900 42.9% 0.15 18.8% 0.75 27.3% 0.40 8.2% 0.00 0.0% 2.20 12.7%
Paper Towels 0.000 0.0% 0.00 0.0% 0.00 0.0% 0.00 0.0% 4.80 70.6% 4.80 27.7%
E‐waste/electronics 0.000 0.0% 0.00 0.0% 0.00 0.0% 0.00 0.0% 0.00 0.0% 0.00 0.0%
Metal 0.000 0.0% 0.00 0.0% 0.00 0.0% 0.00 0.0% 0.00 0.0% 0.00 0.0%
dWood 0.000 0.0% 0.00 0.0% 0.00 0.0% 0.00 0.0% 0.00 0.0% 0.00 0.0%
LDPE Plastic Films 0.000 0.0% 0.00 0.0% 0.00 0.0% 0.00 0.0% 0.00 0.0% 0.00 0.0%
Other / Non recyclable 0.70 33.3% 0.35 43.8% 1.10 40.0% 3.55 72.4% 0.00 0.0% 5.70 32.9%
Total QAQC Check 2.10 100.0% 0.80 100.0% 2.75 100.0% 4.90 100.0% 6.80 100.0% 0.00 0.0% 0.00 0.0% 17.35 100.0%
General Comments and Observations:

Waste Audit Data Collection Sheet
Client: University of Toronto, St. George Campus
Site: Admissions and Awards 172 St George St
Date: Apr‐20‐15
Area of Collection: Offices Labs Public Areas Cafeteria Washrooms Miscel. Unlabeled Total
Colour Code Blue Yellow Black Green Red White Unlabeled
Total Weight of Sample (in kg):
Total Percent of Sample (in %):
Composition of Garbage: kg % kg % kg % kg % kg % kg % kg % kg %
Total Mixed Papers 0.000 0.0% 0.000 0.0% 0.000 0.0% 1.950 26.9% 1.95 14.0%
Total Mixed Containers 1.200 25.8% 0.100 10.0% 0.000 0.0% 0.000 0.0% 1.30 9.3%
Corrugated Cardboard 0.000 0.0% 0.000 0.0% 0.000 0.0% 0.000 0.0% 0.00 0.0%
Coffee Cups 0.350 7.5% 0.100 10.0% 0.000 0.0% 0.000 0.0% 0.45 3.2%
Styrofoam 0.000 0.0% 0.000 0.0% 0.000 0.0% 0.000 0.0% 0.00 0.0%
Organic Food Waste 0.300 6.5% 0.100 10.0% 0.000 0.0% 0.000 0.0% 0.40 2.9%
Paper Towels 0.000 0.0% 0.000 0.0% 1.050 100.0% 5.300 73.1% 6.35 45.5%
E‐waste/electronics 0.000 0.0% 0.000 0.0% 0.000 0.0% 0.000 0.0% 0.00 0.0%
Metal 0.000 0.0% 0.000 0.0% 0.000 0.0% 0.000 0.0% 0.00 0.0%
Wood 0.000 0.0% 0.000 0.0% 0.000 0.0% 0.000 0.0% 0.00 0.0%
LDPE Plastic Films 0.000 0.0% 0.000 0.0% 0.000 0.0% 0.000 0.0% 0.00 0.0%
Other / Non recyclable 2.80 60.2% 0.70 70.0% 0.00 0.0% 0.00 0.0% 3.50 25.1%
Total QAQC Check 4.65 100.0% 0.00 0.0% 1.00 100.0% 1.05 100.0% 7.25 100.0% 0.00 0.0% 0.00 0.0% 13.95 100.0%
General Comments and Observations:
13.95
33.3% 0.0% 7.2% 7.5% 52.0% 0.0% 0.0% 100.0%
4.65 1.00 1.05 7.25
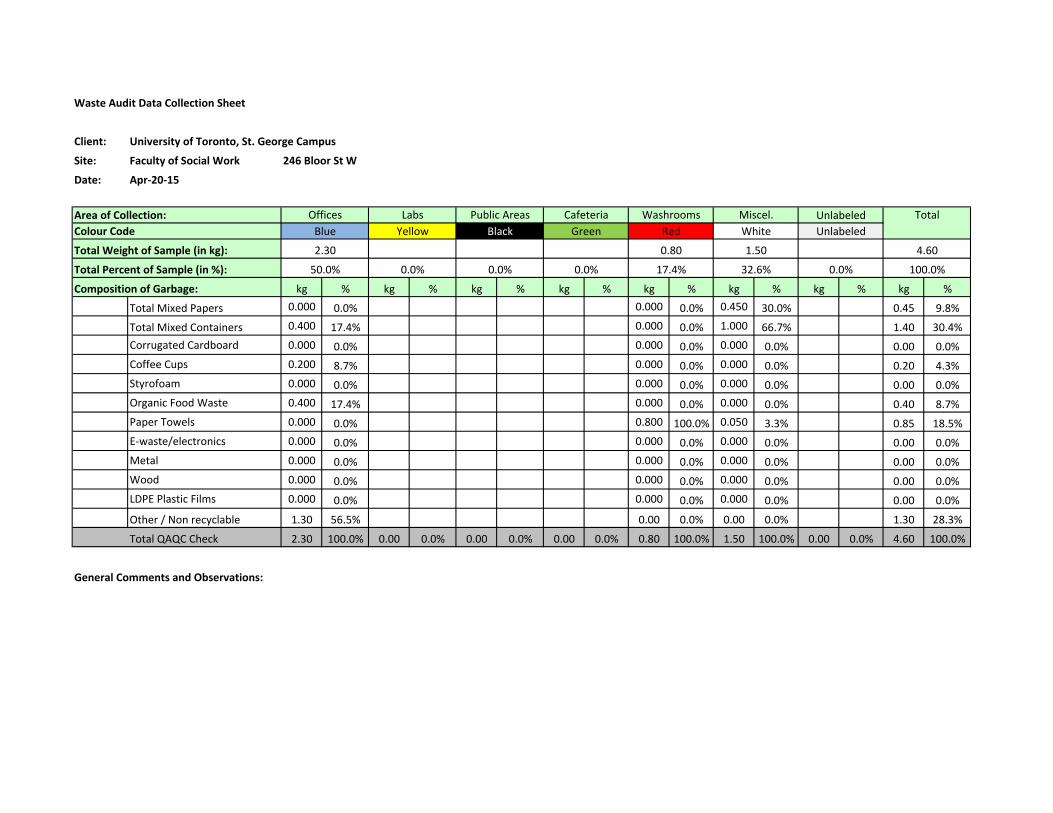
Waste Audit Data Collection Sheet
Client: University of Toronto, St. George Campus
Site: Faculty of Social Work 246 Bloor St W
Date: Apr‐20‐15
Area of Collection: Offices Labs Public Areas Cafeteria Washrooms Miscel. Unlabeled Total
Colour Code Blue Yellow Black Green Red White Unlabeled
Total Weight of Sample (in kg):
Total Percent of Sample (in %):
Composition of Garbage: kg % kg % kg % kg % kg % kg % kg % kg %
Total Mixed Papers 0.000 0.0% 0.000 0.0% 0.450 30.0% 0.45 9.8%
Total Mixed Containers 0.400 17.4% 0.000 0.0% 1.000 66.7% 1.40 30.4%
Corrugated Cardboard 0.000 0.0% 0.000 0.0% 0.000 0.0% 0.00 0.0%
Coffee Cups 0.200 8.7% 0.000 0.0% 0.000 0.0% 0.20 4.3%
Styrofoam 0.000 0.0% 0.000 0.0% 0.000 0.0% 0.00 0.0%
Organic Food Waste 0.400 17.4% 0.000 0.0% 0.000 0.0% 0.40 8.7%
Paper Towels 0.000 0.0% 0.800 100.0% 0.050 3.3% 0.85 18.5%
E‐waste/electronics 0.000 0.0% 0.000 0.0% 0.000 0.0% 0.00 0.0%
Metal 0.000 0.0% 0.000 0.0% 0.000 0.0% 0.00 0.0%
Wood 0.000 0.0% 0.000 0.0% 0.000 0.0% 0.00 0.0%
LDPE Plastic Films 0.000 0.0% 0.000 0.0% 0.000 0.0% 0.00 0.0%
Other / Non recyclable 1.30 56.5% 0.00 0.0% 0.00 0.0% 1.30 28.3%
Total QAQC Check 2.30 100.0% 0.00 0.0% 0.00 0.0% 0.00 0.0% 0.80 100.0% 1.50 100.0% 0.00 0.0% 4.60 100.0%
General Comments and Observations:
4.60
50.0% 0.0% 0.0% 0.0% 17.4% 32.6% 0.0% 100.0%
2.30 0.80 1.50

Waste Audit Data Collection Sheet
Client: University of Toronto, St. George Campus
Site: OISE 252 Bloor St W
Date: Apr‐20‐15
Area of Collection: Offices Labs Public Areas Cafeteria Washrooms Miscel. Unlabeled Total
Colour Code Blue Yellow Black Green Red White Unlabeled
Total Weight of Sample (in kg):
Total Percent of Sample (in %):
Composition of Garbage: kg % kg % kg % kg % kg % kg % kg % kg %
Total Mixed Papers 0.000 0.0% 0.850 4.9% 1.150 20.0% 0.100 1.3% 2.10 6.2%
Total Mixed Containers 0.200 6.5% 0.350 2.0% 1.050 18.3% 0.000 0.0% 1.60 4.7%
Corrugated Cardboard 0.000 0.0% 0.000 0.0% 0.000 0.0% 0.000 0.0% 0.00 0.0%
Coffee Cups 0.200 6.5% 0.500 2.9% 0.150 2.6% 0.000 0.0% 0.85 2.5%
Styrofoam 0.000 0.0% 0.000 0.0% 1.900 33.0% 0.000 0.0% 1.90 5.6%
Organic Food Waste 0.850 27.4% 0.350 2.0% 0.000 0.0% 0.000 0.0% 1.20 3.6%
Paper Towels 0.000 0.0% 0.000 0.0% 0.000 0.0% 5.850 78.0% 5.85 17.4%
E‐waste/electronics 0.000 0.0% 0.000 0.0% 0.000 0.0% 0.000 0.0% 0.00 0.0%
Metal 0.000 0.0% 0.000 0.0% 0.000 0.0% 0.000 0.0% 0.00 0.0%
Wood 0.000 0.0% 0.000 0.0% 0.000 0.0% 0.000 0.0% 0.00 0.0%
LDPE Plastic Films 0.000 0.0% 0.000 0.0% 0.000 0.0% 0.000 0.0% 0.00 0.0%
Other / Non recyclable 1.85 59.7% 15.30 88.2% 1.50 26.1% 1.55 20.7% 20.20 59.9%
Total QAQC Check 3.10 100.0% 0.00 0.0% 17.35 100.0% 5.75 100.0% 7.50 100.0% 0.00 0.0% 0.00 0.0% 33.70 100.0%
General Comments and Observations:
33.70
9.2% 0.0% 51.5% 17.1% 22.3% 0.0% 0.0% 100.0%
3.10 17.35 5.75 7.50

Waste Audit Data Collection Sheet
Client: University of Toronto, St. George Campus
Site: Rotman School of Managemen95 St. George
Date: Apr‐21‐15
Area of Collection: Offices Labs Public Areas Cafeteria Washrooms Miscel. Unlabeled Total
Colour Code Blue Yellow Black Green Red White Unlabeled
Total Weight of Sample (in kg):
Total Percent of Sample (in %):
Composition of Garbage: kg % kg % kg % kg % kg % kg % kg % kg %
Total Mixed Papers 3.700 31.1% 0.300 1.1% 0.000 0.0% 0.250 3.1% 4.25 7.7%
Total Mixed Containers 0.800 6.7% 1.000 3.6% 3.350 45.0% 0.000 0.0% 5.15 9.3%
Corrugated Cardboard 0.000 0.0% 0.000 0.0% 0.000 0.0% 0.000 0.0% 0.00 0.0%
Coffee Cups 0.700 5.9% 1.550 5.5% 0.300 4.0% 0.050 0.6% 2.60 4.7%
Styrofoam 0.000 0.0% 0.000 0.0% 0.000 0.0% 0.000 0.0% 0.00 0.0%
Organic Food Waste 0.800 6.7% 8.650 30.9% 3.600 48.3% 0.000 0.0% 13.05 23.6%
Paper Towels 0.000 0.0% 0.000 0.0% 0.000 0.0% 7.650 96.2% 7.65 13.8%
E‐waste/electronics 0.000 0.0% 0.000 0.0% 0.000 0.0% 0.000 0.0% 0.00 0.0%
Metal 0.000 0.0% 0.000 0.0% 0.000 0.0% 0.000 0.0% 0.00 0.0%
Wood 0.000 0.0% 0.000 0.0% 0.000 0.0% 0.000 0.0% 0.00 0.0%
LDPE Plastic Films 0.000 0.0% 0.000 0.0% 0.000 0.0% 0.000 0.0% 0.00 0.0%
Other / Non recyclable 5.90 49.6% 16.45 58.9% 0.20 2.7% 0.00 0.0% 22.55 40.8%
Total QAQC Check 11.90 100.0% 0.00 0.0% 27.95 100.0% 7.45 100.0% 7.95 100.0% 0.00 0.0% 0.00 0.0% 55.25 100.0%
General Comments and Observations:
55.25
21.5% 0.0% 50.6% 13.5% 14.4% 0.0% 0.0% 100.0%
11.90 27.95 7.45 7.95
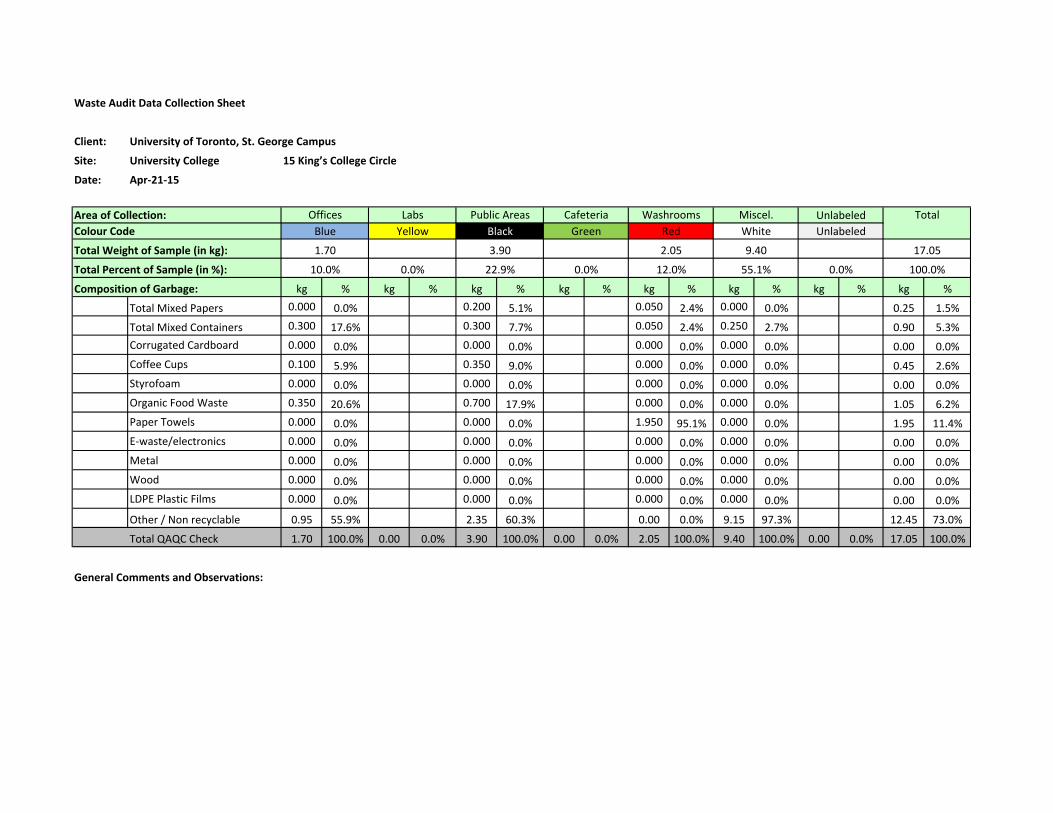
Waste Audit Data Collection Sheet
Client: University of Toronto, St. George Campus
Site: University College 15 King’s College Circle
Date: Apr‐21‐15
Area of Collection: Offices Labs Public Areas Cafeteria Washrooms Miscel. Unlabeled Total
Colour Code Blue Yellow Black Green Red White Unlabeled
Total Weight of Sample (in kg):
Total Percent of Sample (in %):
Composition of Garbage: kg % kg % kg % kg % kg % kg % kg % kg %
Total Mixed Papers 0.000 0.0% 0.200 5.1% 0.050 2.4% 0.000 0.0% 0.25 1.5%
Total Mixed Containers 0.300 17.6% 0.300 7.7% 0.050 2.4% 0.250 2.7% 0.90 5.3%
Corrugated Cardboard 0.000 0.0% 0.000 0.0% 0.000 0.0% 0.000 0.0% 0.00 0.0%
Coffee Cups 0.100 5.9% 0.350 9.0% 0.000 0.0% 0.000 0.0% 0.45 2.6%
Styrofoam 0.000 0.0% 0.000 0.0% 0.000 0.0% 0.000 0.0% 0.00 0.0%
Organic Food Waste 0.350 20.6% 0.700 17.9% 0.000 0.0% 0.000 0.0% 1.05 6.2%
Paper Towels 0.000 0.0% 0.000 0.0% 1.950 95.1% 0.000 0.0% 1.95 11.4%
E‐waste/electronics 0.000 0.0% 0.000 0.0% 0.000 0.0% 0.000 0.0% 0.00 0.0%
Metal 0.000 0.0% 0.000 0.0% 0.000 0.0% 0.000 0.0% 0.00 0.0%
Wood 0.000 0.0% 0.000 0.0% 0.000 0.0% 0.000 0.0% 0.00 0.0%
LDPE Plastic Films 0.000 0.0% 0.000 0.0% 0.000 0.0% 0.000 0.0% 0.00 0.0%
Other / Non recyclable 0.95 55.9% 2.35 60.3% 0.00 0.0% 9.15 97.3% 12.45 73.0%
Total QAQC Check 1.70 100.0% 0.00 0.0% 3.90 100.0% 0.00 0.0% 2.05 100.0% 9.40 100.0% 0.00 0.0% 17.05 100.0%
General Comments and Observations:
17.05
10.0% 0.0% 22.9% 0.0% 12.0% 55.1% 0.0% 100.0%
1.70 3.90 2.05 9.40

Waste Audit Data Collection Sheet
Client: University of Toronto, St. George Campus
Site: UTS 371 Bloor St. W
Date: Apr‐21‐15
Area of Collection: Offices Labs Public Areas Cafeteria Washrooms Miscel. Unlabeled Total
Colour Code Blue Yellow Black Green Red White Unlabeled
Total Weight of Sample (in kg):
Total Percent of Sample (in %):
Composition of Garbage: kg % kg % kg % kg % kg % kg % kg % kg %
Total Mixed Papers 0.050 1.2% 0.050 0.3% 0.000 0.0% 0.050 0.4% 0.15 0.4%
Total Mixed Containers 0.400 9.4% 1.500 9.8% 0.050 1.9% 0.000 0.0% 1.95 5.6%
Corrugated Cardboard 0.000 0.0% 0.000 0.0% 0.000 0.0% 0.000 0.0% 0.00 0.0%
Coffee Cups 0.550 12.9% 0.150 1.0% 0.000 0.0% 0.000 0.0% 0.70 2.0%
Styrofoam 0.000 0.0% 0.000 0.0% 0.000 0.0% 0.000 0.0% 0.00 0.0%
Organic Food Waste 0.900 21.2% 3.200 21.0% 1.300 48.1% 0.000 0.0% 5.40 15.6%
Paper Towels 0.000 0.0% 0.000 0.0% 0.000 0.0% 12.400 99.6% 12.40 35.8%
E‐waste/electronics 0.000 0.0% 0.000 0.0% 0.000 0.0% 0.000 0.0% 0.00 0.0%
Metal 0.000 0.0% 0.000 0.0% 0.000 0.0% 0.000 0.0% 0.00 0.0%
Wood 0.000 0.0% 0.000 0.0% 0.000 0.0% 0.000 0.0% 0.00 0.0%
LDPE Plastic Films 0.000 0.0% 0.000 0.0% 0.000 0.0% 0.000 0.0% 0.00 0.0%
Other / Non recyclable 2.35 55.3% 10.35 67.9% 1.35 50.0% 0.00 0.0% 14.05 40.5%
Total QAQC Check 4.25 100.0% 0.00 0.0% 15.25 100.0% 2.70 100.0% 12.45 100.0% 0.00 0.0% 0.00 0.0% 34.65 100.0%
General Comments and Observations:
34.65
12.3% 0.0% 44.0% 7.8% 35.9% 0.0% 0.0% 100.0%
4.25 15.25 2.70 12.45

Waste Audit Data Collection Sheet
Client: University of Toronto, St. George Campus
Site: Architecture Building 230 College St
Date: Apr‐22‐15
Area of Collection: Offices Labs Public Areas Cafeteria Washrooms Miscel. Unlabeled Total
Colour Code Blue Yellow Black Green Red White Unlabeled
Total Weight of Sample (in kg):
Total Percent of Sample (in %):
Composition of Garbage: kg % kg % kg % kg % kg % kg % kg % kg %
Total Mixed Papers 1.100 51.2% 8.550 39.1% 0.150 2.8% 0.000 0.0% 0.200 6.3% 10.00 29.3%
Total Mixed Containers 0.100 4.7% 3.300 15.1% 0.200 3.7% 0.000 0.0% 0.000 0.0% 3.60 10.6%
Corrugated Cardboard 0.000 0.0% 0.000 0.0% 0.250 4.6% 0.000 0.0% 0.000 0.0% 0.25 0.7%
Coffee Cups 0.100 4.7% 0.300 1.4% 0.850 15.7% 0.100 6.7% 0.000 0.0% 1.35 4.0%
Styrofoam 0.000 0.0% 0.000 0.0% 0.000 0.0% 0.000 0.0% 0.000 0.0% 0.00 0.0%
Organic Food Waste 0.000 0.0% 1.150 5.3% 1.000 18.5% 0.400 26.7% 0.000 0.0% 2.55 7.5%
Paper Towels 0.000 0.0% 0.000 0.0% 0.000 0.0% 0.000 0.0% 3.000 93.8% 3.00 8.8%
E‐waste/electronics 0.000 0.0% 0.000 0.0% 0.000 0.0% 0.000 0.0% 0.000 0.0% 0.00 0.0%
Metal 0.000 0.0% 0.000 0.0% 0.000 0.0% 0.000 0.0% 0.000 0.0% 0.00 0.0%
Wood 0.000 0.0% 0.000 0.0% 0.000 0.0% 0.000 0.0% 0.000 0.0% 0.00 0.0%
LDPE Plastic Films 0.000 0.0% 0.000 0.0% 0.000 0.0% 0.000 0.0% 0.000 0.0% 0.00 0.0%
Other / Non recyclable 0.85 39.5% 8.55 39.1% 2.95 54.6% 1.00 66.7% 0.00 0.0% 13.35 39.1%
Total QAQC Check 2.15 100.0% 21.85 100.0% 5.40 100.0% 1.50 100.0% 3.20 100.0% 0.00 0.0% 0.00 0.0% 34.10 100.0%
General Comments and Observations:
34.10
6.3% 64.1% 15.8% 4.4% 9.4% 0.0% 0.0% 100.0%
2.15 21.85 5.40 1.50 3.20
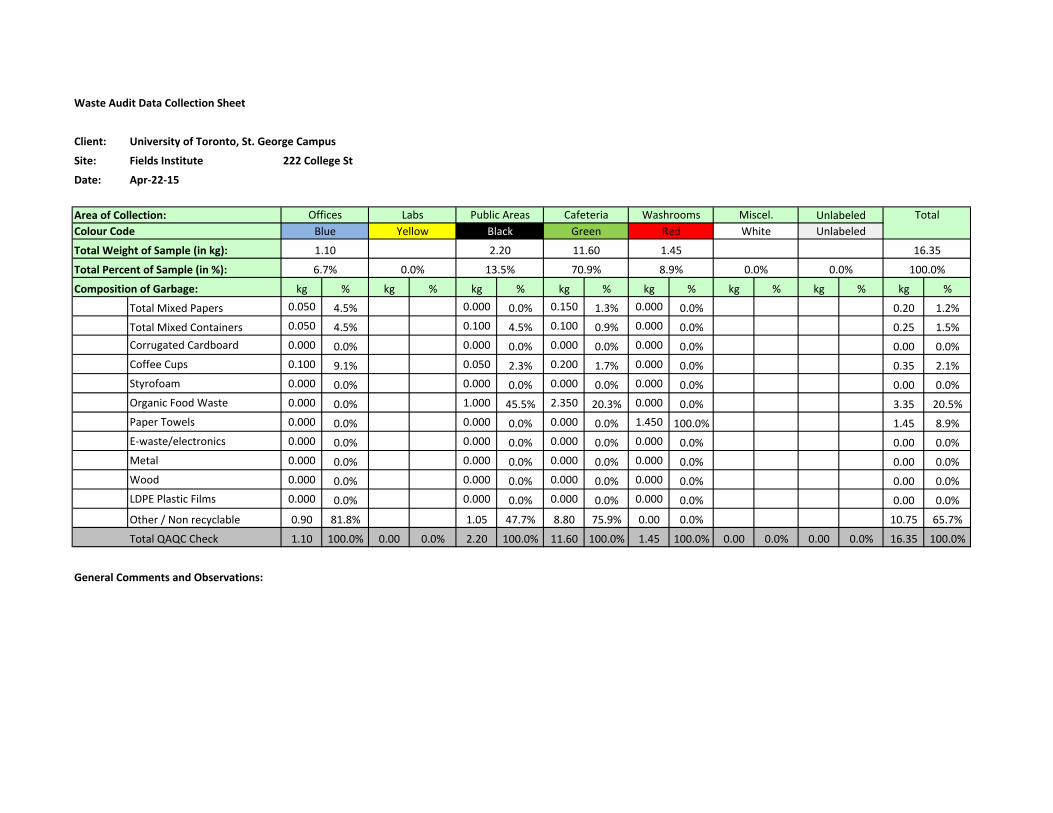
Waste Audit Data Collection Sheet
Client: University of Toronto, St. George Campus
Site: Fields Institute 222 College St
Date: Apr‐22‐15
Area of Collection: Offices Labs Public Areas Cafeteria Washrooms Miscel. Unlabeled Total
Colour Code Blue Yellow Black Green Red White Unlabeled
Total Weight of Sample (in kg):
Total Percent of Sample (in %):
Composition of Garbage: kg % kg % kg % kg % kg % kg % kg % kg %
Total Mixed Papers 0.050 4.5% 0.000 0.0% 0.150 1.3% 0.000 0.0% 0.20 1.2%
Total Mixed Containers 0.050 4.5% 0.100 4.5% 0.100 0.9% 0.000 0.0% 0.25 1.5%
Corrugated Cardboard 0.000 0.0% 0.000 0.0% 0.000 0.0% 0.000 0.0% 0.00 0.0%
Coffee Cups 0.100 9.1% 0.050 2.3% 0.200 1.7% 0.000 0.0% 0.35 2.1%
Styrofoam 0.000 0.0% 0.000 0.0% 0.000 0.0% 0.000 0.0% 0.00 0.0%
Organic Food Waste 0.000 0.0% 1.000 45.5% 2.350 20.3% 0.000 0.0% 3.35 20.5%
Paper Towels 0.000 0.0% 0.000 0.0% 0.000 0.0% 1.450 100.0% 1.45 8.9%
E‐waste/electronics 0.000 0.0% 0.000 0.0% 0.000 0.0% 0.000 0.0% 0.00 0.0%
Metal 0.000 0.0% 0.000 0.0% 0.000 0.0% 0.000 0.0% 0.00 0.0%
Wood 0.000 0.0% 0.000 0.0% 0.000 0.0% 0.000 0.0% 0.00 0.0%
LDPE Plastic Films 0.000 0.0% 0.000 0.0% 0.000 0.0% 0.000 0.0% 0.00 0.0%
Other / Non recyclable 0.90 81.8% 1.05 47.7% 8.80 75.9% 0.00 0.0% 10.75 65.7%
Total QAQC Check 1.10 100.0% 0.00 0.0% 2.20 100.0% 11.60 100.0% 1.45 100.0% 0.00 0.0% 0.00 0.0% 16.35 100.0%
General Comments and Observations:
16.35
6.7% 0.0% 13.5% 70.9% 8.9% 0.0% 0.0% 100.0%
1.10 2.20 11.60 1.45
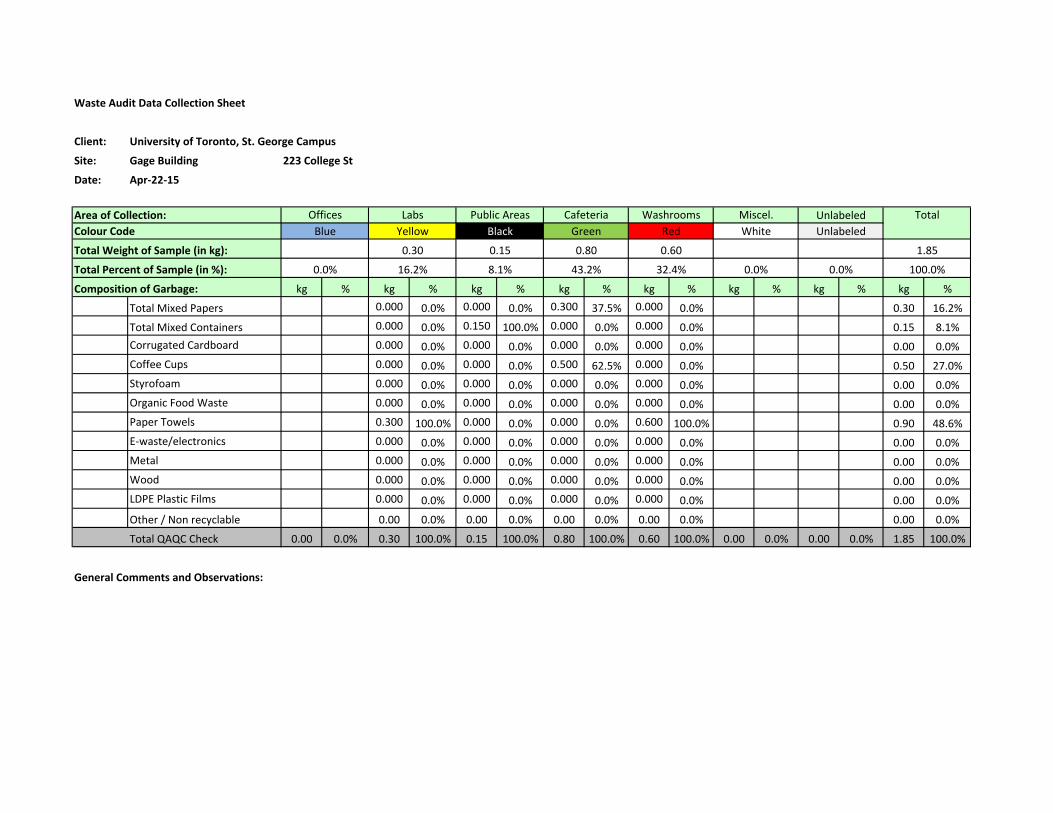
Waste Audit Data Collection Sheet
Client: University of Toronto, St. George Campus
Site: Gage Building 223 College St
Date: Apr‐22‐15
Area of Collection: Offices Labs Public Areas Cafeteria Washrooms Miscel. Unlabeled Total
Colour Code Blue Yellow Black Green Red White Unlabeled
Total Weight of Sample (in kg):
Total Percent of Sample (in %):
Composition of Garbage: kg % kg % kg % kg % kg % kg % kg % kg %
Total Mixed Papers 0.000 0.0% 0.000 0.0% 0.300 37.5% 0.000 0.0% 0.30 16.2%
Total Mixed Containers 0.000 0.0% 0.150 100.0% 0.000 0.0% 0.000 0.0% 0.15 8.1%
Corrugated Cardboard 0.000 0.0% 0.000 0.0% 0.000 0.0% 0.000 0.0% 0.00 0.0%
Coffee Cups 0.000 0.0% 0.000 0.0% 0.500 62.5% 0.000 0.0% 0.50 27.0%
Styrofoam 0.000 0.0% 0.000 0.0% 0.000 0.0% 0.000 0.0% 0.00 0.0%
Organic Food Waste 0.000 0.0% 0.000 0.0% 0.000 0.0% 0.000 0.0% 0.00 0.0%
Paper Towels 0.300 100.0% 0.000 0.0% 0.000 0.0% 0.600 100.0% 0.90 48.6%
E‐waste/electronics 0.000 0.0% 0.000 0.0% 0.000 0.0% 0.000 0.0% 0.00 0.0%
Metal 0.000 0.0% 0.000 0.0% 0.000 0.0% 0.000 0.0% 0.00 0.0%
Wood 0.000 0.0% 0.000 0.0% 0.000 0.0% 0.000 0.0% 0.00 0.0%
LDPE Plastic Films 0.000 0.0% 0.000 0.0% 0.000 0.0% 0.000 0.0% 0.00 0.0%
Other / Non recyclable 0.00 0.0% 0.00 0.0% 0.00 0.0% 0.00 0.0% 0.00 0.0%
Total QAQC Check 0.00 0.0% 0.30 100.0% 0.15 100.0% 0.80 100.0% 0.60 100.0% 0.00 0.0% 0.00 0.0% 1.85 100.0%
General Comments and Observations:
1.85
0.0% 16.2% 8.1% 43.2% 32.4% 0.0% 0.0% 100.0%
0.30 0.15 0.80 0.60

Waste Audit Data Collection Sheet
Client: University of Toronto, St. George Campus
Site: Koffler Student Centre 214 College St
Date: Apr‐22‐15
Area of Collection: Offices Labs Public Areas Cafeteria Washrooms Miscel. Unlabeled Total
Colour Code Blue Yellow Black Green Red White Unlabeled
Total Weight of Sample (in kg):
Total Percent of Sample (in %):
Composition of Garbage: kg % kg % kg % kg % kg % kg % kg % kg %
Total Mixed Papers 0.100 3.3% 0.050 1.2% 0.000 0.0% 0.15 1.7%
Total Mixed Containers 0.050 1.6% 0.050 1.2% 0.000 0.0% 0.10 1.1%
Corrugated Cardboard 0.000 0.0% 0.000 0.0% 0.150 10.7% 0.15 1.7%
Coffee Cups 0.050 1.6% 0.050 1.2% 0.000 0.0% 0.10 1.1%
Styrofoam 0.000 0.0% 0.000 0.0% 0.000 0.0% 0.00 0.0%
Organic Food Waste 0.000 0.0% 0.850 19.8% 0.000 0.0% 0.85 9.7%
Paper Towels 0.000 0.0% 0.000 0.0% 0.000 0.0% 0.00 0.0%
E‐waste/electronics 0.000 0.0% 0.000 0.0% 0.000 0.0% 0.00 0.0%
Metal 0.000 0.0% 0.000 0.0% 0.000 0.0% 0.00 0.0%
Wood 0.000 0.0% 0.000 0.0% 0.000 0.0% 0.00 0.0%
LDPE Plastic Films 0.000 0.0% 0.000 0.0% 0.000 0.0% 0.00 0.0%
Other / Non recyclable 2.85 93.4% 3.30 76.7% 1.25 89.3% 7.40 84.6%
Total QAQC Check 3.05 100.0% 0.00 0.0% 4.30 100.0% 0.00 0.0% 1.40 100.0% 0.00 0.0% 0.00 0.0% 8.75 100.0%
General Comments and Observations:
8.75
34.9% 0.0% 49.1% 0.0% 16.0% 0.0% 0.0% 100.0%
3.05 4.30 1.40
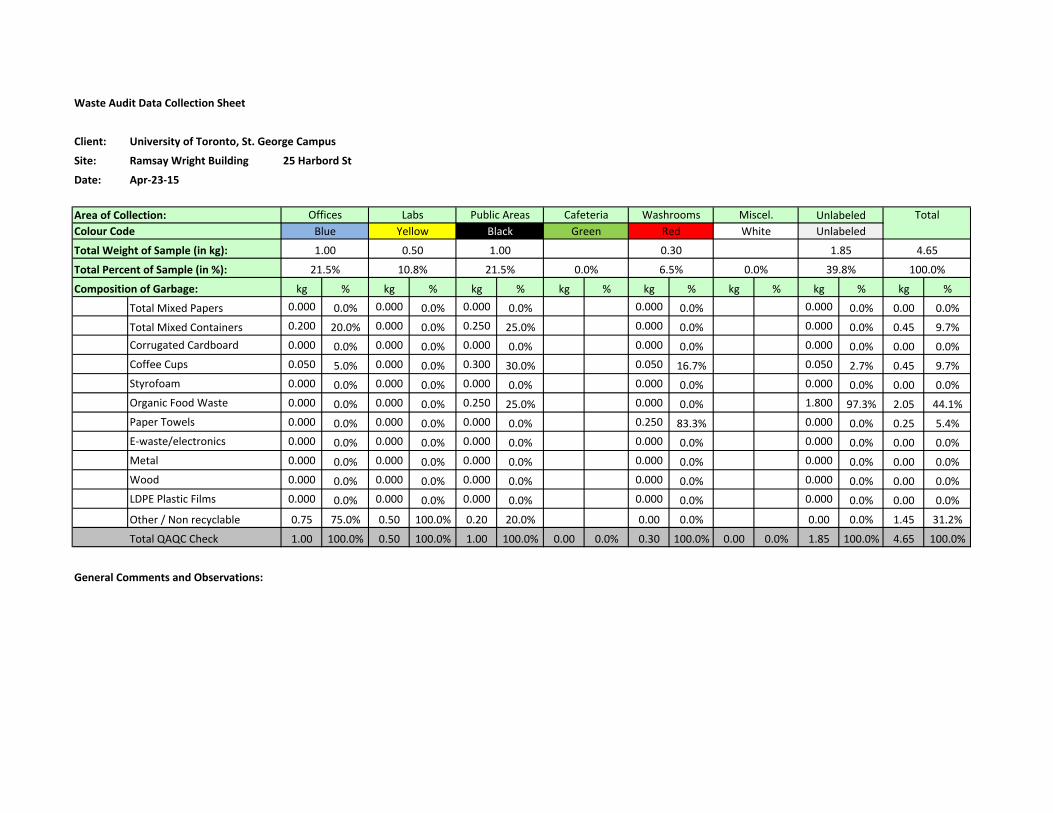
Waste Audit Data Collection Sheet
Client: University of Toronto, St. George Campus
Site: Ramsay Wright Building 25 Harbord St
Date: Apr‐23‐15
Area of Collection: Offices Labs Public Areas Cafeteria Washrooms Miscel. Unlabeled Total
Colour Code Blue Yellow Black Green Red White Unlabeled
Total Weight of Sample (in kg):
Total Percent of Sample (in %):
Composition of Garbage: kg % kg % kg % kg % kg % kg % kg % kg %
Total Mixed Papers 0.000 0.0% 0.000 0.0% 0.000 0.0% 0.000 0.0% 0.000 0.0% 0.00 0.0%
Total Mixed Containers 0.200 20.0% 0.000 0.0% 0.250 25.0% 0.000 0.0% 0.000 0.0% 0.45 9.7%
Corrugated Cardboard 0.000 0.0% 0.000 0.0% 0.000 0.0% 0.000 0.0% 0.000 0.0% 0.00 0.0%
Coffee Cups 0.050 5.0% 0.000 0.0% 0.300 30.0% 0.050 16.7% 0.050 2.7% 0.45 9.7%
Styrofoam 0.000 0.0% 0.000 0.0% 0.000 0.0% 0.000 0.0% 0.000 0.0% 0.00 0.0%
Organic Food Waste 0.000 0.0% 0.000 0.0% 0.250 25.0% 0.000 0.0% 1.800 97.3% 2.05 44.1%
Paper Towels 0.000 0.0% 0.000 0.0% 0.000 0.0% 0.250 83.3% 0.000 0.0% 0.25 5.4%
E‐waste/electronics 0.000 0.0% 0.000 0.0% 0.000 0.0% 0.000 0.0% 0.000 0.0% 0.00 0.0%
Metal 0.000 0.0% 0.000 0.0% 0.000 0.0% 0.000 0.0% 0.000 0.0% 0.00 0.0%
Wood 0.000 0.0% 0.000 0.0% 0.000 0.0% 0.000 0.0% 0.000 0.0% 0.00 0.0%
LDPE Plastic Films 0.000 0.0% 0.000 0.0% 0.000 0.0% 0.000 0.0% 0.000 0.0% 0.00 0.0%
Other / Non recyclable 0.75 75.0% 0.50 100.0% 0.20 20.0% 0.00 0.0% 0.00 0.0% 1.45 31.2%
Total QAQC Check 1.00 100.0% 0.50 100.0% 1.00 100.0% 0.00 0.0% 0.30 100.0% 0.00 0.0% 1.85 100.0% 4.65 100.0%
General Comments and Observations:
1.85 4.65
21.5% 10.8% 21.5% 0.0% 6.5% 0.0% 39.8% 100.0%
1.00 0.50 1.00 0.30

Waste Audit Data Collection Sheet
Client: University of Toronto, St. George Campus
Site: Sydney Smith Hall 100 St. George St
Date: Apr‐23‐15
Area of Collection: Offices Labs Public Areas Cafeteria Washrooms Miscel. Unlabeled Total
Colour Code Blue Yellow Black Green Red White Unlabeled
Total Weight of Sample (in kg):
Total Percent of Sample (in %):
Composition of Garbage: kg % kg % kg % kg % kg % kg % kg % kg %
Total Mixed Papers 0.250 8.3% 0.200 1.4% 0.000 0.0% 0.000 0.0% 0.45 1.6%
Total Mixed Containers 0.100 3.3% 1.650 11.5% 0.900 10.7% 0.000 0.0% 2.65 9.3%
Corrugated Cardboard 0.000 0.0% 0.000 0.0% 0.000 0.0% 0.000 0.0% 0.00 0.0%
Coffee Cups 0.300 10.0% 1.400 9.7% 0.200 2.4% 0.100 3.7% 2.00 7.0%
Styrofoam 0.000 0.0% 0.000 0.0% 0.150 1.8% 0.000 0.0% 0.15 0.5%
Organic Food Waste 0.600 20.0% 2.200 15.3% 2.800 33.3% 0.000 0.0% 5.60 19.6%
Paper Towels 0.000 0.0% 0.000 0.0% 0.000 0.0% 2.600 96.3% 2.60 9.1%
E‐waste/electronics 0.000 0.0% 0.000 0.0% 0.000 0.0% 0.000 0.0% 0.00 0.0%
Metal 0.150 5.0% 0.000 0.0% 0.000 0.0% 0.000 0.0% 0.15 0.5%
Wood 0.000 0.0% 0.000 0.0% 0.000 0.0% 0.000 0.0% 0.00 0.0%
LDPE Plastic Films 0.000 0.0% 0.000 0.0% 0.000 0.0% 0.000 0.0% 0.00 0.0%
Other / Non recyclable 1.60 53.3% 8.95 62.2% 4.35 51.8% 0.00 0.0% 14.90 52.3%
Total QAQC Check 3.00 100.0% 0.00 0.0% 14.40 100.0% 8.40 100.0% 2.70 100.0% 0.00 0.0% 0.00 0.0% 28.50 100.0%
General Comments and Observations:
28.50
10.5% 0.0% 50.5% 29.5% 9.5% 0.0% 0.0% 100.0%
3.00 14.40 8.40 2.70
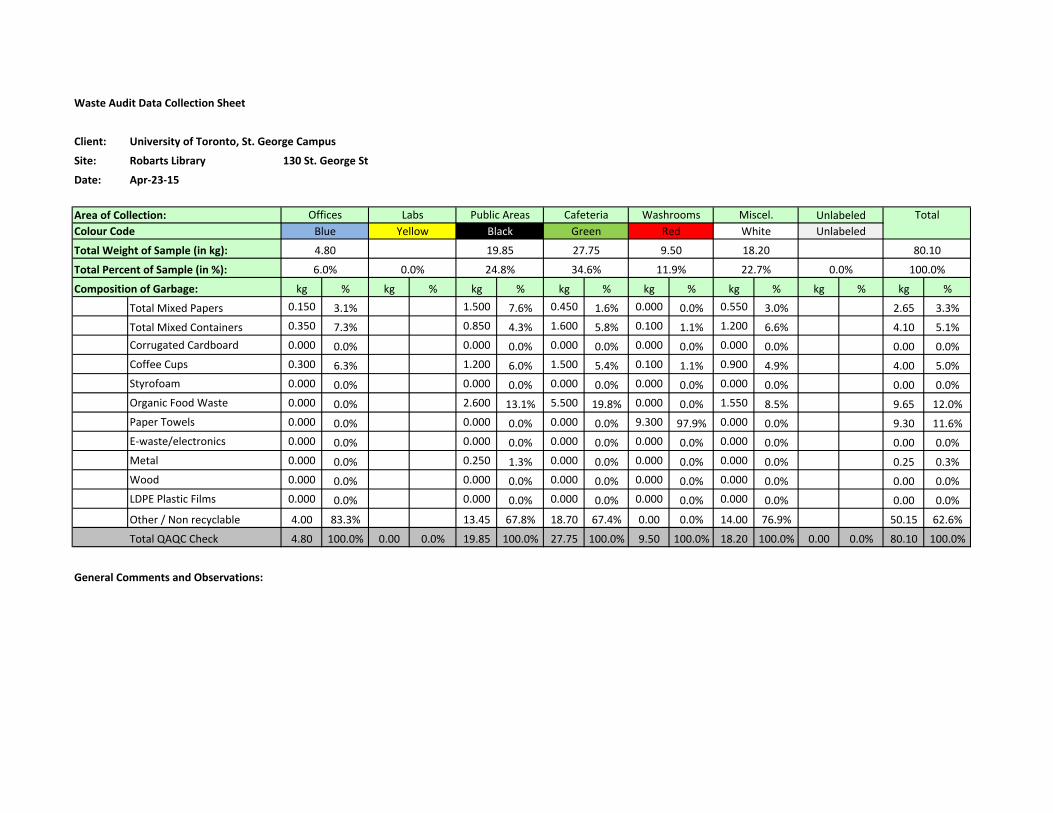
Waste Audit Data Collection Sheet
Client: University of Toronto, St. George Campus
Site: Robarts Library 130 St. George St
Date: Apr‐23‐15
Area of Collection: Offices Labs Public Areas Cafeteria Washrooms Miscel. Unlabeled Total
Colour Code Blue Yellow Black Green Red White Unlabeled
Total Weight of Sample (in kg):
Total Percent of Sample (in %):
Composition of Garbage: kg % kg % kg % kg % kg % kg % kg % kg %
Total Mixed Papers 0.150 3.1% 1.500 7.6% 0.450 1.6% 0.000 0.0% 0.550 3.0% 2.65 3.3%
Total Mixed Containers 0.350 7.3% 0.850 4.3% 1.600 5.8% 0.100 1.1% 1.200 6.6% 4.10 5.1%
Corrugated Cardboard 0.000 0.0% 0.000 0.0% 0.000 0.0% 0.000 0.0% 0.000 0.0% 0.00 0.0%
Coffee Cups 0.300 6.3% 1.200 6.0% 1.500 5.4% 0.100 1.1% 0.900 4.9% 4.00 5.0%
Styrofoam 0.000 0.0% 0.000 0.0% 0.000 0.0% 0.000 0.0% 0.000 0.0% 0.00 0.0%
Organic Food Waste 0.000 0.0% 2.600 13.1% 5.500 19.8% 0.000 0.0% 1.550 8.5% 9.65 12.0%
Paper Towels 0.000 0.0% 0.000 0.0% 0.000 0.0% 9.300 97.9% 0.000 0.0% 9.30 11.6%
E‐waste/electronics 0.000 0.0% 0.000 0.0% 0.000 0.0% 0.000 0.0% 0.000 0.0% 0.00 0.0%
Metal 0.000 0.0% 0.250 1.3% 0.000 0.0% 0.000 0.0% 0.000 0.0% 0.25 0.3%
Wood 0.000 0.0% 0.000 0.0% 0.000 0.0% 0.000 0.0% 0.000 0.0% 0.00 0.0%
LDPE Plastic Films 0.000 0.0% 0.000 0.0% 0.000 0.0% 0.000 0.0% 0.000 0.0% 0.00 0.0%
Other / Non recyclable 4.00 83.3% 13.45 67.8% 18.70 67.4% 0.00 0.0% 14.00 76.9% 50.15 62.6%
Total QAQC Check 4.80 100.0% 0.00 0.0% 19.85 100.0% 27.75 100.0% 9.50 100.0% 18.20 100.0% 0.00 0.0% 80.10 100.0%
General Comments and Observations:
80.10
6.0% 0.0% 24.8% 34.6% 11.9% 22.7% 0.0% 100.0%
4.80 19.85 27.75 9.50 18.20

Waste Audit Data Collection Sheet
Client: University of Toronto, St. George Campus
Site: Dental Building 124 Edward St
Date: Apr‐24‐15
Area of Collection: Offices Labs Public Areas Cafeteria Washrooms Miscel. Unlabeled Total
Colour Code Blue Yellow Black Green Red White Unlabeled
Total Weight of Sample (in kg):
Total Percent of Sample (in %):
Composition of Garbage: kg % kg % kg % kg % kg % kg % kg % kg %
Total Mixed Papers 0.500 1.1% 0.700 7.1% 0.200 1.9% 0.000 0.0% 1.40 2.0%
Total Mixed Containers 0.200 0.4% 0.400 4.0% 0.450 4.2% 0.050 1.1% 1.10 1.6%
Corrugated Cardboard 0.000 0.0% 0.000 0.0% 0.000 0.0% 0.000 0.0% 0.00 0.0%
Coffee Cups 0.050 0.1% 1.200 12.1% 0.200 1.9% 0.000 0.0% 1.45 2.0%
Styrofoam 0.000 0.0% 0.000 0.0% 0.000 0.0% 0.000 0.0% 0.00 0.0%
Organic Food Waste 0.000 0.0% 0.900 9.1% 0.400 3.8% 0.000 0.0% 1.30 1.8%
Paper Towels 0.000 0.0% 0.000 0.0% 0.000 0.0% 4.350 98.9% 4.35 6.1%
E‐waste/electronics 0.000 0.0% 0.000 0.0% 0.000 0.0% 0.000 0.0% 0.00 0.0%
Metal 0.000 0.0% 0.000 0.0% 0.000 0.0% 0.000 0.0% 0.00 0.0%
Wood 0.000 0.0% 0.000 0.0% 0.000 0.0% 0.000 0.0% 0.00 0.0%
LDPE Plastic Films 0.000 0.0% 0.000 0.0% 0.000 0.0% 0.000 0.0% 0.00 0.0%
Other / Non recyclable 45.30 98.4% 6.70 67.7% 9.35 88.2% 0.00 0.0% 61.35 86.5%
Total QAQC Check 0.00 0.0% 46.05 100.0% 9.90 100.0% 10.60 100.0% 4.40 100.0% 0.00 0.0% 0.00 0.0% 70.95 100.0%
General Comments and Observations:
70.95
0.0% 64.9% 14.0% 14.9% 6.2% 0.0% 0.0% 100.0%
46.05 9.90 10.60 4.40

Waste Audit Data Collection Sheet
Client: University of Toronto, St. George Campus
Site: Health Sciences Building 155 College St
Date: Apr‐24‐15
Area of Collection: Offices Labs Public Areas Cafeteria Washrooms Miscel. Unlabeled Total
Colour Code Blue Yellow Black Green Red White Unlabeled
Total Weight of Sample (in kg):
Total Percent of Sample (in %):
Composition of Garbage: kg % kg % kg % kg % kg % kg % kg % kg %
Total Mixed Papers 0.100 1.3% 0.050 5.0% 0.050 2.6% 0.000 0.0% 0.20 1.5%
Total Mixed Containers 0.250 3.1% 0.100 10.0% 0.050 2.6% 0.100 3.7% 0.50 3.7%
Corrugated Cardboard 0.000 0.0% 0.000 0.0% 0.000 0.0% 0.000 0.0% 0.00 0.0%
Coffee Cups 0.650 8.2% 0.010 1.0% 0.200 10.5% 0.000 0.0% 0.86 6.3%
Styrofoam 0.000 0.0% 0.000 0.0% 0.000 0.0% 0.000 0.0% 0.00 0.0%
Organic Food Waste 0.550 6.9% 0.000 0.0% 0.300 15.8% 2.700 100.0% 3.55 26.2%
Paper Towels 0.000 0.0% 0.000 0.0% 0.000 0.0% 0.000 0.0% 0.00 0.0%
E‐waste/electronics 0.000 0.0% 0.000 0.0% 0.000 0.0% 0.000 0.0% 0.00 0.0%
Metal 0.000 0.0% 0.000 0.0% 0.000 0.0% 0.000 0.0% 0.00 0.0%
Wood 0.000 0.0% 0.000 0.0% 0.000 0.0% 0.000 0.0% 0.00 0.0%
LDPE Plastic Films 0.000 0.0% 0.000 0.0% 0.000 0.0% 0.000 0.0% 0.00 0.0%
Other / Non recyclable 6.40 80.5% 0.84 84.0% 1.30 68.4% ‐0.10 ‐3.7% 8.44 62.3%
Total QAQC Check 7.95 100.0% 1.00 100.0% 1.90 100.0% 2.70 100.0% 0.00 0.0% 0.00 0.0% 0.00 0.0% 13.55 100.0%
General Comments and Observations:
13.55
58.7% 7.4% 14.0% 19.9% 0.0% 0.0% 0.0% 100.0%
7.95 1.00 1.90 2.70

Waste Audit Data Collection Sheet
Client: University of Toronto, St. George Campus
Site: Simcoe Hall 27 King’s College Circle
Date: Apr‐24‐15
Area of Collection: Offices Labs Public Areas Cafeteria Washrooms Miscel. Unlabeled Total
Colour Code Blue Yellow Black Green Red White Unlabeled
Total Weight of Sample (in kg):
Total Percent of Sample (in %):
Composition of Garbage: kg % kg % kg % kg % kg % kg % kg % kg %
Total Mixed Papers 0.000 0.0% 0.000 0.0% 0.000 0.0% 0.010 0.3% 0.01 0.1%
Total Mixed Containers 0.050 1.6% 0.050 0.9% 0.050 1.1% 0.000 0.0% 0.15 0.9%
Corrugated Cardboard 0.000 0.0% 0.000 0.0% 0.000 0.0% 0.000 0.0% 0.00 0.0%
Coffee Cups 0.150 4.9% 0.100 1.8% 0.100 2.1% 0.050 1.4% 0.40 2.4%
Styrofoam 0.000 0.0% 0.000 0.0% 0.000 0.0% 0.000 0.0% 0.00 0.0%
Organic Food Waste 0.000 0.0% 0.000 0.0% 2.500 52.6% 0.000 0.0% 2.50 14.8%
Paper Towels 0.000 0.0% 0.000 0.0% 0.000 0.0% 0.000 0.0% 0.00 0.0%
E‐waste/electronics 0.000 0.0% 0.000 0.0% 0.000 0.0% 0.000 0.0% 0.00 0.0%
Metal 0.000 0.0% 0.000 0.0% 0.000 0.0% 0.000 0.0% 0.00 0.0%
Wood 0.000 0.0% 0.000 0.0% 0.000 0.0% 0.000 0.0% 0.00 0.0%
LDPE Plastic Films 0.000 0.0% 0.000 0.0% 0.000 0.0% 0.000 0.0% 0.00 0.0%
Other / Non recyclable 2.85 93.4% 5.40 97.3% 2.10 44.2% 3.44 98.3% 13.79 81.8%
Total QAQC Check 3.05 100.0% 0.00 0.0% 5.55 100.0% 4.75 100.0% 3.50 100.0% 0.00 0.0% 0.00 0.0% 16.85 100.0%
General Comments and Observations:
16.85
18.1% 0.0% 32.9% 28.2% 20.8% 0.0% 0.0% 100.0%
3.05 5.55 4.75 3.50

Waste Audit Data Collection Sheet
Client: University of Toronto, St. George Campus
Site: Haultain Building 170 College (rear)
Date: Apr‐24‐15
Area of Collection: Offices Labs Public Areas Cafeteria Washrooms Miscel. Unlabeled Total
Colour Code Blue Yellow Black Green Red White Unlabeled
Total Weight of Sample (in kg):
Total Percent of Sample (in %):
Composition of Garbage: kg % kg % kg % kg % kg % kg % kg % kg %
Total Mixed Papers 0.000 0.0% 0.300 33.3% 0.000 0.0% 0.000 0.0% 0.30 5.0%
Total Mixed Containers 0.100 6.7% 0.000 0.0% 0.100 8.3% 0.100 4.2% 0.30 5.0%
Corrugated Cardboard 0.000 0.0% 0.000 0.0% 0.000 0.0% 0.000 0.0% 0.00 0.0%
Coffee Cups 0.300 20.0% 0.000 0.0% 0.200 16.7% 0.100 4.2% 0.60 10.0%
Styrofoam 0.400 26.7% 0.000 0.0% 0.000 0.0% 0.000 0.0% 0.40 6.7%
Organic Food Waste 0.200 13.3% 0.000 0.0% 0.000 0.0% 0.000 0.0% 0.20 3.3%
Paper Towels 0.000 0.0% 0.000 0.0% 0.000 0.0% 0.000 0.0% 0.00 0.0%
E‐waste/electronics 0.000 0.0% 0.000 0.0% 0.000 0.0% 0.000 0.0% 0.00 0.0%
Metal 0.000 0.0% 0.000 0.0% 0.000 0.0% 0.000 0.0% 0.00 0.0%
Wood 0.000 0.0% 0.000 0.0% 0.000 0.0% 0.000 0.0% 0.00 0.0%
LDPE Plastic Films 0.000 0.0% 0.000 0.0% 0.000 0.0% 0.000 0.0% 0.00 0.0%
Other / Non recyclable 0.50 33.3% 0.60 66.7% 0.90 75.0% 2.20 91.7% 4.20 70.0%
Total QAQC Check 1.50 100.0% 0.90 100.0% 1.20 100.0% 0.00 0.0% 2.40 100.0% 0.00 0.0% 0.00 0.0% 6.00 100.0%
General Comments and Observations:
6.00
25.0% 15.0% 20.0% 0.0% 40.0% 0.0% 0.0% 100.0%
1.50 0.90 1.20 2.40
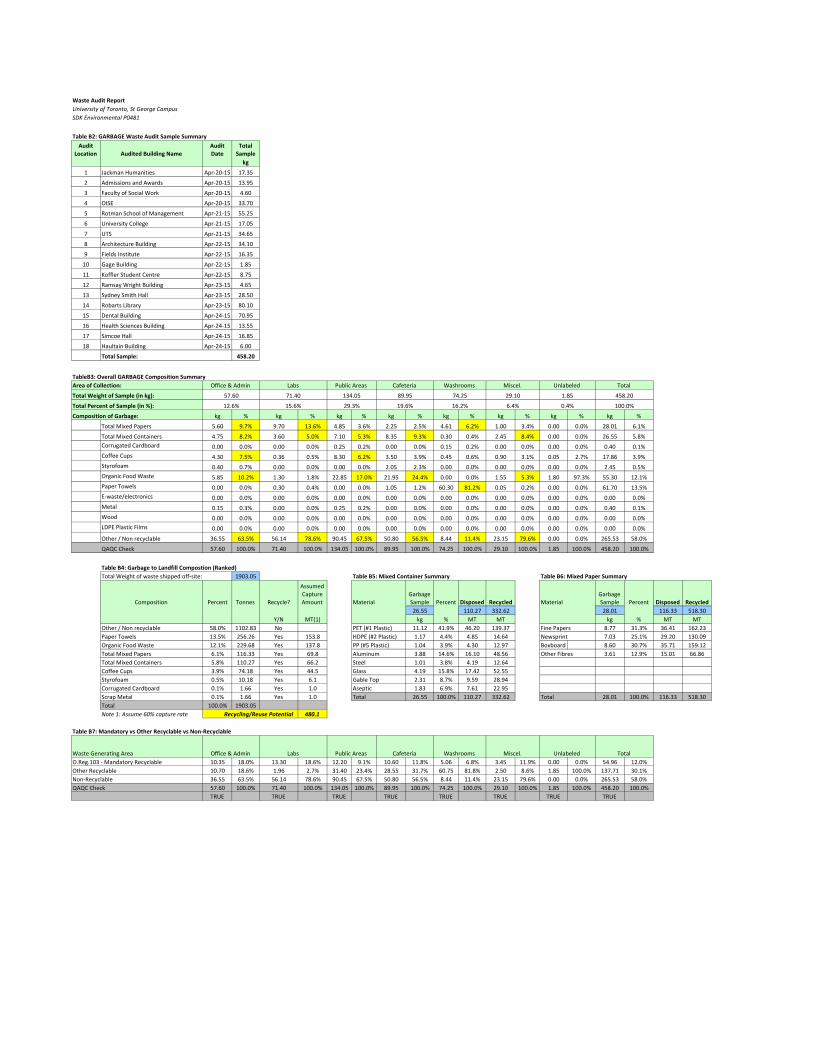
Waste Audit Report
University of Toronto, St George Campus
SDK Environmental P0481
Table B2: GARBAGE Waste Audit Sample Summary
Audit Location Audited Building Name
Audit Date
Total Sample
kg
1 Jackman Humanities Apr‐20‐15 17.35
2 Admissions and Awards Apr‐20‐15 13.95
3 Faculty of Social Work Apr‐20‐15 4.60
4 OISE Apr‐20‐15 33.70
5 Rotman School of Management Apr‐21‐15 55.25
6 University College Apr‐21‐15 17.05
7 UTS Apr‐21‐15 34.65
8 Architecture Building Apr‐22‐15 34.10
9 Fields Institute Apr‐22‐15 16.35
10 Gage Building Apr‐22‐15 1.85
11 Koffler Student Centre Apr‐22‐15 8.75
12 Ramsay Wright Building Apr‐23‐15 4.65
13 Sydney Smith Hall Apr‐23‐15 28.50
14 Robarts Library Apr‐23‐15 80.10
15 Dental Building Apr‐24‐15 70.95
16 Health Sciences Building Apr‐24‐15 13.55
17 Simcoe Hall Apr‐24‐15 16.85
18 Haultain Building Apr‐24‐15 6.00
Total Sample: 458.20
TableB3: Overall GARBAGE Composition Summary
Area of Collection: Office & Admin Labs Public Areas Cafeteria Washrooms Miscel. Unlabeled Total
Total Weight of Sample (in kg):
Total Percent of Sample (in %):
Composition of Garbage: kg % kg % kg % kg % kg % kg % kg % kg %
Total Mixed Papers 5.60 9.7% 9.70 13.6% 4.85 3.6% 2.25 2.5% 4.61 6.2% 1.00 3.4% 0.00 0.0% 28.01 6.1%
Total Mixed Containers 4.75 8.2% 3.60 5.0% 7.10 5.3% 8.35 9.3% 0.30 0.4% 2.45 8.4% 0.00 0.0% 26.55 5.8%
Corrugated Cardboard 0.00 0.0% 0.00 0.0% 0.25 0.2% 0.00 0.0% 0.15 0.2% 0.00 0.0% 0.00 0.0% 0.40 0.1%
Coffee Cups 4.30 7.5% 0.36 0.5% 8.30 6.2% 3.50 3.9% 0.45 0.6% 0.90 3.1% 0.05 2.7% 17.86 3.9%
Styrofoam 0.40 0.7% 0.00 0.0% 0.00 0.0% 2.05 2.3% 0.00 0.0% 0.00 0.0% 0.00 0.0% 2.45 0.5%
Organic Food Waste 5.85 10.2% 1.30 1.8% 22.85 17.0% 21.95 24.4% 0.00 0.0% 1.55 5.3% 1.80 97.3% 55.30 12.1%
Paper Towels 0.00 0.0% 0.30 0.4% 0.00 0.0% 1.05 1.2% 60.30 81.2% 0.05 0.2% 0.00 0.0% 61.70 13.5%
E‐waste/electronics 0.00 0.0% 0.00 0.0% 0.00 0.0% 0.00 0.0% 0.00 0.0% 0.00 0.0% 0.00 0.0% 0.00 0.0%
Metal 0.15 0.3% 0.00 0.0% 0.25 0.2% 0.00 0.0% 0.00 0.0% 0.00 0.0% 0.00 0.0% 0.40 0.1%
Wood 0.00 0.0% 0.00 0.0% 0.00 0.0% 0.00 0.0% 0.00 0.0% 0.00 0.0% 0.00 0.0% 0.00 0.0%
LDPE Plastic Films 0.00 0.0% 0.00 0.0% 0.00 0.0% 0.00 0.0% 0.00 0.0% 0.00 0.0% 0.00 0.0% 0.00 0.0%
Other / Non recyclable 36.55 63.5% 56.14 78.6% 90.45 67.5% 50.80 56.5% 8.44 11.4% 23.15 79.6% 0.00 0.0% 265.53 58.0%
QAQC Check 57.60 100.0% 71.40 100.0% 134.05 100.0% 89.95 100.0% 74.25 100.0% 29.10 100.0% 1.85 100.0% 458.20 100.0%
Table B4: Garbage to Landfill Compostion (Ranked)
Total Weight of waste shipped off‐site: 1903.05 Table B5: Mixed Container Summary Table B6: Mixed Paper Summary
Composition Percent Tonnes Recycle?
Assumed Capture Amount Material
Garbage Sample Percent Disposed Recycled Material
Garbage Sample Percent Disposed Recycled
26.55 110.27 332.62 28.01 116.33 518.30
Y/N MT(1) kg % MT MT kg % MT MT
Other / Non recyclable 58.0% 1102.83 No PET (#1 Plastic) 11.12 41.9% 46.20 139.37 Fine Papers 8.77 31.3% 36.41 162.23
Paper Towels 13.5% 256.26 Yes 153.8 HDPE (#2 Plastic) 1.17 4.4% 4.85 14.64 Newsprint 7.03 25.1% 29.20 130.09
Organic Food Waste 12.1% 229.68 Yes 137.8 PP (#5 Plastic) 1.04 3.9% 4.30 12.97 Boxboard 8.60 30.7% 35.71 159.12
Total Mixed Papers 6.1% 116.33 Yes 69.8 Aluminum 3.88 14.6% 16.10 48.56 Other Fibres 3.61 12.9% 15.01 66.86
Total Mixed Containers 5.8% 110.27 Yes 66.2 Steel 1.01 3.8% 4.19 12.64
Coffee Cups 3.9% 74.18 Yes 44.5 Glass 4.19 15.8% 17.42 52.55
Styrofoam 0.5% 10.18 Yes 6.1 Gable Top 2.31 8.7% 9.59 28.94
Corrugated Cardboard 0.1% 1.66 Yes 1.0 Aseptic 1.83 6.9% 7.61 22.95
Scrap Metal 0.1% 1.66 Yes 1.0 Total 26.55 100.0% 110.27 332.62 Total 28.01 100.0% 116.33 518.30
Total 100.0% 1903.05
Note 1: Assume 60% capture rate Recycling/Reuse Potential 480.1
Table B7: Mandatory vs Other Recyclable vs Non‐Recyclable
Waste Generating Area Office & Admin Labs Public Areas Cafeteria Washrooms Miscel. Unlabeled Total
O.Reg.103 ‐ Mandatory Recyclable 10.35 18.0% 13.30 18.6% 12.20 9.1% 10.60 11.8% 5.06 6.8% 3.45 11.9% 0.00 0.0% 54.96 12.0%
Other Recyclable 10.70 18.6% 1.96 2.7% 31.40 23.4% 28.55 31.7% 60.75 81.8% 2.50 8.6% 1.85 100.0% 137.71 30.1%
Non‐Recyclable 36.55 63.5% 56.14 78.6% 90.45 67.5% 50.80 56.5% 8.44 11.4% 23.15 79.6% 0.00 0.0% 265.53 58.0%
QAQC Check 57.60 100.0% 71.40 100.0% 134.05 100.0% 89.95 100.0% 74.25 100.0% 29.10 100.0% 1.85 100.0% 458.20 100.0%
TRUE TRUE TRUE TRUE TRUE TRUE TRUE TRUE
6.4% 0.4% 100.0%12.6% 15.6% 29.3% 19.6% 16.2%
458.2029.10 1.8557.60 71.40 134.05 89.95 74.25

Waste Audit ReportUniversity of Toronto, St George Campus
SDK Project P0481
Table B15: Annual Waste Management & Recycling Quantities
Waste MaterialRecycled/ Reused, Disposed
kg MT %2013-2014 Total
Waste/Garbage Disposed 1903.05 100.0%Sub-Total 1903.05
Mixed Papers Recycled 518.30 11.4%Paper Towls Recycled 18.50 0.4%Cardboard Recycled 345.30Confidential Papers Recycled 130.60 2.9%Scrap Wood Recycled 177.72 3.9%Scrap Metals Recycled 55.04 1.2%Asphalt Recycled 260 00Asphalt Recycled 260.00Stone, Pavers & Screening Recycled 50.00 1.1%Soil from Construction Projects Recycled 215.00 4.7%Concrete from Construction Recycled 292.00 6.4%Clean Fill Recycled 118.00 2.6%Batteries Recycled 2.00 0.0%Fluorescent Bulbs Recycled 10.50Polystyrene Recycled 4.08Aero. Misc. Pick Ups Recycled 5.4089 Chestnut Mixed Containers Recycled 190.80M. Hall Mixed Containers Recycled 23.52 0.5%Mixed Containers Recycled 118.30 2.6%Coffee Cups Recycled 11.04Amber Bottles Recycled 6.00Electronic Wastes Recycled 47.35Mixed Plastics Recycled 4.88Misc: tires, matresses, rocks etc. Recycled 1.88Lab Glass & Plastic Recycled 23.62Recycling from Compactor Loads Recycled 246.22 5.4%Yard Wastes Composted 49.87 1.1%Yard Wastes Composted 49.87 1.1%Animal Bedding Composted 111.49Soil & Plant P/U Composted 120.00Plant & Tree Use, Composting Composted 20.00Grass & Wood Mulch Composted 88.00Catch Basin Material Composted 88.00 1.9%Organics Composted 285.1289 Chestnut Organics Composted 585.00Swap Shop - Out, Including Pad Reused 19.29 0.4%In-Swap Reused 12.00 0.3%Campus Furniture Projects Reused 164 74 3 6%Campus Furniture Projects Reused 164.74 3.6%Wood Pallets Reused 12.00 0.3%Reduction via Various Programs Reduced 123.90 2.72%
Sub-Total 4555.43
Total Generated 6458.48 100.0%Total Recycled 2876.03 44.5%Total Reused 208.03 3.2%Total Reduced 123.90 1.92%T t l C t d 1347 47 20 9%Total Composted 1347.47 20.9%Total Disposed 1903.05 29.5%
Achieved Waste Diversion Rate 70.5%Additioanl Recyclable Materials in Wastes Disposed to Landfill (MT) 480.13Potential Waste Diversion Rate 82.2%Notes:Detailed records of annual weights provided by UofT. Most recent complete data available.
Appendix C
Waste Audit Summary

Ministry of the Environment Waste Form
Report of a Waste Audit
Industrial, Commercial and Institutional Establishments
As required by O. Reg. 102/94
• This report must be prepared 6 months after becoming subject to O. Reg. 102/94 and a copy retained on file for at least five years after it is prepared, and be made available to the ministry upon request.
• For large construction and demolition projects, please refer to the forms included with “A Guide to Waste Audits and Waste Reduction Work Plans for Construction and Demolition Projects as Required Under Ontario Regulation 102/94” (revised July 2008)
I. GENERAL INFORMATION
Name of Owner and/or Operator of Entity(ies) and Company Name: University of Toronto, St. George Campus Name of Contact Person: Reno Strano
Telephone #: 416‐946‐5711
Email address: [email protected]
Street Address(es) of Entity(ies): 255 McCaul Street, 4th Level Municipality: Toronto, Ontario, M5T 1W7
Type of Entity (check one)
Retail Shopping Establishments Hotels and Motels Retail Shopping Complexes Hospitals Office Buildings Educational Institutions X
Restaurants Large Manufacturing Establishments Note: O. Reg. 102/94 does not apply to multi-unit residential buildings.
II. DESCRIPTION OF ENTITY
Provide a brief overview of the entity(ties): The University of Toronto is a large multi‐building, multi‐facility community that has approximately 60 thousand students, staff and faculty occupying several major city blocks with over 140 buildings that generate waste and recycling materials. U of T is required to conduct an annual waste audit since it satisfies Part X of Ontario Regulation (“O. Reg.”) 102/94 – Waste Audits and Waste Reduction Work Plans (“O. Reg.102/94”) which requires educational institutions to conduct waste audits and prepare waste reduction plans on an annual basis if the location or campus has more than 350 full or part‐time persons enrolled during the calendar year.
…/1

III. HOW WASTE IS PRODUCED AND DECISIONS AFFECTING THE PRODUCTION OF WASTE
For each category of waste that is produced at the entity(ies), explain how the waste will be produced and how management decisions and policies will affect the production of waste.
Categories of Waste How Is the Waste Produced and What Management Decisions/Policies
Affect Its Production?
Organics & Food Waste Generated in cafeterias/food service and residence locations on campus, or brought in by staff/students. U of T’s Environmental Protection Policy* governs the generation and handling of all solid waste.
Yard Waste Generated by grounds maintenance operations. U of T’s Environmental Protection Policy* governs the generation and handling of all solid waste.
Scrap Wood Generated through woodworking operations. U of T’s Environmental Protection Policy* governs the generation and handling of all solid waste.
Scrap Metal Generated through construction projects/maintenance. U of T’s Environmental Protection Policy* governs the generation and handling of all solid waste.
Animal Bedding Generated through animal research facilities. U of T’s Environmental Protection Policy* governs the generation and handling of all solid waste.
Polystyrene Generated in cafeterias/food service locations on campus, or brought in by staff/students. Also found in foam packaging. U of T’s Environmental Protection Policy* governs the generation and handling of all solid waste.
Mixed Containers Generated in cafeterias/food service locations on campus, or brought in by staff/students. U of T’s Environmental Protection Policy* governs the generation and handling of all solid waste.
Laboratory Glass and Plastic Generated in laboratory settings. U of T’s Environmental Protection Policy* governs the generation and handling of all solid waste.
Amber Bottles Generated in laboratory settings. U of T’s Environmental Protection Policy* governs the generation and handling of all solid waste.
Mixed Plastics Generated in cafeterias/food service locations on campus, or brought in by staff/students. U of T’s Environmental Protection Policy* governs the generation and handling of all solid waste.
Coffee Cups Generated in cafeterias/food service locations on campus, or brought in by staff/students. U of T’s Environmental Protection Policy* governs the generation and handling of all solid waste.
Soil & Plants Generated by grounds maintenance operations. U of T’s Environmental Protection Policy* governs the generation and handling of all solid waste.
Light Bulbs Generated in all indoor and lighted outdoor areas. U of T’s Environmental Protection Policy* governs the generation and handling of all solid waste.
E‐waste Generated in classroom, residence, and office areas. U of T’s Environmental Protection Policy* governs the generation and handling of all solid waste.
Printer Cartridges Generated in residence and office areas. U of T’s Environmental Protection Policy* governs the generation and handling of all solid waste.
Mixed Papers Generated in classroom, residence, and office areas. U of T’s Environmental Protection Policy* governs the generation and handling of all solid waste.
Paper Towels Generated in washrooms. U of T’s Environmental Protection Policy* governs the generation and handling of all solid waste.
Cardboard Generated in residence and office areas, and through deliveries. U of T’s Environmental Protection Policy* governs the generation and handling of all solid waste.
Shredded Paper Generated in office areas. U of T’s Environmental Protection Policy* governs the generation and handling of all solid waste.

Pallets Generated through deliveries. U of T’s Environmental Protection Policy* governs the generation and handling of all solid waste.
Asphalt Generated through construction projects. U of T’s Environmental Protection Policy* governs the generation and handling of all solid waste.
Stone, pavers & screening Generated through construction projects. U of T’s Environmental Protection Policy* governs the generation and handling of all solid waste.
Concrete Generated through construction projects. U of T’s Environmental Protection Policy* governs the generation and handling of all solid waste.
Clean fill Generated through construction or grounds/maintenance projects. U of T’s Environmental Protection Policy* governs the generation and handling of all solid waste.
Catch basin material
Generated through water collection (storm drain/sewer). Debris is caught in the catch basin to prevent it from entering the sewer/water system. U of T’s Environmental Protection Policy* governs the generation and handling of all solid waste.
Swap Shop ‐ Out “Swap Shop” is a place for staff/students to drop off/take reusable items. Generated throughout campus. U of T’s Environmental Protection Policy* governs the generation and handling of all solid waste.
Swap Shop – In “Swap Shop” is a place for staff/students to drop off/take reusable items. Generated throughout campus. U of T’s Environmental Protection Policy* governs the generation and handling of all solid waste.
Campus Furniture Generated in common areas/residences/offices. U of T’s Environmental Protection Policy* governs the generation and handling of all solid waste.
Batteries Generated in classrooms, offices, and residence areas. U of T’s Environmental Protection Policy* governs the generation and handling of all solid waste.
Aero. Misc. pick ups Generated at the Aerospace Library. U of T’s Environmental Protection Policy* governs the generation and handling of all solid waste.
Waste Generated in cafeterias/food service areas, offices, residences, common areas, etc. U of T’s Environmental Protection Policy* governs the generation and handling of all solid waste.
Note: When completing this form, write “n/a” in the columns where the entity will not produce any waste for a category of waste.
…/2

IV. MANAGEMENT OF WASTE
For each category of waste listed below, indicate which waste items will be disposed or reused/recycled and how each item will be managed at the entity(ies).
Category Waste to be Disposed Reused or Recycled Waste
Organics & Food Waste
May be placed into a trash bin and go to landfill.
Composting program currently in place.
Yard Waste
May be placed into a trash bin and go to landfill.
Recycling program currently in place.
Scrap Wood
May be placed into a trash bin and go to landfill.
Recycling program currently in place.
Scrap Metal
May be placed into a trash bin and go to landfill.
Recycling program currently in place.
Animal Bedding
May be placed into a trash bin and go to landfill.
Recycling program currently in place.
Polystyrene
May be placed into a trash bin and go to landfill.
Recycling program currently in place.
Mixed Containers
May be placed into a trash bin and go to landfill.
Recycling program currently in place.
Laboratory Glass and Plastic
May be placed into a trash bin and go to landfill.
Recycling program currently in place.
Amber Bottles
May be placed into a trash bin and go to landfill.
Recycling program currently in place.
Mixed Plastics May be placed into a trash bin and go to landfill.
Organics compost program currently in place.
Coffee Cups
May be placed into a trash bin and go to landfill.
Recycling program currently in place.
Soil & Plants
May be placed into a trash bin and go to landfill.
Recycling program currently in place.
Light Bulbs
May be placed into a trash bin and go to landfill.
Recycling program currently in place.
E‐waste
May be placed into a trash bin and go to landfill.
Recycling program currently in place.
Printer Cartridges
May be placed into a trash bin and go to landfill.
Taken away by contractors.
Mixed Papers
May be placed into a trash bin and go to landfill.
Reused where possible or recycled
Paper Towels
May be placed into a trash bin and go to landfill.
Recycling program currently in place.
Cardboard
May be placed into a trash bin and go to landfill.
Recycling program currently in place.
Shredded Paper
May be placed into a trash bin and go to landfill.
Recycling program currently in place.
Pallets
May be placed into a trash bin and go to landfill.
Reuse program currently in place.

Asphalt
May be placed into a trash bin and go to landfill.
Recycling program currently in place.
Stone, pavers & screening
May be placed into a trash bin and go to landfill.
Recycling program currently in place.
Concrete
May be placed into a trash bin and go to landfill.
Recycling program currently in place.
Clean fill
May be placed into a trash bin and go to landfill.
Recycling program currently in place.
Catch basin material Catch basin material is well‐controlled, as only the vendor can remove it from the basins.
Catch basin material is considered reused. It is collected, dried out, and used as landfill cover. This prevents fresh soil from being dug to use as landfill cover.
Swap Shop ‐ Out
May be placed into a trash bin and go to landfill.
Recycling program currently in place.
Swap Shop – In
May be placed into a trash bin and go to landfill.
Recycling program currently in place.
Campus Furniture
May be placed into a trash bin and go to landfill.
Recycling program currently in place.
Batteries
May be placed into a trash bin and go to landfill.
Recycling program currently in place.
Aero. Misc. pick ups
May be placed into a trash bin and go to landfill.
Recycling program currently in place.
Waste All non‐recyclable waste placed into trash bins will go to landfill.
Non‐recyclable waste will not be recycled. If non‐recyclable waste is placed into recycling bins, it will contaminate the load and must be removed at processing facility.
Note: When completing this form, write “n/a” in the columns where the entity will not produce any waste for a category of waste.
…/3

V. ESTIMATED QUANTITY OF WASTE PRODUCED
Categories of Waste
"A" Base Year
"B" Current Year
"C" * Change (A - B)
"A" Base Year
"B" Current Year
"C" * Change (A - B)
"A" Base Year
"B" Current Year
"C" * Change (A - B)
"A" Base Year
"B" Current Year
"C" * Change (A - B)
Tonnes Tonnes Tonnes Tonnes Tonnes Tonnes Tonnes Tonnes Tonnes Tonnes Tonnes TonnesPET (#1 Plastic) 37.91 185.57 -147.66 0.00 0.00 0.00 18.82 139.37 -120.55 19.09 46.20 -27.11HDPE (#2 Plastic) 3.98 19.49 -15.51 0.00 0.00 0.00 1.98 14.64 -12.66 2.00 4.85 -2.85PP (#5 Plastic) 3.53 17.27 -13.74 0.00 0.00 0.00 1.75 12.97 -11.22 1.78 4.30 -2.52
Estimated Amount of WasteGenerated Reduced/Reused Recycled Disposed
( )Aluminum 13.21 64.66 -51.45 0.00 0.00 0.00 6.56 48.56 -42.00 6.65 16.10 -9.45Steel 3.44 16.83 -13.39 0.00 0.00 0.00 1.71 12.64 -10.93 1.73 4.19 -2.46Glass 14.30 69.98 -55.68 0.00 0.00 0.00 7.10 52.55 -45.46 7.20 17.42 -10.22Gable Top 7.87 38.53 -30.66 0.00 0.00 0.00 3.91 28.94 -25.03 3.96 9.59 -5.63Aseptic 6.24 30.56 -24.32 0.00 0.00 0.00 3.10 22.95 -19.85 3.14 7.61 -4.47Amber Bottles 0.00 6.00 -6.00 0.00 0.00 0.00 0.00 6.00 -6.00 0.00 0.00 0.00Lab Glass & Plastic 0.00 23.62 -23.62 0.00 0.00 0.00 0.00 23.62 -23.62 0.00 0.00 0.00Fine Papers 272.08 198.64 73.44 0.00 0.00 0.00 242.66 162.23 80.43 29.42 36.41 -6.99Newsprint 218.19 159.29 58.90 0.00 0.00 0.00 194.60 130.09 64.50 23.59 29.20 -5.61Boxboard 266.87 194.83 72.04 0.00 0.00 0.00 238.01 159.12 78.89 28.86 35.71 -6.86Other Fibres 112.14 81.87 30.27 0.00 0.00 0.00 100.01 66.86 33.15 12.13 15.01 -2.88Confidential Papers 0.00 130.60 -130.60 0.00 0.00 0.00 0.00 130.60 -130.60 0.00 0.00 0.00Corrugated Cardboard 305.27 346.96 -41.69 0.00 0.00 0.00 295.53 345.30 -49.77 9.74 1.66 8.08Paper Towels 352.79 274.76 78.03 0.00 0.00 0.00 119.43 18.50 100.93 233.36 256.26 -22.90Coffee Cups 0.00 85.22 -85.22 0.00 0.00 0.00 0.00 11.04 -11.04 0.00 74.18 -74.18LDPE (#4 Plastic) Films 0.00 0.00 0.00 0.00 0.00 0.00 0.00 0.00 0.00 0.00 0.00 0.00Polystyrene (#6 Plastic) (Styrofoam) 41.92 14.26 27.66 0.00 0.00 0.00 4.08 4.08 0.00 37.84 10.18 27.66Mixed Plastics 0.00 4.88 -4.88 0.00 0.00 0.00 0.00 4.88 -4.88 0.00 0.00 0.00Scrap Metals 101.62 56.70 44.92 0.00 0.00 0.00 97.35 55.04 42.32 4.27 1.66 2.61Scrap Woods 140.41 177.72 -37.31 0.00 0.00 0.00 139.46 177.72 -38.26 0.95 0.00 0.95Ewaste/electronics 83.51 47.35 36.16 0.00 0.00 0.00 66.60 47.35 19.25 16.91 0.00 16.91Batteries 0.00 2.00 -2.00 0.00 0.00 0.00 0.00 2.00 -2.00 0.00 0.00 0.00Fluorescent Bulbs 0.00 10.50 -10.50 0.00 0.00 0.00 0.00 10.50 -10.50 0.00 0.00 0.00Asphalt 0.00 260.00 -260.00 0.00 0.00 0.00 0.00 260.00 -260.00 0.00 0.00 0.00Stone, Pavers & Screening 0.00 50.00 -50.00 0.00 0.00 0.00 0.00 50.00 -50.00 0.00 0.00 0.00Soil from Construction Projects 0.00 215.00 -215.00 0.00 0.00 0.00 0.00 215.00 -215.00 0.00 0.00 0.00Concrete from Construction 371.04 292.00 79.04 0.00 0.00 0.00 371.04 292.00 79.04 0.00 0.00 0.00Clean Fill 0.00 118.00 -118.00 0.00 0.00 0.00 0.00 118.00 -118.00 0.00 0.00 0.00Aero. Misc. Pick Ups 0.00 5.40 -5.40 0.00 0.00 0.00 0.00 5.40 -5.40 0.00 0.00 0.00Misc: tires, matresses, rocks etc. 0.00 1.88 -1.88 0.00 0.00 0.00 0.00 1.88 -1.88 0.00 0.00 0.00Recycling from Compactor Loads 0.00 246.22 -246.22 0.00 0.00 0.00 0.00 246.22 -246.22 0.00 0.00 0.00Yard Wastes 0.00 49.87 -49.87 0.00 0.00 0.00 0.00 49.87 -49.87 0.00 0.00 0.00Animal Bedding 0.00 111.49 -111.49 0.00 0.00 0.00 0.00 111.49 -111.49 0.00 0.00 0.00Soil & Plant P/U 0.00 120.00 -120.00 0.00 0.00 0.00 0.00 120.00 -120.00 0.00 0.00 0.00Plant & Tree Use, Composting 0.00 20.00 -20.00 0.00 0.00 0.00 0.00 20.00 -20.00 0.00 0.00 0.00Grass & Wood Mulch 0.00 88.00 -88.00 0.00 0.00 0.00 0.00 88.00 -88.00 0.00 0.00 0.00Catch Basin Material 0.00 88.00 -88.00 0.00 0.00 0.00 0.00 88.00 -88.00 0.00 0.00 0.00Organics 1511.73 514.80 996.93 0.00 0.00 0.00 1084.44 285.12 799.32 427.29 229.68 197.6189 Chestnut Organics 0.00 585.00 -585.00 0.00 0.00 0.00 0.00 585.00 -585.00 0.00 0.00 0.00Swap Shop - Out, Including Pad 0.00 19.29 -19.29 0.00 19.29 -19.29 0.00 0.00 0.00 0.00 0.00 0.00In-Swap 0.00 12.00 -12.00 0.00 12.00 -12.00 0.00 0.00 0.00 0.00 0.00 0.00Campus Furniture Projects 197.70 164.74 32.96 197.70 164.74 32.96 0.00 0.00 0.00 0.00 0.00 0.00Wood Pallets 0.00 12.00 -12.00 0.00 12.00 -12.00 0.00 0.00 0.00 0.00 0.00 0.00Reduction via Various Programs 0.00 123.90 -123.90 0.00 123.90 -123.90 0.00 0.00 0.00 0.00 0.00 0.00Other/Nonrecyclable 1191.62 1102.83 88.79 0.00 0.00 0.00 432.61 0.00 432.61 759.01 1102.83 -343.82Total 5257.37 6458.48 -1201.11 197.70 331.93 -134.23 3430.74 4223.50 -792.76 1628.93 1903.05 -274.12Percent Change (C ÷A x 100 ) -22.8% -67.9% -23.1% -16.8%Note: When completing this form, write “n/a” in the “Estimated Amount of Waste Produced” column where the entity will not produce any waste for a category of waste.* Fill out these columns each year following the initial waste audit or baseline year to determine the progress that is being made by your waste reduction program.

VI. EXTENT TO WHICH MATERIALS OR PRODUCTS USED OR SOLD BY THE ENTITY CONSIST
OF RECYCLED OR REUSED MATERIALS OR PRODUCTS
Please answer the following questions:
1. Do you have a management policy in place that promotes the purchasing and/or use of materials or products that consist of recycled and/or reused materials or products? If yes, please describe. The University of Toronto’s current purchasing policy indicates that goods and services must be acquired in a manner that ensures that the University meets its statutory, legal and ethical obligations. The purchase/use of environmentally‐friendly/sustainable materials/products is implied in the “ethical” obligations of the University’s purchasing policy. The Purchasing Department is currently pursuing the publication of a specific environmental purchasing policy, though it has yet to be finalized.
2. Do you have plans to increase the extent to which materials or products used or sold*
consist of recycled or reused materials or products? If yes, please describe. Once the environmental purchasing policy is finalized, there will be a significant positive shift in the purchasing/procurement of products manufactured with recycled/reused materials. While every effort is currently being made, the purchase of environmentally‐friendly products will increase once there is an overriding policy dictating the need to do so. The University of Toronto
is strongly committed to reducing their environmental impact as much as possible. * Information regarding materials or products “sold” that consist of recycled or reused materials or products is only required from owner(s) of retail shopping establishments and the owner(s) or operator(s) of large manufacturing establishments. Please attach any additional page(s) as required to answer the above questions.
I hereby certify that the information provided in this Report of Waste Audit is complete and correct.
Signature of authorized official:
Title: Date:
…/5
Appendix D
Waste Reduction Work Plan

Ministry of the Environment Waste Form
Report of a Waste Reduction Work Plan
Industrial, Commercial and Institutional Establishments
As required by O. Reg. 102/94
This report must be prepared 6 months after becoming subject to O. Reg. 102/94 and a copy retained on file for at least five years after it is prepared, and be made available to the ministry upon request. I. GENERAL INFORMATION
Name of Owner and/or Operator of Entity(ies) and Company Name: University of Toronto, St. George Campus Name of Contact Person: Reno Strano
Telephone #: 416‐946‐5711
Email address: [email protected]
Street Address(es) of Entity(ies): 255 McCaul Street, 4th Level Municipality: Toronto, Ontario, M5T 1W7
Type of Entity (check one)
Retail Shopping Establishments Hotels and Motels Retail Shopping Complexes Hospitals Office Buildings Educational Institutions X
Restaurants Large Manufacturing Establishments Note: O. Reg. 102/94 does not apply to multi-unit residential buildings.
II. DESCRIPTION OF THE ENTITY
Provide a brief overview of the entity(ties): The University of Toronto is a large multi‐building, multi‐facility community that has approximately 60 thousand students, staff and faculty occupying several major city blocks with over 140 buildings that generate waste and recycling materials. U of T is required to conduct an annual waste audit since it satisfies Part X of Ontario Regulation (“O. Reg.”) 102/94 – Waste Audits and Waste Reduction Work Plans (“O. Reg.102/94”) which requires educational institutions to conduct waste audits and prepare waste reduction plans on an annual basis if the location or campus has more than 350 full or part‐time persons enrolled during the calendar year.
…/1

III. PLANS TO REDUCE, REUSE AND RECYCLE WASTE
For each category of waste described in Part V of “Report of a Waste Audit” (on which this plan is based), explain what your plans are to Reduce, Reuse and Recycle the waste, including: 1) how the waste will be source separated at the establishment, and 2) the programs to reduce, reuse and recycle all source separated waste. Waste Category (as stated in Part V
of your “Report of a Waste Audit”)
Source Separation and 3Rs Program
Organics & Food Waste
“Organics 3Rs Program” Reduce: None Reuse: None Recycle: Staff/students will be reminded of existing recycling programs.
Yard Waste
“Yard Waste 3Rs Program” Reduce: None Reuse: None Recycle: Grounds staff will be reminded of existing recycling programs.
Scrap Wood
“Scrap Wood 3Rs Program” Reduce: None Reuse: None Recycle: Staff/students will be reminded of existing recycling programs.
Scrap Metal
“Scrap Metal 3Rs Program” Reduce: None Reuse: None Recycle: Staff/students will be reminded of existing recycling programs.
Animal Bedding
“Animal Bedding 3Rs Program” Reduce: None Reuse: None Recycle: Staff/students will be reminded of existing recycling programs.
Polystyrene
“Polystyrene 3Rs Program” Reduce: None Reuse: None Recycle: Staff/students will be reminded of existing recycling programs.
Mixed Containers
“Mixed Containers 3Rs Program” Reduce: Staff/students will be encouraged to use a reusable water bottle instead of purchasing a disposable plastic one. Reuse: None Recycle: Staff/students will be reminded of existing recycling programs.
Laboratory Glass and Plastic
“Laboratory Glass and Plastic 3Rs Program” Reduce: None Reuse: None Recycle: Staff/students will be reminded of existing recycling programs.
Amber Bottles
“Amber Bottles 3Rs Program” Reduce: None Reuse: None Recycle: Staff/students will be reminded of existing recycling programs.
Mixed Plastics
“Mixed Plastics 3Rs Program” Reduce: Staff/students will be encouraged to use a reusable water bottle instead of purchasing a disposable plastic one. Reuse: None Recycle: Staff/students will be reminded of existing recycling programs.
Coffee Cups
“Coffee Cups 3Rs Program” Reduce: Staff/students will be encouraged to use a travel mug instead of a paper cup. Reuse: None Recycle: Staff/students will be reminded of existing recycling programs.
Soil & Plants
“Soil & Plants 3Rs Program” Reduce: None Reuse: None Recycle: Grounds staff will be reminded of existing recycling programs.
Light Bulbs “Light Bulb 3Rs Program” Reduce: None

Reuse: None Recycle: Staff/students will be reminded of existing recycling programs.
E‐waste
“Ewaste 3Rs Program” Reduce: None Reuse: None Recycle: Staff/students will be reminded of existing recycling programs.
Printer Cartridges
“Ewaste 3Rs Program” Reduce: None Reuse: None Recycle: Staff/students will be reminded of existing recycling programs.
Mixed Papers
“Mixed Paper 3Rs Program” Reduce: Staff/Students will be encouraged to print on both sides of paper to reduce the number of pages used. Reuse: None Recycle: Staff/students will be reminded of existing recycling programs.
Paper Towels
“Paper Towel 3Rs Program” Reduce: None Reuse: None Recycle: Staff/students will be reminded of existing recycling programs.
Cardboard
“Cardboard 3Rs Program” Reduce: None Reuse: None Recycle: Staff/students will be reminded of existing recycling programs.
Shredded Paper
“Shredded Paper 3Rs Program” Reduce: None Reuse: None Recycle: Staff/students will be reminded of existing recycling programs.
Pallets
“Pallets 3Rs Program” Reduce: None Reuse: Receiving staff/students will be reminded of the existing reuse program. Recycle: None.
Asphalt
“Asphalt 3Rs Program” Reduce: None Reuse: None Recycle: Staff and contractors will be reminded of existing recycling programs.
Stone, pavers & screening
“Stone, Pavers & Screening 3Rs Program” Reduce: None Reuse: Staff and contractors will be reminded of existing recycling programs. Recycle: None
Concrete
“Concrete 3Rs Program” Reduce: None Reuse: None Recycle: Staff and contractors will be reminded of existing recycling programs.
Clean fill
“Clean Fill 3Rs Program” Reduce: None Reuse: None Recycle: Staff and contractors will be reminded of existing recycling programs.
Swap Shop ‐ Out
“Swap Shop 3Rs Program” Reduce: None Reuse: Staff/students will be reminded of existing recycling programs. Recycle: None
Swap Shop – In
“Swap Shop 3Rs Program” Reduce: None Reuse: Staff/students will be reminded of existing recycling programs. Recycle: None
Campus Furniture
“Campus Furniture 3Rs Program” Reduce: None Reuse: Staff/students will be reminded of existing recycling programs. Recycle: None
Batteries
“Batteries 3Rs Program” Reduce: None Reuse: The use of rechargeable batteries will be encouraged. Recycle: Staff/students will be reminded of existing recycling programs.
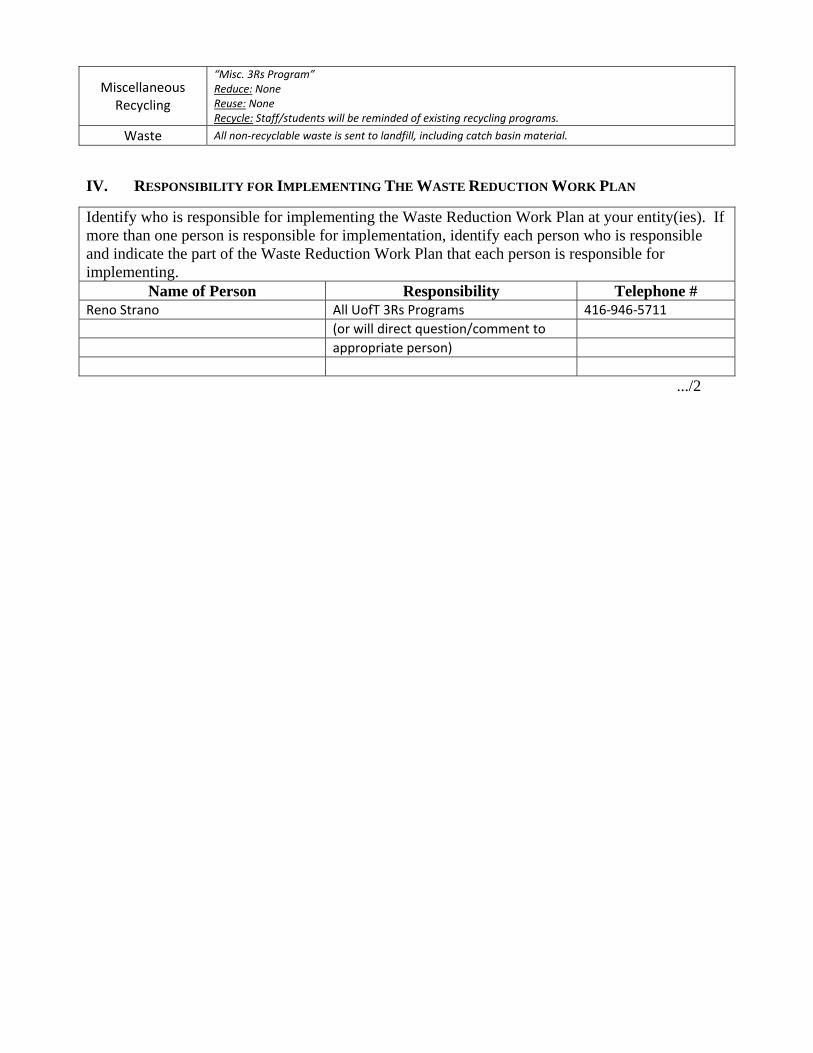
Miscellaneous Recycling
“Misc. 3Rs Program” Reduce: None Reuse: None Recycle: Staff/students will be reminded of existing recycling programs.
Waste All non‐recyclable waste is sent to landfill, including catch basin material.
IV. RESPONSIBILITY FOR IMPLEMENTING THE WASTE REDUCTION WORK PLAN
Identify who is responsible for implementing the Waste Reduction Work Plan at your entity(ies). If more than one person is responsible for implementation, identify each person who is responsible and indicate the part of the Waste Reduction Work Plan that each person is responsible for implementing.
Name of Person Responsibility Telephone # Reno Strano All UofT 3Rs Programs 416‐946‐5711
(or will direct question/comment to
appropriate person)
.../2

V. TIMETABLE FOR IMPLEMENTING WASTE REDUCTION WORK PLAN
Provide a timetable indicating when each Source Separation and 3Rs program of the Waste Reduction Work Plan will be implemented.
Source Separation and 3Rs Program
Schedule for Completion
Organics & Food Waste Composting program currently implemented. Promotion/enforcement may be beneficial to increase capture rate. (2015)
Yard Waste Recycling program currently implemented. Promotion/enforcement may be beneficial to increase capture rate. (2015)
Scrap Wood Recycling program currently implemented. Promotion/enforcement may be beneficial to increase capture rate. (2015)
Scrap Metal Recycling program currently implemented. Promotion/enforcement may be beneficial to increase capture rate. (2015)
Animal Bedding Recycling program currently implemented. Promotion/enforcement may be beneficial to increase capture rate. (2015)
Polystyrene Recycling program currently implemented. Promotion/enforcement may be beneficial to increase capture rate. (2015)
Mixed Containers Recycling program currently implemented. Promotion/enforcement may be beneficial to increase capture rate. (2015)
Laboratory Glass and Plastic
Recycling program currently implemented. Promotion/enforcement may be beneficial to increase capture rate. (2015)
Amber Bottles Recycling program currently implemented. Promotion/enforcement may be beneficial to increase capture rate. (2015)
Mixed Plastics Recycling program currently implemented. Promotion/enforcement may be beneficial to increase capture rate. (2015)
Coffee Cups Recycling program currently implemented. Promotion/enforcement may be beneficial to increase capture rate. (2015)
Soil & Plants Recycling program currently implemented. Promotion/enforcement may be beneficial to increase capture rate. (2015)
Light Bulbs Recycling program currently implemented. Promotion/enforcement may be beneficial to increase capture rate. (2015)
E‐waste Recycling program currently implemented. Promotion/enforcement may be beneficial to increase capture rate. (2015)
Printer Cartridges Recycling program currently implemented. Promotion/enforcement may be beneficial to increase capture rate. (2015)
Mixed Papers Recycling program currently implemented. Promotion/enforcement may be beneficial to increase capture rate. (2015)
Paper Towels Recycling program currently implemented. Promotion/enforcement may be beneficial to increase capture rate. (2015)
Cardboard Recycling program currently implemented. Promotion/enforcement may be beneficial to increase capture rate. (2015)
Shredded Paper Recycling program currently implemented. Promotion/enforcement may be beneficial to increase capture rate. (2015)
Pallets Reuse program currently implemented. Promotion/enforcement may be beneficial to increase capture rate. (2015)
Asphalt Recycling program currently implemented. Promotion/enforcement may be beneficial to increase capture rate. (2015)
Stone, pavers & screening
Reuse program currently implemented. Promotion/enforcement may be beneficial to increase capture rate. (2015)
Concrete Recycling program currently implemented. Promotion/enforcement may be

beneficial to increase capture rate. (2015)
Clean fill Recycling program currently implemented. Promotion/enforcement may be beneficial to increase capture rate. (2015)
Swap Shop ‐ Out Reuse program currently implemented. Promotion/enforcement may be beneficial to increase capture rate. (2015)
Swap Shop – In Reuse program currently implemented. Promotion/enforcement may be beneficial to increase capture rate. (2015)
Campus Furniture Reuse program currently implemented. Promotion/enforcement may be beneficial to increase capture rate. (2015)
Batteries Recycling program currently implemented. Promotion/enforcement may be beneficial to increase capture rate. (2015)
Aero. Misc. pick ups Recycling program currently implemented. Promotion/enforcement may be beneficial to increase capture rate. (2015)
VI. COMMUNICATION TO STAFF, CUSTOMERS, GUESTS AND VISITORS
Explain how the Waste Reduction Work Plan will be communicated to employees, customers, tenants, guests/visitors and students: Increase awareness of recycling programs at the facility through staff/student/cleaner education programs. Such programs can include placement of posters in strategic locations around the building, and posting information regarding recycling, reuse, and reduction rates throughout the facility. Provide easy access to contact information for help or questions regarding the recycling programs. The recycling program should have as much consistency as possible throughout the entire campus.
…/3

VII. ESTIMATED WASTE PRODUCED BY MATERIAL TYPE AND THE PROJECTED AMOUNT
Material Categories (as stated in
Part III)
Estimated Annual Waste
Produced * (tonnes)
Name of Proposed 3Rs
Program (as stated in Part III)
Projections to Reduce, Reuse or Recycle Waste
(tonnes)
Estimated Annual Amount to be Diverted **
(%)
Reduce Reuse Recycle
Organics & Food Waste
1099.80 Organics 3Rs Program
870.12 79.1%
Yard Waste 49.87 Yard Waste 3Rs Program 49.87 100.0%
Scrap Wood 177.72 Scrap Wood 3Rs Program 177.72 100.0%
Scrap Metal 56.70 Scrap Metal 3Rs Program 55.04 97.1%
Animal Bedding 111.49 Animal Bedding 3Rs
Program 111.49 100.0%
Polystyrene 14.26 Polystyrene 3Rs Program 4.28 30%
Mixed Containers 442.89 Mixed Containers 3Rs
Program 332.62 75.1%
Laboratory Glass and Plastic
23.62 Laboratory Glass and Plastic
3Rs Program 23.62 100.0%
Amber Bottles 6.00 Amber Bottles 3Rs Program 6.00 100.0%
Coffee Cups 85.22 Coffee Cups 3Rs Program 12.78 15.0%
Soil & Plants 120.00 Soil & Plants 3Rs Program 120.00 100.0%
Light Bulbs 10.50 Light Bulb 3Rs Program 10.50 100.0%
Ewaste and Printer Cartridges
47.35 Ewaste 3Rs Program
47.35 100.0%
Mixed Papers (including shredded)
765.23
Mixed Paper & Shredded Paper 3Rs Programs 648.90 84.8%
Paper Towels 274.76 Paper Towel 3Rs Program 18.50 6.7%
Cardboard 346.96 Cardboard 3Rs Program 345.30 99.5%
Pallets 12.00 Pallets 3Rs Program 12.00 100.0%
Asphalt 260.00 Asphalt 3Rs Program 260.00 100.0%
Stone, pavers & screening
50.00 Stone, pavers & Screening
3Rs Program 50.00 100.0%
Concrete 292.00 Concrete 3Rs Program 292.00 100.0%
Clean fill 118.00 Clean Fill 3Rs Program 118.00 100.0%
Swap Shop ‐ Out 19.29 Swap‐Shop 3Rs Program 19.29 100.0%
Swap Shop – In 12.00 Swap‐Shop 3Rs Program 12.00 100.0%
Campus Furniture 164.74 Campus Furniture 3Rs
Program 164.74 100.0%
Batteries 2.00 Batteries 3Rs Program 2.00 100.0%
Miscellaneous 3R Programs
793.27 Miscellaneous 3Rs Program
123.90 669.37 100.0%
* Estimated Waste Produced = Waste Diverted (3Rs) + Waste Disposed ** Estimated Waste Diversion Rate = Amount of Waste Diverted (3Rs) ÷ Estimated Waste Produced x 100%
I hereby certify that the information provided in this Waste Reduction Work Plan is complete and correct. Signature of authorized official:
Title: Date:
../4