SDE - Dynamic Analysis
157
Jorge Ressia Software Design and Evolution 11. Dynamic Analysis
-
Upload
jorge-ressia -
Category
Technology
-
view
518 -
download
1
description
Software Design and evolution lecture: Dynamic Analysis
Transcript of SDE - Dynamic Analysis
Jorge Ressia
Software Design and Evolution
11. Dynamic Analysis

> Motivation> Sources of Runtime Information> Dynamic Analysis Techniques> Advanced Dynamic Analysis Techniques> Dynamic analysis in a Reverse Engineering Context> What can we achieve with all this?> Conclusion
Roadmap
2

Roadmap
3
> Motivation> Sources of Runtime Information> Dynamic Analysis Techniques> Advanced Dynamic Analysis Techniques> Dynamic analysis in a Reverse Engineering Context> What can we achieve with all this?> Conclusion

What does this program do?
#include <stdio.h>main(t,_,a)char *a;{return!0<t?t<3?main(-79,-13,a+main(-87,1-_,main(-86,0,a+1)+a)):1,t<_?main(t+1,_,a):3,main(-94,-27+t,a)&&t==2?_<13?main(2,_+1,"%s %d %d¥n"):9:16:t<0?t<-72?main(_,t,"@n'+,#'/*{}w+/w#cdnr/+,{}r/*de}+,/*{*+,/w{%+,/w#q#n+,/#{l,+,/n{n+,/+#n+,/#¥;#q#n+,/+k#;*+,/'r :'d*'3,}{w+K w'K:'+}e#';dq#'l ¥q#'+d'K#!/+k#;q#'r}eKK#}w'r}eKK{nl]'/#;#q#n'){)#}w'){){nl]'/+#n';d}rw' i;# ¥){nl]!/n{n#'; r{#w'r nc{nl]'/#{l,+'K {rw' iK{;[{nl]'/w#q#n'wk nw' ¥iwk{KK{nl]!/w{%'l##w#' i; :{nl]'/*{q#'ld;r'}{nlwb!/*de}'c ¥;;{nl'-{}rw]'/+,}##'*}#nc,',#nw]'/+kd'+e}+;#'rdq#w! nr'/ ') }+}{rl#'{n' ')# ¥}'+}##(!!/"):t<-50?_==*a?putchar(31[a]):main(-65,_,a+1):main((*a=='/')+t,_,a+1) :0<t?main(2,2,"%s"):*a=='/'||main(0,main(-61,*a,"!ek;dc i@bK'(q)-[w]*%n+r3#l,{}:¥nuwloca-O;m .vpbks,fxntdCeghiry"),a+1);}
Thomas Ball, The Concept of Dynamic Analysis, FSE’99
4
Source code can be hard to read and understand.This is a legal C program, an extreme case of course.
This is intentionally obfuscated code. Obfuscation is a set of transformations that preserve the behavior of the program but make the internals hard to reverse-engineer.- Programming contests- Prevent reverse engineering
Finding Features
Software Feature:A distinguishing characteristic of a software item.
IEEE 8295

Bug reports often expressed in terms of Features.
I can’t add new contacts!!!
6
The software engineer needs to maintain a mental map between features and the parts of the code that implement them.Features are not implemented in one class. Their implementation spreads out over lots of classes. The behavior consist of objects that collaborate at runtime.
“Change requests and bug reports are usually expressed in a language that reflects the features of a system” [Mehta and Heinemann 2002]

Bug reports often expressed in terms of Features.
I can’t add new contacts!!!
The “add contacts“
feature
6
The software engineer needs to maintain a mental map between features and the parts of the code that implement them.Features are not implemented in one class. Their implementation spreads out over lots of classes. The behavior consist of objects that collaborate at runtime.
“Change requests and bug reports are usually expressed in a language that reflects the features of a system” [Mehta and Heinemann 2002]

Feature-Centric Reverse Engineering
F2F1
Fn
F1
Fn
F2
Software System
Users Software developer
7

Feature-Centric Reverse Engineering
F2F1
Fn
F1
Fn
F2
Software System
Users Software developer
7

Finding Features
?}
{
}
{
}
{}
{
}
{
8
I have a system and I need to find the features. Which part of the system belongs to which features?

What is Dynamic Analysis?
The investigation of the properties of a running software system over one or more executions
(Static analysis examines the program code alone)
9

Why Dynamic Analysis?
Gap between run-time structure and code structure in OO programs
Trying to understand one [structure] from the other is like trying to understand the dynamism of living ecosystems from the static taxonomy of plants and animals, and vice-versa.
! ! ! -- Erich Gamma et al., Design Patterns
10
Programs can be hard to understand from their source code alone.The static code does not explicitly reflect the dynamic behavior.The code structure consists of classes in fixed inheritance relationships. Difficulties: OO source code exposes a class hierarchy, not the run-time object collaborations Collaborations are spread throughout the code Polymorphism may hide which classes are instantiatedA program’s run-time structure consists of rapidly changing networks of communicating objects.
Roadmap
11
> Motivation> Sources of Runtime Information> Dynamic Analysis Techniques> Advanced Dynamic Analysis Techniques> Dynamic analysis in a Reverse Engineering Context> What can we achieve with all this?> Conclusion

Runtime Information Sources
Many possibilities: hardware monitoring, tracing method execution, values of variables, memory usage etc...
execute program and watch it from outside
Internal viewExternal view
instrument program and watch it from inside
12

External View
Program output, UI (examine behavior, performance, …)
Analyze used resourcesCPU and memory usage (top)Network usage (netstat, tcpdump)Open files, pipes, sockets (lsof)
Examine logs (syslog, web logs, stdout/stderr, …)
13

Internal View
Log statementsin code Stack trace
Debugger
Many different tools are based on tracing: execution profilers, test coverage analyzers, tools for reverse engineering…
Execution trace
14
- Logs: Single points in the execution.- Stack trace: snapshot of the current stack- Debugger: interactive, allows one to step into future method executions. Not persistent.- Tracing: full history of all method executions

Execution Tracing
How can we capture “full”OO program execution?
Trace entry and exit of methods
Additional information:- receiver and arguments- class instantiations- …?
15
For now we consider this approach
Sequence and nesting: construct tree structureAdditional:-receiver and arguments-Return values-Object creation-Current feature-Distinguish process (analyze concurrency properties)
Object referencing relationships not captured.Object graph at particular point in time cannot be reconstructed, now, how it evolves

Tracing Techniques
Instrumentation approaches—Sourcecode modification—Bytecode modification—Wrapping methods (Smalltalk)
Simulate execution (using debugger infrastructure)
Sampling
At the VM level—Execution tracing by the interpreter—(Dynamic recompilation, JIT)
16
Simulate execution: slow, but very precise control possibleSampling: mainly used for profilingDynamic recompilation: - control optimizations: compile hot blocks/paths/procedures to machine code - data optimizations: garbage collection: move objects for locality

Technical Challenges
> Instrumentation influences the behavior of the execution> Overhead: increased execution time> Large amount of data
> Code also used by the tracer, library and system classes cannot be instrumented
-> Trace at the VM level-> Scope instrumentation (Changeboxes)
17

Roadmap
18
> Motivation> Sources of Runtime Information> Dynamic Analysis Techniques> Advanced Dynamic Analysis Techniques> Dynamic analysis in a Reverse Engineering Context> What can we achieve with all this?> Conclusion

Feature Analysis
?}
{
}
{
}
{}
{
}
{
19
I have a system and I need to find the features. Which part of the system belongs to which features?

Loggers - low tech debugging
“…debugging statements stay with the program; debugging sessions are transient. “! ! ! ! Kerningham and Pike
public class Main { public static void main(String[] args) { Clingon aAlien = new Clingon(); System.out.println(“in main “); aAlien.spendLife(); }}
20
Inserting log statements into your code is a low-tech method for debugging it. It may also be the only way because debuggers are not always available or applicable. This is often the case for distributed applications.

Loggers - low tech debugging
“…debugging statements stay with the program; debugging sessions are transient. “! ! ! ! Kerningham and Pike
Very messy!public class Main { public static void main(String[] args) { Clingon aAlien = new Clingon(); System.out.println(“in main “); aAlien.spendLife(); }}
20
Inserting log statements into your code is a low-tech method for debugging it. It may also be the only way because debuggers are not always available or applicable. This is often the case for distributed applications.

Smalltalk Mechanisms
> become: function> Method Wrappers> Anonymous Classes
21

Java Dynamic Proxies
public class DebugProxy implements java.lang.reflect.InvocationHandler {
private Object obj;
public static Object newInstance(Object obj) { return java.lang.reflect.Proxy.newProxyInstance( obj.getClass().getClassLoader(), obj.getClass().getInterfaces(), new DebugProxy(obj)); }
public Object invoke(Object proxy, Method m, Object[] args) throws Throwable { .... Feature data gathering ... return m.invoke(obj, args); System.out.println("after method " + m.getName()); }}
22
http://docs.oracle.com/javase/1.3/docs/guide/reflection/proxy.html
AOP
Aspect Oriented Programming
http://www.eclipse.org/aspectj/doc/next/progguide/language.html23
In the pointcut-advice (PA) mechanism for aspect-oriented programming, as embodied in AspectJ and others, cross- cutting behavior is defined by means of pointcuts and advices. Points during execution at which advices may be executed are called (dynamic) join points. A pointcut identifies a set of join points, and an advice is the action to be taken at a join point matched by a pointcut. An aspect is a module that encompasses a number of pointcuts and advices. In AspectJ, the decision of whether or not to use an aspect within a program is done at build time; if so, the aspect has global scope, i.e. it sees all join points of the program execution. Restricting the scope of an aspect can be done by introducing conditions in the pointcut definitions.

AOP
24

AOP
25

AOP
26

AOP Example
public class HelloWorld {
public static void say(String message) { System.out.println(message); } public static void sayToPerson(String message, String name) { System.out.println(name + ", " + message); }}
27

AOP Example
public aspect Example { pointcut callSayMessage() :
call(public static void HelloWorld.say*(..)); before() : callSayMessage() { System.out.println("Good day!"); } after() : callSayMessage() { System.out.println("Thank you!"); }}
28

Feature Analysis AOP
public aspect FeatureAnalysis { pointcut callMessage() :
call(public * com.mycompany..*.*(..));
before() : callMessage() { ... save feature information ... }
}
29

Feature Analysis AOP
public aspect FeatureAnalysis { pointcut executeMessage() :
execute(public * com.mycompany..*.*(..));
before() : executeMessage() { ... save feature information ... }
}
30
So what's the difference between these join points? Well, there are a number of differences:
Firstly, the lexical pointcut declarations within and withincode match differently. At a call join point, the enclosing code is that of the call site. This means that call(void m()) && withincode(void m()) will only capture directly recursive calls, for example. At an execution join point, however, the program is already executing the method, so the enclosing code is the method itself: execution(void m()) && withincode(void m()) is the same as execution(void m()).
Secondly, the call join point does not capture super calls to non-static methods. This is because such super calls are different in Java, since they don't behave via dynamic dispatch like other calls to non-static methods.
The rule of thumb is that if you want to pick a join point that runs when an actual piece of code runs (as is often the case for tracing), use execution, but if you want to pick one that runs when a particular signature is called (as is often the case for production aspects), use call.

AspectJ pointcuts
call(MethodPattern)execution(MethodPattern)get(FieldPattern)set(FieldPattern)call(ConstructorPattern)execution(ConstructorPattern)initialization(ConstructorPattern)preinitialization(ConstructorPattern)staticinitialization(TypePattern)handler(TypePattern)adviceexecution()within(TypePattern)
withincode(MethodPattern)withincode(ConstructorPattern)cflow(Pointcut)cflowbelow(Pointcut)this(Type or Id)target(Type or Id)args(Type or Id, ...)PointcutId(TypePattern or Id, ...)if(BooleanExpression)! PointcutPointcut0 && Pointcut1Pointcut0 || Pointcut1
31
This is just and example for AspectJ, there are many other aspect languages with many different pointcuts with different objectives.

Operational Decomposition
McAffer - CodA - Meta-level Programming with CodA - ECOOP 1995
32

Operational Decomposition
Iguana C++, IguanaJBifröstAOPEAOPAspectJ tracematches
33

Sub-method Feature Analysis
?}
{
}
{
}
{}
{
}
{
34
We need to find which statements belong to which feature.

Sub-method Feature Analysis
Bytecode Instrumentation
35

Bytecode Instrumentation
Smalltalk
36

> Smalltalk code:
> Symbolic Bytecode
Example: Number>>asInteger
Number>>asInteger! "Answer an Integer nearest! the receiver toward zero."
! ^self truncated
9 <70> self10 <D0> send: truncated11 <7C> returnTop
37

Example: Step by Step
> 9 <70> self—The receiver (self) is pushed on the stack
> 10 <D0> send: truncated—Bytecode 208: send litereral selector 1—Get the selector from the first literal—start message lookup in the class of the object that is on
top of the stack—result is pushed on the stack
> 11 <7C> returnTop—return the object on top of the stack to the calling method
38

ByteSurgeon
> Library for bytecode transformation in Smalltalk> Full flexibility of Smalltalk Runtime > Provides high-level API > For Pharo, but portable
> Runtime transformation needed for —Adaptation of running systems —Tracing / debugging —New language features (MOP, AOP)
39

Example: Logging
> Goal: logging message send.> First way: Just edit the text:
40

Logging with ByteSurgeon
> Goal: Change the method without changing program text> Example:
41

Logging: Step by Step
42

Logging: Step by Step
> instrumentSend: —takes a block as an argument —evaluates it for all send bytecodes
43

Logging: Step by Step
> The block has one parameter: send > It is executed for each send bytecode in the method
44

Logging: Step by Step
> Objects describing bytecode understand how to insert code —insertBefor —insertAfter —replace
45
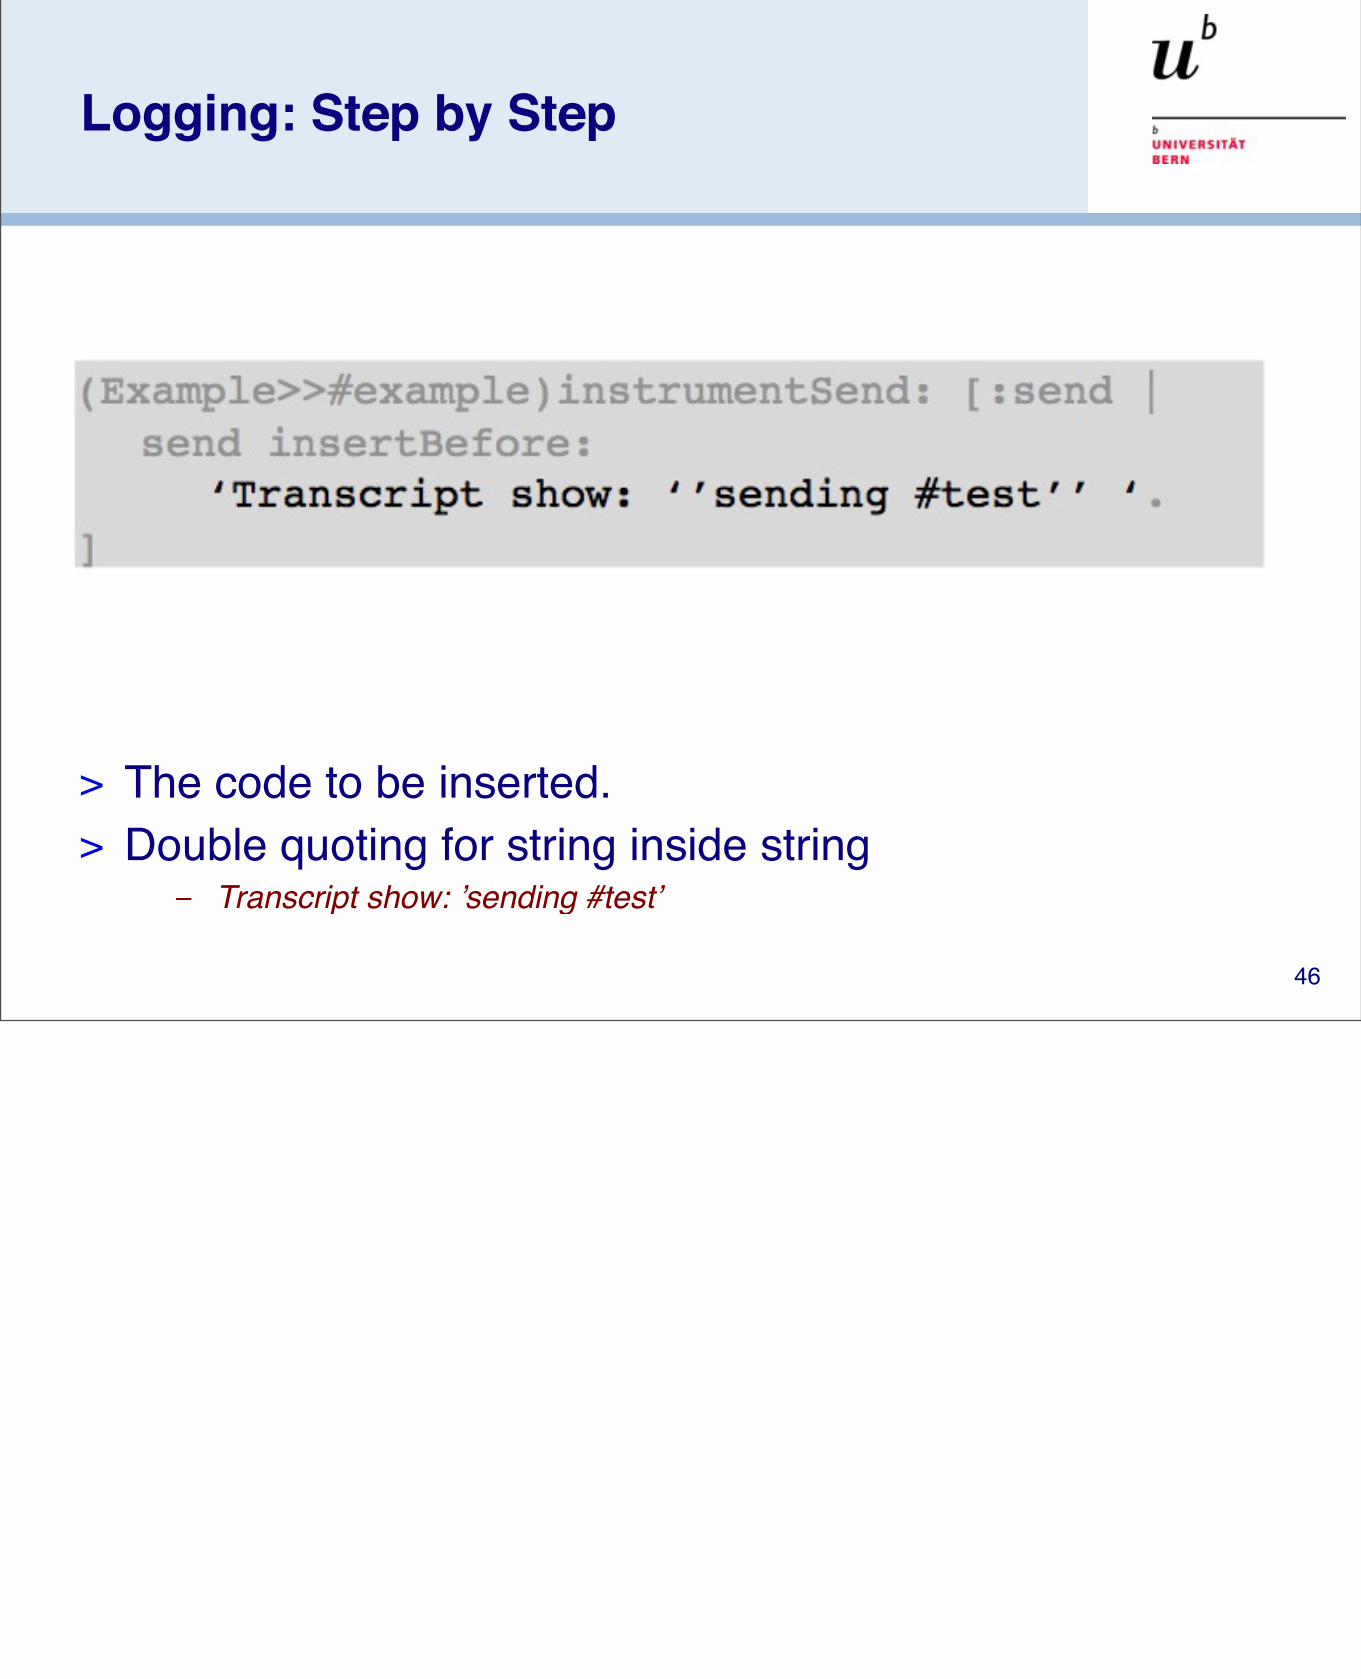
Logging: Step by Step
> The code to be inserted.> Double quoting for string inside string
– Transcript show: ’sending #test’
46

Inside ByteSurgeon
> Uses IRBuilder internally
> Transformation (Code inlining) done on IR
47
ByteSurgeon Usage
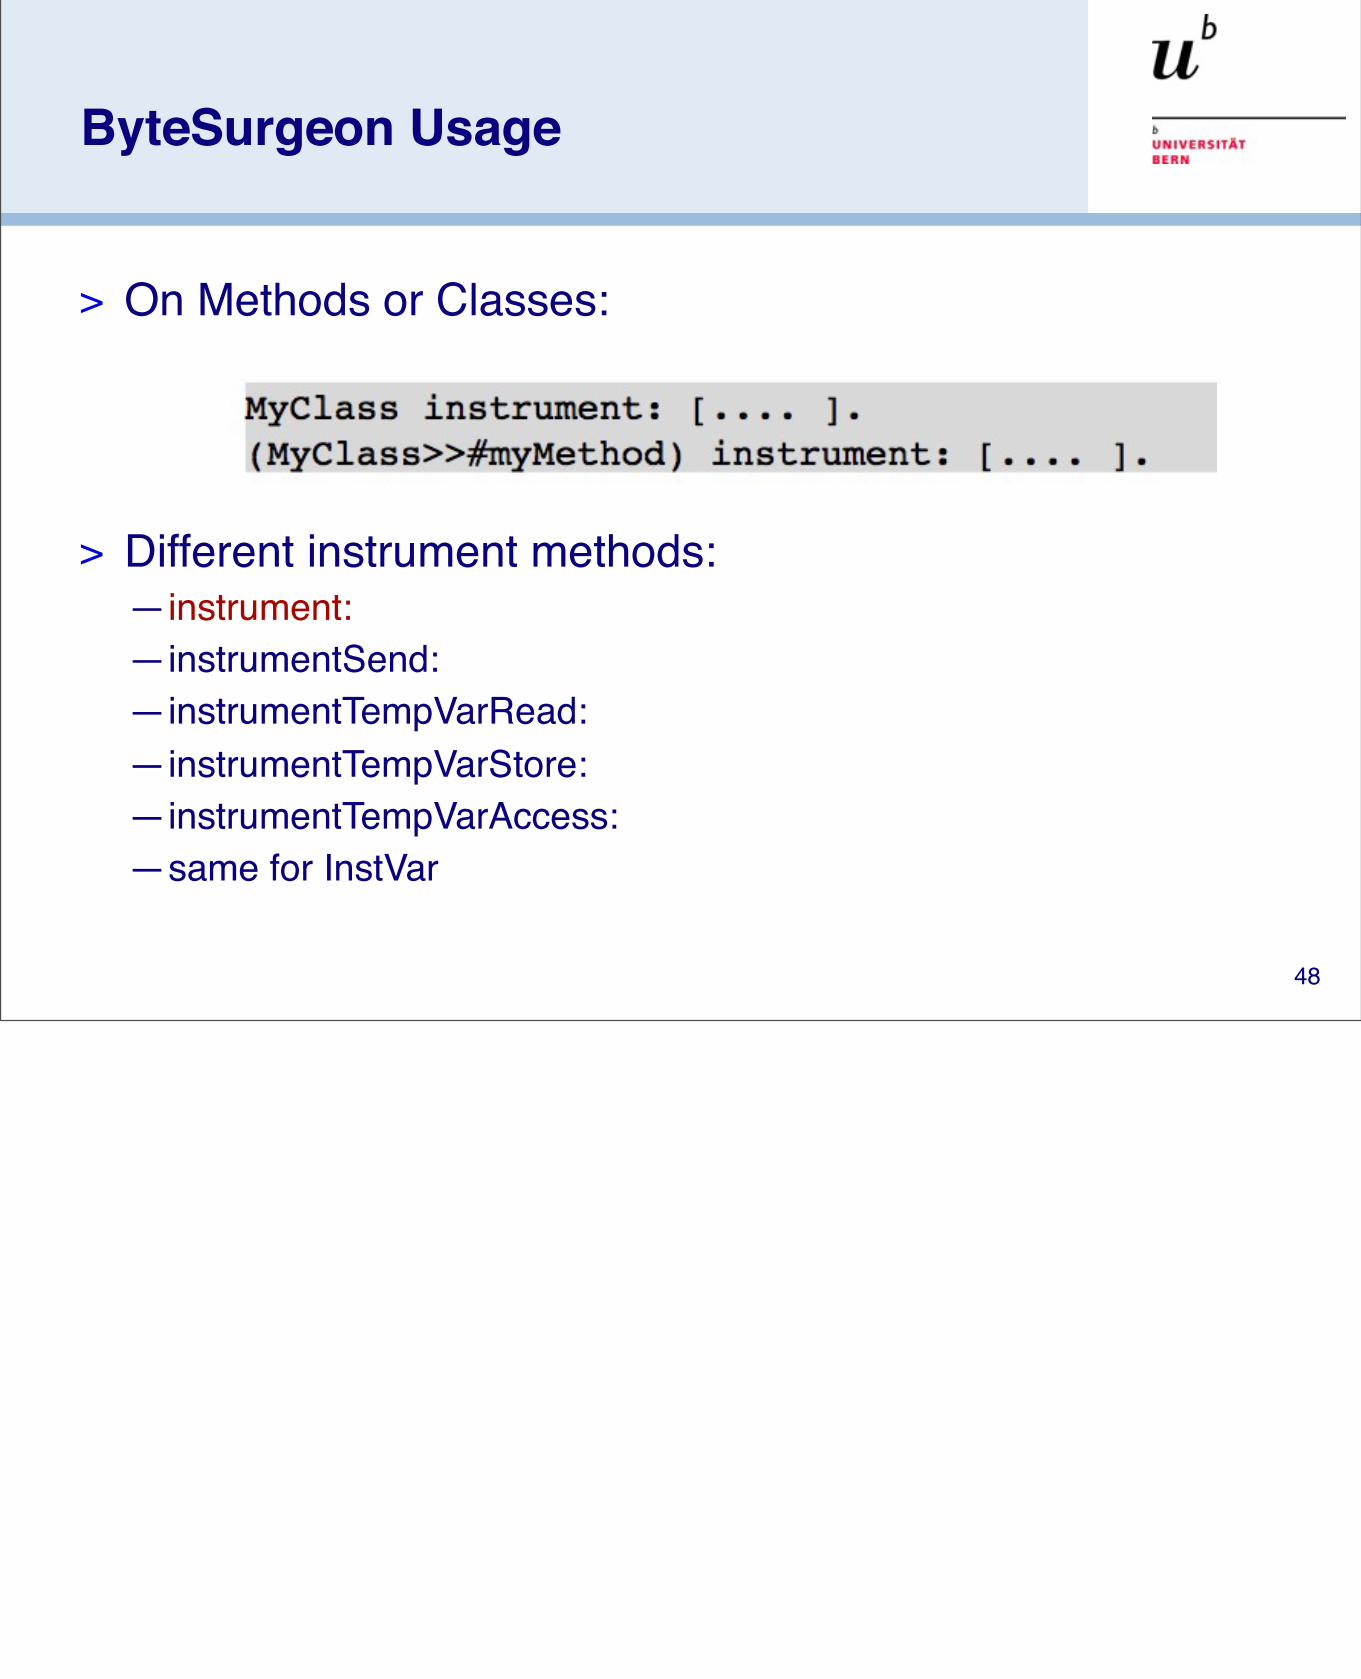
> On Methods or Classes:
> Different instrument methods: —instrument: —instrumentSend: —instrumentTempVarRead:—instrumentTempVarStore: —instrumentTempVarAccess: —same for InstVar
48

Advanced ByteSurgeon
> Goal: extend a send with after logging
49

Advanced ByteSurgeon
> With ByteSurgeon, something like:
> How can we access the receiver of the send? > Solution: Metavariable
50

Advanced ByteSurgeon
> With Bytesurgeon, something like:
> How can we access the receiver of the send? > Solution: Metavariable
51

Bytecode Instrumentation
Java
52
www.javassist.orghttp://commons.apache.org/bcel/http://asm.objectweb.org/

Bytecode Manipulation
> Java—Javassist
– reflection– RMI
—BCEL– Decompiling, Obfuscation, and Refactoring– AspectJ– FindBugs
—ASM– Groovy– AspectWerkz
53
www.javassist.orghttp://commons.apache.org/bcel/http://asm.objectweb.org/
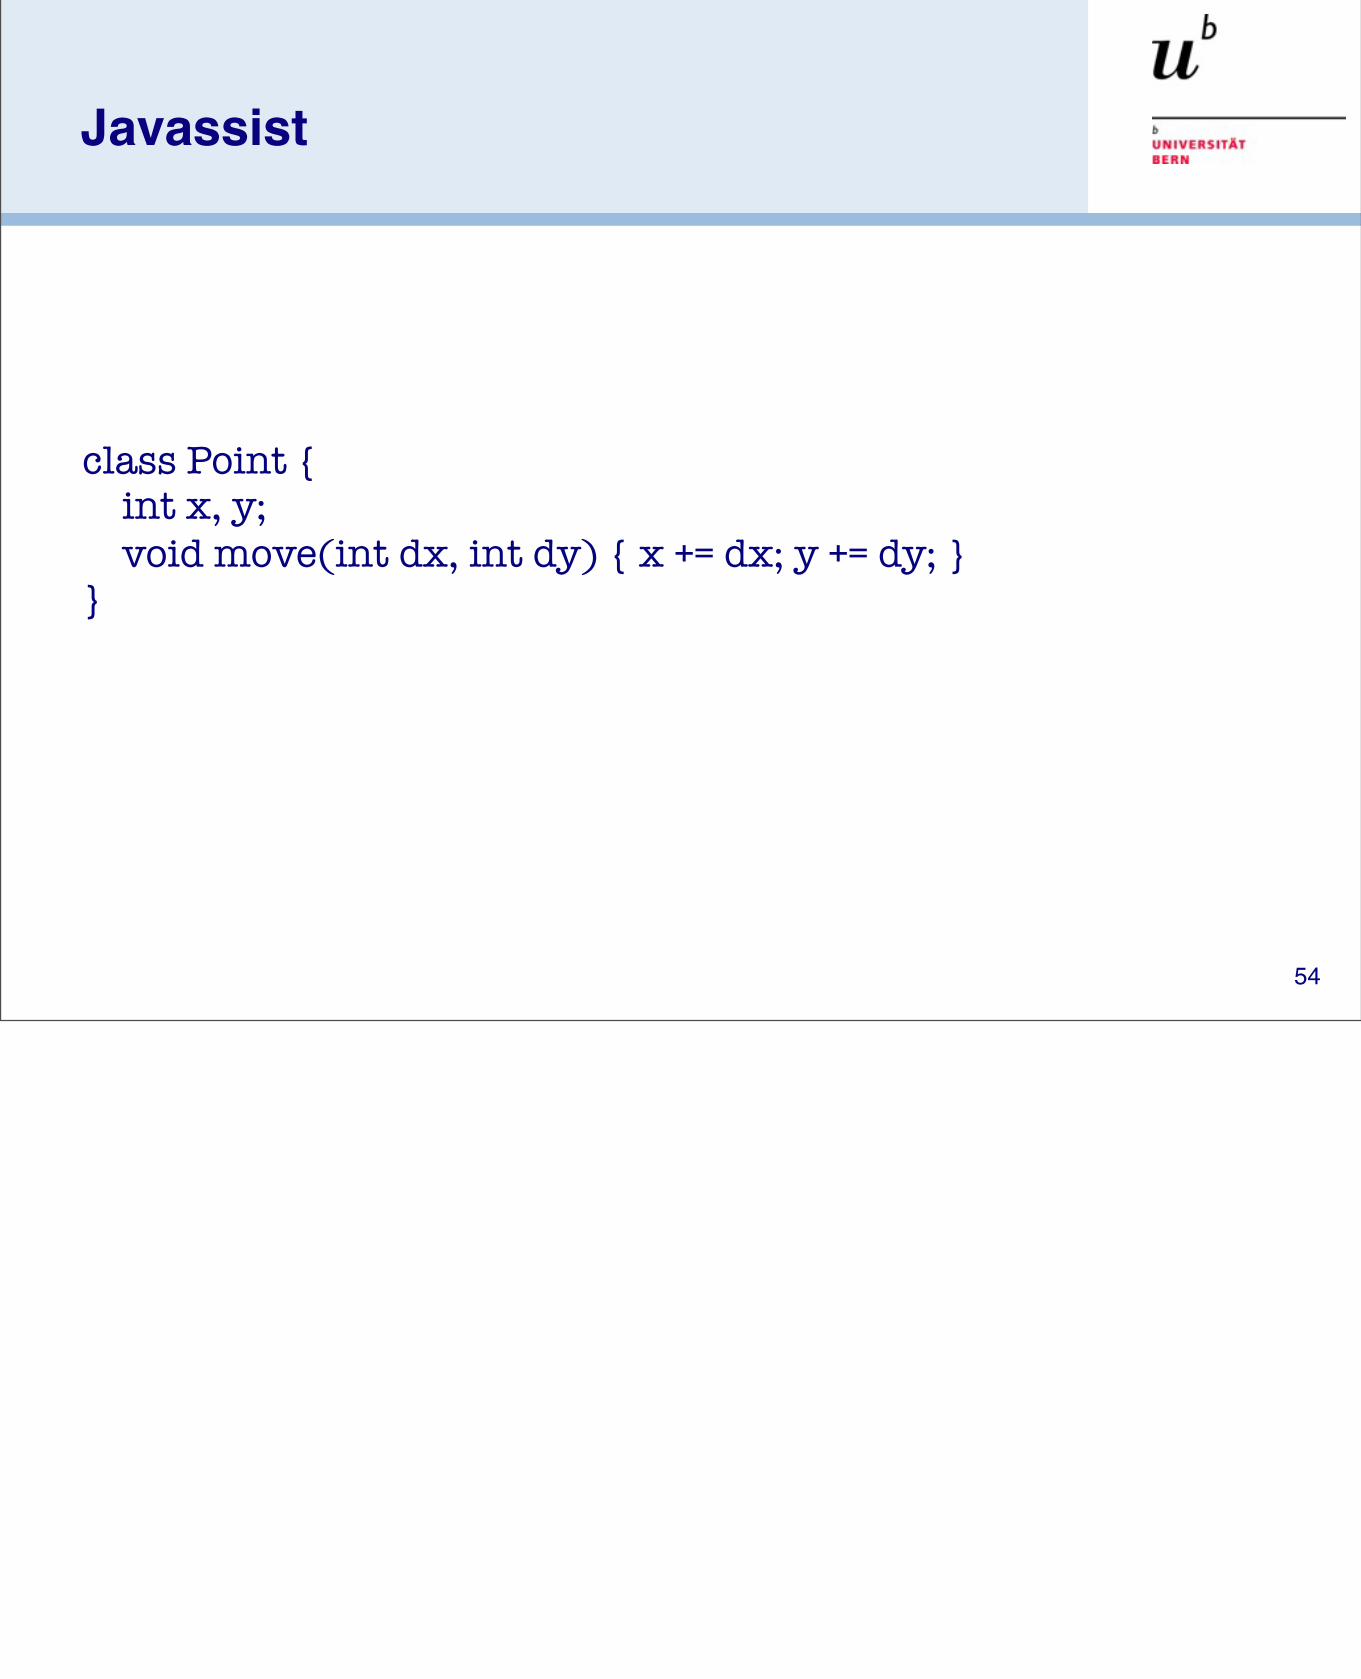
Javassist
class Point { int x, y; void move(int dx, int dy) { x += dx; y += dy; }}
54

Javassist
ClassPool pool = ClassPool.getDefault();CtClass cc = pool.get("Point");CtMethod m = cc.getDeclaredMethod("move");m.insertBefore("{ System.out.println($1); System.out.println($2); }");cc.writeFile();
55

Javassist
class Point { int x, y; void move(int dx, int dy) { { System.out.println(dx); System.out.println(dy); } x += dx; y += dy; }}
56

Javassist - Edit Body
CtMethod cm = ... ;cm.instrument( new ExprEditor() { public void edit(MethodCall m) throws CannotCompileException { if (m.getClassName().equals("Point") && m.getMethodName().equals("move")) m.replace("{ $1 = 0; $_ = $proceed($$); }"); } });
57
searches the method body represented by cm and replaces all calls to move() in class Point with a block:
• { $1 = 0; $_ = $proceed($$); }

Problems with Bytecode Instrumentation
> Bytecode is not a good meta model
> Lost of management infrastructure is needed—Hook composition—Synthesized elements (hooks) vs original code—Mapping to source elements
> Bytecode is optimized—e.g. no ifTrue:
58

Smalltalk Mechanisms
Simulation
59

© Oscar Nierstrasz
ST — Working with Bytecode
Parsing and Interpretation
> First step: Parse bytecode—enough for easy analysis, pretty printing, decompilation
> Second step: Interpretation—needed for simulation, complex analyis (e.g., profiling)
> Pharo provides frameworks for both:—InstructionStream/InstructionClient (parsing)—ContextPart (Interpretation)
60

© Oscar Nierstrasz
ST — Working with Bytecode
The InstructionStream Hierarchy
InstructionStream! ContextPart! ! BlockContext! ! MethodContext! Decompiler! InstructionPrinter! InstVarRefLocator! BytecodeDecompiler
61

© Oscar Nierstrasz
ST — Working with Bytecode
InstructionStream
> Parses the byte-encoded instructions> State:
—pc: program counter—sender: the method (bad name!)
Object subclass: #InstructionStream! instanceVariableNames: 'sender pc'! classVariableNames: 'SpecialConstants'! poolDictionaries: ''! category: 'Kernel-Methods'
62
© Oscar Nierstrasz
ST — Working with Bytecode
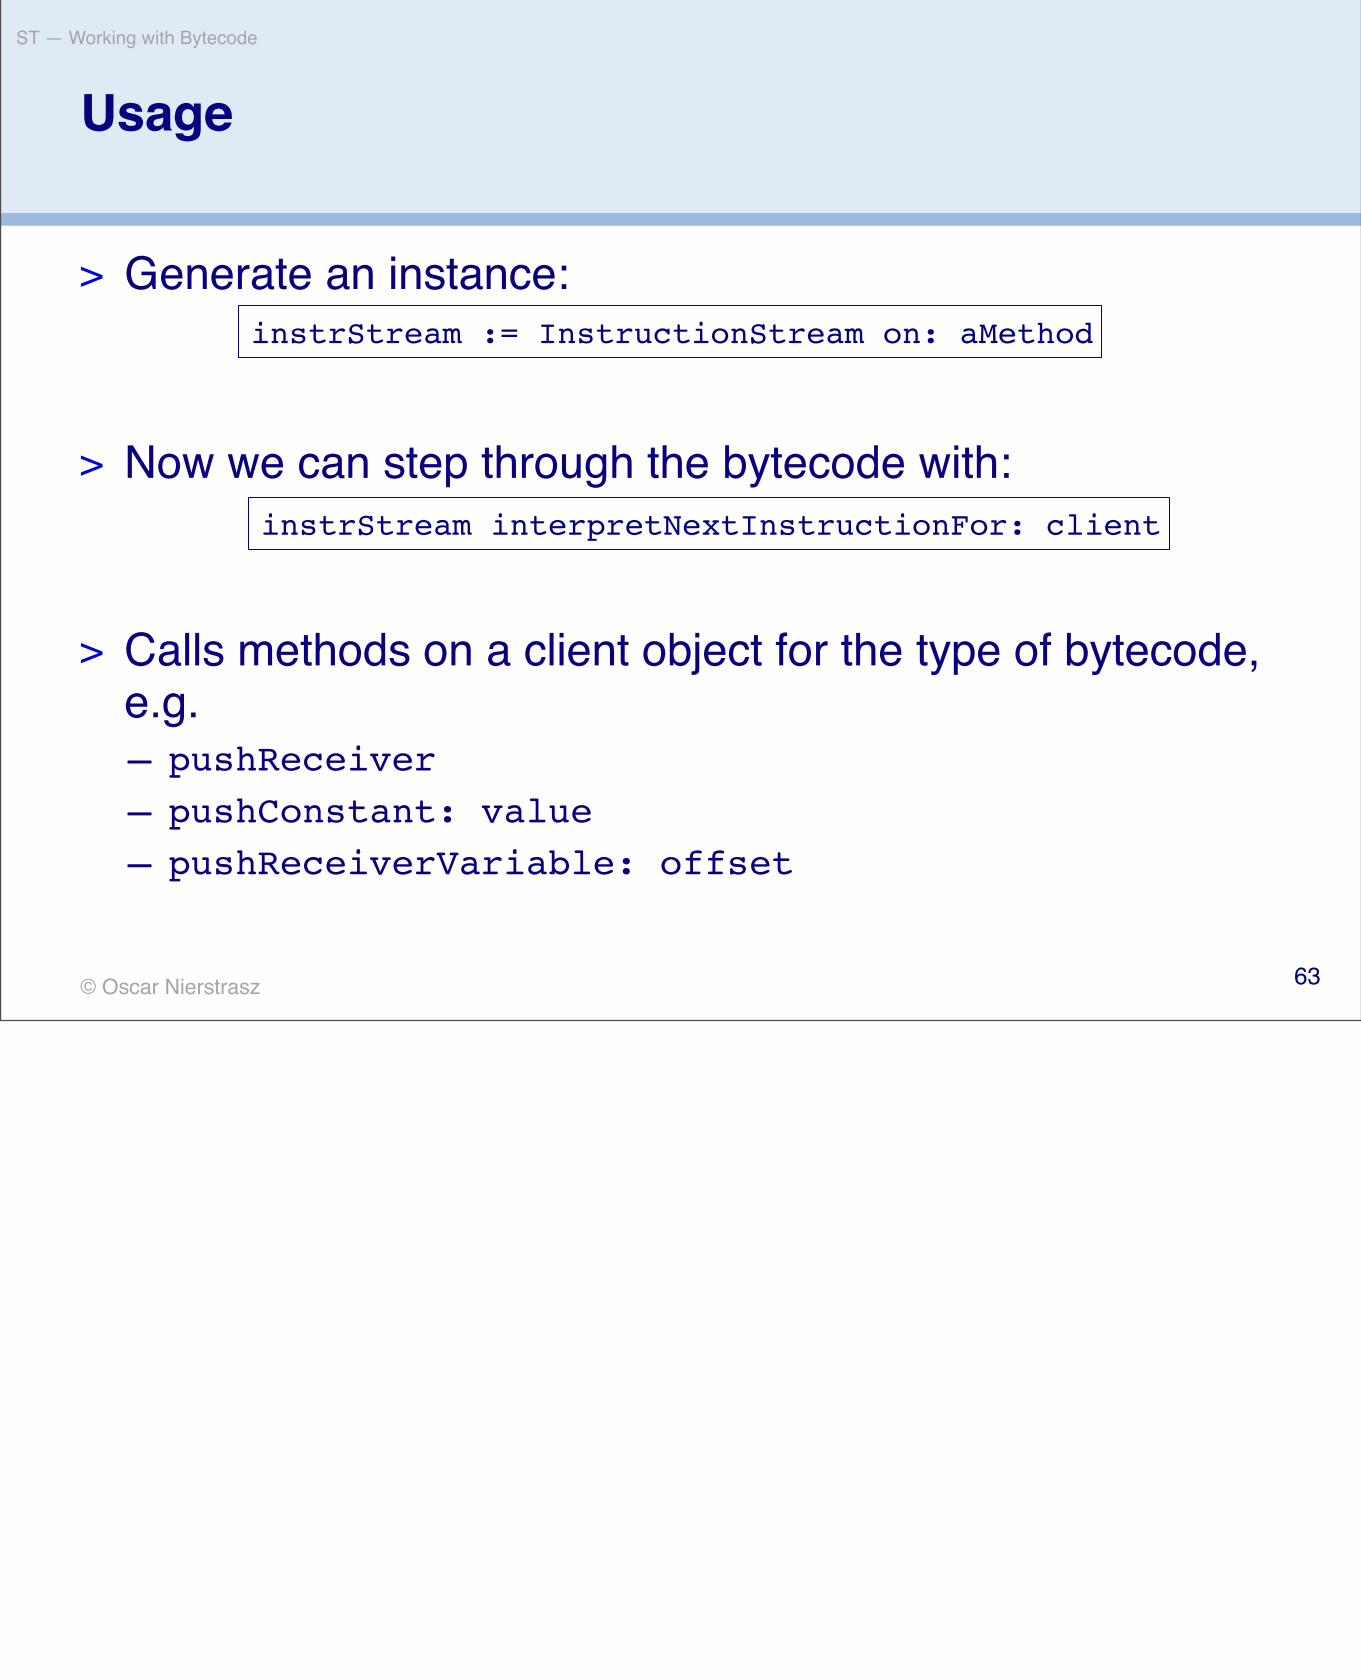
> Generate an instance:
> Now we can step through the bytecode with:
> Calls methods on a client object for the type of bytecode, e.g. — pushReceiver— pushConstant: value— pushReceiverVariable: offset
Usage
instrStream := InstructionStream on: aMethod
instrStream interpretNextInstructionFor: client
63

© Oscar Nierstrasz
ST — Working with Bytecode
InstructionClient
> Abstract superclass—Defines empty methods for all methods that InstructionStream calls
on a client> For convenience:
—Clients don’t need to inherit from this class
Object subclass: #InstructionClient! instanceVariableNames: ''! classVariableNames: ''! poolDictionaries: ''! category: 'Kernel-Methods'
64

© Oscar Nierstrasz
ST — Working with Bytecode
Example: A test
InstructionClientTest>>testInstructions! "just interpret all of methods of Object"! | methods client scanner|!! methods := Object methodDict values. ! client := InstructionClient new.!
! methods do: [:method |! ! scanner := (InstructionStream on: method).! ! [scanner pc <= method endPC] whileTrue: [! ! ! ! self shouldnt:! ! ! ! ! ! [scanner interpretNextInstructionFor: client]! ! ! ! ! raise: Error.! ! ].! ].
65

© Oscar Nierstrasz
ST — Working with Bytecode
Example: Printing Bytecode
> InstructionPrinter:—Print the bytecodes as human readable text
> Example:—print the bytecode of Number>>asInteger:
String streamContents:! [:str | (InstructionPrinter on: Number>>#asInteger)! ! ! ! printInstructionsOn: str ]
'9 <70> self10 <D0> send: truncated11 <7C> returnTop'
66

© Oscar Nierstrasz
ST — Working with Bytecode
InstructionPrinter
> Class Definition:
InstructionClient subclass: #InstructionPrinter! instanceVariableNames: 'method scanner stream indent'! classVariableNames: ''! poolDictionaries: ''! category: 'Kernel-Methods'
67
© Oscar Nierstrasz
ST — Working with Bytecode
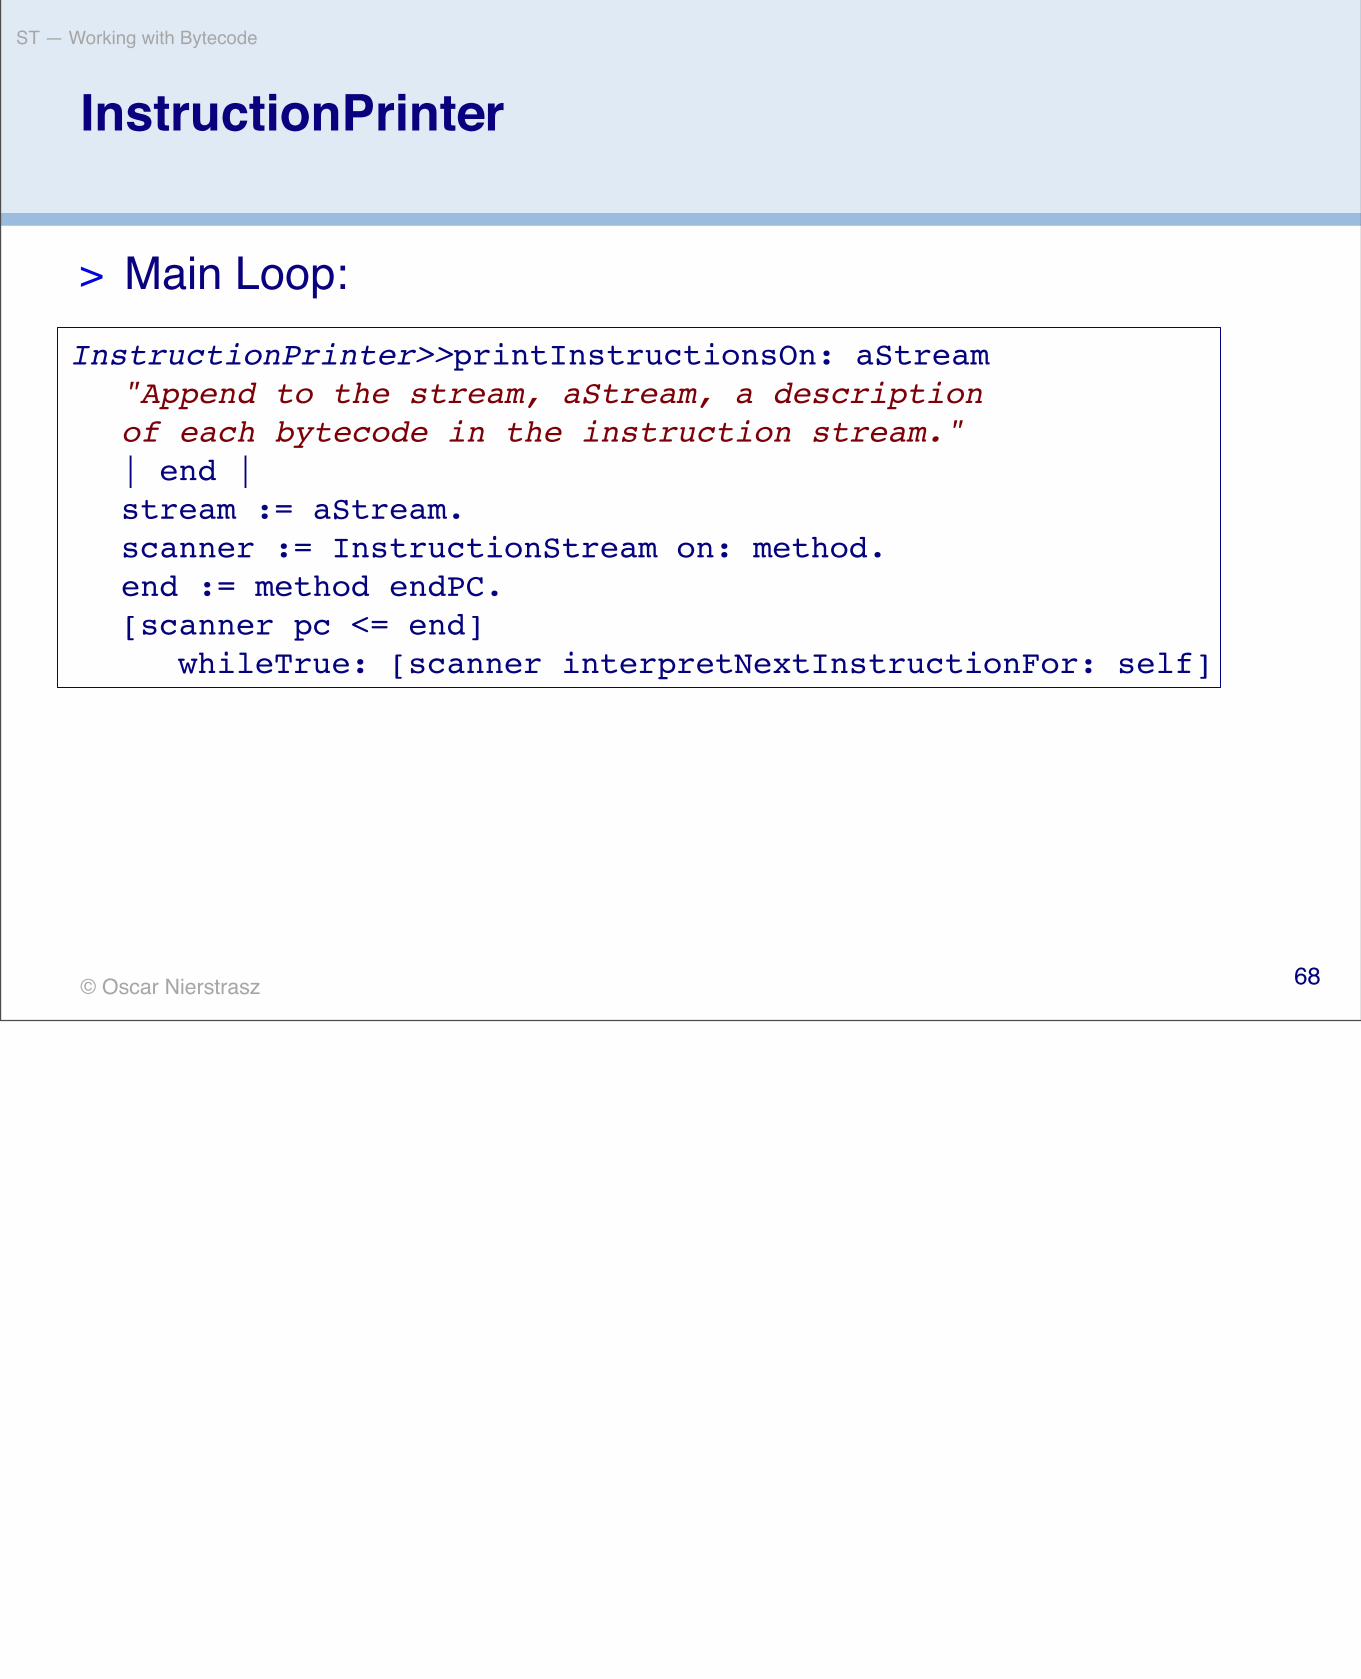
InstructionPrinter
> Main Loop:InstructionPrinter>>printInstructionsOn: aStream ! "Append to the stream, aStream, a description! of each bytecode in the instruction stream."! | end |! stream := aStream.! scanner := InstructionStream on: method.! end := method endPC.! [scanner pc <= end]! ! whileTrue: [scanner interpretNextInstructionFor: self]
68

© Oscar Nierstrasz
ST — Working with Bytecode
InstructionPrinter
> Overwrites methods from InstructionClient to print the bytecodes as text
> e.g. the method for pushReceiver
InstructionPrinter>>pushReceiver! "Print the Push Active Context's Receiver ! on Top Of Stack bytecode."
! self print: 'self'
69

© Oscar Nierstrasz
ST — Working with Bytecode
Example: InstVarRefLocator
InstructionClient subclass: #InstVarRefLocator! instanceVariableNames: 'bingo'! classVariableNames: ''! poolDictionaries: ''! category: 'Kernel-Methods'
InstVarRefLocator>>interpretNextInstructionUsing: aScanner !! bingo := false.! aScanner interpretNextInstructionFor: self.! ^bingo
InstVarRefLocator>>popIntoReceiverVariable: offset ! bingo := true
InstVarRefLocator>>pushReceiverVariable: offset! bingo := true
InstVarRefLocator>>storeIntoReceiverVariable: offset ! bingo := true
70

© Oscar Nierstrasz
ST — Working with Bytecode
InstVarRefLocator
> Analyse a method, answer true if it references an instance variable
CompiledMethod>>hasInstVarRef! "Answer whether the receiver references an instance variable."
! | scanner end printer |
! scanner := InstructionStream on: self.! printer := InstVarRefLocator new.! end := self endPC.
! [scanner pc <= end] whileTrue:! ! [ (printer interpretNextInstructionUsing: scanner)! ! ! ifTrue: [^true]. ].! ^false
71

© Oscar Nierstrasz
ST — Working with Bytecode
InstVarRefLocator
> Example for a simple bytecode analyzer> Usage:
> (has reference to variable testSelector)
> (has no reference to a variable)
aMethod hasInstVarRef
(TestCase>>#debug) hasInstVarRef
(Integer>>#+) hasInstVarRef
true
false
72
© Oscar Nierstrasz
ST — Working with Bytecode
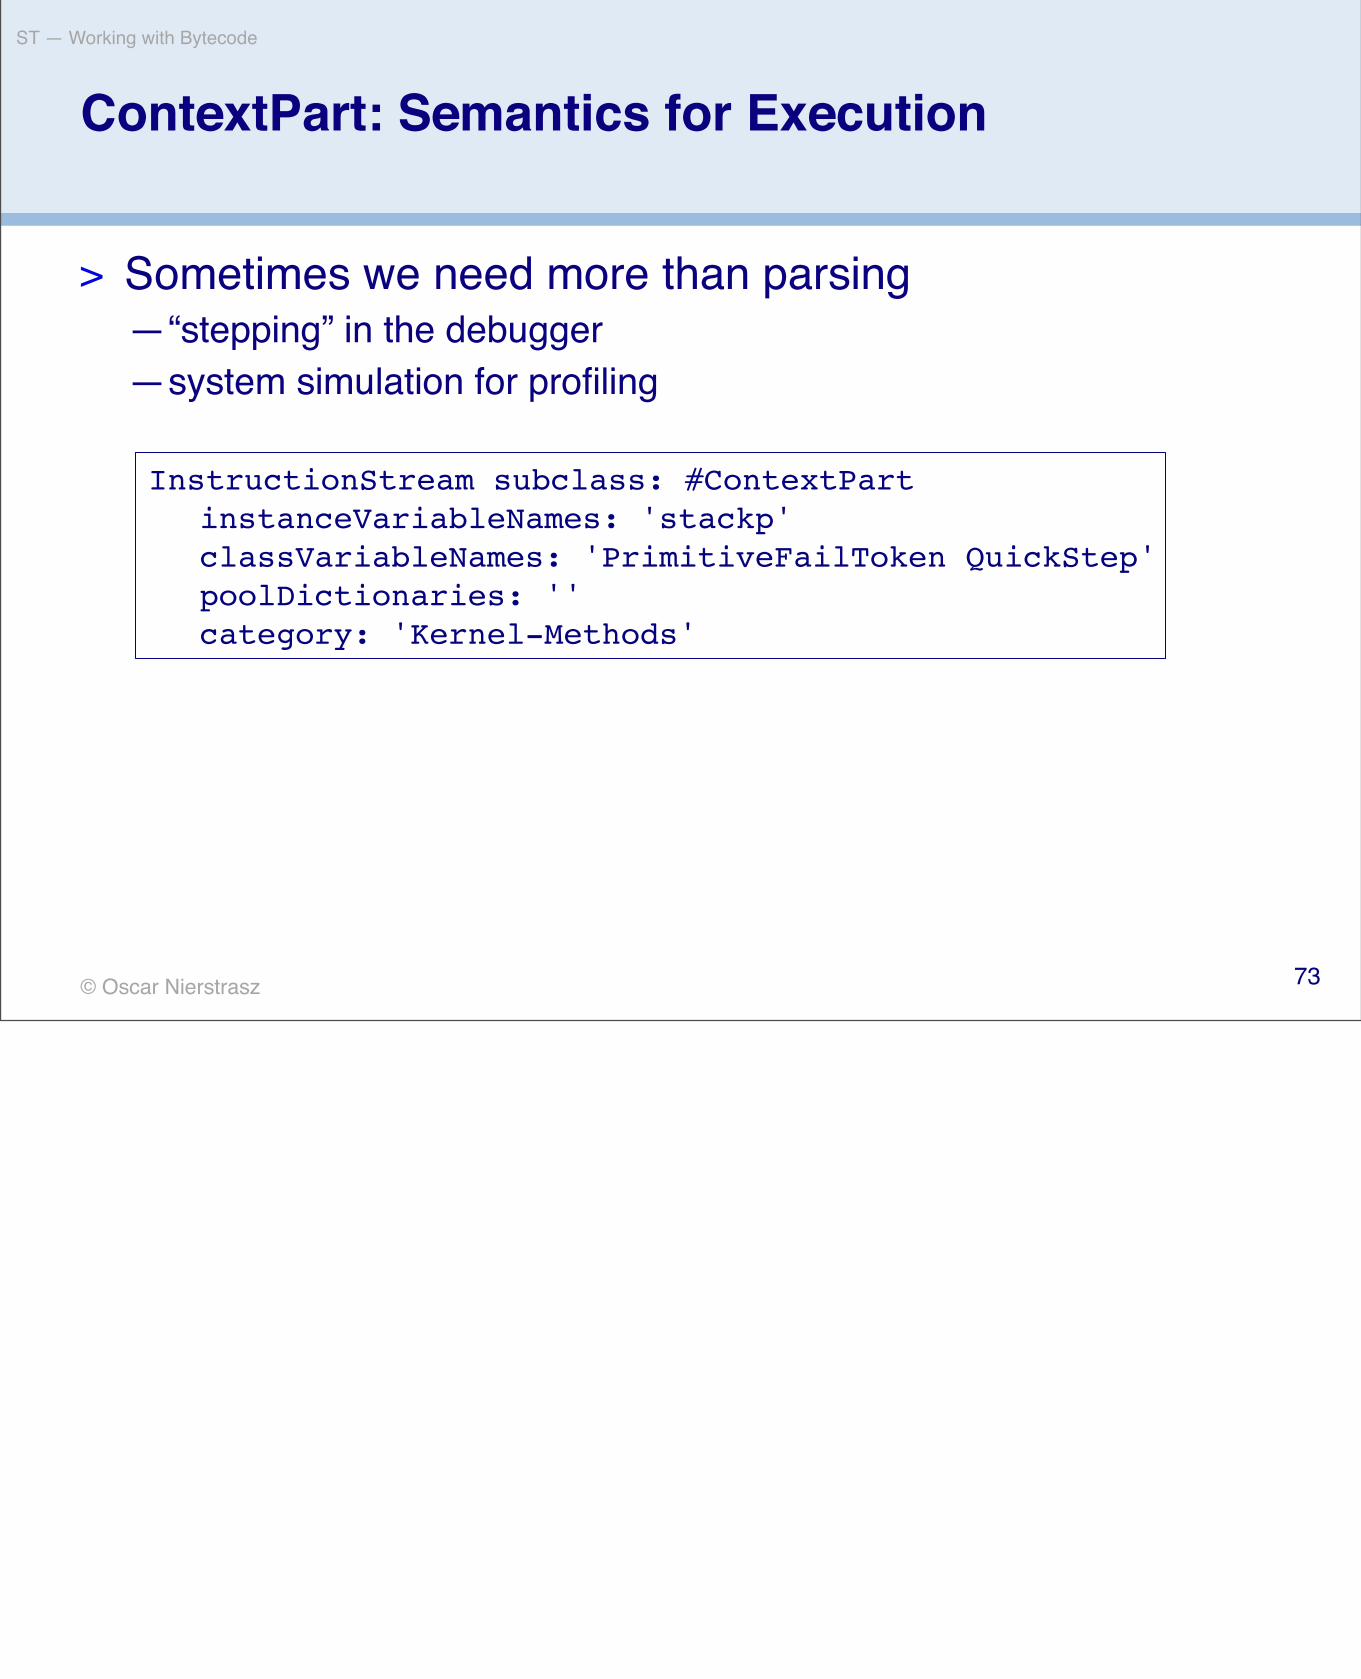
ContextPart: Semantics for Execution
> Sometimes we need more than parsing—“stepping” in the debugger—system simulation for profiling
InstructionStream subclass: #ContextPart! instanceVariableNames: 'stackp'! classVariableNames: 'PrimitiveFailToken QuickStep'! poolDictionaries: ''! category: 'Kernel-Methods'
73

© Oscar Nierstrasz
ST — Working with Bytecode
Simulation
> Provides a complete Bytecode interpreter
> Run a block with the simulator:
(ContextPart runSimulated: [3 factorial]) 6
74

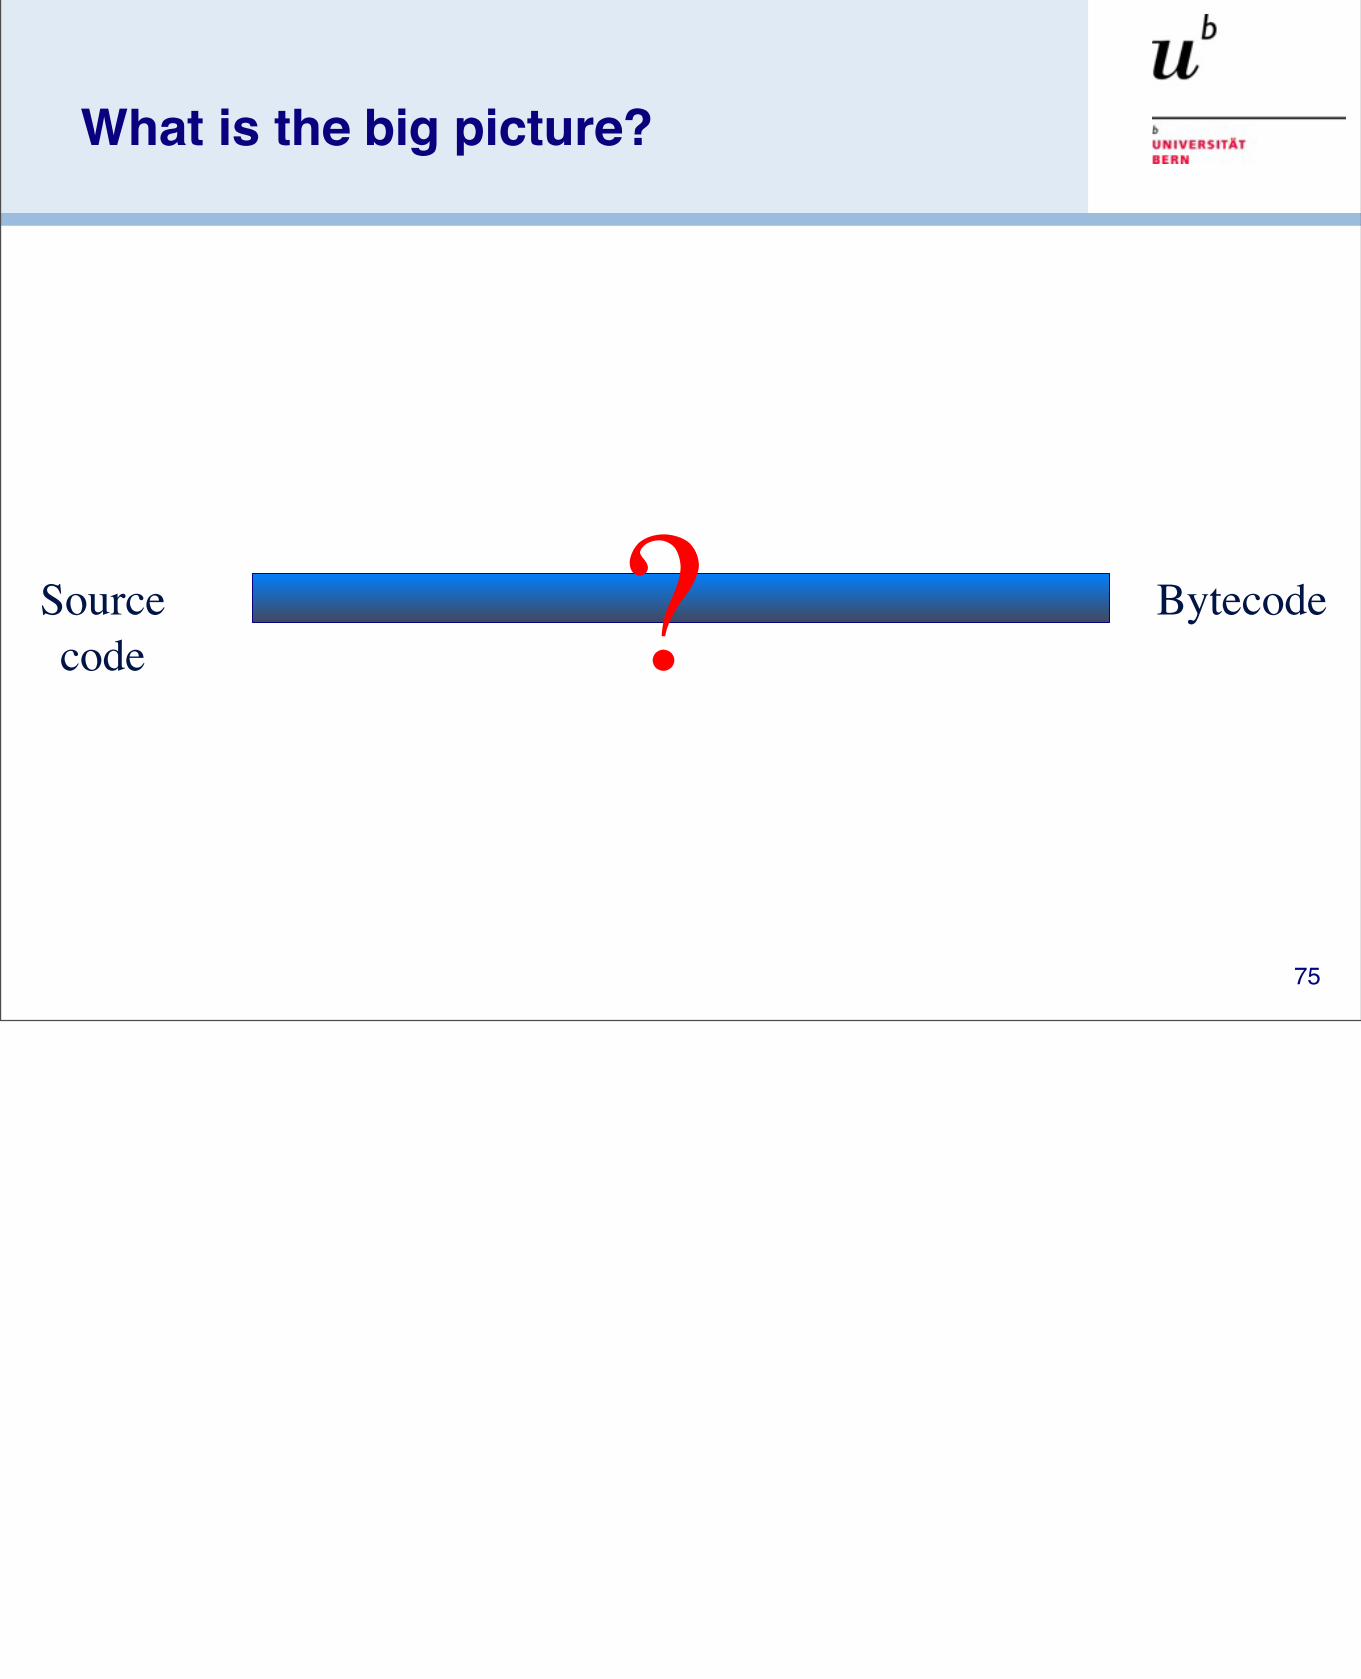
What is the big picture?
BytecodeSourcecode
75
What is the big picture?
BytecodeSourcecode ?
75

AST Instrumentation
code AST ASTScanner/ Parser
SemanticAnalysis BytecodeCode
Generation
76

Reflectivity
> Marcus Denker—Pharo Smalltalk—Geppetto 2—Phersephone
> Using Partial Behavioral Reflection Model—Reflex, Tanter etal.
77

Compiler: AST
> AST: Abstract Syntax Tree—Encodes the Syntax as a Tree—No semantics yet! —Uses the RB Tree:
– Visitors– Backward pointers in ParseNodes – Transformation (replace/add/delete)– Pattern-directed TreeRewriter – PrettyPrinter
RBProgramNode! RBDoItNode! RBMethodNode! RBReturnNode! RBSequenceNode! RBValueNode! ! RBArrayNode! ! RBAssignmentNode! ! RBBlockNode! ! RBCascadeNode! ! RBLiteralNode! ! RBMessageNode! ! RBOptimizedNode! ! RBVariableNode
78

Reflectivity
source code
(AST)
meta-object
activation
condition
links
79
Links for AST nodes

Reflectivity
source code
(AST)
meta-object
activation
condition
links
Reflectivity
Denker 2008
79
Links for AST nodes

Reflectivity
source code
(AST)
meta-object
activation
condition
links
Reflectivity
Denker 2008Reflectivity
Denker 2008
79
Links for AST nodes

Reflectivity
source code
(AST)
meta-object
activation
condition
links
Reflectivity
Denker 2008Reflectivity
Denker 2008Reflectivity
Denker 2008
79
Links for AST nodes

Reflective Architecture
80

> Organize the meta-level> Explicit meta-object> Structural and Behavioral reflection> Partial Reflection> Unanticipation> Selective Reifications> No VM requirements
81

Object
Meta-object
Class
82

Object
Meta-object
Class
83

Evolved Object
Meta-object
Class
84

| aMetaObject | aMetaObject := BFBehavioralMetaObject new. aMetaObject when: (ASTExecutionEvent new) do: [ ... feature information gathering ...]. aMetaObject bindTo: self
Feature Analysis
85
http://scg.unibe.ch/research/bifrost

Implicit Problems
> Partial Reflection—We want to reflect on portions of the system
> Unanticipation—We want to reflect without having to anticipate where in the system
> Selective Reifications—We want to have runtime reifications available
> Composition—We want to be able to compose different analysis
86

Roadmap
87
> Motivation> Sources of Runtime Information> Dynamic Analysis Techniques> Advanced Dynamic Analysis Techniques> Dynamic analysis in a Reverse Engineering Context> What can we achieve with all this?> Conclusion
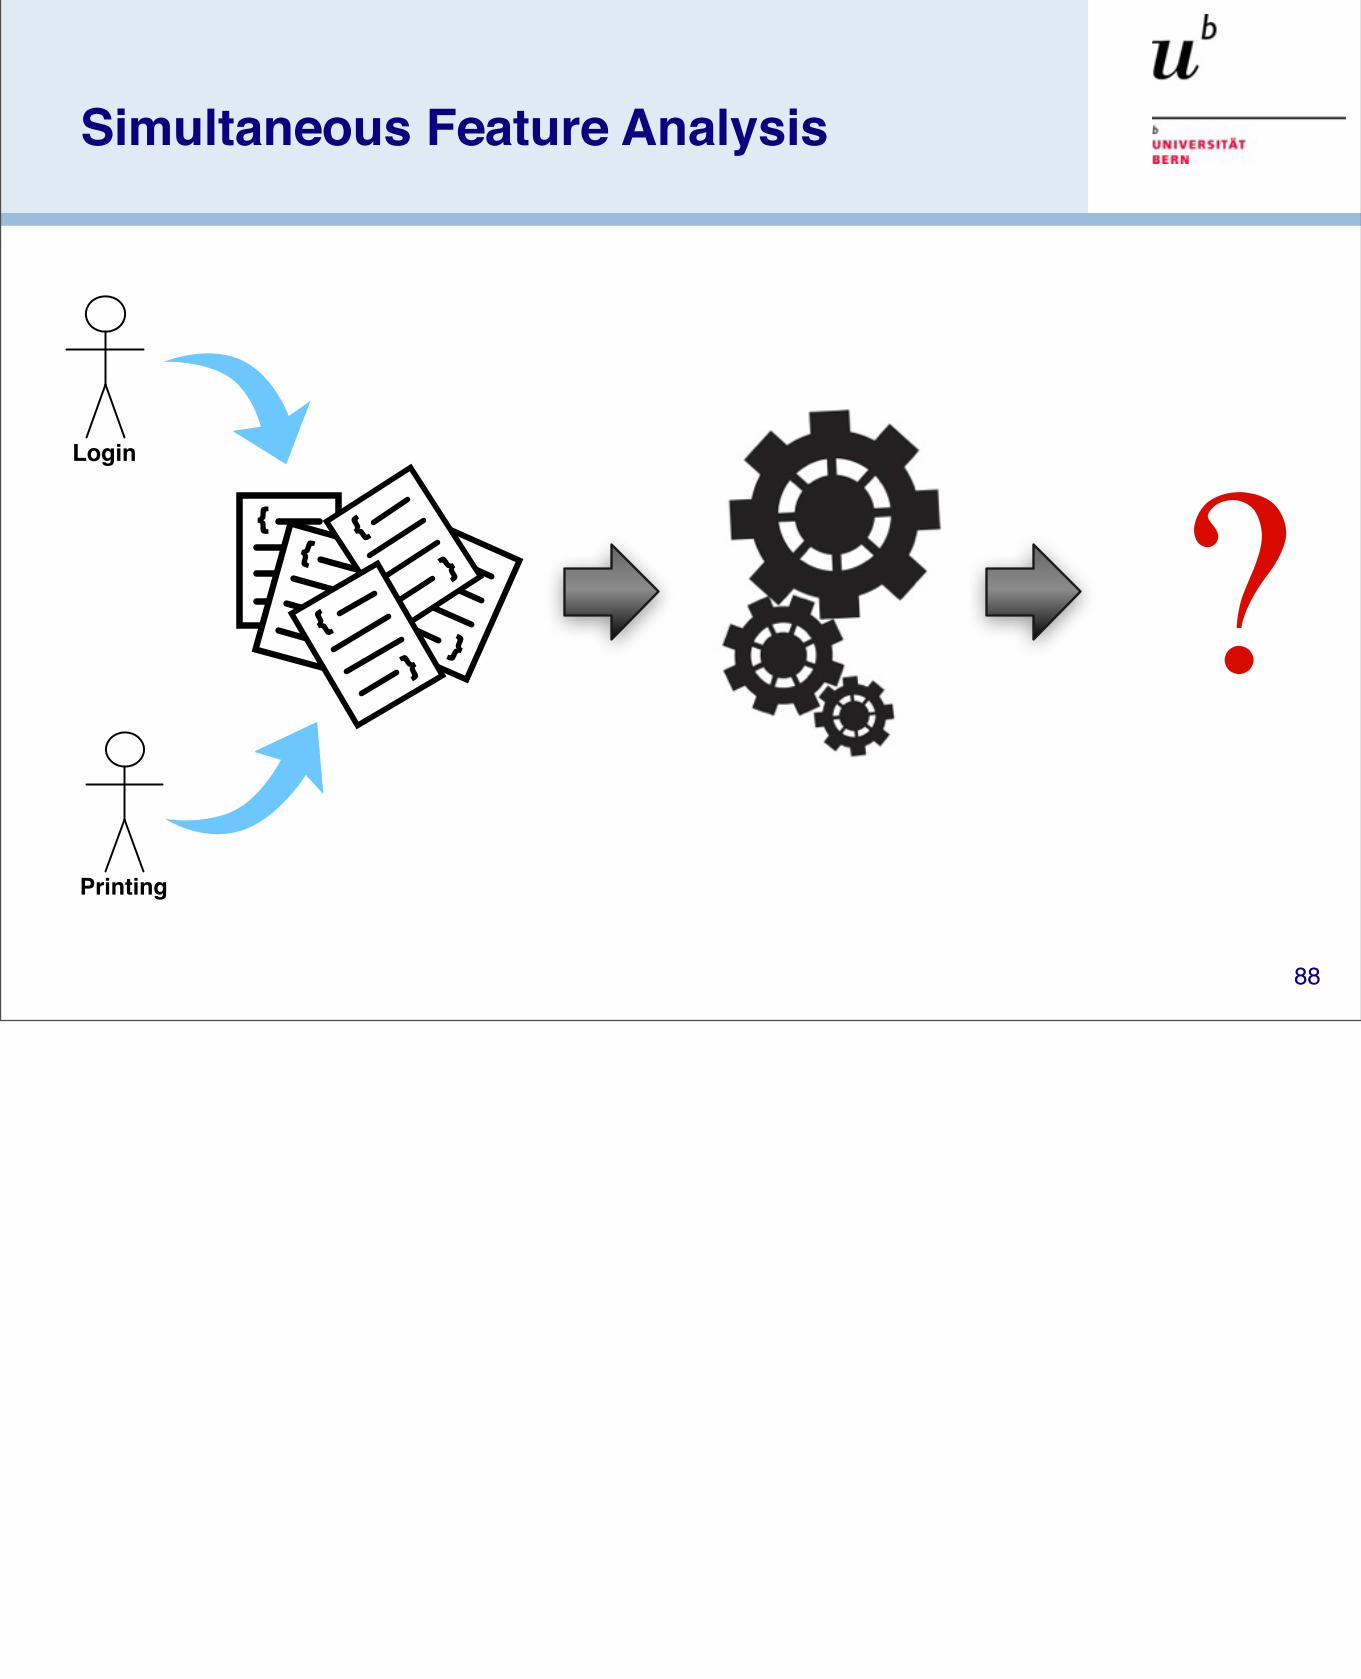
Simultaneous Feature Analysis
?}
{
}
{
}
{}
{
}
{
Login
Printing
88

Simultaneous Feature Analysis
Dynamic Scope
89

Simultaneous Feature Analysis
objectsLegend dynamic scope
90

Simultaneous Feature Analysis
objectsLegend printing featurelogin feature
91

CaesarJ
deploy(a){block}
Dynamically scoped aspects
92
Ivica Aracic, Vaidas Gasiunas, Mira Mezini, and Klaus Ostermann. An overview of CaesarJ. In Transactions on Aspect-Oriented Software Development, volume 3880 of Lecture Notes in Computer Science, pages 135–173. Springer-Verlag, February 2006.
whereby the aspect instance a sees all join points produced in the dynamic extent of the execution of block

Dynamically scoped aspects
> AspectScheme
> CaesarJ
> AspectS
93

Deployment Strategies
depl(a, δ⟨c, d, f ⟩, e)a is an aspectδ is the strategy
c stack propagation function d object propagation function f joint point filter
e is an expression
94
Éric Tanter. Expressive Scoping of Dynamically-Deployed Aspects. In Proceedings of the 7th ACM International Conference on Aspect-Oriented Software Development (AOSD 2008), p. 168—179, ACM Press, Brussels, Belgium, April 2008.
Deployment Strategies
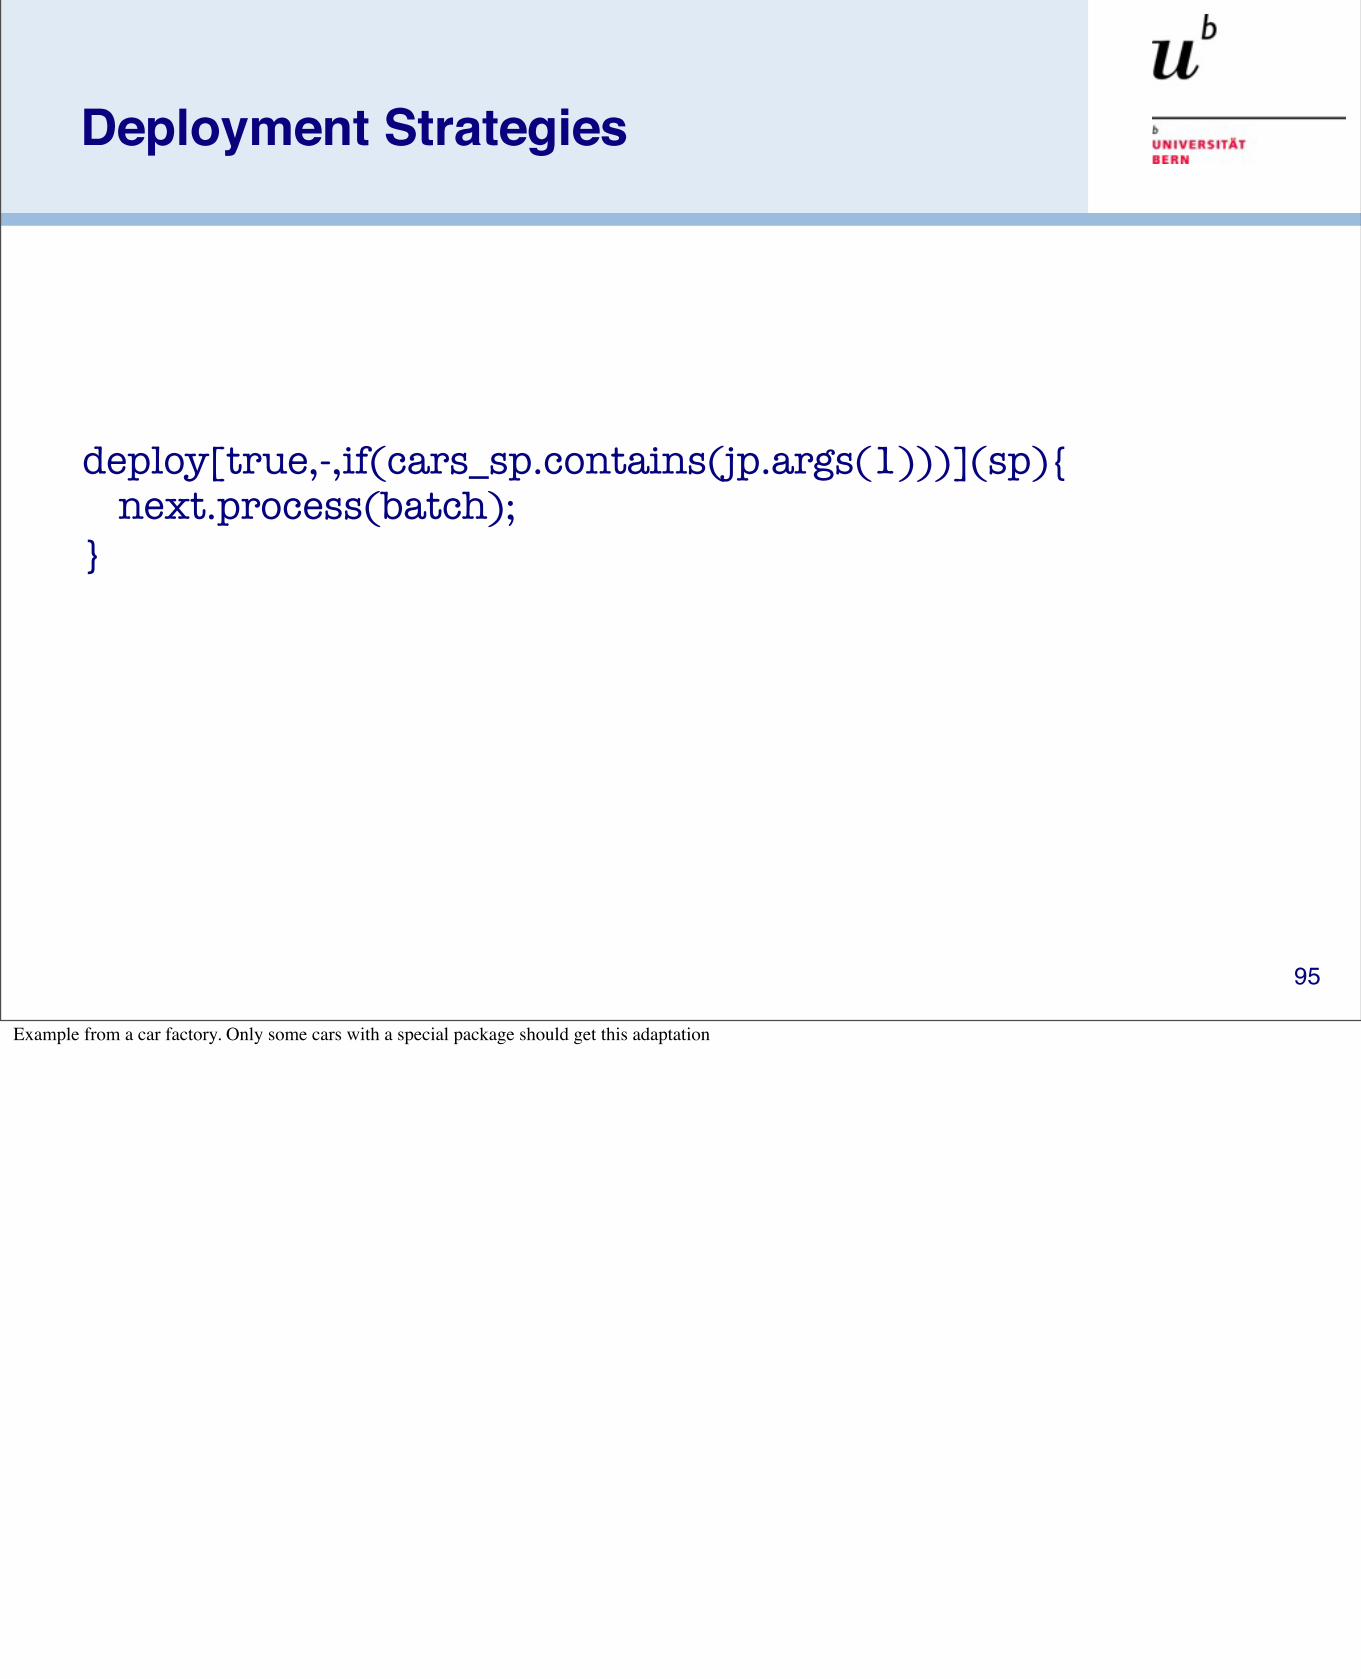
deploy[true,-,if(cars_sp.contains(jp.args(1)))](sp){ next.process(batch);
}
95
Example from a car factory. Only some cars with a special package should get this adaptation

Scoping Strategies
Propagation and Activation Problem
96
Éric Tanter. Beyond static and dynamic scope. In Proceedings of the 5th symposium on Dynamic languages, DLS '09 p. 3—14, ACM, New York, NY, USA, 2009.

Dynamic Scoping
Prisma
97

Dynamic Scoping
98

Simultaneous Feature Analysis
objectsLegend printing featurelogin feature
99
Dynamic Scoping
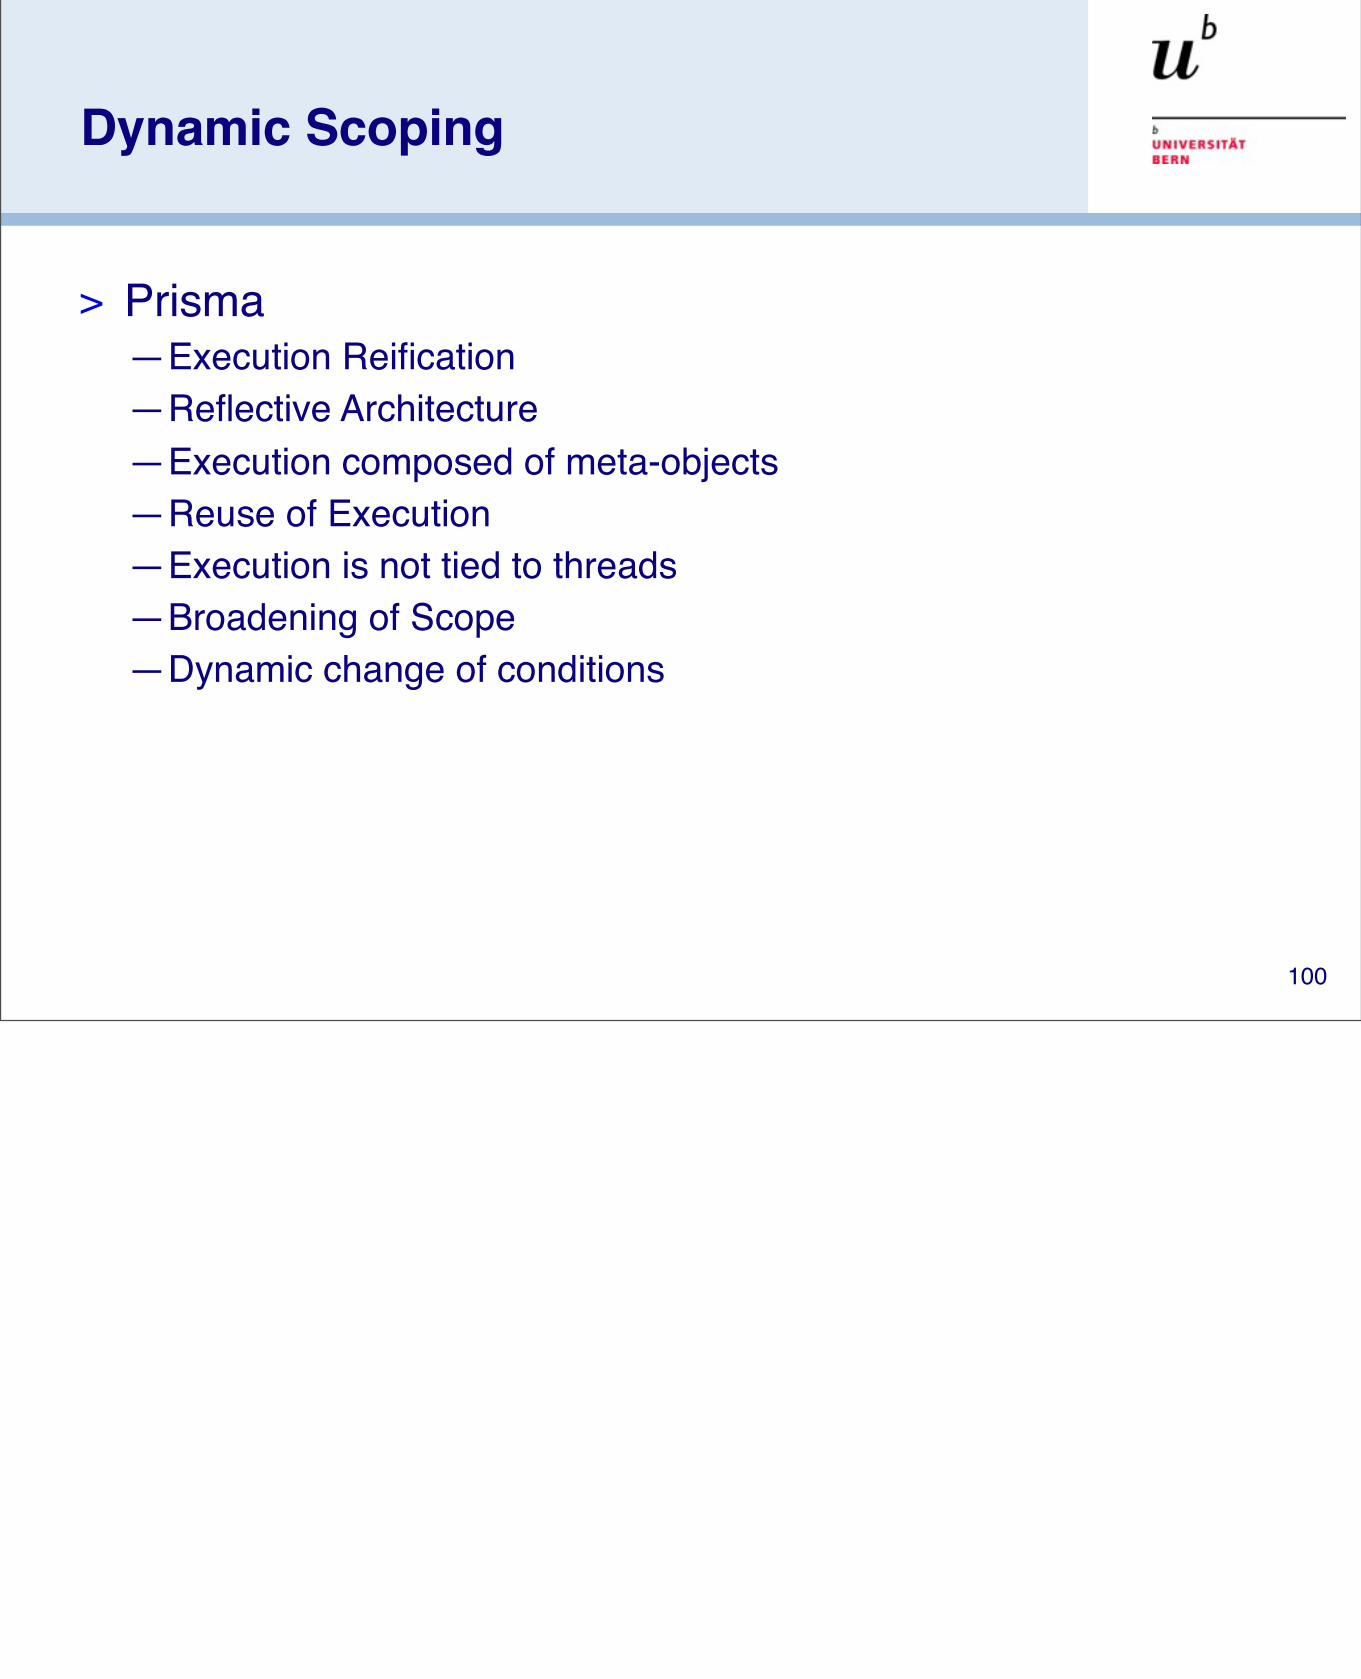
> Prisma—Execution Reification—Reflective Architecture—Execution composed of meta-objects—Reuse of Execution—Execution is not tied to threads—Broadening of Scope—Dynamic change of conditions
100

Execution levels
objectsLegend profilingfeature analysis
101

Execution levels
operation
meta-object
links
level 0
metameta-
object
link
level 1
base
meta
meta-2
Denker etal. Meta Context
102

Execution levels
> Polymorphic Bytecode Instrumentation (PBI)—Dynamic dispatch amongst several, possibly independent
instrumentations—Instrumentations are saved and indexed by a version identifier—Implemented over BCEL—JVM—Scala, JRuby, etc.—Execution levels—Monitoring—Mixin Layers—Promising performance
103
Philippe Moret, Walter Binder, and Éric Tanter. Polymorphic bytecode instrumentation. In Proceedings of the tenth international conference on Aspect-oriented software development, AOSD '11 p. 129—140, ACM, New York, NY, USA, 2011.

Scoping Dimensions
> Nature of Adaptation. A structural adaptation depicts the addition or change of a structural element, like refinements in Classboxes. A behavioral adaptation execute some action when specific runtime events are triggered.
> Scoped Definition. The boundaries of the scope are defined by the entry and exit points. These boundaries can be implicit or explicit.
> Scope Information Exposure. Some approaches allow to bind a value to a variable which is bound to the scope. This trait is particularly important to provide reusable adaptations.
> Scope Binding. There are two binding dimensions. The adaptation can be defined at compile time or at runtime, this is call binding time. The binding mode describes wether an adaptation can be undone/redone during execution, if so the binding mode is said to be dynamic otherwise is static.
> Thread Locality. The scope can be defined locally to a single thread. For example, cflow in AspectJ is by default thread local, while tracematch in AspectJ extension is by default global.
104

Roadmap
105
> Motivation> Sources of Runtime Information> Dynamic Analysis Techniques> Advanced Dynamic Analysis Techniques> Dynamic analysis in a Reverse Engineering Context> What can we achieve with all this?> Conclusion
Reverse Engineering
Revers
e Eng
ineeri
ngstatic view
106
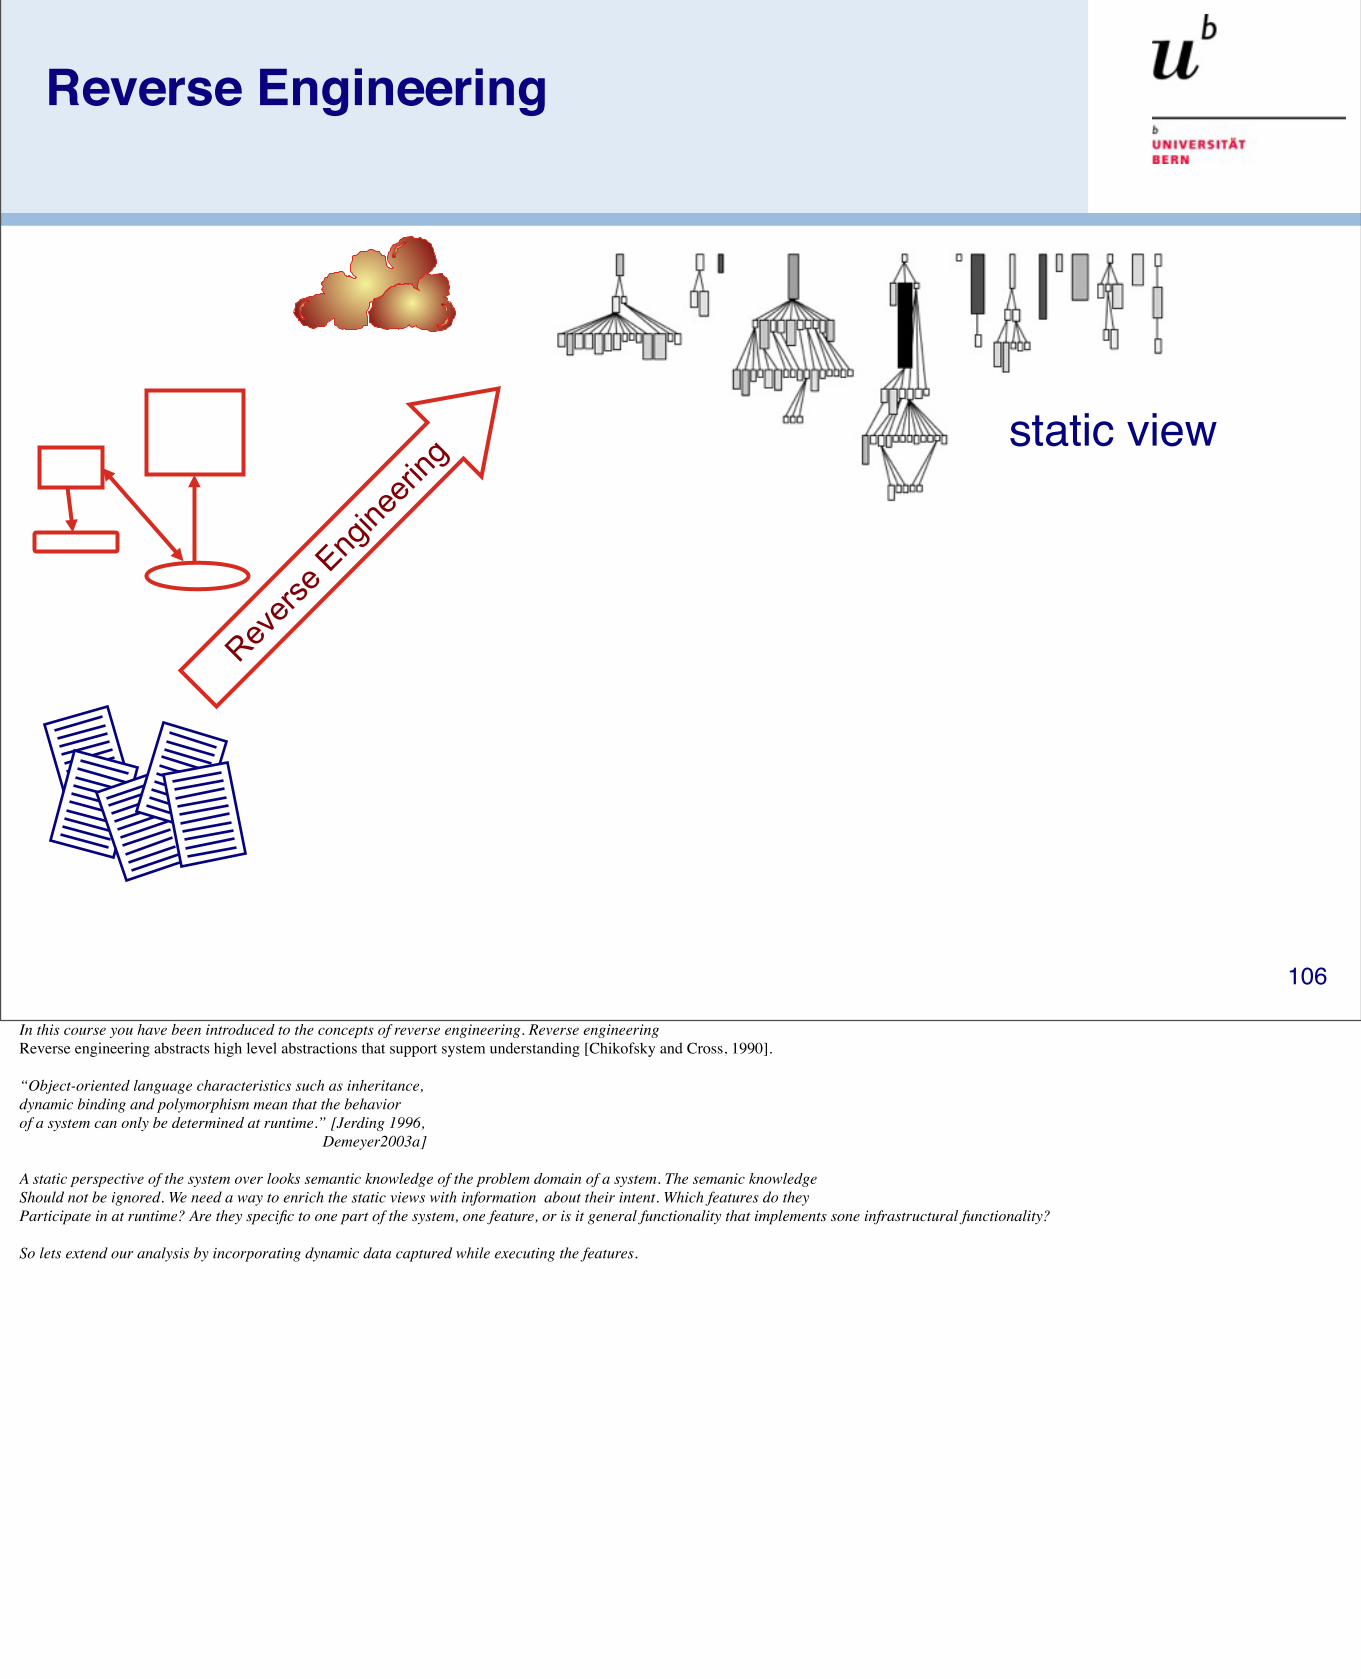
In this course you have been introduced to the concepts of reverse engineering. Reverse engineering Reverse engineering abstracts high level abstractions that support system understanding [Chikofsky and Cross, 1990].
“Object-oriented language characteristics such as inheritance, dynamic binding and polymorphism mean that the behavior of a system can only be determined at runtime.” [Jerding 1996, Demeyer2003a]
A static perspective of the system over looks semantic knowledge of the problem domain of a system. The semanic knowledge Should not be ignored. We need a way to enrich the static views with information about their intent. Which features do they Participate in at runtime? Are they specific to one part of the system, one feature, or is it general functionality that implements sone infrastructural functionality?
So lets extend our analysis by incorporating dynamic data captured while executing the features.

Reverse Engineering
Revers
e Eng
ineeri
ngstatic view
+
execution traces dynamic view
+ Dynamic Analysis
106
In this course you have been introduced to the concepts of reverse engineering. Reverse engineering Reverse engineering abstracts high level abstractions that support system understanding [Chikofsky and Cross, 1990].
“Object-oriented language characteristics such as inheritance, dynamic binding and polymorphism mean that the behavior of a system can only be determined at runtime.” [Jerding 1996, Demeyer2003a]
A static perspective of the system over looks semantic knowledge of the problem domain of a system. The semanic knowledge Should not be ignored. We need a way to enrich the static views with information about their intent. Which features do they Participate in at runtime? Are they specific to one part of the system, one feature, or is it general functionality that implements sone infrastructural functionality?
So lets extend our analysis by incorporating dynamic data captured while executing the features.

Dynamic Analysis for Program Comprehension
Post Mortem Analysis of execution tracesMetrics Based Approaches
-Frequency Analysis [Ball, Zaidman]-Runtime Coupling Metrics based on Web mining techniques to detect key classses in a trace. [Zaidman 2005] -High-Level Polymetric Views of Condensed Run-Time Information [Ducasse, Lanza and Bertoulli 2004]
-Query-based approaches Recoverind high-level views from runtime data! ! ! [Richner and Ducasse 1999]
107
.They define an execution scenario to maximize coverage of the system and ‘preciseness’. To execute all the features.
Frequency analysis - small number of methods are responsible for a large amount of the trace. They focus on call relationships between methods to learn something about a system.
Coupling metrics:
Runtime metrics - how many methods of a class were invoked during the execution of a system.-which classes create objects-Which classes communicate with each other

Visualization of Runtime Behavior
Problem of
Large traces
[JinSight, De Pauw 1993] 108
Traces of execution behavior lead to huge execution traces of tens of thousands of events. This makes them difficult to interpret or toExtract high level views. We need techniques to reduce the volume of information without loss of details needed to answer a specific research question. For example: “Which classes and methods implement the save contact feature?”
Wim dePauw [JinSight, De Pauw 1993].
Other compression approachesUse graph algorithms to detect patterns and reduce the volume of data. Use patterns to learn something about the system behavior.

Dividing a trace into features
Feature 1 Feature 2 Feature n
109

Feature Identification is a technique to map features to source code.
“A feature is an observable unit of behavior of a system triggered by the user” [Eisenbarth etal. 2003]
Software Reconnaissance [Wilde and Scully ]Run a (1) feature exhibiting scenario and a (2) non-exhibiting scenario and compare the traces. Then browse the source code.
110
Other researchers had devised variations of software reconnaissance - Antoniol, Eisenberg etc.

Feature-Centric Analysis:3 Complementary Perspectives
F1
F3
F2
F4
F5
111
1) How are classes related to features?2) How are features related to classes?3) How are features related to each other?
We define a Feature-Affinity metric to distinguish between various levels of characterization of classes.

Feature-Centric Analysis:3 Complementary Perspectives
F1
F3
F2
F4
F5Classes Perspective
111
1) How are classes related to features?2) How are features related to classes?3) How are features related to each other?
We define a Feature-Affinity metric to distinguish between various levels of characterization of classes.

Feature-Centric Analysis:3 Complementary Perspectives
F1
F3
F2
F4
F5
Features PerspectiveClasses Perspective
111
1) How are classes related to features?2) How are features related to classes?3) How are features related to each other?
We define a Feature-Affinity metric to distinguish between various levels of characterization of classes.

Feature-Centric Analysis:3 Complementary Perspectives
F1
F3
F2
F4
F5
Features Perspective
Features RelationshipsPerspective
Classes Perspective
111
1) How are classes related to features?2) How are features related to classes?3) How are features related to each other?
We define a Feature-Affinity metric to distinguish between various levels of characterization of classes.

Dynamix - A Model for Dynamic Analysis
112

DynaMoose - An Environment for Feature Analysis
113
DynaMoose - An Environment for Feature Analysis
113

DynaMoose - An Environment for Feature Analysis
113

DynaMoose - An Environment for Feature Analysis
113

DynaMoose - An Environment for Feature Analysis
113

DynaMoose - An Environment for Feature Analysis
113

Demo of Feature Analysis - Feature Views of Classes
Feature Views of PhoneSim Classes
PhoneButtonEventBackSpace
PhoneStateContactPhoneStateContactFormEditableTextCustomTextArea
114
Here we see the feature views (of classes)Our question was “Which classes participate in the addContacts feature?”

Feature Views of ‘Phonesim’ Methods
Feature Views of PhoneSim Methods115
Which methods participate in the feature ‘addContacts()’?
22 single feature methods

Object Flow Analysis
Method execution traces do not reveal how… objects refer to each other… object references evolve
Trace and analyze object flow— Object-centric debugger: Trace
back flow from errors to code that produced the objects
— Detect object dependencies between features
116

Roadmap
117
> Motivation> Sources of Runtime Information> Dynamic Analysis Techniques> Advanced Dynamic Analysis Techniques> Dynamic analysis in a Reverse Engineering Context> What can we achieve with all this?> Conclusion

What is the future?
Live Feature Analysis
118

Live Feature Analysis
Source Traces
Denker etal.
119
Marcus Denker, Jorge Ressia, Orla Greevy, and Oscar Nierstrasz. Modeling Features at Runtime. In Proceedings of MODELS 2010 Part II, LNCS 6395 p. 138—152, Springer-Verlag, October 2010.

Live Feature Analysis
SourceTraces
Denker etal.
120
Marcus Denker, Jorge Ressia, Orla Greevy, and Oscar Nierstrasz. Modeling Features at Runtime. In Proceedings of MODELS 2010 Part II, LNCS 6395 p. 138—152, Springer-Verlag, October 2010.

Live Feature Analysis
source code (AST)
Feature tagger meta-object
tags node with feature annotation
on execution
121

What is the future?
Object Centric Debugging
122

Object Centric Debugging
}
{
}
{
}
{}
{
}
{
http://scg.unibe.ch/research/bifrost/OCD 123
Marcus Denker, Jorge Ressia, Orla Greevy, and Oscar Nierstrasz. Modeling Features at Runtime. In Proceedings of MODELS 2010 Part II, LNCS 6395 p. 138—152, Springer-Verlag, October 2010.

Object Centric Debugging
}
{
}
{
}
{}
{
}
{
http://scg.unibe.ch/research/bifrost/OCD 123
Marcus Denker, Jorge Ressia, Orla Greevy, and Oscar Nierstrasz. Modeling Features at Runtime. In Proceedings of MODELS 2010 Part II, LNCS 6395 p. 138—152, Springer-Verlag, October 2010.

Object Centric Debugging
http://scg.unibe.ch/research/bifrost/OCD
}
{
}
{
}
{}
{
}
{
124
Marcus Denker, Jorge Ressia, Orla Greevy, and Oscar Nierstrasz. Modeling Features at Runtime. In Proceedings of MODELS 2010 Part II, LNCS 6395 p. 138—152, Springer-Verlag, October 2010.

Object Centric Debugging
Object>>haltAtNextMessage | aMetaObject | aMetaObject := BFBehavioralMetaObject new. aMetaObject when: (BFMessageReceiveEvent new) do: [ self metaObject unbindFrom: self.
TransparentBreakpoint signal ]. aMetaObject bindTo: self
125

What is the future?
MetaSpyDomain-specific
Profiling126

Domain-specific Profiling
http://scg.unibe.ch/research/bifrost/metaspy
Profile
}
{
}
{
}
{}
{
}
{
Domain-Specific Profiling 3
CPU time profiling
Mondrian [9] is an open and agile visualization engine. Mondrian describes avisualization using a graph of (possibly nested) nodes and edges. In June 2010a serious performance issue was raised1. Tracking down the cause of the poorperformance was not trivial. We first used a standard sample-based profiler.
Execution sampling approximates the time spent in an application’s methodsby periodically stopping a program and recording the current set of methodsunder executions. Such a profiling technique is relatively accurate since it haslittle impact on the overall execution. This sampling technique is used by almostall mainstream profilers, such as JProfiler, YourKit, xprof [10], and hprof.
MessageTally, the standard sampling-based profiler in Pharo Smalltalk2, tex-tually describes the execution in terms of CPU consumption and invocation foreach method of Mondrian:
54.8% {11501ms} MOCanvas>>drawOn:54.8% {11501ms} MORoot(MONode)>>displayOn:30.9% {6485ms} MONode>>displayOn:
| 18.1% {3799ms} MOEdge>>displayOn:...
| 8.4% {1763ms} MOEdge>>displayOn:| | 8.0% {1679ms} MOStraightLineShape>>display:on:| | 2.6% {546ms} FormCanvas>>line:to:width:color:...
23.4% {4911ms} MOEdge>>displayOn:...
We can observe that the virtual machine spent about 54% of its time inthe method displayOn: defined in the class MORoot. A root is the unique non-nested node that contains all the nodes of the edges of the visualization. Thisgeneral profiling information says that rendering nodes and edges consumes agreat share of the CPU time, but it does not help in pinpointing which nodesand edges are responsible for the time spent. Not all graphical elements equallyconsume resources.
Traditional execution sampling profilers center their result on the frames ofthe execution stack and completely ignore the identity of the object that receivedthe method call and its arguments. As a consequence, it is hard to track downwhich objects cause the slowdown. For the example above, the traditional profilersays that we spent 30.9% in MONode>>displayOn: without saying which nodeswere actually refreshed too often.
Coverage
PetitParser is a parsing framework combining ideas from scannerless parsing,parser combinators, parsing expression grammars and packrat parsers to modelgrammars and parsers as objects that can be reconfigured dynamically [11].
1 http://forum.world.st/Mondrian-is-slow-next-step-tc2257050.html#a2261116
2 http://www.pharo-project.org/
127
Alexandre Bergel, Oscar Nierstrasz, Lukas Renggli, and Jorge Ressia. Domain-Specific Profiling. In Proceedings of the 49th International Conference on Objects, Models, Components and Patterns (TOOLS'11), LNCS 6705 p. 68—82, Springer-Verlag, June 2011.

Domain-specific Profiling
http://scg.unibe.ch/research/bifrost/metaspy
Domain
Profile
}
{
}
{
}
{}
{
}
{
Domain-Specific Profiling 3
CPU time profiling
Mondrian [9] is an open and agile visualization engine. Mondrian describes avisualization using a graph of (possibly nested) nodes and edges. In June 2010a serious performance issue was raised1. Tracking down the cause of the poorperformance was not trivial. We first used a standard sample-based profiler.
Execution sampling approximates the time spent in an application’s methodsby periodically stopping a program and recording the current set of methodsunder executions. Such a profiling technique is relatively accurate since it haslittle impact on the overall execution. This sampling technique is used by almostall mainstream profilers, such as JProfiler, YourKit, xprof [10], and hprof.
MessageTally, the standard sampling-based profiler in Pharo Smalltalk2, tex-tually describes the execution in terms of CPU consumption and invocation foreach method of Mondrian:
54.8% {11501ms} MOCanvas>>drawOn:54.8% {11501ms} MORoot(MONode)>>displayOn:30.9% {6485ms} MONode>>displayOn:
| 18.1% {3799ms} MOEdge>>displayOn:...
| 8.4% {1763ms} MOEdge>>displayOn:| | 8.0% {1679ms} MOStraightLineShape>>display:on:| | 2.6% {546ms} FormCanvas>>line:to:width:color:...
23.4% {4911ms} MOEdge>>displayOn:...
We can observe that the virtual machine spent about 54% of its time inthe method displayOn: defined in the class MORoot. A root is the unique non-nested node that contains all the nodes of the edges of the visualization. Thisgeneral profiling information says that rendering nodes and edges consumes agreat share of the CPU time, but it does not help in pinpointing which nodesand edges are responsible for the time spent. Not all graphical elements equallyconsume resources.
Traditional execution sampling profilers center their result on the frames ofthe execution stack and completely ignore the identity of the object that receivedthe method call and its arguments. As a consequence, it is hard to track downwhich objects cause the slowdown. For the example above, the traditional profilersays that we spent 30.9% in MONode>>displayOn: without saying which nodeswere actually refreshed too often.
Coverage
PetitParser is a parsing framework combining ideas from scannerless parsing,parser combinators, parsing expression grammars and packrat parsers to modelgrammars and parsers as objects that can be reconfigured dynamically [11].
1 http://forum.world.st/Mondrian-is-slow-next-step-tc2257050.html#a2261116
2 http://www.pharo-project.org/
127
Alexandre Bergel, Oscar Nierstrasz, Lukas Renggli, and Jorge Ressia. Domain-Specific Profiling. In Proceedings of the 49th International Conference on Objects, Models, Components and Patterns (TOOLS'11), LNCS 6705 p. 68—82, Springer-Verlag, June 2011.
Domain-specific Profiling
http://scg.unibe.ch/research/bifrost/metaspy
Profile
}
{
}
{
}
{}
{
}
{
Domain-Specific Profiling 3
CPU time profiling
Mondrian [9] is an open and agile visualization engine. Mondrian describes avisualization using a graph of (possibly nested) nodes and edges. In June 2010a serious performance issue was raised1. Tracking down the cause of the poorperformance was not trivial. We first used a standard sample-based profiler.
Execution sampling approximates the time spent in an application’s methodsby periodically stopping a program and recording the current set of methodsunder executions. Such a profiling technique is relatively accurate since it haslittle impact on the overall execution. This sampling technique is used by almostall mainstream profilers, such as JProfiler, YourKit, xprof [10], and hprof.
MessageTally, the standard sampling-based profiler in Pharo Smalltalk2, tex-tually describes the execution in terms of CPU consumption and invocation foreach method of Mondrian:
54.8% {11501ms} MOCanvas>>drawOn:54.8% {11501ms} MORoot(MONode)>>displayOn:30.9% {6485ms} MONode>>displayOn:
| 18.1% {3799ms} MOEdge>>displayOn:...
| 8.4% {1763ms} MOEdge>>displayOn:| | 8.0% {1679ms} MOStraightLineShape>>display:on:| | 2.6% {546ms} FormCanvas>>line:to:width:color:...
23.4% {4911ms} MOEdge>>displayOn:...
We can observe that the virtual machine spent about 54% of its time inthe method displayOn: defined in the class MORoot. A root is the unique non-nested node that contains all the nodes of the edges of the visualization. Thisgeneral profiling information says that rendering nodes and edges consumes agreat share of the CPU time, but it does not help in pinpointing which nodesand edges are responsible for the time spent. Not all graphical elements equallyconsume resources.
Traditional execution sampling profilers center their result on the frames ofthe execution stack and completely ignore the identity of the object that receivedthe method call and its arguments. As a consequence, it is hard to track downwhich objects cause the slowdown. For the example above, the traditional profilersays that we spent 30.9% in MONode>>displayOn: without saying which nodeswere actually refreshed too often.
Coverage
PetitParser is a parsing framework combining ideas from scannerless parsing,parser combinators, parsing expression grammars and packrat parsers to modelgrammars and parsers as objects that can be reconfigured dynamically [11].
1 http://forum.world.st/Mondrian-is-slow-next-step-tc2257050.html#a2261116
2 http://www.pharo-project.org/
128
Alexandre Bergel, Oscar Nierstrasz, Lukas Renggli, and Jorge Ressia. Domain-Specific Profiling. In Proceedings of the 49th International Conference on Objects, Models, Components and Patterns (TOOLS'11), LNCS 6705 p. 68—82, Springer-Verlag, June 2011.

Domain-specific Profiling
http://scg.unibe.ch/research/bifrost/metaspy
Domain
Profile
}
{
}
{
}
{}
{
}
{
Domain-Specific Profiling 3
CPU time profiling
Mondrian [9] is an open and agile visualization engine. Mondrian describes avisualization using a graph of (possibly nested) nodes and edges. In June 2010a serious performance issue was raised1. Tracking down the cause of the poorperformance was not trivial. We first used a standard sample-based profiler.
Execution sampling approximates the time spent in an application’s methodsby periodically stopping a program and recording the current set of methodsunder executions. Such a profiling technique is relatively accurate since it haslittle impact on the overall execution. This sampling technique is used by almostall mainstream profilers, such as JProfiler, YourKit, xprof [10], and hprof.
MessageTally, the standard sampling-based profiler in Pharo Smalltalk2, tex-tually describes the execution in terms of CPU consumption and invocation foreach method of Mondrian:
54.8% {11501ms} MOCanvas>>drawOn:54.8% {11501ms} MORoot(MONode)>>displayOn:30.9% {6485ms} MONode>>displayOn:
| 18.1% {3799ms} MOEdge>>displayOn:...
| 8.4% {1763ms} MOEdge>>displayOn:| | 8.0% {1679ms} MOStraightLineShape>>display:on:| | 2.6% {546ms} FormCanvas>>line:to:width:color:...
23.4% {4911ms} MOEdge>>displayOn:...
We can observe that the virtual machine spent about 54% of its time inthe method displayOn: defined in the class MORoot. A root is the unique non-nested node that contains all the nodes of the edges of the visualization. Thisgeneral profiling information says that rendering nodes and edges consumes agreat share of the CPU time, but it does not help in pinpointing which nodesand edges are responsible for the time spent. Not all graphical elements equallyconsume resources.
Traditional execution sampling profilers center their result on the frames ofthe execution stack and completely ignore the identity of the object that receivedthe method call and its arguments. As a consequence, it is hard to track downwhich objects cause the slowdown. For the example above, the traditional profilersays that we spent 30.9% in MONode>>displayOn: without saying which nodeswere actually refreshed too often.
Coverage
PetitParser is a parsing framework combining ideas from scannerless parsing,parser combinators, parsing expression grammars and packrat parsers to modelgrammars and parsers as objects that can be reconfigured dynamically [11].
1 http://forum.world.st/Mondrian-is-slow-next-step-tc2257050.html#a2261116
2 http://www.pharo-project.org/
128
Alexandre Bergel, Oscar Nierstrasz, Lukas Renggli, and Jorge Ressia. Domain-Specific Profiling. In Proceedings of the 49th International Conference on Objects, Models, Components and Patterns (TOOLS'11), LNCS 6705 p. 68—82, Springer-Verlag, June 2011.

Domain-specific Profiling
129
Paradox
We claim to be doing dynamic analysis but we keep on going back to the static abstractions.
For dynamic languages the Dilemma is even worst. We are happy to have a dynamic environment like Smalltalk but, in certain way, we are trapped using the static abstractions when we should use the dynamic ones.
130

Roadmap
131
> Motivation> Sources of Runtime Information> Dynamic Analysis Techniques> Advanced Dynamic Analysis Techniques> Dynamic analysis in a Reverse Engineering Context> What can we achieve with all this?> Conclusion

Dynamic vs. Static Analysis
Static analyses extract properties that hold for all possible program runs
Dynamic analysis provides more precise information …but only for the execution under consideration
Dynamic analysis cannot show that a program satisfies a particular property, but can detect violations of the property
132

Conclusions: Pros and Cons
Dependent on input—Advantage: Input or features can be directly related to execution—Disadvantage: May fail to exercise certain important paths and poor choice of input may be unrepresentative
Broad scope: dynamic analyses follow long paths and may discover semantic dependencies between program entities widely separated in space and time
However, understanding dynamic behavior of OO systems is difficultLarge number of executed methodsExecution paths crosscut abstraction layersSide effects
133

http://creativecommons.org/licenses/by-sa/3.0/
Attribution-ShareAlike 3.0You are free:
▪ to copy, distribute, display, and perform the work▪ to make derivative works▪ to make commercial use of the work
Under the following conditions:
Attribution. You must attribute the work in the manner specified by the author or licensor.
Share Alike. If you alter, transform, or build upon this work, you may distribute the resulting work only under a license identical to this one.
▪ For any reuse or distribution, you must make clear to others the license terms of this work.▪ Any of these conditions can be waived if you get permission from the copyright holder.
Your fair use and other rights are in no way affected by the above.