Scrutiny Meeting Tuesday 23rd June...
30
Scrutiny Meeting Tuesday 23rd June 2015 Recorded Crime Region and Most Similar Group 12m to Apr-15 -v- 12m to Apr-14
Transcript of Scrutiny Meeting Tuesday 23rd June...

PROTECT
Scrutiny Meeting
Tuesday 23rd June 2015
Recorded Crime
Region and Most Similar Group
12m to Apr-15 -v- 12m to Apr-14

STCG
PROTECT
PROTECT
All Recorded Crime The Constabulary, Region and Most Similar Group
Earlier Period Later Period
May-13 to Apr-14 May-14 to Apr-15 Numeric Percentage
3,455,173 3,561,443 + 106,270 + 3.1%
449,931 473,122 + 23,191 + 5.2%
54,721 53,036 - 1,685 - 3.1%
23,915 25,285 + 1,370 + 5.7%
182,336 204,010 + 21,674 + 11.9%
95,509 92,739 - 2,770 - 2.9%
93,450 98,052 + 4,602 + 4.9%
742,376 760,853 + 18,477 + 2.5%
95,509 92,739 - 2,770 - 2.9%
82,561 89,653 + 7,092 + 8.6%
91,983 93,984 + 2,001 + 2.2%
69,412 74,220 + 4,808 + 6.9%
68,345 73,034 + 4,689 + 6.9%
66,125 65,976 - 149 - 0.2%
109,946 110,168 + 222 + 0.2%
158,495 161,079 + 2,584 + 1.6%
Number of forces in England & Wales with an increase in this category 29
Nottinghamshire
Humberside
Kent
West Yorkshire
Northumbria
England & Wales
North West Region
Cheshire
Cumbria
Greater Manchester
Lancashire
Merseyside
Most Similar Group
Lancashire
South Wales
South Yorkshire
AreasChange

STCG
PROTECT
PROTECT
Victim Based Crime The Constabulary, Region and Most Similar Group
Earlier Period Later Period
May-13 to Apr-14 May-14 to Apr-15 Numeric Percentage
3,068,030 3,165,619 + 97,589 + 3.2%
400,432 421,158 + 20,726 + 5.2%
49,060 46,594 - 2,466 - 5.0%
20,721 21,638 + 917 + 4.4%
164,456 183,597 + 19,141 + 11.6%
87,928 85,661 - 2,267 - 2.6%
78,267 83,668 + 5,401 + 6.9%
672,430 691,019 + 18,589 + 2.8%
87,928 85,661 - 2,267 - 2.6%
72,197 77,816 + 5,619 + 7.8%
84,307 86,069 + 1,762 + 2.1%
60,337 65,848 + 5,511 + 9.1%
61,550 65,451 + 3,901 + 6.3%
59,941 60,459 + 518 + 0.9%
101,113 102,563 + 1,450 + 1.4%
145,057 147,152 + 2,095 + 1.4%
Number of forces in England & Wales with an increase in this category 29
Nottinghamshire
Humberside
Kent
West Yorkshire
Northumbria
England & Wales
North West Region
Cheshire
Cumbria
Greater Manchester
Lancashire
Merseyside
Most Similar Group
Lancashire
South Wales
South Yorkshire
AreasChange
STCG
PROTECT
PROTECT
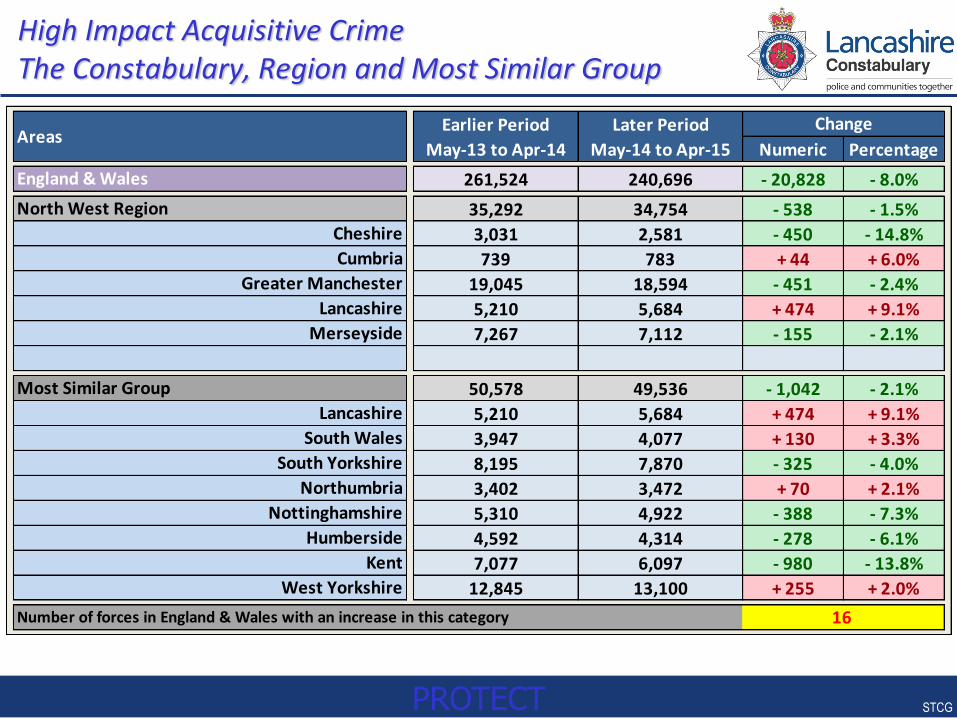
High Impact Acquisitive Crime The Constabulary, Region and Most Similar Group
Earlier Period Later Period
May-13 to Apr-14 May-14 to Apr-15 Numeric Percentage
261,524 240,696 - 20,828 - 8.0%
35,292 34,754 - 538 - 1.5%
3,031 2,581 - 450 - 14.8%
739 783 + 44 + 6.0%
19,045 18,594 - 451 - 2.4%
5,210 5,684 + 474 + 9.1%
7,267 7,112 - 155 - 2.1%
50,578 49,536 - 1,042 - 2.1%
5,210 5,684 + 474 + 9.1%
3,947 4,077 + 130 + 3.3%
8,195 7,870 - 325 - 4.0%
3,402 3,472 + 70 + 2.1%
5,310 4,922 - 388 - 7.3%
4,592 4,314 - 278 - 6.1%
7,077 6,097 - 980 - 13.8%
12,845 13,100 + 255 + 2.0%
South Yorkshire
North West Region
Cheshire
Cumbria
Greater Manchester
England & Wales
AreasChange
Lancashire
16
Northumbria
Nottinghamshire
Humberside
Kent
West Yorkshire
Number of forces in England & Wales with an increase in this category
Merseyside
Most Similar Group
Lancashire
South Wales
STCG
PROTECT
PROTECT
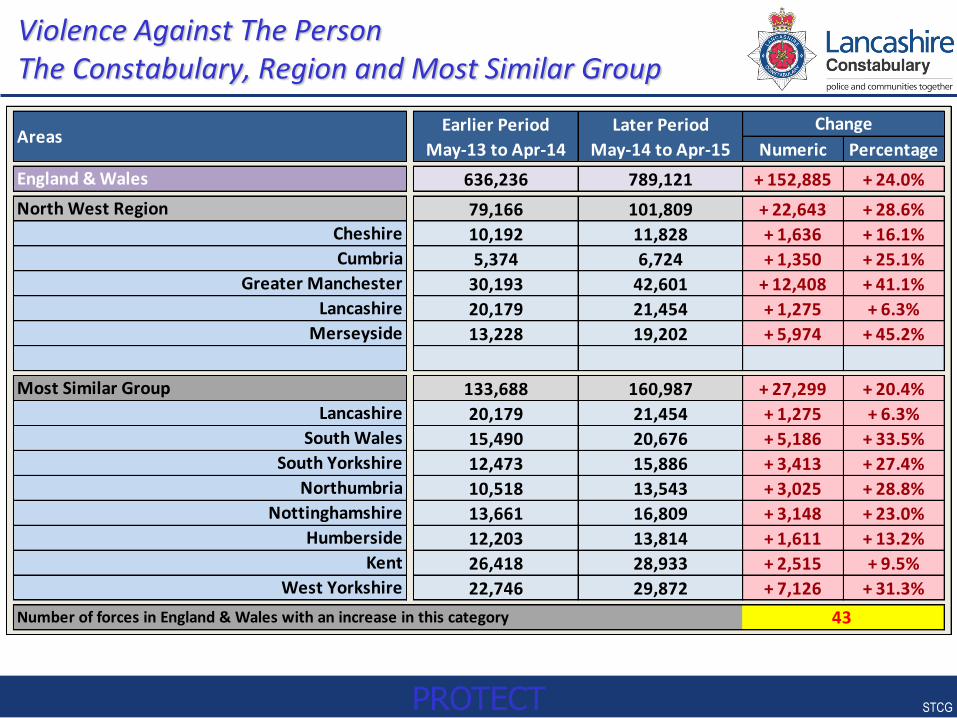
Violence Against The Person The Constabulary, Region and Most Similar Group
Earlier Period Later Period
May-13 to Apr-14 May-14 to Apr-15 Numeric Percentage
636,236 789,121 + 152,885 + 24.0%
79,166 101,809 + 22,643 + 28.6%
10,192 11,828 + 1,636 + 16.1%
5,374 6,724 + 1,350 + 25.1%
30,193 42,601 + 12,408 + 41.1%
20,179 21,454 + 1,275 + 6.3%
13,228 19,202 + 5,974 + 45.2%
133,688 160,987 + 27,299 + 20.4%
20,179 21,454 + 1,275 + 6.3%
15,490 20,676 + 5,186 + 33.5%
12,473 15,886 + 3,413 + 27.4%
10,518 13,543 + 3,025 + 28.8%
13,661 16,809 + 3,148 + 23.0%
12,203 13,814 + 1,611 + 13.2%
26,418 28,933 + 2,515 + 9.5%
22,746 29,872 + 7,126 + 31.3%
Number of forces in England & Wales with an increase in this category 43
Nottinghamshire
Humberside
Kent
West Yorkshire
Northumbria
England & Wales
North West Region
Cheshire
Cumbria
Greater Manchester
Lancashire
Merseyside
Most Similar Group
Lancashire
South Wales
South Yorkshire
AreasChange

STCG
PROTECT
PROTECT
All Sexual Offences The Constabulary, Region and Most Similar Group
Earlier Period Later Period
May-13 to Apr-14 May-14 to Apr-15 Numeric Percentage
64,566 89,785 + 25,219 + 39.1%
8,015 11,126 + 3,111 + 38.8%
945 1,190 + 245 + 25.9%
433 752 + 319 + 73.7%
3,306 5,092 + 1,786 + 54.0%
1,872 2,065 + 193 + 10.3%
1,459 2,027 + 568 + 38.9%
13,694 19,264 + 5,570 + 40.7%
1,872 2,065 + 193 + 10.3%
1,478 1,663 + 185 + 12.5%
1,584 2,569 + 985 + 62.2%
1,187 2,179 + 992 + 83.6%
1,141 1,987 + 846 + 74.1%
1,344 1,718 + 374 + 27.8%
2,325 2,680 + 355 + 15.3%
2,763 4,403 + 1,640 + 59.4%
Number of forces in England & Wales with an increase in this category 43
Nottinghamshire
Humberside
Kent
West Yorkshire
Northumbria
England & Wales
North West Region
Cheshire
Cumbria
Greater Manchester
Lancashire
Merseyside
Most Similar Group
Lancashire
South Wales
South Yorkshire
AreasChange

STCG
PROTECT
PROTECT
Racially/Religiously Aggravated Offences The Constabulary, Region and Most Similar Group
Earlier Period Later Period
May-13 to Apr-14 May-14 to Apr-15 Numeric Percentage
30,301 37,114 + 6,813 + 22.5%
4,721 5,765 + 1,044 + 22.1%
512 544 + 32 + 6.3%
160 173 + 13 + 8.1%
2,383 3,152 + 769 + 32.3%
528 433 - 95 - 18.0%
1,138 1,463 + 325 + 28.6%
5,267 5,782 + 515 + 9.8%
528 433 - 95 - 18.0%
712 932 + 220 + 30.9%
484 577 + 93 + 19.2%
525 707 + 182 + 34.7%
468 587 + 119 + 25.4%
321 308 - 13 - 4.0%
744 618 - 126 - 16.9%
1,485 1,620 + 135 + 9.1%
Number of forces in England & Wales with an increase in this category 34
Nottinghamshire
Humberside
Kent
West Yorkshire
Northumbria
England & Wales
North West Region
Cheshire
Cumbria
Greater Manchester
Lancashire
Merseyside
Most Similar Group
Lancashire
South Wales
South Yorkshire
AreasChange

STCG
PROTECT
PROTECT
HMIC – Delivery
Select Force 20 Period Starts 38 Period Ends 49
-4
-3
-2
-1
0
1
2
3
4
All
Cri
me
Vic
tim
-Bas
ed C
rim
e
Vio
len
ce A
gain
st T
he
Pers
on
Ho
mic
ide
Mo
st S
erio
us
Vio
len
ce
Vio
len
ce W
ITH
Inju
ry
Vio
len
ce W
ITH
OU
T In
jury
Sexu
al O
ffe
nce
s (A
ll)
Ra
pe
Oth
er S
exu
al O
ffen
ces
Ro
bb
ery
(All)
Ro
bb
ery
(Bus
ines
s)
Ro
bb
ery
(Pe
rson
al)
The
ft O
ffen
ces
Bu
rgla
ry (
All)
Bu
rgla
ry (
Dw
elli
ng)
Bu
rgla
ry (
Oth
er)
Veh
icle
Off
enc
es
The
ft f
rom
a V
ehic
le
The
ft o
f a
Veh
icle
Veh
icle
Inte
rfer
ence
Sho
plif
tin
g
The
ft f
rom
th
e P
erso
n
Bic
ycle
The
ft
All
Oth
er
The
ft O
ffen
ces
Cri
min
al D
am
age
& A
rso
n
Cri
min
al D
am
age
Ars
on
Oth
er C
rim
es
Aga
inst
Soc
iety
Pu
blic
Ord
er
Off
en
ces
Po
sse
ssio
n o
f W
eap
on
s O
ffen
ces
Dru
g O
ffen
ces
Dru
gs (
Tra
ffic
kin
g)
Dru
gs (
Po
sse
ssio
n)
Mis
cella
ne
ous
Cri
mes
Aga
inst
So
ciet
y
Ra
cial
ly/R
elig
iou
sly
Agg
rava
ted
Off
ence
s

STCG
PROTECT
PROTECT
HMIC – Direction
Select Force 20 Earlier 12M Ends 37 Later 12M Ends 49
-4
-3
-2
-1
0
1
2
3
4
All
Cri
me
Vic
tim
-Bas
ed C
rim
e
Vio
len
ce A
gain
st T
he
Pers
on
Ho
mic
ide
Mo
st S
erio
us
Vio
len
ce
Vio
len
ce W
ITH
Inju
ry
Vio
len
ce W
ITH
OU
T In
jury
Sexu
al O
ffe
nce
s (A
ll)
Ra
pe
Oth
er S
exu
al O
ffen
ces
Ro
bb
ery
(All)
Ro
bb
ery
(Bus
ines
s)
Ro
bb
ery
(Pe
rson
al)
The
ft O
ffen
ces
Bu
rgla
ry (
All)
Bu
rgla
ry (
Dw
elli
ng)
Bu
rgla
ry (
Oth
er)
Veh
icle
Off
enc
es
The
ft f
rom
a V
ehic
le
The
ft o
f a
Veh
icle
Veh
icle
Inte
rfer
ence
Sho
plif
tin
g
The
ft f
rom
th
e P
erso
n
Bic
ycle
The
ft
All
Oth
er
The
ft O
ffen
ces
Cri
min
al D
am
age
& A
rso
n
Cri
min
al D
am
age
Ars
on
Oth
er C
rim
es
Aga
inst
Soc
iety
Pu
blic
Ord
er
Off
en
ces
Po
sse
ssio
n o
f W
eap
on
s O
ffen
ces
Dru
g O
ffen
ces
Dru
gs (
Tra
ffic
kin
g)
Dru
gs (
Po
sse
ssio
n)
Mis
cella
ne
ous
Cri
mes
Aga
inst
So
ciet
y
Ra
cial
ly/R
elig
iou
sly
Agg
rava
ted
Off
ence
s

PROTECT
Scrutiny Meeting
Recorded Crime
Priority Crimes

STCG
PROTECT
PROTECT
All Recorded Crime The Constabulary and BCUs
96,957 92,629 92,457 83,756 80,000
82,500
85,000
87,500
90,000
92,500
95,000
97,500
100,000
The Constabulary
35,383 34,892 35,028 31,954 20,000
22,500
25,000
27,500
30,000
32,500
35,000
37,500
40,000
EAST BCU
28,394 25,708 25,361 22,312 20,000
22,500
25,000
27,500
30,000
32,500
35,000
37,500
40,000
SOUTH BCU
33,065 32,029 32,068 29,493 20,000
22,500
25,000
27,500
30,000
32,500
35,000
37,500
40,000
WEST BCU
The 2015-16 Estimate of 83,756 = 9.6% REDUCTION on 2014-15
= 13.6% REDUCTION on 3yr Mean The long term trend (Apr-12 to
most recent month) is DOWNWARDS but not significant
The 2015-16 Estimate of 31,954 = 8.4% REDUCTION on 2014-15
= 9.7% REDUCTION on 3yr Mean The long term trend (Apr-12 to most recent month) is slightly UPWARDS but not significant
The 2015-16 Estimate of 22,312 = 13.2% REDUCTION on 2014-15
= 21.4% REDUCTION on 3yr Mean The long term trend (Apr-12 to
most recent month) is DOWNWARDS AND SIGNIFICANT
The 2015-16 Estimate of 29,493 = 7.9% REDUCTION on 2014-15
= 10.8% REDUCTION on 3yr Mean The long term trend (Apr-12 to
most recent month) is DOWNWARDS but not significant

STCG
PROTECT
PROTECT
Victim Based Crime The Constabulary and BCUs
87,780 85,463 85,554 78,141 70,000
72,500
75,000
77,500
80,000
82,500
85,000
87,500
90,000
The Constabulary
31,999 32,272 32,513 29,882 10,000
15,000
20,000
25,000
30,000
35,000
40,000
EAST BCU
25,691 23,418 23,175 20,496 10,000
15,000
20,000
25,000
30,000
35,000
40,000
SOUTH BCU
30,008 29,773 29,866 27,765 10,000
15,000
20,000
25,000
30,000
35,000
40,000
WEST BCU
The 2015-16 Estimate of 78,141 = 8.6% REDUCTION on 2014-15
= 11.0% REDUCTION on 3yr Mean The long term trend (Apr-12 to most recent month) is slightly
DOWNWARDS but not significant
The 2015-16 Estimate of 29,882 = 7.4% REDUCTION on 2014-15
= 6.6% REDUCTION on 3yr Mean The long term trend (Apr-12 to
most recent month) is UPWARDS but not significant
The 2015-16 Estimate of 20,496 = 12.5% REDUCTION on 2014-15
= 20.2% REDUCTION on 3yr Mean The long term trend (Apr-12 to
most recent month) is DOWNWARDS AND SIGNIFICANT
The 2015-16 Estimate of 27,765 = 6.7% REDUCTION on 2014-15
= 7.5% REDUCTION on 3yr Mean The long term trend (Apr-12 to
most recent month) is UPWARDS but not significant

STCG
PROTECT
PROTECT
High Impact Acquisitive Crime The Constabulary and BCUs
4,958 5,614 5,574 5,335 0
1,000
2,000
3,000
4,000
5,000
6,000
7,000
8,000
9,000
10,000
The Constabulary
1,962 2,459 2,484 2,410 0
500
1,000
1,500
2,000
2,500
3,000
EAST BCU
1,404 1,498 1,430 1,283 0
500
1,000
1,500
2,000
2,500
3,000
SOUTH BCU
1,592 1,657 1,660 1,640 0
500
1,000
1,500
2,000
2,500
3,000
WEST BCU
The 2015-16 Estimate of 5,335 = 5.0% REDUCTION on 2014-15 = 7.6% INCREASE on 3yr Mean The long term trend (Apr-12 to
most recent month) is UPWARDS AND SIGNIFICANT
The 2015-16 Estimate of 2,410 = 2.0% REDUCTION on 2014-15 = 22.7% INCREASE on 3yr Mean The long term trend (Apr-12 to
most recent month) is UPWARDS AND SIGNIFICANT
The 2015-16 Estimate of 1,283 = 14.4% REDUCTION on 2014-15 = 8.6% REDUCTION on 3yr Mean The long term trend (Apr-12 to most recent month) is slightly UPWARDS but not signifcant
The 2015-16 Estimate of 1,640 = 1.0% REDUCTION on 2014-15 = 3.0% INCREASE on 3yr Mean The long term trend (Apr-12 to
most recent month) is UPWARDS AND SIGNIFICANT

STCG
PROTECT
PROTECT
Burglary (Dwelling) The Constabulary and BCUs
4,285 5,130 5,087 4,883 0
1,000
2,000
3,000
4,000
5,000
6,000
The Constabulary
1,745 2,307 2,321 2,259 0
500
1,000
1,500
2,000
2,500
3,000
EAST BCU
1,174 1,315 1,259 1,129 0
500
1,000
1,500
2,000
2,500
3,000
SOUTH BCU
1,366 1,508 1,507 1,493 0
500
1,000
1,500
2,000
2,500
3,000
WEST BCU
The 2015-16 Estimate of 94,883 = 4.8% REDUCTION on 2014-15 = 14.0% INCREASE on 3yr Mean The long term trend (Apr-12 to
most recent month) is UPWARDS AND SIGNIFICANT
The 2015-16 Estimate of 2,259 = 2.1% REDUCTION on 2014-15 = 29.5% INCREASE on 3yr Mean The long term trend (Apr-12 to
most recent month) is UPWARDS AND SIGNIFICANT
The 2015-16 Estimate of 1,129 = 14.2% REDUCTION on 2014-15 = 3.8% REDUCTION on 3yr Mean The long term trend (Apr-12 to most recent month) is slightly UPWARDS but not significant
The 2015-16 Estimate of 1,493 = 1.0% REDUCTION on 2014-15 = 9.3% INCREASE on 3yr Mean The long term trend (Apr-12 to
most recent month) is UPWARDS AND SIGNIFICANT

STCG
PROTECT
PROTECT
Robbery (Personal) The Constabulary and BCUs
565 509 515 481 0
100
200
300
400
500
600
700
The Constabulary
181 165 176 164 0
50
100
150
200
250
300
EAST BCU
192 187 177 160 0
50
100
150
200
250
300
SOUTH BCU
191 157 162 157 0
50
100
150
200
250
300
WEST BCU
The 2015-16 Estimate of 481 = 5.5% REDUCTION on 2014-15
= 14.9% REDUCTION on 3yr Mean The long term trend (Apr-12 to
most recent month) is DOWNWARDS but not significant
The 2015-16 Estimate of 164 = 0.9% REDUCTION on 2014-15
= 9.4% REDUCTION on 3yr Mean The long term trend (Apr-12 to
most recent month) is DOWNWARDS but not significant
The 2015-16 Estimate of 160 = 14.6% REDUCTION on 2014-15
= 16.7% REDUCTION on 3yr Mean The long term trend (Apr-12 to most recent month) is slightly UPWARDS but not significant
The 2015-16 Estimate of 157 = NO CHANGE on 2014-15
= 17.8% REDUCTION on 3yr Mean The long term trend (Apr-12 to
most recent month) is DOWNWARDS but not significant
STCG
PROTECT
PROTECT
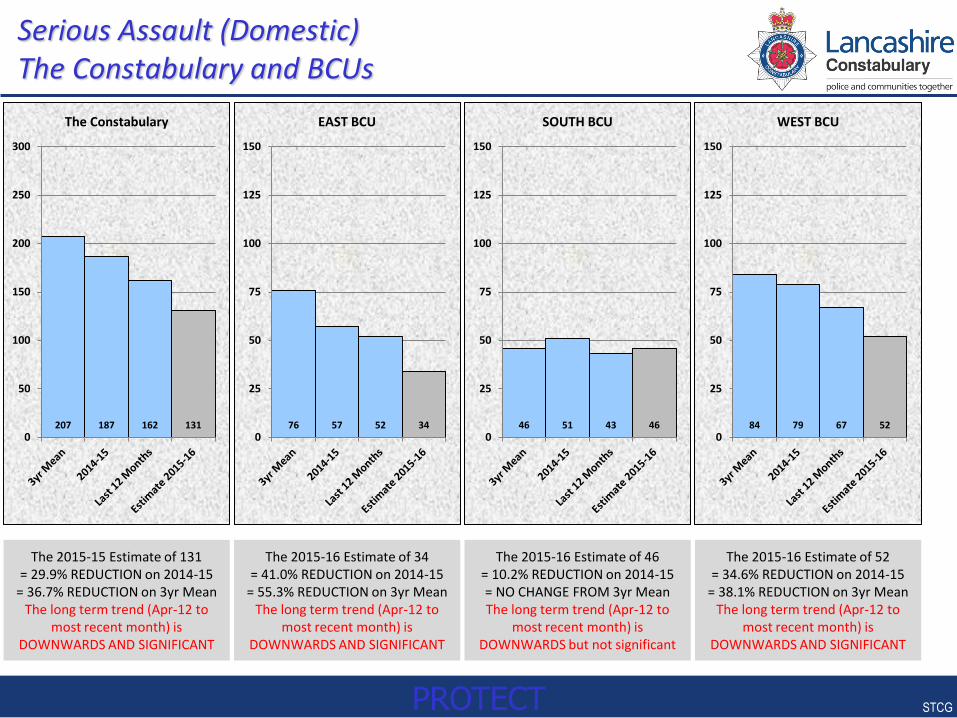
Serious Assault (Domestic) The Constabulary and BCUs
207 187 162 131 0
50
100
150
200
250
300
The Constabulary
76 57 52 34 0
25
50
75
100
125
150
EAST BCU
46 51 43 46 0
25
50
75
100
125
150
SOUTH BCU
84 79 67 52 0
25
50
75
100
125
150
WEST BCU
The 2015-15 Estimate of 131 = 29.9% REDUCTION on 2014-15
= 36.7% REDUCTION on 3yr Mean The long term trend (Apr-12 to
most recent month) is DOWNWARDS AND SIGNIFICANT
The 2015-16 Estimate of 34 = 41.0% REDUCTION on 2014-15
= 55.3% REDUCTION on 3yr Mean The long term trend (Apr-12 to
most recent month) is DOWNWARDS AND SIGNIFICANT
The 2015-16 Estimate of 46 = 10.2% REDUCTION on 2014-15 = NO CHANGE FROM 3yr Mean The long term trend (Apr-12 to
most recent month) is DOWNWARDS but not significant
The 2015-16 Estimate of 52 = 34.6% REDUCTION on 2014-15
= 38.1% REDUCTION on 3yr Mean The long term trend (Apr-12 to
most recent month) is DOWNWARDS AND SIGNIFICANT

STCG
PROTECT
PROTECT
Serious Assault (Non-Domestic) The Constabulary and BCUs
686 675 670 634 0
100
200
300
400
500
600
700
800
900
1,000
The Constabulary
252 230 230 211 0
50
100
150
200
250
300
350
400
EAST BCU
182 192 184 171 0
50
100
150
200
250
300
350
400
SOUTH BCU
250 253 256 253 0
50
100
150
200
250
300
350
400
WEST BCU
The 2015-16 Estimate of 634 = 6.0% REDUCTION on 2014-15
= 7.6% REDUCTION on 3yr Mean The long term trend (Apr-12 to
most recent month) is DOWNWARDS but not significant
The 2015-16 Estimate of 211 = 8.3% REDUCTION on 2014-15
= 16.3% REDUCTION on 3yr Mean The long term trend (Apr-12 to
most recent month) is DOWNWARDS but not significant
The 2015-16 Estimate of 171 = 11.0% REDUCTION on 2014-15 = 6.0% REDUCTION on 3yr Mean The long term trend (Apr-12 to
most recent month) is DOWNWARDS but not significant
The 2015-16 Estimate of 253 = NO CHANGE on 2014-15
= 1.2% INCREASE on 3yr Mean The long term trend (Apr-12 to
most recent month) is UPWARDS but not significant

STCG
PROTECT
PROTECT
Rape The Constabulary and BCUs
416 625 662 677 0
100
200
300
400
500
600
700
800
The Constabulary
137 216 237 238 0
50
100
150
200
250
300
350
400
EAST BCU
126 147 157 152 0
50
100
150
200
250
300
350
400
SOUTH BCU
153 262 268 287 0
50
100
150
200
250
300
350
400
WEST BCU
The 2015-16 Estimate of 677 = 8.3% INCREASE on 2014-15
= 62.7% INCREASE on 3yr Mean The long term trend (Apr-12 to
most recent month) is UPWARDS AND SIGNIFICANT
The 2015-16 Estimate of 238 = 10.1% INCREASE on 2014-15
= 73.7% INCREASE on 3yr Mean The long term trend (Apr-12 to
most recent month) is UPWARDS AND SIGNIFICANT
The 2015-16 Estimate of 152 = 3.6% INCREASE on 2014-15
= 20.6% INCREASE on 3yr Mean The long term trend (Apr-12 to
most recent month) is UPWARDS AND SIGNIFICANT
The 2015-16 Estimate of 287 = 9.7% INCREASE on 2014-15
= 87.6% INCREASE on 3yr Mean The long term trend (Apr-12 to
most recent month) is UPWARDS AND SIGNIFICANT
STCG
PROTECT
PROTECT
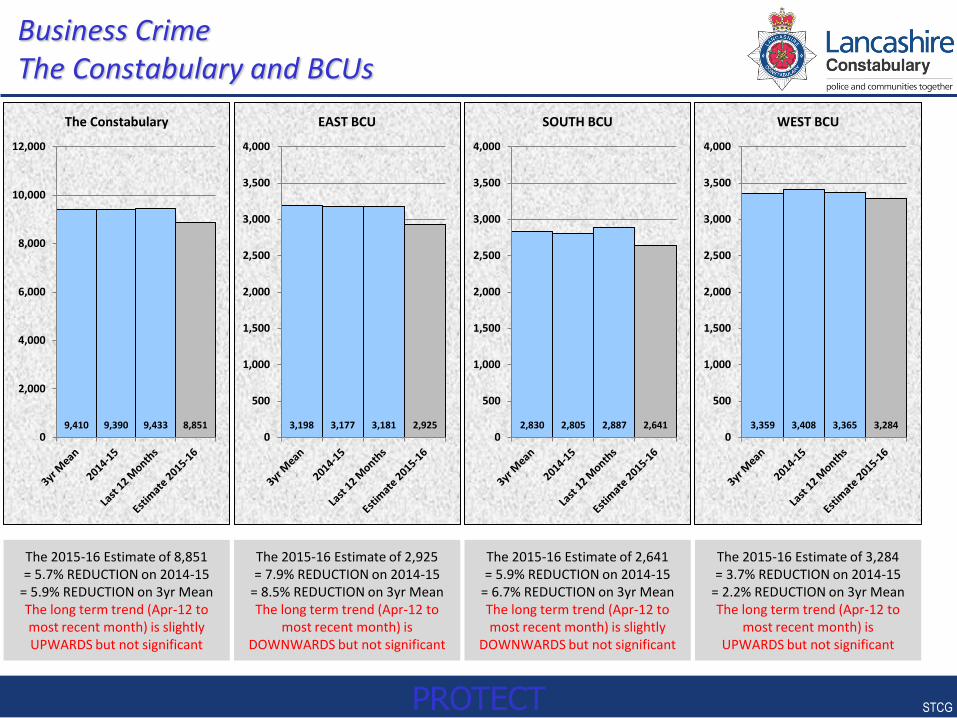
Business Crime The Constabulary and BCUs
9,410 9,390 9,433 8,851 0
2,000
4,000
6,000
8,000
10,000
12,000
The Constabulary
3,198 3,177 3,181 2,925 0
500
1,000
1,500
2,000
2,500
3,000
3,500
4,000
EAST BCU
2,830 2,805 2,887 2,641 0
500
1,000
1,500
2,000
2,500
3,000
3,500
4,000
SOUTH BCU
3,359 3,408 3,365 3,284 0
500
1,000
1,500
2,000
2,500
3,000
3,500
4,000
WEST BCU
The 2015-16 Estimate of 8,851 = 5.7% REDUCTION on 2014-15
= 5.9% REDUCTION on 3yr Mean The long term trend (Apr-12 to most recent month) is slightly UPWARDS but not significant
The 2015-16 Estimate of 2,925 = 7.9% REDUCTION on 2014-15
= 8.5% REDUCTION on 3yr Mean The long term trend (Apr-12 to
most recent month) is DOWNWARDS but not significant
The 2015-16 Estimate of 2,641 = 5.9% REDUCTION on 2014-15
= 6.7% REDUCTION on 3yr Mean The long term trend (Apr-12 to most recent month) is slightly
DOWNWARDS but not significant
The 2015-16 Estimate of 3,284 = 3.7% REDUCTION on 2014-15
= 2.2% REDUCTION on 3yr Mean The long term trend (Apr-12 to
most recent month) is UPWARDS but not significant

PROTECT
Scrutiny Meeting
Crime Outcomes

STCG
PROTECT
PROTECT
Crime Outcomes - Force Level For Every 100 Crimes Recorded Jun-14 to May-15
Select Area
Select Period
Jun-14 to May-15
Select Crime Categories
43.2622.4849.03
98.74
74.96
59.83
65.83
66.31
Rape
The Constabulary
All Crime
Burglary (Dwelling)
Robbery (Personal)
Serious Assault (Domestic)
Serious Assault (Non-Domestic)
Business Crime
Shoplifting
NFA Outcomes
All CrimeBurglary (Dwelling)Robbery (Personal)Serious Assault (Domestic)
Per 100 Recorded Crimes
Crimes in each Outcome GroupCourt & Caution
Other Action
Outcome
Evidential
Difficulty
5.39 0.06
Rape
21.67 6.10
32.30 0.78
49.18 1.50Serious Assault (Non-Domestic)
Business Crime
Shoplifting
16.62 0.15 48.79 0.76
23.24 1.05
38.35 12.83 8.11 0.54
CORA (V15) - Outcomes Bar Chart
TOTAL
43.50 14.08 7.65 0.60
15.56 0.3964.15 0.63 33.33 0.63
14.33 1.15
16.82 0.22
0.0 10.0 20.0 30.0 40.0 50.0 60.0 70.0 80.0 90.0 100.0
Rape
Shoplifting
Business Crime
Serious Assault (Non-Domestic)
Serious Assault (Domestic)
Robbery (Personal)
Burglary (Dwelling)
All Crime

PROTECT
Scrutiny Meeting
Anti-Social Behaviour
and
Attendance at Grade 1 Incidents

STCG
PROTECT
PROTECT
The Constabulary ASB Time Series
1 Force
1 ASB
MONTH INCIDENTS MONTH INCIDENTS
Apr-13 6,912 Apr-15 6,702
May-13 7,731 May-15 6,755
Jun-13 8,253 Jun-15 0
Jul-13 9,942 Jul-15 0
Aug-13 9,088 Aug-15 0
Sep-13 7,103 Sep-15 0
Oct-13 6,977 Oct-15 0
Nov-13 6,134 Nov-15 0
Dec-13 5,328 Dec-15 0
Jan-14 5,230 Jan-16 0
Feb-14 4,965 Feb-16 0
Mar-14 6,236 Mar-16 0
Apr-14 6,554
May-14 6,925
Jun-14 7,152
Jul-14 8,089
Aug-14 6,799
Sep-14 7,001
Oct-14 6,533
Nov-14 5,857
Dec-14 4,959
Jan-15 5,211
Feb-15 5,182
Mar-15 6,056
Apr May Jun Jul Aug Sep Oct Nov Dec Jan Feb Mar
6,733 7,328 7,703 9,016 7,944 7,052 6,755 5,996 5,144 5,221 5,074 6,146
6,702 6,755 0 0 0 0 0 0 0 0 0 0
Estimates
Actual
The Table below shows the estimates for each month (the blue line in the chart) and the actual numbers recorded. The blue line in the chart represents an
estimated number of ASB incidents for each
calendar month based on the average
number of incidents recorded in each month
over the last two years
Click on the drop-down arrows on the right-hand edges of the combo boxes and choose from the lists that appear.SELECT ASB TYPE All Anti-Social Behaviour
SELECT AREA The Constabulary
0
2000
4000
6000
8000
10000
12000
Ap
r-1
3
Ma
y-1
3
Jun
-13
Jul-
13
Au
g-1
3
Sep
-13
Oct
-13
No
v-1
3
De
c-13
Jan
-14
Feb
-14
Ma
r-14
Ap
r-1
4
Ma
y-1
4
Jun
-14
Jul-
14
Au
g-1
4
Sep
-14
Oct
-14
No
v-1
4
De
c-14
Jan
-15
Feb
-15
Ma
r-15
Ap
r-1
5
Ma
y-1
5
Jun
-15
Jul-
15
Au
g-1
5
Sep
-15
Oct
-15
No
v-1
5
De
c-15
Jan
-16
Feb
-16
Ma
r-16
STCG
PROTECT
PROTECT
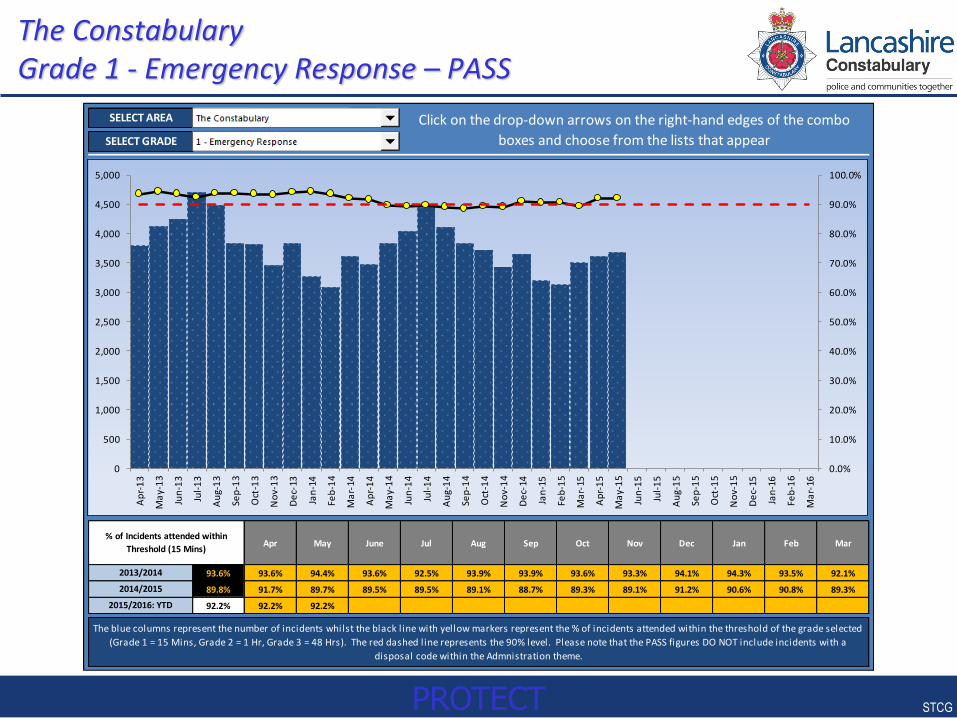
The Constabulary Grade 1 - Emergency Response – PASS
1
1
Apr May June Jul Aug Sep Oct Nov Dec Jan Feb Mar
93.6% 93.6% 94.4% 93.6% 92.5% 93.9% 93.9% 93.6% 93.3% 94.1% 94.3% 93.5% 92.1%
89.8% 91.7% 89.7% 89.5% 89.5% 89.1% 88.7% 89.3% 89.1% 91.2% 90.6% 90.8% 89.3%
92.2% 92.2% 92.2%
The blue columns represent the number of incidents whilst the black line with yellow markers represent the % of incidents attended within the threshold of the grade selected
(Grade 1 = 15 Mins, Grade 2 = 1 Hr, Grade 3 = 48 Hrs). The red dashed line represents the 90% level. Please note that the PASS figures DO NOT include incidents with a
disposal code within the Admnistration theme.
2013/2014
2014/2015
2015/2016: YTD
SELECT GRADE
% of Incidents attended within
Threshold (15 Mins)
SELECT AREA The Constabulary Click on the drop-down arrows on the right-hand edges of the combo
boxes and choose from the lists that appear
0.0%
10.0%
20.0%
30.0%
40.0%
50.0%
60.0%
70.0%
80.0%
90.0%
100.0%
0
500
1,000
1,500
2,000
2,500
3,000
3,500
4,000
4,500
5,000
Ap
r-1
3
Ma
y-1
3
Jun
-13
Jul-
13
Au
g-1
3
Sep
-13
Oct
-13
No
v-1
3
De
c-13
Jan
-14
Feb
-14
Ma
r-14
Ap
r-1
4
Ma
y-1
4
Jun
-14
Jul-
14
Au
g-1
4
Sep
-14
Oct
-14
No
v-1
4
De
c-14
Jan
-15
Feb
-15
Ma
r-15
Ap
r-1
5
Ma
y-1
5
Jun
-15
Jul-
15
Au
g-1
5
Sep
-15
Oct
-15
No
v-1
5
De
c-15
Jan
-16
Feb
-16
Ma
r-16
1
1
Apr May June Jul Aug Sep Oct Nov Dec Jan Feb Mar
93.6% 93.6% 94.4% 93.6% 92.5% 93.9% 93.9% 93.6% 93.3% 94.1% 94.3% 93.5% 92.1%
89.8% 91.7% 89.7% 89.5% 89.5% 89.1% 88.7% 89.3% 89.1% 91.2% 90.6% 90.8% 89.3%
92.2% 92.2% 92.2%
The blue columns represent the number of incidents whilst the black line with yellow markers represent the % of incidents attended within the threshold of the grade selected
(Grade 1 = 15 Mins, Grade 2 = 1 Hr, Grade 3 = 48 Hrs). The red dashed line represents the 90% level. Please note that the PASS figures DO NOT include incidents with a
disposal code within the Admnistration theme.
2013/2014
2014/2015
2015/2016: YTD
SELECT GRADE
% of Incidents attended within
Threshold (15 Mins)
SELECT AREA The Constabulary Click on the drop-down arrows on the right-hand edges of the combo
boxes and choose from the lists that appear
0.0%
10.0%
20.0%
30.0%
40.0%
50.0%
60.0%
70.0%
80.0%
90.0%
100.0%
0
500
1,000
1,500
2,000
2,500
3,000
3,500
4,000
4,500
5,000
Ap
r-1
3
Ma
y-1
3
Jun
-13
Jul-
13
Au
g-1
3
Sep
-13
Oct
-13
No
v-1
3
De
c-13
Jan
-14
Feb
-14
Ma
r-14
Ap
r-1
4
Ma
y-1
4
Jun
-14
Jul-
14
Au
g-1
4
Sep
-14
Oct
-14
No
v-1
4
De
c-14
Jan
-15
Feb
-15
Ma
r-15
Ap
r-1
5
Ma
y-1
5
Jun
-15
Jul-
15
Au
g-1
5
Sep
-15
Oct
-15
No
v-1
5
De
c-15
Jan
-16
Feb
-16
Ma
r-16

STCG
PROTECT
PROTECT
The Constabulary Grade 1 - Emergency Response – Time To Arrive
1
1
Apr May June Jul Aug Sep Oct Nov Dec Jan Feb Mar
8.8 8.7 8.4 9.1 9.0 9.6 8.5 8.4 9.3 8.5 9.0 8.5 8.8
9.6 9.0 10.3 10.4 9.6 9.7 9.8 9.5 9.7 9.1 9.8 9.3 9.4
8.9 9.1 8.82015/2016: YTD
The blue columns represent the number of incidents whilst the pink proportion represents the number of incidents that were not attened or had 'no time' recorded. The black
line with yellow markers represent the average Time To Arrive of incidents attended within the grade selected. The red line represents the threshold level (Grade 1 = 15 Mins,
Grade 2 = 60 Mins, Grade 3 = 48 Hrs). Please note that these PASS figures DO NOT include incidents with a disposal code within the Admnistration theme.
Average Time to Arrive:
Grade 1 - Emergency Response
(Threshold (15 Mins)
2013/2014
2014/2015
SELECT GRADE 1 - Emergency Response
Click on the drop-down arrows on the right-hand edges of the combo
boxes and choose from the lists that appear
SELECT AREA The Constabulary
0
5
10
15
20
25
30
35
40
45
50
55
60
0
500
1,000
1,500
2,000
2,500
3,000
3,500
4,000
4,500
5,000
Ap
r-1
3
Ma
y-1
3
Jun
-13
Jul-
13
Au
g-1
3
Sep
-13
Oct
-13
No
v-1
3
De
c-13
Jan
-14
Feb
-14
Ma
r-14
Ap
r-1
4
Ma
y-1
4
Jun
-14
Jul-
14
Au
g-1
4
Sep
-14
Oct
-14
No
v-1
4
De
c-14
Jan
-15
Feb
-15
Ma
r-15
Ap
r-1
5
Ma
y-1
5
Jun
-15
Jul-
15
Au
g-1
5
Sep
-15
Oct
-15
No
v-1
5
De
c-15
Jan
-16
Feb
-16
Ma
r-16
T
I
M
E

PROTECT
Scrutiny Meeting
Satisfaction
STCG
PROTECT
PROTECT
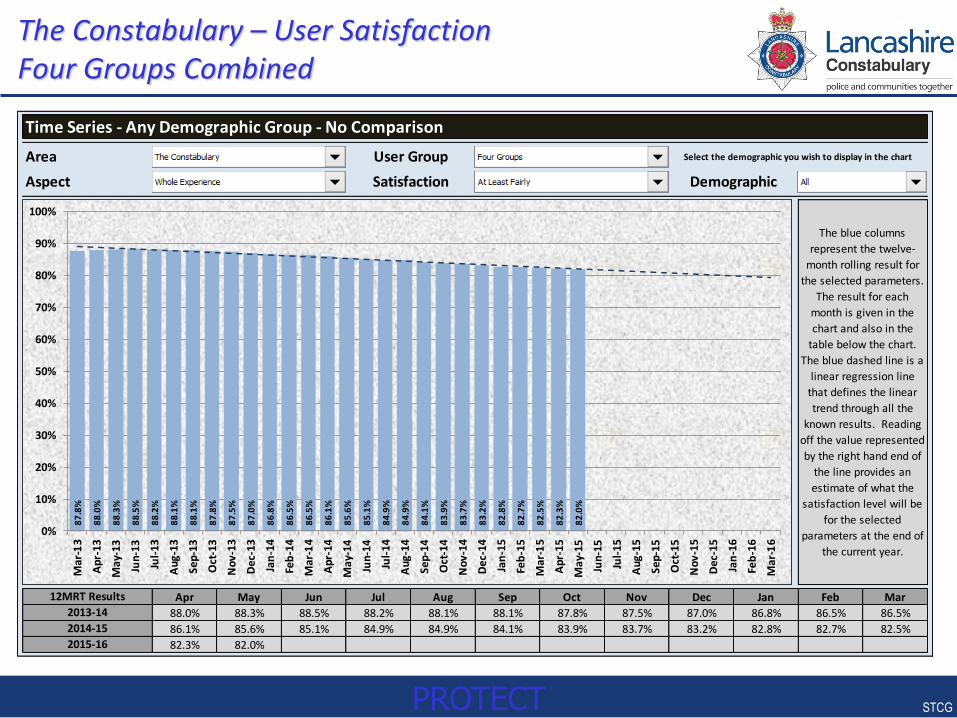
The Constabulary – User Satisfaction Four Groups Combined
1 1
8 1 1
Apr May Jun Jul Aug Sep Oct Nov Dec Jan Feb Mar
88.0% 88.3% 88.5% 88.2% 88.1% 88.1% 87.8% 87.5% 87.0% 86.8% 86.5% 86.5%
86.1% 85.6% 85.1% 84.9% 84.9% 84.1% 83.9% 83.7% 83.2% 82.8% 82.7% 82.5%
82.3% 82.0%
2013-14
2014-15
2015-16
12MRT Results
The blue columns
represent the twelve-
month rolling result for
the selected parameters.
The result for each
month is given in the
chart and also in the
table below the chart.
The blue dashed line is a
linear regression line
that defines the linear
trend through all the
known results. Reading
off the value represented
by the right hand end of
the line provides an
estimate of what the
satisfaction level will be
for the selected
parameters at the end of
the current year.
Aspect EXPERIENCE Satisfaction Demographic
Time Series - Any Demographic Group - No Comparison
Area The Constabulary User Group Select the demographic you wish to display in the chart
87
.8%
88
.0%
88
.3%
88
.5%
88
.2%
88
.1%
88
.1%
87
.8%
87
.5%
87
.0%
86
.8%
86
.5%
86
.5%
86
.1%
85
.6%
85
.1%
84
.9%
84
.9%
84
.1%
83
.9%
83
.7%
83
.2%
82
.8%
82
.7%
82
.5%
82
.3%
82
.0%
0%
10%
20%
30%
40%
50%
60%
70%
80%
90%
100%
Mar
-13
Apr
-13
May
-13
Jun-
13
Jul-
13
Aug
-13
Sep-
13
Oct
-13
No
v-1
3
Dec
-13
Jan
-14
Feb
-14
Mar
-14
Apr
-14
May
-14
Jun-
14
Jul-
14
Aug
-14
Sep-
14
Oct
-14
Nov
-14
Dec
-14
Jan
-15
Feb
-15
Mar
-15
Apr
-15
May
-15
Jun-
15
Jul-
15
Aug
-15
Sep-
15
Oct
-15
No
v-1
5
Dec
-15
Jan
-16
Feb
-16
Mar
-16
STCG
PROTECT
PROTECT
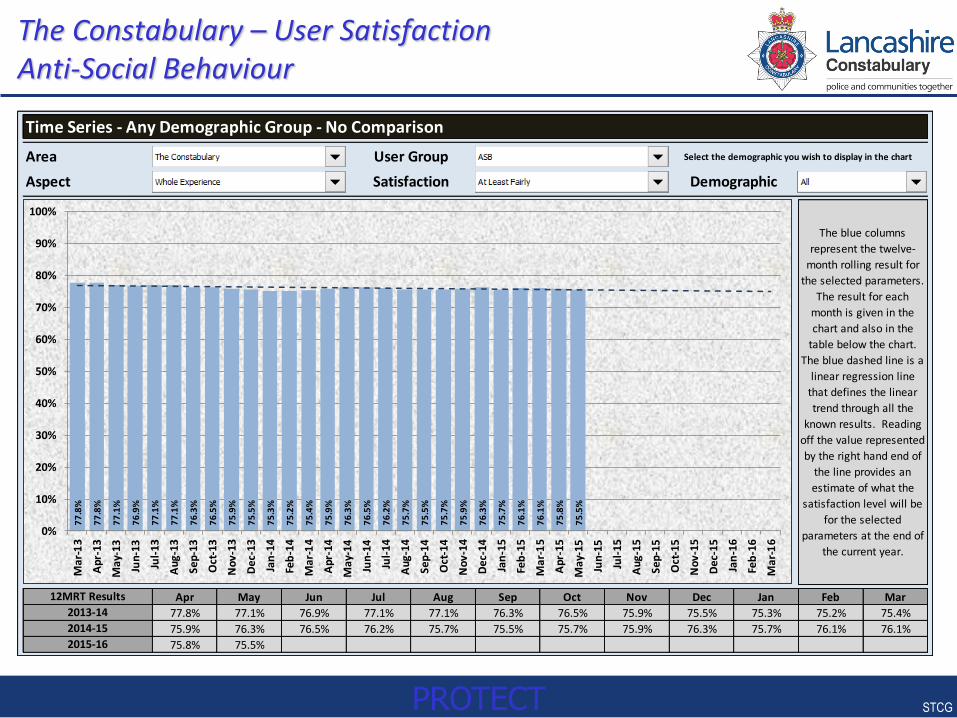
The Constabulary – User Satisfaction Anti-Social Behaviour
1 8
8 1 1
Apr May Jun Jul Aug Sep Oct Nov Dec Jan Feb Mar
77.8% 77.1% 76.9% 77.1% 77.1% 76.3% 76.5% 75.9% 75.5% 75.3% 75.2% 75.4%
75.9% 76.3% 76.5% 76.2% 75.7% 75.5% 75.7% 75.9% 76.3% 75.7% 76.1% 76.1%
75.8% 75.5%
2013-14
2014-15
2015-16
12MRT Results
The blue columns
represent the twelve-
month rolling result for
the selected parameters.
The result for each
month is given in the
chart and also in the
table below the chart.
The blue dashed line is a
linear regression line
that defines the linear
trend through all the
known results. Reading
off the value represented
by the right hand end of
the line provides an
estimate of what the
satisfaction level will be
for the selected
parameters at the end of
the current year.
Aspect EXPERIENCE Satisfaction Demographic
Time Series - Any Demographic Group - No Comparison
Area The Constabulary User Group Select the demographic you wish to display in the chart
77
.8%
77
.8%
77
.1%
76
.9%
77
.1%
77
.1%
76
.3%
76
.5%
75
.9%
75
.5%
75
.3%
75
.2%
75
.4%
75
.9%
76
.3%
76
.5%
76
.2%
75
.7%
75
.5%
75
.7%
75
.9%
76
.3%
75
.7%
76
.1%
76
.1%
75
.8%
75
.5%
0%
10%
20%
30%
40%
50%
60%
70%
80%
90%
100%
Mar
-13
Apr
-13
May
-13
Jun-
13
Jul-
13
Aug
-13
Sep-
13
Oct
-13
No
v-1
3
Dec
-13
Jan
-14
Feb
-14
Mar
-14
Apr
-14
May
-14
Jun-
14
Jul-
14
Aug
-14
Sep-
14
Oct
-14
Nov
-14
Dec
-14
Jan
-15
Feb
-15
Mar
-15
Apr
-15
May
-15
Jun-
15
Jul-
15
Aug
-15
Sep-
15
Oct
-15
No
v-1
5
Dec
-15
Jan
-16
Feb
-16
Mar
-16

STCG
PROTECT
PROTECT
The Constabulary Overall Confidence in the Constabulary
Select Area
Select Aspect
Apr May Jun Jul Aug Sep Oct Nov Dec Jan Feb Mar
87.5% 88.2% 88.4% 88.6% 88.6% 88.4% 88.1% 88.2% 88.1% 88.3% 88.8% 89.0%
88.9% 89.0% 89.2% 89.5% 89.4% 90.1% 90.5% 90.9% 91.4% 91.5% 91.2% 91.1%
91.3% 90.5%
Confidence File - Time Series Bar Chart
The Constabulary
Overall Confidence
12MRT Results
2013-14
2014-15
2015-16
The blue columns represent the twelve-month rolling results for the selected parameters. The percentages are
the proportions of all survey respondents who were fairly or very confident in the aspect of service specified.
87
.1%
87
.5%
88
.2%
88
.4%
88
.6%
88
.6%
88
.4%
88
.1%
88
.2%
88
.1%
88
.3%
88
.8%
89
.0%
88
.9%
89
.0%
89
.2%
89
.5%
89
.4%
90
.1%
90
.5%
90
.9%
91
.4%
91
.5%
91
.2%
91
.1%
91
.3%
90
.5%
0.0%
10.0%
20.0%
30.0%
40.0%
50.0%
60.0%
70.0%
80.0%
90.0%
100.0%
Mar
-13
Ap
r-1
3
May
-13
Jun-
13
Jul-
13
Au
g-1
3
Se
p-1
3
Oct
-13
Nov
-13
De
c-1
3
Jan
-14
Feb
-14
Mar
-14
Ap
r-1
4
May
-14
Jun-
14
Jul-
14
Au
g-1
4
Se
p-1
4
Oct
-14
Nov
-14
Dec
-14
Jan
-15
Feb
-15
Mar
-15
Ap
r-1
5
May
-15
Jun-
15
Jul-
15
Au
g-1
5
Se
p-1
5
Oct
-15
Nov
-15
Dec
-15
Jan
-16
Feb
-16
Mar
-16

PROTECT
Scrutiny Meeting
Tuesday 23rd June 2015