Tomato Disease & Insect Control Manual With Variety Selection

Pak. J. Bot., 46(4): 1165-1178, 2014.
SCREENING AND SELECTION OF TOMATO GENOTYPES/CULTIVARS FOR DROUGHT TOLERANCE USING MULTIVARIATE ANALYSIS
FAKHRA SHAMIM1*, S.M. SAQLAN2, HABIB-UR-REHMAN ATHAR3
AND ABDUL WAHEED1,4
1,2Department of Botany, PMAS-Arid Agriculture University, Rawalpindi, Pakistan 3Institute of Pure and Applied Biology, Bahauddin Zakariya University, Multan, Pakistan
1,4COMSATS Institutes of Information Technology, Sahiwal, Pakistan *Corresponding author e-mail: [email protected]
Abstract
Drought is one of the most important abiotic stresses reducing crop growth and yield of tomato. Development of water
stress tolerant cultivars through screening and selection is one important strategy to overcome this problem. In the present study, seeds of 120 local and exotic lines of tomato were allowed to germinate at varying levels of polyethylene glycol (PEG8000) induced water stress (PEG8000 0, 2.5%, 5.0% and 7.5%) for two weeks. Increasing PEG concentrations in the growth medium (water stress) caused a consistent decrease in seed germination percentage and seedling growth of all tomato cultivars. Moreover, a significant amount of genetic variability was found in all attributes of 120 genotypes of tomato. All lines/cultivars of tomato were ranked on the basis of relative water stress tolerance using 13 morphometric traits and categorized in four groups (tolerant, moderately tolerant, moderately sensitive, and sensitive) through multivariate analysis. Of 120 lines, 18, 25, 29 and 48 lines were ranked as tolerant, moderately tolerant, moderately sensitive and sensitive respectively. The germination percentage or speeds of germination were not found as effective indicator of genotypic differences for water stress at the seedling stage. Moreover, degree of water stress tolerance at the germination and seedling growth stage did not maintain in all tomato lines. Thus, it is not certain whether such variation is detectable at the later vegetative or reproductive growth stages. This needs to be further investigated. Overall, lines 19905, 19906, LA0716, and LA0722 were found to be water stress tolerant at least at early growth stages.
Introduction
At present, drought is a major threat to sustainable food production, which reduces the crop yields up to 70 percent. Hence, of all the abiotic stresses, drought (complex nature) is considered as the supreme destructive (Gosal et al., 2009). In order to meet the rising demand of food especially vegetables for the growing population, rainfed production of vegetables is the need of hour. Yield is frequently limited by scarcity of water besides, universal environmental variations accompanying growing struggle for water resources, forms the genomic advancement of crop for water use efficiency, a progressively more significant objective (Parry et al., 2002). Previously, it has been described that genetic improvements of tomato not only influenced by the background of germplasm but also depends on the stable improvement of more meticulously adapted genotypes appropriate to confined environments (Agong, 2001). The scope of plant genetic improvement through the manipulation of available genetic variability under stress and non-stress condition is still equally believed by all plant scientists. For enhancement of drought tolerance potential in a crop either through selection or breeding basic important criteria is presence of genetic variability for stress resilience (Dias, 2010 & 2014). The knowledge of genetic variability is useful tool in order to maintain (gene bank management), evaluate and utilize germplasm effectively under control and water stress condition (Cuartero & Flower, 1992). The material from diverse geographical origin of the crop species can help to ensure conservation of co-adapted gene complexes, because genetically heterogeneous populations produce more and stable yield than genetically homogenous lines (Simmonds, 1979; Samovol, 1996). The application of
genetic variation can also be manipulated either selecting superior genotypes or to be utilized as parents for the development of future cultivars through hybridization (Frankel et al., 1995; Goncalves et al., 2009). Systematic characterization and evaluation of plant genetic resources are prerequisites for the efficient use of the material through conventional methods or modern techniques. Growth and development of crops plants depend on judicious management of intrinsic (genetic, hereditary) and extrinsic (environment) factors. Tomato germplasm has been evaluated in different countries into different groups based on their latitudes of adaptations but the different planting time in the tropic causes complication. The behavior of tomato genotypes within groups varies from season to season and even in a single season, so the identification of the group can be lost. No systematic attempt has so far been made, to screen/evaluate the tomato germplasm under water deficit conditions and generate database in Pakistan. Characterization and evaluation of tomato genotypes in gene banks is necessary to determine their genetic diversity. Classification methods are being used to quantify the genetic divergence in many crops thus quantification of degree of divergence under drought would be of help in choosing suitable genotypes for tomato breeding programme (Dasgan et al., 2002; Kulkarni and Deshpande, 2007).
Multivariate analyses of verbatim/precise data procedures are helpful to describe phenotypic variations among the genotypes. It is used as a management tool for discovering underlying data grouping and relationships. Results reported by various researchers showed multivariate analysis as a valid system to deal with germplasm collection. Cluster Analysis (measures similarities and dissimilarities in order to determine the cluster numbers that explained in data) was used in this

FAKHRA SHAMIM ET AL., 1166
study because it allows the data to group itself. Though cluster analysis grouped together genotypes with greater morphological similarity, the clusters did not necessarily include all the genotypes from the same origin or nearby sites. Gunathilake et al. (2004) while working on tomato also reported the association between morpholological characters and geographic origin was absent. The genotypes have been grouped in a particular cluster on the basis of morphological trait similarities, thus representative genotypes from a cluster of particular group could be chosen for hybridization programme. Ghafoor et al. (2009) and Nikolic et al. (2010) reported that grouping pattern of the genotypes suggested no parallelism between genetic divergence and geographical distribution of the genotypes. Some potentially important traits have been identified and these can be exploited for specific trait improvement and assemblage of core collection from a bulk genetic stock.
With this aim in mind the present study was undertaken to run a classificatory analysis on the tomato genotypes by means of multivariate analysis which facilitated us to classify the available germplasm into distinct clusters on the basis of their genetic potential. The information, thus obtained, could be further utilized to develop an effective tomato-breeding programme. Therefore, 120 tomato genotypes were screened at germination and seedling stage on hypothesis that the germplasm performs different due to genetic variability under control and water deficit conditions. Also, to decipher the extent of genetic variability and drought tolerance potential under water deficit conditions in tomato germplasm and to identify the promising drought tolerant lines among tomato germplasm for future research. Materials and Methods
Seeds of 108 local/exotic genotypes of tomato were obtained from Plant Genetic Resource Institute, National Agriculture Research Center (NARC), Islamabad, while 12 exotic genotypes of tomato obtained from TGRC (Tomato Genetics Resource Center) California, USA. These experiments were conducted in the Stress Physiology Laboratory of the Department of Botany, Pir Mehr Ali Shah, Arid Agriculture University, Rawalpindi, Pakistan.
Germination assays: Germination trials were conducted in Petri dishes double lined with filter paper. Growth media contained four osmotic levels (0, 2.5%, 5.0% and 7.5% of PEG in full strength Hoagland nutrient solution (Hoagland and Arnon, 1950) in Petri dishes, to ensure adequate moisture for the seeds. Seed samples of 120 tomato genotypes were initially surface sterilized in 3% solution of sodium hypochlorite for 10 minutes and were rinsed three times with sterile water to eliminate residual chlorine, using muslin cloth. Fifteen surface sterilized seeds of tomato genotypes were spread in Petri dishes which were arranged in a completely randomized design with three replicates, four treatments and 120 genotypes, in growth cabinets. The seeds were examined daily and five ml of appropriate treatment solution was applied on alternate days for 14 days to each Petri dish after dripping out the previous solution. Seeds were not fully flooded in the solution to avoid anoxic conditions. Numbers of seeds germinated were observed and counted and germination data was recorded daily until the completion of two weeks (Anonymous, 1996). A seed was considered germinated when both plumule and radicle has emerged > 5 mm (Chartzoulakis and Klapaki, 2000). Rate of germination (1/t50, where t50 is the time to 50% of germination) was computed from untransformed data. Total germination was expressed as percent of that in control treatment for each tomato genotype and then data were arcsine transformed for the statistical analysis. Seedlings evaluation: Pre-germinated seeds of 120 tomato genotypes were planted in plastic containers of 200x100cm size with 25cm depth. Ten seedlings of same size of each genotype were transplanted hydroponically. Growth media contained four osmotic levels (0, 2.5%, 5.0% and 7.5%) of PEG8000 in full strength Hoagland nutrient solution (Hoagland and Arnon, 1950). Containers were arranged in a completely randomized design with three replicates. After about two weeks morphological parameters like shoot and root length, fresh and dry biomass and relative water content of each genotype were recorded. Plant material was dried at 70 oC and dry weights measured. Leaf relative water content was calculated using the equation below:
Leaf fresh weight – Leaf dry weight
Relative water content (%) = Leaf turgid weight – Leaf dry weight
X 100
Ranking of tomato genotypes for drought tolerance: The joint analysis of variables of different types (continuous and nominal/binary type) can provide intensify and inclusive information about a set of genotypes thus became an interesting substitute for both breeders and gene bank curators for a better quantification of genetic variability in tomato (Sudre et al., 2007 and Gonclaves et al., 2009). For comparing genotypes for drought tolerance; all the data were transformed following Zeng et al. (2002) into drought tolerance indices i.e., means of each parameter of drought stressed plants divided by the means of their respective controls. The cultivars were ranked in different groups by frequency
distribution. Usually, number of groups and class intervals set based on range of observations and general trend class intervals were determined as the difference between high and low drought tolerance indices. Furthermore, cluster group ranking numbers were also assigned to cluster groups based on cluster means and used to score genotypes. The cluster analysis was based on Wards minimum variance cluster analysis of the averages of the drought tolerance indices for all parameters (Ward, 1963). Tomato genotypes were ranked on the basis of Euclidean dissimilarity coefficient matrix based on phenograms, constructed on thirteen traits of genotypes under 2.5%, 5.0% and 7.5% of PEG8000. All the

SCREENING AND SELECTION OF TOMATO GENOTYPES/CULTIVARS FOR DROUGHT TOLERANCE 1167
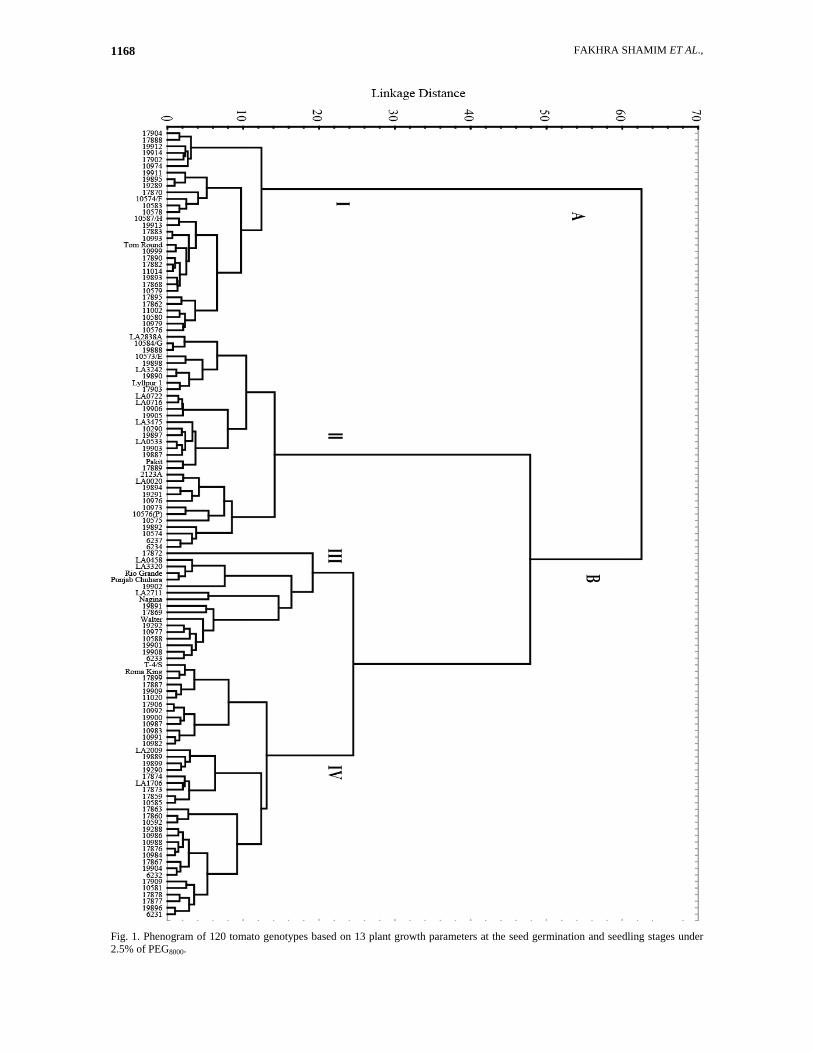
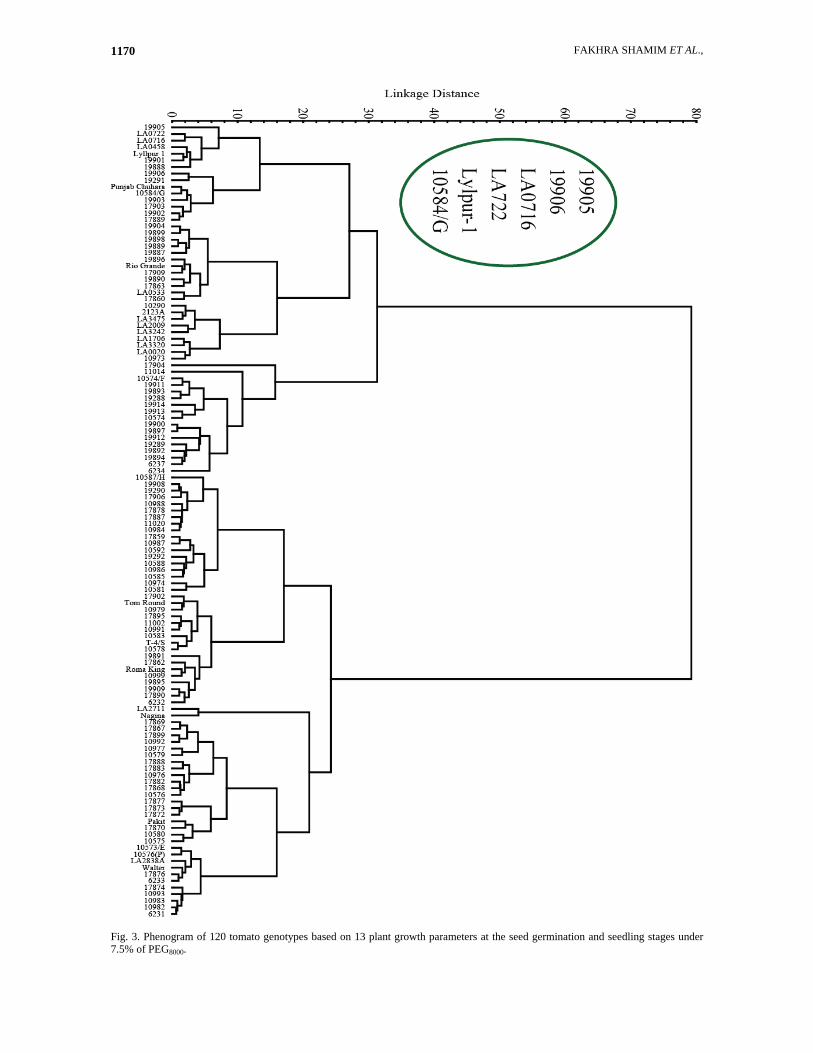
phenograms were constructed in order to support the grouping of the 120 tomato genotypes under drought stress condition. A sum was obtained by adding the number of cluster group ranking at each level in each genotype. The genotypes were finally ranked on the basis of sum, such that those with smallest and largest sums were ranked as the tolerant and sensitive genotypes, respectively in terms of relative drought tolerance. All the traits were analyzed by cluster analysis and principal component analysis with the help of software program ‘Statistca’ v 6.0 and ‘SPSS’ v 12.0 for windows. Results Cluster analysis based on 13 morphometric plant growth parameters: The results of our study revealed considerable phenotypical (and presumably genetic) diversity among tomato genotypes. The descriptive statistics for plant growth parameters in 120 tomato genotypes under control and varying levels (2.5%, 5.0% and 7.5%) of PEG8000 induced water deficit conditions is presented in Table 1. Phenograms constructed was based on thirteen biological traits of 120 tomato genotypes imposed by the use of PEG8000; maintaining three levels of osmotic stress (2.5%, 5.0% and 7.5 %) are presented in Figs. 1, 2 and 3 respectively. Their sum which was calculated by adding the number of cluster group, were used to rank at each level in every genotype is represented in Table 2. Comparison of genotypes indicated that all the characters studied upto seedling stage was considerably affected by water stress. It can be seen that the less water conditions depressed all the characters of all the genotypes. It was also observed from the data under drought conditions, the genotypes having substantial variation for growth attributes, were statistically different from each other for dry matter production. According to final ranking of genotypes based on clusters numbers four groups was made (Table 3), their means and standard deviation are presented in Table (4), principle component matrix is given in Table 5, whereas correlation matrix for growth parameters of the tomato genotypes under PEG8000 induced water stress is given in Table 6.
Tolerant group (group 1): In group 1, eighteen genotypes were placed which were 15.00 % of the total genotypes. It has been observed that except for two characters root dry weight (66.16) and shoot-to-root ratio; group 1 performed best for all parameters like germination percentage (69.3), germination rate (7.73), shoot length (0.92), root length (42.74), shoot fresh weight (34.59), shoot dry weight (12.13) root fresh weight (1.03) and relative water content (55.81) hence the group members designated as tolerant group, thus this group could be used for crop improvement under water deficit conditions. Moderately tolerant group (group 2): Group 2 accounts for 20.83 % of the total population and includes 25 genotypes. This group was very close to the tolerant group and has germination percentage (62.5), germination rate (7.45), shoot length (0.87), root length (31.13), shoot fresh weight (27.26), shoot dry weight (6.37) root fresh weight (0.87), root dry weight (74.68) and relative water content (50.48) hence the group members designated as moderately tolerant/intermediate group under drought stress conditions. Moderately sensitive group (group 3): Group 3 represents 24.17 % of the population and comprised of twenty nine genotypes. The genotypes from this group were with second highest shoot length (0.90) but their germination rate (5.48), root length (13.68), shoot fresh weight (16.40) shoot dry weight (3.43) root dry weight (76.38) were minimum with relative water content (35.56) thus, this group was intermediate/moderately sensitive in its performance. Sensitive group (group 4): Group 4 contributed 40.00 % to the population and comprising of forty eight genotypes. This group shows no significant performance for any trait and has less germination percentage (42.9), germination rate (5.51), shoot length (0.83), root length (16.86), shoot fresh weight (17.60), shoot dry weight (3.44) root fresh weight (0.86), root dry weight (80.77) and relative water content (32.13).
Table 1. Descriptive statistics for plant growth parameters in 120 tomato genotypes under control and varying
levels (2.5%, 5.0% and 7.5%) of PEG8000 induced water deficit conditions. Plant growth parameters Minimum value Maximum value Mean ± Standard error Germination percentage 61.1 98.3 79.7 ± 0.8 Germination rate (% day-1) 2.1 5.5 3.3 ± 0.1 Shoot fresh weight (mg) 15.6 155.8 58.0 ± 3.6 Root fresh weight (mg) 9.7 106.8 38.3 ± 2.1 Shoot dry weight (mg) 3.6 57.6 16.4 ± 1.1 Root dry weight (mg) 3.3 53.0 14.3 ± 1.0 Shoot/Root ratio 0.7 1.7 1.0 ± 0.01 Shoot Length (cm) 3.9 10.0 6.5 ± 0.1 Root Length (cm) 4.1 10.9 7.6 ± 0.2 Shoot/Root length ratio 0.7 1.3 0.9 ± 0.01 Shoot moisture content 43.7 90.1 72.4 ± 0.7 Root moisture content 43.4 89.6 69.6 ± 0.6 Relative water content (%) 34.9 82.3 52.0 ± 1.0
FAKHRA SHAMIM ET AL., 1168
Fig. 1. Phenogram of 120 tomato genotypes based on 13 plant growth parameters at the seed germination and seedling stages under 2.5% of PEG8000.

SCREENING AND SELECTION OF TOMATO GENOTYPES/CULTIVARS FOR DROUGHT TOLERANCE 1169
Fig. 2. Phenogram of 120 tomato genotypes based on 13 plant growth parameters at the seed germination and seedling stages under 5.0% of PEG8000.
FAKHRA SHAMIM ET AL., 1170
Fig. 3. Phenogram of 120 tomato genotypes based on 13 plant growth parameters at the seed germination and seedling stages under 7.5% of PEG8000.

SCREENING AND SELECTION OF TOMATO GENOTYPES/CULTIVARS FOR DROUGHT TOLERANCE 1171
Table 2. Ranking of the tomato genotypes for their relative drought tolerance of plant growth parameters at germination and seedling stages based on cluster analysis (Ward’s method).
PEG8000 levels Genotypes 2.5% 5.0% 7.5%
Drought tolerance rank ($)
19905 2 1 1 Tolerant 19906 2 1 1 Tolerant LA0716 2 1 1 Tolerant LA0722 2 1 1 Tolerant 11014 1 1 3 Tolerant 17889 2 2 1 Tolerant 17903 2 2 1 Tolerant 19289 1 1 3 Tolerant 19888 2 2 1 Tolerant 19893 1 1 3 Tolerant 19903 2 2 1 Tolerant 19911 1 1 3 Tolerant 19912 1 1 3 Tolerant 19913 1 1 3 Tolerant 19914 1 1 3 Tolerant 10574/F 1 1 3 Tolerant 10584/G 2 2 1 Tolerant Lyallpur-1 2 2 1 Tolerant 6234 2 1 3 Moderately tolerant 6237 2 1 3 Moderately tolerant 10574 2 1 3 Moderately tolerant 10578 1 1 4 Moderately tolerant 19291 2 3 1 Moderately tolerant 19887 2 2 2 Moderately tolerant 19890 2 2 2 Moderately tolerant 19892 2 1 3 Moderately tolerant 19894 2 1 3 Moderately tolerant 19897 2 1 3 Moderately tolerant 19898 2 2 2 Moderately tolerant 19901 3 2 1 Moderately tolerant 19902 3 2 1 Moderately tolerant P. Chuhara 3 2 1 Moderately tolerant LA3242 2 2 2 Moderately tolerant LA0533 2 2 2 Moderately tolerant LA0020 2 2 2 Moderately tolerant LA3475 2 2 2 Moderately tolerant 10973 2 3 2 Moderately tolerant 17904 1 3 3 Moderately tolerant Rio Grande 3 2 2 Moderately tolerant LA3320 3 2 2 Moderately tolerant 10973 2 3 2 Moderately tolerant 17904 1 3 3 Moderately tolerant Rio Grande 3 2 2 Moderately tolerant LA3320 3 2 2 Moderately tolerant 10576 1 3 4 Moderately sensitive 10579 1 3 4 Moderately sensitive 10580 1 3 4 Moderately sensitive 10583 1 3 4 Moderately sensitive 10974 1 3 4 Moderately sensitive 10979 1 3 4 Moderately sensitive

FAKHRA SHAMIM ET AL., 1172
Table 2. (Cont’d.). PEG8000 levels Genotypes
2.5% 5.0% 7.5% Drought tolerance rank ($)
10993 1 3 4 Moderately sensitive 10999 1 3 4 Moderately sensitive 11002 1 3 4 Moderately sensitive 17860 4 2 2 Moderately sensitive 17862 1 3 4 Moderately sensitive 17863 4 2 2 Moderately sensitive 17868 1 3 4 Moderately sensitive 17882 1 3 4 Moderately sensitive 17883 1 3 4 Moderately sensitive 17888 1 3 4 Moderately sensitive 17890 1 3 4 Moderately sensitive 17895 1 3 4 Moderately sensitive 17902 1 3 4 Moderately sensitive 19288 4 1 3 Moderately sensitive 19889 4 2 2 Moderately sensitive 19895 1 3 4 Moderately sensitive 19899 4 2 2 Moderately sensitive 19900 4 1 3 Moderately sensitive 19904 4 2 2 Moderately sensitive Tom Round 1 3 4 Moderately sensitive LA2838A 2 2 4 Moderately sensitive LA2009 4 2 2 Moderately sensitive LA1706 4 2 2 Moderately sensitive 10576 1 3 4 Moderately sensitive 10579 1 3 4 Moderately sensitive 10580 1 3 4 Moderately sensitive 10583 1 3 4 Moderately sensitive 10974 1 3 4 Moderately sensitive 10979 1 3 4 Moderately sensitive 10993 1 3 4 Moderately sensitive 10999 1 3 4 Moderately sensitive 11002 1 3 4 Moderately sensitive 17860 4 2 2 Moderately sensitive 17862 1 3 4 Moderately sensitive 17863 4 2 2 Moderately sensitive 17868 1 3 4 Moderately sensitive 17882 1 3 4 Moderately sensitive 17883 1 3 4 Moderately sensitive 17888 1 3 4 Moderately sensitive 17890 1 3 4 Moderately sensitive 17895 1 3 4 Moderately sensitive 17902 1 3 4 Moderately sensitive 19288 4 1 3 Moderately sensitive 19889 4 2 2 Moderately sensitive 19895 1 3 4 Moderately sensitive 19899 4 2 2 Moderately sensitive 19900 4 1 3 Moderately sensitive 19904 4 2 2 Moderately sensitive Tom Round 1 3 4 Moderately sensitive LA2838A 2 2 4 Moderately sensitive LA2009 4 2 2 Moderately sensitive

SCREENING AND SELECTION OF TOMATO GENOTYPES/CULTIVARS FOR DROUGHT TOLERANCE 1173
Table 2. (Cont’d.). PEG8000 levels Genotypes
2.5% 5.0% 7.5% Drought tolerance rank ($)
LA1706 4 2 2 Moderately sensitive 10575 2 3 4 Sensitive 10976 2 3 4 Sensitive 17870 1 4 4 Sensitive 17872 3 2 4 Sensitive 17909 4 3 2 Sensitive 19896 4 3 2 Sensitive 10587/H 1 4 4 Sensitive 6232 4 2 4 Sensitive 10576(P) 2 4 4 Sensitive 10585 4 2 4 Sensitive 10977 3 3 4 Sensitive 17905 4 2 4 Sensitive 17906 4 2 4 Sensitive 19891 3 3 4 Sensitive 19908 3 3 4 Sensitive 10573/E 2 4 4 Sensitive Pakit 2 4 4 Sensitive 6233 3 4 4 Sensitive 10588 3 4 4 Sensitive 10984 4 3 4 Sensitive 10991 4 3 4 Sensitive 11020 4 3 4 Sensitive 17887 4 3 4 Sensitive 19290 4 3 4 Sensitive 19292 3 4 4 Sensitive 19909 4 3 4 Sensitive Roma King 4 3 4 Sensitive T-4/S 4 3 4 Sensitive Walter 3 4 4 Sensitive Nagina 3 4 4 Sensitive LA2711 3 4 4 Sensitive 6231 4 4 4 Sensitive 10581 4 4 4 Sensitive 10592 4 4 4 Sensitive 10982 4 4 4 Sensitive 10983 4 4 4 Sensitive 10986 4 4 4 Sensitive 10987 4 4 4 Sensitive 10988 4 4 4 Sensitive 10992 4 4 4 Sensitive 17859 4 4 4 Sensitive 17867 4 4 4 Sensitive 17873 4 4 4 Sensitive 17874 4 4 4 Sensitive 17876 4 4 4 Sensitive 17877 4 4 4 Sensitive 17899 4 4 4 Sensitive Legend $; Tolerant, sum of clusters at three levels of PEG8000 is 4 and 5 Moderately tolerant, sum of clusters at three levels of PEG8000 is 6 and 7 Moderately sensitive, sum of clusters at three levels of PEG8000 is 8 and 9 Sensitive, sum of clusters at three levels of PEG8000 is > 9

FAKHRA SHAMIM ET AL., 1174
Table 3. Groups membership based on cluster analysis from relative data in 120 tomato genotypes. Group No. Frequency Genotypes
19905 19906 LA0716 LA0722 Group 1 18 11014 17889 17903 19289
19888 19893 19903 19911 19912 19913 19914 10574/F 10584/G Lyllpur-1
Group 2 25 6234 6237 10574 10578 19291 19887 19890 19892 19894 19897 19898 19901 19902 P.Chuhara LA3242 LA0533 LA0020 LA3475 LA0458 10290 2123A 10973 17904 Rio Grande LA3320
Group 3 29 10576 10579 10580 10583 10974 10979 10993 10999 11002 17860 17862 17863 17868 17882 17883 17888 17890 17895 17902 19288 19889 19895 19899 19900 19904 Tom Round LA2838A LA2009 LA1706
Group 4 48 10575 10976 17870 17872 17909 19896 10587/H 6232 10576 (P) 10585 10977 17869 17878 17906 19891 19908 10573/E Pakit 6233 10588 10984 10991 11020 17887 19290 19292 19909 Roma King T-4/S Walter Nagina LA2711 6231 10581 10592 10982 10983 10986 10987 10988 10992 17859 17867 17873 17874 17876 17877 17899
Table 4. Tolerance-rank wise means for morphometric parameters recorded under PEG8000 induced stress.
Tolerant Moderately tolerant
Moderately sensitive Sensitive
Growth parameters Mean Mean Mean Mean Germination percentage 68.3(1.45) 62.5(1.29) 45.9(0.91) 42.9(0.62) Germination rate 7.73(1.98) 7.45(1.46) 5.48(1.58) 5.50(1.09) Shoot length (cm) 0.92(0.11) 0.87(0.15) 0.90(0.15) 0.83(0.14) Root length (cm) 42.74(37.52) 31.13(23.58) 13.68(9.09) 16.86(7.82) Shoot-to-root length Ratio 14.67(14.50) 6.24(3.05) 3.15(2.06) 3.20(1.41) Shoot fresh weight (mg) 34.59(21.25) 27.26(10.49) 16.40(8.15) 17.60(6.39) Shoot dry weight (mg) 12.13(9.83) 6.37(2.49) 3.43(2.21) 3.44(1.49) Root fresh weight (mg) 1.03(0.36) 0.87(0.15) 0.87(0.14) 0.86(0.11) Root dry weight (mg) 66.16(11.99) 74.68(10.14) 76.38(6.05) 80.77(5.06) shoot-to-root ratio 69.42(7.39) 76.11(10.21) 81.73(5.09) 83.58(4.49) Shoot moisture content 49.87(18.48) 42.30(13.61) 33.73(9.02) 31.07(6.58) Root moisture content 10.94(3.26) 10.27(2.19) 8.39(1.48) 8.94(1.08) Relative water content (%) 55.81(14.33) 50.48(25.95) 35.56(20.69) 32.13(21.42)

SCREENING AND SELECTION OF TOMATO GENOTYPES/CULTIVARS FOR DROUGHT TOLERANCE 1175
Table 5. Principal Component Analysis of 120 tomato genotypes for thirteen biological attributes at seed germination and seedling stages under varying levels (2.5%, 5.0% and 7.5%) of PEG8000.
PC1 PC2 Eigen values 7.44 1.90 Proportion of variance 57.19 14.61 Cumulative variance 57.19 71.80 Growth parameters Communalities Eigenvector Germination percentage 0.81 0.89 -0.15 Germination rate 0.81 0.87 0.22 Shoot Length 0.44 -0.15 -0.65 Root Length 0.80 0.88 0.17 Shoot -to-root length ratio 0.85 0.90 -0.19 Shoot fresh weight 0.84 0.91 0.05 Shoot dry weight 0.88 0.91 -0.24 Root fresh weight 0.32 0.56 0.08 Root dry weight 0.72 -0.46 0.71 Shoot -to-root ratio 0.77 -0.54 0.69 Shoot moisture content 0.77 0.85 0.20 Root moisture content 0.91 0.89 0.34 Relative water content 0.44 0.55 0.37
Table 6. Correlation matrix for growth parameters of the tomato genotypes under PEG8000 induced water stress.
Growth parameters Germination percentage
Rate of germination
Shoot length
Root length
Shoot fresh weight
Shoot dry weight
Root fresh weight
Root dry weight
Shoot-to-root ratio
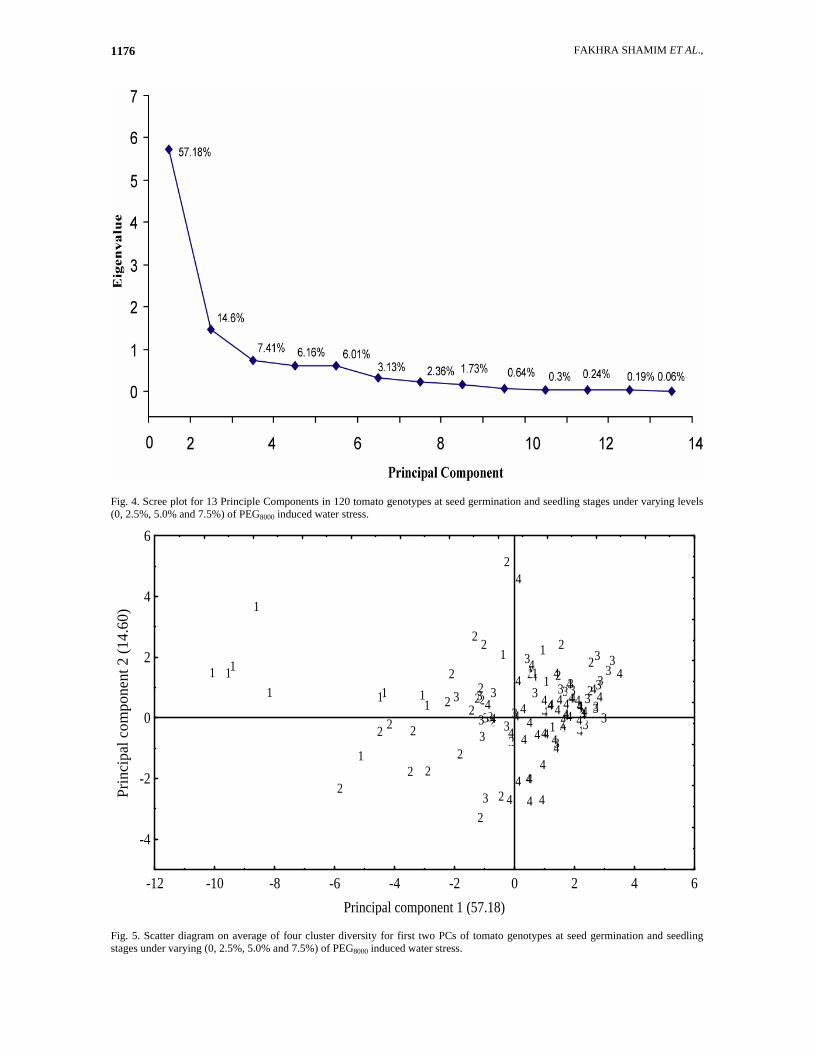
Germination rate 0.80** Shoot length 0.72** 0.79** Root length 0.72** 0.77** 0.84** Shoot fresh weight 0.65** 0.74** 0.75** 0.79** Shoot dry weight 0.65** 0.81** 0.74** 0.79** 0.89** Root fresh weight 0.64** 0.77** 0.81** 0.84** 0.89** 0.92** Root dry weight 0.65** 0.78** 0.73** 0.78** 0.86** 0.96** 0.93** Shoot moisture content -0.12 -0.17 -0.16 -0.10 0.16 -0.19 -0.08 -0.20 -0.13 Root moisture content -0.39** -0.40** -0.28** -0.22 -0.22 -0.40** -0.18 -0.44** -0.02 Relative water content 0.56** 0.67** 0.66** 0.59** 0.55** 0.65** 0.62** 0.57** 0.39** * = Significant at the 0.05 probability level ** = Significant at the 0.01 probability level Principle component analysis based on plant growth parameters: The variation among genotypes was also computed through Principle Component. Eigenvalues of thirteen principle components drought stress potential is shown in scree plot (Fig. 4) and principle component matrix/analysis is given in (Table 5). The data revealed that under drought stress (mean values) two principle components having greater than 1 Eigenvalues contributed 71.80 % of the total variation among 120 genotypes of tomato. It was found that two Principle Component 1 (PC1) contributed 57.19%, whereas, PC2 contributed 14.61% of the total variation. Ten biological characters which contributed more positively to PC1 were shoot fresh and dry weight (0.91), germination percentage (0.89), root length (0.88), and rate of germination (0.87). Moreover, root fresh weight and relative water content contributed (0.56) and (0.55), respectively. While shoot length and root dry weight under present study in PC1 contributed less than 0.5, which showed non-significant genetic variance. This indicated that the populations with greater PC1 values produced more shoot fresh and dry weighs under different levels of PEG8000 and exhibited maximum germination percentage and rate of germination thus seedling maintained root length and fresh weight of
roots. Maximum genetic variance to PC2 was contributed by only two traits: root dry weight (0.71) and shoot-to root ratio (0.69) which contributed more positively. Relative water content, germination rate, root length, root and shoot fresh weight contributed positively but not significant. Germination percentage, shoot dry weight and shoot length in this component have negative association but non-significant. It is evident that under water deficit conditions maximum biological traits contributed more positively to PC1 (57.19%) and hence could be given considerable importance for the four groups based on thirteen traits of tomato genotypes. When PC1 was plotted against PC2, although there was not complete separation of four groups but maximum separation was between group 2, 3 and 4 but maximum mixing up of groups was in moderately sensitive and sensitive groups (3 and 4). Moreover, maximum mixing was also exhibited by groups 1 and 2 presented in scatter diagram (Fig. 5). The correlation coefficients among plant growth parameters were computed and are presented in (Table 6). The results of present investigation revealed water stress tolerance was positively correlated with growth attributes. So, scatterplot among (120) tomato genotypes was developed in order to determine stress tolerance.
FAKHRA SHAMIM ET AL., 1176
Fig. 4. Scree plot for 13 Principle Components in 120 tomato genotypes at seed germination and seedling stages under varying levels (0, 2.5%, 5.0% and 7.5%) of PEG8000 induced water stress.
4
1 1
1
1
1
11
1
1
1
11
1
1111
2
2 22
22
22
2
22
2
2
2
22
2
2
2
2
2
2
2
2
2
33
33
3
33
3
3
3
3
33
33
333
3
3
3 33 3
33
3
3
34
4
4
4
4444
4
4
4
4444
4
4
4 444
4 4
44
4
4 44
4 444
44 4
44 4 4
4
44
4
44
44
-12 -10 -8 -6 -4 -2 0 2 4 6Principal component 1 (57.18)
-4
-2
0
2
4
6
Prin
cipa
l com
pone
nt 2
(14.
60)
Fig. 5. Scatter diagram on average of four cluster diversity for first two PCs of tomato genotypes at seed germination and seedling stages under varying (0, 2.5%, 5.0% and 7.5%) of PEG8000 induced water stress.
SCREENING AND SELECTION OF TOMATO GENOTYPES/CULTIVARS FOR DROUGHT TOLERANCE 1177
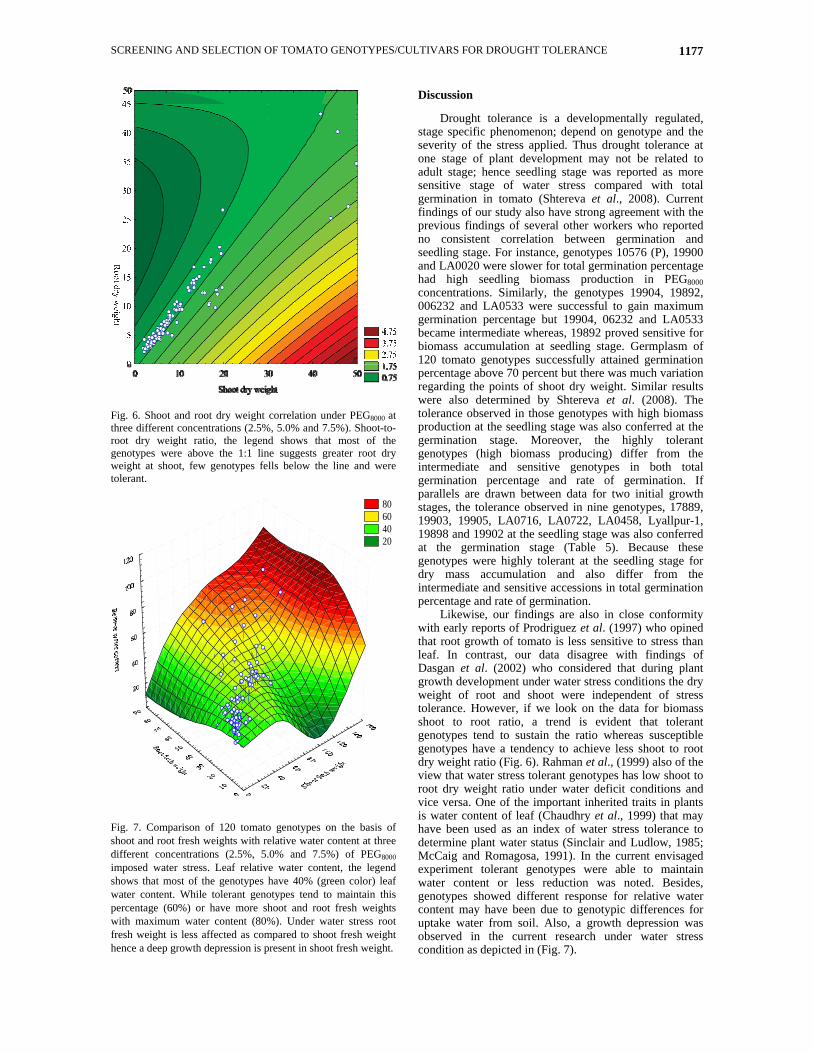
Fig. 6. Shoot and root dry weight correlation under PEG8000 at three different concentrations (2.5%, 5.0% and 7.5%). Shoot-to-root dry weight ratio, the legend shows that most of the genotypes were above the 1:1 line suggests greater root dry weight at shoot, few genotypes fells below the line and were tolerant.
80 60 40 20
Fig. 7. Comparison of 120 tomato genotypes on the basis of shoot and root fresh weights with relative water content at three different concentrations (2.5%, 5.0% and 7.5%) of PEG8000 imposed water stress. Leaf relative water content, the legend shows that most of the genotypes have 40% (green color) leaf water content. While tolerant genotypes tend to maintain this percentage (60%) or have more shoot and root fresh weights with maximum water content (80%). Under water stress root fresh weight is less affected as compared to shoot fresh weight hence a deep growth depression is present in shoot fresh weight.
Discussion
Drought tolerance is a developmentally regulated, stage specific phenomenon; depend on genotype and the severity of the stress applied. Thus drought tolerance at one stage of plant development may not be related to adult stage; hence seedling stage was reported as more sensitive stage of water stress compared with total germination in tomato (Shtereva et al., 2008). Current findings of our study also have strong agreement with the previous findings of several other workers who reported no consistent correlation between germination and seedling stage. For instance, genotypes 10576 (P), 19900 and LA0020 were slower for total germination percentage had high seedling biomass production in PEG8000 concentrations. Similarly, the genotypes 19904, 19892, 006232 and LA0533 were successful to gain maximum germination percentage but 19904, 06232 and LA0533 became intermediate whereas, 19892 proved sensitive for biomass accumulation at seedling stage. Germplasm of 120 tomato genotypes successfully attained germination percentage above 70 percent but there was much variation regarding the points of shoot dry weight. Similar results were also determined by Shtereva et al. (2008). The tolerance observed in those genotypes with high biomass production at the seedling stage was also conferred at the germination stage. Moreover, the highly tolerant genotypes (high biomass producing) differ from the intermediate and sensitive genotypes in both total germination percentage and rate of germination. If parallels are drawn between data for two initial growth stages, the tolerance observed in nine genotypes, 17889, 19903, 19905, LA0716, LA0722, LA0458, Lyallpur-1, 19898 and 19902 at the seedling stage was also conferred at the germination stage (Table 5). Because these genotypes were highly tolerant at the seedling stage for dry mass accumulation and also differ from the intermediate and sensitive accessions in total germination percentage and rate of germination.
Likewise, our findings are also in close conformity with early reports of Prodriguez et al. (1997) who opined that root growth of tomato is less sensitive to stress than leaf. In contrast, our data disagree with findings of Dasgan et al. (2002) who considered that during plant growth development under water stress conditions the dry weight of root and shoot were independent of stress tolerance. However, if we look on the data for biomass shoot to root ratio, a trend is evident that tolerant genotypes tend to sustain the ratio whereas susceptible genotypes have a tendency to achieve less shoot to root dry weight ratio (Fig. 6). Rahman et al., (1999) also of the view that water stress tolerant genotypes has low shoot to root dry weight ratio under water deficit conditions and vice versa. One of the important inherited traits in plants is water content of leaf (Chaudhry et al., 1999) that may have been used as an index of water stress tolerance to determine plant water status (Sinclair and Ludlow, 1985; McCaig and Romagosa, 1991). In the current envisaged experiment tolerant genotypes were able to maintain water content or less reduction was noted. Besides, genotypes showed different response for relative water content may have been due to genotypic differences for uptake water from soil. Also, a growth depression was observed in the current research under water stress condition as depicted in (Fig. 7).

FAKHRA SHAMIM ET AL., 1178
Therefore, drought tolerance of five tolerant included two wild; ‘Lycopersicon pennellii’ and ‘Lycopersicon chilense’ ‘Lyallpur-1’, ‘17889’ and ‘10584/G’, four moderate, ‘Punjab Chuhara’, ‘Pusa Ruby’ and ‘Ailsa Craig’ and three sensitive, ‘Roma’, ‘Avinash-2’ and ‘Ratan’ were confirmed on the basis of biomass production at seedling stage. In these selected eleven genotypes it was observed that there was absence of consistent relationship between germination and seedling stage. L. pennellii was successful to gain 98 percent germination percentage but L. chilense scored germination percentage less than other tolerant genotypes. Similarly both rate of germination of wild genotypes was less than other tolerant group. But maximum shoot dry weight and relative water content recorded in L. pennellii and L. chilense along with tolerant genotypes. Similarly, this subset of 11 tomato genotypes was also exhibited variation in shoot, root length and fresh weight. Tolerant genotypes attained more biomass under stress conditions. However, since the degree of water stress tolerance varies with the change in developmental stage, it is suggested to assess water stress tolerance in selected 11 genotypes at the adult stage. This will definitely help in introducing new varieties with higher yield in different environmental conditions of low water supply. Acknowledgements
The authors acknowledge the National Agriculture Research Center, PGRI, Islamabad, Pakistan and C.M. Rick, Tomato Genetics Resource Center, University of California UC Davis, USA, for supplying the tomato germplasm. The work presented in this manuscript is part of Ph. D. research work being conducted by Ms. Fakhra Shamim. References Agong, S.G., S. Schittenhelm and W. Friedt. 2001. Genotypic
variation of Kenyan tomato (Lycopersicon esculentum L.) germplasm. J. Food Tech. in Africa, 6: 13-17.
Anonymous. 1996. ISTA., International rules for seed testing. Rules-Seed Science & Technology. 24: supplement.
Chaudhry, M.F., K.M. Khokhar, S.I. Hussain, T. Mahmood and S.M. Iqbal. 1999. Comparative performance of local and exotic tomato cultivars during spring and autumn season. Pak. J. Arid Agric., 2(2): 7-10.
Dias, J.S. 2010. Impact of improved vegetable cultivars in overcoming food insecurity. Euphytca, 176: 125-136.
Dias, J.S. 2014. Guiding strategies for breeding vegetables. Agric. Sci. 5: 9-32.
Chartzoulakis, K. and G. Klapaki. 2000. Response of two greenhouse pepper hybrids to NaCl salinity during different growth stages. Sci. Hort., 86: 247-260.
Cuartero, A.R. and T.J. Flowers. 1992. Selection of donors for salt tolerance in tomato using physiological traits. New Phytol., 121(1): 63-69.
Dasgan, H.Y., H. Aktas, K. Abak and I. Cakmak. 2002. Determination of screening techniques to salinity tolerance in tomatoes and investigation of genotype responses. Plant Sci., 163: 695-703.
Frankel, N., E. Hasson, N.D. Iusem and M.S. Rossi. 2003. Adaptive evolution of the water stress induced gene Asr2 in Lycopersicon species dwelling in arids habitats. Mol. Biol. Evol., 20(12): 1955-1962.
Ghafoor, A., Z. Ahmad, N.I. Hashmi and M. Bashir. 2009. Genetic diversity based on agronomic traits and SDS-PAGE markers in relation to geographic pattern of black gram [Vigna mungo (L.) Hepper]. J. Genet. & Breed., 57: 5-14. Pak. J. Bot., 41(3): 1117-1126.
Goncalves, L.S.A., R. Rodrigues, A.T.A. Junior, M. Karasawa and C.P. Sudre. 2009. Heirloom tomato gene bank: assessing genetic divergence based on morphological, agronomic and molecular data using a Ward-modification location model. Genet. Mol. Res., 8(1): 364-374.
Gosal, S.S., S.H. Wani and M.S. Khan. 2009. Biotechnology and drought tolerance. J. Crop Improvement, 23(1): 19-54.
Gunathilake, P.M.P., C.K. Banadara and S. Samarajeewa. 2004. Genetic diversity and pahogencity of Ralstonia solanacearum E.F. Smith in tomato (Lycopersicon esculentum Mill.) in Kandy, Matale and Monaragala districts. Trop. Agic. Research, 16: 51-60.
Hoagland, D.R. and D.I. Arnon.1950. The water culture for growing plants without soil. Calif. Agic. Expt. Station Circ. 347, Univ. California, Berkeley Press, CA.
Kulkarni, M. and U. Deshpande. 2007. In vitro screening of tomato genotypes for drought resistance using polyethylene glycol. Afr. J. Biotechnol., 6(6): 691-696.
McCaig, T.N. and I. Romagosa. 1991. Water status measurements of excised leaves: Position and age effects. Crop Sci., 31(6): 1583-1588.
Nikolic, D., E.V. Rakonjac, E.D. Milatovic, E.M. Fotiric. 2010. Multivariate analysis of vineyard peach [Prunus persica (L.) Batsch.] germplasm collection. Euphytca, 171: 227-234.
Parry, M., P.J. Andraloje, S. Khan, P.J. Lea and A. Keys. 2002. Rubisco activity: effect of drought stress. Ann. Bot., 89: 833-639.
Prodriguez, P., J.D. Amico, D. Morakes, M.J.S. Blanco and J.J Alarcon. 1997. Effects of salinity on growth, shoot water relations and root hydraulic conductivity in tomato plants. J. Agic. Sci., 128: 439-444.
Rahman, S.M.L., E. Nawata and T. Sakuratani. 1999. Effect of water stress on growth, yield and eco-physiological responses of four tomato (Lycopersicon esculentum Mill.) cultivars. J. Jap. Society Hort. Sci., 68(3): 499-504.
Samovol, A.P., A.A. Zhuchenko and V.A. Dobryanskii. 1996. Cluster analysis of the rate at rate at which segregating populations attain homogeneity and rec genes attain homozygosity in tomato. Tsitologiya-i-Genetika, 30(2): 34-40.
Shtereva, L., B. Atanassova, T. Karcheva and V. Petkov. 2008. The effect of water stress on the growth rate, water content and proline accumulation in tomato calli and seedlings Acta. Hort., 789: 189-197.
Sinclair, T. and M. Ludlow. 1985. Who taught plants thermodynamics? The unfulfilled potential of plant water potential. Aust. J. Plant Physiol., 12: 213-217.
Simmonds, N.W. 1979. Principles of crop improvement. London, New York: Longman.
Ward, J.H. 1963. Hierarchical grouping to optimize an objective function. J. Am. Stat. Ass., 58(301): 236-244.
Zeng, L., M.C. Shannon and C.M. Grieve. 2002. Evaluation of salt tolerance in rice genotypes by multiple agronomic parameters. Euphytica, 127: 235-245.
(Received for publication 5 March 2013)