Screening and Diagnosing Gestational Diabetes Mellitus...Gestational Diabetes Mellitus Gestational...
32
Evidence-Based Practice Evidence-based Practice Program The Agency for Healthcare Research and Quality (AHRQ), through its Evidence- based Practice Centers (EPCs), sponsors the development of evidence reports and technology assessments to assist public- and private-sector organizations in their efforts to improve the quality of health care in the United States. The reports and assessments provide organizations with comprehensive, science-based information on common, costly medical conditions and new health care technologies. The EPCs systematically review the relevant scientific literature on topics assigned to them by AHRQ and conduct additional analyses when appropriate prior to developing their reports and assessments. AHRQ expects that the EPC evidence reports and technology assessments will inform individual health plans, providers, and purchasers as well as the health care system as a whole by providing important information to help improve health care quality. The full report and this summary are available at www.effectivehealthcare. ahrq.gov/reports/final.cfm. Introduction Gestational Diabetes Mellitus Gestational diabetes mellitus (GDM) is defined as glucose intolerance first discovered in pregnancy. Pregestational diabetes mellitus refers to any type of diabetes diagnosed before pregnancy. Pregnant women with pregestational diabetes experience an increased risk of poor maternal, fetal, and neonatal outcomes. 1 The extent to which GDM predicts adverse outcomes for mother, fetus, and neonate is less clear. Depending on the diagnostic criteria used and the population screened, the prevalence of GDM ranges from 1.1 to 25.5 percent of pregnancies in the United States. 2-4 In 2009, the Centers for Disease Control and Prevention reported a prevalence of 4.8 percent of diabetes in pregnancy. An estimated 0.5 percent of these cases likely represented women with pregestational diabetes. Data from the international Hyperglycemia and Adverse Pregnancy Outcome (HAPO) study 3 indicate that 6.7 percent of the women met a fasting plasma glucose threshold of 95 mg/dL (5.3 mmol/L), which is in keeping with the Carpenter and Coustan 5 (CC) criteria that are in common practice in North America. In contrast, 17.8 percent of women were diagnosed with GDM using the International Association of the Diabetes in Pregnancy Study Groups (IADPSG) criteria in which lower glucose thresholds diagnose GDM. Evidence Report/Technology Assessment Number 210 Screening and Diagnosing Gestational Diabetes Mellitus Executive Summary
Transcript of Screening and Diagnosing Gestational Diabetes Mellitus...Gestational Diabetes Mellitus Gestational...
Evidence-Based Practice
Evidence-based Practice Program
The Agency for Healthcare Research and Quality (AHRQ), through its Evidence-based Practice Centers (EPCs), sponsors the development of evidence reports and technology assessments to assist public- and private-sector organizations in their efforts to improve the quality of health care in the United States. The reports and assessments provide organizations with comprehensive, science-based information on common, costly medical conditions and new health care technologies. The EPCs systematically review the relevant scientific literature on topics assigned to them by AHRQ and conduct additional analyses when appropriate prior to developing their reports and assessments.AHRQ expects that the EPC evidence reports and technology assessments will inform individual health plans, providers, and purchasers as well as the health care system as a whole by providing important information to help improve health care quality.The full report and this summary are available at www.effectivehealthcare.ahrq.gov/reports/final.cfm.
Introduction
Gestational Diabetes Mellitus
Gestational diabetes mellitus (GDM) is defined as glucose intolerance first discovered in pregnancy. Pregestational diabetes mellitus refers to any type of diabetes diagnosed before pregnancy. Pregnant women with pregestational diabetes experience an increased risk of poor maternal, fetal, and neonatal outcomes.1 The extent to which GDM predicts adverse outcomes for mother, fetus, and neonate is less clear.
Depending on the diagnostic criteria used and the population screened, the prevalence of GDM ranges from 1.1 to 25.5 percent of pregnancies in the United States.2-4 In 2009, the Centers for Disease Control and Prevention reported a prevalence of 4.8 percent of diabetes in pregnancy. An estimated 0.5 percent of these cases likely represented women with pregestational diabetes. Data from the international Hyperglycemia and Adverse Pregnancy Outcome (HAPO) study3 indicate that 6.7 percent of the women met a fasting plasma glucose threshold of 95 mg/dL (5.3 mmol/L), which is in keeping with the Carpenter and Coustan5 (CC) criteria that are in common practice in North America. In contrast, 17.8 percent of women were diagnosed with GDM using the International Association of the Diabetes in Pregnancy Study Groups (IADPSG) criteria in which lower glucose thresholds diagnose GDM.
Evidence Report/Technology Assessment Number 210
Screening and Diagnosing Gestational Diabetes Mellitus
Executive Summary
2
The prevalence of GDM is not only influenced by diagnostic criteria but also by population characteristics. In a recent publication, data from the Hyperglycemia and Adverse Pregnancy Outcome Study (HAPO) demonstrated wide variability in GDM prevalence across a number of study centers, both internationally and within the United States, even when the same diagnostic criteria are applied (i.e., the IADPSG criteria).6 Prevalence in the United States ranged from 15.5 percent in Providence, RI, to 25.5 percent in Bellflower, CA. There are ethnic differences in the prevalence of GDM in the United States. Native Americans, Asians, Hispanics, and African-American women are at higher risk than non-Hispanic white women.7 Data from 2000 showed that prevalence was highest among Asian and Hispanic women (~7 to 8 percent), intermediate among African-American women (~6 percent), and lower among non-Hispanic white women (~5 percent) based on CC criteria and/or hospital discharge diagnosis.7 The rate of increase of prevalence over the past 10 years has been highest for Asian and African-American women.7
The incidence of GDM has increased over the past decades in parallel with the increase in rates of obesity and type 2 diabetes mellitus, and this trend is expected to continue.8 It is unclear how much the increase in obesity will affect the proportion of women diagnosed with overt diabetes during pregnancy versus transient pregnancy-induced glucose intolerance.
GDM is usually diagnosed after 20 weeks’ gestation when placental hormones that have the opposite effect of insulin on glucose metabolism increase substantially. Women with adequate insulin secreting capacity overcome this insulin resistance of pregnancy by secreting more endogenous insulin to maintain normal blood glucose. Women with less adequate pancreatic reserve are unable to produce sufficient insulin to overcome the increase in insulin resistance, and glucose intolerance results.
Glucose abnormalities in women with GDM usually resolve postpartum, but commonly recur in subsequent pregnancies. Women with GDM have an increased risk of future development of overt diabetes. The cumulative incidence of diabetes after a diagnosis of GDM varies widely depending on maternal body mass index (BMI), ethnicity, and time since index pregnancy, and it may reach levels as high as 60 percent.9 When glucose abnormalities persist postpartum in a woman with GDM, her diabetes is recategorized as overt diabetes. When this occurs, the likelihood that this woman had pregestational (i.e., overt) diabetes increases, especially if the diagnosis of GDM occurred before 20 weeks’ gestation and glucose levels were markedly elevated in pregnancy.
Studies investigating pregnancy outcomes of women with GDM show considerable variability in the proportion of women with suspected pregestational diabetes. This variability contributes to the confusion surrounding the true morbidity of GDM. In an attempt to enable better comparability across future studies and more accurate risk stratification of pregnant women with diabetes, recommendations10 have proposed that women with more severe glucose abnormalities in pregnancy be excluded from the diagnosis of GDM. The expectation is that this would exclude women with overt diabetes from the population of women defined as having GDM. This proposal is in contrast to the older definition of GDM, which includes any degree of glucose intolerance first discovered in pregnancy.
Risk Factors
Risk factors for GDM include greater maternal age, higher BMI, member of an ethnic group at increased risk for development of type 2 diabetes mellitus (i.e., Hispanic, African, Native American, South or East Asian, or Pacific Islands ancestry), polyhydramnios, past history of GDM, macrosomia in a previous pregnancy, history of unexplained stillbirth, type 2 diabetes mellitus in a first degree relative, polycystic ovary syndrome, and metabolic syndrome.11 Low risk of GDM is usually defined as young (age less than 25 or 30 years), non-Hispanic white, normal BMI (25 kg/m2 or less), no history of previous glucose intolerance or adverse pregnancy outcomes associated with GDM, and no first degree relative with known diabetes.7,12 Women at high risk of GDM are usually defined as having two or more risk factors for GDM. Women at moderate risk of GDM do not satisfy all criteria of women at low risk, but they lack two or more risk factors for GDM.
Screening and Diagnostic Strategies
The 2008 U.S. Preventive Services Task Force (USPSTF) evidence review on screening for GDM concluded that at that time, “evidence was insufficient to assess the balance of benefits and harms of screening for GDM either before or after 24 weeks’ gestation.”13 The report suggested that “…until there was better evidence, clinicians should discuss screening for GDM with their patient and make case-by-case decisions. Discussions should include information about the uncertainty of benefits and harms as well as the frequency of positive screening test results.”
The 2001 practice guidelines of the American College of Obstetricians and Gynecologists (ACOG) endorsed risk factor-based screening for GDM, recognizing that low-risk women may be less likely to benefit from screening with glucose measurements. Women were considered low risk
3
of GDM if they met all the following criteria: (1) younger than 25 years; (2) not a member of an ethnic group at high risk for development of type 2 diabetes mellitus; (3) BMI of 25 kg/m2 or less; (4) no history of previous glucose intolerance or adverse pregnancy outcomes associated with GDM; and (5) no first degree relative with known diabetes. ACOG plans to update its 2001 practice guidelines on GDM based on the proceedings of the 2012 National Institutes of Health consensus conference on GDM diagnosis. Until 2011, the American Diabetes Association (ADA) also endorsed no screening for pregnant woman who met all the criteria mentioned above for low risk of GDM. In 2011 the ADA changed their recommendations to endorse glucose testing for GDM in all pregnant women who do not have a diagnosis of pregestational diabetes.
Common practices of glucose screening for GDM in North America involve a two-step approach in which patients with abnormal results on a screening test receive a subsequent diagnostic test.14 Typically, a 50 g oral glucose challenge test (OGCT) is initially administered between 24 and 28 weeks’ gestation in a nonfasting state, in women at moderate risk (i.e., women who do not meet all low risk criteria but lack two or more risk factors for GDM). The test is administered earlier in gestation for women at high risk of GDM (i.e., multiple risk factors for GDM) and repeated at 24–28 weeks’ gestation if initial surveillance is normal. Patients who meet or exceed a screening threshold (usually 130 mg/dL or 140 mg/dL) receive a more involved diagnostic test—the oral glucose tolerance test (OGTT), in which a 75 g or 100 g oral glucose load is administered in a fasting state, and plasma glucose levels are evaluated after 1, 2, or 3 hours. A diagnosis of GDM is made in pregnant women when one or more glucose values fall at or above the specified glucose thresholds. Alternatively, a one-step method in which all patients or high-risk patients forego the screening test and proceed directly to the OGTT has been recommended.15
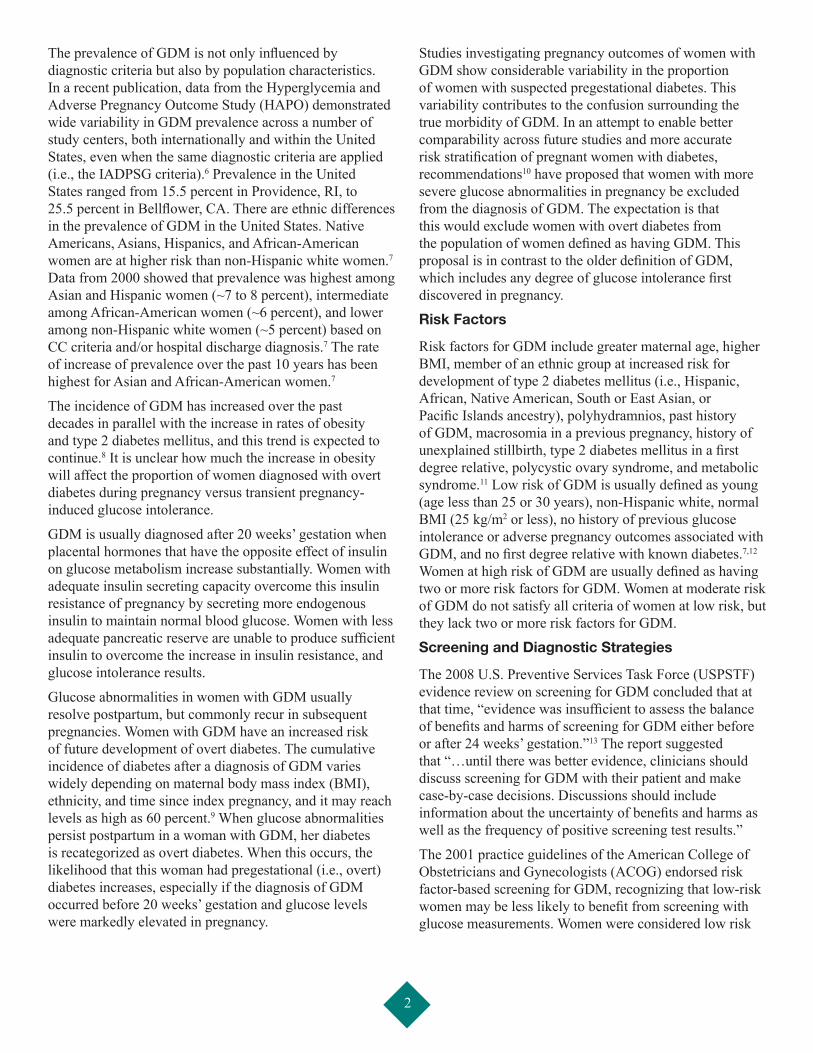
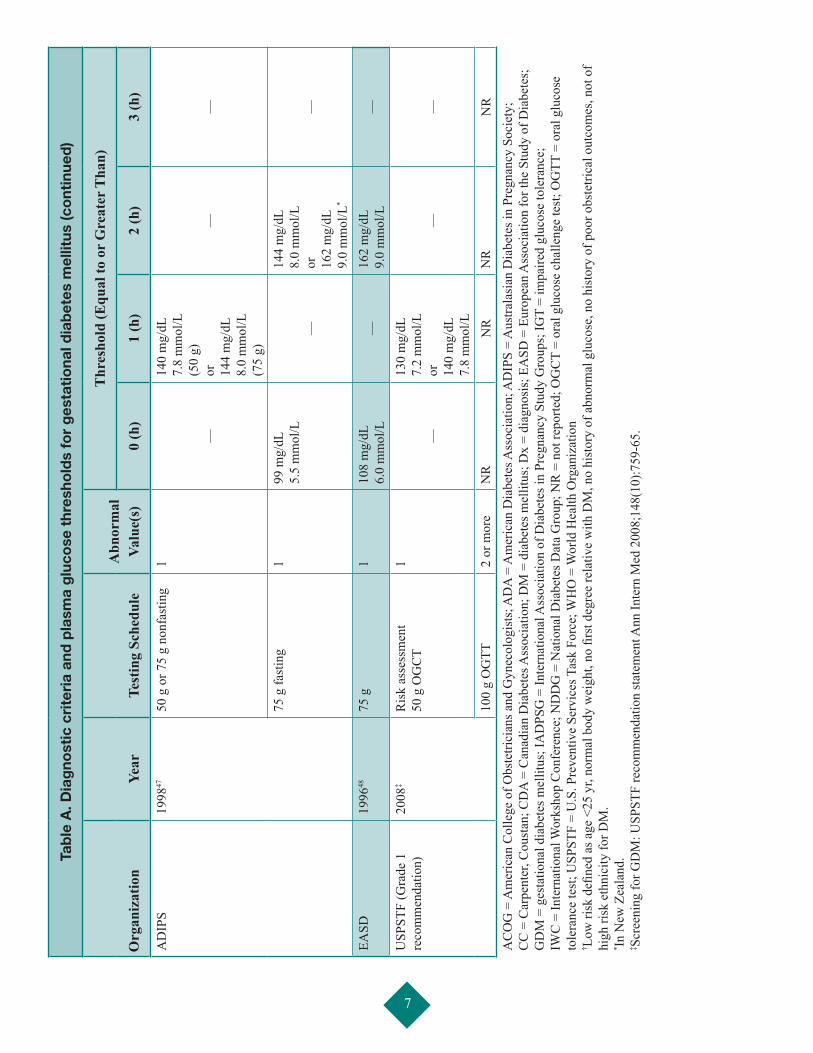
The absence of a universally accepted gold standard for the diagnosis of GDM has resulted in a variety of recommended diagnostic glucose thresholds that have been endorsed by different stakeholders (Table A). These criteria reflect changes that have occurred in laboratory glucose measurements over the years and in new evidence that suggests the ability of different glucose thresholds to predict poor pregnancy outcomes. The different diagnostic criteria and thresholds result in different estimates of the prevalence of GDM.
In 2004, a cross-sectional study reported that universal screening was the most common practice in the United
States, with 96 percent of obstetricians routinely screening for GDM.16 In contrast, the guidelines of ACOG and the ADA at that time stated that women at low risk for GDM were unlikely to benefit from screening.14,17 Since only 10 percent of pregnant women were categorized as low risk, some argued that selective screening contributed to confusion, with little benefit and potential for harm.18 Of particular concern was the association between risk factor-based screening and high rates of false negative results.19 Others have endorsed alternative risk scoring systems for screening.20
The IADPSG, an international consensus group with representation from multiple obstetrical and diabetes organizations, recently spearheaded a reexamination of the definition of GDM in an attempt to bring uniformity to GDM diagnoses.21 The IADPSG recommended that a one-step 75 g OGTT be given to all pregnant women who do not have a diagnosis of overt diabetes. They also recommended that a single glucose value, rather than at least two abnormal values at or above diagnostic glucose thresholds on the OGTT be accepted as sufficient for a diagnosis of GDM. The diagnostic glucose thresholds recommended by the IADPSG were the maternal glucose values from the HAPO study3 that identified a 1.75-fold increase (adjusted odds ratio relative to the mean cohort glucose values) in large for gestational age, elevated C-peptide, high neonatal body fat, or in a combination of these factors. Since overt diabetes is often asymptomatic, may not have been screened for before conception, has a prevalence that is increasing dramatically in reproductive-age women, and carries a higher risk for poor pregnancy outcomes,22 the IADPSG also recommended that all women, or at least women from high-risk groups for type 2 diabetes mellitus, be screened for overt diabetes at their first prenatal visit and excluded from the diagnosis of GDM using one of the following criteria: fasting plasma glucose ≥126 mg/dL (7.0 mmol/L), glycated hemoglobin (HbA1c) ≥6.5 percent (Diabetes Chronic Complications Trial/United Kingdom Prospective Diabetes Study standardized), or a random plasma glucose ≥200 mg/dL (11.1 mmol/L) confirmed by one of the first two measures.
Treatment Strategies
Initial treatment for GDM involves diet modification, glucose monitoring, and moderate exercise. When dietary management does not achieve desired glucose control, insulin or oral antidiabetic medications may be used.23 Increased prenatal surveillance may also occur as well as changes in delivery management depending on fetal size and the effectiveness of measures to control glucose.
4
Scope of the Review
Based on systematic reviews published in 2003 and 2008, the USPSTF concluded that there was insufficient evidence upon which to make a recommendation regarding routine screening of all pregnant women for GDM.13,24 Several key studies have been published since the 2008 USPSTF evidence report.3,8,25 The National Institutes of Health’s Office of Medical Applications of Research (OMAR) commissioned this report (specifically Key Questions 3 to 5, see section below), which the Agency for Healthcare Research and Quality (AHRQ) Evidence-based Practice Center (EPC) Program conducted. OMAR will use the review to inform members of consensus meetings and inform guideline development. The USPSTF joined this effort and will use the review to update its recommendation on screening for GDM (Key Questions 1 and 2). The primary aims of this review were to (1) identify the test properties of screening and diagnostic tests for GDM, (2) evaluate the potential benefits and harms of screening at ≥24 weeks and <24 weeks’ gestation, (3) assess the effects of different screening and diagnostic thresholds on outcomes for mothers and their offspring, and (4) determine the effects of treatment in modifying outcomes for women diagnosed with GDM. The benefits and harms of treatments were considered in this review to determine the downstream effects of screening on health outcomes. The intent of this review was also to assess whether evidence gaps in the previous USPSTF reviews have been filled. These gaps included lack of sufficient evidence to determine whether maternal or fetal complications are reduced by screening; lack of screening studies with adequate power to evaluate health outcomes such as mortality, neonatal intensive care unit (NICU) admissions, hyperbilirubinemia; limited evidence on the accuracy of screening strategies; and insufficient evidence on the benefits of treating GDM in improving health outcomes.
Key QuestionsOMAR and USPSTF developed the Key Questions for this evidence synthesis to inform members of consensus meetings and inform guideline development; OMAR specifically developed Key Questions 3 to 5. Investigators from the University of Alberta EPC worked in consultation with representatives from the AHRQ EPC Program, OMAR and the USPSTF, and a panel of Technical Experts to operationalize the Key Questions. The Technical Expert Panel provided content and methodological expertise throughout the development of this evidence synthesis. Participants in this panel are identified in the front matter of this report. The Key Questions are as follows:
Key Question 1: What are the sensitivities, specificities, reliabilities, and yields of current screening tests for GDM? (a)After 24 weeks’ gestation? (b) During the first trimester and up to 24 weeks’ gestation?
Key Question 2: What is the direct evidence on the benefits and harms of screening women (before and after 24 weeks’ gestation) for GDM to reduce maternal, fetal, and infant morbidity and mortality?
Key Question 3: In the absence of treatment, how do health outcomes of mothers who meet various criteria for GDM and their offspring compare to those who do not meet the various criteria?
Key Question 4: Does treatment modify the health outcomes of mothers who meet various criteria for GDM and their offspring?
Key Question 5: What are the harms of treating GDM and do they vary by diagnostic approach?
MethodsLiterature Search
We systematically searched the following bibliographic databases for studies published from 1995 to May 2012: MEDLINE® Ovid, Ovid MEDLINE® In-Process & Other Non-Indexed Citations, Cochrane Central Register of Controlled Trials (contains the Cochrane Pregnancy and Childbirth Group, which hand searches journals pertinent to its content area and adds relevant trials to the registry), Cochrane Database of Systematic Reviews (CDSR), Database of Abstracts of Reviews of Effects (DARE), Global Health, Embase, Pascal CINAHL Plus with Full Text (EBSCO host), BIOSIS Previews® (Web of KnowledgeSM), Science Citation Index Expanded® and Conference Proceedings Citation Index- Science (both via Web of ScienceSM), PubMed®, LILACS (Latin American and Caribbean Health Science Literature), National Library of Medicine (NLM) Gateway, and OCLC ProceedingsFirst and PapersFirst. We searched trial registries, including the WHO International Clinical Trials Registry Platform (ICTRP), ClinicalTrials.gov, and Current Controlled Trials. We limited the search to trials and cohort studies published in English.
We searched the Web sites of relevant professional associations and research groups, including the ADA, IADPSG, International Symposium of Diabetes in Pregnancy, and Diabetes in Pregnancy Society for conference abstracts and proceedings from the past 3 years. We reviewed the reference lists of relevant reviews (including the 2008 USPSTF review) and studies that were included in this report.

5
Tab
le A
. Dia
gno
stic
cri
teri
a an
d p
lasm
a g
luco
se t
hres
hold
s fo
r g
esta
tio
nal d
iab
etes
mel
litus
Org
aniz
atio
nYe
arTe
stin
g Sc
hedu
leA
bnor
mal
Va
lue(
s)
Thr
esho
ld (E
qual
to o
r G
reat
er T
han)
0 (h
)1
(h)
2 (h
)3
(h)
AD
A19
9926
50 g
OG
CT
1—
140
mg/
dL
7.8
mm
ol/L
——
100
g O
GTT
2 or
mor
e10
5 m
g/dL
5.
8 m
mol
/L19
0 m
g/dL
10
.5 m
mol
/L16
5 m
g/dL
9.
1 m
mol
/L14
5 m
g/dL
8.
0 m
mol
/LA
DA
Lo
w ri
sk† e
xclu
ded
2000
-201
010,2
7-36
50 g
OG
CT
1
—
130
mg/
dL
7.2
mm
ol/L
or
14
0 m
g/dL
7.
8 m
mol
/L
——
100
g or
75
g O
GTT
af
ter o
vern
ight
fast
≥8h
r2
or m
ore
95 m
g/dL
5.
3 m
mol
/L18
0 m
g/dL
10
.0 m
mol
/L15
5 m
g/dL
8.
6 m
mol
/L14
0 m
g/dL
7.
8 m
mol
/L
(3 h
r val
ue o
nly
fo
r 100
g te
st)
IAD
PSG
A
DA
20
1137
75
g O
GTT
1 or
mor
e92
mg/
dL
5.1
mm
ol/L
180
mg/
dL
10.0
mm
ol/L
153
mg/
dL
8.5
mm
ol/L
—
1. C
C
2. 4
th IW
C (s
ame)
3.
5th IW
C (s
ame
as
4th b
ut 7
5 g
acce
pted
w
ith sa
me
gluc
ose
thre
shol
ds)
1. 1
9825
2. 1
99838
3.
200
739
50 g
OG
CT
1—
130
mg/
dL
7.2
mm
ol/L
——
100
g O
GTT
2
or m
ore
95 m
g/dL
5.
3 m
mol
/L18
0 m
g/dL
10
.0 m
mol
/L15
5 m
g/dL
8.
6 m
mol
/L14
0 m
g/dL
7.
8 m
mol
/L
ND
DG
1979
4050
g O
GC
T—
——
——
100
g O
GTT
2
or m
ore
105
mg/
dL
5.8
mm
ol/L
19
0 m
g/dL
10
.5 m
mol
/L16
5 m
g/dL
9.
1 m
mol
/L14
5 m
g/dL
8.
0 m
mol
/LW
HO
1999
WH
O
cons
ulta
tion41
75 g
OG
TT1
6.1
mm
ol/L
fo
r IG
T of
pr
egna
ncy;
7.
0 m
mol
/L fo
r D
x of
DM
—
140
mg/
dL
7.8
mm
ol/L
fo
r IG
T of
pr
egna
ncy;
20
0 m
g/dL
11
.1 m
mol
/L fo
r D
x of
DM
—

6
Tab
le A
. Dia
gno
stic
cri
teri
a an
d p
lasm
a g
luco
se t
hres
hold
s fo
r g
esta
tio
nal d
iab
etes
mel
litus
(co
ntin
ued
)
Org
aniz
atio
nYe
arTe
stin
g Sc
hedu
leA
bnor
mal
Va
lue(
s)
Thr
esho
ld (E
qual
to o
r G
reat
er T
han)
0 (h
)1
(h)
2 (h
)3
(h)
WH
O19
85 W
HO
st
udy
grou
p re
port42
75 g
OG
TT1
7.8
mm
ol/L
14
0 m
g/dL
for
IGT
of p
regn
ancy
—
7.8
mm
ol/L
(1
40 m
g/dL
); fo
r IG
T of
pr
egna
ncy;
20
0 (1
1.1
mm
ol/L
) for
Dx
of D
M
—
CD
A20
03, 2
00843
,44
50 g
OG
CT
1
—
140
mg/
dL
7.8
mm
ol/L
or
18
6 m
g/dL
, 10
.3 m
mol
/L D
x G
DM
——
75 g
2 or
mor
e95
mg/
dL
5.3
mm
ol/L
19
1 m
g/dL
10
.6 m
mol
/L16
0 m
g/dL
8.
9 m
mol
/L—
AC
OG
– ri
sk fa
ctor
4th
IWC
2001
14,4
550
g1
—
130
mg/
dL
7.2
mm
ol/L
or
14
0 m
g/dL
7.
8 m
mol
/L
——
100
g C
C2
or m
ore
95 m
g/dL
5.
3 m
mol
/L18
0 m
g/dL
10
.0 m
mol
/L15
5 m
g/dL
8.
5 m
mol
/L14
0 m
g/dL
7.
8 m
mol
/L10
0 g
ND
DG
2 or
mor
e10
5 m
g/dL
5.
8 m
mol
/L19
0 m
g/dL
10
.5 m
mol
/L16
5 m
g/dL
9.
1 m
mol
/L14
5 m
g/dL
8.
0 m
mol
/L3rd
IWC
1991
4610
0 g
OG
TT2
or m
ore
105
mg/
dL
5.8
mm
ol/L
190
mg/
dL
10.5
mm
ol/L
165
mg/
dL
9.1
mm
ol/L
145
mg/
dL
8.0
mm
ol/L
7
Tab
le A
. Dia
gno
stic
cri
teri
a an
d p
lasm
a g
luco
se t
hres
hold
s fo
r g
esta
tio
nal d
iab
etes
mel
litus
(co
ntin
ued
)
Org
aniz
atio
nYe
arTe
stin
g Sc
hedu
leA
bnor
mal
Va
lue(
s)
Thr
esho
ld (E
qual
to o
r G
reat
er T
han)
0 (h
)1
(h)
2 (h
)3
(h)
AD
IPS
1998
4750
g o
r 75
g no
nfas
ting
1
—
140
mg/
dL
7.8
mm
ol/L
(5
0 g)
or
14
4 m
g/dL
8.
0 m
mol
/L
(75
g)
——
75 g
fast
ing
199
mg/
dL
5.5
mm
ol/L
—
144
mg/
dL
8.0
mm
ol/L
or
16
2 m
g/dL
9.
0 m
mol
/L*
—
EASD
1996
4875
g1
108
mg/
dL
6.0
mm
ol/L
—16
2 m
g/dL
9.
0 m
mol
/L—
USP
STF
(Gra
de 1
re
com
men
datio
n)20
08‡
Ris
k as
sess
men
t 50
g O
GC
T1
—
130
mg/
dL
7.2
mm
ol/L
or
14
0 m
g/dL
7.
8 m
mol
/L
——
100
g O
GTT
2 or
mor
eN
RN
RN
RN
RA
CO
G =
Am
eric
an C
olle
ge o
f Obs
tetri
cian
s and
Gyn
ecol
ogis
ts; A
DA
= A
mer
ican
Dia
bete
s Ass
ocia
tion;
AD
IPS
= A
ustra
lasi
an D
iabe
tes i
n Pr
egna
ncy
Soci
ety;
C
C =
Car
pent
er, C
oust
an; C
DA
= C
anad
ian
Dia
bete
s Ass
ocia
tion;
DM
= d
iabe
tes m
ellit
us; D
x =
diag
nosi
s; E
ASD
= E
urop
ean
Ass
ocia
tion
for t
he S
tudy
of D
iabe
tes;
G
DM
= g
esta
tiona
l dia
bete
s mel
litus
; IA
DPS
G =
Inte
rnat
iona
l Ass
ocia
tion
of D
iabe
tes i
n Pr
egna
ncy
Stud
y G
roup
s; IG
T =
impa
ired
gluc
ose
tole
ranc
e;
IWC
= In
tern
atio
nal W
orks
hop
Con
fere
nce;
ND
DG
= N
atio
nal D
iabe
tes D
ata
Gro
up; N
R =
not
repo
rted;
OG
CT
= or
al g
luco
se c
halle
nge
test
; OG
TT =
ora
l glu
cose
to
lera
nce
test
; USP
STF
= U
.S. P
reve
ntiv
e Se
rvic
es T
ask
Forc
e; W
HO
= W
orld
Hea
lth O
rgan
izat
ion
† Low
risk
defi
ned
as a
ge <
25 y
r, no
rmal
bod
y w
eigh
t, no
firs
t deg
ree
rela
tive
with
DM
, no
hist
ory
of a
bnor
mal
glu
cose
, no
hist
ory
of p
oor o
bste
trica
l out
com
es, n
ot o
f hi
gh ri
sk e
thni
city
for D
M.
* In N
ew Z
eala
nd.
‡ Scr
eeni
ng fo
r GD
M: U
SPST
F re
com
men
datio
n st
atem
ent A
nn In
tern
Med
200
8;14
8(10
):759
-65.
8
Study Selection
Two reviewers independently screened the titles and abstracts using broad inclusion criteria. We retrieved the full text of articles classified as “include” or “unclear.” Two reviewers independently assessed each full-text article using a priori inclusion criteria and a standardized form. We resolved disagreements by consensus or third-party adjudication.
We included published randomized controlled trials (RCTs), nonrandomized controlled trials (NRCTs), and prospective and retrospective cohort studies. For Key Question 1, we excluded retrospective cohort studies. We included studies of pregnant women ≥24 weeks’ gestation or <24 weeks’ gestation, with no known history of preexisting diabetes. Comparisons of interest varied by Key Question and were as follows: Key Question 1 – any GDM screening or diagnostic test compared with any GDM reference standard or other screening or diagnostic test; Key Question 2 – any GDM screening versus no GDM screening; Key Question 3 – women who met various thresholds for GDM versus those who did not meet various criteria for GDM, where women in both groups did not receive treatment; Key Questions 4 and 5 – any treatment for GDM, including but not limited to dietary advice, blood glucose monitoring, insulin therapy (all preparations), and oral hypoglycemic agents versus no treatment. Studies meeting these eligibility criteria were included if they reported data for at least one outcome specified in the Key Questions. We included studies regardless of setting and duration of followup.
Quality Assessment
Two reviewers independently assessed the methodological quality of studies and resolved discrepancies by discussion and consensus. For Key Question 1, we used the QUADAS-2 checklist49 to assessthe quality of diagnostic accuracy studies. We assessed the internal validity of RCTs and NRCTs using the Cochrane Collaboration Risk of Bias tool. For cohort studies, we used the Newcastle-Ottawa Scale. For Key Questions 2 to 5, we summarized the quality of individual studies as “good,” “fair,” or “poor” based on criteria specific to each tool.
Data Extraction and Synthesis
One reviewer extracted data using a standardized form, and a second reviewer checked the data for accuracy and completeness. We extracted information on study characteristics, inclusion and exclusion criteria, participant characteristics, details of the interventions or diagnostic/screening tests (as appropriate), and outcomes. Reviewers resolved discrepancies by consensus or in consultation with a third party.
For each Key Question, we presented evidence tables detailing each study and provided a qualitative description of results. For Key Question 1, we constructed 2x2 tables and calculated sensitivity, specificity, positive and negative predictive values, reliability (i.e., accuracy), and yield (i.e., prevalence) of the screening or diagnostic tests. If studies were clinically homogenous, we pooled sensitivities and specificities using a hierarchical summary receiver-operator curve and bivariate analysis of sensitivity and specificity.50 For the other Key Questions, we combined studies in a meta-analysis if the study design, population, comparisons, and outcomes were sufficiently similar. Results were combined using random effects models. We quantified statistical heterogeneity using the I-squared (I2) statistic. When I2 was greater than 75 percent, we did not pool results, and we investigated potential sources of heterogeneity.
Strength of the Body of Evidence
Two independent reviewers graded the strength of the evidence for Key Questions 3 and 4 using the EPC GRADE (Grading of Recommendations Assessment, Development and Evaluation) approach and resolved discrepancies by discussion and consensus. We graded the evidence for the following key outcomes: birth injury, preeclampsia, neonatal hypoglycemia, maternal weight gain, and long-term metabolic outcomes of the child and mother. We made a post hoc decision to grade shoulder dystocia and macrosomia. These were not included in the protocol as outcomes that would be graded but were felt by the clinical investigators to be important to grade during the course of preparing the review. For each outcome, we assessed four major domains: risk of bias (rated as low, moderate, or high), consistency (rated as consistent, inconsistent, or unknown), directness (rated as direct or indirect), and precision (rated as precise or imprecise). The overall strength of evidence was graded as high, moderate, low, or insufficient.
Applicability
We assessed the applicability of the body of evidence following the PICOTS (population, intervention, comparator, outcomes, timing of outcome measurement, and setting) format used to assess study characteristics. Factors that may potentially limit applicability were discussed.
Peer Review and Public Commentary
Peer reviewers were invited to provide written comments on the draft report based on their clinical, content, or methodologic expertise. Peer reviewer comments on the draft report were addressed by the EPC in preparation of the final draft of the report. Peer reviewers do not
9
participate in writing or editing of the final report or other products. The synthesis of the scientific literature presented in the final report does not necessarily represent the views of individual reviewers. The dispositions of the peer review comments are documented and will be published 3 months after the publication of the Evidence Report.
Potential reviewers must disclose any financial conflicts of interest greater than $10,000 and any other relevant business or professional conflicts of interest. Invited peer reviewers may not have any financial conflict of interest greater than $10,000. Peer reviewers who disclose potential business or professional conflicts of interest may submit comments on draft reports through AHRQ’s public comment mechanism.
Results
Description of Included Studies
The search identified 14,398 citations, and 97 studies were included: 6 RCTs, 63 prospective cohort studies, and 28 retrospective cohort studies. The studies were published between 1995 and 2012 (median 2004). Studies were conducted in the United States (24 percent), Europe (23 percent), Asia (22 percent), the Middle East (20 percent), Australia (4 percent), Central and South America (3 percent), and Canada (4 percent). The number of women enrolled in each study ranged from 32 to 23,316 (median 750). The mean age of study participants was 30 years.
Forty-eight studies (50 percent) analyzed women tested for GDM between 24 and 28 weeks, with an OGCT taking place first and the OGTT following within 7 days. Thirty-one studies (32 percent) did not specify when screening or diagnostic procedures took place. Eighteen studies (18 percent) screened or tested within unique time ranges. Of these, one study screened participants with an OGCT at 21–23 weeks followed by a diagnostic OGTT at 24–28 weeks; another screened a group of participants after 37 weeks; one study screened before 24 weeks; another screened women at risk between 14 and 16 weeks, with normal women screened at the usual 24–28 weeks; and one study screened between 16 and 20 weeks or between 17 and 21 weeks followed by a diagnostic OGTT at 26–32 weeks. Remaining studies generally provided broader screening times ranging from 21 to 32 weeks’ gestation. Studies employing WHO criteria generally screened further into gestation as only an OGTT was performed: one study screened at 28–32 weeks, and another study screened women at high risk at 18–20 weeks and others at 28–30 weeks.
Methodological Quality of Included Studies
The methodological quality was assessed using different tools depending on the Key Question and study design: QUADAS-2 was used for Key Question 1; for Key Questions 2 to 5, the Cochrane Risk of Bias tool was used for RCTs and the Newcastle Ottawa Scale was used for cohort studies. The methodological quality of studies is summarized for each Key Question below.
Results of Included Studies
The results are presented by Key Question in the sections that follow. A summary of the results for all Key Questions is provided in Table D at the end of the Executive Summary.
Key Question 1
Fifty-one studies provided data for Key Question 1, which examined the diagnostic test characteristics and prevalence of current screening and diagnostic tests for GDM. Studies were conducted in a range of geographic regions: 11 in North America, 10 in Europe, 12 in Asia, 15 in the Middle East, 2 in South America, and 1 in Australia. Studies reported on findings for a number of screening tests, including the 50 g OGCT, fasting plasma glucose (FPG), and risk factor-based screening, as well as other, less common tests such as HbA1c, serum fructosamine, and adiponectin. GDM was confirmed using criteria developed by different groups, including CC, ADA, National Diabetes Data Group (NDDG), and WHO. The lack of a gold standard to confirm a diagnosis of GDM limits the ability to compare the results of studies that have used different diagnostic criteria. Different criteria result in different rates of prevalence, regardless of similarities across study settings and patient characteristics. A summary of the results is provided in Table D.
Methodological quality of the studies was assessed using the QUADAS-2 tool. The domain of patient selection was rated as low risk for 53 percent and unclear risk for 22 percent of the studies. Overall, 55 percent were assessed as having high concerns about applicability for this domain. This was primarily because these studies were conducted in developing countries and used the WHO criteria to diagnose GDM. The domain of the index test was generally rated as low risk of bias (53 percent). Concern about applicability was assessed as low (82 percent). The domain of the reference standard (i.e., the criteria used to confirm a diagnosis of GDM) was rated as high or unclear risk (80 percent). For most studies, the result of the screening test was used to determine whether patients underwent further testing for GDM (lack
10
of blinding) or it was unclear. Concern about applicability for this domain was assessed as low (84 percent). The domain of flow and timing was assessed as low risk of bias in 39 percent of studies. However, 35 percent were assessed as unclear risk of bias because not all patients received a confirmatory reference standard if the screening test was below a certain threshold, so there is a risk of diagnostic review bias.
Nine studies provided data to estimate sensitivity and specificity of a 50 g OGCT (cutoff ≥140 mg/dL); GDM was confirmed using a 100 g, 3-hour OGTT using CC criteria. Sensitivity and specificity were 85 percent (95% CI, 76 to 90) and 86 percent (95% CI, 80 to 90), respectively. Prevalence ranged from 3.8 to 31.9 percent. When prevalence was less than 10 percent, PPV ranged from 18 to 27 percent; when prevalence was 10 percent or more, PPV ranged from 32 to 83 percent. The median NPV for all studies was 98 percent.
Six studies reported results for a 50 g OGCT (cutoff ≥130 mg/dL); GDM was confirmed using the CC criteria. Sensitivity was 99 percent (95% CI, 95 to 100) and specificity was 77 percent (95% CI, 68 to 83). Prevalence ranged from 4.3 to 29.8 percent. When prevalence was less than 10 percent, PPV ranged from 11 to 27 percent; when prevalence was 10 percent or more, PPV ranged from 31 to 62 percent. The median NPV for all studies was 100 percent.
One study assessed a 50 g OGCT with a cutoff value of ≥200 mg/dL; GDM was confirmed using the CC criteria. Prevalence was 6.4 percent. Sensitivity, specificity, PPV and NPV were all 100 percent.
The evidence showed that the 50 g OGCT with the 130 mg/dL cutpoint had higher sensitivity when compared with the 140 mg/dL cutpoint; however, specificity was lower. Both thresholds have high NPVs, but variable PPVs across a range of GDM prevalence. The Toronto Trihospital study found evidence to support the use of the lower screening cutpoint for higher risk patients, and the higher screening cutpoint for lower risk patients.12
Seven studies assessed a 50 g OGCT (≥140 mg/dL); GDM was confirmed using the NDDG criteria. Sensitivity was 85 percent (95% CI, 73 to 92) and specificity was 83 percent (95% CI, 78 to 87). Prevalence ranged from 1.4 to 45.8 percent. When prevalence was less than 10 percent, PPV ranged from 12 to 39 percent; prevalence was more than 10 percent in one study and PPV was 57 percent. The median NPV for all studies was 99 percent. Three studies that assessed a 50 g OGCT (≥130 mg/dL) using NDDG were not pooled. Prevalence ranged from 16.7 to 35.3 percent. PPV ranged from 20 to 75 percent; NPV ranged from 86 to 95 percent.
Three studies assessed a 50 g OGCT (different thresholds); GDM was confirmed using the ADA 2000-2010 75 g, 2 hour criteria. Sensitivity ranged from 86 to 97 percent; specificity ranged from 79 to 87 percent. Prevalence ranged from 1.6 to 4.1 percent. PPV ranged from 7 to 20 percent; NPV ranged from 99 to 100 percent.
Three studies assessed a 50 g OGCT (≥140 mg/dL) with GDM confirmed using the WHO 75 g criteria. Sensitivity was 43 to 85 percent and specificity was 73 to 94 percent. Prevalence ranged from 3.7 to 15.7. In two studies with prevalence less than 10 percent, PPV was 18 and 20 percent; in one study in which prevalence was 10 or more, PPV was 58 percent. The median NPV for all studies was 99 percent.
Seven studies assessed FPG to screen for GDM; GDM was confirmed using CC criteria. Four FPG thresholds were compared— ≥85 mg/dL: sensitivity was 87 percent (95% CI, 81 to 91) and specificity was 52 percent (95% CI, 50 to 55); ≥90 mg/dL: sensitivity was 77 percent (95% CI, 66 to 85) and specificity was 76 percent (95% CI, 75 to77); ≥92 mg/dL: sensitivity was 76 percent (95% CI, 55 to 91) and specificity 92 percent (95% CI, 86 to 96); ≥95 mg/dL: sensitivity was 54 percent (95% CI, 32 to 74) and specificity was 93 percent (95% CI, 90 to 96). While the effect on health outcomes was not part of this Key Question, the Toronto Trihospital and HAPO studies demonstrated the ability of using fasting glucose to predict GDM outcomes.
Limited data support the use of HbA1c as a screening test. One study conducted in the United Arab Emirates using an HbA1c value of 5.5 percent or more lacked specificity (21 percent) despite good sensitivity (82 percent). A study conducted in Turkey showed that an HbA1c cutoff of 7.2 percent or more had 64 percent sensitivity and specificity. HbA1c does not perform as well as the 50 g OGCT as a screening test for GDM. However, when HbA1c is markedly elevated, this supports a possible diagnosis of overt diabetes discovered in pregnancy. Since 2011–2012, the ADA has endorsed the use of an HbA1c of 6.5 percent or more as diagnostic of diabetes in nonpregnant women.36
Although eight studies examined risk factors for screening women, our review did not identify compelling evidence for or against risk factor-based screening. Studies used different diagnostic criteria and could not be pooled. Sensitivity and specificity varied widely across studies.
Only three studies included women who were in their first trimester of pregnancy, and they used different diagnostic criteria. Therefore, no conclusions can be made about the test characteristics of the screening tests for this group of women.
11
Four studies compared the 75 g and 100 g load tests, but they were conducted in different countries and used different criteria or thresholds. The prevalence of GDM ranged from 1.4 to 50 percent. Sensitivity and specificity varied widely across studies. Limited data are available to draw conclusions about the effectiveness of the different options for diagnostic testing for GDM. However, because both the 75 g and 100 g load tests are positively linked with outcomes3,51 and the 75 g test is less time consuming, the adoption of the 75 g glucose load may be warranted, even if thresholds continue to be debated.3,51
The IADPSG has proposed the elimination of a screening test in favor of proceeding directly to a diagnostic test for GDM. We identified only one study that compared the IADPSG criteria with the Australasian Diabetes in Pregnancy Society (two-step) criteria. The sensitivity was 82 percent (95% CI: 74 to 88) and specificity was 94 percent (95% CI: 93 to 96); the PPV and NPV were 61 percent (95% CI: 53 to 68) and 98 (95% CI: 97 to 99), respectively.
Prevalence and Predictive Values
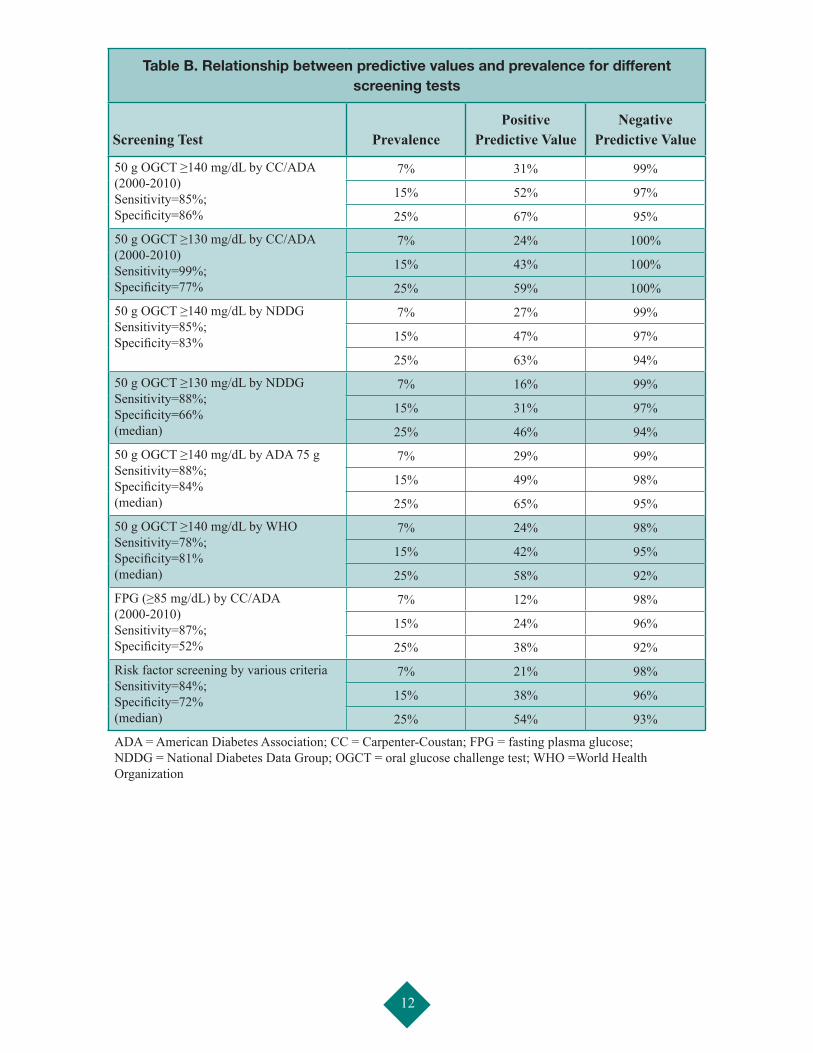
The prevalence of GDM varied across studies and the diagnostic criteria used. Factors contributing to the variability included differences in study setting (i.e., country), screening practices (e.g., universal vs. selective), and population characteristics (e.g., race/ethnicity, age, BMI).
The predictive value of a screening or diagnostic test is determined by the test’s sensitivity and specificity and by the prevalence of GDM. Table B presents a series of scenarios that demonstrate the changes in PPV and NPV for three levels of prevalence (7 percent, 15 percent, and 25 percent).6 Separate tables are presented for different screening and diagnostic criteria. The higher the prevalence of GDM, the higher the PPV, or the more likely a positive result is able to predict the presence of GDM. When the prevalence of GDM is low, the PPV is also low, even when the test has high sensitivity and specificity. Generally the NPV (negative result rules out GDM) is very high—98 percent or better at a GDM prevalence of 7 percent.
Key Question 2Only two retrospective cohort studies were relevant to Key Question 2, which asked about the direct benefits and harms of screening for GDM. One retrospective cohort study (n=1,000) conducted in Thailand showed a significantly greater incidence of cesarean deliveries in the screened group. A survey of a subset of participants (n=93) in a large prospective cohort study involving 116,678 nurses age 25–42 years in the United States found
the incidence of macrosomia (infant weight ≥ 4.3 kg) was the same in the screened and unscreened groups (7 percent each group).
No RCTs were available to answer questions about screening. There is a paucity of evidence on the effect of screening women for GDM on health outcomes. The comparison for this question was women who had and had not undergone screening. Since screening is now commonplace it may be unlikely to identify studies or cohorts in which this comparison is feasible.
Key Question 3
Thirty-eight studies provided data for Key Question 3, which sought to examine health outcomes for women who met various criteria for GDM and did not receive treatment. A summary of the results is provided in Table D. The majority of data came from cohort studies or the untreated groups from RCTs. Study quality was assessed using the Newcastle-Ottawa Scale with a possible total of nine stars. The median quality score was 9 out of 9 stars. Studies receiving lower scores most often did not control for potential confounding, and/or had an important proportion of patients lost to followup. Overall, the majority of studies were considered good quality (36 of 38, 95 percent).
A wide variety of diagnostic criteria and thresholds were compared across the studies. The most common groups reported and compared were GDM diagnosed by CC criteria, no GDM by any criteria (normal), impaired glucose tolerance defined as one abnormal glucose value, and false positive (positive OGCT, negative OGTT). Only single studies contributed data for many of the comparisons and outcomes; therefore, results that showed no statistically significant differences between groups cannot be interpreted as equivalence between groups, and they do not rule out potential differences.
Two studies did not group women according to criteria (as above) but examined glucose levels as a continuous outcome and their association with maternal and neonatal outcomes. Both studies were methodologically strong. A continuous positive association was found between maternal glucose and birthweight (both studies), as well as fetal hyperinsulinemia (one study only). There was some evidence of an association between glucose levels and primary cesarean section and neonatal hypoglycemia, although the associations were not consistently significant. No clear glucose thresholds were found that were predictive of poor outcomes. One of these studies also found significantly fewer cases of preeclampsia, cesarean section, shoulder dystocia and/or birth injury, clinical neonatal hypoglycemia, and hyperbilirubinemia for women
12
Table B. Relationship between predictive values and prevalence for different screening tests
Screening Test PrevalencePositive
Predictive ValueNegative
Predictive Value
50 g OGCT ≥140 mg/dL by CC/ADA (2000-2010) Sensitivity=85%; Specificity=86%
7% 31% 99%
15% 52% 97%
25% 67% 95%
50 g OGCT ≥130 mg/dL by CC/ADA (2000-2010) Sensitivity=99%; Specificity=77%
7% 24% 100%
15% 43% 100%
25% 59% 100%
50 g OGCT ≥140 mg/dL by NDDG Sensitivity=85%; Specificity=83%
7% 27% 99%
15% 47% 97%
25% 63% 94%
50 g OGCT ≥130 mg/dL by NDDG Sensitivity=88%; Specificity=66% (median)
7% 16% 99%
15% 31% 97%
25% 46% 94%
50 g OGCT ≥140 mg/dL by ADA 75 g Sensitivity=88%; Specificity=84% (median)
7% 29% 99%
15% 49% 98%
25% 65% 95%
50 g OGCT ≥140 mg/dL by WHO Sensitivity=78%; Specificity=81% (median)
7% 24% 98%
15% 42% 95%
25% 58% 92%
FPG (≥85 mg/dL) by CC/ADA (2000-2010) Sensitivity=87%; Specificity=52%
7% 12% 98%
15% 24% 96%
25% 38% 92%
Risk factor screening by various criteria Sensitivity=84%; Specificity=72% (median)
7% 21% 98%
15% 38% 96%
25% 54% 93%
ADA = American Diabetes Association; CC = Carpenter-Coustan; FPG = fasting plasma glucose; NDDG = National Diabetes Data Group; OGCT = oral glucose challenge test; WHO =World Health Organization
13
with no GDM compared with those meeting IADPSG criteria.
For maternal outcomes among the studies that compared groups as described above, women without GDM and those testing false positive showed fewer cases of preeclampsia than those meeting CC criteria. No differences in preeclampsia were found for other comparisons, although evidence was based on few studies per comparison.
Fewer cases of cesarean section were found among women without GDM compared with women meeting criteria for CC GDM, CC 1 abnormal OGTT, CC false positives, NDDG false positives, NDDG 1 abnormal oral glucose tolerance test, WHO IGT, IADPSG impaired fasting glucose (IFG), and IADPSG impaired glucose tolerance (IGT) IFG. There were fewer cases of cesarean section among false positives compared with women meeting criteria for CC GDM. For 12 other comparisons, there were no differences in rates of cesarean delivery.
For maternal hypertension, significant differences were found for 8 of 16 comparisons; many comparisons were based on single studies. No GDM groups showed lower incidence of maternal hypertension when compared with CC GDM, CC 1 abnormal OGTT, IADPSG IFG, IADPSG IGT-2 (double-impaired glucose tolerance), and IADPSG IGT IFG. Other comparisons showing significant differences were CC GDM versus false positives (lower incidence for false positives), IADPSG IGT versus IGT IFG (lower incidence for IGT), and IADPSG IFG versus IGT IFG (lower incidence for IFG).
Based on single studies, no differences were observed for maternal birth trauma for three comparisons. For maternal weight gain (less weight gain considered beneficial), significant differences were found for 3 of 12 comparisons: IADPSG IGT versus no GDM (favored IGT), IADPSG IFG versus no GDM (favored IFG), IADPSG IGT-2 versus no GDM (favored IGT-2). All comparisons were based on single studies. For maternal mortality/morbidity, single studies contributed to three comparisons, and no differences were found except for fewer cases among patient groups with no GDM compared with IADPSG GDM. No studies provided data on long-term maternal outcomes, such as type 2 diabetes mellitus, obesity, and hypertension.
The most commonly reported outcome for the offspring was macrosomia >4,000 g. Six of 11 comparisons showed a significant difference: there were fewer cases in the group without GDM compared with CC GDM, CC 1 abnormal OGTT, NDDG GDM (unrecognized), NDDG false positives, and WHO IGT. Fewer cases were found for women with false-positive results compared with
CC GDM. Data for macrosomia >4,500 g were available for four comparisons and showed significant differences in two comparisons: patient groups with no GDM had fewer cases compared with women with CC GDM and with unrecognized NDDG GDM. For shoulder dystocia, significant differences were found for 7 of 17 comparisons; all but one comparison were based on single studies. Patient groups with no GDM showed lower incidence of shoulder dystocia when compared with CC GDM (5 studies), NDDG GDM (unrecognized), NDDG false positive, WHO IGT, IADPSG IFG, and IADPSG IGT IFG. The other significant difference showed lower incidence among the false-positive group compared with CC 1 abnormal OGTT.For fetal birth trauma or injury, four studies compared CC GDM, NDDG GDM, and WHO IGT with patient groups without GDM. No differences were observed except for NDDG GDM, which favored the group with no GDM. Only one difference was found for neonatal hypoglycemia, with fewer cases among patient groups without GDM compared with those meeting CC criteria. There were 16 comparisons for hyperbilirubinemia; the majority were based on single studies. Three comparisons showed significant differences between groups: patient groups with no GDM had fewer cases compared with CC false positive, IADPSG IGT, and IADPSG IGT-2, respectively. No differences were found for fetal morbidity/mortality for any of eight comparisons, which may be attributable to small numbers of events within some comparisons. Moreover, comparisons were based on single studies. Based on a single study, significant differences were found in prevalence of childhood obesity for CC GDM versus patients without GDM (lower prevalence for no GDM) and CC GDM versus false positives (lower prevalence for false positives). This was consistent for both childhood obesity >85th percentile as well as >95th percentile. However, this study was unable to control for maternal weight or BMI, which are established predictors of childhood obesity. No differences, based on the same single study, were found for the other four comparisons within >85th or >95th percentiles. No other studies provided data on long-term outcomes, including type 2 diabetes mellitus and transgenerational GDM.In summary, different thresholds of glucose intolerance affect maternal and neonatal outcomes of varying clinical importance. While many studies have attempted to measure the association between various criteria for GDM and pregnancy outcomes in the absence of treatment, the ability of a study or pooled analysis to find a statistically significant difference in pregnancy outcomes appears more dependent on study design, in particular the size of
14
the study or pooled analysis, rather than the criteria used for diagnosing GDM. This is not surprising given the strong support found for a continuous positive relationship between glucose and a variety of pregnancy outcomes. The clinical significance of absolute differences in event rates requires consideration by decisionmakers even though statistical significance was reached at the strictest diagnostic glucose thresholds for some outcomes.
This question focused on outcomes for women who did not receive treatment for GDM. While women with untreated GDM have a variety of poorer outcomes than women without GDM, it cannot be assumed that treatment of GDM reverses all the short- and long-term poor outcomes observed in women with untreated GDM. Some of the reasons for the poorer outcomes in women that have untreated GDM may not be modifiable, such as the influences of genetic makeup. The strength of evidence was insufficient for most outcomes and comparisons in this question due to high risk of bias (observational studies), inconsistency across studies, and/or imprecise results. The strength of evidence was low for the following outcomes and comparisons: preeclampsia (CC GDM vs. no GDM, CC GDM vs. false positives), macrosomia >4,000 g (CC GDM vs. no GDM, CC GDM vs. false positives, CC GDM vs. 1 abnormal OGTT, CC false positives vs. no GDM, NDDG false positives vs. no GDM), macrosomia >4,500 g (CC GDM vs. no GDM), and shoulder dystocia (CC GDM vs. no GDM).
Key Question 4
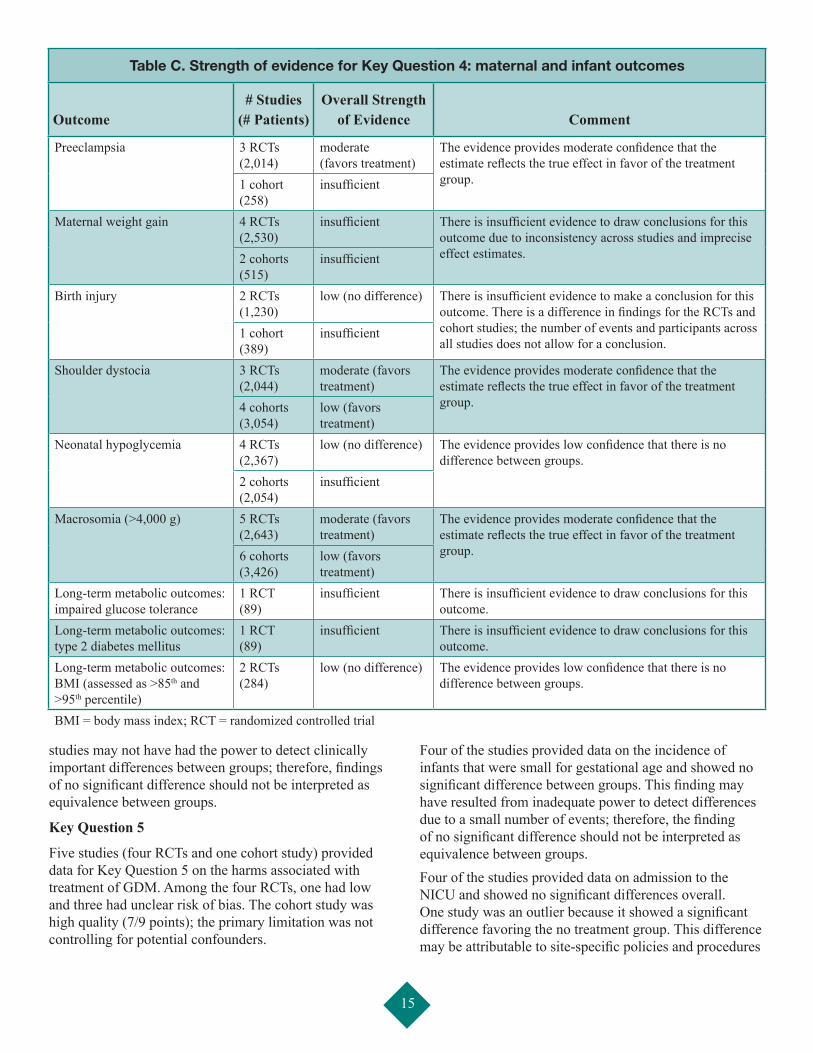
Eleven studies provided data for Key Question 4 to assess the effects of treatment for GDM on health outcomes of mothers and offspring. All studies compared diet modification, glucose monitoring, and insulin as needed with standard care. The strength of evidence for key outcomes is summarized in Table C, and a summary of the results is provided in Table D.
Among the 11 included studies, 5 were RCTs and 6 were cohort studies. The risk of bias for the RCTs was low for one trial, unclear for three trials, and high for one trial. The trials that were unclear most commonly did not report detailed methods for sequence generation and allocation concealment. The trial assessed as high risk of bias was due to lack of blinding for outcome assessment and incomplete outcome data. The six cohort studies were all considered high quality, with overall scores of 7 to 9 on a 9-point scale.
There was moderate evidence showing a significant difference for preeclampsia, with fewer cases in the treated group. There was inconsistency across studies in terms of differences in maternal weight gain, and the strength of
evidence was considered insufficient. There were no data on long-term outcomes among women, including type 2 diabetes mellitus, obesity, and hypertension.
In terms of infant outcomes, there was insufficient evidence for birth trauma. This was driven by lack of precision in the effect estimates and inconsistency across studies: there was no difference for RCTs, but a significant difference favoring treatment in the one cohort study. The incidence of shoulder dystocia was significantly lower in the treated groups, and this finding was consistent for the three RCTs and four cohort studies. Overall, the evidence for shoulder dystocia was considered moderate, showing a difference in favor of the treated group. For neonatal hypoglycemia, the strength of evidence was low, suggesting no difference between groups. Moderate evidence showed benefits of treatment in terms of macrosomia (>4,000 g).
Only one study provided data on long-term metabolic outcomes among the offspring at a 7- to 11-year followup. The strength of evidence was insufficient. For both outcomes―impaired glucose tolerance and type 2 diabetes mellitus―no differences were found between groups although the estimates were imprecise. No differences were observed in single studies that assessed BMI >95 (7- to 11-year followup) and BMI >85 percentile (5- to 7-year followup). Overall, pooled results showed no difference in BMI, and the strength of evidence was low.
In summary, there was moderate evidence showing differences in preeclampsia and shoulder dystocia, with fewer cases among women (and offspring) who were treated compared with those not receiving treatment. There was also moderate evidence showing significantly fewer cases of macrosomia (>4,000 g) among offspring of women who received treatment for GDM. The results were driven by the two largest RCTs, the Maternal Fetal Medicine Unit (MFMU)25 and the Australian Carbohydrate Intolerance in Pregnancy Study (ACHOIS),52 which had unclear and low risk of bias, respectively. There was little evidence showing differences between groups in other key maternal and infant outcomes. One potential explanation is that for the most part, the study populations included women whose glucose intolerance was less marked, as those whose glucose intolerance was more pronounced would not have been entered into a trial in which they may be assigned to a group receiving no treatment. For outcomes where results were inconsistent between studies, different study glucose threshold entry criteria did not explain the variation. For some outcomes, particularly the long-term outcomes, the strength of evidence was insufficient or low, suggesting that further research may change the results and increase our confidence in them. Moreover, for some outcomes events were rare, and the
15
Table C. Strength of evidence for Key Question 4: maternal and infant outcomes
Outcome# Studies
(# Patients)Overall Strength
of Evidence Comment
Preeclampsia 3 RCTs (2,014)
moderate (favors treatment)
The evidence provides moderate confidence that the estimate reflects the true effect in favor of the treatment group.1 cohort
(258)insufficient
Maternal weight gain 4 RCTs (2,530)
insufficient There is insufficient evidence to draw conclusions for this outcome due to inconsistency across studies and imprecise effect estimates.2 cohorts
(515)insufficient
Birth injury 2 RCTs (1,230)
low (no difference) There is insufficient evidence to make a conclusion for this outcome. There is a difference in findings for the RCTs and cohort studies; the number of events and participants across all studies does not allow for a conclusion.
1 cohort (389)
insufficient
Shoulder dystocia 3 RCTs (2,044)
moderate (favors treatment)
The evidence provides moderate confidence that the estimate reflects the true effect in favor of the treatment group.4 cohorts
(3,054)low (favors treatment)
Neonatal hypoglycemia 4 RCTs (2,367)
low (no difference) The evidence provides low confidence that there is no difference between groups.
2 cohorts (2,054)
insufficient
Macrosomia (>4,000 g) 5 RCTs (2,643)
moderate (favors treatment)
The evidence provides moderate confidence that the estimate reflects the true effect in favor of the treatment group.6 cohorts
(3,426)low (favors treatment)
Long-term metabolic outcomes: impaired glucose tolerance
1 RCT (89)
insufficient There is insufficient evidence to draw conclusions for this outcome.
Long-term metabolic outcomes: type 2 diabetes mellitus
1 RCT (89)
insufficient There is insufficient evidence to draw conclusions for this outcome.
Long-term metabolic outcomes: BMI (assessed as >85th and >95th percentile)
2 RCTs (284)
low (no difference) The evidence provides low confidence that there is no difference between groups.
BMI = body mass index; RCT = randomized controlled trial
studies may not have had the power to detect clinically important differences between groups; therefore, findings of no significant difference should not be interpreted as equivalence between groups.
Key Question 5
Five studies (four RCTs and one cohort study) provided data for Key Question 5 on the harms associated with treatment of GDM. Among the four RCTs, one had low and three had unclear risk of bias. The cohort study was high quality (7/9 points); the primary limitation was not controlling for potential confounders.
Four of the studies provided data on the incidence of infants that were small for gestational age and showed no significant difference between groups. This finding may have resulted from inadequate power to detect differences due to a small number of events; therefore, the finding of no significant difference should not be interpreted as equivalence between groups.Four of the studies provided data on admission to the NICU and showed no significant differences overall. One study was an outlier because it showed a significant difference favoring the no treatment group. This difference may be attributable to site-specific policies and procedures
16
or lack of blinding of investigators to treatment arms. Two studies reported on the number of prenatal visits and generally found significantly more visits between the treatment groups.
Two of the RCTs showed no significant difference overall in the rate of induction of labor, although there was important statistical heterogeneity between studies. One RCT showed significantly more inductions of labor in the treatment group,52 while the other study did not.25 Different study protocols may account for the heterogeneity of results between studies. In the first study that showed more inductions of labor in the treatment group, no recommendations were provided regarding obstetrical care. In the second study, antenatal surveillance was reserved for standard obstetrical indications. Based on the studies included in Key Question 4 (five RCTs and six cohort studies), there was no difference in rates of cesarean section between treatment and nontreatment groups.
A single study assessed depression and anxiety at 6 weeks after study entry and 3 months postpartum using the Spielberger State-Trait Anxiety Inventory and the Edinburgh Postnatal Depression Score, respectively. There was no significant difference in anxiety between the groups at either time point, although there were significantly lower rates of depression in the treatment group at 3 months postpartum. These results should be interpreted cautiously because the assessment of depression and anxiety was conducted in a subgroup of the study population.
There was no evidence for some of the outcomes stipulated in the protocol, including costs and resource allocation.
Findings in Relationship to What Is Already Known
This review provides evidence that treating GDM reduces some poor maternal and neonatal outcomes. The recent MFMU trial25 published in 2009 reinforces the findings of the earlier ACHOIS trial that was published in 200552 and included in an earlier version of this review.24 Both trials showed that treating GDM to targets of 5.3 or 5.5 mmol/L fasting and 6.7 or 7.0 mmol/L 2 hours postmeal reduced neonatal birthweight, large for gestational age, macrosomia, shoulder dystocia, and preeclampsia, without a reduction in neonatal hypoglycemia or hyperbilirubinemia/jaundice requiring phototherapy, or an increase in small for gestational age. In contrast to the ACHOIS trial, MFMU demonstrated a reduced cesarean section rate in the GDM treatment group. The failure of ACHOIS to find a lower cesarean section rate despite reduced neonatal birthweight and macrosomia may have been the result of differing obstetrical practices or the different populations studied (e.g., the inclusion
of some women with more marked glucose intolerance in ACHOIS, as reflected by the increased prevalence of insulin use; more black and Hispanic women in the MFMU study). Differences may have also resulted due to study design: in the ACHOIS trial, participants did not receive specific recommendations regarding obstetrical care, thus treatment was left to the discretion of the delivering health care provider. In the MFMU study, antenatal surveillance was reserved for standard obstetrical indications. Our findings of the effect of treatment of GDM is similar to a systematic review and meta-analysis published in 2010 by Horvath and colleagues.53 This review included two older RCTs of GDM that were not included in our analysis because we restricted our inclusion criteria to studies published after 1995.
The HAPO Study Cooperative Research Group3 used a simpler 75 g OGTT in a large international sample of women and confirmed findings of the earlier Toronto Trihospital study51 that there is a continuous positive association between maternal glucose and increased birthweight, as well as fetal hyperinsulinemia (HAPO only), at levels below diagnostic thresholds for GDM that existed at the time of the study. However, no clear glucose thresholds were found for fetal overgrowth or a variety of other maternal and neonatal outcomes. Subsequently, the IADPSG developed diagnostic thresholds for GDM based on a consensus of expert opinion of what was considered to be the most important outcomes and the degree of acceptable risk for these outcomes. The thresholds chosen by the IADPSG were derived from the HAPO data to identify women with a higher risk (adjusted odds ratio 1.75) of large for gestational age, elevated c-peptide, and high neonatal body fat compared with the mean maternal glucose values of the HAPO study. The glucose threshold chosen by the IADPSG represents differing levels of risk for other outcomes. Specifically, their thresholds represent a 1.4 (1.26–1.56) risk for pregnancy-induced hypertension and a 1.3 (1.07–1.58) risk for shoulder dystocia. A dichotomous view of GDM may no longer be appropriate, given evidence of a continuous relationship between maternal blood glucose and pregnancy outcomes. An alternative approach may be to define different glucose thresholds based on maternal risk for poor pregnancy outcomes. This approach has been used in the context of lipid levels and risk of adverse cardiovascular outcomes.
Neither recent RCT was designed to determine diagnostic thresholds for GDM or therapeutic glucose targets. However, it is noteworthy that therapeutic glucose targets for both ACHOIS and MFMU were above the proposed diagnostic criteria of the IADPSG (fasting 5.5 mmol/L [99 mg/dL] and 5.3 mmol/L [95 mg/dL] and 2 hour postmeal of 7.0 mmol/L [126 mg/dL and 6.7 mmol/L
17
120 mg/dL], respectively). A change in diagnostic criteria without addressing management thresholds could contribute to clinical confusion. If diagnostic thresholds for GDM below the treatment targets of the large RCTs are endorsed, this could ethically obstruct the possibility of future RCTs to compare different treatment targets above such diagnostic thresholds.
It has been hypothesized that treatment of GDM may reduce future poor metabolic outcomes for children born to mothers with GDM. If true, the potential for long-term gain is important from a clinical and public health perspective and may justify the “costs” of screening and treating women for GDM. However, the followup of offspring from two RCTs52,54 and a HAPO cohort in Belfast55 currently fail to support this hypothesis. This may be explained in part due to insufficient length of followup or inadequate numbers of events.
The HAPO study showed that maternal weight and glucose predict large for gestational age. However, BMI was the better predictor of large for gestational age than glucose until glucose thresholds higher than the diagnostic thresholds set by the IADPSG were reached.56,57 Most cases of large for gestational age occur in neonates of mothers with normal glycemia. A large observational study found that the upper quartile of maternal BMI accounted for 23 percent of macrosomia, while GDM was responsible for only 3.8 percent.58
The ongoing obesity epidemic in the United States warrants careful consideration of a diagnostic approach for GDM that incorporates maternal BMI. This would require the development and validation of a risk model that incorporates maternal BMI as well as other modifiable risk factors. Such a model could facilitate the identification of women at high risk of adverse pregnancy outcomes and minimize exposure of lower risk women to unnecessary interventions.
Applicability
Several issues may limit the applicability of the evidence presented in this review to the U.S. population. All of the Key Questions asked about the effects of screening and treatment before and after 24 weeks’ gestation. The vast majority of included studies screened women after 24 weeks’ gestation; therefore, the results are not applicable to screening and treatment earlier in gestation.
For Key Question 1 on the test properties of screening and diagnostic tests, comparisons involving the WHO criteria are less applicable to the U.S. setting because these criteria are not used in North America. There were insufficient data from the included studies to assess the
performance of screening or diagnostic tests for specific patient characteristics (e.g., BMI, race/ethnicity). Therefore it is unclear whether the evidence applies to specific subpopulations of women.
For Key Question 2, limited evidence was identified because the comparison of interest was women who had not undergone screening. Because screening is routine in prenatal care in the United States, the evidence (or limited evidence) is likely not helpful for U.S. decisionmaking, and a refinement of this question may be appropriate to reflect current practices and outstanding questions.
With respect to Key Question 3, all studies or groups included for analysis involved women who had not received treatment for GDM. It cannot be assumed that the same associations and outcomes would be observed in clinical practice in which standard care is to screen for and treat GDM. The untreated women may differ from the general population in ways that are related to the reasons for which they did not seek or receive early prenatal care (e.g., socioeconomic status). That is, the reasons they did not receive treatment for GDM are varied; some reasons, such as late presentation for obstetrical care, may confound the observed association with health outcomes. Attempts were made to control for these factors in some studies (e.g., Langer and colleagues59) by including a group of women without GDM with similar known confounders or by adjusting for known confounders in the analysis. The adjusted estimates did not change the overall pooled results in the majority of cases and did not change the overall conclusions.
The majority of the studies for Key Questions 4 and 5 pertaining to the benefits and harms of treatment for GDM were conducted in North America or Australia. Most of the North American studies were inclusive of mixed racial populations and are likely applicable to the general U.S. population. Even though the Australian RCT52 population had more white women with a lower BMI than the U.S. RCT (MFMU25), this should not affect applicability of most of their findings because these patient characteristics would be factors associated with lower risk of poor outcomes. Differences in physician or hospital billing structures between the United States and Australia may have accounted for the discrepant findings with respect to NICU admissions and, as a result, may limit the applicability of this finding in the United States. Among the studies included in Key Questions 4 and 5, a variety of glucose threshold criteria were used for inclusion, varying from 50 g screen positive with nondiagnostic OGTTs, to women who met NDDG criteria for a diagnosis of GDM. The two large RCTs25,52 used different glucose thresholds for entry in their trials: WHO and CC criteria with a fasting
18
glucose <95 mg/dL (5.3 mmol/L), respectively. The mean glucose levels at study entry were similar between these two RCTs, which may reflect a reluctance to assign women with more marked glucose intolerance to a group receiving no treatment. The results may not be applicable to women with higher levels of glucose intolerance.
Limitations of the Evidence Base
There is sparse evidence to clarify issues regarding the timing of screening and treatment for GDM (i.e., before and after 24 weeks’ gestation). Earlier screening will help identify overt type 2 diabetes mellitus and distinguish this from GDM. This has important implications for clinical management and ongoing followup beyond pregnancy. Previously unrecognized type 2 diabetes mellitus diagnosed in pregnancy should be excluded from the diagnosis of GDM because this condition has the highest perinatal mortality rate of all classes of glucose intolerance in pregnancy.60 This distinction within research studies will provide more targeted evidence to help obstetrical care providers to risk stratify obstetrical care and glycemic management of patients with overt type 2 diabetes mellitus diagnosed in pregnancy and those with less pronounced pregnancy-induced glucose intolerance. This will also facilitate better comparability across future studies. Few data were available on long-term outcomes. Furthermore, the studies included in this review do not provide evidence of a direct link between short-term and long-term outcomes (e.g., macrosomia and childhood obesity).
Care provider knowledge of the glucose screening and diagnostic results may have introduced a bias if their subsequent treatment of women differed depending on the results. This was of particular concern for Key Question 3, which assessed how the various criteria for GDM influenced pregnancy outcomes. For Key Question 3, many of the statistically significant differences seemed to be driven by the size of the study or pooled analysis (i.e., statistically significant differences could be found if the sample were sufficiently large). However, these differences may not be clinically important. The absolute differences in event rates between different glucose thresholds need careful consideration by decisionmakers, even though statistically significant differences were found. Another key limitation with the evidence for Key Question 3 is that the studies included were cohort studies, many of which did not control for potential confounders. Therefore, any associations between glucose thresholds and outcomes should be interpreted with caution.
Given that the large landmark studies51,61 show a continuous relationship between glucose and maternal and neonatal outcomes, the lack of clear thresholds contributes
to the uncertainty regarding a diagnostic threshold for GDM. While there is controversy about where to set lower limits for diagnostic criteria, the identification of overt diabetes in pregnancy is imperative if this diagnosis has not occurred before pregnancy. Overt diabetes first identified in pregnancy should be distinguished from GDM to gain a better understanding of the true risk of GDM to pregnancy outcomes. Unfortunately there is no literature to guide diagnostic criteria for a diagnosis of overt diabetes in pregnancy.
There were several methodological concerns for this evidence base. For example, risk of spectrum bias and partial verification bias (Key Question 1); different definitions or methods of assessing key outcomes (e.g., clinical vs. biochemical neonatal hypoglycemia and hyperbilirubinemia) (Key Questions 3 and 4); and lack of blinding of treatment arms in some studies (Key Questions 4 and 5).
Future Research
Several important gaps in the current literature exist:
• The adoption of a consistent comparator for diagnosis of GDM, such as the 75 g OGTT, would facilitate comparisons across studies even if different diagnostic thresholds are used.
• Further analysis of the HAPO data could help answer some outstanding questions. For example, further analysis could better define absolute differences in rare event rates. This evidence could be used to inform discussions about the clinical importance of absolute differences in event rates at thresholds other than those of the IADPSG. Such analyses should include adjustment for important confounders such as maternal BMI.
• Further analysis of the HAPO data, examining center-to-center differences in glucose outcome relationships would be helpful in determining the usefulness of FPG as a screening test for GDM.
• Research is needed to clarify issues regarding earlier screening and treatment, particularly as they relate to the diagnosis, treatment, and long-term outcomes of pregestational (overt) diabetes.
• Further research of FPG, a screening test, is needed, given that the reproducibility of fasting glucose measurement is superior to postglucose load measurements.62
• Further study of the long-term metabolic outcomes in offspring whose mothers have been treated for GDM is warranted. In addition, data on the influences of GDM
19
treatment on long-term breastfeeding success have not been studied. The association of breastfeeding with reduced poor metabolic outcomes in offspring of GDM has been found to have a dose-dependent response with duration of breastfeeding.63
• Implementation of well-conducted prospective cohort studies of the “real world” effects of GDM treatment on use of care is needed.
• Research on outcomes is needed to help determine the glucose thresholds and treatment targets at which GDM treatment benefits outweigh the risks of treatment and no treatment. This will best be achieved through well-conducted, large RCTs that randomize women with GDM to different glucose treatment targets.
• While this review did not identify evidence of substantial harms to treatment, the populations considered were mostly women whose GDM was controlled without medication. There is a risk for more precautionary management of women diagnosed with GDM, who are perceived by clinicians to be at greater risk, such as those managed with insulin, which may result in unnecessary interventions (e.g., cesarean section).64 Therefore, RCTs investigating the care of women diagnosed with GDM, including fetal surveillance protocols, are needed to guide obstetrical investigations and management of GDM. Further, RCTs comparing delivery management for GDM with and without insulin or medical management are needed to provide clinicians guidance on appropriate timing and management of delivery in women with GDM to avoid unnecessary intervention in “the real world” driven by health care provider apprehension.
• The development of long-term studies that evaluate the potential increased or decreased resource use associated with the implementation of diabetes prevention strategies after a diagnosis of GDM is required.
• Studies to assess the long-term results that a label of GDM may have for future pregnancy planning, future pregnancy management, and future insurability are required.
• The increased prevalence of type 2 diabetes mellitus in women of reproductive age merits consideration of preconception screening for overt diabetes in women at risk of type 2 diabetes. In addition to poor maternal and neonatal outcomes associated with overt diabetes in pregnancy, there is potential for benefit of preconception care.
• Long-term benefits and harms need to be evaluated among different treatment modalities for GDM (e.g., diet, exercise, insulin, oral glucose-lowering medications, and/or combinations of these).
• Since 2011–2012, the American Diabetes Association has endorsed the use of an HbA1c of 6.5 percent or more as a diagnostic of diabetes in nonpregnant women.36 Studies of HbA1c with trimester-specific cutoffs to determine the value at which overt diabetes should be diagnosed in pregnancy are needed.
Limitations of the Review
This review followed rigorous methodological standards, which were detailed a priori. The limitations of the review to fully answer the Key Questions are largely due to the nature and limitations of the existing evidence.
Several limitations need to be discussed regarding systematic reviews in general. First, there is a possibility of publication bias. The effects of publication bias on the results of diagnostic test accuracy reviews (Key Question 1) is not well understood, and the tools to investigate publication bias in these reviews have not been developed. For the remaining Key Questions, we may be missing unpublished and/or negative therapy studies and may be overestimating the benefits of certain approaches. However, we conducted a comprehensive and systematic search of the published literature for potentially relevant studies. Search strategies included combinations of subject headings and free text words. These searches were supplemented by handsearching for gray literature (i.e., unpublished or difficult-to-find studies). Despite these efforts, we recognize that we may have missed some studies.
There is also a possibility of study selection bias. However, we employed at least two independent reviewers and feel confident that the studies excluded from this report were done so for consistent and appropriate reasons. Our search was comprehensive, so it is unlikely that many studies in press or publication were missed.
Cost analysis of different screening and diagnostic approaches was not addressed in this review.
Conclusions
There was limited evidence regarding the test characteristics of current screening and diagnostic strategies for GDM. Lack of an agreed-upon gold standard for diagnosing GDM creates challenges for assessing the accuracy of tests and comparing across studies. The 50 g
20
OGCT with a glucose threshold of 130 mg/dL versus 140 mg/dL improves sensitivity and reduces specificity (10 studies). Both thresholds have high negative predictive value, but variable positive predictive value across a range of GDM prevalence. There was limited evidence for the screening of GDM diagnosed less than 24 weeks’ gestation (3 studies). Single studies compared the diagnostic characteristics of different pairs of diagnostic criteria in the same population. The use of fasting glucose (≥85 mg/dL) as a screen for GDM may be a practical alternative because of similar test characteristics to the OGCT, particularly in women who cannot tolerate any form of oral glucose load.
Evidence supports benefits of treating GDM, with little evidence of short-term harm. Specifically, treatment of GDM results in lower incidence of preeclampsia, macrosomia, and large for gestational age infants. Current research does not demonstrate a treatment effect of GDM on clinical neonatal hypoglycemia or future poor metabolic outcomes of the offspring. RCTs of GDM treatment show limited harm related to treating GDM, other than an increased demand for services. There is a risk for more precautionary management of women diagnosed with GDM, who are perceived by clinicians to be at greater risk, such as those managed with insulin, which may result in unnecessary interventions (e.g., cesarean section); however, this review found limited data for these outcomes, and
further research on the care of women diagnosed with GDM (e.g., fetal surveillance protocols) is warranted.
What remains less clear is what the lower limit diagnostic thresholds for GDM should be. Given the continuous association between glucose and a variety of outcomes, decisions should be made in light of what outcomes altered by treatment are the most important and what level of increased risk is acceptable. A dichotomous view of GDM may no longer be appropriate, given evidence of a continuous relationship between maternal blood glucose and pregnancy outcomes. An alternative approach would be to define different glucose thresholds based on maternal risk for poor pregnancy outcomes.
Further study is needed regarding the long-term metabolic outcomes on offspring of mothers receiving GDM treatment; the “real world” impact of GDM treatment on use of care outside of structured research trials; and the results of the timing of screening for GDM, particularly before 24 weeks’ gestation and in the first trimester of pregnancy. Early screening could help identify pregestational (i.e., overt) diabetes. Research is urgently required to determine the best way to diagnose and manage overt diabetes in pregnancy, particularly in an era of increasing rates of obesity and diabetes in the U.S. population.
21
Tab
le D
. Sum
mar
y o
f ev
iden
ce f
or
all K
ey Q
uest
ions
Key
Que
stio
nN
umbe
r an
d
Qua
lity
of S
tudi
esL
imita
tions
/ C
onsi
sten
cyA
pplic
abili
tySu
mm
ary
of F
indi
ngs
KQ
1. W
hat a
re
the
sens
itivi
ties,
spec
ifici
ties,
relia
bilit
ies,
and
yiel
ds o
f cur
rent
sc
reen
ing
test
s for
G
DM
? (a
) Aft
er 2
4 w
eeks
’ ges
tatio
n?
(b) D
urin
g th
e fir
st
trim
este
r an
d up
to
24 w
eeks
’ ges
tatio
n?
(a) A
fter
24
wk
gest
atio
n
51 p
rosp
ectiv
e st
udie
s Fa
ir to
goo
d qu
ality
Lim
itatio
ns: L
ack
of a
n ag
reed
up
on g
old
stan
dard
for d
iagn
osis
of
GD
M c
reat
es c
halle
nges
for
asse
ssin
g th
e ac
cura
cy o
f tes
ts
and
com
parin
g ac
ross
stud
ies.
GD
M w
as c
onfir
med
usi
ng
crite
ria d
evel
oped
by
CC
, AD
A,
ND
DG
, and
WH
O.
Ther
e w
ere
spar
se d
ata
com
parin
g ov
eral
l app
roac
hes
for d
iagn
osis
and
scre
enin
g,
e.g.
, one
-ste
p vs
. tw
o-st
ep,
sele
ctiv
e vs
. uni
vers
al.
Con
sist
ency
: Acr
oss s
tudi
es
num
erou
s tes
ts a
nd th
resh
olds
w
ere
exam
ined
. Scr
eeni
ng te
sts
incl
uded
the
50 g
OG
CT,
FPG
, ris
k fa
ctor
-bas
ed sc
reen
ing,
and
ot
her l
ess c
omm
on te
sts s
uch
as
HbA
1c, s
erum
fruc
tosa
min
e.
Prev
alen
ce o
f GD
M v
arie
d ac
ross
stud
ies a
nd d
iagn
ostic
cr
iteria
use
d. R
esul
ts n
eed
to
be in
terp
rete
d in
the
cont
ext
of p
reva
lenc
e.
Com
paris
ons i
nvol
ving
W
HO
crit
eria
are
less
ap
plic
able
to th
e N
orth
A
mer
ican
setti
ng b
ecau
se
thes
e cr
iteria
are
not
use
d in
N
orth
Am
eric
a.
• Pr
eval
ence
var
ied
acro
ss st
udie
s and
dia
gnos
tic
crite
ria: A
DA
200
0-20
10 (7
5 g)
2.0
to 1
9%
(ran
ge),
CC
3.6
to 3
8%, N
DD
G 1
.4 to
50%
, W
HO
2 to
24.
5%.
• 9
stud
ies e
xam
ined
a 5
0 g
OG
CT
with
a c
utof
f va
lue
of ≥
140
mg/
dL; G
DM
was
con
firm
ed
usin
g C
C c
riter
ia. R
esul
ts: s
ensi
tivity
85%
, sp
ecifi
city
86%
, pre
vale
nce
3.8
to 3
1.9%
, PPV
18
to 2
7% (p
reva
lenc
e <1
0), P
PV 3
2 to
83%
(p
reva
lenc
e ≥1
0), N
PV m
edia
n 98
%.
• 6
stud
ies e
xam
ined
a 5
0 g
OG
CT
(≥13
0 m
g/dL
); G
DM
was
con
firm
ed u
sing
CC
crit
eria
. R
esul
ts: s
ensi
tivity
99%
, spe
cific
ity 7
7%,
prev
alen
ce 4
.3 to
29.
5%, P
PV 1
1 to
31%
(p
reva
lenc
e <1
0), P
PV 3
1 to
62%
(pre
vale
nce
≥10)
, NPV
med
ian
100%
.
• 1
stud
y ex
amin
ed a
50
g O
GC
T (≥
200
mg/
dL);
GD
M w
as c
onfir
med
usi
ng C
C c
riter
ia.
Sens
itivi
ty, s
peci
ficity
, PPV
, and
NPV
wer
e al
l 10
0%. P
reva
lenc
e w
as 6
.4%
.
• 7
stud
ies e
xam
ined
a 5
0 g
OG
CT
(≥14
0 m
g/dL
); G
DM
was
con
firm
ed u
sing
ND
DG
cr
iteria
. Res
ults
: sen
sitiv
ity 8
5%, s
peci
ficity
83
%, p
reva
lenc
e 1.
4 to
45.
8%, P
PV 1
2 to
39%
(p
reva
lenc
e <1
0), P
PV 5
7% (p
reva
lenc
e ≥1
0),
NPV
med
ian
99%
.
• 3
stud
ies e
xam
ined
a 5
0 g
OG
CT
(≥13
0 m
g/dL
); G
DM
was
con
firm
ed u
sing
ND
DG
cr
iteria
. Res
ults
: sen
sitiv
ity 6
7 to
90%
(ran
ge),
spec
ifici
ty 4
7 to
84%
; pre
vale
nce
16.7
to 3
5.3%
, PP
V 2
0 to
75%
, NPV
86
to 9
5%.
22
Tab
le D
. Sum
mar
y o
f ev
iden
ce f
or
all K
ey Q
uest
ions
(co
ntin
ued
)
Key
Que
stio
nN
umbe
r an
d
Qua
lity
of S
tudi
esL
imita
tions
/ C
onsi
sten
cyA
pplic
abili
tySu
mm
ary
of F
indi
ngs
KQ
1. W
hat a
re
the
sens
itivi
ties,
spec
ifici
ties,
relia
bilit
ies,
and
yiel
ds o
f cur
rent
sc
reen
ing
test
s for
G
DM
? (a
) Aft
er 2
4 w
eeks
’ ges
tatio
n?
(b) D
urin
g th
e fir
st
trim
este
r an
d up
to
24 w
eeks
’ ges
tatio
n?
(con
tinue
d)
(a) A
fter
24
wk
gest
atio
n
51 p
rosp
ectiv
e st
udie
s Fa
ir to
goo
d qu
ality
(c
ontin
ued)
• 3
stud
ies e
xam
ined
a 5
0 g
OG
CT
(diff
eren
t th
resh
olds
); G
DM
was
con
firm
ed u
sing
AD
A
2000
-201
0 (7
5 g)
crit
eria
. Pre
vale
nce
was
1.
6 to
4.1
% (r
ange
). R
esul
ts: s
ensi
tivity
86
to
97%
(ran
ge),
spec
ifici
ty 7
9 to
87%
; PPV
7 to
20
%, N
PV 9
9 to
100
%.
• 3
stud
ies e
xam
ined
a 5
0 g
OG
CT
(≥14
0 m
g/dL
); G
DM
was
con
firm
ed u
sing
WH
O c
riter
ia.
Res
ults
: sen
sitiv
ity 4
3 to
85%
, spe
cific
ity 7
3 to
94
%, p
reva
lenc
e 3.
7 to
15.
7%, P
PV 1
8 to
20%
(p
reva
lenc
e <1
0), P
PV 5
8% (p
reva
lenc
e ≥1
0),
NPV
med
ian
99%
.
• 7
stud
ies e
xam
ined
FPG
at d
iffer
ent t
hres
hold
s;
GD
M w
as c
onfir
med
usi
ng C
C c
riter
ia. R
esul
ts:
at ≥
85 m
g/dL
sens
itivi
ty 8
7%, s
peci
ficity
52%
; at
≥90
mg/
dL se
nsiti
vity
77%
, spe
cific
ity 7
6%;
at ≥
92 m
g/dL
sens
itivi
ty 7
6%, s
peci
ficity
92%
; at
≥95
mg/
dL se
nsiti
vity
54%
, spe
cific
ity 9
3%.
At ≥
85 m
g/dL
pre
vale
nce
1.4
to 3
4.53
(ran
ge).
PPV
10%
(pre
vale
nce
<10)
and
23
to 5
9%
(pre
vale
nce
≥10)
. Med
ian
NPV
93%
.
• 8
stud
ies e
xam
ined
risk
fact
or-b
ased
scre
enin
g bu
t wer
e no
t poo
led.
Stu
dies
use
d di
ffere
nt
crite
ria to
con
firm
GD
M. R
esul
ts: s
ensi
tivity
48
to 9
5% (r
ange
), sp
ecifi
city
22
to 9
4%,
prev
alen
ce 1
.7 to
16.
9%, P
PV 5
to 1
9%
(pre
vale
nce
<10)
, PPV
20%
(pre
vale
nce
≥10)
, N
PV m
edia
n 99
%.
• 1
stud
y co
mpa
red
IAD
PSG
vs.
AD
IPS
2
step
(ref
eren
ce) t
o di
agno
se G
DM
. Res
ults
: se
nsiti
vity
82%
, spe
cific
ity 9
4%, p
reva
lenc
e 13
.0%
, PPV
61%
, NPV
98%
.
• 4
stud
ies c
ompa
red
75 g
and
100
g lo
ad te
sts t
o di
agno
se G
DM
. Pre
vale
nce
rang
ed fr
om 1
.4 to
50
%. R
esul
ts w
ere
not p
oole
d: se
nsiti
vity
18
to
100%
, spe
cific
ity 8
6 to
100
%, P
PV 1
2 to
100
%,
NPV
62
to 1
00%
.
23
Tab
le D
. Sum
mar
y o
f ev
iden
ce f
or
all K
ey Q
uest
ions
(co
ntin
ued
)
Key
Que
stio
nN
umbe
r an
d
Qua
lity
of S
tudi
esL
imita
tions
/ C
onsi
sten
cyA
pplic
abili
tySu
mm
ary
of F
indi
ngs
KQ
1. W
hat a
re
the
sens
itivi
ties,
spec
ifici
ties,
relia
bilit
ies,
and
yiel
ds o
f cur
rent
sc
reen
ing
test
s for
G
DM
? (a
) Aft
er 2
4 w
eeks
’ ges
tatio
n?
(b) D
urin
g th
e fir
st
trim
este
r an
d up
to
24 w
eeks
’ ges
tatio
n?
(con
tinue
d)
(b) D
urin
g th
e fir
st
trim
este
r and
up
to
24 w
k ge
stat
ion
3 pr
ospe
ctiv
e co
hort
stud
ies
Lim
itatio
ns: O
nly
3 st
udie
s of
wom
en b
efor
e 24
wks
ges
tatio
n;
ther
efor
e, n
o co
nclu
sion
s can
be
mad
e fo
r tes
t cha
ract
eris
tics i
n ea
rly p
regn
ancy
.
Con
sist
ency
: Not
app
licab
le
(not
eno
ugh
stud
ies a
ddre
ssin
g th
e sa
me
ques
tion
to ju
dge
cons
iste
ncy)
.
Evid
ence
too
limite
d to
ju
dge
appl
icab
ility
.•
1 st
udy
exam
ined
the
50 g
OG
CT
at 1
0 w
ks
and
confi
rmed
GD
M u
sing
JSO
G c
riter
ia
(75
g). R
esul
ts: s
ensi
tivity
88%
, spe
cific
ity
79%
, pre
vale
nce
1.6%
, PPV
7%
, NPV
100
%.
• 1
stud
y ex
amin
ed 5
0 g
OG
CT
at 2
0 w
ks a
nd
confi
rmed
GD
M u
sing
AD
A (2
000-
2010
) 100
g
crite
ria. R
esul
ts: s
ensi
tivity
56%
, spe
cific
ity
94%
, pre
vale
nce
3.6%
, PPV
24%
, NPV
98%
.
• 1
stud
y co
mpa
red
1st a
nd 2
nd tr
imes
ter r
esul
ts
usin
g 3
scre
enin
g te
sts (
OG
CT
at ≥
130
mg/
dL, F
PG, H
bA1c
); G
DM
con
firm
ed u
sing
JS
OG
crit
eria
. Res
ults
(OG
CT)
1st
trim
este
r: pr
eval
ence
1.9
%, s
ensi
tivity
93%
, spe
cific
ity
77%
, PPV
7.1
, NPV
99%
; 2nd
trim
este
r: pr
eval
ence
2.9
%, s
ensi
tivity
100
%, s
peci
ficity
85
%, P
PV 1
7%, N
PV 1
00%
. K
Q2:
Wha
t is t
he
dire
ct e
vide
nce
on th
e be
nefit
s and
har
ms
of sc
reen
ing
wom
en
(bef
ore
and
Aft
er
24 w
eeks
’ ges
tatio
n)
for
GD
M to
red
uce
mat
erna
l, fe
tal,
and
infa
nt m
orbi
dity
and
m
orta
lity?
2 re
trosp
ectiv
e co
hort
stud
ies
Fair
and
goo
d qu
ality
Lim
itatio
ns: N
o R
CTs
ava
ilabl
e to
ans
wer
this
que
stio
n.
Con
sist
ency
: Not
app
licab
le
(not
eno
ugh
stud
ies a
ddre
ssin
g th
e sa
me
ques
tion
to ju
dge
cons
iste
ncy)
.
The
com
paris
on fo
r thi
s qu
estio
n w
as w
omen
who
ha
d an
d ha
d no
t und
ergo
ne
scre
enin
g. S
ince
scre
enin
g is
now
com
mon
plac
e, it
m
ay b
e un
likel
y to
iden
tify
stud
ies o
r coh
orts
whe
re th
is
com
paris
on is
feas
ible
.
1 st
udy
(n=1
,000
) sho
wed
mor
e ce
sare
an d
eliv
erie
s in
the
scre
ened
gro
up. A
seco
nd st
udy
(n=9
3)
foun
d th
e in
cide
nce
of m
acro
som
ia (≥
4.3
kg) w
as
the
sam
e in
scre
ened
and
uns
cree
ned
grou
ps (7
%
each
gro
up).
Bas
ed o
n th
e sm
all n
umbe
r of s
tudi
es a
nd sa
mpl
e si
zes,
the
effe
ct o
f scr
eeni
ng w
omen
for G
DM
on
heal
th o
utco
mes
is in
conc
lusi
ve.
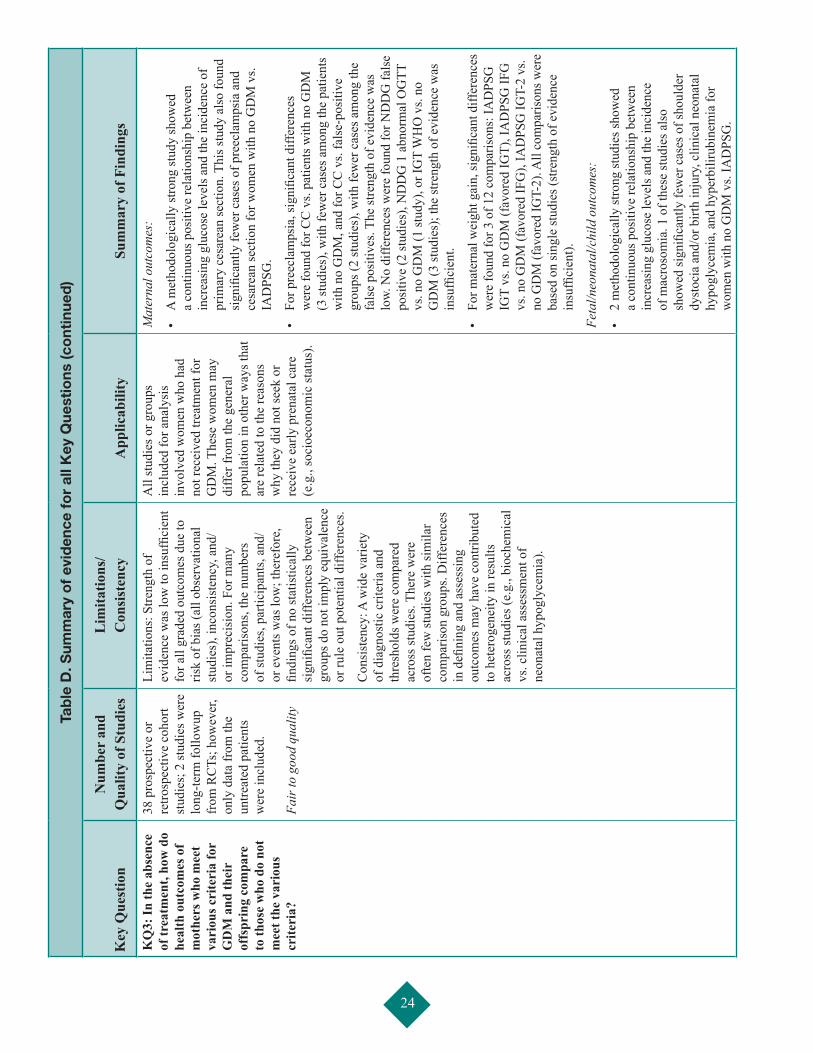
24
Tab
le D
. Sum
mar
y o
f ev
iden
ce f
or
all K
ey Q
uest
ions
(co
ntin
ued
)
Key
Que
stio
nN
umbe
r an
d
Qua
lity
of S
tudi
esL
imita
tions
/ C
onsi
sten
cyA
pplic
abili
tySu
mm
ary
of F
indi
ngs
KQ
3: In
the
abse
nce
of tr
eatm
ent,
how
do
heal
th o
utco
mes
of
mot
hers
who
mee
t va
riou
s cri
teri
a fo
r G
DM
and
thei
r of
fspr
ing
com
pare
to
thos
e w
ho d
o no
t m
eet t
he v
ario
us
crite
ria?
38 p
rosp
ectiv
e or
re
trosp
ectiv
e co
hort
stud
ies;
2 st
udie
s wer
e lo
ng-te
rm fo
llow
up
from
RC
Ts; h
owev
er,
only
dat
a fr
om th
e un
treat
ed p
atie
nts
wer
e in
clud
ed.
Fair
to g
ood
qual
ity
Lim
itatio
ns: S
treng
th o
f ev
iden
ce w
as lo
w to
insu
ffici
ent
for a
ll gr
aded
out
com
es d
ue to
ris
k of
bia
s (al
l obs
erva
tiona
l st
udie
s), i
ncon
sist
ency
, and
/or
impr
ecis
ion.
For
man
y co
mpa
rison
s, th
e nu
mbe
rs
of st
udie
s, pa
rtici
pant
s, an
d/or
eve
nts w
as lo
w; t
here
fore
, fin
ding
s of n
o st
atis
tical
ly
sign
ifica
nt d
iffer
ence
s bet
wee
n gr
oups
do
not i
mpl
y eq
uiva
lenc
e or
rule
out
pot
entia
l diff
eren
ces.
Con
sist
ency
: A w
ide
varie
ty
of d
iagn
ostic
crit
eria
and
th
resh
olds
wer
e co
mpa
red
acro
ss st
udie
s. Th
ere
wer
e of
ten
few
stud
ies w
ith si
mila
r co
mpa
rison
gro
ups.
Diff
eren
ces
in d
efini
ng a
nd a
sses
sing
ou
tcom
es m
ay h
ave
cont
ribut
ed
to h
eter
ogen
eity
in re
sults
ac
ross
stud
ies (
e.g.
, bio
chem
ical
vs
. clin
ical
ass
essm
ent o
f ne
onat
al h
ypog
lyce
mia
).
All
stud
ies o
r gro
ups
incl
uded
for a
naly
sis
invo
lved
wom
en w
ho h
ad
not r
ecei
ved
treat
men
t for
G
DM
. The
se w
omen
may
di
ffer f
rom
the
gene
ral
popu
latio
n in
oth
er w
ays t
hat
are
rela
ted
to th
e re
ason
s w
hy th
ey d
id n
ot se
ek o
r re
ceiv
e ea
rly p
rena
tal c
are
(e.g
., so
cioe
cono
mic
stat
us).
Mat
erna
l out
com
es:
• A
met
hodo
logi
cally
stro
ng st
udy
show
ed
a co
ntin
uous
pos
itive
rela
tions
hip
betw
een
incr
easi
ng g
luco
se le
vels
and
the
inci
denc
e of
pr
imar
y ce
sare
an se
ctio
n. T
his s
tudy
als
o fo
und
sign
ifica
ntly
few
er c
ases
of p
reec
lam
psia
and
ce
sare
an se
ctio
n fo
r wom
en w
ith n
o G
DM
vs.
IAD
PSG
.
• Fo
r pre
ecla
mps
ia, s
igni
fican
t diff
eren
ces
wer
e fo
und
for C
C v
s. pa
tient
s with
no
GD
M
(3 st
udie
s), w
ith fe
wer
cas
es a
mon
g th
e pa
tient
s w
ith n
o G
DM
, and
for C
C v
s. fa
lse-
posi
tive
grou
ps (2
stud
ies)
, with
few
er c
ases
am
ong
the
fals
e po
sitiv
es. T
he st
reng
th o
f evi
denc
e w
as
low.
No
diffe
renc
es w
ere
foun
d fo
r ND
DG
fals
e po
sitiv
e (2
stud
ies)
, ND
DG
1 a
bnor
mal
OG
TT
vs. n
o G
DM
(1 st
udy)
, or I
GT
WH
O v
s. no
G
DM
(3 st
udie
s); t
he st
reng
th o
f evi
denc
e w
as
insu
ffici
ent.
• Fo
r mat
erna
l wei
ght g
ain,
sign
ifica
nt d
iffer
ence
s w
ere
foun
d fo
r 3 o
f 12
com
paris
ons:
IAD
PSG
IG
T vs
. no
GD
M (f
avor
ed IG
T), I
AD
PSG
IFG
vs
. no
GD
M (f
avor
ed IF
G),
IAD
PSG
IGT-
2 vs
. no
GD
M (f
avor
ed IG
T-2)
. All
com
paris
ons w
ere
base
d on
sing
le st
udie
s (st
reng
th o
f evi
denc
e in
suffi
cien
t).
Feta
l/neo
nata
l/chi
ld o
utco
mes
:
• 2
met
hodo
logi
cally
stro
ng st
udie
s sho
wed
a
cont
inuo
us p
ositi
ve re
latio
nshi
p be
twee
n in
crea
sing
glu
cose
leve
ls a
nd th
e in
cide
nce
of m
acro
som
ia. 1
of t
hese
stud
ies a
lso
show
ed si
gnifi
cant
ly fe
wer
cas
es o
f sho
ulde
r dy
stoc
ia a
nd/o
r birt
h in
jury
, clin
ical
neo
nata
l hy
pogl
ycem
ia, a
nd h
yper
bilir
ubin
emia
for
wom
en w
ith n
o G
DM
vs.
IAD
PSG
.
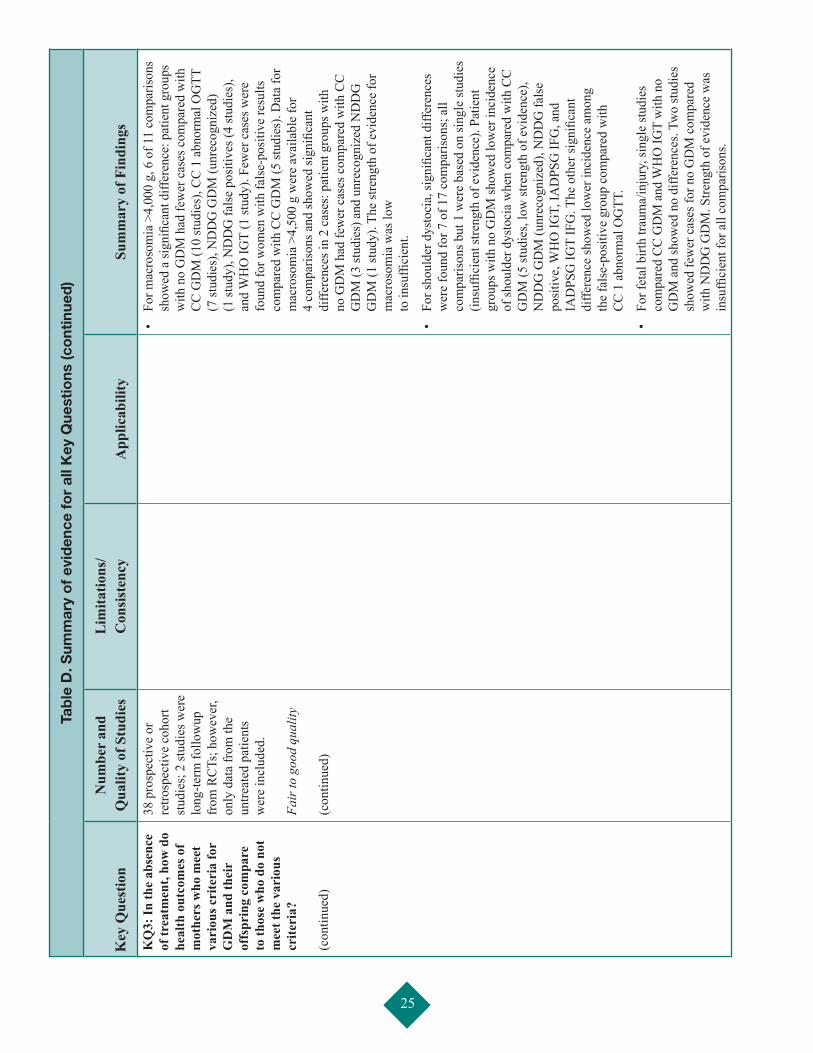
25
Tab
le D
. Sum
mar
y o
f ev
iden
ce f
or
all K
ey Q
uest
ions
(co
ntin
ued
)
Key
Que
stio
nN
umbe
r an
d
Qua
lity
of S
tudi
esL
imita
tions
/ C
onsi
sten
cyA
pplic
abili
tySu
mm
ary
of F
indi
ngs
KQ
3: In
the
abse
nce
of tr
eatm
ent,
how
do
heal
th o
utco
mes
of
mot
hers
who
mee
t va
riou
s cri
teri
a fo
r G
DM
and
thei
r of
fspr
ing
com
pare
to
thos
e w
ho d
o no
t m
eet t
he v
ario
us
crite
ria?
(c
ontin
ued)
38 p
rosp
ectiv
e or
re
trosp
ectiv
e co
hort
stud
ies;
2 st
udie
s wer
e lo
ng-te
rm fo
llow
up
from
RC
Ts; h
owev
er,
only
dat
a fr
om th
e un
treat
ed p
atie
nts
wer
e in
clud
ed.
Fair
to g
ood
qual
ity
(con
tinue
d)
• Fo
r mac
roso
mia
>4,
000
g, 6
of 1
1 co
mpa
rison
s sh
owed
a si
gnifi
cant
diff
eren
ce: p
atie
nt g
roup
s w
ith n
o G
DM
had
few
er c
ases
com
pare
d w
ith
CC
GD
M (1
0 st
udie
s), C
C 1
abn
orm
al O
GTT
(7
stud
ies)
, ND
DG
GD
M (u
nrec
ogni
zed)
(1
stud
y), N
DD
G fa
lse
posi
tives
(4 st
udie
s),
and
WH
O IG
T (1
stud
y). F
ewer
cas
es w
ere
foun
d fo
r wom
en w
ith fa
lse-
posi
tive
resu
lts
com
pare
d w
ith C
C G
DM
(5 st
udie
s). D
ata
for
mac
roso
mia
>4,
500
g w
ere
avai
labl
e fo
r 4
com
paris
ons a
nd sh
owed
sign
ifica
nt
diffe
renc
es in
2 c
ases
: pat
ient
gro
ups w
ith
no G
DM
had
few
er c
ases
com
pare
d w
ith C
C
GD
M (3
stud
ies)
and
unr
ecog
nize
d N
DD
G
GD
M (1
stud
y). T
he st
reng
th o
f evi
denc
e fo
r m
acro
som
ia w
as lo
w
to in
suffi
cien
t.
• Fo
r sho
ulde
r dys
toci
a, si
gnifi
cant
diff
eren
ces
wer
e fo
und
for 7
of 1
7 co
mpa
rison
s; a
ll co
mpa
rison
s but
1 w
ere
base
d on
sing
le st
udie
s (in
suffi
cien
t stre
ngth
of e
vide
nce)
. Pat
ient
gr
oups
with
no
GD
M sh
owed
low
er in
cide
nce
of sh
ould
er d
ysto
cia
whe
n co
mpa
red
with
CC
G
DM
(5 st
udie
s, lo
w st
reng
th o
f evi
denc
e),
ND
DG
GD
M (u
nrec
ogni
zed)
, ND
DG
fals
e po
sitiv
e, W
HO
IGT,
IAD
PSG
IFG
, and
IA
DPS
G IG
T IF
G. T
he o
ther
sign
ifica
nt
diffe
renc
e sh
owed
low
er in
cide
nce
amon
g
the
fals
e-po
sitiv
e gr
oup
com
pare
d w
ith
CC
1 a
bnor
mal
OG
TT.
• Fo
r fet
al b
irth
traum
a/in
jury
, sin
gle
stud
ies
com
pare
d C
C G
DM
and
WH
O IG
T w
ith n
o G
DM
and
show
ed n
o di
ffere
nces
. Tw
o st
udie
s sh
owed
few
er c
ases
for n
o G
DM
com
pare
d w
ith N
DD
G G
DM
. Stre
ngth
of e
vide
nce
was
in
suffi
cien
t for
all
com
paris
ons.
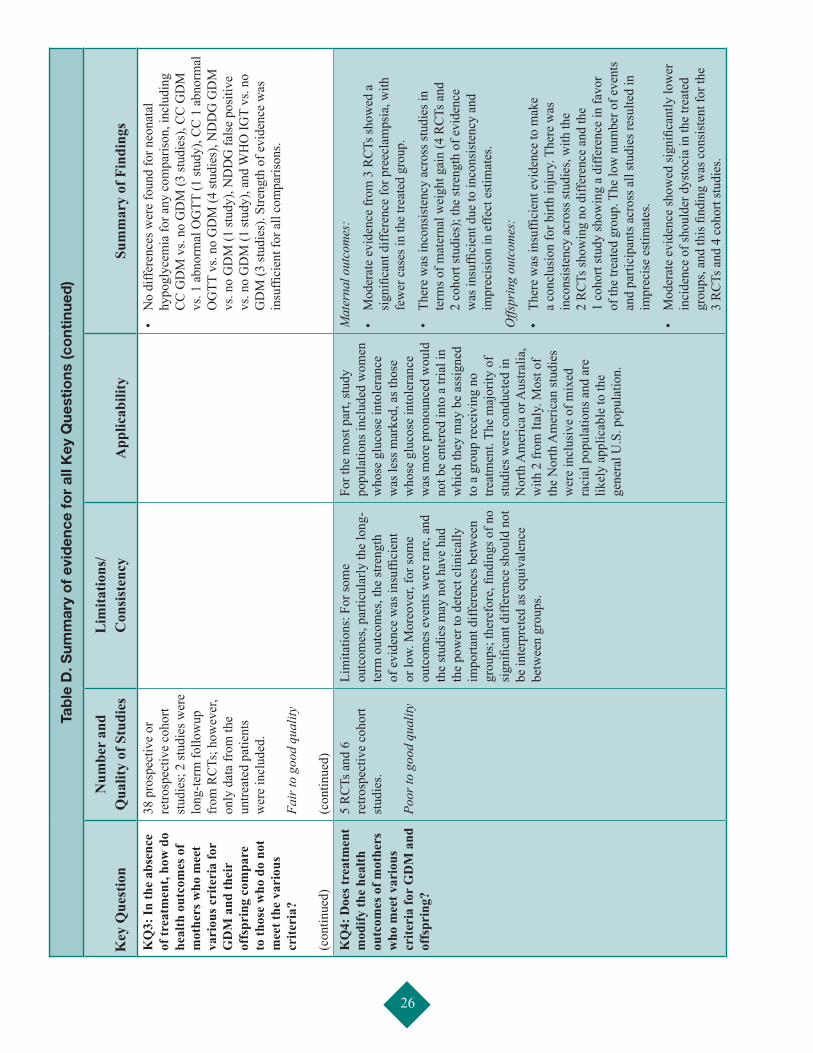
26
Tab
le D
. Sum
mar
y o
f ev
iden
ce f
or
all K
ey Q
uest
ions
(co
ntin
ued
)
Key
Que
stio
nN
umbe
r an
d
Qua
lity
of S
tudi
esL
imita
tions
/ C
onsi
sten
cyA
pplic
abili
tySu
mm
ary
of F
indi
ngs
KQ
3: In
the
abse
nce
of tr
eatm
ent,
how
do
heal
th o
utco
mes
of
mot
hers
who
mee
t va
riou
s cri
teri
a fo
r G
DM
and
thei
r of
fspr
ing
com
pare
to
thos
e w
ho d
o no
t m
eet t
he v
ario
us
crite
ria?
(c
ontin
ued)
38 p
rosp
ectiv
e or
re
trosp
ectiv
e co
hort
stud
ies;
2 st
udie
s wer
e lo
ng-te
rm fo
llow
up
from
RC
Ts; h
owev
er,
only
dat
a fr
om th
e un
treat
ed p
atie
nts
wer
e in
clud
ed.
Fair
to g
ood
qual
ity
(con
tinue
d)
• N
o di
ffere
nces
wer
e fo
und
for n
eona
tal
hypo
glyc
emia
for a
ny c
ompa
rison
, inc
ludi
ng
CC
GD
M v
s. no
GD
M (3
stud
ies)
, CC
GD
M
vs. 1
abn
orm
al O
GTT
(1 st
udy)
, CC
1 a
bnor
mal
O
GTT
vs.
no G
DM
(4 st
udie
s), N
DD
G G
DM
vs
. no
GD
M (1
stud
y), N
DD
G fa
lse
posi
tive
vs. n
o G
DM
(1 st
udy)
, and
WH
O IG
T vs
. no
GD
M (3
stud
ies)
. Stre
ngth
of e
vide
nce
was
in
suffi
cien
t for
all
com
paris
ons.
KQ
4: D
oes t
reat
men
t m
odify
the
heal
th
outc
omes
of m
othe
rs
who
mee
t var
ious
cr
iteri
a fo
r G
DM
and
of
fspr
ing?
5 R
CTs
and
6
retro
spec
tive
coho
rt st
udie
s. Po
or to
goo
d qu
ality
Lim
itatio
ns: F
or so
me
outc
omes
, par
ticul
arly
the
long
-te
rm o
utco
mes
, the
stre
ngth
of
evi
denc
e w
as in
suffi
cien
t or
low.
Mor
eove
r, fo
r som
e ou
tcom
es e
vent
s wer
e ra
re, a
nd
the
stud
ies m
ay n
ot h
ave
had
the
pow
er to
det
ect c
linic
ally
im
porta
nt d
iffer
ence
s bet
wee
n gr
oups
; the
refo
re, fi
ndin
gs o
f no
sign
ifica
nt d
iffer
ence
shou
ld n
ot
be in
terp
rete
d as
equ
ival
ence
be
twee
n gr
oups
.
For t
he m
ost p
art,
stud
y po
pula
tions
incl
uded
wom
en
who
se g
luco
se in
tole
ranc
e w
as le
ss m
arke
d, a
s tho
se
who
se g
luco
se in
tole
ranc
e w
as m
ore
pron
ounc
ed w
ould
no
t be
ente
red
into
a tr
ial i
n w
hich
they
may
be
assi
gned
to
a g
roup
rece
ivin
g no
tre
atm
ent.
The
maj
ority
of
stud
ies w
ere
cond
ucte
d in
N
orth
Am
eric
a or
Aus
tralia
, w
ith 2
from
Ital
y. M
ost o
f th
e N
orth
Am
eric
an st
udie
s w
ere
incl
usiv
e of
mix
ed
raci
al p
opul
atio
ns a
nd a
re
likel
y ap
plic
able
to th
e ge
nera
l U.S
. pop
ulat
ion.
Mat
erna
l out
com
es:
• M
oder
ate
evid
ence
from
3 R
CTs
show
ed a
si
gnifi
cant
diff
eren
ce fo
r pre
ecla
mps
ia, w
ith
few
er c
ases
in th
e tre
ated
gro
up.
• Th
ere
was
inco
nsis
tenc
y ac
ross
stud
ies i
n te
rms o
f mat
erna
l wei
ght g
ain
(4 R
CTs
and
2
coho
rt st
udie
s); t
he st
reng
th o
f evi
denc
e w
as in
suffi
cien
t due
to in
cons
iste
ncy
and
impr
ecis
ion
in e
ffect
est
imat
es.
Offs
prin
g ou
tcom
es:
• Th
ere
was
insu
ffici
ent e
vide
nce
to m
ake
a co
nclu
sion
for b
irth
inju
ry. T
here
was
in
cons
iste
ncy
acro
ss st
udie
s, w
ith th
e
2 R
CTs
show
ing
no d
iffer
ence
and
the
1
coho
rt st
udy
show
ing
a di
ffere
nce
in fa
vor
of th
e tre
ated
gro
up. T
he lo
w n
umbe
r of e
vent
s an
d pa
rtici
pant
s acr
oss a
ll st
udie
s res
ulte
d in
im
prec
ise
estim
ates
.
• M
oder
ate
evid
ence
show
ed si
gnifi
cant
ly lo
wer
in
cide
nce
of sh
ould
er d
ysto
cia
in th
e tre
ated
gr
oups
, and
this
find
ing
was
con
sist
ent f
or th
e
3 R
CTs
and
4 c
ohor
t stu
dies
.
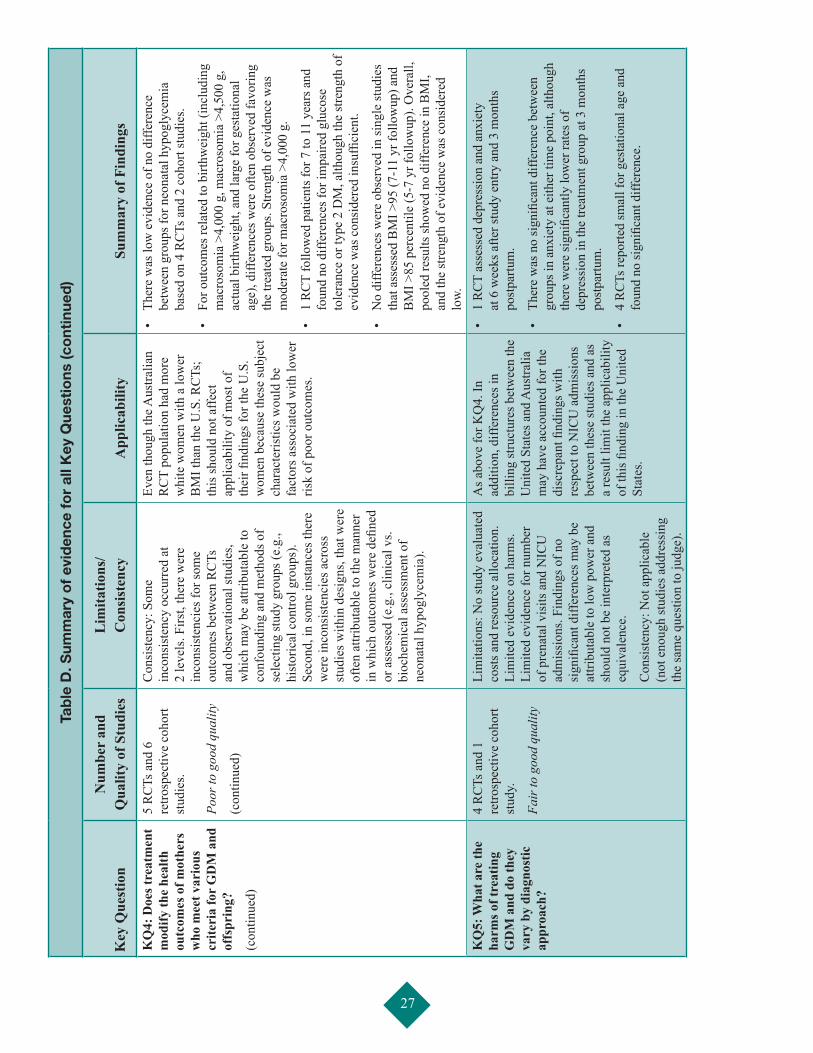
27
Tab
le D
. Sum
mar
y o
f ev
iden
ce f
or
all K
ey Q
uest
ions
(co
ntin
ued
)
Key
Que
stio
nN
umbe
r an
d
Qua
lity
of S
tudi
esL
imita
tions
/ C
onsi
sten
cyA
pplic
abili
tySu
mm
ary
of F
indi
ngs
KQ
4: D
oes t
reat
men
t m
odify
the
heal
th
outc
omes
of m
othe
rs
who
mee
t var
ious
cr
iteri
a fo
r G
DM
and
of
fspr
ing?
(con
tinue
d)
5 R
CTs
and
6
retro
spec
tive
coho
rt st
udie
s. Po
or to
goo
d qu
ality
(con
tinue
d)
Con
sist
ency
: Som
e in
cons
iste
ncy
occu
rred
at
2 le
vels
. Firs
t, th
ere
wer
e in
cons
iste
ncie
s for
som
e ou
tcom
es b
etw
een
RC
Ts
and
obse
rvat
iona
l stu
dies
, w
hich
may
be
attri
buta
ble
to
conf
ound
ing
and
met
hods
of
sele
ctin
g st
udy
grou
ps (e
.g.,
hist
oric
al c
ontro
l gro
ups)
. Se
cond
, in
som
e in
stan
ces t
here
w
ere
inco
nsis
tenc
ies a
cros
s st
udie
s with
in d
esig
ns, t
hat w
ere
ofte
n at
tribu
tabl
e to
the
man
ner
in w
hich
out
com
es w
ere
defin
ed
or a
sses
sed
(e.g
., cl
inic
al v
s. bi
oche
mic
al a
sses
smen
t of
neon
atal
hyp
ogly
cem
ia).
Even
thou
gh th
e Aus
tralia
n R
CT
popu
latio
n ha
d m
ore
whi
te w
omen
with
a lo
wer
B
MI t
han
the
U.S
. RC
Ts;
this
shou
ld n
ot a
ffect
ap
plic
abili
ty o
f mos
t of
thei
r find
ings
for t
he U
.S.
wom
en b
ecau
se th
ese
subj
ect
char
acte
ristic
s wou
ld b
e fa
ctor
s ass
ocia
ted
with
low
er
risk
of p
oor o
utco
mes
.
• Th
ere
was
low
evi
denc
e of
no
diffe
renc
e be
twee
n gr
oups
for n
eona
tal h
ypog
lyce
mia
ba
sed
on 4
RC
Ts a
nd 2
coh
ort s
tudi
es.
• Fo
r out
com
es re
late
d to
birt
hwei
ght (
incl
udin
g m
acro
som
ia >
4,00
0 g,
mac
roso
mia
>4,
500
g,
actu
al b
irthw
eigh
t, an
d la
rge
for g
esta
tiona
l ag
e), d
iffer
ence
s wer
e of
ten
obse
rved
favo
ring
the
treat
ed g
roup
s. St
reng
th o
f evi
denc
e w
as
mod
erat
e fo
r mac
roso
mia
>4,
000
g.
• 1
RC
T fo
llow
ed p
atie
nts f
or 7
to 1
1 ye
ars a
nd
foun
d no
diff
eren
ces f
or im
paire
d gl
ucos
e to
lera
nce
or ty
pe 2
DM
, alth
ough
the
stre
ngth
of
evid
ence
was
con
side
red
insu
ffici
ent.
• N
o di
ffere
nces
wer
e ob
serv
ed in
sing
le st
udie
s th
at a
sses
sed
BM
I >95
(7-1
1 yr
follo
wup
) and
B
MI >
85 p
erce
ntile
(5-7
yr f
ollo
wup
). O
vera
ll,
pool
ed re
sults
show
ed n
o di
ffere
nce
in B
MI,
and
the
stre
ngth
of e
vide
nce
was
con
side
red
low.
KQ
5: W
hat a
re th
e ha
rms o
f tre
atin
g G
DM
and
do
they
va
ry b
y di
agno
stic
ap
proa
ch?
4 R
CTs
and
1
retro
spec
tive
coho
rt st
udy.
Fair
to g
ood
qual
ity
Lim
itatio
ns: N
o st
udy
eval
uate
d co
sts a
nd re
sour
ce a
lloca
tion.
Li
mite
d ev
iden
ce o
n ha
rms.
Lim
ited
evid
ence
for n
umbe
r of
pre
nata
l vis
its a
nd N
ICU
ad
mis
sion
s. Fi
ndin
gs o
f no
sign
ifica
nt d
iffer
ence
s may
be
attri
buta
ble
to lo
w p
ower
and
sh
ould
not
be
inte
rpre
ted
as
equi
vale
nce.
Con
sist
ency
: Not
app
licab
le
(not
eno
ugh
stud
ies a
ddre
ssin
g th
e sa
me
ques
tion
to ju
dge)
.
As a
bove
for K
Q4.
In
addi
tion,
diff
eren
ces i
n bi
lling
stru
ctur
es b
etw
een
the
Uni
ted
Stat
es a
nd A
ustra
lia
may
hav
e ac
coun
ted
for t
he
disc
repa
nt fi
ndin
gs w
ith
resp
ect t
o N
ICU
adm
issi
ons
betw
een
thes
e st
udie
s and
as
a re
sult
limit
the
appl
icab
ility
of
this
find
ing
in th
e U
nite
d St
ates
.
• 1
RC
T as
sess
ed d
epre
ssio
n an
d an
xiet
y at
6 w
eeks
afte
r stu
dy e
ntry
and
3 m
onth
s po
stpa
rtum
.
• Th
ere
was
no
sign
ifica
nt d
iffer
ence
bet
wee
n gr
oups
in a
nxie
ty a
t eith
er ti
me
poin
t, al
thou
gh
ther
e w
ere
sign
ifica
ntly
low
er ra
tes o
f de
pres
sion
in th
e tre
atm
ent g
roup
at 3
mon
ths
post
partu
m.
• 4
RC
Ts re
porte
d sm
all f
or g
esta
tiona
l age
and
fo
und
no si
gnifi
cant
diff
eren
ce.
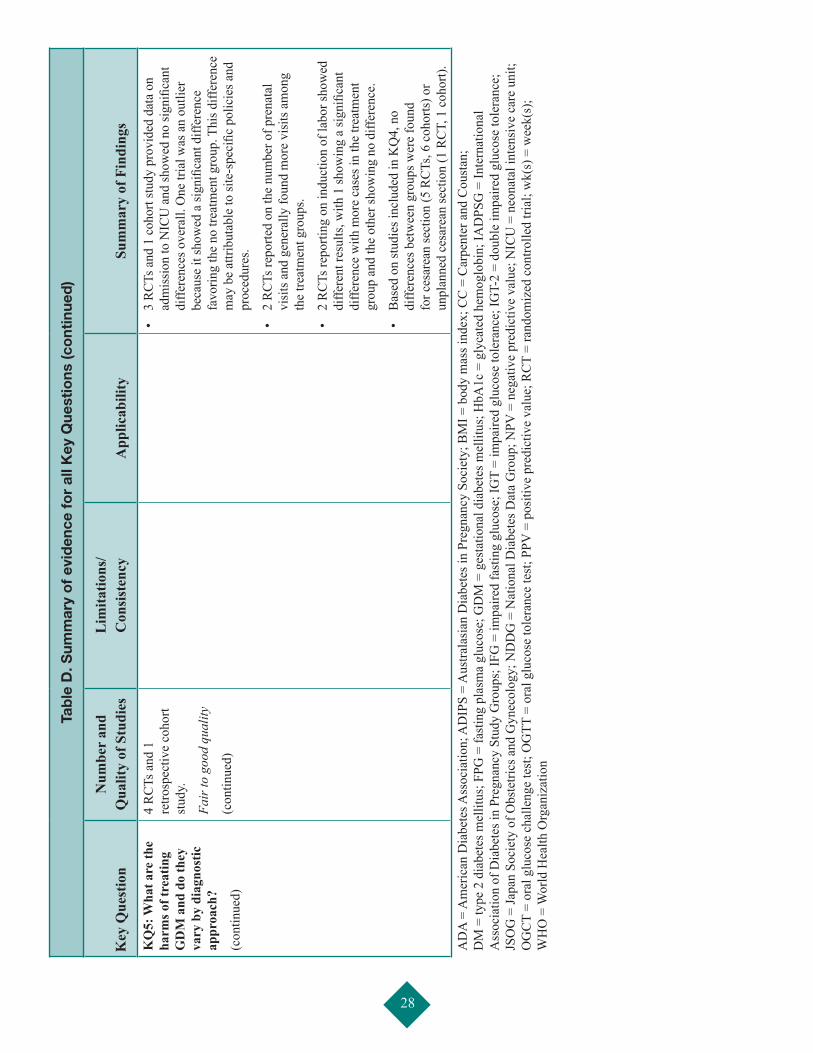
28
Tab
le D
. Sum
mar
y o
f ev
iden
ce f
or
all K
ey Q
uest
ions
(co
ntin
ued
)
Key
Que
stio
nN
umbe
r an
d
Qua
lity
of S
tudi
esL
imita
tions
/ C
onsi
sten
cyA
pplic
abili
tySu
mm
ary
of F
indi
ngs
KQ
5: W
hat a
re th
e ha
rms o
f tre
atin
g G
DM
and
do
they
va
ry b
y di
agno
stic
ap
proa
ch?
(con
tinue
d)
4 R
CTs
and
1
retro
spec
tive
coho
rt st
udy.
Fair
to g
ood
qual
ity
(con
tinue
d)
• 3
RC
Ts a
nd 1
coh
ort s
tudy
pro
vide
d da
ta o
n ad
mis
sion
to N
ICU
and
show
ed n
o si
gnifi
cant
di
ffere
nces
ove
rall.
One
tria
l was
an
outli
er
beca
use
it sh
owed
a si
gnifi
cant
diff
eren
ce
favo
ring
the
no tr
eatm
ent g
roup
. Thi
s diff
eren
ce
may
be
attri
buta
ble
to si
te-s
peci
fic p
olic
ies a
nd
proc
edur
es.
• 2
RC
Ts re
porte
d on
the
num
ber o
f pre
nata
l vi
sits
and
gen
eral
ly fo
und
mor
e vi
sits
am
ong
the
treat
men
t gro
ups.
• 2
RC
Ts re
porti
ng o
n in
duct
ion
of la
bor s
how
ed
diffe
rent
resu
lts, w
ith 1
show
ing
a si
gnifi
cant
di
ffere
nce
with
mor
e ca
ses i
n th
e tre
atm
ent
grou
p an
d th
e ot
her s
how
ing
no d
iffer
ence
.
• B
ased
on
stud
ies i
nclu
ded
in K
Q4,
no
diffe
renc
es b
etw
een
grou
ps w
ere
foun
d fo
r ces
area
n se
ctio
n (5
RC
Ts, 6
coh
orts
) or
unpl
anne
d ce
sare
an se
ctio
n (1
RC
T, 1
coh
ort).
AD
A =
Am
eric
an D
iabe
tes A
ssoc
iatio
n; A
DIP
S =
Aus
trala
sian
Dia
bete
s in
Preg
nanc
y So
ciet
y; B
MI =
bod
y m
ass i
ndex
; CC
= C
arpe
nter
and
Cou
stan
; D
M =
type
2 d
iabe
tes m
ellit
us; F
PG =
fast
ing
plas
ma
gluc
ose;
GD
M =
ges
tatio
nal d
iabe
tes m
ellit
us; H
bA1c
= g
lyca
ted
hem
oglo
bin;
IAD
PSG
= In
tern
atio
nal
Ass
ocia
tion
of D
iabe
tes i
n Pr
egna
ncy
Stud
y G
roup
s; IF
G =
impa
ired
fast
ing
gluc
ose;
IGT
= im
paire
d gl
ucos
e to
lera
nce;
IGT-
2 =
doub
le im
paire
d gl
ucos
e to
lera
nce;
JS
OG
= Ja
pan
Soci
ety
of O
bste
trics
and
Gyn
ecol
ogy;
ND
DG
= N
atio
nal D
iabe
tes D
ata
Gro
up; N
PV =
neg
ativ
e pr
edic
tive
valu
e; N
ICU
= n
eona
tal i
nten
sive
car
e un
it;
OG
CT
= or
al g
luco
se c
halle
nge
test
; OG
TT =
ora
l glu
cose
tole
ranc
e te
st; P
PV =
pos
itive
pre
dict
ive
valu
e; R
CT
= ra
ndom
ized
con
trolle
d tri
al; w
k(s)
= w
eek(
s);
WH
O =
Wor
ld H
ealth
Org
aniz
atio
n
29
References
1. Balsells M, Garcia-Patterson A, Gich I, et al. Maternal and fetal outcome in women with type 2 versus type 1 diabetes mellitus: a systematic review and metaanalysis. J Clin Endocrinol Metab. 2009;94(11):4284-91. PMID: 19808847.
2. National Diabetes Data Group. Diabetes in America, 2nd ed. Bethesda, MD: National Institutes of Health; 1995.
3. HAPO Study Cooperative Research Group, Metzger B, Lowe L, et al. Hyperglycemia and adverse pregnancy outcomes. N Engl J Med. 2008;358(19):1991-2002. PMID: 18463375.
4. American Diabetes Association. Position statement: standards of medical care in diabetes - 2012. Diabetes Care. 2012;35(Suppl 1):S11-S63. PMID: 22187469.
5. Carpenter MW, Coustan DR. Criteria for screening tests for gestational diabetes. Am J Obstet Gynecol. 1982;144(7):768-73. PMID: 7148898.
6. Sacks DA, Hadden DR, Maresh M, et al. Frequency of gestational diabetes mellitus at collaborating centers based on IADPSG consensus panel-recommended criteria: the Hyperglycemia and Adverse Pregnancy Outcome (HAPO) Study. Diabetes Care. 2012;35(3):526-8. PMID: 22355019.
7. Ferrara A. Increasing prevalence of gestational diabetes mellitus: a public health perspective. Diabetes Care. 2007;30(Suppl 2):S141-S146. PMID: 17596462.
8. Gillman MW, Oakey H, Baghurst PA, et al. Effect of treatment of gestational diabetes mellitus on obesity in the next generation. Diabetes Care. 2010;33(5):964-8. PMID: 20150300.
9. Kaufmann RC, Schleyhahn FT, Huffman DG, et al. Gestational diabetes diagnostic criteria: long-term maternal follow-up. Am J Obstet Gynecol. 1995;172(2 Pt 1):621-5. PMID: 7856695.
10. Diagnosis and classification of diabetes mellitus. Diabetes Care. 2006;29(Suppl 1):S43-S48. PMID: 16373932.
11. Berger H, Crane J, Farine D, et al. Screening for gestational diabetes mellitus. J Obstet Gynaecol Can. 2002;24(11):894-912. PMID: 12417905.
12. Naylor CD, Sermer M, Chen E, et al. Selective screening for gestational diabetes mellitus. Toronto Trihospital Gestational Diabetes Project Investigators. N Engl J Med. 1997;337(22):1591-6. PMID: 9371855.
13. Hillier T, Vesco K, Pedula K, et al. Screening for gestational diabetes mellitus: a systematic review for the U.S. Preventive Services Task Force. Ann Intern Med. 2008;148:766-75. PMID: 18490689.
14. American College of Obstetricians and Gynecologists Committee on Practice Bulletins. ACOG Practice Bulletin. Clinical management guidelines for obstetrician-gynecologists. Number 30, September 2001. Gestational Diabetes. Obstet Gynecol. 2001;98(3):525-38. PMID: 1154779.
15. Meltzer SJ, Snyder J, Penrod JR, et al. Gestational diabetes mellitus screening and diagnosis: a prospective randomised controlled trial comparing costs of one-step and two-step methods. BJOG. 2010;117(4):407-15. PMID: 20105163.
16. Gabbe S, Gregory R, Power M, et al. Management of diabetes mellitus by obstetrician-gynecologists. Obstet Gynecol. 2004;103(6):1229-34. PMID: 15172857.
17. American Diabetes Association. Position Statement: Diabetes mellitus. Diabetes Care. 2004;27(Suppl 1):S11-S14. PMID: 14693922.
18. Moses RG, Cheung NW. Point: universal screening for gestational diabetes mellitus. Diabetes Care. 2009;32(7):1349-51. PMID: 19564479.
19. Danilenko-Dixon DR, Van Winter JT, Nelson RL, et al. Universal versus selective gestational diabetes screening: application of 1997 American Diabetes Association recommendations. Am J Obstet Gynecol. 1999;181(4):798-802. PMID: 10521732.
20. Berger H, Sermer M. Counterpoint: selective screening for gestational diabetes mellitus. Diabetes Care. 2009;32(7):1352-4. PMID: 19564480.
21. Metzger B, Gabbe S, Persson B, et al. International Association of Diabetes and Pregnancy Study Groups recommendations on the diagnosis and classification of hyperglycemia in pregnancy. Diabetes Care. 2010;33(3):676-82. PMID: 20190296.
22. Lipscombe LL, Hux JE. Trends in diabetes prevalence, incidence, and mortality in Ontario, Canada 1995-2005: a population-based study. Lancet. 2007;369(9563):750-6. PMID: 17336651.
23. American Diabetes Association. Position statement: gestational diabetes mellitus. Diabetes Care. 2003;26(Suppl 1):S103-S105. PMID: 12502631.
24. U.S.Preventive Services Task Force. Screening for gestational diabetes mellitus: recommendations and rationale. Obstet Gynecol. 2003;101(393):395. PMID: 12576265.
25. Landon MB, Spong CY, Thom E, et al. A multicenter, randomized trial of treatment for mild gestational diabetes. N Engl J Med. 2009;361(14):1339-48. PMID: 19797280.
26. Report of the Expert Committee on the Diagnosis and Classification of Diabetes Mellitus. Diabetes Care. 1999;22(Suppl 1):S5-S19.
30
27. Report of the Expert Committee on the Diagnosis and Classification of Diabetes Mellitus. Diabetes Care. 2000;23(Suppl 1):S4-S19. PMID: 12017675.
28. Report of the Expert Committee on the Diagnosis and Classification of Diabetes Mellitus. Diabetes Care. 2001;24(Suppl 1):S5-S20.
29. Report of the Expert Committee on the Diagnosis and Classification of Diabetes Mellitus. Diabetes Care. 2002;25(Suppl 1):S5-S20.
30. Report of the Expert Committee on the Diagnosis and Classification of Diabetes Mellitus. Diabetes Care. 2003;26(Suppl 1):S5-S20. PMID: 12502614.
31. American Diabetes Association. Diagnosis and classification of diabetes mellitus. Diabetes Care. 2004 Jan;27(Suppl 1):S5-S10. PMID: 14693921.
32. American Diabetes Association. Diagnosis and classification of diabetes mellitus. Diabetes Care. 2005;28(Suppl 1):S37-S42. PMID: 15618111.
33. American Diabetes Association. Diagnosis and classification of diabetes mellitus.Diabetes Care. 2007 Jan;30(Suppl 1):S42-S7. PMID: 17192378.
34. Diagnosis and classification of diabetes mellitus. Diabetes Care. 2008;31(Suppl 1):S55-S60. PMID: 18165338.
35. Diagnosis and classification of diabetes mellitus. Diabetes Care. 2009;32(Suppl 1):S62-S67. PMID: 19118289.
36. Diagnosis and classification of diabetes mellitus. Diabetes Care. 2010;33(Suppl 1):S62-S69. PMID: 20042775.
37. International association of diabetes and pregnancy study groups recommendations on the diagnosis and classification of hyperglycemia in pregnancy. Diabetes Care. 2010;33(3):676-82. PMID: 20190296.
38. Jovanovic L. American Diabetes Association’s Fourth International Workshop-Conference on Gestational Diabetes Mellitus: summary and discussion. Therapeutic interventions. Diabetes Care. 1998;21(Suppl 2):B131-37. PMID: 9704240.
39. Metzger BE, Oats JN, Kjos SL, et al. Summary and Recommendations of the Fifth International Workshop-Conference on Gestational Diabetes Mellitus. Diabetes Care. 2007;30(Suppl 2):S251-S260. PMID: 17596481.
40. Classification and diagnosis of diabetes mellitus and other categories of glucose intolerance. National Diabetes Data Group. Diabetes. 1979;28(12):1039-57. PMID: 510803.
41. World Health Organization. Definition, diagnosis and classification of diabetes mellitus and its complications. Report of a WHO Consultation. Part 1: Diagnosis and classification of diabetes mellitus. 1999.
42. World Health Organization. Report of a WHO study Group (Technical Report Series No.727). Report of a WHO study group (Technical Report Series No. 727). 1985.
43. Canadian Diabetes Association Clinical Practice Guidelines Expert Committee. Canadian Diabetes Association 2003 Clinical Practice Guidelines for the Prevention and Management of Diabetes in Canada. Can J Diabetes. 2003;27(Suppl 2), S1-S152.
44. Canadian Diabetes Association 2008 Clinical Practice Guidelines for the Prevention and Management of Diabetes in Canada [corrected] [published erratum appears in Can J Diabetes 2009 Mar;33(1):46]. Can J Diabetes. 2008;32:iv.
45. Sempowski IP, Houlden RL. Managing diabetes during pregnancy. Guide for family physicians. Canadian Family Physician Médecin De Famille Canadien. 2003;49:761-7. PMID: 12836864.
46. Metzger BE. Summary and recommendations of the Third International Workshop-Conference on Gestational Diabetes Mellitus. Diabetes. 1991;40(Suppl 2):197-201. PMID: 1748259.
47. Hoffman L, Nolan C, Wilson JD, et al. Gestational diabetes mellitus--management guidelines. The Australasian Diabetes in Pregnancy Society. The Medical Journal Of Australia. 1998;169(2):93-7. PMID: 9700346.
48. Brown CJ, Dawson A, Dodds R, et al. Report of the Pregnancy and Neonatal Care Group. Diabetic Medicine: A Journal Of The British Diabetic Association. 1996;13(9 Suppl 4):S43-S53. PMID: 8894455.
49. Whiting PF, Rutjes AW, Westwood ME, et al. QUADAS-2: a revised tool for the quality assessment of diagnostic accuracy studies. Ann Intern Med. 2011;155(8):529-36. PMID: 22007046.
50. Reitsma JB, Glas AS, Rutjes AW, et al. Bivariate analysis of sensitivity and specificity produces informative summary measures in diagnostic reviews. J Clin Epidemiol. 2005;58(10):982-90. PMID: 16168343.
51. Sermer M, Naylor CD, Gare DJ, et al. Impact of increasing carbohydrate intolerance on maternal-fetal outcomes in 3637 women without gestational diabetes. The Toronto Tri-Hospital Gestational Diabetes Project. Am J Obstet Gynecol. 1995;173(1):146-56. PMID: 7631672.
52. Crowther CA, Hiller JE, Moss JR, et al. Effect of treatment of gestational diabetes mellitus on pregnancy outcomes. N Engl J Med. 2005;352(24):2477-86. PMID: 15951574.
53. Horvath K, Koch K, Jeitler K, et al. Effects of treatment in women with gestational diabetes mellitus: systematic review and meta-analysis. BMJ: British Medical Journal (International Edition). 2010;340:c1395. PMID: 20360215.
54. Malcolm JC, Lawson ML, Gaboury I, et al. Glucose tolerance of offspring of mother with gestational diabetes mellitus in a low-risk population. Diabetic Med. 2006;23(5):565-70. PMID: 16681566.
31
55. Pettitt DJ, McKenna S, McLaughlin C, et al. Maternal glucose at 28 weeks of gestation is not associated with obesity in 2-year-old offspring: The Belfast Hyperglycemia and Adverse Pregnancy Outcome (HAPO) family study. Diabetes Care. 2010;33(6):1219-23. PMID: 20215449.
56. Ryan EA. Diagnosing gestational diabetes. Diabetologia. 2011;54(3):480-6. PMID: 21203743.
57. HAPO Study Cooperative Research Group. Hyperglycaemia and Adverse Pregnancy Outcome (HAPO) Study: associations with maternal body mass index. BJOG. 2010;117(5):575-84. PMID: 20089115.
58. Ricart W, Lopez J, Mozas J, et al. Body mass index has a greater impact on pregnancy outcomes than gestational hyperglycaemia. Diabetologia. 2005;48(9):1736-42. PMID: 16052327.
59. Langer O, Yogev Y, Most O, et al. Gestational diabetes: the consequences of not treating. Am J Obstet Gynecol. 2005;192(4):989-97. PMID: 15846171.
60. Cundy T, Gamble G, Townend K, et al. Perinatal mortality in Type 2 diabetes mellitus. Diabet Med. 2000;17(1):33-9. PMID: 10691157.
61. Sacks DA, Greenspoon JS, bu-Fadil S, et al. Toward universal criteria for gestational diabetes: The 75-gram glucose tolerance test in pregnancy. Am J Obstet Gynecol. 1995;172(2 I):607-14. PMID: 7856693.
62. Rasmussen SS, Glumer C, Sandbaek A, et al. Short-term reproducibility of impaired fasting glycaemia, impaired glucose tolerance and diabetes The ADDITION study, DK. Diabetes Res Clin Pract. 2008;80(1):146-52. PMID: 18082284.
63. Schaefer-Graf UM, Hartmann R, Pawliczak J, et al. Association of breast-feeding and early childhood overweight in children from mothers with gestational diabetes mellitus. Diabetes Care. 2006;29(5):1105-7. PMID: 16644645.
64. Buchanan TA, Kjos SL, Montoro MN, et al. Use of fetal ultrasound to select metabolic therapy for pregnancies complicated by mild gestational diabetes. Diabetes Care. 1994;17(4):275-83. PMID: 8026282.
Full Report
This executive summary is part of the following document: Hartling L, Dryden DM, Guthrie A, Muise M, Vandermeer B, Aktary WM, Pasichnyk D, Seida JC, Donovan L. Screening and Diagnosing Gestational Diabetes Mellitus. Evidence Report/Technology Assessment No. 210. (Prepared by the University of Alberta Evidence-based Practice Center under Contract No. 290-2007-10021-I.) AHRQ Publication No. 12(13)-E021-EF. Rockville, MD: Agency for Healthcare Research and Quality. October 2012. www.effectivehealthcare.gov/reports/final.cfm.
For More Copies
For more copies of Screening and Diagnosing Gestational Diabetes Mellitus: Evidence Report/Technology Assessment Executive Summary No. 210 (AHRQ Pub. No. 12(13)-E021-1), please call the AHRQ Publications Clearinghouse at 1-800-358-9295 or email [email protected].

AHRQ Pub. No. 12(13)-E021-1 October 2012