Scrap Metal Qualified SWPPP Practioner (SM-QSP) · Pollution prevention control measures ......
36
Scrap Metal Qualified SWPPP Practioner (SM-QSP) program implementation
Transcript of Scrap Metal Qualified SWPPP Practioner (SM-QSP) · Pollution prevention control measures ......

Scrap Metal Qualified SWPPP Practioner
(SM-QSP)
program implementation

Who May Be a Scrap Metal Qualified SWPPP Practioner?
• Scrap Metal Qualified SWPPP Developer • Scrap Metal Qualified SWPPP Practitioner
2

Storm Water Pollution Prevention Plan Action Overview
• Ensure full implementation of the SWPPP • Visual observations • Sampling and analysis oversight • Evaluate and report on compliance
3
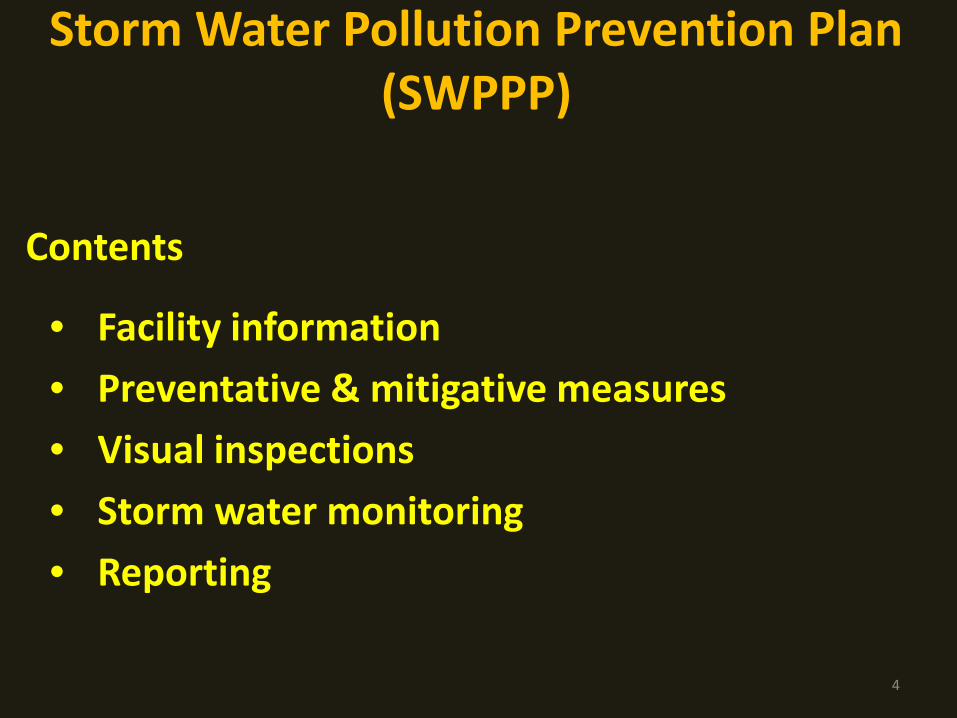
Storm Water Pollution Prevention Plan (SWPPP)
Contents
• Facility information • Preventative & mitigative measures • Visual inspections • Storm water monitoring • Reporting
4

Approved Signatory
Scrap Metal Qualified SWPPP Practioner • prepares documents for submittal in SMARTS Approved Signatory • certifies submittal
5
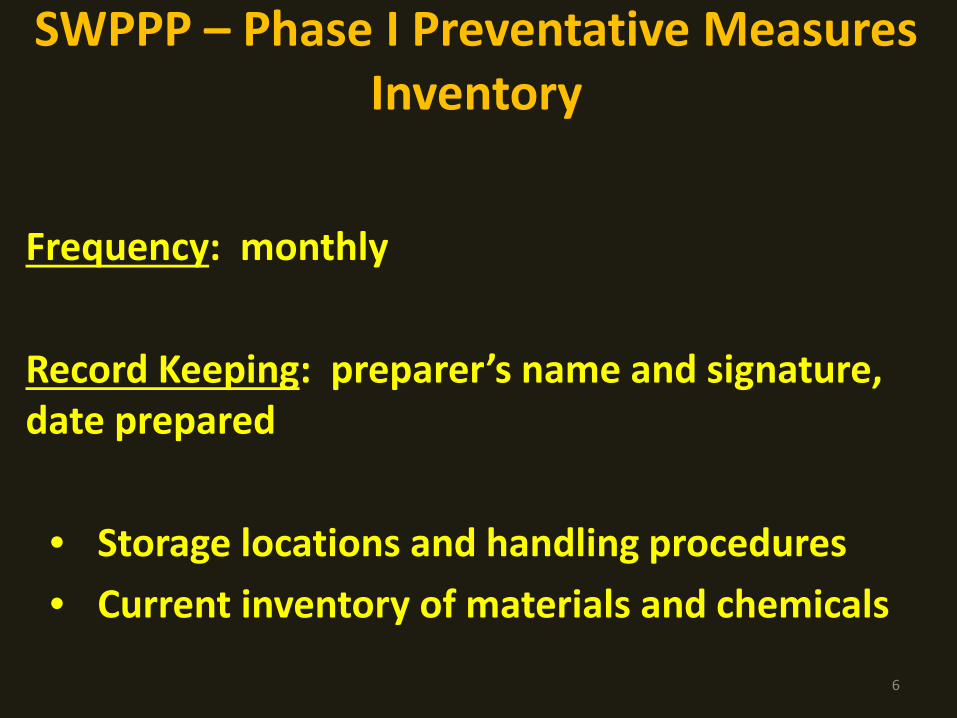
SWPPP – Phase I Preventative Measures Inventory
Frequency: monthly Record Keeping: preparer’s name and signature, date prepared
• Storage locations and handling procedures • Current inventory of materials and chemicals
6

SWPPP – Phase I Preventative Measures Employee Training
New Employees: within 30 days of employment All Employees: annually Record Keeping: document training topics, attendees, dates of training
• SWPPP implementation 7
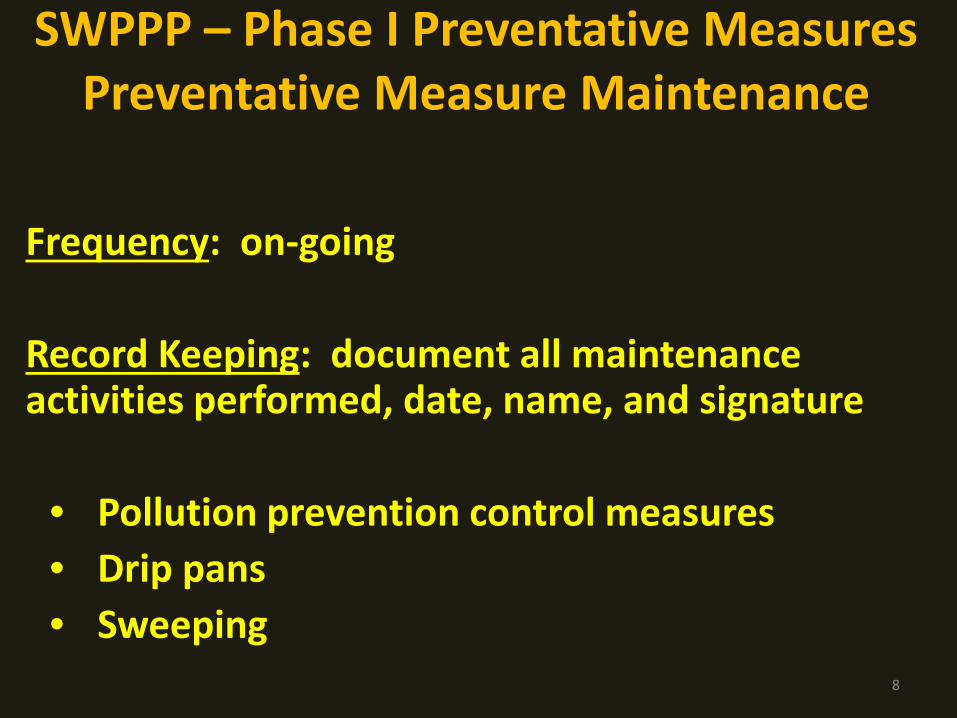
SWPPP – Phase I Preventative Measures Preventative Measure Maintenance
Frequency: on-going Record Keeping: document all maintenance activities performed, date, name, and signature
• Pollution prevention control measures • Drip pans • Sweeping
8
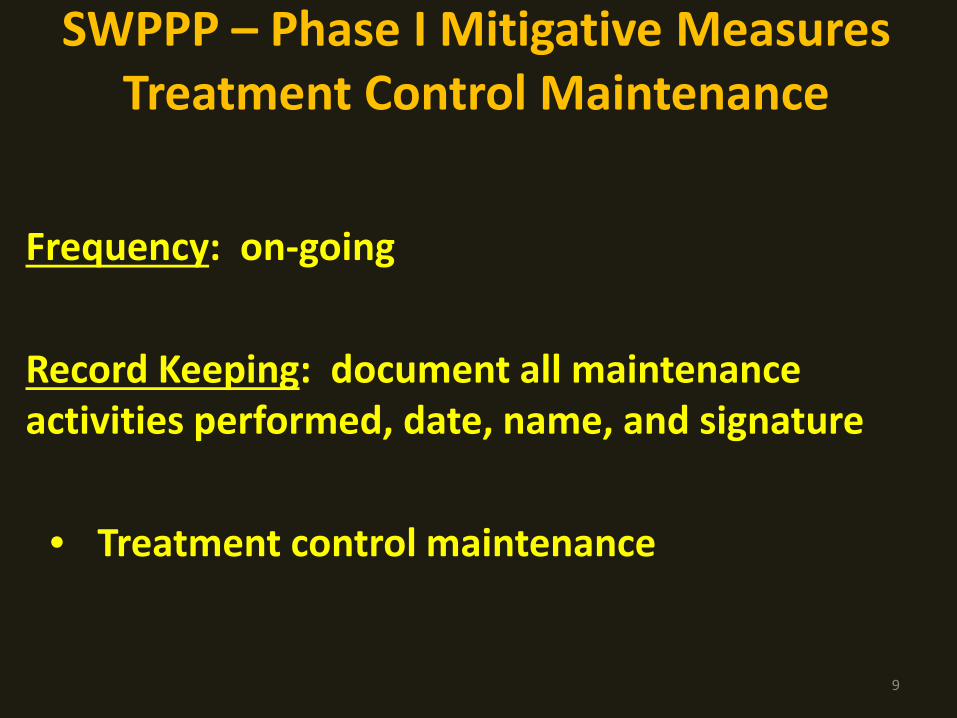
SWPPP – Phase I Mitigative Measures Treatment Control Maintenance
Frequency: on-going Record Keeping: document all maintenance activities performed, date, name, and signature
• Treatment control maintenance
9
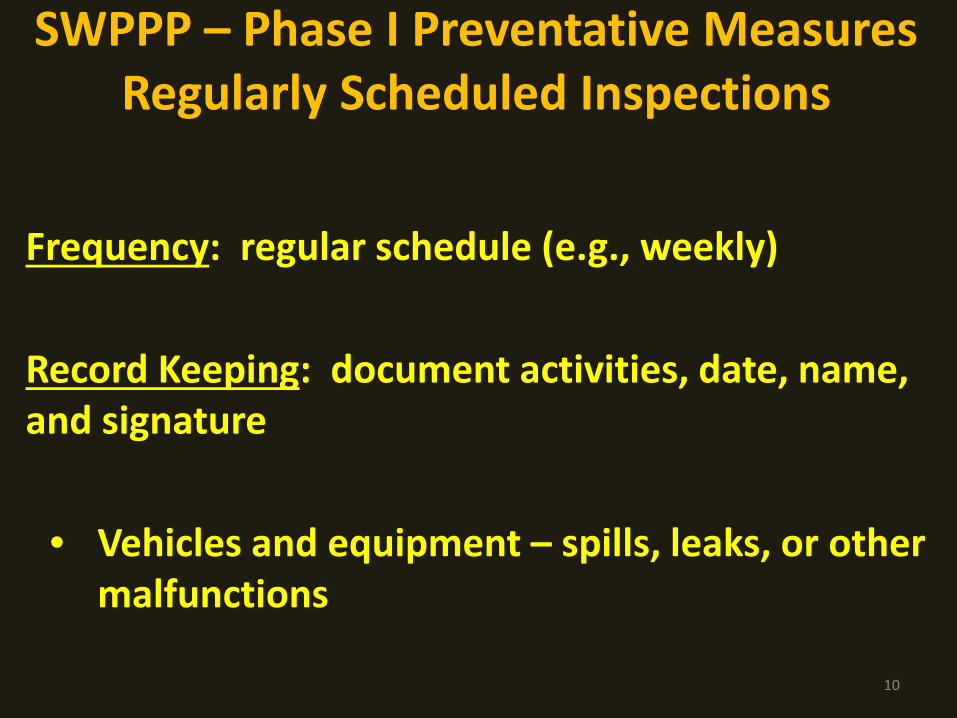
SWPPP – Phase I Preventative Measures Regularly Scheduled Inspections
Frequency: regular schedule (e.g., weekly) Record Keeping: document activities, date, name, and signature
• Vehicles and equipment – spills, leaks, or other malfunctions
10
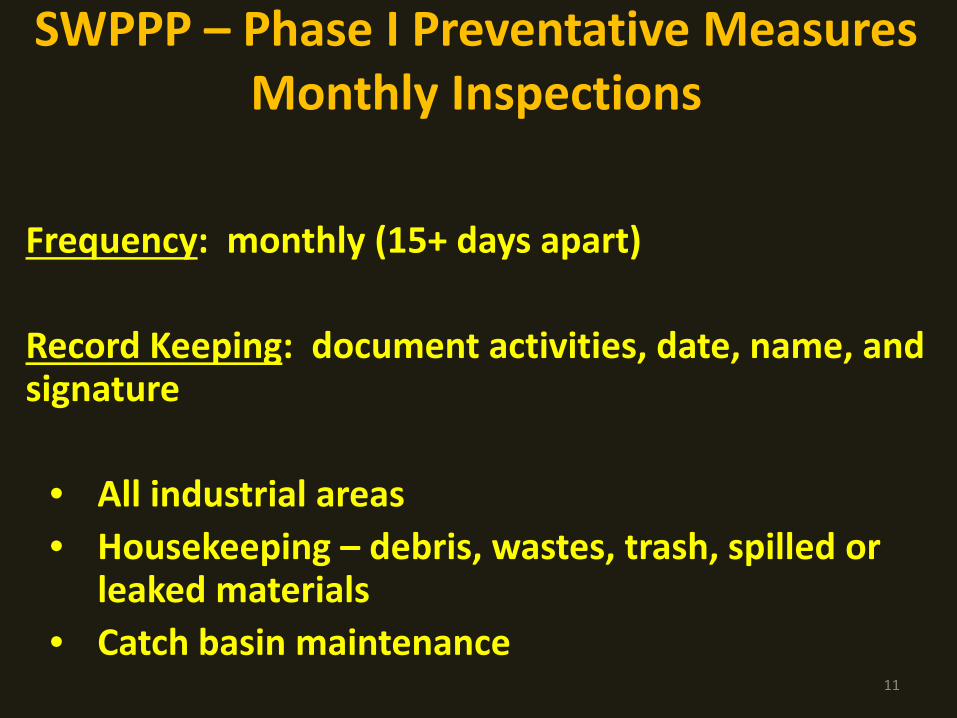
SWPPP – Phase I Preventative Measures Monthly Inspections
Frequency: monthly (15+ days apart) Record Keeping: document activities, date, name, and signature
• All industrial areas • Housekeeping – debris, wastes, trash, spilled or
leaked materials • Catch basin maintenance
11

SWPPP – Phase I Preventative Measures Rain Event Action Plan (REAP)
Frequency: 40% chance of rain National Weather Service (www.weather.gov)
Record Keeping: document all REAP activities
date and sign for each event
• Ensure all control measures are fully functional • Housekeeping (including sweeping) • Cover trash • Temporarily cover exposed material • Isolate industrial areas from contact with rainfall and runoff
12

13

Storm Event Visual Monitoring
Frequency: during storm events that produce discharge from the site ( ≥ 0.1” rainfall)
Record Keeping: date, weather conditions, findings, corrective actions implemented, SWPPP revisions required, and name of inspector
• Inspect all discharge points (oil sheen, turbidity, sediment, debris, trash, foam, and/or floatables)
14

SWPPP – Monitoring Sample & Analysis
Frequency: 4 qualifying storm event samples per year per discharge location Monthly, starting July 1st of each year
Who: Certified Person Record Keeping: upload to SMARTS Ad Hoc report within 30 days of receipt of sample analysis results
15

16
17
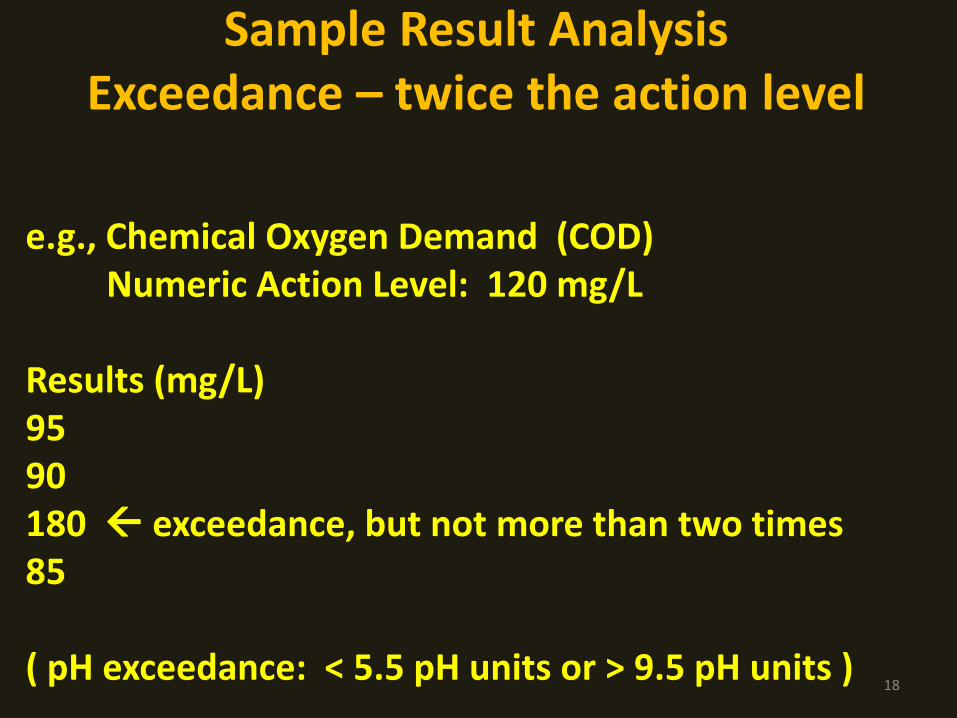
Sample Result Analysis Exceedance – twice the action level
e.g., Chemical Oxygen Demand (COD) Numeric Action Level: 120 mg/L Results (mg/L) 95 90 180 exceedance, but not more than two times 85 ( pH exceedance: < 5.5 pH units or > 9.5 pH units )
18
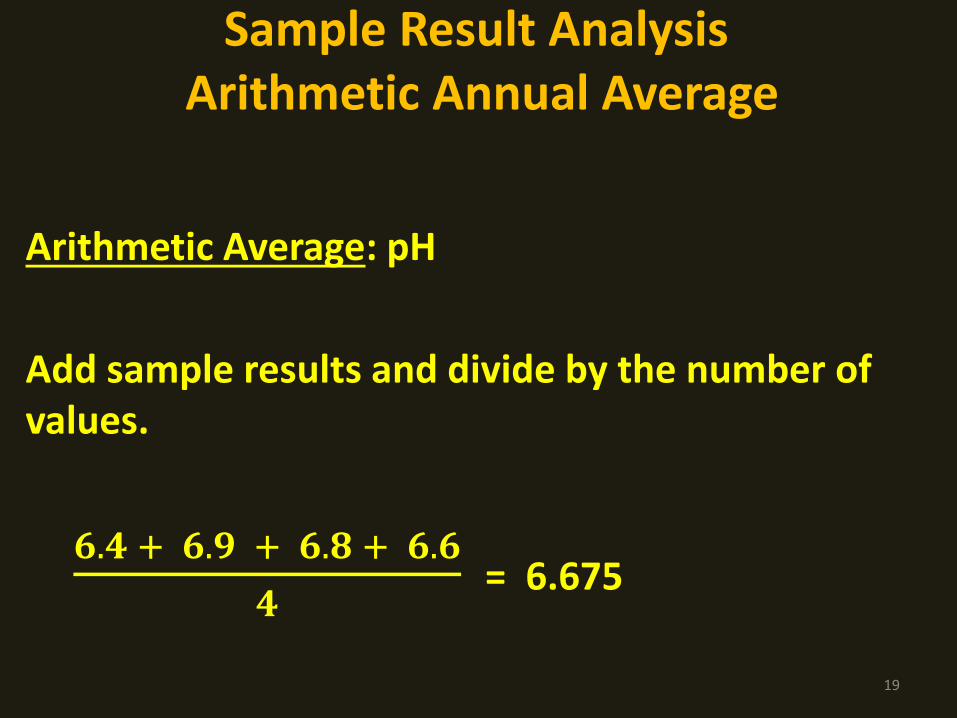
Sample Result Analysis Arithmetic Annual Average
Arithmetic Average: pH Add sample results and divide by the number of values. 𝟔.𝟒 + 𝟔.𝟗 + 𝟔.𝟖 + 𝟔.𝟔
𝟒 = 6.675
19

Sample Result Analysis Geometric Annual Average
Geometric Average: turbidity, specific conductance, oil & grease, chemical oxygen demand, aluminum, copper, iron, lead, zinc Multiply sample results and apply root of number of samples 𝟗𝟗 𝒙 𝟗𝟗 𝒙 𝟏𝟖𝟗 𝒙 𝟖𝟗𝟒 = 106.9 mg/L
( 𝟗𝟗 𝒙 𝟗𝟗 𝒙 𝟏𝟖𝟗 𝒙 𝟖𝟗 ) 𝟏𝟒 = 106.9 mg/L
20

21
(value 1 * value 2 * value 3 * value 4) 1 / number of values
(85 * 80 * 180 * 85) 1/4 = 130,815,000 1/4 = 106.95
22
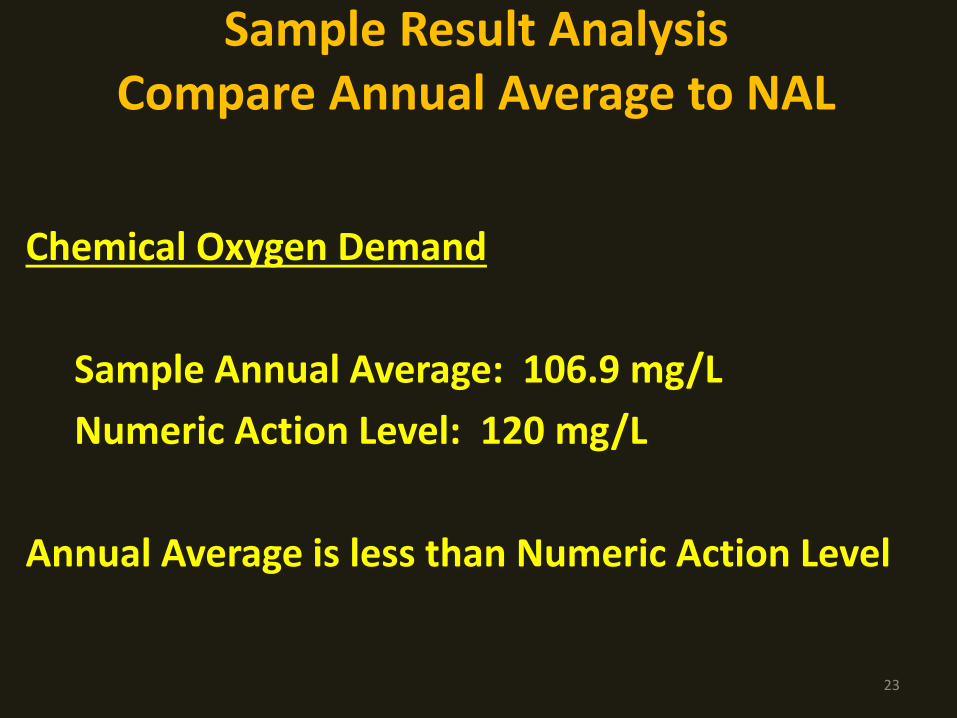
Sample Result Analysis Compare Annual Average to NAL
Chemical Oxygen Demand
Sample Annual Average: 106.9 mg/L Numeric Action Level: 120 mg/L
Annual Average is less than Numeric Action Level
23

Sample Result Analysis Area-Weighted Average
Discharge Point 1 Discharge Point 2 60% 40% 95 mg/L 103 mg/L 90 mg/L 117 mg/L 180 mg/L 98 mg/L 85 mg/L 106 mg/L Annual Average 106.9 mg/L 105.8 mg/L Annual Weighted Average 106.9 x 0.60 = 64.14 105.8 x 0.40 = 42.32 Combined Area-Weighted Annual Average: 64.14 + 42.32 = 106.46 mg/L Chemical Oxygen Demand – Numeric Action Level: 120 mg/L Area-Weighted Annual Average: 106.5 mg/L Area-Weighted Annual Average is less than Numeric Action Level 24

Sample Result Analysis Credit
Non-Polluting Coverage of Industrial Areas: 25%
Numeric Action Level: 120 mg/L Sample Annual Average: 106.9 mg/L Less 25%: 106.9 x 0.25 = 26.6 mg/L 106.9 x 0.75 = 80.2 mg/L
Annual Average less credit is less than Numeric Action Level
25

Compliance Option 1 Phase II
When: If Numeric Action levels are exceeded By June 30, 2013: Assess monitoring results to determine if Phase advancement triggers have been exceeded
By July 31, 2013: If so, reassess Phase I pollution control measures and consider additional measures
By August 15, 2013: Submit Corrective Action Plan to Regional Board for approval
26
Reporting Unauthorized Non-Storm Water Discharge
If discharge poses an immediate threat to: • human health • Environment
Provide notification to Regional Board within: • 24 hours • Oral or email
27

Reporting Annual Report
• August 1st: submit in SMARTS for preceeding July 1 to June 30 reporting year
• Includes monitoring data, any new pollution
control measures implemented, any additional treatment controls, and any corrective actions implemented to address any exceedances of water quality standards
28
Record Keeping
Retain copies of all records, paper or electronic: • for at least five years • from the date generated or date submitted to
the Regional Board • Regional Board may request records be retained
beyond five years
29

Monitoring Reductions
Visual Monitoring Frequency Reduction
Eliminate Storm Water Sample Constituent
Storm Water Sample Frequency Reduction
30

The frequency of visual monitoring may be decreased if:
1. No significant violations for 4 consecutive inspections
2. SM-QSP / Group Monitoring Leader certifies BMPs are fully implemented and site conditions do not warrant monthly inspections
3. Submit reduction request to Regional Board for approval
4. Conduct at least one inspection per reporting cycle during storm event that produces runoff
Monitoring Reductions Visual Monitoring Frequency Reduction
31
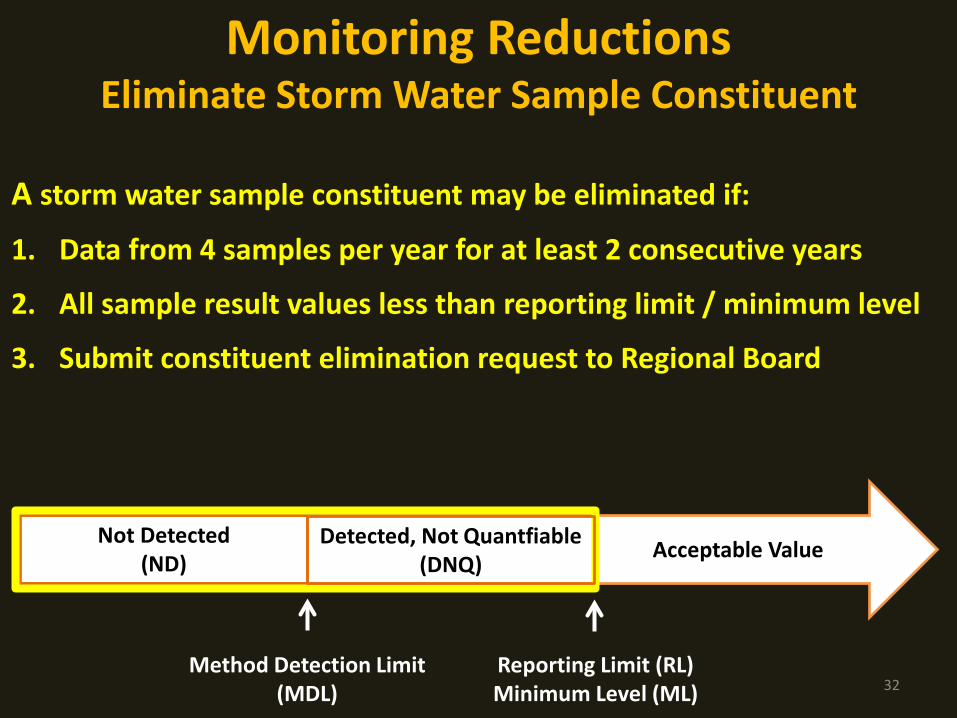
A storm water sample constituent may be eliminated if:
1. Data from 4 samples per year for at least 2 consecutive years
2. All sample result values less than reporting limit / minimum level
3. Submit constituent elimination request to Regional Board
Monitoring Reductions Eliminate Storm Water Sample Constituent
Acceptable Value
Method Detection Limit (MDL)
Reporting Limit (RL) Minimum Level (ML)
Not Detected (ND)
32
Detected, Not Quantfiable (DNQ)
The frequency of storm water sampling may be decreased if: 1. Less than Numeric Action Level (NAL) for 2 consecutive
years
2. Reliability of treatment systems certified
3. Submit reduction request to Regional Board for approval
Monitoring Reductions Storm Water Sample Frequency Reduction
33

If no industrial activity is exposed to storm water, submit: • No Exposure Certification • Analytical results of runoff from each discharge point of
the facility for two storm events (Table 1A Numeric Action levels for Option 1 constituents)
June 30th: Renew No Exposure Certification by June 30th of each year.
No Exposure Certification
34

Complete Notice of Termination when:
• All industrial activities have ceased, and the facility no longer poses a threat to water quality
• No water flows from the facility to storm water systems or surface waters
• Change in ownership
• Change in location of facility
• Obtain individual permit coverage
Notice of Termination
35

Mary Bartholomew Coastal Stormwater Unit
(Orange County) 951-321-4586
Keith Elliott Inland Stormwater Unit
(Riverside & San Bernardino Counties) 951-782-4925