
Scottish Urban Air Quality Steering Group - Modelling & Monitoring Workshop - Joost Wesseling
56
MODELS AND MONITORING NSL SEPA | December 2014 1
-
Upload
stepscotland -
Category
Environment
-
view
94 -
download
1
Transcript of Scottish Urban Air Quality Steering Group - Modelling & Monitoring Workshop - Joost Wesseling
MODELS AND MONITORING NSL
SEPA | December 2014 1

Contents
●Air Quality models in the Netherlands ●Monitoring of the NSL ●Monitoring Tool ●Exceedances ●Uncertainties ●Air Quality presently in the NL
SEPA | December 2014 2
AIR QUALITY MODELS
SEPA | December 2014 3

Standard Calculation Models Air Quality (SRM) ● Dutch law provides 3 Standard Calculation Models Air Quality (SRM)
– SRM-1 for streets / street canyons in an urban environment – SRM-2 along highways and larger other roads – SRM-3 near industrial facilities
● These models are described in detail in several documents.
● Other models are allowed if they are comparable to the SRM’s or if
they can be applied to other situations than the SRM’s.
● Wind tunnel experiments are also allowed, provided a specific protocol is followed.
● The RIVM advises the minister of Infrastructure and the Environment on model approval.
SEPA | December 2014 4

Netherlands: traffic and livestock important ● For traffic the local authorities must provide
– The exact location and height of the main roads – Numbers of light, medium-heavy, heavy vehicles and busses – Average speed and appropriate emission class – Average congestion and appropriate emission class – Location and shape of sound barriers
● For livestock the local authorities must provide – numbers of animals – Type of housing – Exact location
● For traffic and livestock the emission factors are provided by the Dutch government.
SEPA | December 2014 5

Model system
Background (double counting)
+ Local streets SRM1
+ Highways SRM2
+ Industry / livestock SRM3
SEPA | December 2014 6
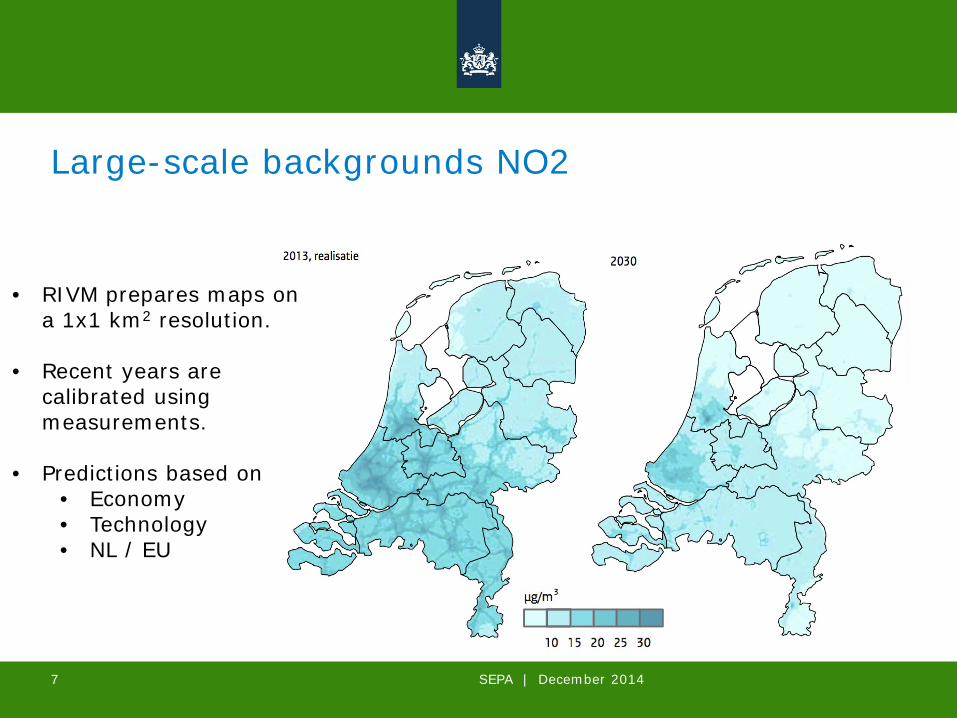
Large-scale backgrounds NO2
• RIVM prepares maps on a 1x1 km2 resolution.
• Recent years are calibrated using measurements.
• Predictions based on • Economy • Technology • NL / EU
SEPA | December 2014 7

Large-scale backgrounds PM10
SEPA | December 2014 8

Model system Simple empirical model, derived from wind tunnel, calibrated using field measurements
Background (double counting)
+ Local streets SRM1
+ Highways SRM2
+ Industry / livestock SRM3
SEPA | December 2014 9
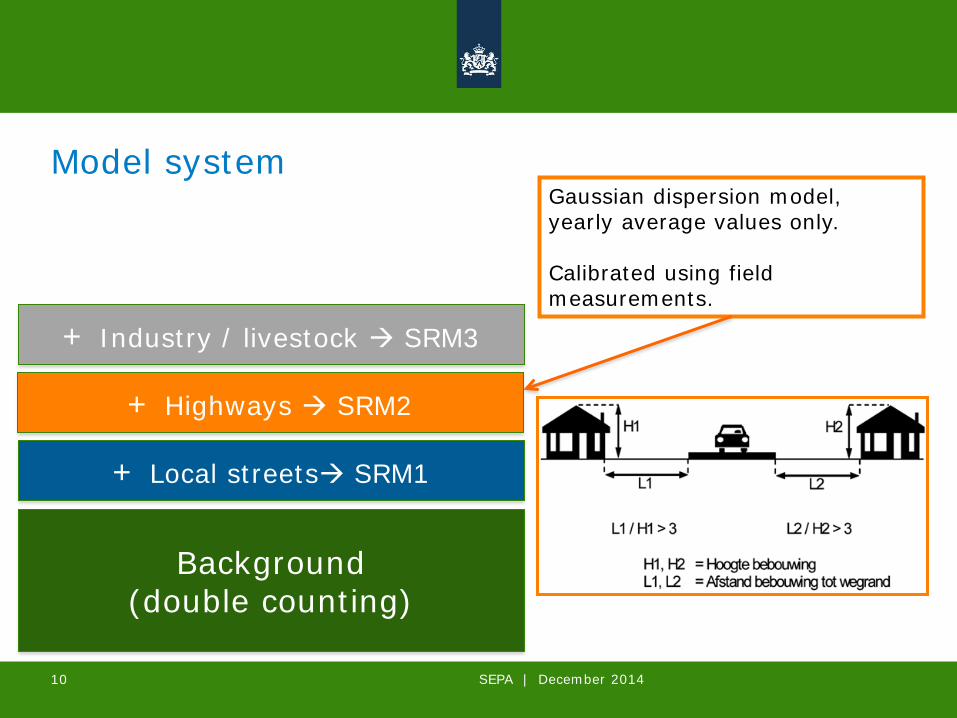
Model system Gaussian dispersion model, yearly average values only. Calibrated using field measurements.
Background (double counting)
+ Local streets SRM1
+ Highways SRM2
+ Industry / livestock SRM3
SEPA | December 2014 10
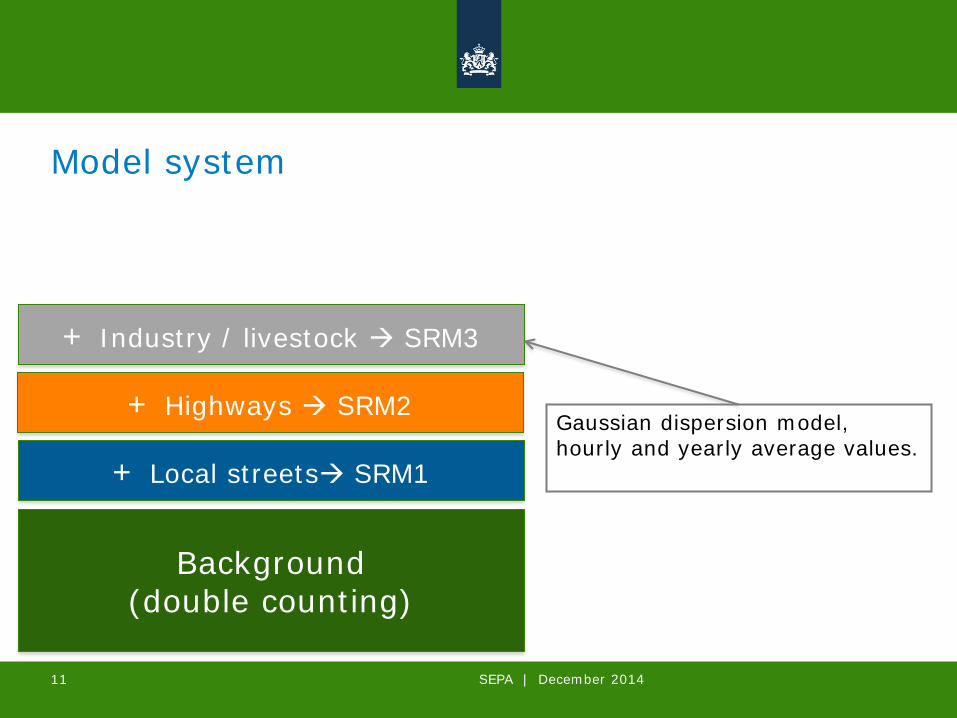
Model system
Gaussian dispersion model, hourly and yearly average values.
Background (double counting)
+ Local streets SRM1
+ Highways SRM2
+ Industry / livestock SRM3
SEPA | December 2014 11

NO2, data 2010 - 2013
Extensive model validation, mainly for NO2, some NOx, PM10
SEPA | December 2014 12
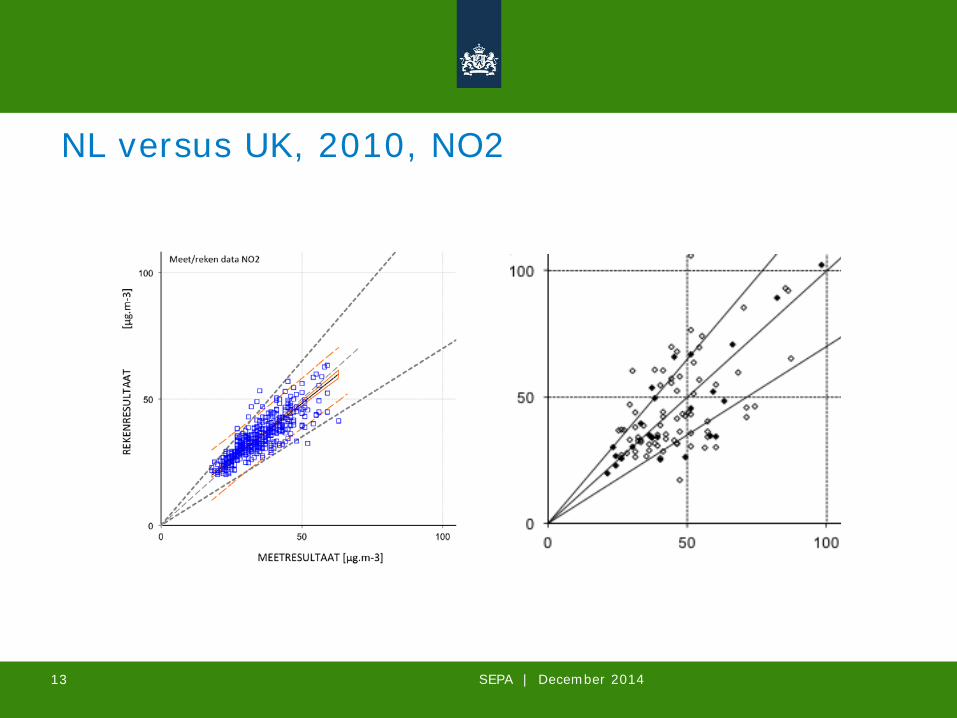
NL versus UK, 2010, NO2
SEPA | December 2014 13

MONITORING NSL
14 SEPA | December 2014
15
Monitoring NSL ● All emissions, background calculations, local model results,
corrections etc are combined in the yearly Monitoring report of the NSL.
● The report is send to the Dutch parliament around December of each year.
● There is a lot of public interest.
● RIVM tries to provide the inputs and results in a transparant way.
● Some of the input is checked and commented.
15 SEPA | December 2014 15
16
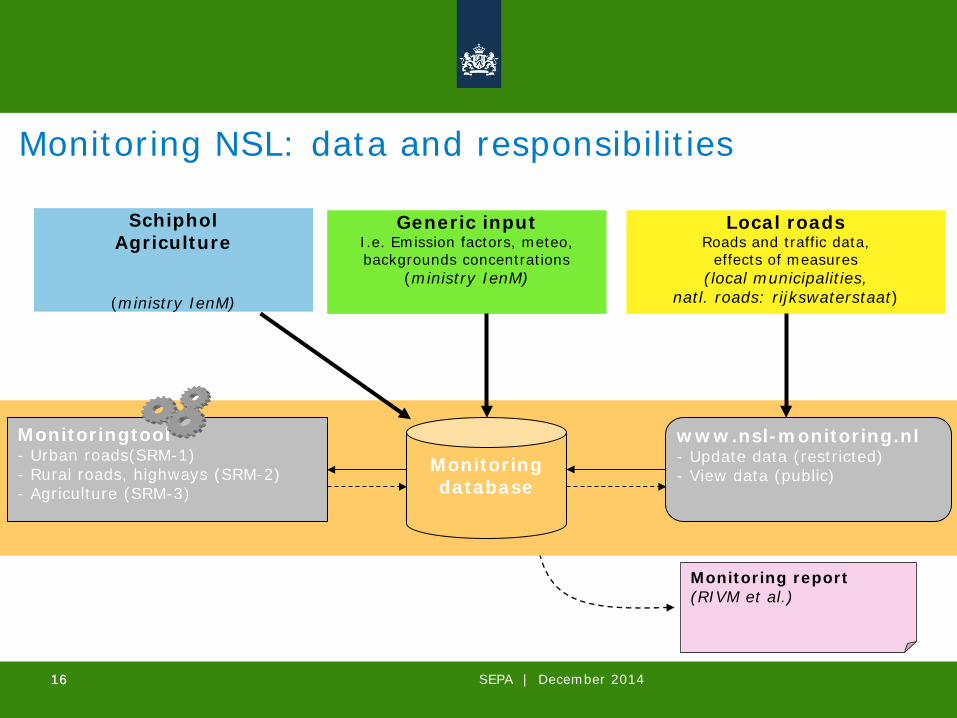
Monitoring NSL: data and responsibilities
Monitoring report (RIVM et al.)
Monitoring database
www.nsl-monitoring.nl - Update data (restricted) - View data (public)
Monitoringtool - Urban roads(SRM-1) - Rural roads, highways (SRM-2) - Agriculture (SRM-3)
Generic input I.e. Emission factors, meteo, backgrounds concentrations
(ministry IenM)
Local roads Roads and traffic data,
effects of measures (local municipalities,
natl. roads: rijkswaterstaat)
Schiphol Agriculture
(ministry IenM)
16 SEPA | December 2014

17
Quality of the monitoring ● Critical review (Wesseling en Beijk, 2010): system with great
potential but also some issues:
– Quality of input data and effects of measures: limited quality control and documentation (in 2010).
– Actualization process: focus on limit values, quite a number of errors.
– Large uncertainties: focus on limit values, without a margin for uncertainties leads to a predictable number of ‘hidden’ exceedances.
– Completeness: only the larger projects are included in the NSL monitoring.
– Health: there was not enough focus on health effects (in 2010).
17 SEPA | December 2014

SEPA | December 2014 19
SEPA | December 2014 20
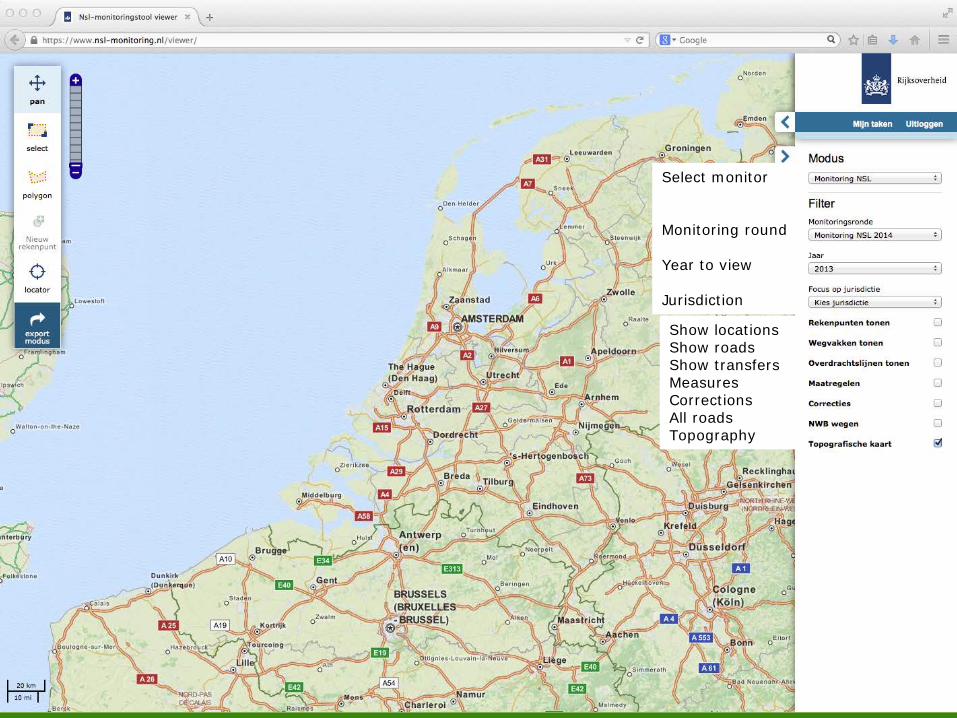
Show locations Show roads Show transfers Measures Corrections All roads Topography
Select monitor Monitoring round Year to view Jurisdiction

SEPA | December 2014 21

SEPA | December 2014 22
Amsterdam
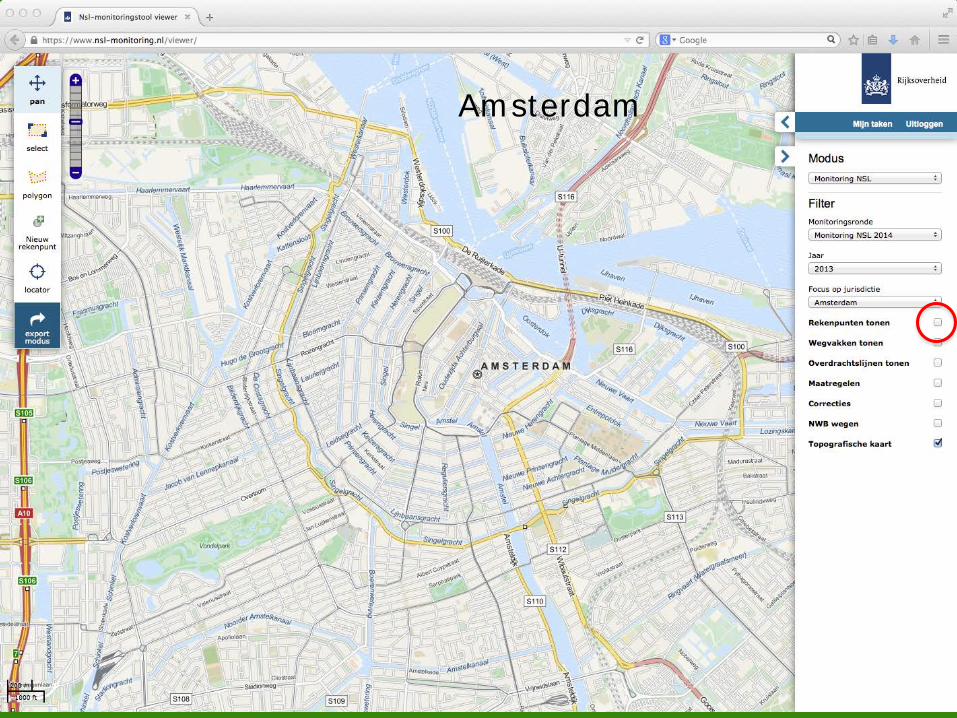
SEPA | December 2014 23
Amsterdam

SEPA | December 2014 24
Concentrations, NO2, 2013

SEPA | December 2014 25
Intensities traffic, 2013
SEPA | December 2014 26
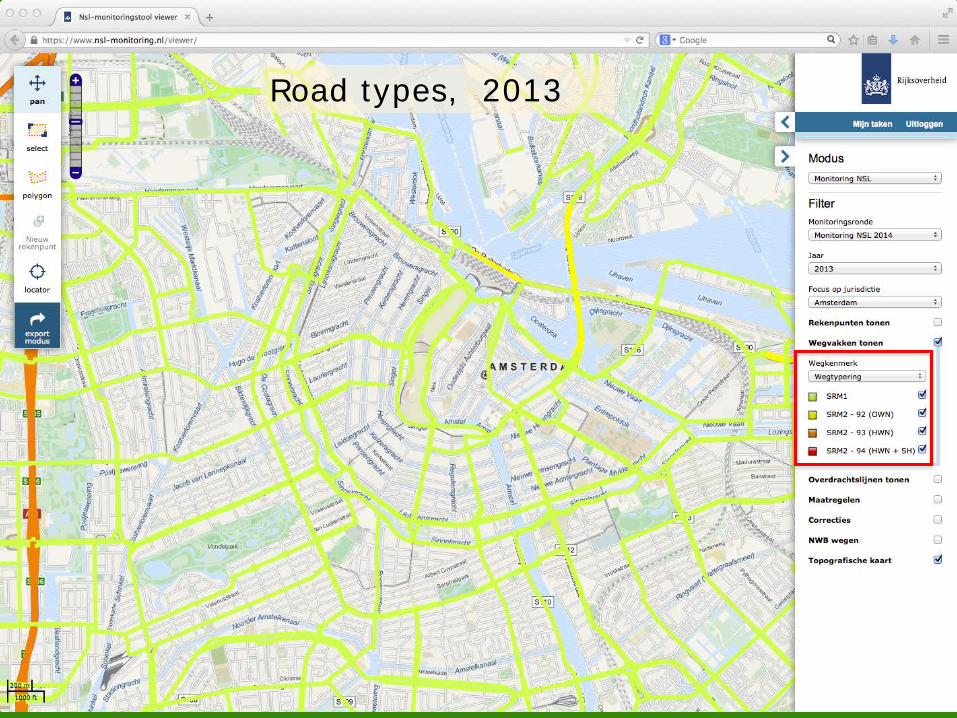
Road types, 2013

SEPA | December 2014 27
Speed type, 2013

SEPA | December 2014 28
Congestion, 2013

SEPA | December 2014 29
Calculation transfer, 2013
SEPA | December 2014 30
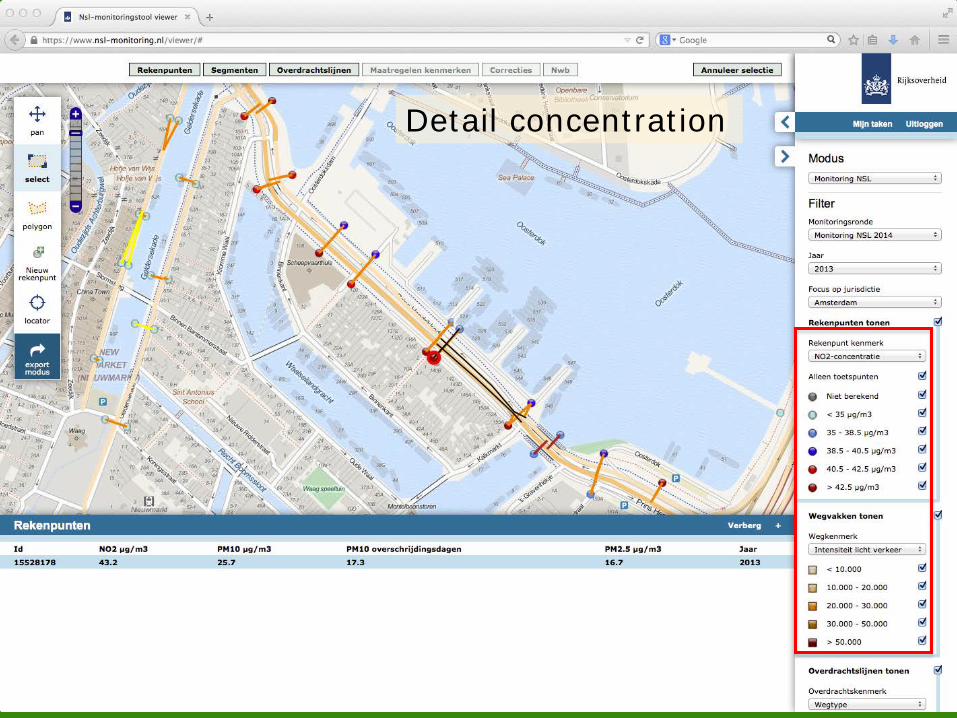
Detail concentration
SEPA | December 2014 31
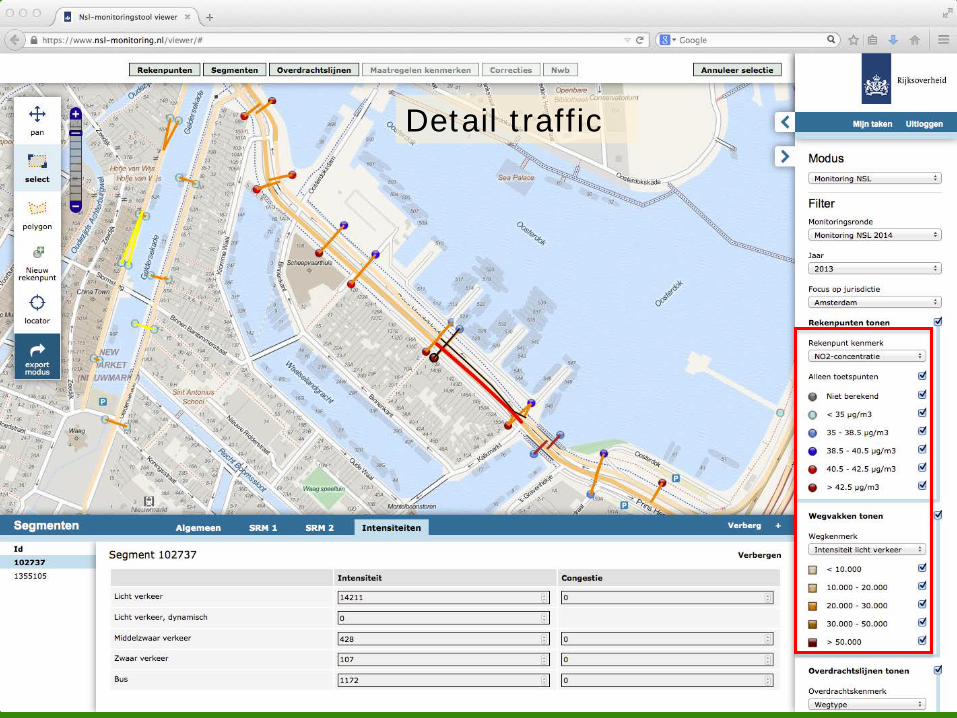
Detail traffic

SEPA | December 2014 32
Detail transfer
SEPA | December 2014 33
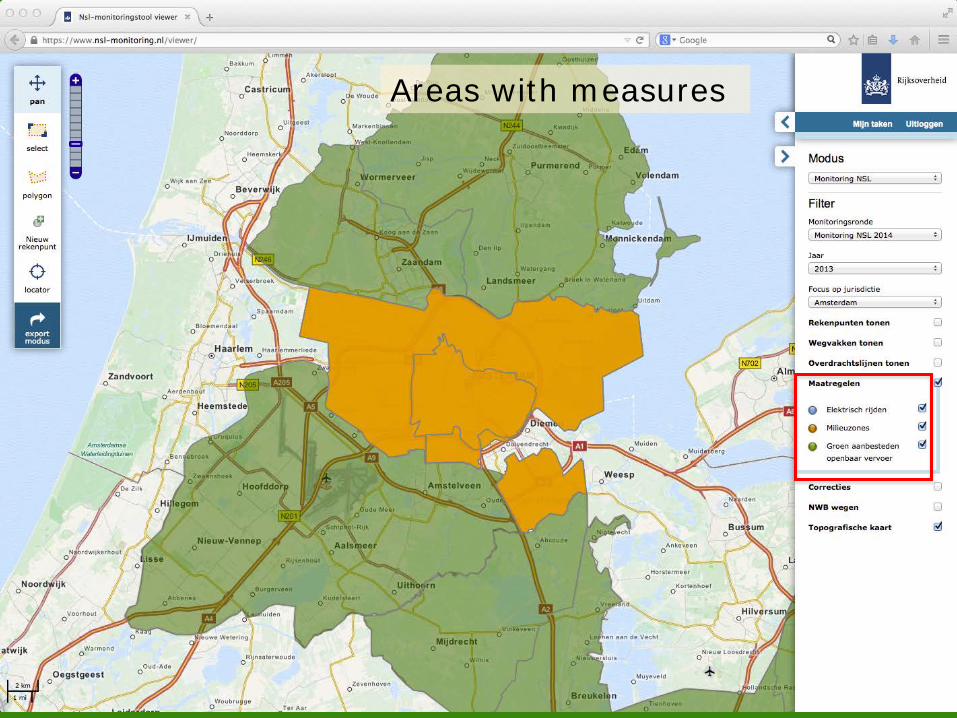
Areas with measures

SEPA | December 2014 34
Areas with measures

SEPA | December 2014 35
Areas with measures

EXCEEDANCES 2015
SEPA | December 2014 36

SEPA | December 2014 37
Amsterdam, NO2, 2013

SEPA | December 2014 38
Amsterdam, NO2, 2015

SEPA | December 2014 39
Rotterdam, NO2, 2013
SEPA | December 2014 40
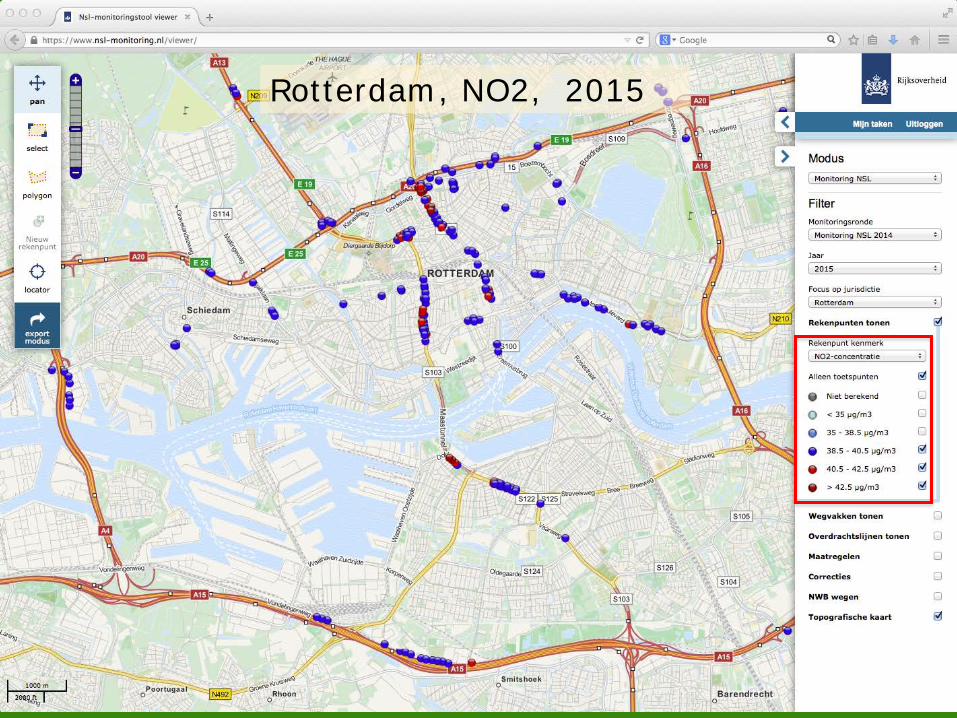
Rotterdam, NO2, 2015

SEPA | December 2014 41
Rotterdam, NO2, 2020
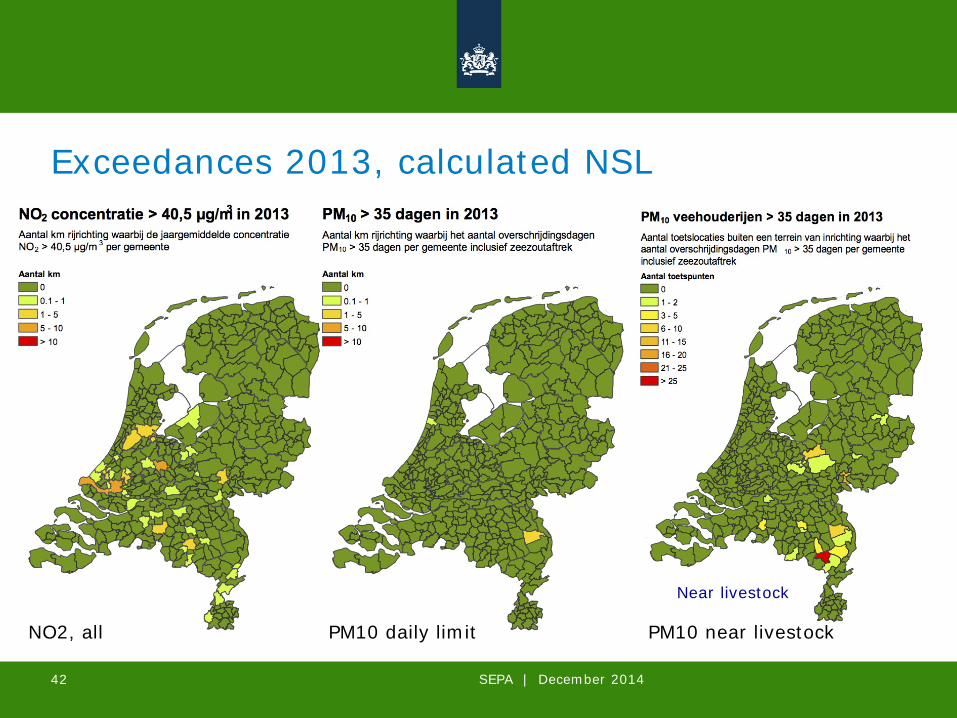
Exceedances 2013, calculated NSL
SEPA | December 2014 42
Near livestock
NO2, all PM10 daily limit PM10 near livestock

Exceedances 2015, calculated NSL
SEPA | December 2014 43
NO2, all PM10 daily limit

UNCERTAINTIES
SEPA | December 2014 44

The effects of uncertainties ● All calculations and measurements are uncertain.
● The results of calculations for the NSL are subject
to different types of uncertainties. – Systematic: are the general basis assumptions regarding
back grounds and emission factors correct?
– Random: every concentration is calculated using many assumption. On average the assumptions will be correct but for a specific individual location the assumption may not be correct.
SEPA | December 2014 45

Effect systematic uncertainties NSL
• Predictions for the
future have an uncertainty of 20-30%
• In the Netherlands many concentrations are just below limit values.
• Small changes in de predictions can have a significant effect of the number of exceedances. Variation emission factors
Var
iatio
n ba
ckgr
ound
s
Expected NO2 exceedances in 2015
Expe
cted
NO
2 ex
ceed
ance
s in
201
5
SEPA | December 2014 46

Effect random uncertainties NSL
Highest concentrations, sorted
Expected NO2 in 2015 Limit value (40.5)
NO
2 c
once
ntr
atio
n [
ug
/m3
]
SEPA | December 2014 47

Effect random uncertainties NSL
Expected NO2 in 2015 Limit value (40.5)
NO
2 c
once
ntr
atio
n [
ug
/m3
]
SEPA | December 2014 48

Effect random uncertainties NSL
Expected NO2 in 2015 Limit value (40.5)
NO
2 c
once
ntr
atio
n [
ug
/m3
]
Was exceedance Not any more
Turns out to be an exceedance
SEPA | December 2014 49

AIR QUALITY NOW
SEPA | December 2014 50

SEPA | December 2014 51
National network NO2, trend
Rural urban street

SEPA | December 2014 52
Rural urban street
National network PM10, trend

SEPA | December 2014 53
National network PM2.5, trend
Rural urban street
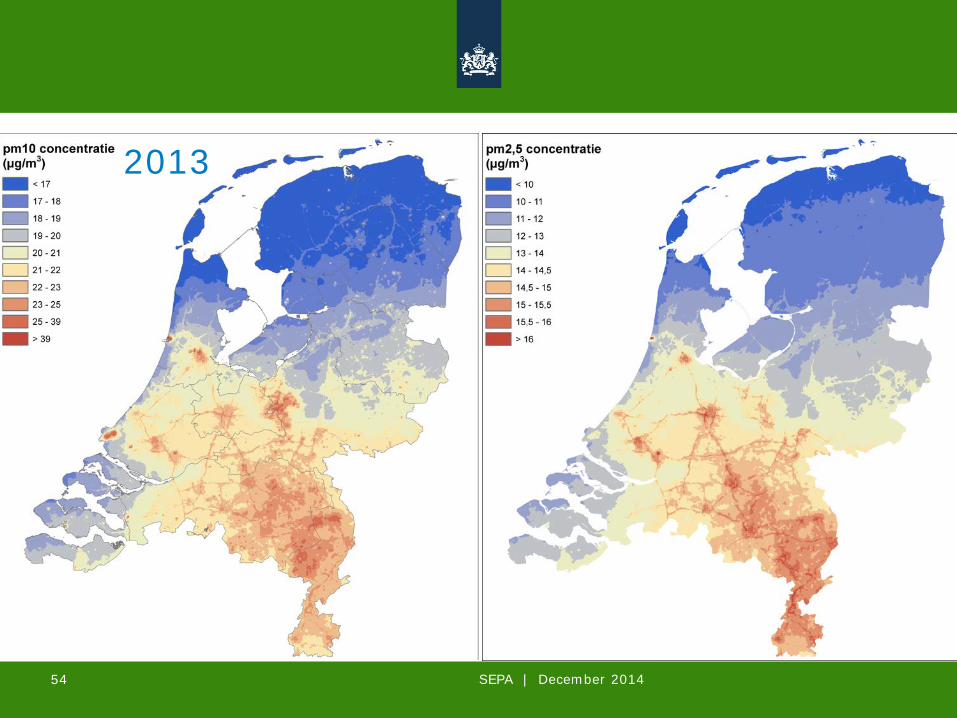
2013
SEPA | December 2014 54
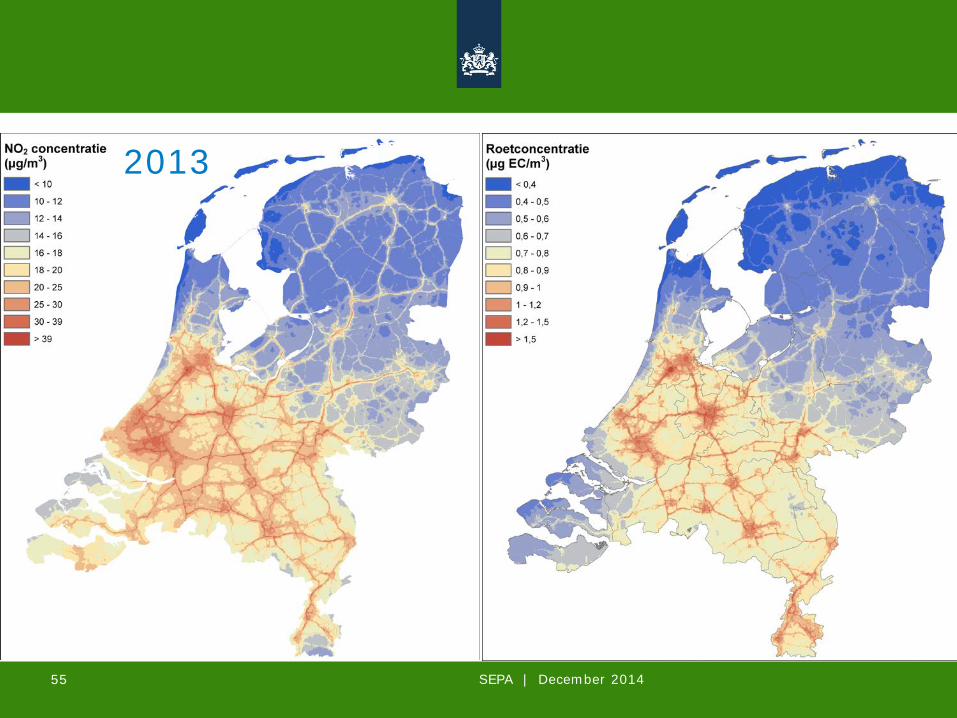
2013
SEPA | December 2014 55

56 56 SEPA | December 2014 56