Scottish Sanitary Survey Project - cefas.co.uk
48
Scottish Sanitary Survey Project Restricted Sanitary Survey Report Oitir Mhor Bay AB 419 February 2009 Oitir Mhor Restricted Survey Report Final 17/12/09
Transcript of Scottish Sanitary Survey Project - cefas.co.uk
Scottish Sanitary Survey Project
Restricted Sanitary Survey Report Oitir Mhor Bay AB 419 February 2009
Oitir Mhor Restricted Survey Report Final 17/12/09

i
Report Distribution – Oitir Mhor Bay
Name Agency
Linda Galbraith Scottish Government
Judith White Scottish Government
Ewan Gillespie SEPA
Douglas Sinclair SEPA
Stephan Walker Scottish Water
Alex Adrian Crown Estate
Andy MacLeod Argyll & Bute Council
Christine McLachlan Argyll & Bute Council
Scott Glen Harvester
Oitir Mhor Restricted Survey Report Final 17/12/09
ii
Table of Contents 1. Area Overview ................................................................................................. 1
1.1 Land Cover .............................................................................................. 2 1.2 Human Population .................................................................................. 2
2. Fishery ............................................................................................................. 4 3. Sewage Discharges......................................................................................... 5 4. Animals ............................................................................................................ 8
4.1 Livestock ................................................................................................. 8 4.2 Wildlife..................................................................................................... 8
5. Rainfall........................................................................................................... 10 5.1 Rainfall at Lismore Frackersaig Farm................................................. 10
6. River Flow...................................................................................................... 12 7. Historical E. coli Monitoring Data .................................................................. 14
7.1 Validation .............................................................................................. 14 7.2 Summary of sampling and results ...................................................... 14 7.3 Temporal pattern of results ................................................................. 15 7.4 Geographical pattern of results .......................................................... 16
8. Bathymetry and Hydrodynamics .................................................................... 18 8.1 Tidal curve and description ................................................................. 19 8.2 Currents................................................................................................. 20 8.3 Conclusions regarding effect on impacting sources ........................ 21
9. Shoreline Survey Overview............................................................................ 22 10. Overall Assessment ................................................................................... 24 11. Recommendations ..................................................................................... 27 12. References................................................................................................. 29 Appendices ........................................................................................................... 31 1. Summary Sampling Plan 2. Shoreline Survey Report © Crown Copyright 2008. Food Standards Agency Scotland and Cefas. All rights reserved.
Oitir Mhor Restricted Survey Report Final 17/12/09
1
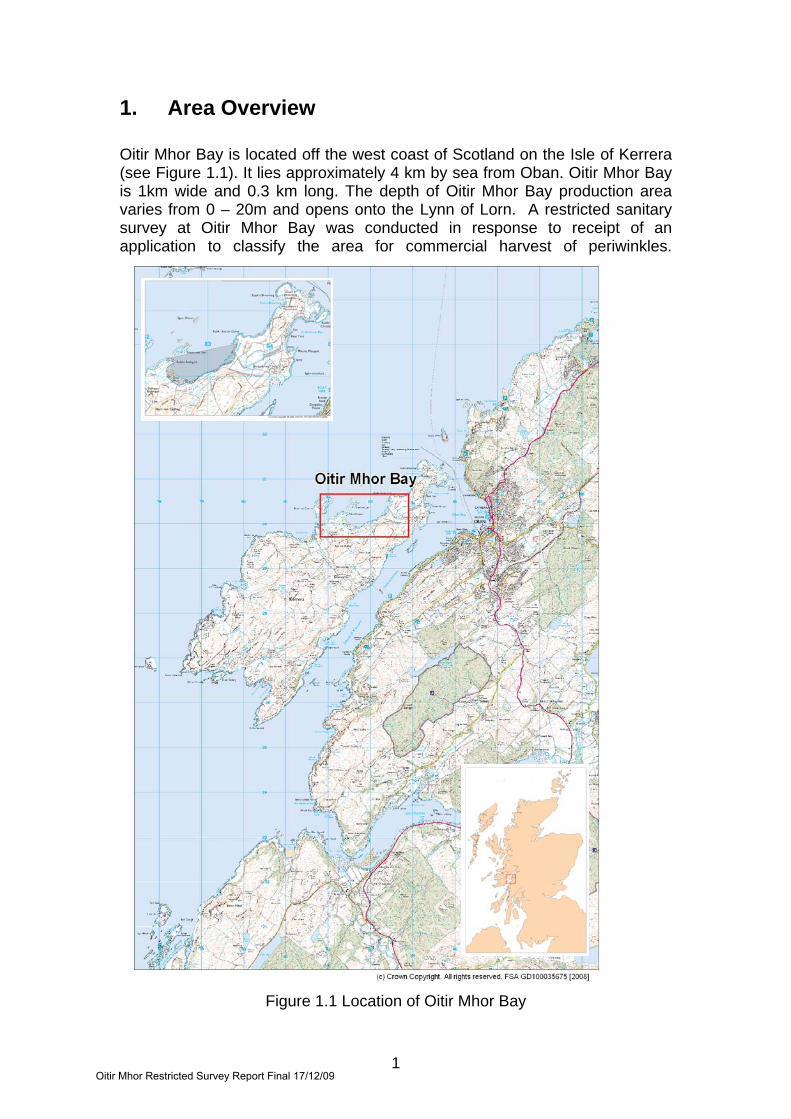
1. Area Overview Oitir Mhor Bay is located off the west coast of Scotland on the Isle of Kerrera (see Figure 1.1). It lies approximately 4 km by sea from Oban. Oitir Mhor Bay is 1km wide and 0.3 km long. The depth of Oitir Mhor Bay production area varies from 0 – 20m and opens onto the Lynn of Lorn. A restricted sanitary survey at Oitir Mhor Bay was conducted in response to receipt of an application to classify the area for commercial harvest of periwinkles.
Figure 1.1 Location of Oitir Mhor Bay
Oitir Mhor Restricted Survey Report Final 17/12/09
2
1.1 Land Cover The land cover on the surrounding coastline of the shellfish bed is predominantly natural and improved grassland with some patches of heath. There is only a small area of improved grassland on the eastern end of Oitir Mhor Bay and mostly natural grassland on the western end. Heath is found all around the bay further inland. Faecal coliform contributions from improved grassland have been shown to be approximately 8.3 x 10⁸ cfu km-2 hr-1 (Kay et al, 2008). The contributions to the contamination if shellfish from all land cover types would be expected to increase significantly after marked rainfall events. This increase would be highest, at more than 100-fold, for improved grassland. Areas of improved grassland near the fishery would be expected to contribute the most to contamination levels carried in surface runoff to the eastern end of the periwinkle bed.
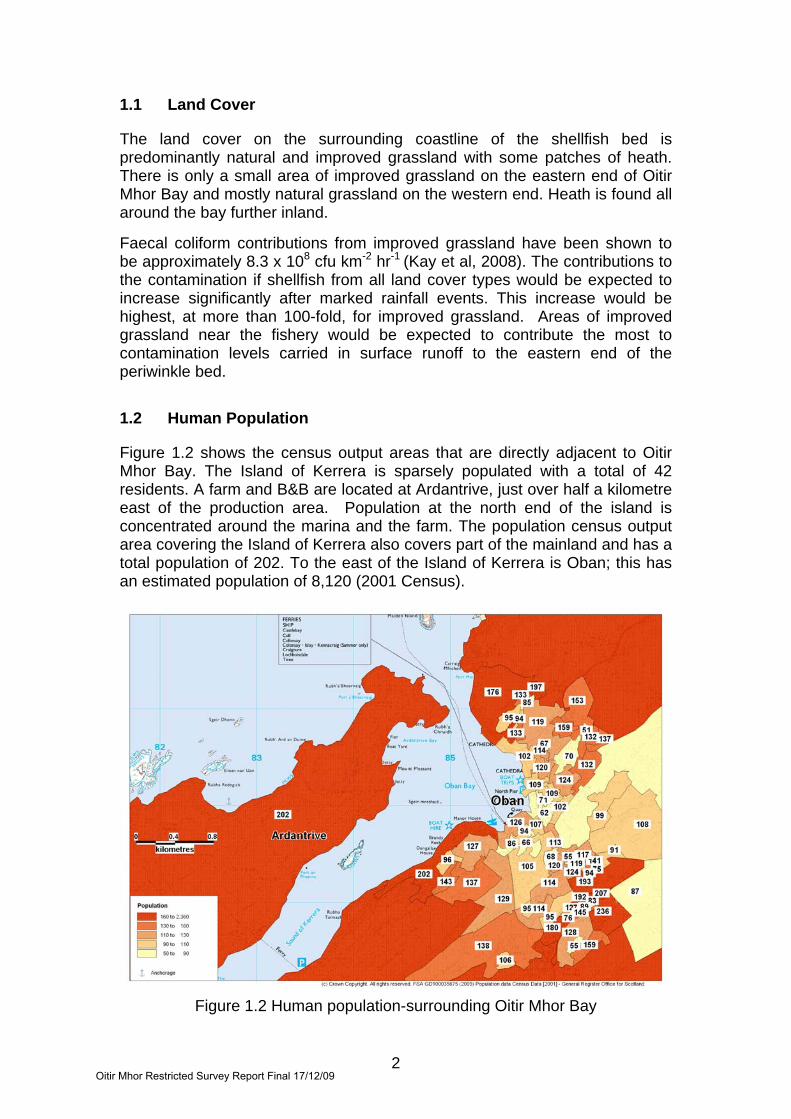
1.2 Human Population Figure 1.2 shows the census output areas that are directly adjacent to Oitir Mhor Bay. The Island of Kerrera is sparsely populated with a total of 42 residents. A farm and B&B are located at Ardantrive, just over half a kilometre east of the production area. Population at the north end of the island is concentrated around the marina and the farm. The population census output area covering the Island of Kerrera also covers part of the mainland and has a total population of 202. To the east of the Island of Kerrera is Oban; this has an estimated population of 8,120 (2001 Census).
Figure 1.2 Human population-surrounding Oitir Mhor Bay
Oitir Mhor Restricted Survey Report Final 17/12/09

3
The Oban yacht marina is located on the northeast side of the island in Ardentrive Bay. It has 75 pontoon berths and 30 moorings, a boatyard, a bar and grill and is served by frequent ferry from Oban. There are yacht anchorages identified in Oitir Mhor Bay and the adjacent Charlotte Bay (Clyde Cruising Club, 2007). Tourism to the island is significant, with frequent ferries from Oban bringing day visitors as well as tourists planning to stay on the island. There is some overnight accomodation at a small number of B&Bs and and hostels. The nearest accomodation to the fishery is the hostel at Ardentrive Farm. Oitir Mhor Bay does not have a significant population, with only one house located immediately adjacent the bay, near the middle of the identified stretch of shoreline with periwinkles. The greatest impact from human population is likely to be that of visitors on yachts using the anchorage in the western end of the bay and this is most likely to occur during the summer. Overall, human impact to the area would be expected to be highest near the main body of the periwinkle bed, at the western end of the bay.
Oitir Mhor Restricted Survey Report Final 17/12/09

4
2. Fishery This survey is being undertaken for classification of a wild periwinkle (Littorina littorea) bed within the Oitir Mhor Bay (AB 419 823 14) production area. The current production area boundaries are given as the area bounded by lines drawn between NM 8236 3028 and NM 8348 3050 extending to MHWS. There is an RMP for Pacific Oysters, which are also harvested in the area, located at NM 825 300. The area lies within a designated Shellfish Growing Water. The periwinkles are found in the rocky intertidal zone along the shoreline of the bay. The harvester collects his stock from the western end at Oitir Mhor (see Figure 2.1). The periwinkles are hand gathered by the harvester all year round.
Figure 2.1 Oitir Mhor Bay periwinkle bed
Oitir Mhor Restricted Survey Report Final 17/12/09

5
3. Sewage Discharges Scottish Water identified several community septic tanks and sewage discharges for the area surrounding Oitir Mhor Bay. They are detailed in Table 3.1 and mapped in Figure 3.1. No sanitary or microbiological data were available for these discharges. Table 3.1 Discharges identified by Scottish Water
Discharge Name NGR of discharge
Discharge Type
Level of Treatment
Consented flow
m3/day Consented/design pop
Oban STW NM 8490 3060 Continuous Secondary 4958 26600 Oban George Street
CSO NM 8581 2998 Intermittent 10mm screening 4998 22200
Oban Corran Parks WWPS NM 849 306 Intermittent 6mm
screening 4998 22200
Ganavan WWPS (EO only) NM 8592 3259 Intermittent 10mm
screening not stated not stated
Oban Burnbank Crescent CSO NM 8585 3062 Intermittent 6mm
screening 605 not stated
Oban Alma Crescent CSO NM 8555 2972 Intermittent 15mm
screening 173 not stated
Oban Soroba Road CSO NM 8606 2930 Intermittent 15mm
screening 1037 not stated
SEPA provided information regarding a number of discharge consents held for the area of Oitir Mhor Bay. These are listed in Table 3.1 and mapped in Figure 3.1. At the time of writing this report, full details of some discharge consents were not available. Only one of these is located on the island of Kererra and none of these discharge directly to Oitir Mhor Bay. Table 3.2 SEPA discharge consents
Ref No. NGR of discharge Discharge Type PE Discharge Vol
m3 per day WPC-W-12057 NM 857 325 Treated - - WPC-W-30700 NM 8594 3231 Domestic 7 - WPC-W-22466 NM 8585 3062 Oban Burnbank Crescent CSO - 605 WPC-W-20816 NM 8585 3062 Oban Corran Parks WWPS 22200 4998 WPC-W-20817 NM 8581 2998 Oban George Street CSO 22200 4998
WPC-W-0022465 NM 8555 2972 Oban Alma Crescent CSO - 173 WPC-W-30354 NM 8481 2946 Domestic 400 - WPC-W-22464 NM 8606 2930 Oban Soroba Road CSO - 1037 CAR/L/1003475 NM 8490 3060 Oban STW 26600 4958 CAR/R/1014557 NM 8537 3208 Domestic 5 - CAR/R/1013629 NM 8539 3203 Domestic 5 - CAR/R/1014140 NM 8538 3204 Domestic 5 - CAR/R/1014806 NM 8533 3187 Domestic 5 - CAR/R/1016811 NM 8534 3176 Domestic 18 - CAR/R/1009285 NM 8451 3089 Domestic 6 - CAR/R/1022607 NM 8475 2925 Domestic 5 - CAR/R/1022604 NM 8466 2921 Domestic 10 -
Oitir Mhor Restricted Survey Report Final 17/12/09

6
A septic tank for a new house was observed during the shoreline survey and is listed in Table 3.3. The location has been included in the mapped discharges in Figure 3.1. Further details can be found in the shoreline survey report in the appendix. Table 3.3 Observation of potential sewage discharge No. Date NGR Description of potential sewage discharge
1 16.10.08 NM 83100 30029 Septic tank for new house, no discharge pipe The septic tank for the new house is most likely to discharge to soakaway as no discharge pipe was observed. Should this become clogged and fail to operate properly, septic waste from the property would impact the eastern half of the shoreline along Oitir Mhor Bay. Discharges from yachts are likely at both Oban Marina and in Oitir Mhor Bay itself during the summer season when yachts looking to avoid congestion in Oban are most likely to use the anchorage in Oitir Mhor (Clyde Cruising Club, 2007). The farm and hostel at Ardantrive would most certainly have a septic tank, though no information on the size and type of discharge was available from SEPA. It is likely that this will discharge to Oban Bay, as the farm lies on the eastern side of the island. The discharges at Oban are a separated from the production area by both distance and topography and are less likely to significantly impact the fishery at Oitir Mhor than are sources more local to the fishery.
Oitir Mhor Restricted Survey Report Final 17/12/09
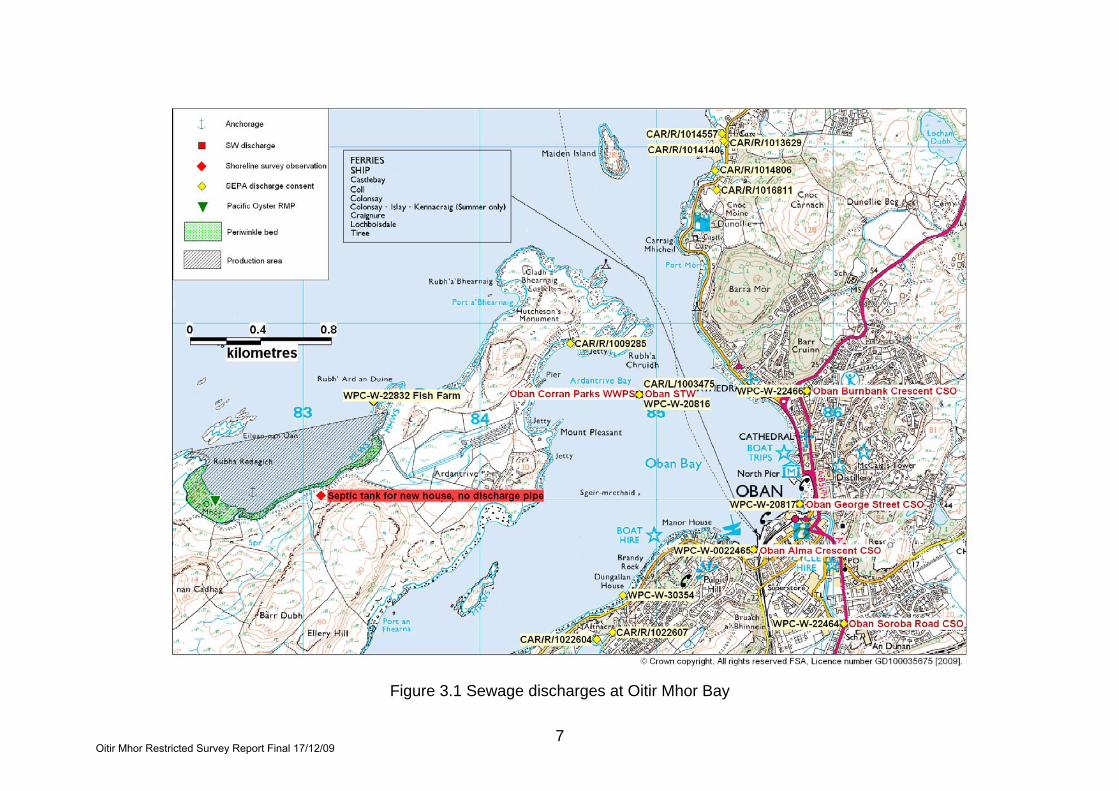
Figure 3.1 Sewage discharges at Oitir Mhor Bay
7Oitir Mhor Restricted Survey Report Final 17/12/09

8
4. Animals 4.1 Livestock The only significant source of information concerning livestock numbers in the area surrounding Oitir Mhor Bay was available from the shoreline survey. The shoreline survey only relates to the time of the site visits on Thursday 16th October. During the shoreline survey, an estimated 40 sheep were observed grazing approximately midway along the bay, with access to the shoreline (see Figure 4.1). Sheep droppings were observed on the shoreline at the northern end of the beach at Oitir Mhor, indicating that sheep had been present on the shoreline. A cattle feeding station was observed toward the northeastern end of the shore and though no cattle were observed on the day, it is likely that cattle are present in the area at some times.
Figure 4.1 Livestock/wildlife observed at Oitir Mhor Bay Overall, livestock are likely to be significant contributors of contamination to the fishery at Oitir Mhor given that they are present on and near the shoreline. 4.2 Wildlife While the Isle of Kerrera does host some colonies of breeding seabirds, Oitir Mhor Bay does not host significant colonies. Seabirds such as gulls will
Oitir Mhor Restricted Survey Report Final 17/12/09

9
always be present on the loch but their distribution is likely to be even over time and as such would not materially affect placement of an RMP. The Sea Mammal Research Unit has recorded a growing number of harbour seals in the Isle of Kerrera area over the past twenty years (Table 4.1). There have also been some specifically in the Oitir Mhor Bay area. Grey seals have also been spotted but in very small numbers and were absent during 1988, 1991 - 1996 (Table 4.2). Table 4.1 Harbour Seals Location Aug
1988 Aug 1989
Aug 1990
Aug 1991
Aug 1992
Aug 1993
Aug 1996
Aug 2000
Aug 2007
Kerrera Oitir Mhor - - 42 - - - 50 95 40 Wider area 217 209 351 225 149 301 373 464 297
Table 4.2 Grey Seals Location Aug
1988 Aug 1989
Aug 1990
Aug 1991
Aug 1992
Aug 1993
Aug 1996
Aug 2000
Aug 2007
Kerrera Oitir Mhor - - 30 - - - 14 6 16 Wider area 0 2 0 0 0 0 0 24 3
According to the local authority, there is currently a seal colony (estimated 20-30 seals) resident in the Oitir Mhor Bay area. Daily boat trips are run from Oban to view the seal colony. According to one of the tour operators, the seals are primarily found on the rocks at Sgier Dhonn and more rarely at Eilean nan Uan, both offshore of the fishery (Figure 4.1). They are also sometimes found near the cage fish farm off the east end of the production area. The amount of E. coli and other faecal indicator bacteria contained in seal faeces has been reported as being similar to that found in raw sewage, with counts showing up to 1.21 x 10⁴ CFU (colony forming units) E. coli per gram dry weight of faeces (Lisle et al 2004). Given the proximity and numbers of seals present near the fishery and the numbers of faecal indicator bacteria present in seal faeces, it is possible that they contribute significantly to the load of faecal bacteria in the waters around Oitir Mhor. As these animals are highly mobile and likely to hunt throughout the area, their impact may be widely spread and unpredictable.
Oitir Mhor Restricted Survey Report Final 17/12/09

10
5. Rainfall The nearest weather station is located at Lismore Frackersaig Farm approximately 9.4km north of the production area. Rainfall data was supplied for the period 01/01/03 to 31/12/06 (total daily rainfall in mm). For this period of 1461 days, total daily rainfall was not recorded for 122 days, including July 2003, September 2004 and 2005 and October 2006. Although the weather station is at some distance from the production area, it is likely that the rainfall experienced at Lismore Frackersaig Farm is broadly similar to that experienced at the production area and so is included in the analysis here. High rainfall and storm events are commonly associated with increased faecal contamination of coastal waters through surface water run-off from land where livestock or other animals are present, and through sewer and wastewater treatment plant overflows (Mallin et al. 2001, Lee and Morgan 2003). 5.1 Rainfall at Lismore Frackersaig Farm Total annual rainfall and mean monthly rainfall were calculated, and are presented in Figures 5.1 and 5.2. As there were no records for July 2003, September 2005 & 2006, October 2006, the mean for these months was caculated by dividing the total monthly rainfall by the number of years for which records were provided.
2006200520042003
2000
1500
1000
500
0
Year
Tota
l ann
ual r
ainf
all (
mm
)
1517.81588.3
1978.9
1281.8
Total annual rainfall (Lismore Frackersaig Farm) 2003-2006*
*Data missing for Jul 2003, Sep 2005 & 2006, Oct 2006
Figure 5.1 Total annual rainfall at Lismore Frackersaig Farm 2003 – 2006 (no records for Jul 2003, Sep 2005 & 2006, Oct 2006).
Oitir Mhor Restricted Survey Report Final 17/12/09

11
DecNovOctSepAugJulJunMayAprMarFebJan
250
200
150
100
50
0
Month
Mea
n m
onth
ly t
otal
rai
nfal
l (m
m)
231.1
215.4
154.2
170.0162.6
78.3
119.8117.8
91.0
120.7
95.8
199.2
Mean monthly total rainfall (Lismore Frackersaig Farm) 2003-2006
Figure 5.2 Mean total monthly rainfall at Lismore Frackersaig Farm 2003 – 2006
(no records for Jul 2003, Sep 2005 & 2006, Oct 2006). The wettest months were January, November and December. The largest increases in rainfall over the previous months occurred in August and November. For the period considered here (2003 – 2006), only 26% of the days experienced no rainfall while 16% of days experienced rainfall of 1mm or less. Periods of increased rainfall are generally associated with higher levels of contaminated surface water runoff. However, the catchment area for the bay and its streams is small and contamination via these sources may be present at any time of year after a rainfall. Faecal contaminants from other sources may be independent of rainfall and so episodes of contamination may occur outside identified periods of higher rainfall, for example when livestock are present on the shoreline.
Oitir Mhor Restricted Survey Report Final 17/12/09

12
6. River Flow There are no significant rivers or river gauging stations in the vicinity of Oitir Mhor Bay. There are five streams discharging into Oitir Mhor Bay and their locations are shown in Figure 6.1. These streams were sampled during the shoreline survey. These represented the largest freshwater inputs into Oitir Mhor Bay. However, measurements taken on the day of survey may not be representative of flow conditions at all times of the year. Table 6.1 Stream flows and loadings – Oitir Mhor Bay
No
Grid
Ref
Des
crip
tion
Wid
th
(m)
Dep
th
(m)
Mea
sure
d Fl
ow (m
/s)
Flow
in
m3/
day
E. c
oli (
cfu/
10
0ml)
Load
ing
(E.
coli
per
day)
1 NM 83445 30254 Stream 1.60 0.10 0.110 1520.6 100 1.5 x 10⁹
2 NM 83045 30040 Stream 0.40 0.11 0.760 2889.2 100 2.9 x 10⁹
3 NM 82349 29974 Stream 0.45 0.09 0.135 472.4 <100* -
4 NM 82347 30124 Stream 0.20 0.07 0.503 608.4 <100* -
5 NM 82741 29873
Stream – too
small to measure
- - - - <100* -
* For water samples with an E. coli result of <100, loadings were not calculated.
Figure 6.1 Location of streams and loadings at Oitir Mhor Bay
Oitir Mhor Restricted Survey Report Final 17/12/09

13
The streams discharging to eastern end of the bay are longer, carry runoff from a larger area and showed moderately higher levels of contamination than was observed in the two smaller streams at the western end of the bay. Given the difference in size of catchment for the streams, it is likely that those on the eastern end of the bay will carry higher bacterial loads under most conditions and so the impact of contamination from streams will be consistently higher at the eastern end of the fishery.
Oitir Mhor Restricted Survey Report Final 17/12/09
14
7. Historical E. coli Monitoring Data
7.1 Validation The E. coli results of all the shellfish (Pacific oyster and periwinkle) samples taken from Oitir Mhor Bay from the beginning of 2005 up to the most recent 2008 samples were extracted from the database and validated according to the criteria described in the standard protocol for validation of historical E. coli data. No samples were rejected on the basis of major geographical or sampling date discrepancies. For sample results that were reported as <20 a nominal value of 10 for purposes of statistical assessment and graphical presentation. All E. coli results are reported in most probable number per 100g of shellfish flesh and intravalvular fluid.
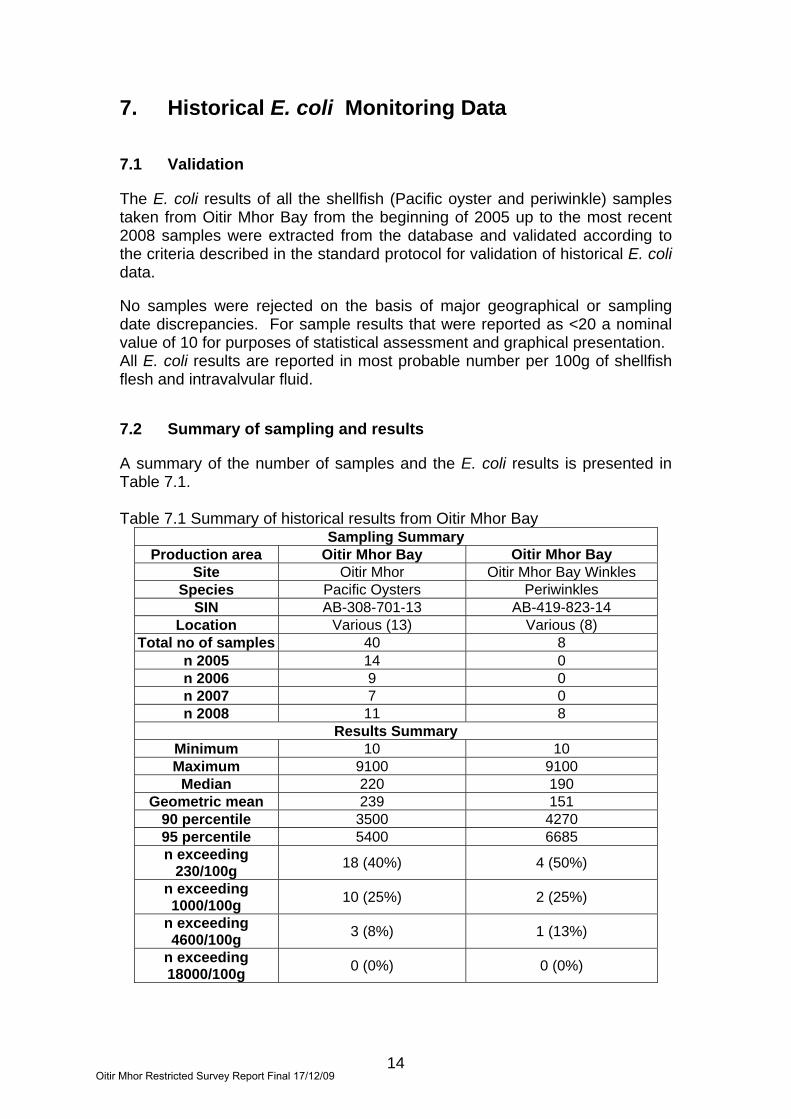
7.2 Summary of sampling and results A summary of the number of samples and the E. coli results is presented in Table 7.1. Table 7.1 Summary of historical results from Oitir Mhor Bay
Sampling Summary Production area Oitir Mhor Bay Oitir Mhor Bay
Site Oitir Mhor Oitir Mhor Bay Winkles Species Pacific Oysters Periwinkles
SIN AB-308-701-13 AB-419-823-14 Location Various (13) Various (8)
Total no of samples 40 8 n 2005 14 0 n 2006 9 0 n 2007 7 0 n 2008 11 8
Results Summary Minimum 10 10 Maximum 9100 9100
Median 220 190 Geometric mean 239 151
90 percentile 3500 4270 95 percentile 5400 6685 n exceeding
230/100g 18 (40%) 4 (50%)
n exceeding 1000/100g 10 (25%) 2 (25%)
n exceeding 4600/100g 3 (8%) 1 (13%)
n exceeding 18000/100g 0 (0%) 0 (0%)
Oitir Mhor Restricted Survey Report Final 17/12/09
15
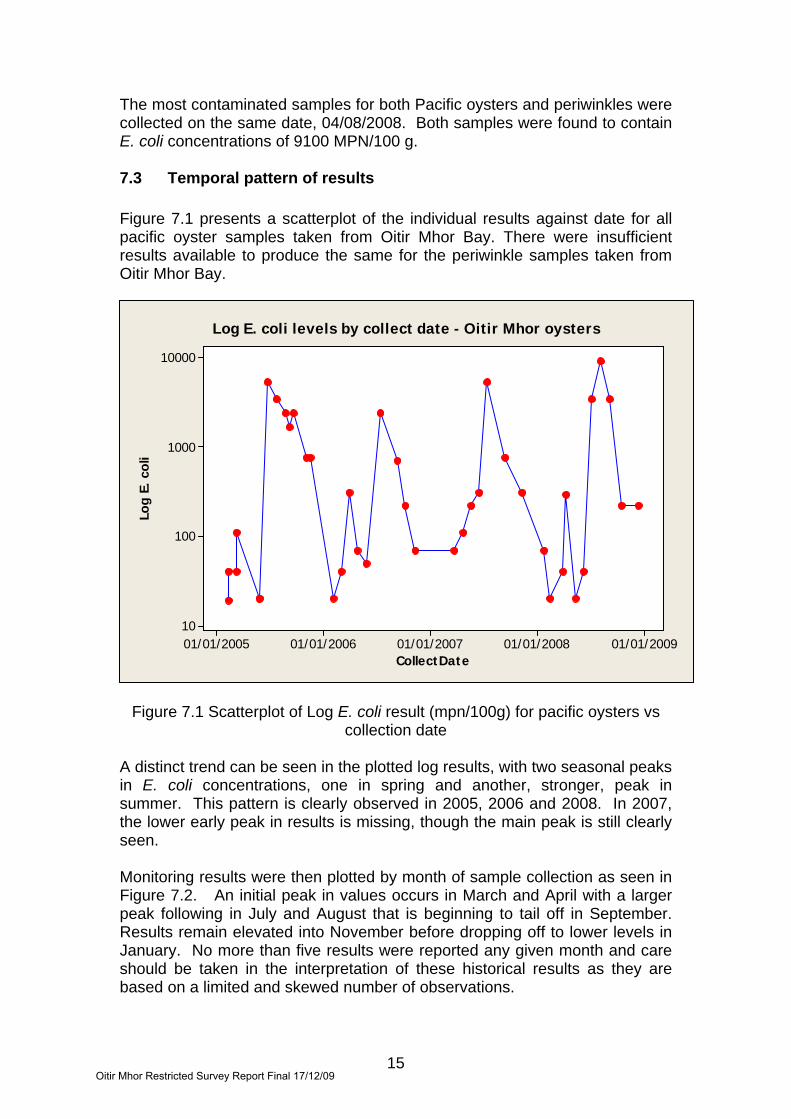
The most contaminated samples for both Pacific oysters and periwinkles were collected on the same date, 04/08/2008. Both samples were found to contain E. coli concentrations of 9100 MPN/100 g. 7.3 Temporal pattern of results Figure 7.1 presents a scatterplot of the individual results against date for all pacific oyster samples taken from Oitir Mhor Bay. There were insufficient results available to produce the same for the periwinkle samples taken from Oitir Mhor Bay.
01/01/200901/01/200801/01/200701/01/200601/01/2005
10000
1000
100
10
CollectDate
Log
E. c
oli
Log E. coli levels by collect date - Oitir Mhor oysters
Figure 7.1 Scatterplot of Log E. coli result (mpn/100g) for pacific oysters vs collection date
A distinct trend can be seen in the plotted log results, with two seasonal peaks in E. coli concentrations, one in spring and another, stronger, peak in summer. This pattern is clearly observed in 2005, 2006 and 2008. In 2007, the lower early peak in results is missing, though the main peak is still clearly seen. Monitoring results were then plotted by month of sample collection as seen in Figure 7.2. An initial peak in values occurs in March and April with a larger peak following in July and August that is beginning to tail off in September. Results remain elevated into November before dropping off to lower levels in January. No more than five results were reported any given month and care should be taken in the interpretation of these historical results as they are based on a limited and skewed number of observations.
Oitir Mhor Restricted Survey Report Final 17/12/09

16
Dece
mber
Nove
mber
Octob
er
Septe
mber
Augu
stJuly
JuneMay
April
March
Februa
ry
Janu
ary
10000
1000
100
10
Month
Log
E.co
liE.coli by collection month - Oitir Mhor
Figure 7.2 Value plot of Log E. coli result vs sampling month These peaks do not directly coincide with seasonal variations in recorded rainfall, however this does not rule out the possibility that contamination peaks in shellfish may be indirectly related to rainfall-related surface runoff. 7.4 Geographical pattern of results Figure 7.2 shows a map with the geometric mean results plotted at the sampling locations for Pacific oysters at Oitir Mhor Bay. The location of the current oyster farm was not recorded as a part of this survey. The oyster samples reported vary markedly in their location and this may reflect movement of the trestles over time. Locations of samples prior to 2008 were reported to only 100 metre accuracy, so the four samples that appear to plot on dry land were presumed to have been taken from within the intertidal zone. Insufficient data were available to present geometric mean result by sampling location for periwinkle samples collected at Oitir Mhor Bay. The periwinkles were 1 sample at each location so no mean could be calculated. Figure 7.3 shows a thematic map of the individual periwinkle results plotted by sampling locations.
otted by sampling locations.
Oitir Mhor Restricted Survey Report Final 17/12/09

17
Figure 7.3 Pacific oyster geometric mean results plotted by sampling location
Figure 7.4 Periwinkle sample results plotted by sampling location
Oitir Mhor Restricted Survey Report Final 17/12/09

18
8. Bathymetry and Hydrodynamics
Figure 8.1 Oitir Mhor Bay bathymetry
Figure 8.2 OS map of Oitir Mhor Bay The bathymetry chart above shows that there is a large, intertidal drying area adjacent to the southwest coastline and a smaller area on the eastern coastline. The western side of the bay called Oitir Mhor is very shallow, with a deeper zone (>20m) extending southward from just off the point of Rubh’ Ard an Duine. The adjacent bay to the northeast is also shallow, varying from 0 – 10 m.
Oitir Mhor Restricted Survey Report Final 17/12/09

19
8.1 Tidal curve and description The two tidal curves below are for the port of Oban the nearest standard port– they have been output from UKHO TotalTide. The first is for seven days beginning 00.00 GMT on 8th October 2008. The second is for seven days beginning 00.00 GMT on 16th October 2008. Together they show the predicted tidal heights over high/low water for a full neap/spring tidal cycle.
Figure 8.3 Tidal curves for Oban The following is the UKHO summary description for Oban: The tide type is Semi-Diurnal. MHWS 4.0 m MHWN 2.9 m MLWN 1.8 m MLWS 0.7 m © Crown Copyright and/or database rights. Reproduced by permission of the Controller of Her Majesty’s Stationery Office and the UK Hydrographic Office (www.ukho.gov.uk) Predicted heights are in metres above chart datum. The tidal range at spring tide is therefore approximately 3.3 m and at neap tide 1.1 m.
Oitir Mhor Restricted Survey Report Final 17/12/09

20
8.2 Currents The nearest tidal diamond (SN037I) was located northwest of the Isle of Kerrera in the Lynn of Lorn at NM 80125 32485, about 3.1 km from the north western extremity of the production area. While it is reasonably close to the production area, tidal flows here will be less influenced by interaction with the surrounding land than those nearer the fishery. Table 8.1 Tidal diamond information for SN0371
Time Direction Spring rate Neap Rate -06h 212° 0.1 kn 0.0 kn
-05h 029° 0.1 kn 0.0 kn
-04h 026° 0.2 kn 0.1 kn
-03h 022° 0.3 kn 0.1 kn
-02h 022° 0.4 kn 0.1 kn
-01h 028° 0.3 kn 0.1 kn
HW 049° 0.1 kn 0.0 kn
+01h 145° 0.1 kn 0.0 kn
+02h 184° 0.2 kn 0.1 kn
+03h 204° 0.3 kn 0.1 kn
+04h 219° 0.3 kn 0.1 kn
+05h 226° 0.3 kn 0.1 kn
+06h 219° 0.1 kn 0.0 kn Figures 8.4 and 8.5 present predicted maximum tidal flows and direction on the ebb and flood tide respectively on 16/10/2008, when the largest tides of the year were predicted. Tidal flows at the diamond are generally bi-directional, with water moving in a northeasterly direction on the flood and southwesterly on the ebb. Peak flow rates are 0.4 knots on spring tides, and 0.1 knots on neap tides and are slightly stronger on the flooding tide. If the maximum flow is assumed, contamination entering Oitir Mhor Bay would potentially travel 720 metres in an hour at peak spring flood and 550 metres in an hour at the peak spring ebb. This is sufficient to travel the full length of Oitir Mhor Bay on a complete ebb tide cycle. Flow rates are slow, indicating relatively weak tidal flows in the middle of the Firth of Lorn. Flows around the tip of the island of Kerrera at the entrance to Oban Bay and Kerrera sound can be much higher with flow rates of up to 2.5 kn at spring tides reported (Clyde Cruising Club 2007). Contamination discharged to Oban Bay would potentially move a significant distance north into the Firth of Lorn on a flood tide, however interaction of currents with Kerrera island and the other smaller islands and rocks in the area would be complex making prediction of contaminant movement here difficult without
Oitir Mhor Restricted Survey Report Final 17/12/09

21
detailed study or modelling. It is unlikely that these sources would be more significant than contaminant sources more local to the fishery at Oitir Mhor.
Figure 8.4 Maximum ebb tide flow and direction on a large spring tide at
SN037I (from Admiralty TotalTide)
Figure 8.5 Maximum flood tide flow and direction on a large spring tide at
SN037I (from Admiralty TotalTide) The presence of the beach at Oitir Mhor and its northerly aspect seem to indicate sediment deposition on a southbound tide and low rates of water flow given the lack of a large streams depositing sediment in that area. Tides flowing past on the flood would tend to swirl around the point just north of the beach, creating an eddy within the western end of Oitir Mhor Bay as the tide rises. As the tide begins to fall, water moving to the southwest would tend to get trapped by the land, causing any contamination entering the bay to the northeast to pool and settle on the beach at Oitir Mhor. Wind could significantly modify water flow in the area, however consideration of this is beyond the scope of this restricted survey. 8.3 Conclusions regarding effect on impacting sources Due to the weak tides and aspect of the area primarily fished at Oitir Mhor, contaminants entering the bay to the northeast are likely to accumulate in the area around Oitir Mhor on the ebb tide. Calculation of maximum potential travel based on tidal flows indicated that contaminants are unlikely to travel much beyond the bay on the flood tide and are capable of travelling the length of the bay on the ebb tide. Contamination from streams and surface runoff all along the shoreline at Oitir Mhor Bay is likely to impact the main part of the fishery to the southwest.
Oitir Mhor Restricted Survey Report Final 17/12/09
22
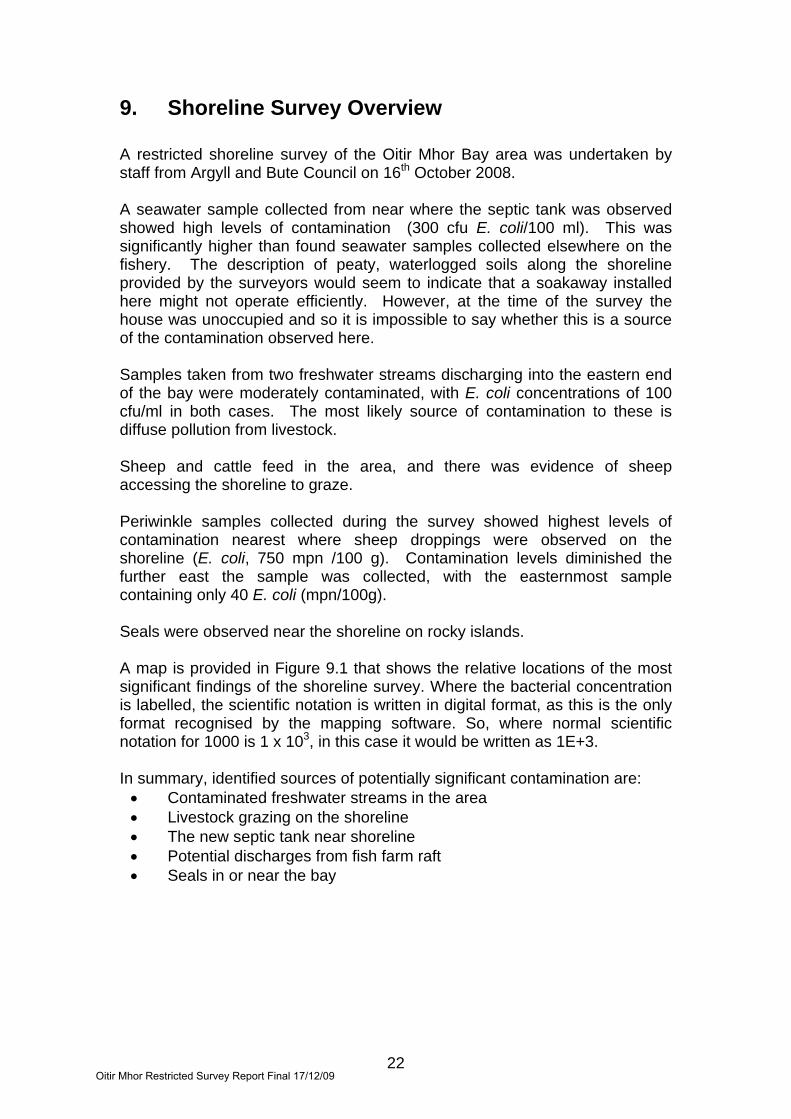
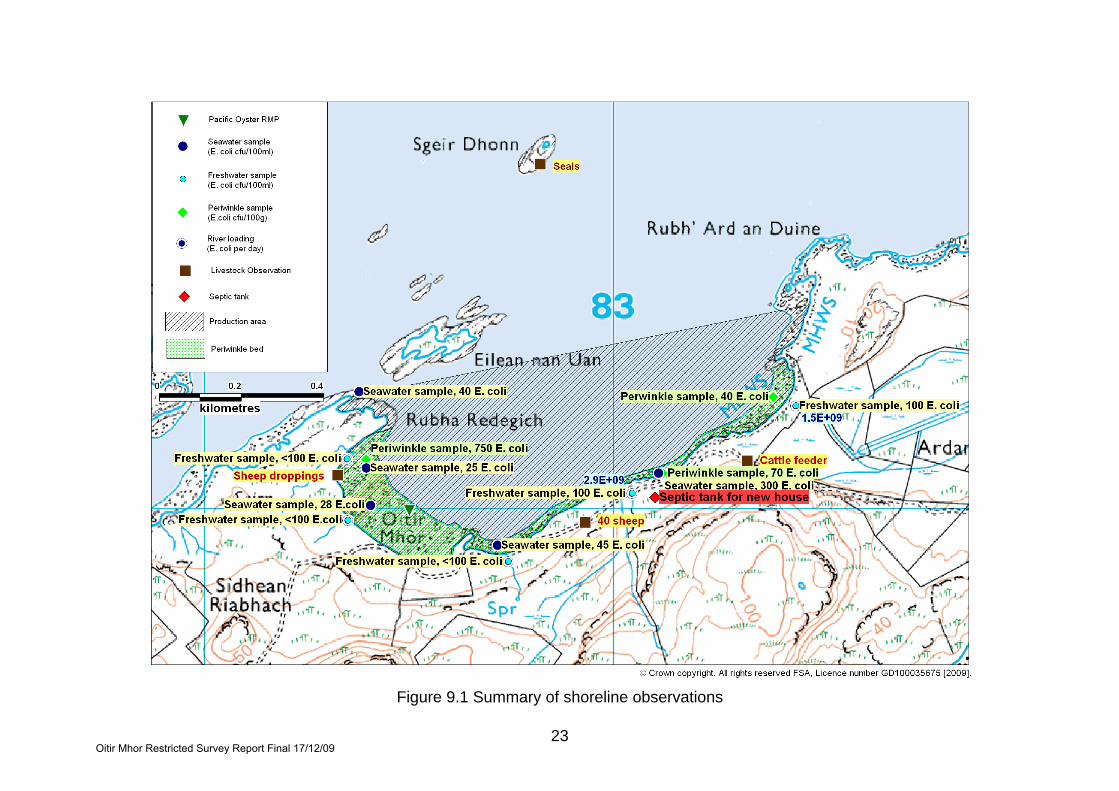
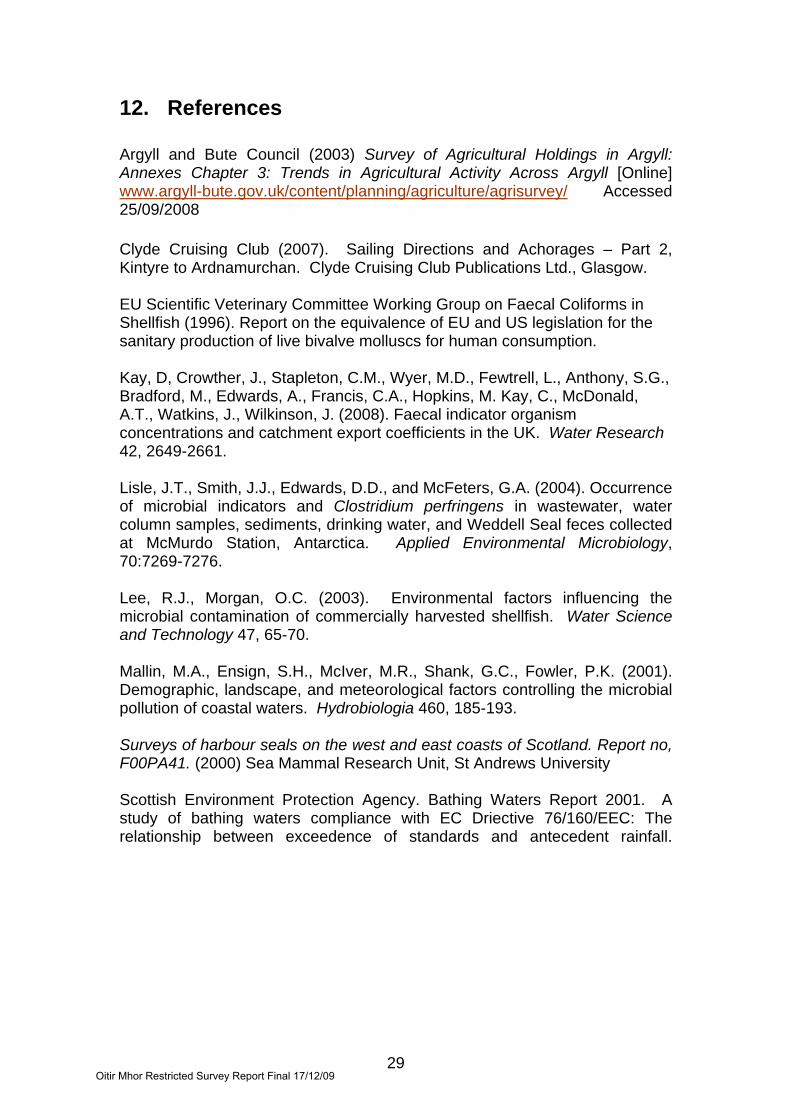
9. Shoreline Survey Overview A restricted shoreline survey of the Oitir Mhor Bay area was undertaken by staff from Argyll and Bute Council on 16th October 2008. A seawater sample collected from near where the septic tank was observed showed high levels of contamination (300 cfu E. coli/100 ml). This was significantly higher than found seawater samples collected elsewhere on the fishery. The description of peaty, waterlogged soils along the shoreline provided by the surveyors would seem to indicate that a soakaway installed here might not operate efficiently. However, at the time of the survey the house was unoccupied and so it is impossible to say whether this is a source of the contamination observed here. Samples taken from two freshwater streams discharging into the eastern end of the bay were moderately contaminated, with E. coli concentrations of 100 cfu/ml in both cases. The most likely source of contamination to these is diffuse pollution from livestock. Sheep and cattle feed in the area, and there was evidence of sheep accessing the shoreline to graze. Periwinkle samples collected during the survey showed highest levels of contamination nearest where sheep droppings were observed on the shoreline (E. coli, 750 mpn /100 g). Contamination levels diminished the further east the sample was collected, with the easternmost sample containing only 40 E. coli (mpn/100g). Seals were observed near the shoreline on rocky islands. A map is provided in Figure 9.1 that shows the relative locations of the most significant findings of the shoreline survey. Where the bacterial concentration is labelled, the scientific notation is written in digital format, as this is the only format recognised by the mapping software. So, where normal scientific notation for 1000 is 1 x 10³, in this case it would be written as 1E+3. In summary, identified sources of potentially significant contamination are: • Contaminated freshwater streams in the area • Livestock grazing on the shoreline • The new septic tank near shoreline • Potential discharges from fish farm raft • Seals in or near the bay
Oitir Mhor Restricted Survey Report Final 17/12/09
23
Figure 9.1 Summary of shoreline observations
Oitir Mhor Restricted Survey Report Final 17/12/09

24
10. Overall Assessment Human sewage inputs The Isle of Kerrera has a human population of 42. The settlement of Oban adjacent to the island has a population of 8,120 (2001 census) and though it has significant sewage discharges, these are not considered likely to impact heavily at Oitir Mhor Bay. There is no mains sewerage system on the Isle of Kerrera, however a new septic tank was identified on the shoreline of Oitir Mhor Bay close to the shellfish bed. A marine cage fish farm and service barge are located at the northeastern end of the bay and if toilet facilities are present on the barge, these may discharge directly into the bay. Further sewage input is likely from the wildlife tour boats that frequent Oitir Mhor Bay and from the yachts that anchor there. Potential contamination from these sources is likely to be seasonal, with higher impact during the summer months. Agricultural inputs There is no arable agriculture in the vicinity of Oitir Mhor Bay. Livestock graze on and near the shoreline at Oitir Mhor Bay, with approximately 40 sheep observed during the survey. Though no cattle were observed on the day, a cattle-feeding station provided a clear indication that cattle are present on the shore here some of the time. The exact amount, location and timing of faecal inputs from these sources is likely to be variable and unpredictable and so they will be assumed to have equal impact across the fishery. Wildlife inputs There is a seal colony (approximately 30 seals) resident off shore near the western end of the fishery. Seals may hunt and swim in waters throughout Oitir Mhor Bay, though they are mainly observed at the offshore islands and occasionally near the salmon farm Their impact is likely to be highest, however, toward the western end of the fishery near the islands where they are known to reside. Wildlife such as dolphins, water birds and otters may be present at times in the area, but not in large numbers. Seasonal variation Seasonal variation was observed in monitoring results obtained from the oyster farm present in the bay. Peak contamination levels were seen during April and May and July through September inclusive. Seasonal rainfall is highest in winter, and historically much higher in August and November than in the preceding months. Livestock numbers in the area as a whole are likely to be at their highest during the summer months when lambs are present. During the warmer months livestock may access streams to drink and cool off more frequently, leading to higher levels of faecal contamination in freshwater streams and in
Oitir Mhor Restricted Survey Report Final 17/12/09
25
the bay itself. There is likely to be an increase in human presence during the summer months, and if the new home observed on the shore of the bay is a holiday home, it is more likely to impact the fishery during the summer. Boat traffic is likely to be higher in summer as yachts that cannot find moorings on the Oban side of the island choose to anchor in Oitir Mhor Bay. These are most likely to impact the Western side of the fishery, where the anchorage is located. Traffic from wildlife tour boats is likely to also be more frequent during the late spring and summer months. Rivers and streams All five streams discharging into Oitir Mhor Bay were sampled. All of the water samples taken indicated relatively low levels of E. coli (all were below 100 E. coli cfu/100ml). However, three of the streams discharge directly onto the shellfish bed. Overall it is expected that the freshwater inputs into Oitir Mhor Bay will have a relatively low effect on the bacterial contamination of shellfish. Rainfall Rainfall patterns at Lismore Frackersaig Farm (the nearest rainfall station) show mean rainfall levels have been higher between August and January than during the remainder of the year. Peaks in contamination were found in the monitoring history to occur during March and April and again in July and August, indicating that higher historical mean rainfall and levels of E. coli contamination in shellfish are not necessarily positively correlated at this site. In fact, contamination peaks occur during two of the driest months of the year, based on mean recorded rainfall. While in general terms, higher rainfall levels are expected to correlate with higher levels of bacterial contaminants washed into streams with surface runoff, observation of this effect may be complicated by a number of other factors. In the case of Oitir Mhor Bay, due to the relatively small catchment area drained by the streams discharging to the bay, the impact of rainfall on the production area is likely to be weak. Analysis of results Historic shellfish hygiene monitoring results for Pacific Oysters are available from 2005 to present, with samples collected from the western end of the bay at Oitir Mhor. Results varied greatly, ranging from 19 to 9100 E. coli (mpn/100g). Shellfish hygiene monitoring results for periwinkles are available from January 2008 to present. Samples were collected from the western end of the bay at Oitir Mhor. Results varied greatly, ranging from 10 to 9100 E. coli (mpn/100g). Seawater samples taken from five points along the shore ranged from 25 to 300 E. coli cfu/100ml. The highest result (300 E. coli mpn/100g) came from near the centre of the bay. Overall these results showed contamination levels usually associated with Class B waters (EU SVC, 1996).
Oitir Mhor Restricted Survey Report Final 17/12/09
26
Shellfish samples were taken from three points along the rocky inter-tidal zone during the shoreline survey. The two samples taken from the eastern end of the inter-tidal zone had relatively low levels of E. coli (40 and 70 E. coli mpn/100g). The sample taken from the western end of the bay at Oitir Mhor had a much higher result of 750 E. coli (mpn/100g). As noted in the previous sections the level of contamination and calculated bacterial loading for the streams discharging into Oitir Mhor Bay were relatively low at the time of survey. Movement of contaminants Tidal flows in the area were shown to be relatively weak. Given the shallow depth and sheltering islands around Oitir Mhor Bay, contaminants are not likely to disperse quickly with the tide. Contaminants entering the bay from streams and livestock droppings along the northeastern shore of the bay are likely to accumulate and combine with more local sources at the southwestern end of the bay on the ebb tide. Overall conclusions Oitir Mhor Bay is affected by seasonal peaks in contamination levels from an as yet undetermined source. It is may be that peaks in contamination observed in oysters farmed at the site will also be observed in periwinkles gathered in the area. The western end of the bay is likely to be most acutely impacted as water movement and the local land formation may lead to contaminants being entrained and concentrated in this area.
Oitir Mhor Restricted Survey Report Final 17/12/09
27
11. Recommendations Due to seasonal patterns observed in monitoring results, it is recommended that monthly monitoring be undertaken on periwinkles at this production area. Peak results observed in both oysters and periwinkles (9100 E. coli mpn/100g) at the site were obtained from samples collected on the same date, indicating that the source or sources of contamination at this site affect both species similiarly. However, given their very different feeding strategies it is not recommended that one species or other be used as an indicator for both at this time. This may be reviewed after sufficient monitoring history has been obtained to adequately compare the two. Though periwinkles are mainly harvested from the beach at the southwestern end of the bay, they are present all along the shoreline. As the remainder of the shore is likely to be either equally or less contaminated than the beach at Oitir Mhor, it is recommended that the production area for periwinkles be retained as that already established for oysters on site because it covers the entire extent of the bed. This production area is described as the area bounded by lines drawn between NM 8236 3028 and NM 8348 3050 extending to MHWS. Due to the likely movement of contaminants into the southwestern end of the bay, shellfish harvested from this part of the bay are likely to contain higher concentrations of faecal contaminants than those in other parts of the bay. As it is also the area primarily harvested, the RMP should be established in this area. The two streams carrying contaminated runoff are located on the northwestern half of the beach and as these are likely to be consistent sources it would be prudent to locate the RMP near these at NM 82400 30050. As this is a wild fishery, a sampling tolerance of 50 metres is recommended in the first instance. Should this be found to be inadequate to allow regular collection of samples, the tolerance can be reviewed and amended if necessary or the location of the RMP reviewed. The proposed RMP and sampling tolerance, along with the production area boundaries, are illustrated in Figure 11.1.
Oitir Mhor Restricted Survey Report Final 17/12/09

Figure 11.1 Recommendations for Oitir Mhor Bay periwinkles
28Oitir Mhor Restricted Survey Report Final 17/12/09
29
12. References Argyll and Bute Council (2003) Survey of Agricultural Holdings in Argyll: Annexes Chapter 3: Trends in Agricultural Activity Across Argyll [Online] www.argyll-bute.gov.uk/content/planning/agriculture/agrisurvey/ Accessed 25/09/2008 Clyde Cruising Club (2007). Sailing Directions and Achorages – Part 2, Kintyre to Ardnamurchan. Clyde Cruising Club Publications Ltd., Glasgow. EU Scientific Veterinary Committee Working Group on Faecal Coliforms in Shellfish (1996). Report on the equivalence of EU and US legislation for the sanitary production of live bivalve molluscs for human consumption. Kay, D, Crowther, J., Stapleton, C.M., Wyer, M.D., Fewtrell, L., Anthony, S.G., Bradford, M., Edwards, A., Francis, C.A., Hopkins, M. Kay, C., McDonald, A.T., Watkins, J., Wilkinson, J. (2008). Faecal indicator organism concentrations and catchment export coefficients in the UK. Water Research 42, 2649-2661. Lisle, J.T., Smith, J.J., Edwards, D.D., and McFeters, G.A. (2004). Occurrence of microbial indicators and Clostridium perfringens in wastewater, water column samples, sediments, drinking water, and Weddell Seal feces collected at McMurdo Station, Antarctica. Applied Environmental Microbiology, 70:7269-7276. Lee, R.J., Morgan, O.C. (2003). Environmental factors influencing the microbial contamination of commercially harvested shellfish. Water Science and Technology 47, 65-70. Mallin, M.A., Ensign, S.H., McIver, M.R., Shank, G.C., Fowler, P.K. (2001). Demographic, landscape, and meteorological factors controlling the microbial pollution of coastal waters. Hydrobiologia 460, 185-193. Surveys of harbour seals on the west and east coasts of Scotland. Report no, F00PA41. (2000) Sea Mammal Research Unit, St Andrews University Scottish Environment Protection Agency. Bathing Waters Report 2001. A study of bathing waters compliance with EC Driective 76/160/EEC: The relationship between exceedence of standards and antecedent rainfall.
Oitir Mhor Restricted Survey Report Final 17/12/09
30
13. List of Figures and Tables Figures Figure 1.1 Location of Oitir Mhor Bay ..............................................................1 Figure 1.2 Human population-surrounding Oitir Mhor Bay...............................2 Figure 2.1 Oitir Mhor Bay periwinkle bed .........................................................4 Figure 3.1 Sewage discharges at Oitir Mhor Bay.............................................7 Figure 4.1 Livestock/wildlife observed at Oitir Mhor Bay..................................8 Figure 5.1 Total annual rainfall at Lismore Frackersaig Farm 2003 – 2006 ...10 Figure 5.2 Mean total monthly rainfall at Lismore Frackersaig Farm 2003 – 2006...............................................................................................................11 Figure 6.1 Location of streams and loadings at Oitir Mhor Bay .....................12 Figure 7.1 Scatterplot of Log E. coli result (mpn/100g) for pacific oysters vs collection date ................................................................................................15 Figure 7.2 Value plot of Log E. coli result vs sampling month........................16 Figure 7.3 Pacific oyster geometric mean results plotted by sampling location.......................................................................................................................17 Figure 7.4 Periwinkle sample results plotted by sampling location ................17 Figure 8.1 Oitir Mhor Bay bathymetry ............................................................18 Figure 8.2 OS map of Oitir Mhor Bay.............................................................18 Figure 8.3 Tidal curves for Oban....................................................................19 Figure 8.4 Maximum ebb tide flow and direction on a large spring tide at SN037I...........................................................................................................21 Figure 8.5 Maximum flood tide flow and direction on a large spring tide at SN037I...........................................................................................................21 Figure 9.1 Summary of shoreline observations..............................................23 Figure 11.1 Recommendations for Oitir Mhor Bay periwinkles ......................28 Tables Table 3.1 Discharges identified by Scottish Water...........................................5 Table 3.2 SEPA discharge consents................................................................5 Table 3.3 Observation of potential sewage discharge .....................................6 Table 4.1 Harbour Seals ..................................................................................9 Table 4.2 Grey Seals .......................................................................................9 Table 6.1 Stream flows and loadings – Oitir Mhor Bay ..................................12 Table 7.1 Summary of historical results from Oitir Mhor Bay .........................14 Table 8.1 Tidal diamond information for SN0371...........................................20
Oitir Mhor Restricted Survey Report Final 17/12/09

Appendices 1. Summary Sampling Plan 2. Shoreline Survey Report
Oitir Mhor Restricted Survey Report Final 17/12/09

Sampling Plan for Oitir Mhor Bay
PRODUC- TION AREA
SITE NAME SIN SPECIES
TYPE OF
FISH-ERY
NGR OF
RMP EAST NORTH
TOLER- ANCE
(M)
DEPTH (M)
METHOD OF
SAMPLING
FREQ OF
SAMPLING
LOCAL AUTHORITY
AUTHORISED SAMPLER(S)
LOCAL AUTHORITY
LIAISON OFFICER
Oitir Mhor Bay
Oitir Mhor Bay
Winkles
AB 419 Periwinkles Wild
harvest
NM 8240 3005
18240 73005 50 N/A Hand Monthly Argyll & Bute Council
Christine McLachlan William MacQuarrie
Ewan McDougall Donald Campbell
Christine McLachlan
Oitir Mhor Restricted Survey Report Final 17/12/09
Appendix 1

Shoreline Survey Report
Oitir Mhor Bay AB 419 823 14
Restricted Scottish Sanitary Survey
Project
Oitir Mhor Restricted Survey Report Final 17/12/09
Appendix 2
1

Shoreline Survey Report Production area: Oitir Mhor Bay Site name: Oitir Mhor Bay Winkles Species: Periwinkles Harvester: Mr Scott Glen Local Authority: Argyll and Bute Council Status: New site Date Surveyed: 16th October 2008 Surveyed by: Christine McLachlan and Ewan McDougall Existing RMP: RMP for Pacific Oysters located at NM 825 300 Area Surveyed: See Figure 1.
Weather observations Dry during survey, previous showers, Wind: NW, Force 5. Site Observations Fishery This site is a wild shellfishery. The periwinkles are found in the rocky inter-tidal band along the shoreline of the bay. The harvester collects his stock from the western end at Oitir Mhor and close to the mouth of the largest fresh water input from Ardantrive. The periwinkles are hand gathered, all year round. Stock of sufficient size and quantity was present for sampling. Sewage/Faecal Sources A septic tank for a new house is located at NM 83100 30029; there was no outfall pipe visible for this discharge. Livestock Sheep were observed in a field with access to the shoreline near the middle of the bay. Sheep droppings were observed on the beach at the northern end of Oitir Mhor Bay. A cattle feeding station at the eastern end of the bay indicated the presence of cattle in the area at least part of the time. Seasonal Population There are no campsites on the Isle of Kerrera, however there are several B&Bs and the area is popular with walkers. Boats/Shipping Oban Marina is situated at Ardantrive Bay on the Isle of Kerrera, opposite Oban with 33 moorings and 94 floating pontoon berths. A daily ferry service runs from Oban to Kerrera. Daily tourist boat trips are also run from Oban to the location of the seal colony at either Sgier Dhonn or Eilean nan Uan.
Oitir Mhor Restricted Survey Report Final 17/12/09
Appendix 2
2

Land Use The land surrounding Oitir Mhor Bay is farmland used mainly for rough grazing, whereby access to the shoreline is available from adjacent fields. Peaty ground, as a result channels of water seep out to the shoreline at frequent intervals. Observations from the shoreline survey can be found in Table 1.
Oitir Mhor Restricted Survey Report Final 17/12/09
Appendix 2
3
DRAFT Figure 1. Shoreline observations
Oitir Mhor Restricted Survey Report Final 17/12/09
Appendix 2
4

DRAFT Table 1. Shoreline observations No. Date Time NGR East North Associated
photograph Description
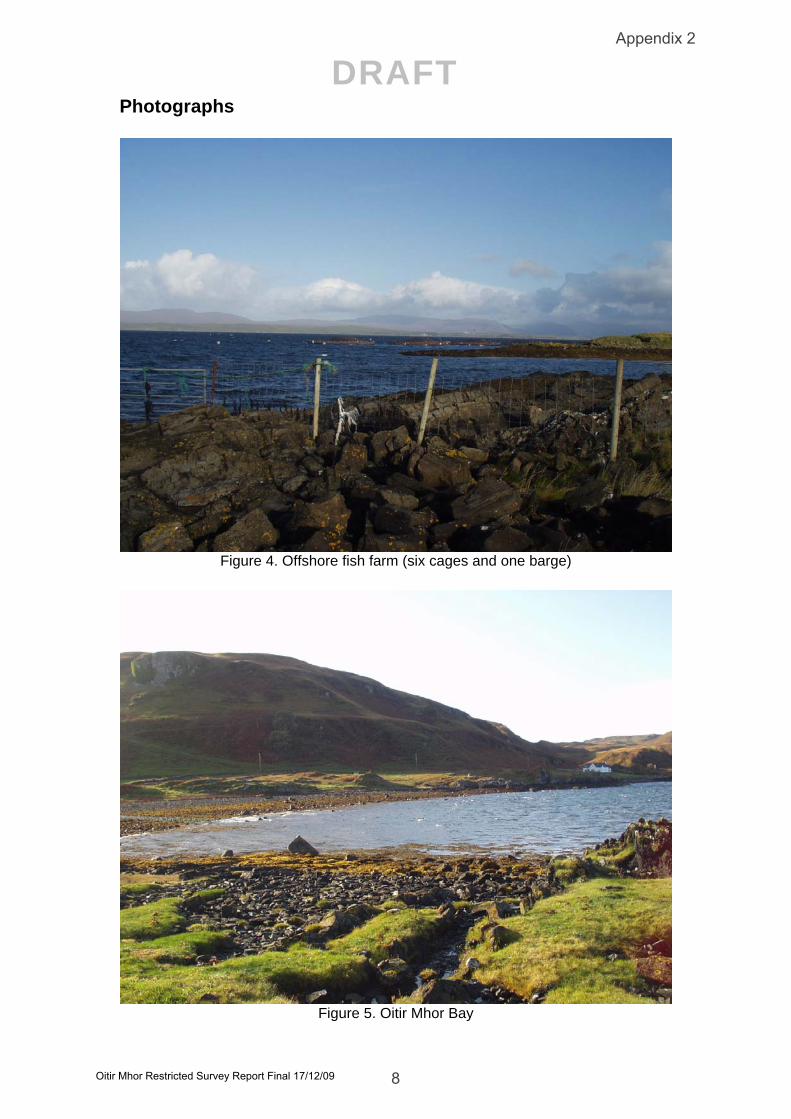
1 16.10.08 10:35 NM 83415 30365 183415 730365 Figure 4 Fish farm off shore, 6 cages, one barge
2 16.10.08 10:45 NM 83445 30254 183445 730254 Figure 6 Stream, 160cm x 10cm x 0.110 OM FW Sample 1.
3 16.10.08 10:48 NM 83326 30120 183326 730120 Cattle ring feeding station 4 16.10.08 10:56 NM 83096 29999 183096 729999 Figure 8 House (new build 2007), unoccupied 5 16.10.08 10:59 NM 83100 30029 183100 730029 Septic tank for new house, no discharge pipe
6 16.10.08 11:00 NM 83045 30040 183045 730040 Stream, 40cm x 11cm x 0.760 OM FW 2
7 16.10.08 11:08 NM 82930 29970 182930 729970 Figure 9 Approaching western bay, 40 sheep with access to shoreline
8 16.10.08 11:15 NM 82741 29873 182741 729873 Very small stream, not measurable OM FW 3
9 16.10.08 11:24 NM 82349 29974 182349 729974 Figure 10 Stream, 45cm x 9cm x 0.135 OM FW 4
10 16.10.08 11:27 NM 82344 30002 182344 730002 Figure 11 Cockles, small clams, razor, scallop, and mussel shells.
11 16.10.08 11:29 NM 82325 30085 182325 730085 Significant evidence of sheep dung on shoreline
12 16.10.08 11:32 NM 82347 30124 182347 730124 Figure 12 Stream 20cm x 7cm x 0.503 OM FW Sample 5
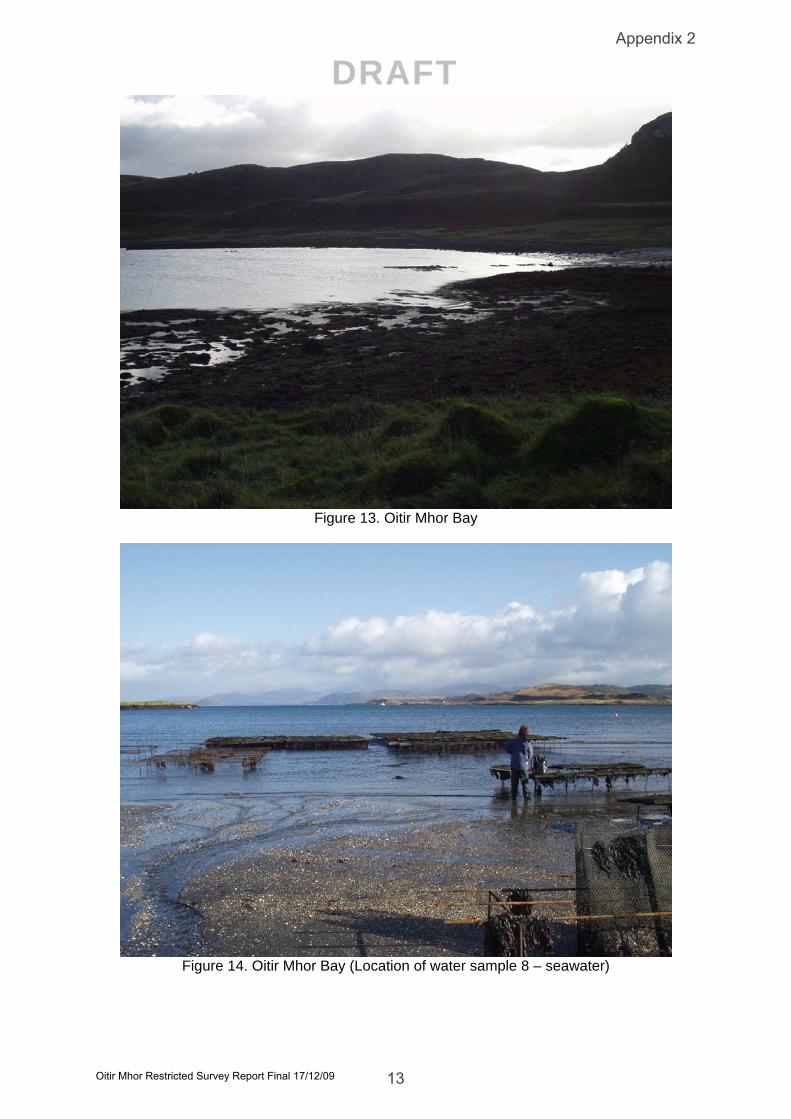
13 16.10.08 11:44 NM 82394 30102 182394 730102 OM SW Sample 6, Salinity = 31.1 14 16.10.08 12:00 NM 82395 30123 182395 730123 OM Winkles Sample 1 15 16.10.08 12:05 NM 82405 30011 182405 730011 OM SW Sample 7, Salinity 30.0 16 16.10.08 12:15 NM 82715 29913 182715 729913 Figure 14 OM SW Sample 8, Salinity 30.0 17 16.10.08 12:25 NM 83110 30089 183110 730089 OM SW Sample 9, Salinity 29.0 18 16.10.08 12:30 NM 83120 30089 183120 730089 OM Winkle Sample 2 19 16.10.08 12:55 NM 82377 30288 182377 730288 OM SW Sample 10, Salinity 20.0 20 16.10.08 12:55 NM 83390 30276 183390 730276 OM Winkles Sample 3
Photographs referenced in the table can be found attached as Figures 4 - 14.
Oitir Mhor Restricted Survey Report Final 17/12/09
Appendix 2
5

DRAFT
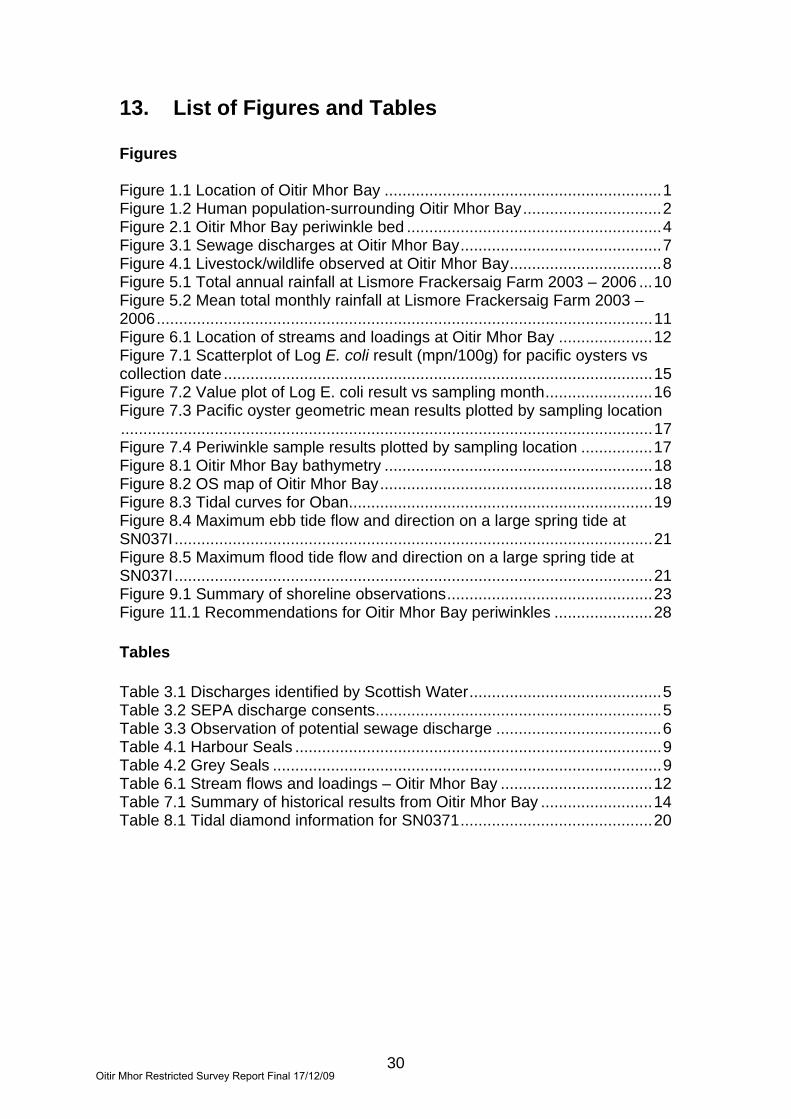
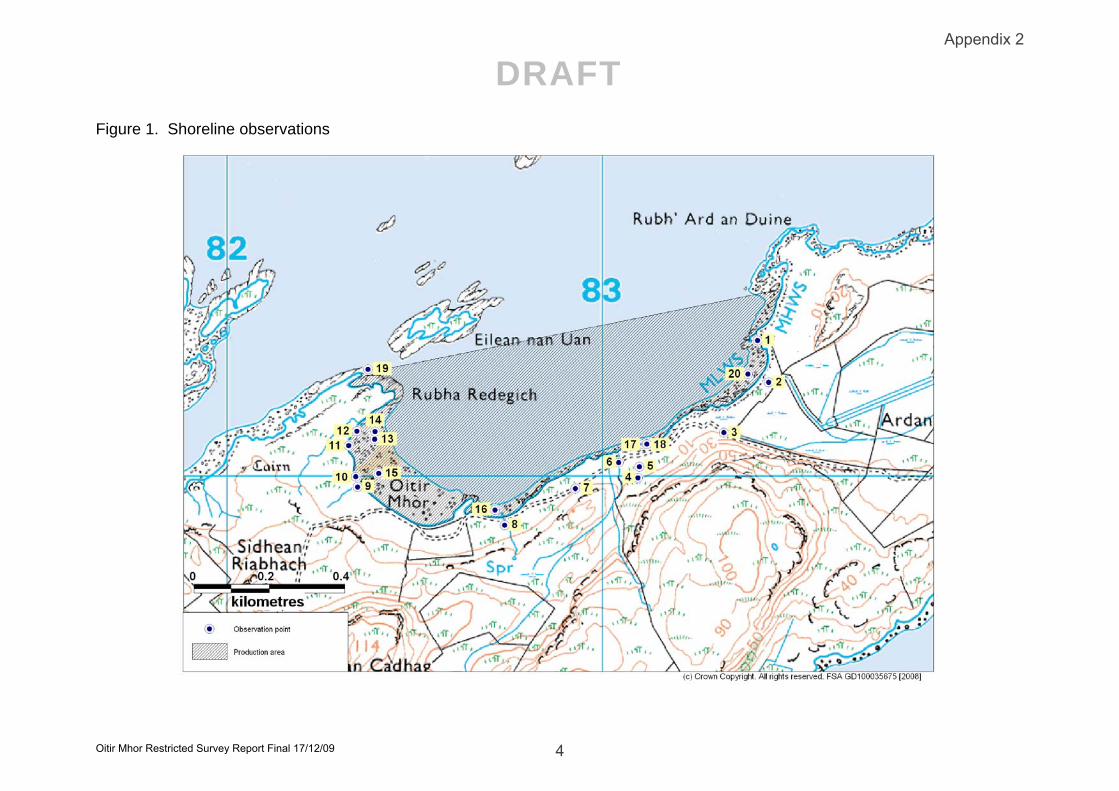
Sampling Water and shellfish samples were collected at sites marked on the map. Bacteriology results follow in Tables 2 and 3. Water samples were taken from all fresh water inputs discharging into Oitir Mhor Bay (see Figure 2). Sea water samples were collected from five locations around the sea bed (see Figure 2). Seawater samples were tested for salinity using a hand held refractometer. These readings are recorded in Table 1 as salinity in parts per thousand (ppt). Samples were also tested for salinity by the laboratory using a salinity meter under more controlled conditions. These results are shown in Table 2, given in units of grams salt per litre of water. This is the same as ppt. Periwinkle samples were samples were collected at three points within the inter-tidal zone of the Oitir Mhor Bay production area (see Figure 3). Shellfish sample No. 1 on the western side of the bay had a higher result of 750 E. coli/100g compared two samples taken from the eastern side of the shore which had much lower results of 40 E. coli/100g and 70 E. coli/100g. Table 2. Water sample results
No. Date Sample Grid Ref Type
E. coli (cfu/100
ml)
Salinity (g/L)
1 16/10/2008 OMFW1 NM 83445 30254 Freshwater 100 - 2 16/10/2008 OMFW2 NM 83045 30040 Freshwater 100 - 3 16/10/2008 OMFW3 NM 82741 29873 Freshwater <100 - 4 16/10/2008 OMFW4 NM 82349 29974 Freshwater <100 - 5 16/10/2008 OMFW5 NM 82347 30124 Freshwater <100 - 6 16/10/2008 OMFW6 NM 82394 30102 Seawater 25 31.1 7 16/10/2008 OMFW7 NM 82405 30011 Seawater 28 31.6 8 16/10/2008 OMFW8 NM 82715 29913 Seawater 45 30.2 9 16/10/2008 OMFW9 NM 83110 30089 Seawater 300 30.3 10 16/10/2008 OMFW10 NM 82377 30288 Seawater 40 18.6
Table 3. Shellfish sample results
No. Date Grid Ref Type E. coli (cfu/100g)
1 16/10/2008 NM 82395 30123 Periwinkle 750 2 16/10/2008 NM 83120 30089 Periwinkle 70 3 16/10/2008 NM 83390 30276 Periwinkle 40
Oitir Mhor Restricted Survey Report Final 17/12/09
Appendix 2
6
DRAFT
Figure 2. Water sample results
Figure 3. Shellfish sample results
Oitir Mhor Restricted Survey Report Final 17/12/09
Appendix 2
7
DRAFT
Photographs
Figure 4. Offshore fish farm (six cages and one barge)
Figure 5. Oitir Mhor Bay
Oitir Mhor Restricted Survey Report Final 17/12/09
Appendix 2
8

DRAFT
Figure 6. Fresh water stream (Fresh water sample 1)
Figure 7. Oitir Mhor Bay
Oitir Mhor Restricted Survey Report Final 17/12/09
Appendix 2
9

DRAFT
Figure 8. New unoccupied house, built in 2007
Figure 9. Oitir Mhor Bay – view from western side
Oitir Mhor Restricted Survey Report Final 17/12/09
Appendix 2
10

DRAFT
Figure 10. Fresh water stream (Fresh water sample 4)
Oitir Mhor Restricted Survey Report Final 17/12/09
Appendix 2
11

DRAFT
Figure 11. Remains of cockle, clam, razor fish, scallop and mussel shells
Figure 12. Fresh water stream (Freshwater sample 5)
Oitir Mhor Restricted Survey Report Final 17/12/09
Appendix 2
12
DRAFT
Figure 13. Oitir Mhor Bay
Figure 14. Oitir Mhor Bay (Location of water sample 8 – seawater)
Oitir Mhor Restricted Survey Report Final 17/12/09
Appendix 2
13