
Scott Pasternak - CURCcurc3r.org/wp-content/uploads/2017/04/Pasternak-Presentation... · Scott...
30
Scott Pasternak Senior Project Manager, Burns & McDonnell
Transcript of Scott Pasternak - CURCcurc3r.org/wp-content/uploads/2017/04/Pasternak-Presentation... · Scott...
Scott Pasternak Senior Project Manager,
Burns & McDonnell

CURC Campus Recycling Workshop
Scott Pasternak
October 15, 2017
3
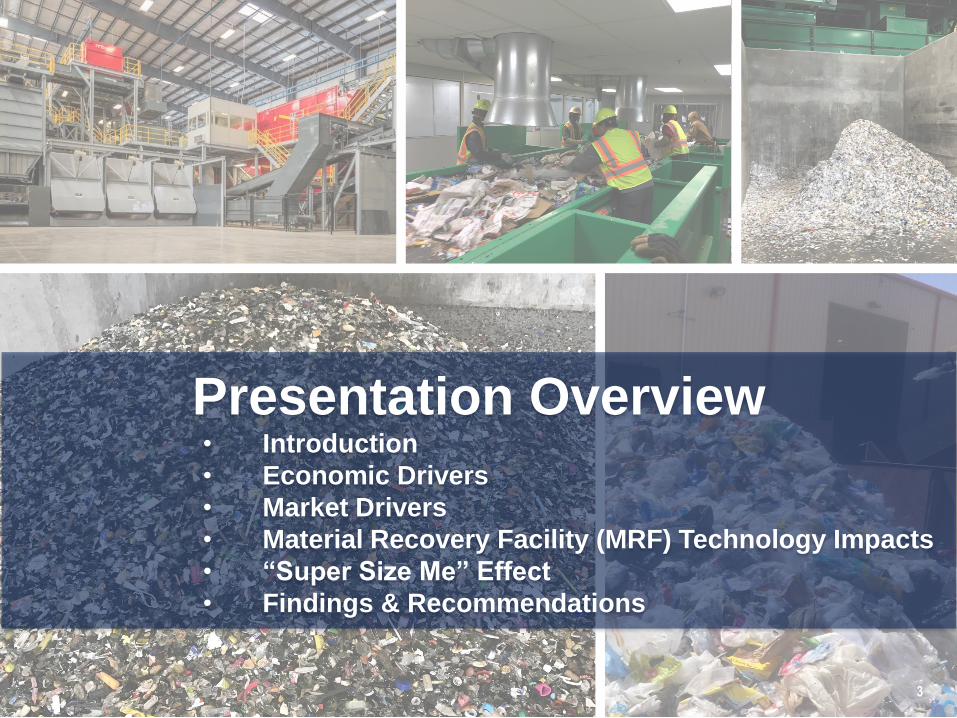
Presentation Overview • Introduction
• Economic Drivers
• Market Drivers
• Material Recovery Facility (MRF) Technology Impacts
• “Super Size Me” Effect
• Findings & Recommendations

4
Economic Drivers
► Commodity values plummeted from all time highs to historic
lows in a matter of weeks
► Crisis drove recycling processors to reconsider their financial
approach to allocate more risk to local governments
► Financial benefits to local governments have decreased due to
lower trending commodity values and higher processing fees
5
2008-2009 Market Crash: Long-term Financial Impact

6
Commodity Values Create Economic Pressure
$40.00
$50.00
$60.00
$70.00
$80.00
$90.00
$100.00
$110.00
$120.00
$130.00
$140.00
May
-11
Jul-
11
Sep
-11
No
v-11
Jan
-12
Mar
-12
May
-12
Jul-
12
Sep
-12
No
v-12
Jan
-13
Mar
-13
May
-13
Jul-
13
Sep
-13
No
v-13
Jan
-14
Mar
-14
May
-14
Jun
-14
Au
g-1
4
Oct
-14
Dec
-14
Feb
-15
Ap
r-1
5
Jun
-15
Au
g-1
5
Oct
-15
Dec
-15
Feb
-16
Ap
r-1
6
Jun
-16
Au
g-1
6
Oct
-16
Dec
-16
Rev
en
ue
pe
r In
com
ing
Ton
5-Year Average

Financial terms often include a
processing fee and revenue share
► Processing fees increasing:
compensate processors for cost
to provide service, current typical
range of $60–90 per ton;
compared to $30 – 40 prior to
2008
► Revenue share increasing:
Based on market prices for
recyclable materials, typical
range of 40–90 percent; but
values typically less than in 2008
7
The Cost of Contamination
CONTAMINATION IS EXPENSIVE
Paying $60 – $90 per ton to
process trash
Zero revenue is generated
from contamination
Costs to transport to landfill
and dispose

8
Market Drivers

9
Factors That Impact Commodity Values
Value of the US Dollar
Oil Prices
Recovering Economy
China

► National Sword: China proposed to ban 24 material types by
December 31, 2017
• “Plastic waste from living sources”
• “Unsorted waste paper”
► No one really knows what will happen - lots of
speculation and guessing
1 0
What is Happing in China?
Material Percentage of U. S. Material Shipped to China in 2015
Paper 25%
Plastic Bottles 20%
Non-bottle Rigid Plastics 33%

1 1
Perspective on Recycling in China
Only 2 percent of material currently recycled in China = lots of potential for China to develop domestic sources
China developing more process capability in long term
China mills presently buying domestic paper at $500 per ton; unhappy with National Sword
US pricing for same material has ranged from $100 – $230 in 2017
Government driven, not market driven
1 2
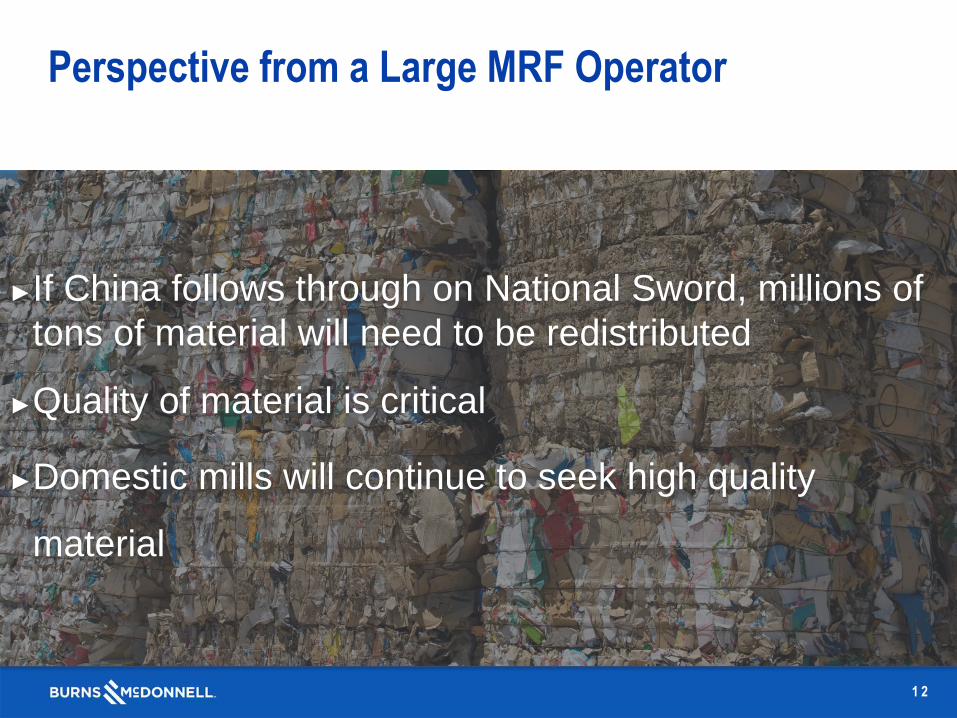
Perspective from a Large MRF Operator
►If China follows through on National Sword, millions of
tons of material will need to be redistributed
►Quality of material is critical
►Domestic mills will continue to seek high quality
material
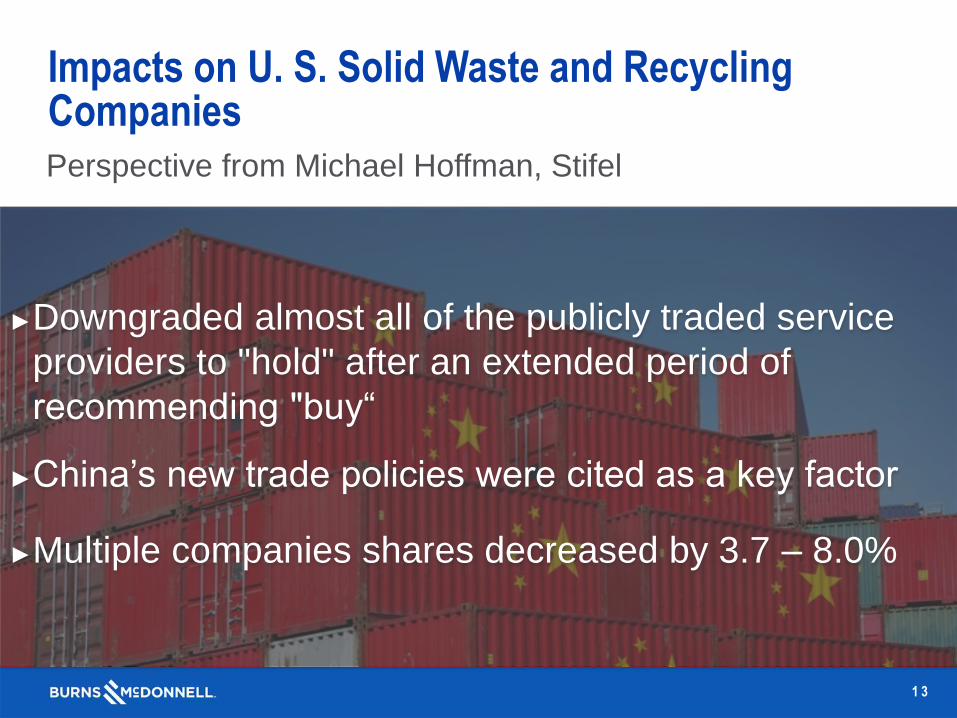
Perspective from Michael Hoffman, Stifel
1 3
Impacts on U. S. Solid Waste and Recycling Companies
►Downgraded almost all of the publicly traded service
providers to "hold" after an extended period of
recommending "buy“
►China’s new trade policies were cited as a key factor
►Multiple companies shares decreased by 3.7 – 8.0%

1 4
MRF Technology Impacts

15
16
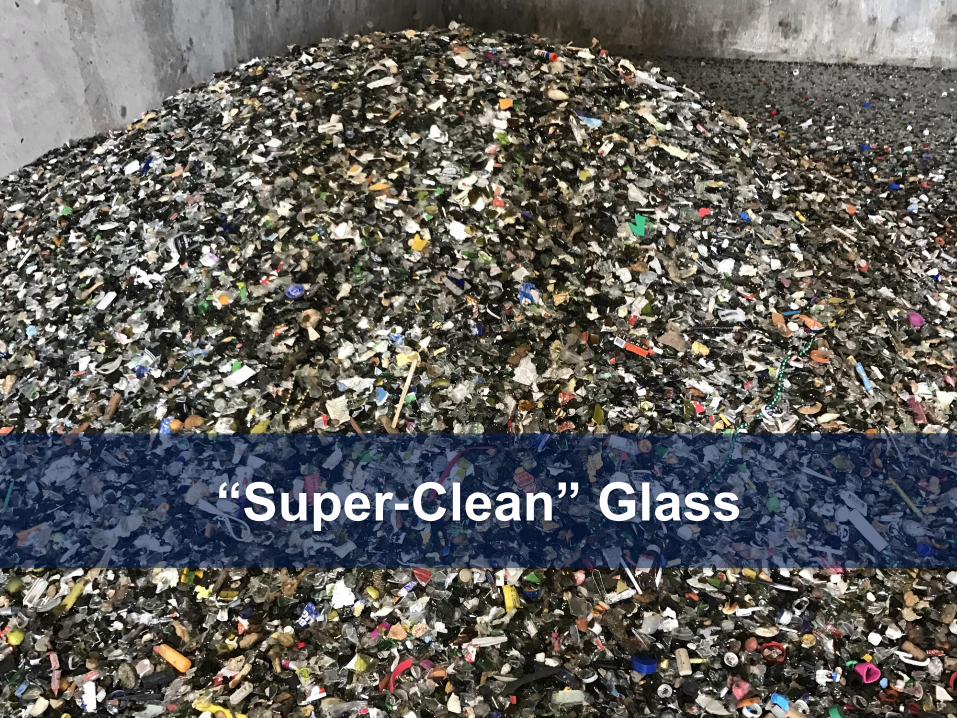
“Super-Clean” Glass
17
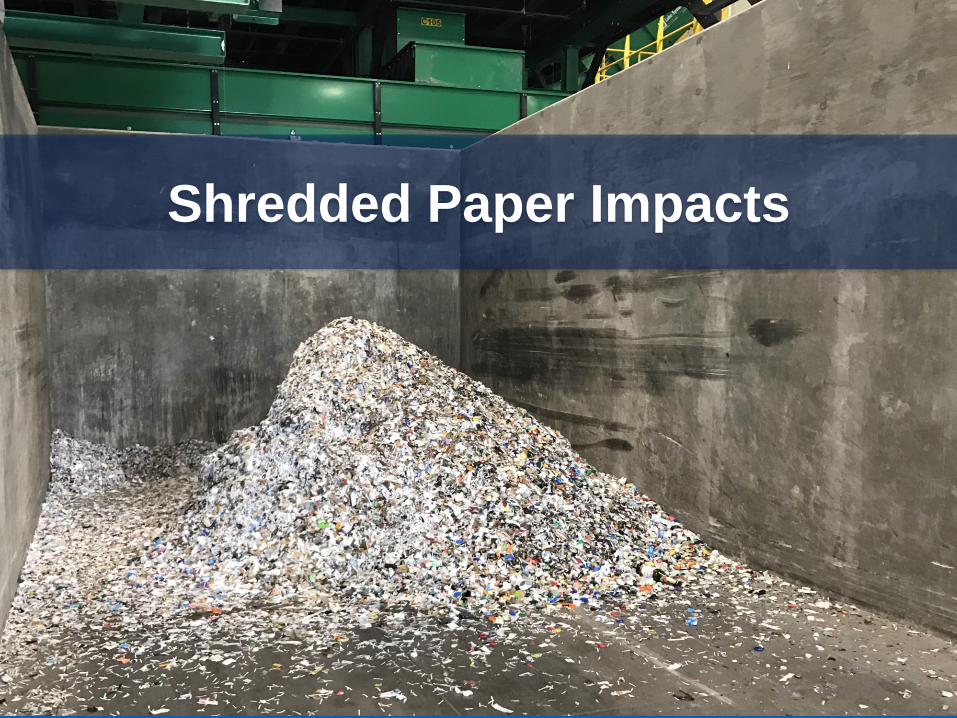
Shredded Paper Impacts

1 8
“Super Size Me” Effect
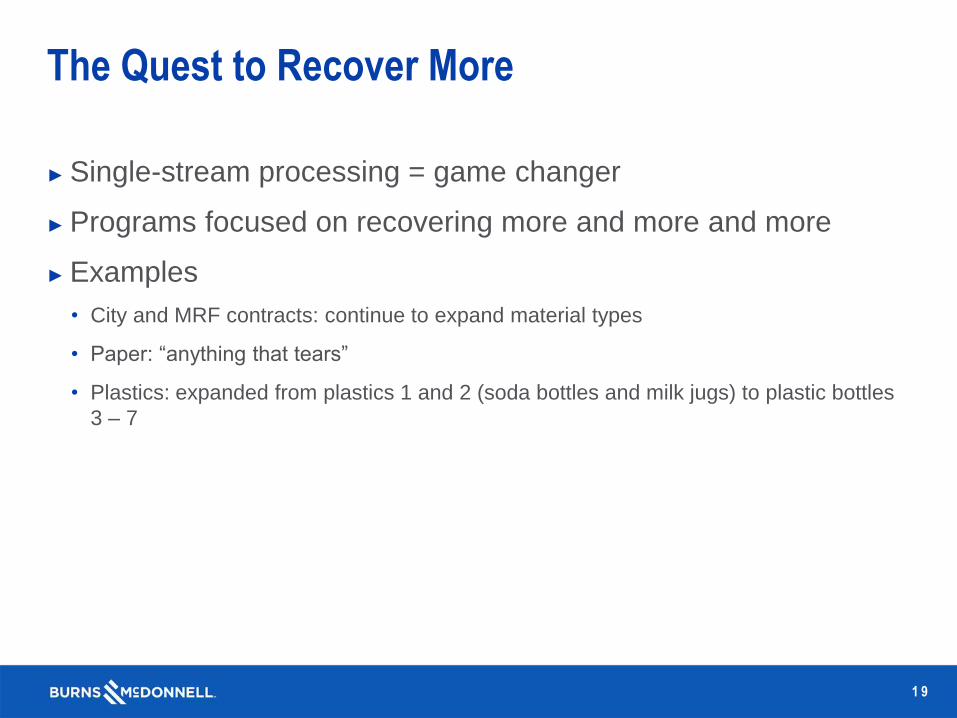
► Single-stream processing = game changer
► Programs focused on recovering more and more and more
► Examples
• City and MRF contracts: continue to expand material types
• Paper: “anything that tears”
• Plastics: expanded from plastics 1 and 2 (soda bottles and milk jugs) to plastic bottles
3 – 7
1 9
The Quest to Recover More

2 0

2 1
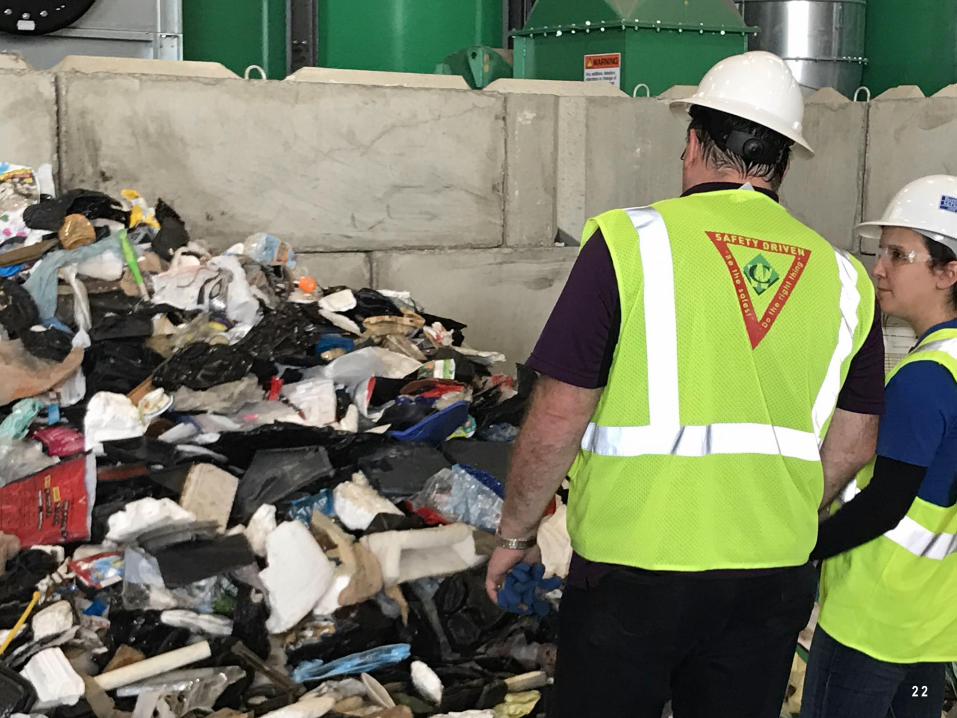
2 2

23
Benefits of Removing Plastic Bags

2 4
Findings & Recommendations

2 5
Keys to Successful Campus, Multi-Family
and Commercial Recycling Programs
► Public education
► Convenient access
► Performance measures
► Management buy-In
► Conduct waste audits and
workshops for businesses
to focus recycling
programs

► Contamination allowance much lower for organics, compared to single stream
► Decide whether to focus on pre-consumer vs. post consumer
► Some compost operators have stopped servicing customers with high contamination levels
► Use of visual aides critical
2 6
Organics

2 7

Thank you to our Sponsors!
Workshop Partners