Scotland analysis: Macroeconomic and fiscal performance - Gov.uk
124
Scotland analysis: Macroeconomic and fscal performance September 2013
Transcript of Scotland analysis: Macroeconomic and fiscal performance - Gov.uk

Scotland analysis Macroeconomic and fiscal performance
September 2013
Scotland analysis Macroeconomic and fiscal
performance
Presented to Parliamentby the Chief Secretary to the Treasury
by Command of Her MajestySeptember 2013
Cm 8694
pound3000
copy Crown copyright 2013
You may re-use this information (excluding logos) free of charge in any format or medium under the terms of the Open Government Licence To view this licence visit wwwnationalarchivesgovukdocopenshygovernment-licence or e-mail psinationalarchivesgsigovuk
Where we have identified any third party copyright information you will need to obtain permission from the copyright holders concerned
Any enquiries regarding this publication should be sent to us at The Correspondence and Enquiry Unit HM Treasury 1 Horse Guards Road London SW1A 2HQ
This publication is available for download from wwwgovukscotlandanalysis
ISBN 9780101869423
Printed in the UK by The Stationery Office Limited on behalf of the Controller of Her Majestyrsquos Stationery Office
ID 2582158 0913
Printed on paper containing 75 recycled fibre content minimum
Contents
Executive summary 5
Introduction 11
Chapter 1 An integrated economic union 15
Chapter 2 The UKrsquos integrated fiscal model 33
Chapter 3 The border effect 53
Chapter 4 Managing volatility in the public finances 69
Chapter 5 Conclusion 85
Annex A Scotlandrsquos economic performance as part of the UK 89
Annex B Scotlandrsquos tax and spending as part of the UK 105
Annex C Modelling the effect of the border 118
Annex D References 124
Executive summary
In September 2014 people in Scotland will take one of the most important decisions in the history of Scotland and the whole of the United Kingdom (UK) ndash whether to stay in the UK or leave it and become a new separate and independent state In advance of the referendum the UK Government will ensure through the Scotland analysis programme that the debate is properly informed by analysis and that the facts crucial to considering Scotlandrsquos future are set out
This paper sets out the role of economic and fiscal integration in shaping Scotlandrsquos economic performance as part of the UK and describes some of the potential economic and fiscal consequences of independence It follows the fourth paper in the Scotland analysis series Scotland analysis Business and microeconomic framework which sets out how the UKrsquos domestic market is a key part of Scotlandrsquos successful business environment
The economic benefits of integration shared opportunities pooled risk Integration is at the heart of the economic fiscal and political union between Scotland and the rest of the UK and produces tangible benefits for Scotlandrsquos macroeconomic performance The UKrsquos domestic market allows for the free movement of goods and services labour and capital to all parts of the UK The freedom to trade goods and services across the UK supports greater productivity through knowledge sharing specialisation and economies of scale There are significant trade flows across the UK in 2011 Scotland exported pound36 billion worth of goods and services to the rest of the UK and imported pound49 billion from the rest of the UK1
Workers can easily move throughout the UK helping to match individuals and jobs and to alleviate unemployment in particular areas in times of economic difficulty In 2011 33000 people of working age moved from the rest of the UK to Scotland and another 35000 moved in the opposite direction demonstrating the flexibility and ease of movement that the UK provides to people of working age2 Based on current data it is estimated over half a million people born in England Northern Ireland and Wales now live in Scotland and over 700000 people born in Scotland have moved to other parts of the UK3
Integrated capital markets across the UK ensure the best and most profitable investments gain access to finance Scottish holdings of assets in the rest of the UK diversifies risk reducing the impact of a Scotland-specific downturn on incomes in Scotland And Scotland is a more attractive place to invest because it is part of the UK domestic market meaning companies
1 Scottish Government Scottish National Accounts Project Quarterly National Accounts 2012 Q3 2 General Register Office for Scotland 3 2001 Census
6 Scotland analysis Macroeconomic and fiscal performance
investing in Scotland have access to a large market and diverse and skilled labour force Scotland was the most successful part of the UK outside London in attracting foreign direct investment in 2012
Scotlandrsquos economic performance as part of the UK The benefits of this deep economic integration can be seen in Scotlandrsquos economic performance as a part of the UK The performance of the Scottish economy is similar to that of the UK as a whole On average a worker in Scotland produces almost exactly the same as a worker in the rest of the UK4 Scotland has the third highest economic output per person of all parts of the UK behind only London and the South East of England5 While Londonrsquos performance is very strong it is in line with the stronger performing Scottish cities The annual growth in the cash value of economic output per person from 1995 to 2011 was 49 per cent in London 50 per cent in Glasgow City and 44 per cent in both the City of Edinburgh and Aberdeen and Aberdeenshire And Scottish output per person is closer to the overall UK average than any other part of the UK Since 1963 growth in economic output per person has been slightly stronger in Scotland than in the UK averaging 20 per cent in Scotland and 19 per cent in the UK overall 6 Differences in employment rates between the UK and Scotland have narrowed over time the latest data show that the employment rate in Scotland is now higher than the UK at 719 per cent compared with 714 per cent7
Scotland has performed well relative to comparable independent countries 8 Scotland has very slightly higher economic output per person than Denmark and Finland significantly higher than Portugal and not far behind Austria Ireland and Sweden Having been weaker in the 1970s and 1980s growth in output per person is above the median for comparable independent countries over the 1990s and 2000s9 Over the last 20 years Scotland has maintained a significantly higher employment rate than the median of these countries10
Scotlandrsquos economy has particular strengths in a number of sectors such as energy (including North Sea oil and gas) and finance However these sectors are comparatively vulnerable to economic shocks which has a significant impact on Scottish economic and fiscal performance year-to-year The integration of the Scottish economy into the larger and more diverse UK economy shields the Scottish economy from the damaging effects of economic volatility and limits the impact of global crises Scotlandrsquos growth has avoided some of the volatility observed elsewhere in comparable European countries A much more severe impact has been observed in smaller open economies that are more exposed to economic volatility the majority of which experienced deeper recessions than Scotland11
Scotlandrsquos fiscal position as part of the UK The similarity of Scotlandrsquos economic performance to the UK as a whole is reflected in the amount of tax that Scotland generates Scottish onshore tax revenues per person have been only slightly lower than the UK average since devolution in 1998 Over the same time period
4 ONS Regional Labour Productivity 5 ONS Regional Gross Value Added 6 Scottish Government GDP Statistical Bulletin (2010 Q1 and 2013 Q1) ONS UK Real GVA excluding North Sea
oil and gas (KLH7 and UIZY) ONS Mid-year population estimates General Register Office for Scotland 7 ONS Labour Market Statistics (July 2013) Labour Force Survey 8 Austria Denmark Finland Ireland Luxembourg Portugal and Sweden as identified by the Scottish
Government for their economic growth target 9 OECD National Accounts Statistics GVA at basic prices Scottish Government GDP Statistical Bulletin 10 Eurostat OECD ONS Labour Market Statistics 11 Eurostat Scottish Government Quarterly GDP (2013 Q1)
Executive summary 7
public spending per person in Scotland has been around 10 per cent higher than the UK average Therefore Scotlandrsquos notional onshore fiscal balance has been considerably weaker than the UKrsquos over the same timeframe In the event of independence the allocation of North Sea oil and gas revenues would be subject to negotiation On the basis of a geographical apportionment Scotlandrsquos notional fiscal balance for the period since devolution is very similar to the UKrsquos public finances over the same period12
North Sea oil and gas receipts are commonly one of the most volatile sources of revenue Since devolution Scotlandrsquos geographical share of North Sea oil and gas receipts has fluctuated between pound2 billion and pound12 billion from 24 per cent to 83 per cent of Scottish GDP Based on the earliest available data Scottish receipts since 1981-82 have been almost twice as volatile as UK-wide receipts while Scottish public spending has been just as stable13
Volatility in spending and tax revenues in Scotland and the UK 70
00
10
20
30
40
50
60
2 ndash1
11al 20
re
toin ch
ange
2 ndash8
8119
te
d sp
endi
ng
abso
lue
rag
e anA
v ts
ceip
re
Receipts volatility Spending volatility
UK Scotland UK Scotland
37
61
30 28
Source Scottish Government GERS HM Treasury calculations
The UKrsquos broader and more diverse tax base helps maintain the stability of public spending in Scotland and smooth the impact of volatile sources of revenue such as North Sea oil and gasThe high degree of fiscal integration across the UK means that fiscal resources can easily be deployed in response to shocks in individual parts of the UK For example there is no requirement that spending on pensions in Scotland need fall if oil revenues fall
This is the UK fiscal model in action diffusing the volatility of Scottish receipts across the UK while providing stability and security on public spending Through the pooling of major tax revenues across the UK Scotland therefore contributes a volatile revenue stream from North Sea oil and gas in return for secure and stable funding from the UK Government
The fiscal model protects Scotland from a more difficult set of fiscal choices In the absence of shared public finances in 2009-10 ndash in the aftermath of a halving of North Sea oil and gas revenues14 ndash Scotland would have faced a choice between implementing immediate spending cuts of pound6 billion (which equates to half Scotlandrsquos health budget) increasing other taxes by this amount or absorbing this volatility in its budget deficit As a small independent country Scotland would have less flexibility to absorb shocks of this kind in its budget deficit than the UK as it would be likely to pay higher borrowing costs
12 Scottish Government GERS (for all figures in this paragraph) 13 This is the impact of year-on-year volatility but in addition independent analysts expect North Sea oil and gas
revenues to decline over time which would require other taxes to increase by the same amount to maintain the same level of public spending
14 HM Revenue amp Customs Government revenues from UK oil and gas production
8 Scotland analysis Macroeconomic and fiscal performance
The economic consequences of independence the ldquoborder effectrdquo In the event of a vote for independence Scotland would leave the UK and a separate Scottish state would have to establish its own macroeconomic and institutional framework Institutional and policy divergence between Scotland and the continuing UK would be likely to lead to a weakening of economic integration And over the longer-term some business networks might end as a result of economic historical and cultural ties being weakened Devolution would end along with the pooling of fiscal risks across the UK the stabilising role of fiscal transfers between different parts of the UK and the ability to share costs and coordinate policies across the UK
Collectively these changes would be expected to trigger a ldquoborder effectrdquo international evidence shows that flows of trade labour and capital are much larger between two regions of the same country than between two (otherwise similar) regions of two different countries This effect occurs even when there is no physical border between countries and even where trade agreements and structures such as the European Single Market are in place The most well known example of this effect is trade between the US and Canada Independent academic evidence concludes that the border reduces trade between the US and Canada by 44 per cent15
While historical and cultural ties between an independent Scottish state and the continuing UK are likely to prevent an immediate fall off in flows evidence of previous separations points to the erosion of these ties as time passes In the case of Czechoslovakia the fall in trade shares between the two new states was very rapid Combined with regulatory divergence Scottish independence would lead to barriers to trade and obstacles to labour and capital mobility where there presently are none The choice of currency for an independent Scottish state could also introduce a barrier to trade and the Scotland analysis Currency and monetary policy paper established that the wider economic rationale for the continuing UK to enter a formal sterling union is not clear Even if the Scottish Governmentrsquos ambition of a common currency between an independent Scottish state and the continuing UK were to come to fruition the long term effect of independence on trade flows and labour mobility could still be considerable
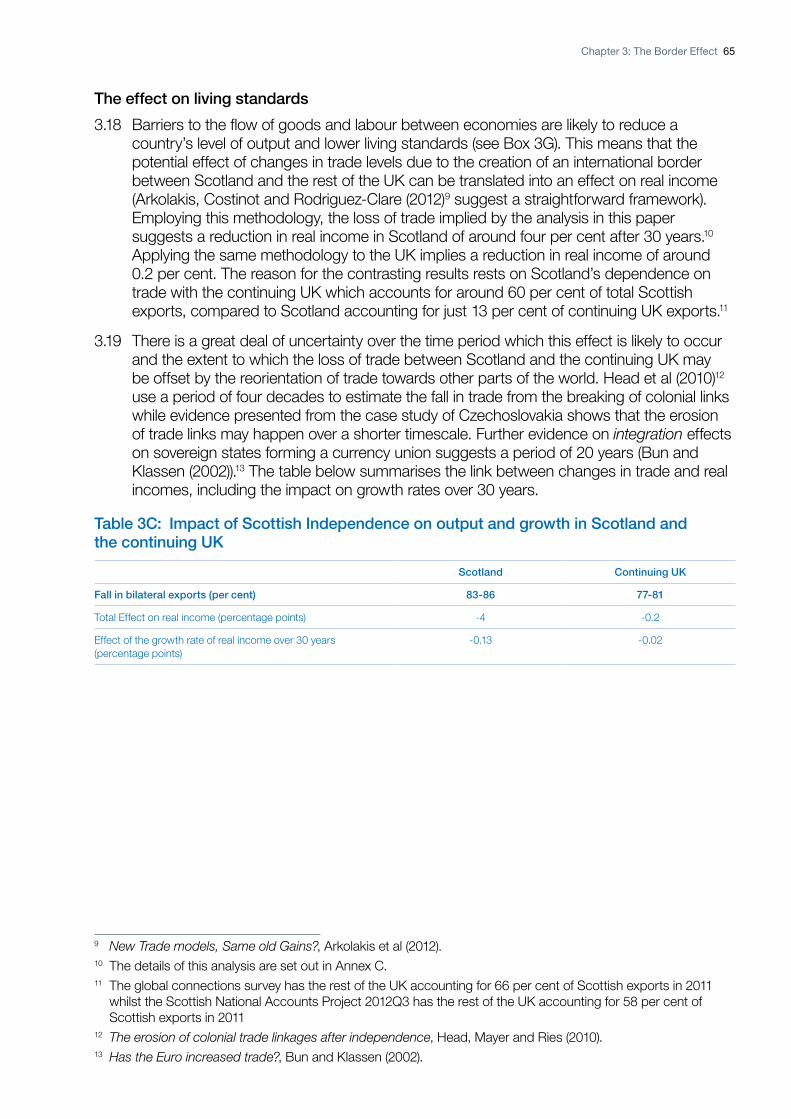
If the relationship between Scotland the rest of the UK were to become similar to that between euro area countries there would be headwinds to Scottish (and continuing UK) growth On this basis the analysis in this paper shows that as an impediment to trade flows the border is likely to reduce the level of real income in the Scottish economy by around 4 per cent after 30 years with the effect building over time The rest of the UK would also suffer from reduced trade flows but the impact on incomes would be only 02 per cent of GDP as Scotland constitutes a smaller share of total trade for the rest of the UK This analysis assumes Scotland and the UK would have the same levels of trade between them as seen between euro area countries after allowing for differences in economic size distance between countries and language The euro area has been used as the basis for comparison as these countries are part of the Single Market and share a common currency This analysis assumes however that an independent Scottish state and the continuing UK are also able to use a common currency by agreeing to form a formal sterling currency union the Scotland analysis Currency and monetary policy paper established that this is unlikely An independent Scotland could look to new markets to offset this drag on growth but it is not clear whether this would be able to compensate for the effect on trade flows with the continuing UK
15 Gravity with Gravitas A solution to the border puzzle Anderson and van Wincoop (2003)
Executive summary 9
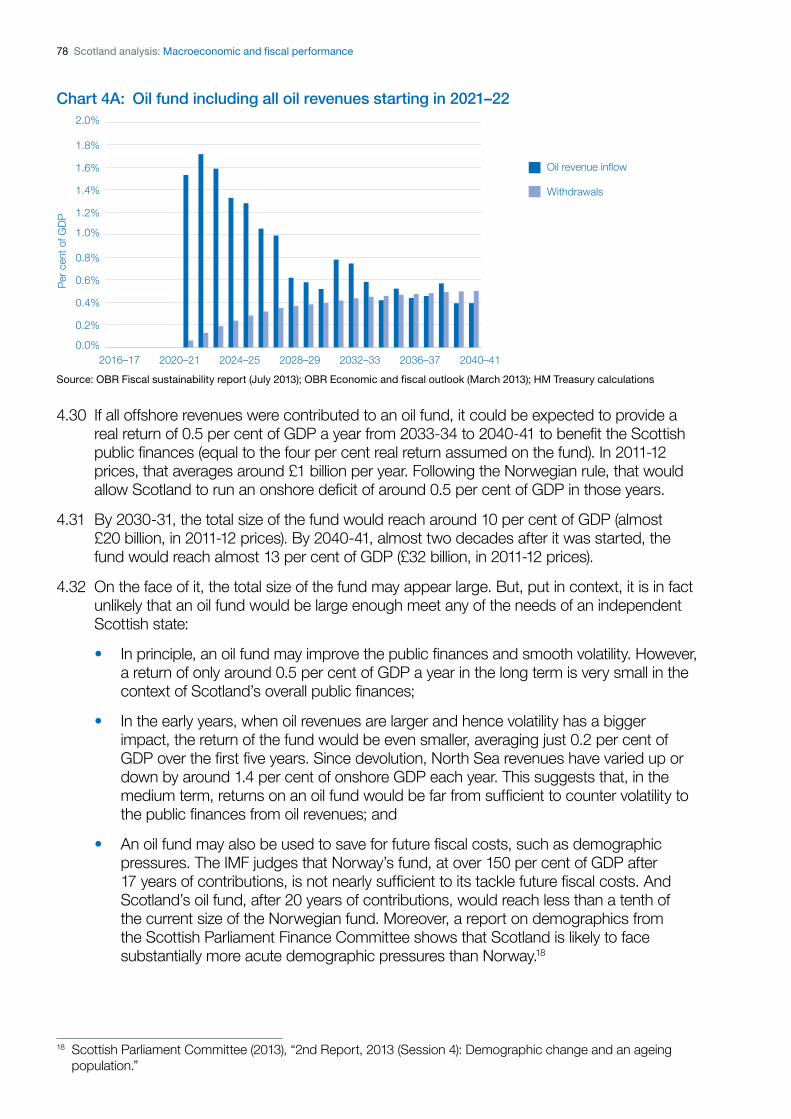
Managing volatility in the public finances the case for an oil fund In the event of independence Scotland would be directly exposed to a narrower tax revenue base and more volatile fiscal position An independent Scottish state could try to smooth its public finances and manage volatile oil and gas revenues by establishing an oil fund
While the economic rationale for an oil fund is clear for a country of Scotlandrsquos size establishing such a fund would affect the fiscal choices available to an independent Scottish state Implementing an oil fund in a similar way to Norway would imply very significant tax increases or cuts to public spending over and above the plans that have been set by the UK Government to repair the impact of the financial crisis Based on forecasts of Scotlandrsquos fiscal position in 2016-17 by the Centre for Public Policy for Regions for an independent Scotland to start an oil fund in 2016-17 from a balanced budget additional fiscal consolidation of 51 per cent of GDP16
or pound84 billion in real terms would be needed That implies nominal spending cuts of 13 per cent from current levels or onshore tax rises of 18 per cent Additional fiscal consolidation would then be required to begin making contributions to the fund17
Even if an independent Scotland were able radically to adjust fiscal policy and implement an oil fund this would not smooth all volatility in Scotlandrsquos public finances It may take considerable time to build up a fund of adequate size to manage volatility in the public finances Assuming an independent Scotland started a Norwegian-style oil fund in 2021-22 Scotlandrsquos oil fund after 20 years of contributions would reach less than a tenth of the current size of the Norwegian fund (after 17 years of contributions)18 As part of the UK Scotland achieves many of the benefits of an oil fund the UKrsquos integrated fiscal model provides a very stable flow of Scottish expenditure without the need for Scotland to run the onshore fiscal position required for an oil fund
Conclusion Integration is at the heart of the UKrsquos current economic and fiscal union playing a central role in supporting economic performance and fiscal sustainability Crucially it allows the free flow of goods services labour and capital The performance of the Scottish economy has been strong as part of the UK and in comparison to a set of small independent countries The fiscal model has allowed Scotland to maintain stable public spending per capita while contributing a fair share to revenues through onshore taxes and the substantial but volatile revenues from North Sea oil and gas
Independence would fundamentally transform and fragment this relationship The pooling of fiscal resources and risk-sharing between Scotland and the rest of the UK would end immediately And over the longer term as the institutions and structures of the two economies diverged the mutually beneficial flows of trade labour and capital would be lower than if Scotland were to remain a part of the UK
16 Centre for Public Policy for Regions Analysis of Scotlandrsquos Past and Future Fiscal Position (March 2013) 17 Scottish Government GERS 18 HM Treasury calculation based on data from the Office for Budget Responsibility Economic and fiscal outlook
(March 2013) Office for Budget Responsibility Fiscal sustainability report (July 2013) Norwegian Ministry of Finance website
Introduction
The objective of the UK Governmentrsquos Scotland analysis programme is to provide comprehensive and detailed analysis of Scotlandrsquos place in the UK and how that would be affected by independence The outputs of the analysis will provide sources of information and aim to enhance understanding on the key issues relating to the referendum As such the programme should be a major contribution to the independence debate
The 300 year union between Scotland and the rest of the UK has resulted in deep economic integration Bringing this union to an end would have considerable implications for the economic relationship between an independent Scottish state and the continuing UK The UK Government believes that Scotland is better off as part of the UK and that the UK is stronger with Scotland as part of it
This is the fifth paper in the Scotland analysis series It sets out the role of economic and fiscal integration in shaping Scotlandrsquos economic performance as part of the UK and describes the potential macroeconomic impact of independence It follows the fourth paper in the Scotland analysis series Scotland analysis Business and microeconomic framework which sets out how the UKrsquos domestic market is a key part of Scotlandrsquos successful business environment
The first paper in the series Scotland analysis Devolution and the implications of Scottish Independence examines the UKrsquos constitutional setup and the legal implications of independence Scotland would become an entirely new state The remainder of the UK would continue as before retaining the rights and obligations of the UK as it currently stands As a new state an independent Scotland would be required to apply to andor negotiate to become a member of whichever international organisations it wished to join and would need to seek new institutional arrangements
The second paper Scotland analysis Currency and monetary policy shows how the current currency and monetary policy arrangements within the UK serve Scotland well A move away from the current arrangements would require a set of decisions that would affect the wider management of the economy not only the currency but also the setting of monetary and fiscal policy The status quo would not be one of the options The analysis in this paper concludes that all of the alternative currency arrangements would be likely to be less economically suitable for both Scotland and the rest of the UK
The third paper Scotland analysis Financial services and banking shows that Scotland has a strong and vibrant financial services industry As part of the UK firms and individuals benefit from a world-leading financial services sector and a large integrated domestic market for financial services with clear and effective arrangements for protecting consumers This position would be put at risk if Scotland were to become independent fragmenting the market and the
12 Scotland analysis Macroeconomic and fiscal performance
bodies that have been put in place to protect customers
The fourth paper Scotland analysis Business and microeconomic framework shows that effective common regulations and institutions a unified labour market a shared knowledge base and integrated infrastructures are central to the success of the unified domestic market However much an independent Scottish state sought to stay aligned with regulations and institutions in the continuing UK a single market between two separate states is not the same as a fully integrated domestic market Divergence and fragmentation would be likely to lead to short-term and long-term costs and prolonged uncertainties for businesses and consumers
Structure of the paper Chapter 1 outlines the performance of the Scottish economy as part of the UK and investigates the role of economic integration in shaping Scotlandrsquos economic performance
Chapter 2 describes the UKrsquos single fiscal model and the role this plays in stabilising Scotlandrsquos public finances maintaining public spending in Scotland and providing automatic transfers across the UK especially in welfare and pensions spending
Chapter 3 discusses the effects of creating an international border between an independent Scotland and the continuing UK on movements of trade labour and capital between Scotland and the continuing UK
Chapter 4 discusses the case for an independent Scotland establishing an oil fund and the fiscal implications of setting up such a fund
Annex A describes Scotlandrsquos economic performance as part of the UK over the past four decades and assesses it against performance for the UK as a whole and for a set of independent comparable countries
Annex B describes Scotlandrsquos public finances as part of the UK
Annex C explains the approach that has been taken to modelling the potential impact of independence on trade labour and capital flows and summarises the literature on the ldquoborder effectrdquo
Chapter 1 An integrated economic union
Over the past 300 years the UK economy has become increasingly integrated and interconnected Scottish growth has contributed to and benefited from access to the large and diverse UK economy The UK provides a large stable and diverse economic environment in which Scottish businesses have thrived and which is very attractive to foreign investors A large domestic market is a crucial aspect of this environment and businesses and consumers benefit from the free flow of goods services labour and capital The domestic market is supported by a UK-wide system of tax and regulation as well as a single labour market a common knowledge base and integrated infrastructure This produces tangible benefits for Scotlandrsquos macroeconomic performance
Economic integration has brought benefits to all parts of the UK including Scotland The performance of the Scottish economy is similar to that of the UK as a whole Despite weaker performance in the 1970s and 1980s output per person in the Scottish economy has grown faster than the median for comparable independent countries since 1990
Integration with the UK economy also helps protect the Scottish economy from the damaging effects of economic volatility and the extremes of global financial crisis A much more severe impact from the recent global recession has been observed in smaller open economies that are more exposed to economic volatility During the financial crisis Iceland Ireland and Cyprus were exposed to large banking sectors which dwarfed their national wealth And in the recession that followed the financial crisis Spain and Italy were subject to volatile international financial markets compounding a weakening of their public finances
16 Scotland analysis Macroeconomic and fiscal performance
Economic alignment between Scotland and the rest of the UK Scotlandrsquos economic performance
11 Across a range of measures the performance of the Scottish economy is similar to the economy of the whole UK1 Economic output per head and output per worker are almost exactly equal to the UK average and both the industrial structure and income distribution of output are very similar to those for the UK as a whole Conditions in the Scottish labour market are also very well aligned with UK average conditions Poorer economic growth in the 1970s and into the 1980s was reversed in the 1990s and 2000s growth in output per head is above the median for a set of independent comparable countries over the 1990s and 2000s
12 Scotland is one of the strongest performing parts of the UK As shown in Chart 1A in 2011 output2 per person was pound20511 for Scotland compared with an average of pound20873 across the UK3 and behind only London and the South East
Chart 1A Onshore economic output per head of nations and regions (2011)
London
South East
UK excluding extra regio
Scotland
East
South West
UK ex London extra regio
East Midlands
North West
West Midlands
Yorkshire amp the Humber
Northern Ireland
Wales
North East
0 10000 20000 30000 40000
GVA per capita (pound) excluding extra regio 2011
Source ONS Regional Gross Value Added (December 2012) HMT calculation for UK excluding London
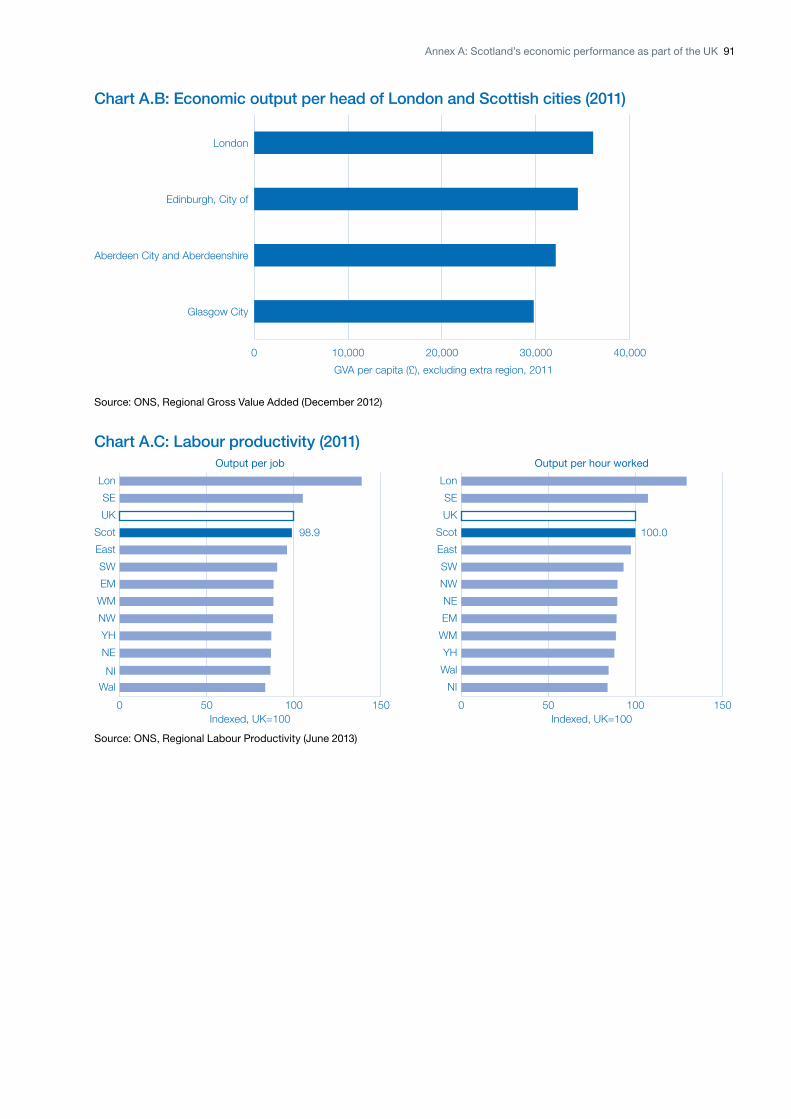
13 The outlying performance of London reflects its status as an international city and global financial centre But as the Scotland analysis Financial services and banking paper explained Scotlandrsquos successful financial centre has also benefited from the lsquocluster effectrsquo of its location in the UK economy Scotlandrsquos economic performance is superior to the rest of the UK when London is excluded Further while Londonrsquos performance is very strong Chart 1B shows that it is not out of line with the higher performing Scottish cities4
The annual growth in the cash value of economic output per person (known as nominal Gross Value Added (GVA))5 between 1995 and 2011 was also similar between London and
1 The analysis in this document is based upon data available up until 10 August 2013 2 Excluding North Sea oil and gas 3 ONS Regional Gross Value Added (December 2012) Extra-regio is the ONS category for output that cannot
be assigned to a specific region It includes offshore oil and gas activities 4 The Nomenclature of Units for Territorial Statistics (NUTS) is a hierarchical classification of geographical areas
London (NUTS 1) is a larger area than the Scottish cities (NUTS 3) 5 GVA is a measure of economic output Nominal means that it is not adjusted for inflation
Chapter 1 An integrated economic union 17
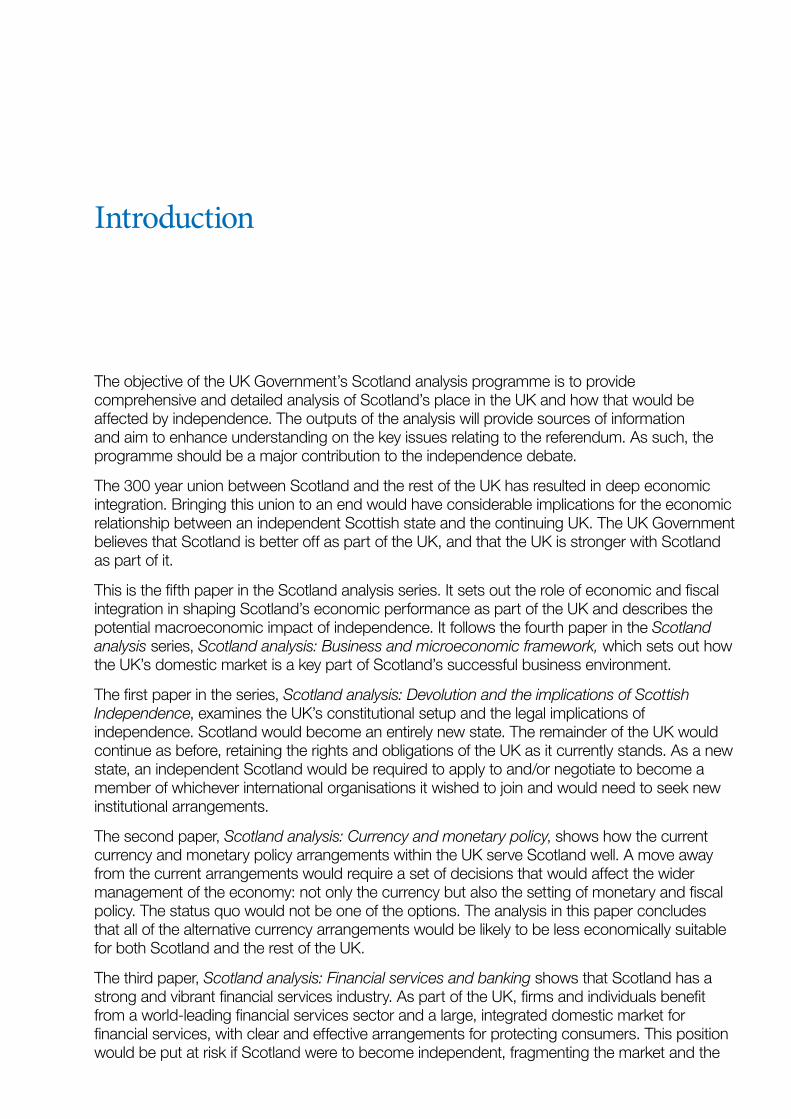
Scottish cities 49 per cent in London 50 per cent in Glasgow City and 44 per cent in the City of Edinburgh and Aberdeen and Aberdeenshire6
Chart 1B Economic output per head of London and Scottish cities (2011)
Glasgow City
Aberdeen City and Aberdeenshire
Edinburgh City of
London
0 10000 20000 30000 40000
GVA per capita (pound) excluding extra region 2011
Source ONS Regional Gross Value Added (December 2012)
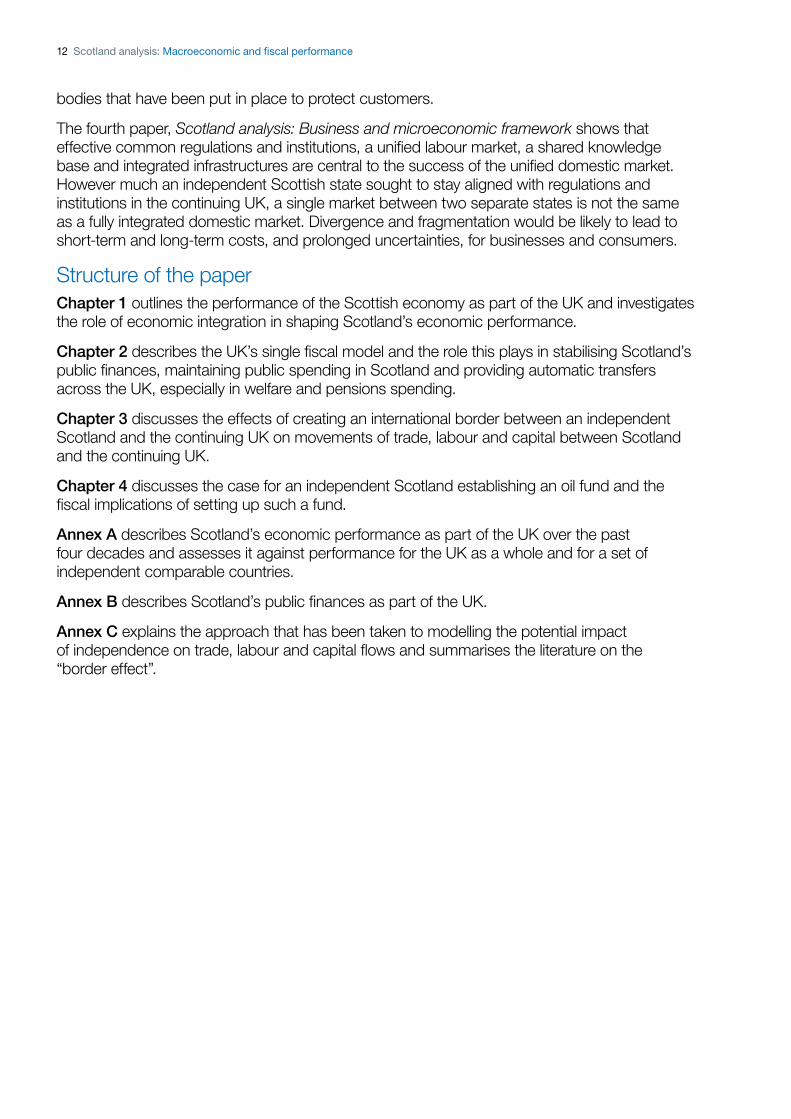
14 The strength of the Scotlandrsquos economic performance is underpinned by the productivity of its workforce As Chart 1C shows Scottish productivity levels are also extremely close to the UK average whether measuring each person employed or by the hour worked7
On average a worker in Scotland produces almost exactly the same as a worker in the rest of the UK
Chart 1C Labour productivity (2011) Output per job
Lon
SE
UK
Scot
East
SW
EM
WM
NW
YH
NE
NI Wal
989
0 50 100 150 Indexed UK=100
Output per hour worked
Lon
SE
UK
Scot 1000
East
SW
NW
NE
EM
WM
YH
Wal
NI
0 50 100 150 Indexed UK=100
Source ONS Regional Labour Productivity (June 2013)
6 ONS Regional Gross Value Added (December 2012) 7 ONS Regional Labour Productivity (June 2013)
18 Scotland analysis Macroeconomic and fiscal performance
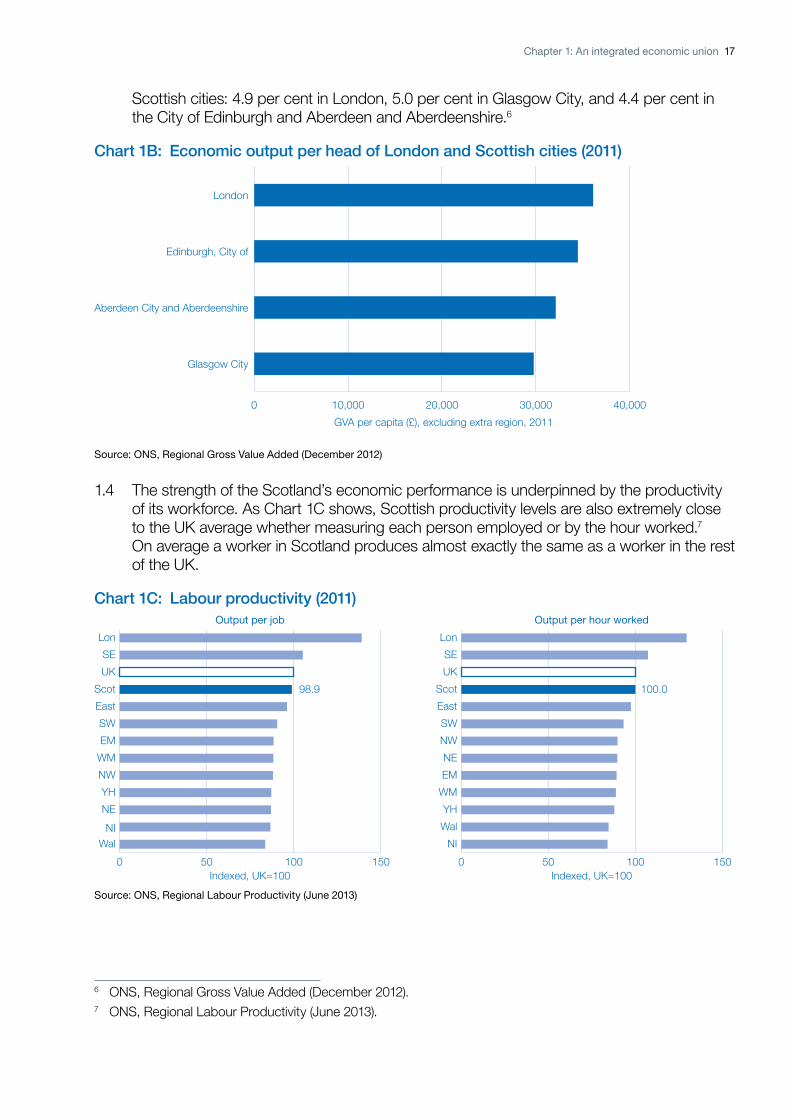
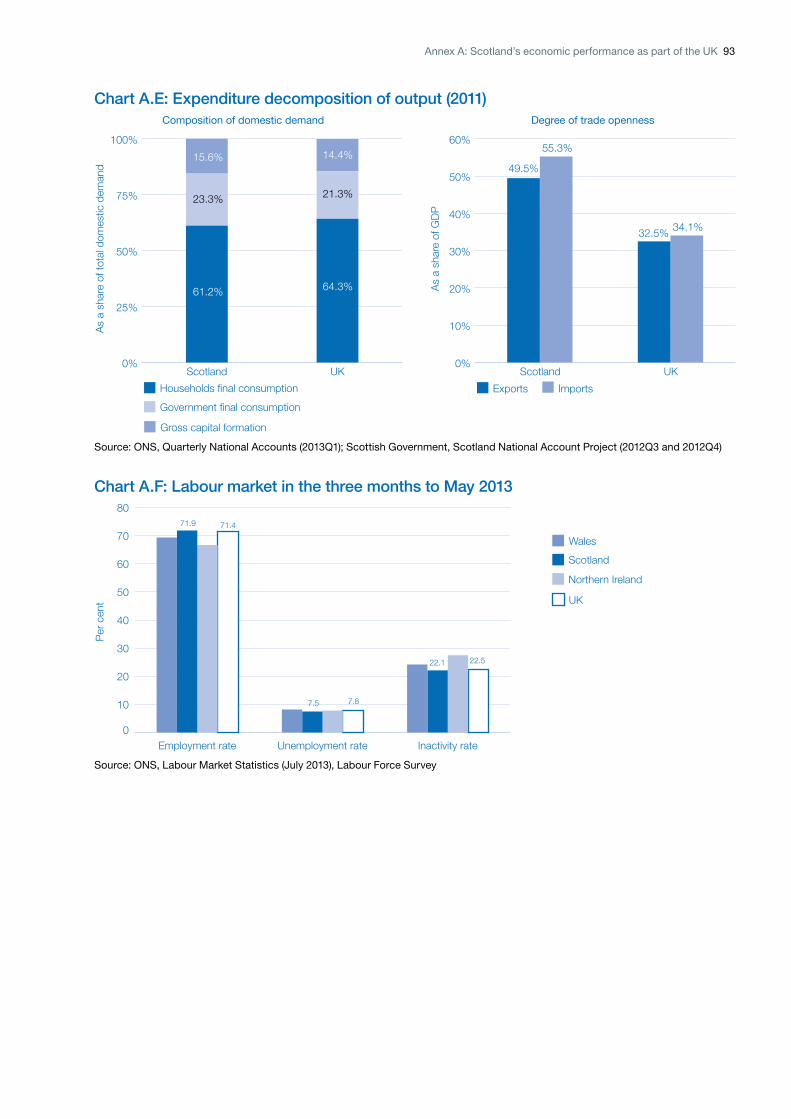
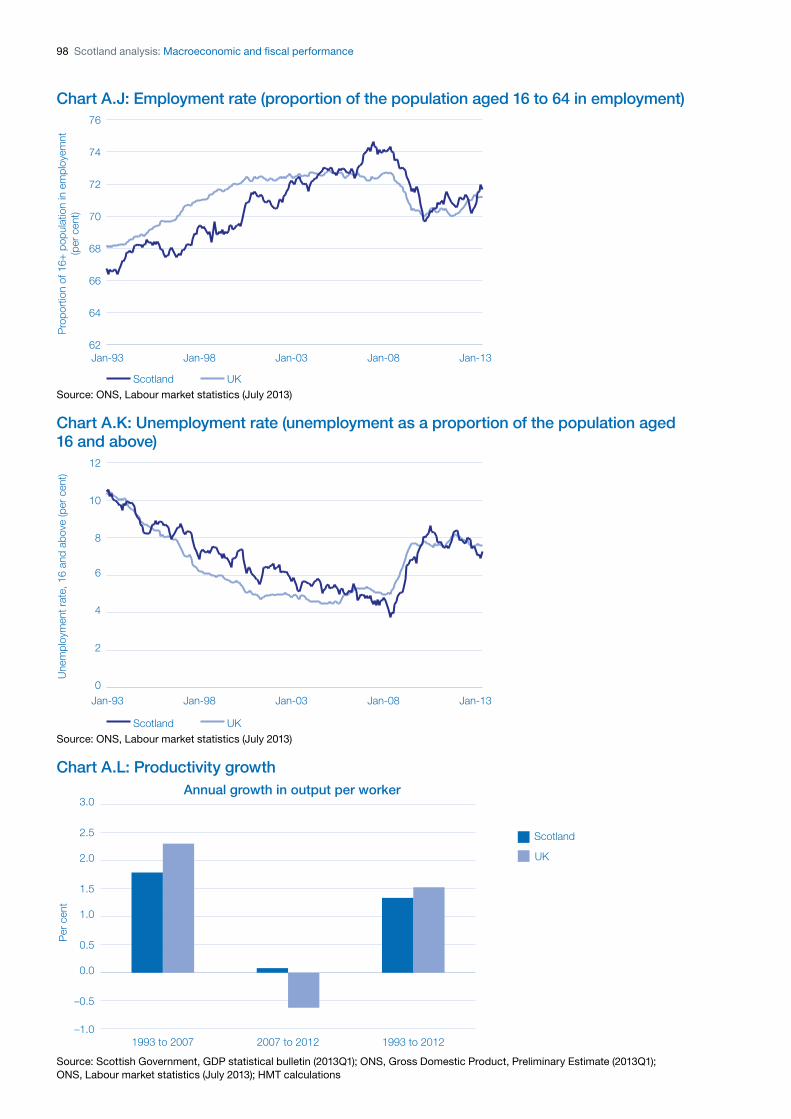
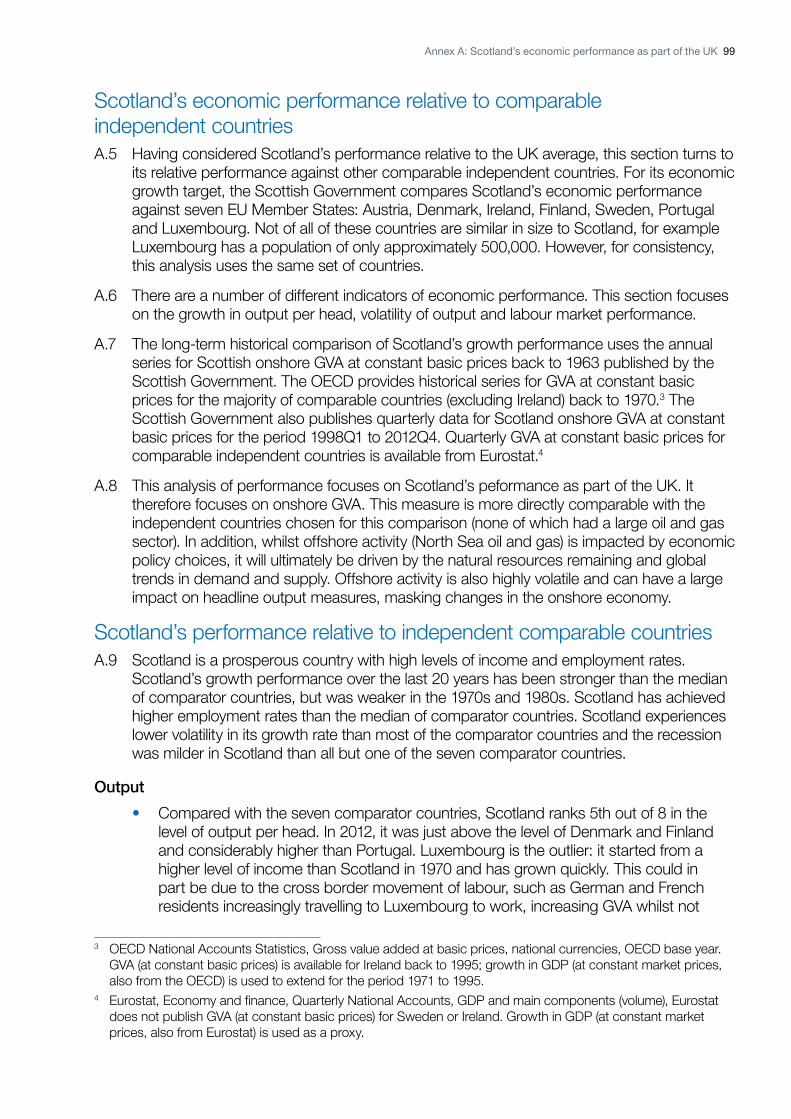
15 Conditions in the Scottish labour market are well aligned with the UK In the three months to May 2013 Scotland had a higher employment rate and a lower unemployment rate than the UK
Chart 1D Labour market in the three months to May 2013 80
719 714 70 Wales
60 Scotland
Northern Ireland 50
UK
40
30
Employment rate Unemployment rate Inactivity rate
Per
cen
t
75 78
221 225
Source ONS Labour Market Statistics (July 2013) Labour Force Survey
Scottish economic performance over time 16 Long-term trends in the Scottish economy have been very similar to UK trends and the
impact of the global financial crisis is comparable Chart 1E below compares annual growth in the volume of economic output per head for Scotland and the UK as a whole (excluding North Sea oil and gas) between 1963 and 2012 Scottish data are published by the Scottish Government as a National Statistic which means they meet the UK Statistics Authorityrsquos quality standards The current publication goes back to 1998 The longer series back to 1963 has not been updated since 2010
17 Cycles in Scotlandrsquos onshore economy have been broadly in line with the rest of the UK contracting in similar periods most notably in the mid 1970s in the early 1980s and in 2008-09 As was set out in Scotland analysis Currency and monetary policy the Scottish economy is well synchronised with the UK average The correlation in output growth rates is over 80 per cent from 1963 to 2012 The correlation in the claimant count rate between Scotland and the UK average is over 95 per cent between 1984 when data starts and 2012 Both these factors demonstrate that Scotlandrsquos growth and employment record is strongly aligned with the rest of the UK
18 Growth in Scotlandrsquos onshore economy has been similar to the UK average over this period after adjusting for the differential in population growth Average annual growth in onshore GVA per head from 1963 to 2012 was 20 per cent in Scotland compared with 19 per cent in the UK This is the main difference between the figures presented here and those presented by the Fiscal Commission Working Group who do not adjust growth rates for changes in population8 Dividing economic output by population gives a basic measure of standards of living Similarly it is important to adjust the growth in economic output for changes in population If economic growth is in line with population growth standards of living have not improved on this measure Table 1A shows onshore growth rates per head for Scotland and the UK for 1963 to 2012 and broken down by decade
0
10
20
8 Fiscal Commission Working Group First Report Macroeconomic Framework The Scottish Government 2013
Chapter 1 An integrated economic union 19
Table 1A Onshore economic growth in Scotland and the UK
Growth in GVA per head
1963-2012 1963-1970 1970-1980 1980-1990 1990-2000 2000-2012
Scotland 2 34 16 21 23 11
UK 19 24 15 25 22 11
Source Scottish Government GDP statistical bulletin (2010Q1 and 2013Q1) ONS UK real GVA excluding North Sea oil and gas (KLH7 and UIZY) ONS mid-year population estimates General Register Office for Scotland
Chart 1E Growth in onshore activity per head Scotland and the UK 10
8
ndash6
ndash4
ndash2
0
2
4
6
ndash8 1964 1974 1984 1994 2004
Scotland UK
Source Scottish Government GDP statistical bulletin (2010Q1 and 2013Q1) ONS UK real GVA excluding North Sea oil and gas (KLH7 and UIZY) ONS mid-year population estimates General Register Office for Scotland
Performance during the financial crisis 19 The recent financial crisis has highlighted serious issues in the UK economy a highly
indebted economy a poorly regulated financial system unbalanced growth across regions and an export base that is too reliant on Europe and the US UK and Scottish onshore GVA fell by -74 per cent and -56 per cent respectively (peak to trough) UK economic institutions continue to evolve in response to the financial crisis the UKrsquos macroeconomic framework provides clear governance and accountability that facilitates rapid crisis resolution This macroeconomic framework provides the underpinnings for future sustainable economic growth for both the UK and Scotland The OECD commented in its 2013 Economic Survey of the United Kingdom that the UK benefitted from a ldquostrong institutional frameworkrdquo9 Scotland has also outperformed the majority of comparitor countries The recession was larger in Ireland Denmark Finland Luxembourg Portugal and Sweden
Economic Survey of the United Kingdom 2013 OECD 9
20 Scotland analysis Macroeconomic and fiscal performance
Chart 1F Impact of the recession
92
94
96
98
100
Comparable country median
UK excl oil and gas
Quarters after peak in output
UK
Scotland
20151050
Rea
l GVA
ind
ex (P
eak=
100)
Source Scottish Government GDP statistical bulletin (2013Q1) ONS Gross Domestic Product Preliminary Estimate (2013Q2) Eurostat
110 Given the similarities in economic structures and cyclical position it is likely that the Scottish economy will recover from the recession on a similar trajectory to that forecast for the UK Recent economic data show that the UK recovery is strengthening with broad based growth across all sectors of the economy Long-term economic trends are also expected to be comparable although faster population ageing in Scotland is likely to weigh on long-term growth by restricting the growth in labour supply
Including North Sea oil and gas111 Including offshore production there is a clear structural difference between the Scottish
economy and the economy of the rest of the UK
Chart 1G Size and composition of the Scottish and UK economies
Scotland Rest of the UK UK
Other industries
Finance and insurance activities
Mining and quarrying
Source ONS Regional Gross Value Added (December 2012) Workplace based GVA by industry groups at current basic prices Scottish shares of extra regio GVA used for these calculations 90 of mining and quarrying GVA and 8 of public administation and defence GVA
112 In the event of independence the allocation of the UKrsquos oil and gas reserves would have to be negotiated between a separate Scottish state and the continuing UK The Scottish Government produces estimates of the contribution of a geographical share of North Sea oil and gas to the value of Scottish output According to these estimates North Sea oil and gas has contributed between 9 per cent and 18 per cent of total Scottish output between 1998 and 2012 Under this assumption Scottish output per capita would be above the UK average However as discussed in Box 1A as much of North Sea oil and gas profits are remitted abroad Scottish residents do not benefit from the total output of North Sea oil and gas
Chapter 1 An integrated economic union 21
Box 1A The impact of North Sea oil on economic performance GDP versus GNI Allocating to Scotland a geographic share of North Sea oil and gas output increases measures of economic output However it is not clear how much of the extra income from North Sea oil and gas actually contributes to the wealth of Scottish households and businesses as opposed to foreign investors
This distinction is captured in the difference between Gross Domestic Product (the total income generated in Scotland regardless of where or to whom this income flows) and Gross National Income (the total income generated by residents of Scotland) GNI is therefore a better measure of living standards for Scottish residents The inclusion of North Sea oil and gas in output figures will not increase GNI by as much as GDP Scotland is likely to be further down international rankings of economic performance when assessed on GNI
For countries with significant amounts of foreign ownership there can be a large difference between these measures of output For example Irish GDP is 20 per cent higher than Irish GNI because of the degree of foreign ownership in Ireland In 2011 Ireland ranked 8th in the OECD on the basis of GDP per capita but to 16th on the basis of GNI per capita1
No GNI estimate is currently produced for Scotland However there are reasons why GNI could well be lower than GDP in Scotland as identified by the Centre for Public Policy for Regions (CPPR)2 Large parts of the whisky and financial services sectors are internationally owned There would also be a large difference between GNI and GDP when considering North Sea oil and gas production HM Treasury analysis shows that over two thirds of North Sea oil and gas is produced by international companies (or subsidiaries of such companies)3
As North Sea activity is mostly internationally owned and the vast majority of output is received as capital rather than labour income a large majority of total North Sea post-tax income that is not reinvested in North Sea oil and gas production is sent abroad in the form of profits on foreign investment Where this is the case it will benefit GDP but not GNI4
1 OECD statistics 2011 data has been used as GNI data for some countries is not available for 2012 New Zealand Turkey and Canada excluded from the calculation due to missing data
2 CPPR httpwwwglaacukmediamedia_275906_enpdf ldquoMeasuring a independent Scotlandrsquos economic performancerdquo Reform Scotland ldquoScotlandrsquos economic futurerdquo
3 HM Treasury analysis of Wood Mackenzie data on UK oil and gas production in 2012 4 It should be noted that where internationally owned companies have Scottish shareholders some of the
profits sent abroad would flow back into Scotland via these shareholders However in a similar way where UK owned companies have international shareholders some of the profits will flow abroad
113 As a result of a higher dependence on the North Sea Scottish output would be much more volatile as oil and gas volumes of production and prices fluctuate substantially and the depletion of North Sea reserves and progressive decline in production would be a drag on growth and put pressure on Scotlandrsquos fiscal position Both oil and gas prices and production can add significant volatility to Scottish output the impact of price fluctuations is exemplified by price changes during 2008 when the oil price fell from a high of pound67 per barrel to a low of pound27 per barrel in just six months DECC forecast that oil production (MTOE) will halve between 2013 and 2030 Valuing the remaining North Sea oil and gas reserves is discussed in Box 1B
22 Scotland analysis Macroeconomic and fiscal performance
Chart 1H Quarterly Scottish nominal GDP growth 10
-6
-4
-2
0
2
4
6
8 Scotland GDP (onshore)
Scotland GDP (including a geographical share of extra-region)
UK GDP (including extra-region)
-8 1998 2001 2004 2007 2010
Source ONS Scottish Government Scottish National Accounts Project (2012Q4)
Box 1B Valuing remaining North Sea reserves The North Sea remains a hugely valuable resource to Scotland and the whole of the UK providing employment and revenues There are a variety of approaches to quantifying the value of remaining reserves The Scottish Government has suggested that ldquoeconomic benefits [of remaining oil and gas reserves] total around pound15 trillionrdquo1 This box explores the assumptions underpinning that calculation2 The pound15 trillion figure is based on
bull An assumption that remaining reserves are in line with the most optimistic scenario estimated by Oil and Gas UK
bull An assumption that oil and gas can be extracted from the seabed costlessly Capital and operating costs are large and reflecting that fact in the valuation of remaining reserves would reduce the figure significantly More than pound1 trillion (in todayrsquos prices) is likely to be needed to extract the remaining oil and gas resources assumed by the Scottish Government
bull The oil price is assumed to apply to both oil and gas However in recent years gas which accounts for roughly 40 per cent of forecast UK oil and gas production has sold for little more than half as much as the equivalent volume of oil and
bull The figure is not calculated in ldquonet present valuerdquo terms the standard approach recommended by international statistical frameworks for the quantification of environmental assets
A recent Office for National Statistics (ONS) publication offers an independent alternative approach to valuing remaining UK Continental Shelf oil and gas reserves3 According to the ONS paper the monetary value of UK oil and gas reserves is pound120 billion as of 31 December 2011 12 times lower than the Scottish Government estimate The ONS methodology is based on the United Nationsrsquo System of Economic and Environmental Accounts consistent with the System of National Accounts It is therefore in line with statistical best practice The estimate reflects the independent Office for Budget Responsibilityrsquos central projection of oil and gas production and prices operating and capital expenditure and decommissioning costs The figure is discounted at the social discount rate to reflect the true long-term value of reserves across current and future generations
Chapter 1 An integrated economic union 23
Since UK oil and gas production peaked at the turn of the century official forecasts have consistently overestimated production demonstrating the importance of applying realism in forecasts As the CPPR comment Scottish Government claims that UK Government forecasts are too pessimistic ldquoseem odd when juxtaposed with this evidence of repeated over-prediction of production by DECC and OBR in recent yearsrdquo4
Only the tax of the profits made from North Sea oil and gas production would flow into the UK Exchequer And as explained in Box 1A a large majority of total North Sea post-tax income that is not reinvested in North Sea oil and gas production is sent abroad in the form of profits on foreign investment
1 Scottish Government evidence to House of Commons Energy and Climate Change Committee 17 April 2012
2 As set out in an answer to a Parliamentary Question (S4W-06988 answered by Fergus Ewing on 16 May 2012)
3 Office for National Statistics (2013) Monetary valuation of UK continental shelf oil amp gas reserves Available at httpwwwonsgovukonsrelenvironmentaluk-environmental-accounts2013stb-ukea-2013 htmltab-background-notes
4 CPPR (2013) ldquoReflections on the latest Oil and Gas related analysis by the Scottish Government and the Office for Budget Responsibilityrdquo
Scottish economic performance compared to similar small advanced economies 114 Scotland as part of the UK has performed as well as a comparable group of independent
countries10 Scotland has a slightly higher economic output per head than Denmark and Finland significantly higher than Portugal and not far behind Austria Ireland and Sweden While Scotlandrsquos performance had been weaker in the 1970s and 1980s growth in onshore output per head of population is close to or above the median for independent comparable countries in the 1990s and 2000s Volatility of annual growth in Scotland is below that of most other comparable countries over the same period Over the last 20 years the time period for which data is available Scotland has maintained a significantly higher employment rate than the median across comparable independent countries
115 The overall output impact of the global financial crisis (from peak in output to the latest data in 2013Q1) remained more moderate in Scotland than in a majority of independent comparable countries While the financial crisis has badly affected the Scottish economy with output falling by 56 per cent from peak to trough the depth of the recession was shallower than all but one of the independent comparable countries The recession was twice as large in Ireland which required an IMFEU assistance programme The recession was also larger in Denmark Finland Luxembourg Portugal and Sweden
116 Many small countries are successful but they experience a different set of challenges to larger countries they need to overcome barriers to trade and face reduced flexibility in their set of fiscal and monetary policy choices Alesina (2003) argues that country size is a trade-off between the benefits of size and the costs arising from reduced ability to tailor policies to the preferences of the population A number of factors make larger countries more efficient economies of scale for the provision of government services such as infrastructure economies of scale for private companies if international borders inhibit market size (Chapter 4 argues that they will over time in the event of Scottish independence) and the provision of insurance in the form of fiscal transfers should
10 Independent comparable countries are Austria Denmark Finland Ireland Luxembourg Portugal and Sweden For its economic growth target the Scottish Government compares Scotland with these 7 EU Member States
24 Scotland analysis Macroeconomic and fiscal performance
economic shocks be uneven across regions Further smaller countries tend to be more volatile possibly as a result of greater exposure to international markets11 Independence could therefore create greater swings in GDP and employment
117 Country size is not the only determinant of economic performance the richest and fastest growing countries in the world include a number of small countries such as Norway Switzerland and Singapore However small countries are generally constrained in their choices of fiscal and monetary policy One way in which countries can overcome these challenges is to trade more extensively with other countries Success in this area will be important in mitigating the substantial effects the creation of an international border is likely to have It is unclear whether the border effect can be fully offset by reorientation to other markets Small countries can also maintain tax and regulatory alignment with other trading partners small countries need to balance flexibility in adjusting policy settings and the risk of undermining economic integration Managing that risk implies that their ability to adopt markedly different policy settings is constrained
118 Small countries tend to run relatively prudent fiscal policy In many cases running fiscal surpluses to build up reserves to ensure they are resilient to external shocks and to maintain access to international capital markets when needed Even then prudent fiscal policy has proved insufficient in some smaller euro area Member States to prevent funding problems in the recent financial crisis It would take time for Scotland to adjust its policy settings there would likely be significant costs for Scotland in both shifting to a position of fiscal surplus and in managing economic volatility in particular in the years following independence Smaller countries also generally have to place a much higher consideration on managing volatility when considering currency regime fixed or pegged exchange rates would provide low transactions costs which could help Scotland to overcome a border effect but this could be at the cost of flexibility needed to manage economic volatility An independent Scotlandrsquos currency choices are discussed more fully in Scotland analysis Currency and monetary policy
119 Annex A provides further detail on how economic outcomes in Scotland compare with those in the rest of the United Kingdom
Benefits of economic integration for economic performance 120 Over the past 50 years groups of countries have gone to great lengths to reinforce
their economic integration with one another in order to support economic growth and stability This can be seen in Europe starting with the creation of the European Economic Community in 1957 and continuing in the expansion of the European Union today in South America with the creation of the Mercosur in 1991 in South East Asia with the creation of the ASEAN in 1967 and in North America with the signature of NAFTA in 1994 The euro area countries continue to integrate further with a fiscal compact and a banking union
121 In June 2013 the European Commission and the United States announced that they would start negotiating a trade agreement to facilitate further the ease with which their respective producers can trade with each other Given the low average tariffs (under 3 per cent) these negotiations will focus on tackling non-tariff barriers These consist mainly of customs procedures and behind the border regulatory restrictions Such non-tariff barriers come from divergent regulatory systems (notably standards definitions) but also other non-tariff measures such as those related to certain aspects of security or consumer protection
11 Business cycle volatility and country size evidence for a sample of OECD countries Fuceri D and Karras G 2008
Chapter 1 An integrated economic union 25
122 While these are associations of states the direction of travel is clear to reduce barriers to economic integration rather than create them These agreements all involve pooling aspects of sovereignty in order to generate greater economic integration The global trend is to find ways to support greater economic integration rather than less
Scotlandrsquos integration with the rest of the UK 123 The level of economic integration is one of a number of factors that contributes to the
achievement of high levels of productivity and hence of living standards Differences in income levels across countries depend primarily on the strength of the business environment which in turn depends on a wide variety of factors including the institutional and legal infrastructure transport infrastructure and the skills of the workforce Differences in these factors affect firmsrsquo willingness and ability to build complex supply chains that enable them to reap the full benefits of specialisation They help to explain why some large countries remain poor and why a number of small mainly European countries number among the richest countries in the world12
124 As part of the UK Scotland benefits from common regulations a unified labour market and integrated infrastructure and the absence of border controls These are described in detail in Scotland analysis Business and microeconomic framework In addition the 300 year history of the United Kingdom has enabled the effects of shared institutions and policies to accumulate over time Businesses have been able to plan their investment and build their supply chains with a high level of confidence in the integrity of the political union between Scotland and the rest of the United Kingdom In the event of independence the level of integration between a separate Scottish state and the continuing UK would by definition diminish
125 There are many aspects to economic integration this paper assesses economic integration as being measured by the degree of trade labour and capital flows between the UK and Scotland
bull Trade integration is a measure of the degree to which different countries or regions trade goods and services
bull Labour market integration is a measure of the degree to which workers move between different regions or countries and
bull Capital flows are the cross border movements of money or assets
126 These and other measures of economic integration are discussed in Scotland analysis Business and microeconomic framework and Scotland analysis Financial services and banking
12 Henrekson et al (1997) find evidence for permanent growth effects of European integration (increasing growth by 06 to 13 percentage points per annum) Badinger (2000) finds evidence of a lsquoconsiderablersquo levels effect if no integration had taken place since 1950 GDP per capita would be a fifth smaller today Conversely Landau (1995) obtains no effect of EC-membership
26 Scotland analysis Macroeconomic and fiscal performance
Trade 127 Economic integration implies that producers are willing and able to engage with a wide
range of suppliers This allows individual producers to specialise in those activities where they are most efficient and to do so through buying in the goods and services that other suppliers can produce more efficiently than they can Scotlandrsquos most famous economist Adam Smith identified these mechanisms which he termed the division of labour as an important determinant of the Wealth of Nations13
128 Productivity levels will tend to be higher among countries that specialise in the production of the goods and services that they can produce most efficiently and who trade their surplus production for goods and services that can be produced more efficiently in the rest of the world Empirical evidence confirms that those countries that trade freely with the rest of the world have higher productivity levels and living standards than those where the barriers to trade are high
129 Frankel and Romer (1999) conclude that a one percentage point increase in the trade to GDP ratio raises real income per capita by around one per cent A later study by Frankel and Rose (2002) suggests that the impact may be smaller but still positive at around 13 of a per cent HM Treasuryrsquos EMU and trade14 publication in 2003 concluded that a one percentage point increase in the trade to GDP ratio would increase real income per capita by one third of a per cent These estimates should be interpreted as indicative rather than definitive given the broad range of factors that affect the rate of economic growth and as the authors acknowledge the sensitivity of these results to the measure of openness Nonetheless they suggest that lower barriers to cross border trade support higher rates of economic growth
130 There is close trade integration between Scotland and the rest of the UK Experimental data from the Scottish Government15 show that in 2011 Scotland ldquoexportedrdquo pound36 billion worth of goods and services to the rest of the UK and ldquoimportedrdquo pound49 billion from the rest of the UK or nearly 30 per cent and 40 per cent of Scottish GDP respectively This is a growing proportion of Scottish trade from 1998 to 2011 annual trade growth between Scotland and the rest of the UK has averaged 27 per cent per year compared to 22 per cent annual growth in trade with the entire rest of the world In 2009 across all industries exports to the rest of the UK account for approximately 24 per cent of total final demand The sectors with the highest exports to the rest of the UK as a percentage of Total Final Demand are Mining and Quarrying (86 per cent) Professional and Support Activities (61 per cent) and Energy and Supply (42 per cent) 16
131 Across all industries approximately 60 per cent of inputs are sourced from within Scotland 30 per cent from the rest of the UK and 10 per cent from the rest of the World Thus in terms of inputs into the supply chain Scotland is much more integrated with the rest of the UK than with the rest of the World The source of inputs varies dependent upon the industrial sector For example the agriculture sector is the most integrated with the rest of the UK 37 per cent of inputs come from the rest of the UK Manufacturing (34 per cent) financial insurance and real estate (33 percent) and professional and support activities
13 An inquiry into the Nature and Causes of the Wealth of Nations Smith Adam 14 EMU and Trade HM Treasury 2003 15 Scottish Government Scottish National Accounts Project (SNAP) Quarterly National Accounts 2012Q3 Other
export data is available from the Global Connections Survey but SNAP data is used for both imports and exports for consistency
16 Scottish Government Input-Output Tables 2009
Chapter 1 An integrated economic union 27
(33 per cent) are the other sectors with the highest source of inputs from the rest of the UK17 These sectors are currently benefiting from the best of both worlds targeted help from the Scottish Government but access to the UK domestic market
Chart 1I Scottish exports to the rest of the UK and Rest of World as a share of demand
Agriculture Scottish domestic
Mining amp utilities demand as of demand
Manufacturing Exports to UK as
Construction of demand
Distribution Hotels amp restaurants Exports to RoW as of demandTransport amp communication
Finance amp real estate
Business services
Public admin education amp health
Other
All industries
0 25 50 75 100
Source Scottish Goverment Input-Output Tables 2009
Labour 132 There can be both static and dynamic gains from migration Static gains arise if migrants
have a higher propensity to be employed than native workers or earn higher wages Some of these benefits will spill over to the wider economy in the form of taxes and returns to other factors of production such as capital especially if migrants fill shortage occupations Dynamic benefits of migration could increase the trend rate of growth for example by increasing innovation by bringing new skills or aptitudes that could spillover to non-immigrants increasing competition in labour or product markets or by improving trade links back to their origin countries There can also be costs in the form of higher public spending pressure on limited resources such as housing and social cohesion Borjas suggests that there is evidence that immigration can have negative economic impacts on groups such as low-skilled workers18 Not all migrants are as economically beneficial high skilled migrants and those who fill shortage occupations for example are likely to generate greater benefits and possibly lower costs The predictions from economic models are mixed (Drinkwater Levine Lotti and Pearlman (2003)) and depend on a variety of assumptions about for example the skill composition of migrants capital mobility and the existence of economies of scale in the host economy19
17 Scottish Government Input-Output Tables 2009 18 Increasing the Supply of Labour through Immigration measuring the Impact on Native-born Workers G Borjas
Centre for Immigration Studies May 2004 19 Fic et al (2011) estimate a small positive impact from migration on the UK economy A study by Poot Nana
and Philpott (1988) for New Zealand found that a net inflow of 15000 people increases GDP per capita by 02 percent per year and GDP per worker by 015 per cent per year For the US Borjas (1995) estimates the economic gains of immigration accruing to natives to be relatively small of the order of 01 percent of GDP while Barro and Sala-i-Martinrsquos (1992) results suggest that a 1 percentage point higher net migration rate in the US is associated with a 01 higher growth rate
28 Scotland analysis Macroeconomic and fiscal performance
133 Labour integration between Scotland and the rest of the UK is high This is shown through high migration flows In total it is estimated over half a million people born in England Northern Ireland and Wales now live in Scotland and over 700000 people born in Scotland have moved to other parts of the UK20 In 2010-11 nearly 44000 people moved from Scotland to the rest of the UK of which more than 35000 were of working-age and nearly 41000 moved from the rest of the UK to Scotland of which about 33000 were of working age (or about one per cent of the Scottish population of working age)21 There is also a high degree of commuting across the border In 2011 there were 30000 individuals who lived and worked on different sides of the border22 13000 of whom lived in Scotland and worked in the North of England23 This is higher than movements within other closely integrated European economies For example in 2008 17000 people moved from Austria to Germany and 22000 from Germany to Austria24
Capital 134 Flows of capital across regions and states have a positive effect on the level of economic
growth in an economy As a single domestic market the financial system operates to provide capital to businesses and households at low prices Scotland may also be more attractive as part of the union for other flows of capital such as Foreign Direct Investment (FDI) As set out in Scotland analysis Financial services and banking a more localised Scottish financial industry following independence may face more challenges in providing capital at least the same range of products at the same cost to households and businesses Costs could increase due to higher funding costs and the costs of operating in a smaller market The fragmentation of the domestic industry would make it harder to promote competition and address barriers to competition as they arise It is possible that as the Scottish and continuing UK markets diverge Scotland could become a less attractive location for FDI There is evidence that FDI brings benefits to the domestic economy Foreign owned firms tend to have higher productivity and higher levels of investment than domestic firms particularly compared with domestic non-multinationals Whilst evidence is more limited higher productivity may also spillover into the domestic economy eg through technology transfer25
135 If independence reduces capital flows it would be expected to impact on economic performance At a microeconomic level capital flows can enhance the efficiency of resource allocation the competitiveness of the domestic financial sector and support technology transfer The evidence on the effect of capital flows on economic growth is mixed Earlier studies such as Rodrick (1998) find no effect of capital flows on economic growth However more recent studies such as that by Kose Prasad and Terrones (2008) find that financial flows increase the growth of productivity in an economy Two possible reasons why the evidence is not conclusive is the volatility of capital flows which may have the effect of negating any potential benefits and that the flows have gone to countries which do not have the capacity to absorb the flows they are receiving This could be because they may not have a highly skilled workforce lack infrastructure or do not have
20 2001 Census 21 General Register Office for Scotland Migration between Scotland and the Rest of the UK (retrieved May 2013)
httpwwwgro-scotlandgovukstatisticsthememigrationmig-statsscotland-rest-of-ukhtml 22 Annual Population Survey January to December 2011 23 The North of England is defined as the following English regions North East North West Yorkshire and
the Humber 24 Eurostat Immigration by sex age group and country of previous residence July 2013 25 See for example Foreign ownership and Productivity New Evidence from the Service Sector and the RampD Lab
Griffith Redding and Simpson (2004)
Chapter 1 An integrated economic union 29
developed financial markets Despite this according to the IMF (2006) ldquothe weight of the evidence seems to be gradually shifting towards finding positive marginal effects on growthrdquo
136 These flows allow for capital to move to its most profitable use ensuring the best investments gain access to finance There are more limited data on flows of capital between Scotland and the rest of the UK However Scotland analysis Financial services and banking showed the extent that financial services are provided across the whole of the UK For example 51 per cent of Scottish mortgage and 70 per cent of Scottish pension products are supplied by non-Scottish firms Scottish Financial Enterprise (SFE) report that 90 per cent of its membersrsquo customers are based in the rest of the UK26
Integration and economic stability 137 A further benefit of integration is that it helps to create larger and more diverse markets
Economies that are part of a larger market are less susceptible to economic shocks and hence have less volatile economic growth Furceri and Karras (2008) and Down (2007) both find evidence to suggest that the larger economies are less volatile For example Scotland has avoided the very large negative impacts of the financial crisis that some other small economies have experienced The recession was twice as large in Ireland which required an IMFEU assistance programme The recession was also significantly larger in Denmark Finland and Sweden
138 Smaller economies which are more specialised and as a result more volatile can compensate for smaller domestic markets by being more open to international trade and orientating domestic production and consumption towards larger more stable international markets in order to mitigate some of the volatility However Down (2007) concluded that the benefits of diversification through international trade openness cannot fully compensate for the smaller size of the domestic market
139 Economic stability is an important aspect of economic performance Many studies have argued that higher levels of volatility have negative effects on average growth in output for example In one of the first studies Ramey and Ramey (1995) found a negative relationship between volatility and growth for a sample of 92 countries as well as in a sample of OECD countries This could be because for example entrepreneurs are discouraged from investing when the path of economic growth is more uncertain
140 Scottish integration with the rest of the UK as part of the large UK domestic market has played an important role in explaining the performance of the Scottish economy Scottish independence would have important implications for economic integration between Scotland and the rest of the UK which are discussed in the following chapter
26 Speech by Owen Kelly Chief Executive of Scottish Financial Enterprise at the Scotsman Conference A Question of Independence The Economics of Independence June 2012
30 Scotland analysis Macroeconomic and fiscal performance
Chapter 1 Conclusion 141 Across a range of measures the performance of the Scottish economy is similar to the
economy of the whole UK
bull Output per head and output per worker in Scotland are almost exactly equal to the UK average
bull Output growth over the last 40 years has grown at almost exactly the same rate as it has in the UK
bull The employment and unemployment rates in the UK and Scotland are very similar
142 Scotlandrsquos economic performance is comparable to a range of small independent countries
bull Scotlandrsquos economic output is within the range of comparable countries higher than Portugal Denmark and Finland
bull While Scotlandrsquos performance has been weaker in the 1970s and 1980s growth in output per head of population is above the median for independent comparable countries over the 1990s and 2000s
bull Scotland has maintained a consistently higher employment rate than most of the comparable countries
bull Scotland suffered a considerably less severe recession than most comparator countries
143 High levels of economic integration between Scotland and the UK in particular flows of goods and services labour and capital have underpinned Scotlandrsquos economic performance and helped to reduce economic volatility
Chapter 2 The UKrsquos integrated fiscal model
The UKrsquos integrated fiscal model supports Scotlandrsquos economic performance and delivers funding for public services The UKrsquos broader tax base helps maintain the stability of public spending in Scotland and smooth the impact of volatile and declining sources of revenue such as North Sea oil and gas Fiscal transfers are automatic across the UK which supports higher welfare and pensions spending in Scotland
Scotlandrsquos notional onshore fiscal balance is considerably weaker than the UKrsquos onshore public finances1 This reflects a slightly lower level of onshore tax revenue and public spending that is consistently 10 per cent higher than the UK average In the event of independence the allocation of North Sea oil and gas revenues would be subject to negotiation If North Sea oil and gas revenues are allocated on a geographical basis Scotlandrsquos notional fiscal balance since devolution is very similar to the UKrsquos public finances
However North Sea oil and gas receipts are one of the most volatile sources of revenue Since devolution Scotlandrsquos geographical share of North Sea oil and gas receipts has fluctuated between pound2 billion and pound12 billion from 25 per cent to 83 per cent of Scottish GDP2 As a result total receipts in Scotland are more volatile than for the UK as a whole Based on the earliest available data comparing receipts and spending demonstrates that Scottish receipts since 1981-82 have been almost twice as volatile while Scottish public spending has been just as stable as across the UK as a whole3
This is the UKrsquos fiscal model in action diffusing the volatility of Scottish receipts across the UK while providing stability and security for public spending Through the pooling of major tax revenues across the UK Scotland contributes a volatile revenue stream from North Sea oil and gas in return for secure and stable funding from the UK Government
1 Scottish Government GERS 2011-12 and historical series March 2013 2 Scottish Government GERS 2011-12 and historical series March 2013 3 This is the impact of year-on-year volatility but in addition independent analysts expect North Sea oil and gas
revenues to decline over time which would require other taxes to increase by the same amount to maintain the same level of public spending
34 Scotland analysis Macroeconomic and fiscal performance
The UKrsquos fiscal model protects Scotland from a more difficult set of fiscal choices In the absence of shared public finances in 2009-10 ndash in the aftermath of a halving of North Sea oil and gas revenues ndash Scotland would have faced a choice between implementing immediate spending cuts of nine per cent (or pound6 billion which equates to half of Scotlandrsquos health budget) increasing other taxes to offset the sharp fall in North Sea oil and gas revenues or absorbing this volatility in its budget deficit As a small independent country Scotland would be likely to have less flexibility to absorb shocks of this kind than the UK as it would be likely to pay higher borrowing costs
A clear benefit of the current fiscal framework is that the Scottish Government is able to take long-term decisions on the allocation of significant areas of public spending that have been devolved and do this secure in the knowledge that funding levels will remain stable irrespective of the volatility of Scottish receipts
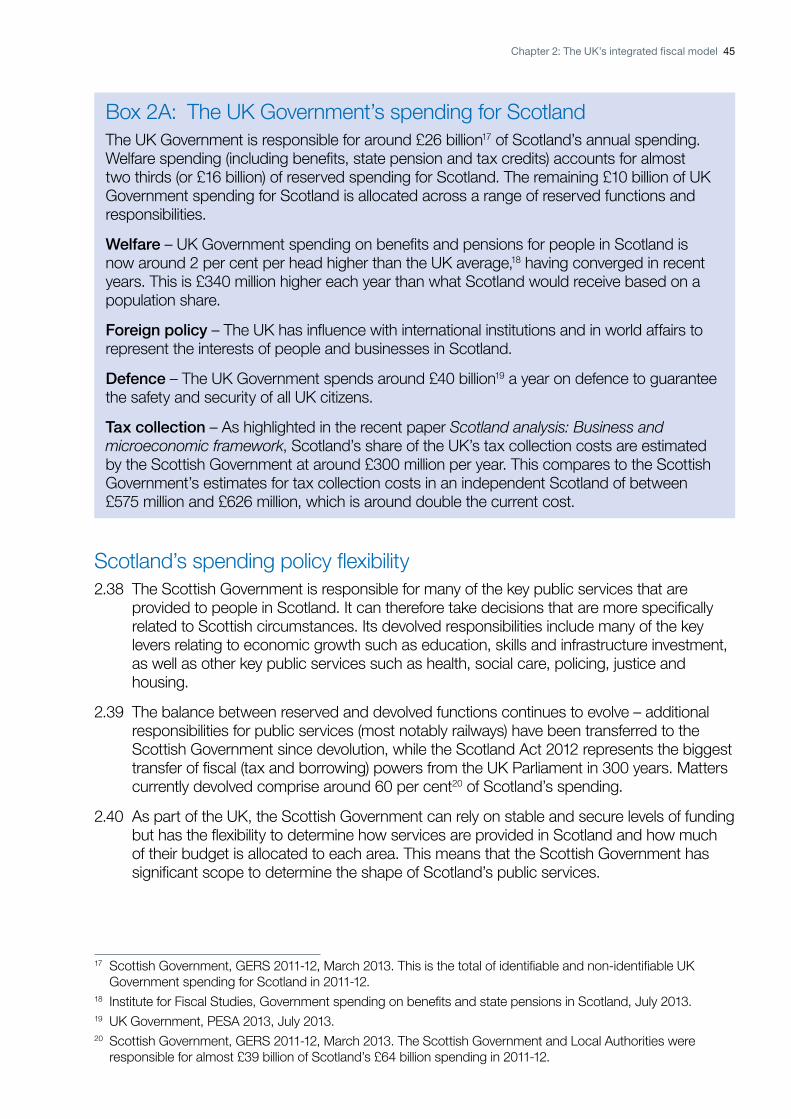
The Scottish Parliamentrsquos budget for devolved public services is separate and predictably certain and is not affected by changes in demand for welfare Automatic welfare provision at the UK level means that if the number of welfare recipients or pensioners increases in Scotland then the Scottish Government does not need to adjust its budget The latest IFS figures4 show that UK Government spending on benefits and pensions for people in Scotland is now around two per cent per head higher than the UK average having converged in recent years This is pound340 million higher each year than what Scotland would receive based on a population share
A large and diversified tax base allows all parts of the UK to pool risks such as volatile tax revenues and to borrow at a lower cost to maintain public services By spending taxpayersrsquo money on a UK-wide basis for certain services the UK limits public costs through economies of scale (for example in defence tax collection and overseas representation) while also supporting integration in the domestic market (for example through unified social security and common regulators)
An integrated tax system works well for business and individuals providing a simple and efficient way to collect tax revenues across the UK The same taxes and rates apply across most of the UK ensuring the overall coherence of the tax system But as part of this integrated system the UK Government has devolved certain tax powers to the Scottish Parliament through the Scotland Act 2012 which will make the Scottish Parliament more accountable for funding its spending and enable greater tax and spending flexibility within Scotland
Independence would put an end to devolution as it would create a separate independent Scottish state This would also put an end to the pooling of fiscal risks across the UK the stabilising role of fiscal transfers between different parts of the UK and the ability to share costs and coordinate policies An independent Scotland would therefore be directly exposed to a more narrow and volatile tax base resulting in a more difficult set of tax and spending choices
4 Institute for Fiscal Studies Government spending on benefits and state pensions in Scotland July 2013
Chapter 2 The UKrsquos integrated fiscal model 35
21 In addition to close economic integration examined in Chapter 1 the UK is characterised by a high degree of fiscal integration combined with substantial devolution of spending policy powers
22 As well as being a fully integrated economic and political union with a sovereign parliament the UK is a fiscal union with a fully integrated tax and spending system Public spending in the UK is funded through taxation with shortfalls in tax revenues supplemented by borrowing This enables all nations and regions of the UK to pool fiscal resources benefit from economies of scale in public spending share fiscal risks and borrow as a single and credible participant in international financial markets The UKrsquos integrated fiscal model supports Scotlandrsquos economic performance ndash and the economic performance of all parts of the UK ndash and ensures that funding for Scotlandrsquos public services remains stable
23 Figures for Scotlandrsquos tax and spending published by the Scottish Government therefore reflect Scotlandrsquos position as part of the UK integrated within the UK economy and supported by the UKrsquos fiscal model They do not show tax and spending for an independent Scotland no longer benefitting from the economic or fiscal integration with the rest of the UK
24 Since the Scotland Act 1998 the UK Government has devolved responsibility for some 60 per cent5 of Scotlandrsquos public spending to the Scottish Parliament and following the Scotland Act 2012 the Scottish Parliament will be responsible for funding around one-third of its spending6 Fiscal devolution is taking place while retaining the overall coherence and integration of the UKrsquos tax and spending system Independence would mean an end to the UKrsquos fiscal model and an independent Scottish state would need to establish its own tax system and fund all public spending commitments including through borrowing in international financial markets when necessary
Fiscal alignment between Scotland and the rest of the UK 25 Just as Scotlandrsquos strong economic performance as part of the UK is closely aligned to
the UKrsquos overall performance the Scottish Government estimates that Scottish onshore tax revenues per person are very slightly lower than the UK average since devolution in 1998 as shown in Chart 2A This reflects the fact that the performance of Scotlandrsquos onshore economy closely mirrors the performance of the UKrsquos onshore economy as highlighted in Chapter 1 and the fact that people and businesses across the UK are subject to the same levels of taxation as the UK has a largely unified tax system
5 Scottish Government GERS 2011-12 March 2013 The Scottish Government and Local Authorities were responsible flor almost pound39 billion of Scotlandrsquos pound64 billion spending in 2011-12
6 Commission on Scottish Devolution final report June 2009
36 Scotland analysis Macroeconomic and fiscal performance
Chart 2A Comparison of Scotland and UK onshore tax revenues per head
1999
ndash00
2001
ndash02
2003
ndash04
2005
ndash06
2007
ndash08
2009
ndash10
2011
ndash12
13000
12000
Rev
enue
s pe
r he
ad (pound
)
6000
7000
8000
9000
11000
10000
5000
4000
Scotland UK 19
99ndash0
0
2001
ndash02
2003
ndash04
2005
ndash06
2007
ndash08
2009
ndash10
2011
ndash12
120
115
Rev
enue
s pe
r he
ad (i
ndex
ed U
K=
100)
100
105
110
95
90
Scotland UK
Source Scottish Government GERS 2011ndash12 and historical series (all figures to 2011ndash12) ONSHM Treasury Public Sector Finances (UK figures for 2012ndash13 excluding the one-off Royal Mail Pension Scheme asset transfer) HM Treasury estimates (Scotlandrsquos share of 2012ndash13 UK totals based on the 2011ndash12 share)
26 Onshore revenues are the levels of taxation that people and (onshore) businesses in Scotland actually pay Irrespective of the offshore revenues attributed to Scotland this demonstrates that people and (onshore) businesses in Scotland are making roughly the same contribution to the UKrsquos tax revenues as the UK (onshore) average
27 Scotlandrsquos notional onshore balance therefore reflects the levels of taxation people in Scotland face and the levels of public service they receive While Scotlandrsquos onshore revenues are slightly lower than the UK average public spending per person in Scotland has been around ten per cent higher than the UK average since devolution7 This is currently equivalent to almost pound1200 per head as shown in Chart 2B below Had Scotland instead received its population share of spending then it would have received some pound74 billion less since devolution or pound6 billion less each year (in real terms) which is equivalent to around half Scotlandrsquos health budget An allocation of the UKrsquos spending based on a share of onshore tax revenues would have further decreased Scotlandrsquos spending
Scottish Government GERS 2011-12 and historical series March 2013 7
Chapter 2 The UKrsquos integrated fiscal model 37
Chart 2B Comparison of Scotland and UK spending per head
1999
ndash00
2001
ndash02
2003
ndash04
2005
ndash06
2007
ndash08
2009
ndash10
2011
ndash12
13000
Spe
ndin
g pe
r he
ad (pound
)
6000
7000
8000
9000
10000
11000
12000
5000
4000
Scotland UK 19
99ndash0
0
2001
ndash02
2003
ndash04
2005
ndash06
2007
ndash08
2009
ndash10
2011
ndash12
120
Spe
ndin
g pe
r he
ad (i
ndex
ed U
K=
100)
100
105
110
115
95
90
Scotland UK
Source Scottish Government GERS 2011ndash12 and historical series (all figures to 2011ndash12) ONSHMT Public Sector Finances (UK figures for 2012ndash13 excluding the one-off Royal Mail Pension Scheme asset transfer) HMT estimates (Scotlandrsquos share of 2012ndash13 UK totals based on the 2011ndash12 share)
28 As shown in Chart 2C Scotlandrsquos significantly higher public spending per person compared to the UK as a whole is driven by
bull spending on social protection which is largely reserved (the main exception being social care) and determined by need and which is around pound260 per head higher in Scotland than the UK average and
bull other largely devolved areas of spending in particular economic affairs (which includes transport and agriculture) is pound350 per head higher in Scotland than the UK average health is pound180 per head higher and housing and community amenities is pound120 per head higher
Chart 2C Breakdown of Scotland and UK spending per head
10 S
ocial
pr
Accou
nting
adjus
tmen
ts
9 Edu
catio
n
otec
tion
8 Rec
reatio
n cult
ur
6 Hou
sing a
nd co
mmunity
amen
ities
7 Hea
lth
e and
relig
ion
5 Env
ironm
ent p
rotec
tion
4 Eco
nomic
affair
s
3 Pub
lic or
1 Gen
eral p
ublic
servi
ces
2 Defe
nce
der a
nd sa
fety
4000
UK
Scotland 3000
pound pe
r he
ad
2000
1000
0
Source Scottish Government GERS 2011ndash12 March 2013 (average of the five years 2007ndash08 to 2011ndash12)
38 Scotland analysis Macroeconomic and fiscal performance
29 It should be noted that the spending numbers presented in Government Expenditure and Revenue Scotland (GERS) reflects the spending that is determined to benefit people in Scotland or that was incurred on their behalf It does not necessarily reflect spending that actually took place in Scotland8
210 For example all parts of the UK are considered to benefit equally from spending on defence security and foreign representation even though the location of the spending may be concentrated in certain areas of the UK or overseas Similarly some spending that takes place in Scotland (for example administering tax and benefits) actually benefits people in other parts of the UK While this is explained further in Annex B the key point to note is that GERS shows the spending that Scotland benefits from as part of the UK and not what Scotlandrsquos spending would need to look like as an independent country
211 Combining Scotlandrsquos onshore revenues and public spending allocation in Chart 2D below shows that relative to the UK raising and spending pound100 Scotland generates pound98 and spends pound112 Scotlandrsquos notional onshore fiscal balance has therefore been considerably weaker than the UKrsquos onshore fiscal position in the period since devolution
Chart 2D Scotlandrsquos onshore tax and spending compared to the UK average
o
f UK
tota
ls
80
85
90
95
100
105
110
2011
ndash12
2009
ndash10
2007
ndash08
2005
ndash06
2003
ndash04
2001
ndash02
1999
ndash00
Spending Revenue Population
Spe
ndin
g an
d re
venu
es p
er h
ead
(inde
xed
UK
=10
0)
90
95
100
105
110
115
120
2011
ndash12
2009
ndash10
2007
ndash08
2005
ndash06
2003
ndash04
2001
ndash02
1999
ndash00
Scotland spending Scotland revenues UK
Source Scottish Government GERS 2011ndash12 and historical series (all figures to 2011ndash12) ONSHMT Public Sector Finances (UK figures for 2012ndash13 excluding the one-off Royal Mail Pension Scheme asset transfer) HMT estimates (Scotlandrsquos share of 2012ndash13 UK totals based on the 2011ndash12 share)
Including North Sea oil and gas 212 In the event of independence the allocation of the UKrsquos oil and gas reserves would have to
be negotiated between a separate Scottish state and the continuing UK
213 For illustrative purposes the Scottish Government presents both a ldquogeographical share of North Sea oil and gasrdquo and a ldquoper capita share of North Sea oil and gasrdquo9 Consistent with the economic analysis in Chapter 1 the rest of this section includes a geographical share of North Sea oil and gas within Scotlandrsquos overall revenues This does not reflect any UK Government position in the event of independence rather by allocating the largest share of resources to Scotland it ensures that the subsequent analysis represents the lsquobest casersquo for an independent Scotland
8 The spending methodology is set out in Annex B of GERS 9 Scottish Government GERS 2011-12 March 2013
Chapter 2 The UKrsquos integrated fiscal model 39
214 Any allocation of North Sea oil and gas receipts to Scotlandrsquos onshore tax revenues has the effect of increasing Scotlandrsquos contribution to UK tax revenues The geographical allocation used by the Scottish Government would see Scotlandrsquos contribution to UK tax revenues substantially increased
215 On this basis Scotlandrsquos notional fiscal balance as part of the UK is very similar to the UKrsquos fiscal position over the period since devolution albeit Scotlandrsquos revenues and spending both average around 10 per cent higher than the UK This is illustrated by Chart 2E below which demonstrates that there is no consistent fiscal surplus in Scotland compared to the UK
Chart 2E Scotlandrsquos overall tax and spending compared to the UK average
1999
ndash00
2001
ndash02
2003
ndash04
2005
ndash06
2007
ndash08
2009
ndash10
2011
ndash12
o
f UK
tota
ls
80
85
90
95
100
105
110
Spending Revenue Population 19
99ndash0
0
2001
ndash02
2003
ndash04
2005
ndash06
2007
ndash08
2009
ndash10
2011
ndash12 S
pend
ing
and
reve
nues
per
hea
d (in
dexe
d U
K=
100)
90
95
100
105
110
115
120
130
125
Scotland spending Scotland revenues UK
Source Scottish Government GERS 2011ndash12 and historical series (all figures to 2011ndash12) ONSHM Treasury Public Sector Finances (UK figures for 2012ndash13 excluding the one-off Royal Mail Pension Scheme asset transfer) HMRC Government revenues from UK oil and gas production (North Sea revenues for 2012ndash13) HM Treasury estimates (Scotlandrsquos share of 2012ndash13 UK totals based on the 2011ndash12 share)
216 Moreover as is shown by the fluctuation of total Scottish revenues North Sea receipts are among the most volatile sources of government funding Since devolution Scotlandrsquos geographical share of North Sea oil and gas receipts has fluctuated between pound2 billion in 1999-2000 and pound12 billion in 2008-09 from 25 per cent to 83 per cent of Scottish GDP10
Pooling of resources Stability of receipts
217 The pooling of most tax revenues across the UK ndash in particular volatile revenues such as corporation tax and North Sea taxes ndash provides greater stability and certainty for policy makers firms and households This creates a more favourable environment to develop tax and spending policies
218 At an aggregate level Scotlandrsquos onshore tax mix is similar to the UKrsquos onshore tax mix as shown in Chart 2F This is perhaps unsurprising given the high level of integration of the two economies and given that (with some limited exceptions) it is the same tax system with the same rates that is in operation across the whole of the UK
10 Scottish Government GERS 2011-12 March 2013
40 Scotland analysis Macroeconomic and fiscal performance
Chart 2F Onshore tax mix in Scotland and the UK
UK Scotland
Income Tax and NICS
VAT
Corporation Tax
Excise and other indirect taxes
Main local taxes
Other
4346
17 18
76
54
99
1817
Source Scottish Government GERS 2011ndash12 (average of the five years 2007ndash08 to 2011ndash12)
219 Chart 2G shows Scotlandrsquos tax mix including a geographic share of North Sea revenues alongside the UKrsquos tax mix also including North Sea revenues A geographical share of North Sea oil and gas significantly changes the Scottish tax mix compared to that across the UK as a whole
Chart 2G Tax mix in Scotland and the UK including North Sea revenues
UK Scotland
Income Tax and NICS
VAT
Corporation Tax
Excise and other indirect taxes
Main local taxes
Other
Oil and Gas
36
45
17 156
4
6 7
4
2
159
1617
Source Scottish Government GERS 2011ndash12 (average of the five years 2007ndash08 to 2011ndash12)
220 Specifically while total North Sea revenues average 17 per cent of UK revenues in the past five years attributing a geographical share to Scotland would mean that this averages 163 per cent of Scotlandrsquos revenues
221 Total receipts in Scotland are therefore more volatile than for the UK Based on earliest available data Scottish receipts have varied up or down by an average of 61 per cent each year11 For the UK as a whole the average annual variation in receipts is significantly lower at 37 per cent The driver of higher volatility in Scotland is offshore revenues from North Sea oil and gas as shown in Chart 2H This implies Scottish receipts vary by around pound670 per head each year (in 2013-14 prices) while total UK receipts vary by around pound330 per head each year
11 Over 1981-82 to 2011-12 in real terms
Chapter 2 The UKrsquos integrated fiscal model 41
Chart 2H Volatility in UK and Scottish receipts 70
00
10
20
30
40
50
60
Scotland ndash Total receipts volatility
UK ndash Total receipts volatility
ecei
pts
eal r
Ave
rage
abs
olut
e ch
ange
in r
1981
ndash82
to 2
011ndash
12
37
61
35
30 30
ecei
pts
eal r
Ave
rage
abs
olut
e ch
ange
in r
1981
ndash82
to 2
011ndash
12 25
20
15
10
5
0
35
Onshore volatility Offshore volatility
Source Scottish Government GERS 2011ndash12 and historical series HM Treasury calculations
222 North Sea oil and gas receipts are among the most volatile sources of revenue On average real-terms offshore receipts vary by 30 per cent from year to year as Chart 2H shows That means there are ldquoboomrdquo years (eg 2005-06 when revenues rose by over 75 per cent) but also ldquobustrdquo years such as 2009-10 when revenues halved
223 If revenues were volatile but predictable the challenge for fiscal planning might be eased But they are not North Sea revenues have a critical dependence on a range of external and interrelated factors that are difficult to predict These factors include world oil and gas prices exchange rates production and outages investment levels and the nature and stability of the policy regime in particular for taxation and decommissioning
224 While there are examples of small countries managing the volatility of revenues from natural resources (notably Norway) this is largely due to the existence of an oil fund The ability and necessity for an independent Scotland to create an oil fund is considered in Chapter 4
225 As Chart 2I illustrates the volatile path of outturn offshore revenues makes them difficult to predict despite the fact that forecasts are based on prices derived from market expectations and production estimates informed by the industryrsquos projections
42 Scotland analysis Macroeconomic and fiscal performance
Chart 2I Successive official forecasts of UK offshore revenues
16
4
6
8
10
12
14
pound bi
llion
2
0 2000ndash01 2003-04 2006ndash07 2009ndash10 2012ndash13 2015ndash16
Outturn Forecasts
Source HM Treasury and Office for Budget Responsibility forecasts from Budget 2002 to Budget 2013 including Pre-Budget Reports and Autumn Statements ONS outturn
226 This shows how difficult it is to forecast North Sea revenues A further example is provided by the Scottish Governmentrsquos recent Oil and Gas bulletin12 published in March 2013 Although published towards the very end of 2012-13 and including a range of scenarios the least optimistic forecast of Scotlandrsquos geographic share in 2012-13 (other than the forecast based on OBR assumptions) turned out to be pound400 million higher than the UKrsquos total offshore revenues and pound800 million higher than Scotlandrsquos geographic share (assuming the same share as 2011-12) Annex B explains in more detail the interactions between the range of factors that affect North Sea production and the impact on revenues
227 If peaks and troughs in North Sea oil and gas revenues could be aligned to counterbalance the onshore economic cycle the challenge of how to plan fiscal policy to mitigate the volatility of North Sea oil and gas might be eased But the most severe volatility tends to be caused by external factors For example the significant increase in revenues in 2005-06 was largely driven by oil prices almost doubling during 2005 from pound21 per barrel to pound36 per barrel while a fall from pound67 per barrel to pound27 per barrel during just six months in 2008 resulted in revenues halving between 2008-09 and 2009-1013
228 This final trough in 2009-10 was the largest single-year fall in offshore revenues since the early 1990s It coincided with the financial crisis and recession the associated shortfalls in onshore receipts and the fiscal costs of intervening in the financial sector Collectively these factors put historic pressure on the public finances The UKrsquos fiscal model pooled the shortfall in offshore revenues to better withstand the impact
229 Within the UK most public sector receipts are pooled allowing this exceptional source of volatility to be managed Since devolution offshore oil and gas receipts amounted to around 15 per cent of total UK receipts For Scotland North Sea revenues would have been almost 14 per cent of the total Shortfalls in North Sea revenues would need to be offset by borrowing in financial markets (to avoid spending cuts or tax rises) Markets may demand higher interest rates on this borrowing particularly for a newly-formed small independent state There are therefore clear risks from depending on such a volatile source of revenue for such a large proportion of tax revenues and clear benefits to pooling volatile sources of revenue across the UK as a whole
12 Scottish Government Oil and Gas bulletin March 2013 13 World Bank Dated Brent monthly oil prices
Chapter 2 The UKrsquos integrated fiscal model 43
Stability of spending
230 The analysis above shows Scottish tax receipts are almost twice as volatile as revenues across the UK as a whole In the absence of wider fiscal risk-sharing a more volatile revenue base would imply sharp annual changes in the affordable level of spending But thanks to the UKrsquos integrated fiscal model Scotland has access to stable and secure funding regardless of the fluctuating level of North Sea oil and gas receipts
231 The UK and Scottish Governments generally set public service spending plans over multiple years This gives Scotland the ability to plan spending efficiently over the medium term The stability of firm multi-year plans enables sound value-for-money decisions to be taken for Scotland and all parts of the UK maximising public service outcomes for a given funding envelope
232 Based on the earliest available data public spending in Scotland has varied up or down by an average of around 28 per cent each year14 That is very similar to the equivalent UK average of 30 per cent This implies that public spending in Scotland varies by pound350 per head each year in 2013-14 prices and population The UK figure is very similar
233 Chart 2J compares receipts and spending volatility to demonstrate that while Scottish tax receipts are more volatile Scottish spending is just as stable as that of the UK as a whole15 This is the UK fiscal model in action diffusing receipts volatility across the UK while giving Scotland stability and security on public spending
Chart 2J Volatility in UK and Scottish receipts and spending
Ave
rage
abs
olut
e ch
ange
in r
eal
rece
ipts
and
spe
ndin
g 1
981ndash
82 to
201
1ndash12
70
61
60
50
3740
30 2830
20
10
00 UK Scotland UK Scotland
Receipts volatility Spending volatility
Source Scottish Government GERS 2011-12 and historical series HM Treasury calculations
234 The fiscal model protects Scotland from a more difficult set of fiscal choices In the absence of shared public finances in 2009-10 ndash in the aftermath of a halving of North Sea oil and gas revenues16 ndash Scotland would have faced a choice between implementing immediate spending cuts of nine per cent (or pound6 billion which equates to half Scotlandrsquos health budget) increasing other taxes to offset the fall in North Sea revenues or absorbing this volatility in its budget deficit As a small independent country Scotland is likely to have less fiscal flexibility to absorb shocks of this kind within its deficit than the UK as it would be likely
14 Over 1981-82 to 2011-12 in real terms 15 This result is also robust over a shorter time period such as the last two decades (albeit with a smaller
magnitude of difference) Receipts and spending are deflated using the UK GDP deflator 16 HM Revenue amp Customs Government Revenues from UK oil and gas production June 2013
44 Scotland analysis Macroeconomic and fiscal performance
to pay higher borrowing costs For the UK the fall in offshore receipts that year was 05 per cent of GDP ndash a still significant but more manageable pressure
235 Through the pooling of major tax revenues across the UK Scotland therefore contributes a volatile revenue stream from North Sea oil and gas and benefits from secure and stable funding from the UK Government As will be explored in forward-looking analysis later in the Scotland analysis series oil and gas revenues remain extremely uncertain The only outcome that forecasters predict with any confidence is that the reserves in the North Sea will ultimately decline
Policy flexibility within an integrated fiscal model 236 The UKrsquos integrated fiscal model provides stable and secure funding across the UK
including for Scotland As a result of devolution the Scottish Government is responsible for many key public services in Scotland and has complete flexibility to determine how to use its funding for devolved public services This reflects that decisions in some areas are judged to be better taken locally by the Scottish Government But at the same time services that benefit from being delivered consistently on a UK-wide basis are provided by the UK Government and the UK Parliament The split between devolved and reserved functions is shown in Chart 2K
Chart 2K Devolved and reserved spending for Scotland
10 S
ocial
pr
Accou
nting
adjus
tmen
ts
9 Edu
catio
n
otec
tion
8 Rec
reatio
n cu
ltur
6 Hou
sing a
nd co
mmunity
amen
ities
7 Hea
lth
e and
relig
ion
5 Env
ironm
ent p
rotec
tion
4 Eco
nomic
affair
s
3 Pub
lic or
1 Gen
eral p
ublic
servi
ces
2 Defe
nce
der a
nd sa
fety
4000
Reserved
Devolved 3000
pound pe
r he
ad
2000
1000
0
Source Scottish Government GERS 2011ndash12 (average of the five years 2007ndash08 to 2011ndash12)
Note that reserved lsquogeneral public servicesrsquo includes international development foreign affairs tax collection and debt interest lsquoEconomic affairsrsquo includes transport and agriculture
237 The UK Government and the UK Parliament are responsible for those areas that are essential to the integrity of the state and where all people across the UK benefit from a common approach Key areas of responsibility reserved to the UK Parliament include defence and national security macro-economic policy foreign affairs immigration social security and pensions Not only does this mean that the public benefits from the same levels of service across the UK strengthening the UKrsquos union but it also enables the UK to benefit from economies of scale in relation to spending This is explored further in Box 2A
17 18 19
Chapter 2 The UKrsquos integrated fiscal model 45
Box 2A The UK Governmentrsquos spending for Scotland The UK Government is responsible for around pound26 billion17 of Scotlandrsquos annual spending Welfare spending (including benefits state pension and tax credits) accounts for almost two thirds (or pound16 billion) of reserved spending for Scotland The remaining pound10 billion of UK Government spending for Scotland is allocated across a range of reserved functions and responsibilities
Welfare ndash UK Government spending on benefits and pensions for people in Scotland is now around 2 per cent per head higher than the UK average18 having converged in recent years This is pound340 million higher each year than what Scotland would receive based on a population share
Foreign policy ndash The UK has influence with international institutions and in world affairs to represent the interests of people and businesses in Scotland
Defence ndash The UK Government spends around pound40 billion19 a year on defence to guarantee the safety and security of all UK citizens
Tax collection ndash As highlighted in the recent paper Scotland analysis Business and microeconomic framework Scotlandrsquos share of the UKrsquos tax collection costs are estimated by the Scottish Government at around pound300 million per year This compares to the Scottish Governmentrsquos estimates for tax collection costs in an independent Scotland of between pound575 million and pound626 million which is around double the current cost
Scotlandrsquos spending policy flexibility 238 The Scottish Government is responsible for many of the key public services that are
provided to people in Scotland It can therefore take decisions that are more specifically related to Scottish circumstances Its devolved responsibilities include many of the key levers relating to economic growth such as education skills and infrastructure investment as well as other key public services such as health social care policing justice and housing
239 The balance between reserved and devolved functions continues to evolve ndash additional responsibilities for public services (most notably railways) have been transferred to the Scottish Government since devolution while the Scotland Act 2012 represents the biggest transfer of fiscal (tax and borrowing) powers from the UK Parliament in 300 years Matters currently devolved comprise around 60 per cent20 of Scotlandrsquos spending
240 As part of the UK the Scottish Government can rely on stable and secure levels of funding but has the flexibility to determine how services are provided in Scotland and how much of their budget is allocated to each area This means that the Scottish Government has significant scope to determine the shape of Scotlandrsquos public services
17 Scottish Government GERS 2011-12 March 2013 This is the total of identifiable and non-identifiable UK Government spending for Scotland in 2011-12
18 Institute for Fiscal Studies Government spending on benefits and state pensions in Scotland July 2013 19 UK Government PESA 2013 July 2013 20 Scottish Government GERS 2011-12 March 2013 The Scottish Government and Local Authorities were
responsible for almost pound39 billion of Scotlandrsquos pound64 billion spending in 2011-12
46 Scotland analysis Macroeconomic and fiscal performance
241 This policy flexibility allows the Scottish Government to focus on different priorities For example the Scottish population is dispersed more widely and so transport spending tends to be relatively higher Similarly as fisheries form a larger part of Scotlandrsquos economy spending in this area is higher And Scottish Water is part of the public sector in Scotland whereas water services have been privatised in England and Wales It is also as part of the UK that the Scottish Government is able to provide certain universal services free at the point of access Box 2B examines some of these policy differences in greater detail
Box 2B Examples of the Scottish Governmentrsquos spending policy choices The allocation of public spending to the services under the control of the Scottish Government is for the Scottish Government to determine This means that the Scottish Government is afforded significant flexibility to decide what policies to pursue and how to prioritise spending on these services
In some of the examples below the Scottish Government elected either to forego revenue from fees and charges or to use its funding in a different way to other parts of the UK making offsetting savings in other areas funded by the block grant
Policing
The Police and Fire Reform (Scotland) Act 2012 brought together Scotlandrsquos eight regional police forces the Scottish Police Services Authority and the Scottish Crime and Drug Enforcement Agency into a single Police Service of Scotland At the same time the eight fire and rescue services across Scotland were amalgamated into a single new Scottish Fire and Rescue Service This contrasts with the regional fire and policing structure in England and Wales
Prescriptions and eye tests
In 2006 the Scottish Government elected to fund free eye tests for Scottish residents in an attempt to improve public health In 2011 the Scottish Government abolished prescription fees This followed successive reductions in prescription charges by Scottish Ministers in the three years preceding the abolition The decision to end prescription charges brought Scotland in line with the approach previously adopted by the Welsh Government and Northern Ireland Assembly
Education
Although the devolution of higher education in 1999 saw tuition fee regimes in Scotland and the rest of the UK develop differently the decision by the Scottish Government to abolish the graduate endowment scheme that had existed since 2001 saw the reintroduction of free higher education in Scotland in 2008 However while the UK Government has protected schools spending in England since 2010 the Scottish Government has not made this commitment
Social care
Free personal care is available in Scotland for over 65s who have been assessed as needing care Scotland is the only part of the UK to offer free personal care in care homes and in peoplersquos own homes
Chapter 2 The UKrsquos integrated fiscal model 47
The UKrsquos integrated tax system 242 There are significant benefits to business and individuals of the UKrsquos integrated tax system
as they can operate or livework across the UK without having to deal with a number of separate systems and institutions It also provides a robust and comparatively efficient way for the Government to collect tax avoiding unhelpful tax competition within the UK and helping to minimise the opportunities for tax evasion and avoidance
243 While the UKrsquos integrated tax system is substantially unified with the same taxes and rates largely applying across the whole of the UK the devolution of certain tax powers (while retaining the integration and coherence of the overall system) can empower and enhance the accountability of devolved governments
244 Under devolution it is possible to decide which tax powers to devolve in order to enhance accountability of the devolved administrations and bring economic benefits to the UK as a whole There are no rules about which tax powers should be reserved and which devolved but the UK Government has indicated that it will proceed with tax devolution only where this is supported by evidence gains cross-party support and would not be to the detriment of the rest of the UK As with spending the challenge is therefore to find the right balance between devolved and reserved responsibilities ndash and this balance can clearly evolve over time
245 The Scottish Parliament is already responsible for council tax and non-domestic (business) rates which usually fund slightly more than 10 per cent of the spending for which it is responsible (ie the spending by the Scottish Government and Scottish local authorities) The UK Government and Scottish Parliament established the Calman Commission in 2007 to consider as one part of its remit how to increase the financial accountability of the Scottish Government
246 The Calman Commissionrsquos report highlighted the current benefits of the UKrsquos unified tax system and the risks associated with having separate tax systems within the UK
ldquoWere different tax systems to operate in Scotland compared to the rest of the United Kingdom an overall increase in the governmentsrsquo total administrative costs would be created as two tax systems would have to be operated It would also create new compliance costs to individuals and businesses operating across both tax jurisdictions as they would have to separate and determine their liabilities in those two tax systems In other words a unified UK tax system represents an existing administrative efficiency The evidence is that the administrative costs associated with the tax system in the UK compare favourably with international competitorsrdquo
247 Similar observations have been made by the Institute of Chartered Accountants Scotland (ICAS)21 as well as in an Ernst and Young corporate tax survey22 of Scottish business leaders while for ease of paying taxes the World Bank23 ranked the UK ahead of every G8 country except Canada and every EU country except Luxembourg Denmark and Ireland
21 Institute of Chartered Accountants of Scotland Scotlandrsquos tax future the practicalities of tax devolution November 2012
22 Ernst and Youngrsquos Scotland corporate tax survey report ldquoGrasping the thistlerdquo 23 World Bankrsquos 2012 lsquoDoing Businessrsquo survey
48 Scotland analysis Macroeconomic and fiscal performance
248 The Calman Commissionrsquos recommendations therefore balanced the existing strengths of the UKrsquos unified tax system against the potential benefits of devolving tax powers The report considered where devolving tax policy might substantially increase revenue-raising responsibility andor be an effective additional fiscal lever in existing devolved spending areas taking into account the mobility of taxes in relation to the risk of tax competition and avoidance as well as the administrative impact on business individuals and government
249 Following a rigorous assessment of the report virtually all of the key recommendations were included in a Scotland Bill and are now being implemented following the Scotland Act 2012 This will increase the autonomy and financial accountability of the Scottish Government and Scottish Parliament while ensuring that the UKrsquos tax system remains integrated and coherent
250 For example the partial devolution of income tax whereby the Scottish rate of income tax remains within the UKrsquos income tax system provides the Scottish Government with the ability to affect overall tax and spending in Scotland but minimises costs and complexity In particular the income tax structure (such as personal allowances and thresholds) remains consistent across the UK which avoids businesses running separate payroll systems and limits additional tax collection costs
251 The two fully devolved taxes (stamp duty land tax and landfill tax) apply to transactions or activities that relate to policy responsibilities of the Scottish Parliament (housing and planning and waste management respectively) and have a clear location associated with them This also keeps it simple for business and individuals and minimises any increased risk of tax evasion and avoidance which helps to avoid the need for higher government spending on compliance
252 This is a key difference between devolution and independence While selected taxes can currently be devolved in a way that benefits Scotland without adversely affecting the UK as a whole independence would ultimately lead to two completely separate and potentially competing tax systems
Scotlandrsquos tax policy flexibility introduced with the Scotland Act 2012 253 The Scotland Act 2012 transfers significant tax powers to the Scottish Parliament
Alongside these tax powers the Act also provides the Scottish Government for the first time with commensurate capital borrowing powers to support further investment in infrastructure A summary of all the Scotland Act 2012 fiscal powers is provided in Box 2C
254 The Scotland Act 2012 includes full devolution of stamp duty land tax (SDLT) and landfill tax as they apply in Scotland and partial devolution of income tax Full devolution means that the Scottish Government will be responsible for determining the tax base and the rates Or in other words they will be responsible for determining when the tax applies and how much will be paid as they already are in relation to council tax and business rates Partial devolution gives the Scottish Government the responsibility for rate-setting with the tax base (such as income tax bands) remaining the responsibility of the UK Government
Chapter 2 The UKrsquos integrated fiscal model 49
255 In terms of the value of revenues raised the income tax powers are by far the most significant The OBR estimates that the Scottish Government will raise pound50 billion in the first year of operation (2016ndash17) compared to a combined pound06 billion from SDLT and landfill tax As part of the Scotland Act 2012 an element of income tax is being devolved to the Scottish Parliament from April 2016 Specifically each of the UK rates (basic higher and additional) is to be reduced by 10p in the pound for Scottish tax-payers and will be replaced by a Scottish rate of income tax set annually by the Scottish Parliament Setting the Scottish rate at 10p would lead to overall income tax rates in Scotland remaining aligned with the rest of the UK while a rate of 11p or 9p would lead to higher or lower rates respectively being paid in Scotland
256 This replaces (and extends) the Scottish variable rate (SVR) which gave the Scottish Government the power to vary the basic rate of income tax in Scotland by up to three pence in the pound While this provided the Scottish Government with the ability to vary overall levels of tax and spending in Scotland better to reflect Scottish circumstances the power was never used However there are a number of advantages in the design of the new system In addition to requiring the Scottish Government pro-actively to set the Scottish rate each year these new powers are being implemented in such a way that the Scottish Governmentrsquos funding will be linked to the performance of the Scottish economy
257 Specifically even if the Scottish Government decides to leave overall income tax rates aligned with the rest of the UK Scotland will benefit (compared to current arrangements) if the income tax base in Scotland grows faster than in the UK but will be less well off if this tax base grows more slowly This further incentivises the Scottish Government to create the conditions for growth in the economy while continuing to shield Scotland from UK-wide shocks that the UK Government is better placed to manage
258 In advance of income tax powers being devolved stamp duty land tax and landfill tax are being fully devolved to the Scottish Parliament from April 2015 HMRC will therefore disapply these UK taxes in Scotland with the Scottish Parliament responsible for deciding whether and if so how to legislate for replacement Scottish taxes
259 While the revenues generated by these taxes are relatively modest (particularly in comparison with the devolved income tax powers) they will provide the Scottish Government with new fiscal levers in areas of policy responsibility that are already devolved (housing and planning and waste management respectively) This will enable the Scottish Government to balance for example environmental priorities against revenue raising thereby increasing their accountability
50 Scotland analysis Macroeconomic and fiscal performance
Box 2C The Scotland Act 2012 tax and borrowing powers From Royal Assent
bull Existing UK-wide taxes can be devolved andor new Scottish taxes can be created by order-making process in both the UK and Scottish Parliaments
From April 2015
bull full devolution of stamp duty land tax and landfill tax
bull borrowing powers for capital spending set at an additional 10 per cent of the Scottish Governmentrsquos capital DEL budget each year (which equates to capital borrowing of pound296 million in 2015-16 as set out in the recent Spending Round) within an overall limit of pound22 billion
bull the Scottish Government can utilise a cash reserve if devolved tax receipts are lower than forecast In addition to using an element of devolved tax revenues to build up the reserve the Scottish Government can also make discretionary payments from their existing budgets (from June 2011 to June 2016) in order to support the transition to the new system
bull borrowing powers for current spending if devolved tax receipts are lower than forecast and there are insufficient funds in the cash reserve to cover the shortfall This is limited to pound200 million per year up to an overall limit of pound500 million
From April 2016
bull Income tax will be partially devolved Each of the UK rates (basic higher and additional) is to be reduced by 10p in the pound for Scottish tax-payers and will be replaced by a Scottish rate of income tax set annually by the Scottish Parliament There will be a two or three year transitional period during which the UK Government will retain the forecasting risk
260 To help the Scottish Government manage variation between devolved tax forecasts and actual receipts a cash reserve can be built up in good years and utilised when tax revenues are lower than forecast If there are insufficient funds in the cash reserve to deal with any shortfall the Scottish Government also has access to limited borrowing powers for current spending
261 Alongside the introduction of these fully devolved taxes in April 2015 the Scottish Government will also gain borrowing powers for capital spending to support infrastructure projects
262 This package of new powers mean that the Scottish Government will have the ability to vary the levels of tax and day-to-day spending in Scotland as well as having more flexibility to decide when and how much to invest in capital projects While the majority of public services are currently devolved (health education transport housing policing etc) the Scottish Government is currently delivering public services within a fixed budget
263 The devolution of tax powers in the Scotland Act 2012 will mean that the Scottish Government will be taking decisions over both tax and spending which therefore empowers the Scottish Parliament while making the Scottish Government more accountable for raising funds as well as for spending them
Chapter 2 The UKrsquos integrated fiscal model 51
264 As part of that enhanced accountability under the arrangements set out in the Scotland Act 2012 the Scottish Government will be able to decide whether they want to retain the same level of existing public services (essentially by setting similar rates of tax to the rest of the UK) or to vary this by increasing or decreasing certain taxes This therefore enables the Scottish Government to further shape Scotlandrsquos tax and spending to reflect the needs and requirements of the people in Scotland
Chapter 2 Conclusion 265 Scotlandrsquos tax and spending is supported by the UKrsquos integrated economy and fiscal
model
bull the Scottish economy generates slightly lower per capita onshore tax revenues than the UK average while Scotland benefits from public spending that is consistently 10 per cent higher than the UK average
bull while Scotlandrsquos onshore fiscal balance is therefore weaker than the UKrsquos onshore public finances the allocation of a geographical share of North Sea tax revenues closes this gap However there is no consistent fiscal surplus in Scotland compared to the UK as a whole
266 The pooling and redistribution of tax revenues across the UK enables Scotland to exchange volatile North Sea revenues for stable and secure levels of funding
bull on average Scottish tax receipts including a geographic share of the North Sea have varied up or down by 61 per cent each year while for the UK as a whole the average annual variation in receipts is significantly lower at 37 per cent This increased volatility in Scotland is driven by offshore revenues which on average have varied by 30 per cent from year to year
bull through pooling and redistributing these revenues across the UK public spending in Scotland (in addition to being around 10 per cent higher than the UK average) has varied by around 28 per cent each year which is similar to the equivalent UK average of 30 per cent
267 Within this integrated fiscal model Scotland benefits from UK-wide services provided by the UK Government while the Scottish Government has significant policy flexibility to deliver devolved services
bull the UK Government and the UK Parliament are responsible for those areas that are essential to the integrity of the state and where all people across the UK benefit from a common approach such as defence and national security macro-economic policy foreign affairs immigration social security and pensions
bull the Scottish Government has significant policy responsibility for many of the key levers relating to economic growth (such as education skills and infrastructure investment) and for other key public services such as health social care policing justice and housing The Scottish Government also has complete flexibility over how it uses its funding to deliver devolved services
bull through the implementation of the Scotland Act 2012 new tax and borrowing powers are being devolved to the Scottish Parliament This will enable the Scottish Government to further vary the overall levels of tax and spending in Scotland
Chapter 3 The Border Effect
In the event of a vote for independence an international border would be created between an independent Scottish state and the continuing UK Over time this is likely to lead to differences in tax and welfare policy and regulatory and administrative regimes Over the longer-term some business networks might end as a result of economic historical and cultural ties being weakened
Collectively these changes would be expected to trigger a ldquoborder effectrdquo international evidence shows that flows of trade labour and capital are much larger between two regions of the same country than between two (otherwise similar) regions of two different countries This effect occurs even when there is no physical border between countries and even where trade agreements and structures such as the European Single Market are in place While historical and cultural ties between Scotland and the continuing UK will prevent an immediate fall off in flows evidence of previous separations points to the erosion of these ties as time passes Combined with regulatory divergence Scottish independence would lead to barriers to trade and obstacles to labour and capital mobility Even if the Scottish Governmentrsquos ambition of a formal sterling union between an independent Scotland and the continuing UK were to come to fruition the long term effect of this arrangement on trade flows and labour mobility could still be considerable
Replacing the current relationship between Scotland and the rest of the UK with a relationship similar to that of euro area Member States would create significant headwinds to Scottish growth Estimates suggest that the movement of people between Scotland and the rest of the UK could fall below 10000 per annum in both directions compared with average rates of over 40000 people per annum in recent years As an impediment to trade flows the border is likely to reduce the level of real income in the Scottish economy by four per cent after 30 years While Scotland can look to new markets to offset this drag on growth it is not clear whether this would compensate for the decline in trade with the continuing UK
54 Scotland analysis Macroeconomic and fiscal performance
The ldquoborder effectrdquo impact of independence on economic integration Characterising the potential border between an independent Scottish state and the continuing UK
31 In the event of Scottish independence an international border would be created between an independent Scottish state and the continuing UK This would create barriers to cross-border transactions and lead to increased costs for businesses and households operating or travelling across the border These effects would cumulate across the economy and trigger a ldquoborder effectrdquo ndash the barrier to flows of trade labour and capital created by the weakening of economic integration
32 The extent of these barriers and costs and their overall impact on the economy would depend on the exact nature of the international border that would be created between an independent Scottish state and the continuing UK Characterising this border is complicated by the fact that many aspects of the relationships between an independent Scottish state and the continuing UK would be subject to policy choices and negotiations and cannot be known prior to the referendum As described in the benefits of integration in Chapter 1 countries try to mitigate the effects of borders by pooling aspects of sovereignty in order to generate greater economic integration A recent example is the mutual recognition of travel visas between the UK and Ireland These same incentives to reduce the effect of the border would exist for an independent Scotland and the continuing UK although their ability to do so may be limited However the creation of a border would still create barriers to economic integration that do not currently exist and would require policy choices in order to mitigate these barriers
33 The Scottish Governmentrsquos ambition is that an independent Scotland would be a member of the European Union the European Single Market and of the Common Travel Area1
and that it would continue to use sterling as part of a formal currency union with the continuing UK But a range of uncertainties exists around the feasibility of these ambitions and the time-frame over which they could be achieved As discussed in Scotland analysis Devolution and the implications of Scottish independence in the event of a vote in favour of leaving the UK in the eyes of the world and in law Scotland would become an entirely new and separate state The details of the currency issue were discussed in Scotland analysis Currency and monetary policy questions around membership of the European Single Market and of the Common Travel Area will be discussed in forthcoming publications
34 This analysis uses the Scottish Governmentrsquos ambition as the baseline for characterising the potential effects of the border between an independent Scottish state and the continuing UK In practice the UK Government considers it unlikely that the proposals would be agreed and could be made to work It is important to stress that of all the potential scenarios that could materialise in the event of Scottish independence the conclusion of successful negotiations with the continuing UK and the EU to deliver these proposals would provide a model for independence that is one of the closest to existing conditions within the UK Any further changes would be likely to create additional costs
1 The Common Travel Area (CTA) is the free movement zone that allows people to travel between the UK the Republic of Ireland the Isle of Man and the Channel Islands without internal borders for immigration purposes The Scottish Governmentrsquos position is that an independent Scottish state would join the European Union All members of the European Union are legally obliged to join the Schengen Area unless they negotiate an opt-out (the UK and Ireland are the only EU members with an opt-out from the Schengen agreement) It is not clear whether an independent Scottish state would manage to secure such an opt-out Membership of the Schengen Area is not compatible with membership of the CTA
Chapter 3 The Border Effect 55
to households and businesses such as transaction costs from using a different currency as described in Box 3A As such the baseline scenario assumed for the purposes of this chapter has a more limited impact on economic integration The potential effects on the flows of trade labour and output set out in this chapter should therefore be thought of as being at the lower end of likely outcomes in the event of independence
Box 3A Currency options and transaction costs The effects outlined above are likely to be relevant no matter which format Scottish independence takes However as noted in Scotland analysis Currency and monetary policy there are a variety of currency regimes which could be adopted Any one of these options could be subject to a form of exchange rate risk if markets lack confidence in the regime This could raise the cost of capital in Scotland relative to that in the rest of the UK If Scotland issued a new currency then a further effect is likely to present itself through exchange-rate volatility DellrsquoAriccia (1999) finds exchange rate uncertainty has a small but significant negative effect on international trade between 15 EU states and Switzerland the estimates find that total elimination of exchange rate variability in 1994 could have increased bilateral trade among these countries by between five and 12 per cent1
1 Exchange rate fluctuation and trade flows evidence from the European Union DellrsquoAriccia (1999)
35 Regardless of the main characteristics of an independent Scottish state all possible models of independence would constitute a fundamental change in the economic relationship between Scotland and the rest of the UK The UK Governmentrsquos Scotland analysis Business and microeconomic framework paper explained that independence would create new costs and barriers to transactions (trade labour and capital flows) between an independent Scottish state and the continuing UK Box 3B highlights some of the costs identified in the Scotland analysis Business and Microeconomic framework paper
56 Scotland analysis Macroeconomic and fiscal performance
Box 3B Administrative and transaction costs of independence ndash Summary from the Scotland analysis Business and microeconomic framework Administrative and Transaction costs Trade
The UK domestic market guarantees a free flow of goods and services Companies which operate across the UK are generally subject to the same regulations and requirements This ensures a level playing field and further reduces the costs of intra-UK trade The creation of a border could impose costs on firms and also consumers which are likely to reduce trade across the border significantly
For example Scottish firms who sell or buy their products in the rest of the UK do not incur additional costs typically associated with exporting abroad such as the cost of custom procedures However if procedures similar to the EU are introduced there could be an increase in costs for firms of trading across the border For example in the EU where trade exceeds pound250000 per annum businesses need to complete a monthly Intrastat declaration
Administrative and Transactions Costs Labour
A single regulatory framework between Scotland and the rest of the UK creates a unified national labour market and a more transparent and efficient allocation of resources Workers employees and employers across the UK are ensured a common set of rights and responsibilities which aids labour mobility and ability of the UK to respond to economic shocks Independence would pose a risk to this labour mobility For example
bull Differences in labour market regulations in an independent Scotland could reduce labour market mobility which in turn would reduce the efficiency of the labour market to the detriment of Scotland and the rest of the UKrsquos macroeconomic performance and
bull An independent Scotland may choose or be obliged to join the Schengen area as a condition of EU membership Membership of the Schengen area would require the removal of border controls between an independent Scotland and other members of that area and the establishment of border control with other EU Member States that were outside Schengen The Scottish Government has indicated that it would wish to remain in the CTA1 rather than join the Schengen area The UK Governmentrsquos paper Scotland analysis Devolution and the implications of Scottish independence notes that membership of the CTA would be subject to negotiation with the continuing UK and all existing CTA members and that membership of the Schengen area is not compatible with membership of the CTA Should an independent Scottish state become part of either the CTA or the Schengen area it would need to align its migration policy in certain aspects with the other members of those areas These issues will be considered in a future paper in the Scotland analysis series
1 Deputy First Minister Nicola Sturgeonrsquos statement to Scottish Parliament on an independent Scotlandrsquos continuing membership of the EU 13 December 2012
Chapter 3 The Border Effect 57
Administrative and Transactions Costs Capital
Scotland is a favourable location for Foreign Direct Investment (FDI) In 2012 it attracted the second most FDI projects in the UK and would have ranked twelfth in Europe above all the comparable independent countries except Ireland This attractiveness is enhanced by being part of the UK It expands Scotlandrsquos domestic market and improves its access to skilled labour The Ernst and Young 2013 International Executive Survey provides a detailed analysis of the relative attractiveness of the UK
bull Within the UK 84 per cent of international investors surveyed thought the stable political environment was attractive placing it as the second highest rated aspect after quality of life diversity culture and language and
bull The UKrsquos market size generally emerged as highly influential in a ranking of the most important factors for international investors when evaluating the UK as a potential investment location Some foreign investors might be deterred from investing in an independent Scotland if they judge that independence had increased the costs of supplying the wider UK market
Assessing the impact of a border on economic integration between Scotland and the rest of the UK
Evidence of the ldquoborder effectrdquo
36 International evidence shows that flows of trade labour and capital are much larger between two regions of a same country than between two (otherwise similar) regions of two different countries The most well known example of this effect is trade between the US and Canada After controlling for the effects of differences in regional incomes and distance between the various regions in the two countries McCallum (1995)2 concluded that Canadian provinces traded around 20 times more with each other than with US states of a similar size and proximity The size of this result prompted further studies which reduced the size of the estimated effect but the one of the most widely cited study concludes that the border between the US and Canada reduces trade by 44 per cent3 This is the border effect ndash the clear tendency to trade more within countries rather than across borders
37 This finding has since been replicated many times and is a well established phenomenon in global trade patterns The empirical estimates vary in size but are typically large suggesting that trade within a region or state can be anywhere between two and 22 times larger than trade across an international border More recent estimates are nearer the lower end of this range but still significant For example Anderson and van Wincoop (2003)4 conclude that borders reduce trade by a factor of 54 in other words the analysis suggests that we should expect to see a trade fall of around 80 per cent when comparing trade across a border to trade without the border Box 3C summarises the evidence for the border effect
38 The border effect is not limited to trade flows and has also been shown to reduce labour and capital flows The empirical estimates are again very large For example migration is found to be one hundred times more likely within Canada than it is from the USA to Canada (Helliwell 1997)5 Iwamoto and van Wincoop (2000)6 investigate the border effect in the context of capital flows They note that issues such as transaction costs regulatory
2 National borders matter Canada-US regional trade patterns McCallum (1995) 3 Gravity with Gravitas A solution to the Border Puzzle Anderson and van Wincoop (2003) 4 Gravity with Gravitas A solution to the Border Puzzle Anderson and van Wincoop (2003) 5 National Borders Trade and Migration Helliwell (1997) 6 Do borders matter Evidence from Japanese Regional net Capital flows Iwamoto and van Wincoop (2000)
58 Scotland analysis Macroeconomic and fiscal performance
differences language barriers and different accounting practices all reduce the incentive to take on foreign assets
Box 3C Estimates of the ldquoborder effectrdquo on trade McCallum (1995)1 made the original contribution to the border effect literature by looking at the trading patterns of US states and Canadian provinces using a model of trade flows (explained in detail in Annex C) The size of the estimated effects in McCallumrsquos study gave rise to a large number of research papers which have looked to estimate the effect of international borders on trade
Wei (1996)2 looked at a panel of OECD countries to identify the effect of home bias His central estimate implied that an OECD country trades two and half more times with itself than with a trading partner controlling for distance and size Using the 11 EU states and the same approach Nitsch (2000)3 found intra-country trade to be 10 times larger than inter-country trade
Further Wolf (2000)4 found that the border effect does not limit itself to the borders between sovereign states When looking at whether there was a bias in intra-state trade relative to inter-state trade in the US he found intra-state trade was around three times higher than interstate trade
Anderson and van Wincoop (2003)5 argue that McCallumrsquos estimates fail to take account of the fact that relative as opposed to absolute trade costs are what matter for trade between regions The intuition being that it is more attractive to trade with a country or region that has low trade costs relative to the average trading costs across all countries and regions (including regions in the same country) Taking this into account they found that international borders reduce trade by a factor of 54 More recent studies include an industry level study in Spain by Llano and Requena (2008)6 who found that intra-regional trade in Spain exceed intra-national trade by a factor of 30 and furthermore that intra-national trade in Spain exceeds international trade by a factor of 10 Coughlin and Novy (2012)7 perform a similar analysis for the USA comparing intra-state trade with inter-state trade and then comparing that with international trade They find a similar result that there is a larger border effect for trade between states than for trade between states and other countries Pacchioli (2011)8
considers the extent of home bias in EU trade finding that internal trade in EU Member States is three to four times greater than internal trade in US states
Head and Mayer (2013)9 find the average border effect to be a multiple of around seven implying that trade within a country is around 85 per cent higher than trade across an international border between countries
1 National borders matter Canada-US regional trade patterns McCallum (1995) 2 Intra-national versus International trade How stubborn are nations in Global Integration Wei (1996) 3 National Borders and International Trade Evidence from the European Union Nitsch (2000) 4 Intranational Home Bias in Trade Wolf (2000) 5 Gravity with Gravitas A solution to the Border Puzzle Anderson and van Wincoop (2003) 6 The border effects in Spain an industry-level analysis Requena and Llano (2006) 7 Is the International Border Effect Larger than the Domestic Border Effect Evidence from US Trade
Coughlin and Novy (2012) 8 Is the EU internal market suffering from an integration deficit Estimating the lsquohome-bias effectrsquo Pacchioli
(2011) 9 Gravity Equations Workhorse Toolkit and Cookbook Head and Mayer (2013)
Chapter 3 The Border Effect 59
What happens when a border is created Understanding the transition effects
39 These estimates of the border effect are in many cases based on countries that have had a long separate history but they give a clear indication of the likely result as the effects of independence begin to emerge Indeed the evidence suggests that the strong links that currently exist between Scotland and the rest of the UK would be likely to erode over time in the event of independence Reorientation towards new markets would be important in ensuring the effect of the border on trade flows is minimised
310 In the short term historical and cultural ties between Scotland and the rest of the UK may mean that flows initially remain similar to the pre-independence level In the event of Scottish independence it would take time for the close business networks and cultural and historical links that currently exist between Scotland and the rest of the UK to dissolve and for the full impact of introducing an international border between the two partners to materialise Proximity language and cultural links are likely to be important for the trade of goods that depend critically on relationships between customers and firms as all these factors make trading across a border simpler7 While this is likely to dampen any effect of the border over a shorter horizon changes that have a material effect on the ability of Scottish and the rest of the UKrsquos businesses to trade with each other (see for example the discussion in Box 3B) would make it more likely that the existing networks would dissolve as time passes
311 Experience of previous separations can help assess the process of erosion of existing trade links A study by Head Ries and Mayer (2010)8 found that trade flows between countries with strong historical and cultural ties (for example colonial links) which had been severed remained buoyant in the short run but reduced by 65 per cent in the four decades between 1948 and 2006 providing initial evidence of the effect of time on strong historical and cultural ties
312 International experiences of country separation ndash such as the dissolution of Czechoslovakia in 1993 and the independence of the Irish State in 1922 ndash can help shed light on this transition process although it is important to recognise that no two separations are the same
bull The dissolution of Czechoslovakia happened at the same time as the transition from a planned economy to a market economy implying important changes to patterns of trade for both countries There were also marked differences in living standards and productivity between Slovakia and the Czech Republic which were an important causes of the collapse of the monetary union and resulted in Slovakia experiencing a long period of catching up with the Czech Republic over the 1990s and the 2000s See Box 3D for further details and
bull In 1922 Irelandrsquos GDP per capita was around half that of the UK as a whole and was largely agriculture Independence also took place prior to an important wave of trade intensification globally and at the European level See Box 3E for further details
313 Importantly for Scotland these two case studies provide further evidence that institutional and regulatory divergence as well as the dissolution of business networks and historical links can happen when a separation occurs with negative consequences for economic integration and bilateral flows of capital labour and trade A weakening of the large and dynamic flows that currently exist between Scotland and the rest of the UK would create risks for Scotland given its current exposure to trade with the rest of the UK
7 The Institutional Determinants of bilateral trade patterns De Groot et al (2004) This is built on an argument focussed on networks first described by Rauch See Business and Social Networks in International Trade Rauch (2001)
8 The erosion of colonial trade linkages after independence Head Mayer and Ries (2010)
60 Scotland analysis Macroeconomic and fiscal performance
Box 3D Case study of Czechoslovakia On 1 January 1993 Czechoslovakia split into two separate states the Czech Republic and Slovakia The immediate aftermath of the split was characterised by two key choices First the Czech and Slovak Customs Union (CSCU) was formed to minimise the economic cost of a decline in economic ties between the countries Second the states attempted to preserve monetary and economic union
Monetary union was conditional either side could withdraw if fiscal deficits or transfers of private capital between the two countries exceeded preset limits or the shared monetary policy committee failed to agree a common policy But with an uncertain political commitment and no fiscal transfers the currency union lacked credibility Thirty-three days after independence the monetary union failed
Trade data for the Czech Republic and Slovakia show that the share of bilateral trade in total trade has fallen dramatically for both countries in the first decade following the dissolution of Czechoslovakia1 Between 1993 and 2003 the share of total Czech exports going to Slovakia fell from 22 to eight per cent and the share of total Slovakian exports going to the Czech Republic fell from 42 to 13 per cent The value of bilateral trade remained broadly flat for both countries over the same period
Central and Eastern European economies experienced fundamental reforms through the 1990s abandoning the Council for Mutual Economic Assistance and transitioning from a planned economy to a market economy and these trends in trade are likely to capture other effects most notably the opening to trade with the rest of the world However as shown in the chart below the share of trade with other neighbours from the Eastern bloc held up much better suggesting that opening to trade with Western economies was only part of the explanation for the collapse in the share of bilateral trade between the Czech Republic and Slovakia
Share of total exports
Czech Republic
5
10
15
20
25
Per
cen
t
0 1993 1998 2003 2008
To Slovakia To Poland and Hungary
Slovakia
10
15
20
25
30
35
40
45
5
0 1993 1998 2003 2008
To Czech Republic To Poland and Hungary
Source International Monetary Fund Direction of Trade Statistics (IMF dots)
From the IMF Direction of Trade Statistics starting in 1993 1
Chapter 3 The Border Effect 61
Furthermore the chart below shows that since 1993 the increase in trade in the Czech Republic and Slovakia has not been markedly different from the trade performance of other Eastern European states all experiencing strong growth from a low level in 1993
Value of exports to the rest of the world for selected Eastern European countries
0
20000
40000
60000
80000
100000
120000
140000
160000
180000
200000
Slovakia
Czech Republic
Bulgaria
Romania
Slovakia
Poland
Hungary
US
dol
lars
1993 1996 1999 2002 2005 2008 2011
Source International Monetary Fund Direction of Trade Statistics (IMF dots)
Kaminski and Smarzynska (2003)2 note that a number of new obstacles to trade were created along with the creation of two states ndash separate currencies administrative procedures required to control origin of traded goods and ldquocreeping-inrdquo of different technical standards The quick disappearance of monetary union exacerbated the decline in trade as did the devaluation of the Slovak koruna against the Czech koruna and the establishment of a complicated payment system Faced with a large deficit Slovakia introduced other barriers to imports from the Czech Republic including import taxes quotas on imports of nonshyalcoholic beverages and beer and burdensome technical certification procedures
2 Never too late to get together again Turning the Czech and Slovak Customs Union into a stepping zone to EU Integration Kaminski and Smarzynska (2003)
62 Scotland analysis Macroeconomic and fiscal performance
Box 3E Case study of Ireland In 1922 the 26 counties of the Irish Free State gained political independence having been part of the UK since the 1800 Act of Union At that time Ireland traded almost exclusively with the UK ndash 90 per cent of Irelandrsquos total trade was with the UK1 This continued to be the case in the first few years following independence However the ldquoeconomic warrdquo in which Ireland introduced protectionist measures saw the UKrsquos share of total Irish trade drop rapidly from around 90 per cent to 65 per cent (see chart below) After rebounding to near pre-protectionist levels after 1938 the UKrsquos share of Irelandrsquos trade has since been in long-term decline despite a UK-Irish free trade agreement being signed in 19652 This decline may have accelerated slightly after 1973 when both the UK and Ireland entered the European Economic Community causing Irish trade to further divert to other European countries The breaking of the punt-sterling link in 1979 did not appear to have any significant effect on the pattern of trade between the UK and Ireland3 For comparison the share of Scottish exports accounted for by the rest of the UK is approximately 60 per cent
UK Share of Irish Trade
100
20
30
40
50
60
70
80
90
Per
cen
t
10
0
1924 1934 1944 1954 1964 1974 1984 1994 2004
Source Thom amp Walsh 2001
Irish independence is also likely to have reduced Irish trade with the UK first through the consequences of the initial economic war and then through the progressive divergence between the Irish and UK economies despite institutional links such as the Anglo-Irish free trade agreement Thom and Walsh (2001)4 point to the gradual weakening of social and cultural ties as well as the emergence of differences in legal systems both contributed to the decline of trade between Ireland and the UK
Further evidence on how the passage of time has weakened the ties with the UK comes from Fitzsimmons Hogan and Neary (1999)2 who model trade flows between Northern Ireland and the Republic of Ireland While they find trade between the two remains higher than is predicted by their model trade between Northern Ireland and the Republic of Ireland is of a magnitude lower than that estimated for Scotland by the model in this paper
1 The effect of a common currency on trade Ireland before and after the Sterling link Thom and Walsh (2001) 2 The effect of a common currency on trade Ireland before and after the Sterling link Thom and Walsh (2001) 3 The effect of a common currency on trade Ireland before and after the Sterling link Thom and Walsh (2001) 4 The effect of a common currency on trade Ireland before and after the Sterling link Thom and Walsh (2001) 5 lsquoA Gravity model for North-South Tradersquo Fitzsimmons et al (1999)
Chapter 3 The Border Effect 63
How big could the border effect be
314 One way to estimate the likely effect of establishing an international border between Scotland and the UK is to compare current levels of trade and migration with the levels of trade and migration between euro area Member States The relationships between euro area countries have many of the same characteristics as the Scottish Governmentrsquos proposed model of Scottish independence and its relationship with the continuing UK they are members of the EUrsquos single market with a free movement of people share a common currency and in a number of cases a common border and language and social and cultural links are often strong
315 As already discussed earlier Scotland analysis papers have already established that such an outcome is unlikely In particular the Scotland analysis Currency and monetary policy paper explained that the economic rationale for the UK to agree to enter into a formal sterling union with a separate state is not clear But even if the continuing UK were to agree to a formal sterling union trade and migration flows between an independent Scotland and the continuing UK might be expected over time to resemble the flows between euro area Member States A summary of the approach used to calculate the border effect is described in Box 3F with a more detailed explanation set out in Annex C In brief the approach is to look at the effect of replacing the current relationship between Scotland and the rest of the UK with a relationship similar to that of euro area Member States after allowing for differences in economic size distance to markets and language
316 The results presented in this paper are based on the lower end of estimated effects to reflect the huge uncertainty around the future path of Scotland as an independent economy as well as the close cultural and social ties between Scotland and the UK Taking these factors into account the results remain in line with those obtained in other empirical studies Actual outcomes will depend critically on how policies adopted by the two states affect the ease of trading across the border and hence the rate at which current high levels of integration might be eroded
317 Taking the lower end of the estimates suggests that exports from an independent Scotland to the continuing UK would be 83 per cent lower after 30 years than if Scotland were to remain a part of the UK Exports from the rest of the UK to Scotland would be 77 per cent lower Migration flows could fall below ten thousand per annum in both directions compared with average rates of over 40000 people per annum in recent years
64 Scotland analysis Macroeconomic and fiscal performance
Box 3F Estimating the trade and migration effects if Scotland and the rest of the UK were to adopt a euro area-like relationship ndash an empirical study The first step is to identify how the patterns of trade and migration between different euro area Member States are influenced by the characteristics of any pair of euro area partners This is done by estimating a ldquogravityrdquo model of trade Put simply these models estimate trade flows based on the economic size of the countries involved the distance between them and other factors relevant to trade such as the use of a common language
The estimated effects of each characteristic are then applied to Scotland and the rest of the UK (given their size proximity and common language) to calculate what trade and migration flows could be if the relationship were similar to that between euro area Member States A more detailed explanation of the methodology can be found in Annex C
The calculated flows can then be compared with those currently observed between Scotland and the rest of the UK The difference between the flows gives an idea of the possible order of magnitude of the effect of the border under the current proposals from the Scottish Government
Results from estimating the trade gravity equation
Pooled Ordinary Least Squares
(1) Range of Predicted Values for Scottish Exports to rUK 2002-2011 (pound billion) 45-55
(2) Actual Value of Scottish Exports to rUK 2002-2011 (pound billion) 325
1-[(1)(2)] Range of Implied Border Effect 83-86
(1) Range of Predicted Values for rUK Exports to Scotland 2002-2011 (pound billion) 80-100
(2) Actual Value of rUK Exports to Scotland 2002-2011 (pound billion) 426
1-[(1)(2)] Range of Implied Border Effect 77-81
Note Equation fully specified in the Annex
Source HMT calculations
Results from estimating the migration gravity equation
Pooled Ordinary Least Squares
(1) Range of Predicted Values for Scottish Migration to rUK 2002-2010 4292-8158
(2) Actual Value of Scottish Migration to rUK 2002-2010 43809
1-[(1)(2)] Range of Implied Border Effect 81-90
(1) Range of Predicted Values for rUK Migration to Scotland 2002-2010 2346-4555
(2) Actual Value of rUK Migration to Scotland 2002-2010 52195
1-[(1)(2)] Range of Implied Border Effect 91-96
Note Equation fully specified in the Annex
Source HMT calculations
Chapter 3 The Border Effect 65
The effect on living standards
318 Barriers to the flow of goods and labour between economies are likely to reduce a countryrsquos level of output and lower living standards (see Box 3G) This means that the potential effect of changes in trade levels due to the creation of an international border between Scotland and the rest of the UK can be translated into an effect on real income (Arkolakis Costinot and Rodriguez-Clare (2012)9 suggest a straightforward framework) Employing this methodology the loss of trade implied by the analysis in this paper suggests a reduction in real income in Scotland of around four per cent after 30 years10
Applying the same methodology to the UK implies a reduction in real income of around 02 per cent The reason for the contrasting results rests on Scotlandrsquos dependence on trade with the continuing UK which accounts for around 60 per cent of total Scottish exports compared to Scotland accounting for just 13 per cent of continuing UK exports11
319 There is a great deal of uncertainty over the time period which this effect is likely to occur and the extent to which the loss of trade between Scotland and the continuing UK may be offset by the reorientation of trade towards other parts of the world Head et al (2010)12
use a period of four decades to estimate the fall in trade from the breaking of colonial links while evidence presented from the case study of Czechoslovakia shows that the erosion of trade links may happen over a shorter timescale Further evidence on integration effects on sovereign states forming a currency union suggests a period of 20 years (Bun and Klassen (2002))13 The table below summarises the link between changes in trade and real incomes including the impact on growth rates over 30 years
Table 3C Impact of Scottish Independence on output and growth in Scotland and the continuing UK
Scotland Continuing UK
Fall in bilateral exports (per cent) 83-86 77-81
Total Effect on real income (percentage points) -4 -02
Effect of the growth rate of real income over 30 years -013 -002 (percentage points)
9 New Trade models Same old Gains Arkolakis et al (2012) 10 The details of this analysis are set out in Annex C 11 The global connections survey has the rest of the UK accounting for 66 per cent of Scottish exports in 2011
whilst the Scottish National Accounts Project 2012Q3 has the rest of the UK accounting for 58 per cent of Scottish exports in 2011
12 The erosion of colonial trade linkages after independence Head Mayer and Ries (2010) 13 Has the Euro increased trade Bun and Klassen (2002)
66 Scotland analysis Macroeconomic and fiscal performance
Box 3G The effect on real incomes from declining trade flows alternative Scenarios based on European Countries Another way of gauging the impact of a reduction in trade flows on real income in Scotland is to compare the share of expenditure on domestic goods with a range of small European countries
Countries gain from trade through sourcing goods from other countries with lower production costs That way a country benefits from more advanced technology and productivity abroad via imports A reduction in gross trade flows all else being equal implies that a country will spend a higher proportion of its income on domestic goods
Using the Arkolakis et al (2012)1 methodology Table 3D highlights that if the share of expenditure on domestic goods in Scotland increased in line with other small independent countries in Europe there would be a reduction in real income While the results below are also consistent with the fall in trade between Scotland and the continuing UK estimated using the gravity model the size of the reduction depends importantly on how and to what extent Scotland may be able to offset the expected decrease in trade with the UK through trade with other countries
Table 3D Effect of decline in trade flows on real income
Share of expenditure on domestic goods Difference with Scotlandrsquos Effect on share of expenditure on real income domestic goods in 2011
Austria in 2009 81 +11ppt -29
Denmark in 2009 85 +15ppt -38
Finland in 2009 87 +17ppt -43
Ireland in 2007 83 +13ppt -33
Portugal in 2006 83 +13ppt -33
Sweden in 2008 82 +12ppt -31
Source Latest available data from OECD STAN indicators Rev3 2011 and Scottish National Accounts Project Tables from 2012Q3
The methodology is described in more detail in Annex C
1 New Trade models Same old Gains Arkolakis et al (2012)
Conclusion 320 Evidence suggests that international borders reduce economic integration impeding flows
of goods capital and labour even where countries are members of single markets with low formal barriers to trade the so called ldquoborder effectrdquo Empirical estimates suggest that even if an independent Scottish state was part of the European Single Market with the continuing UK and the Scottish Government was able to achieve its aims of a formal sterling currency union Scottish exports to the continuing UK could be reduced by around 80 per cent Migration flows could fall below 10000 per annum in both directions compared with average rates of over 40000 people per annum in recent years As an impediment to trade flows the border is likely to reduce the level of real income in the Scottish economy by four per cent over a 30 year period While Scotland can look to new markets to offset this drag on growth it is not clear whether this would compensate for the decline in trade with the continuing UK Even if Scotland did increase trade with other countries the income lost in the intervening period would not be regained
Chapter 4 Managing volatility in the public finances
In the event of independence Scotland would be directly exposed to a narrower tax revenue base and more volatile fiscal position A stabilisation mechanism to smooth the public finances is likely to be required An independent Scottish state could try to smooth its public finances as a small country and manage declining oil and gas reserves by establishing an oil fund
While the economic rationale for establishing one is clear an oil fund would come at a price Scotland is currently far from having the sustainable fiscal position that would make such a fund viable Implementing an oil fund in a similar way to Norway would imply very significant cuts to public spending or tax increases over and above the plans that have been set by the UK Government to repair the impact of the financial crisis Based on forecasts by the Centre for Public Policy for Regions for an independent Scotland to start an oil fund in 2016-17 from a balanced budget additional fiscal consolidation of 51 per cent of GDP (pound84 billion in real terms) would be needed That implies spending cuts of 13 per cent from current levels or onshore tax rises of 18 per cent To then begin contributing to the fund more fiscal consolidation would be required on top of that
It would take considerable time to build up a fund of adequate size to manage volatility in the public finances Assuming an independent Scotland started a Norwegian-style oil fund in 2021-22 Scotlandrsquos oil fund after 20 years of contributions would reach less than a tenth of the current size of the Norwegian fund (after 17 years of contributions)
Scotland achieves many of the benefits of an oil fund within the UK The UKrsquos integrated fiscal model provides a very stable flow of Scottish expenditure without Scotland having to run the very tight fiscal policy required for an oil fund
41 Chapter 2 explained that firstly Scotland benefits from the more diverse UK stabilising the Scottish fiscal position and the volatile nature of its revenue base in particular North Sea oil and gas Secondly Scotland benefits from the UKrsquos broader tax base which allows stable public spending to be resourced across a wider and more diverse set of revenue streams
42 There would be two fundamental fiscal consequences if Scotland became an independent country
bull an immediate end to Scotlandrsquos inclusion within the UKrsquos fiscal model which would lead to the end of risk-sharing through pooled and redistributed tax revenues (fiscal
70 Scotland analysis Macroeconomic and fiscal performance
transfers) Scotland would therefore rely on a narrower and more volatile tax base to fund spending on public services and
bull the break-up of the UKrsquos integrated tax system with a completely separate tax system being implemented in Scotland This could lead to implications for business individuals and both governments
The case for an oil fund and its implications 43 In the event of independence Scotlandrsquos reliance on oil and gas revenue would leave its
public finances vulnerable to fluctuations in prices and production and a declining stock of oil over time Managing the challenge of a narrower and more volatile revenue base is essential to ensuring fiscal sustainability A stabilisation mechanism is likely to be required The Scottish Governmentrsquos Fiscal Commission Working Group recommended that it ldquoshould seek in principle to establish a stabilisation fund such as an Oil Fundrdquo1
44 Many small and emerging countries with similar reliance on revenues from commodities have established some form of stabilisation fund Funds vary in their transparency but the largest appear to be those of Norway Saudi Arabia the United Arab Emirates Kuwait Qatar and Russia The Norwegian oil fund is most often cited as a model for Scotland to follow More detail on the Norwegian experience is set out in Box 4A
45 Only a small share of UK total revenue comes from oil and gas and the UK has a broad tax base overall meaning the UK does not require an oil fund to manage volatility in oil revenues Oil and gas receipts have averaged 15 per cent of overall UK revenue fluctuating within a range of 15 percentage points compared with average oil and gas receipts of 135 per cent for Scotland since devolution fluctuating within a range of 15 percentage points2 The merits of an oil fund were considered by the UK Government when North Sea oil and gas was discovered in the 1970s but the government of the day decided not to set up such a fund Other large developed economies have chosen not to set up national oil funds including the United States and Canada despite being the second and sixth largest oil producers in the world and receiving revenues at the federal level3
Economic rationale for an oil fund 46 The concept of an oil fund is to divert oil revenues from a governmentrsquos finances to a
standalone fund that generates income The income can be withdrawn now or in the future to improve the governmentrsquos onshore fiscal position Economically the principle behind setting up an oil fund is to maintain the nationrsquos capital stock by creating a financial asset above ground to offset the depletion of oil below ground By maintaining the nationrsquos capital stock an oil fund can transfer resources between generations It allows future generations to benefit from the future financial market value of the fund thus providing them compensation for the depletion of oil by the current generation
47 An oil fund can also provide an economic stabilisation function to lessen the impact of changes in oil production and oil price volatility on the wider economy In a country heavily reliant on oil exports volatility in the international oil price can have significant negative
1 The Scottish Government (2013) Fiscal Commission Working Group First Report Macroeconomic Framework page 20
2 Scottish Government GERS HM Revenue amp Customs Government Revenues from UK oil and gas production Assuming a geographical share of North Sea oil and gas revenues
3 International Energy Agency (2012) Key World Energy Statistics
Chapter 4 Managing volatility in the public finances 71
effects on wider prices in the economy and the exchange rate As is discussed in Scotland analysis Currency and monetary policy (see Box 1C page 35)4 an increase in oil prices or production can lead to an appreciation of the real exchange rate (when exchange rates are flexible) andor higher domestic inflation This can have a negative impact on the non-oil export sector by making it uncompetitive (ldquoDutch diseaserdquo)5 This can have long-term negative costs for the economy especially if the non-oil export sector provides wider benefits to the economy (eg from knowledge spillovers) Volatility in the real exchange rate of the non-oil sector can also discourage investment
48 Although the outcome of any negotiations that would be required over the split of oil and gas reserves in the event of independence is uncertain an independent Scottish state will be much more exposed to the oil and gas sector than the UK economy as a whole The real exchange rate of an independent Scottish state would be expected to be much more directly influenced by changes in the price or production of oil and gas An oil fund could help mitigate these effects regardless of the currency arrangement in a monetary union either with sterling or the euro an oil fund could provide a useful counter for occasions when a one-size-fits-all monetary policy is not appropriate for an independent Scotland if an independent Scotland had its own currency an oil fund could help to dampen the negative effects on non-oil export sector competitiveness (Dutch disease) through oil fund investments abroad
Fiscal implications of an oil fund 49 While the economic rationale for establishing one is clear an oil fund would come at a
price Currently revenues from oil and gas fund public spending in Scotland (and across the UK) If any government in an independent Scotland wished to establish an oil fund it would need to divert oil and gas revenues from the governmentrsquos finances to a standalone fund the money cannot be spent twice That implies raising onshore tax revenues or cutting spending in order to maintain the governmentrsquos level of fiscal deficitsurplus An independent Scottish state is unlikely to be able to contribute significantly to an oil fund without taking radical action to put its public finances in a much stronger position As the Centre for Public Policy for Regions (CPPR) comment ldquothe Scottish Government would need to rely on most or all of the tax revenues from the North Sea simply to attain the current implicit level of annual fiscal deficit This would mean that no such revenues would be available to build up a Sovereign (Oil) Fund or at least not without tax increases or budget cutsrdquo6
410 Even phased over a number of years once the current challenges in the public finances have been addressed the fiscal adjustment required is very large How much fiscal policy would need to be tightened over the medium term to afford an oil fund would depend on the evolution of Scotlandrsquos economy and public finances The analysis below sets out the potential scale of the challenge
4 HM Government (2013) ldquoScotland analysis currency and monetary policyrdquo 5 ldquoDutch diseaserdquo is named after the economic crisis that affected the Netherlands in the 1960s following the
discovery of North Sea gas and the sharp appreciation in the Dutch guilder 6 Centre for Public Policy for Regions (2013) ldquoReflections on the latest Oil and Gas related analysis by the Scottish
Government and the Office for Budget Responsibilityrdquo
72 Scotland analysis Macroeconomic and fiscal performance
Box 4A Norwayrsquos oil fund Until the mid-1990s a large proportion of Norwegian oil revenues were used to improve the governmentrsquos finances In 1990 Norway chose to establish an oil fund now known as the Government Pension Fund Global (GPFG) to ensure that the economy would not remain dependent on this non-renewable resource The first net contribution of revenues to the fund took place in May 1996 By the end of 2012 the market value of the GPFG was over pound400 billion using current exchange rates (NOK 3816 billion over 150 per cent of GDP) By 2019 the fund is forecast to be worth over pound675 billion (NOK 6410 billion)1
Under a mandate set by the Ministry of Finance the GPFG is managed by Norges Bank Investment Management (NBIM) As NBIM set out ldquothe fund was set up to give the government room for manoeuvring in fiscal policy should oil prices drop or the mainland economy contract It also served as a tool to manage the financial challenges of an ageing population and an expected drop in petroleum revenue The fund was designed to be invested for the long term but in a way that made it possible to draw on when required The fund was called the Petroleum Fund until 2006 when it was renamed the Government Pension Fund Global The change highlighted the fundrsquos role in saving government revenue to finance an expected increase in future public pension costs Despite its name the fund has no formal pension liabilitiesrdquo2
The fundrsquos capital inflow consists of all government oil revenue net of government expenditure on petroleum activities The capital is invested internationally to avoid overheating the Norwegian economy 60 per cent of the fund is invested in equity 35 to 40 per cent in fixed-income markets and the remainder in property
Norway only contributes to the fund when the overall budget including oil revenues is in surplus For the first years of the fund from 1990 to 1996 the public finances were in deficit so no contributions were made This fiscal position was relatively unusual for Norway which since the Second World War has generally run a budget surplus of two-four per cent of GDP3
The government can make transfers back from the fund each year to improve the public finances which partly offset the oil revenues that flow into the fund In 2001 the government set a spending rule that no more than the expected return of the fund estimated at four per cent of the fundrsquos capital in real terms should be returned to the governmentrsquos finances each year Fiscal policy is set in line with that On a cyclically-adjusted basis the non-oil deficit is set to broadly match the four per cent return over time while allowing for some flexibility around this Figure 1 set outs the flow
Norwegian oil fund mechanism
Oil revenues and return on
investments
Fund Transfer to finance
non-oil budget deficit
Non-oil revenues
Public finances
Expenditure
Spending rule Spend only the annual real return on the fund
(estimated at 4 annually)
Chapter 4 Managing volatility in the public finances 73
The GPFG has been described as a model for other natural resource exporters and there is a broad consensus in Norway and internationally on its strengths including from the IMF However like any policy it is not a panacea In its assessment of the Norwegian economy the IMF sets out three issues for the future4
bull the expected real return assumption of four per cent per year might prove too optimistic The average return to date has been below four per cent
bull Norwayrsquos long-run health pension and other costs associated with an aging population are ldquofar in excess of what could be financed from the GPFGrdquo The IMFrsquos assessment is that in the long term Norway will need to raise taxes (from already-high levels) cut other expenditure sharply or take other measures to contain age-related pressures and
bull if oil prices were to enter a prolonged decline during the remaining years of near-peak production the total assets of the GPFG could be significantly lower than expected If fiscal transfers from the fund did not reduce in line with this the fund would be further depleted
1 Norwegian Ministry of Finance (available at wwwregjeringennoendepfin Norges Bank Investment Management (available at wwwnbimnoen)
2 wwwnbimnoenAbout-usGovernment-Pension-Fund-Global 3 Martin Skancke (2003) ldquoFiscal policy and petroleum fund management in Norwayrdquo in Jeffrey M Davis (ed)
Fiscal Policy Formulation and Implementation in Oil-Producing Countries Washington DC International Monetary Fund
4 International Monetary Fund (2013) Concluding Statement of IMF Article IV Mission to Norway
411 As an accepted model for developed resource-exporting countries the Norwegian experience offers several important lessons for an independent Scottish state in setting up an oil fund As set out in Box 4A Norway only contributes revenues to the fund when its overall public finances are in surplus Despite creating the fund in 1990 it was not until May 1996 that any contributions were made reflecting the fact that Norway ran a budget deficit over this period
412 If an independent Scottish state were to adopt the Norwegian model and only contribute to a fund when it has a budget surplus it would face a difficult set of fiscal choices Scottish Government figures show that after the oil peaks of the 1980s Scotland has run a fiscal surplus only once The average position from 1999-00 to 2011-12 is a deficit of 37 per cent of GDP even assuming a geographical share of oil revenues7
413 The gap that Scotland faces to achieve fiscal balance (neither surplus nor deficit) and start a fund can be quantified in various ways
bull as set out above Scotlandrsquos average fiscal position since devolution is a deficit of 37 per cent of GDP or pound52 billion8 A fiscal consolidation of pound52 billion equates to reducing public spending in Scotland by fully eight per cent from current levels Or equivalently increasing onshore tax revenues by 11 per cent and
bull the Centre for Public Policy for Regions (CPPR) has produced medium-term projections for the Scottish public finances as part of the UK In 2016-17 they project a deficit for Scotland (including a geographic share of oil revenues) of 51 per cent9
7 Scottish Government GERS 8 In real terms 2011-12 prices calculated using the UK GDP deflator outturn and forecast 9 Centre for Public Policy for Regions (2013) ldquoAnalysis of Scotlandrsquos Past and Future Fiscal Positionrdquo
74 Scotland analysis Macroeconomic and fiscal performance
of GDP or pound84 billion in real terms10 That implies spending cuts of 13 per cent from current levels more than three-quarters of what the Scottish Government spent on health last year or onshore tax rises of 18 per cent
414 For context on the level of spending adjustments required under the UKrsquos current fiscal consolidation programme Scotlandrsquos total departmental spending is set not to fall in cash terms but increase by around one per cent from 2010-11 to 2015-16
415 The implied spending cuts or tax rises are very large and difficult to imagine without fundamental shifts in the shape of Scotlandrsquos public sector and society It is important to be clear that fiscal consolidation on this scale is what is required just to be in a position to start contributing to an oil fund as Norway was in 1996 The spending cuts or tax rises set out above are what is needed before the first revenues flow into the oil fund To build up an effective fund Scotland would of course need to divert a significant proportion of its oil revenues from the public finances To do that and maintain a balanced budget would require further consolidation
416 In 2016-17 the independent Office for Budget Responsibility forecasts that UK oil and gas revenues will be around pound48 billion11 or pound44 billion in real terms (2011-12 prices) An independent Scottish statersquos share of these revenues is far from clear but if revenues were split geographically as of 2011-12 Scotlandrsquos share would amount to around pound41 billion in real terms If in 2016-17 Scotland chose to allocate these revenues to a fund it would require further fiscal consolidation of this amount on top of the spending cuts or onshore tax rises set out above in order to maintain a balanced budget Based on the CPPR forecast for the underlying deficit that takes the total spending cuts or tax rises required by 2016-17 to pound125 billion in real terms In total spending would have to fall by 19 per cent from current levels or onshore taxes rise by 27 per cent It is very difficult to see how changes of this magnitude would be credible for a newly-formed Scottish state
417 So an independent Scottish state may well choose to see contributing to an oil fund as a long-term ambition rather than a realistic near-term possibility ndash as acknowledged by the Fiscal Commission Working Group12 That might give more time to phase in a fiscal adjustment However it would come at the cost of spending rather than saving the declining oil revenues in the meantime diminishing the total size and effectiveness of the eventual fund And importantly the fiscal challenge will not necessarily become any easier to tackle after the current programme of consolidation is complete An independent Scottish state is likely to face a significant burden of age-related fiscal pressures and higher debt servicing costs as a proportion of national income than it currently pays as part of the UK Future Scotland analysis work will explore these issues in more detail
418 Even if an independent Scotland were able radically to adjust fiscal policy and implement an oil fund it would not resolve Scotlandrsquos fiscal challenges And while Norwayrsquos fund has brought it great benefits comparisons with the hypothetical fund of an independent Scotland should be made with caution
bull comparisons with the wealth of Norwayrsquos fund should take into account the very different resource positions of the two countries The Norwegian area of the North Sea has substantially more oil remaining than the UKrsquos It is estimated that Norway has around 47 billion barrels of oil equivalent (boe) remaining while up to 20 billion boe are
10 In real terms 2011-12 prices calculated using the UK GDP deflator outturn and forecast 11 Office for Budget Responsibility (March 2013) Economic and fiscal outlook 12 ldquoIn the near term [an independent Scottish state] would therefore have to use North Sea revenues to fund
current public services and reduce public sector borrowingrdquo Page 167 Scottish Government (2013) Fiscal Commission Working Group First Report Macroeconomic Framework
Chapter 4 Managing volatility in the public finances 75
estimated to remain in the UK Continental Shelf13 Norwayrsquos remaining reserves are therefore at least double the UKrsquos of which the reserves of an independent Scottish state would form a proportion
bull an independent Scottish state may well find that even a very large oil fund proves insufficient on its own to tackle future fiscal costs Like most developed countries Norway faces a challenging demographic profile The IMF set out that despite the oil fundrsquos vast size (over 150 per cent of GDP) healthcare pension and other ageing costs will still be ldquofar in excess of what could be financed from the [fund]rdquo14
bull as the CPPR set out ldquothe government of an independent Scotland would be more reliant than Norway on using tax revenues from the North Sea to balance its budgetrdquo ldquoat present (2012-13) levels of expected UK North Sea tax revenues Scotland would need to use all such funds just to compensate for the loss in (higher) spend per head on public services as a result of leaving the UKrdquo15 Therefore it would take considerable time for an independent Scotland to build up an oil fund of significant size so the fund is unlikely to be in a position to smooth fiscal volatility for several years and
bull assuming revenues are invested in a portfolio of assets the fund itself is exposed to volatility in the value of the underlying investments Over time this should be substantially lower than that of oil revenues But like any investment an oil fund is not a risk-free proposition and the more ambitious the expected investment returns are the more risky it is likely to be
419 The analysis of receipts and spending volatility within the UK in Chapter 2 shows how Scotland achieves many of the key benefits of an oil fund simply by remaining within the UK The UKrsquos integrated fiscal model has provided a very stable flow of Scottish expenditure without the need for Scotland to run the fiscal surpluses required for an oil fund
420 Alongside its recommendation for Scotland to establish an oil fund the Fiscal Commission Working Group set out an alternative option for a stabilisation fund ndash a ldquodeficit-funded oil fundrdquo In this model Scotland would contribute oil revenues into a fund even while running a fiscal deficit When oil revenues exceed forecasts the difference (ldquoupside surpriserdquo) could be transferred Whilst this is technically possible unlike the Norwegian fund this model would imply increasing government borrowing and it is a not a model commonly associated with sovereign states operating oil funds for the reasons described below
bull if only upside surprises on oil revenues were used building a fund of an effective size is likely to take a very long time given no contributions would be made in the average year Modelling later in this section finds that a stabilisation fund would reach only a little over 2 per cent of GDP after a decade and little over 35 per cent of GDP by 2040-41 ndash far beneath the level required to provide effective stabilisation in a fiscal crisis
bull establishing such a fund eliminates the benefit of upside surprises to the budget from oil and gas revenues coming in above forecast That is equivalent to increasing the
13 Available at Norwegian Petroleum Directorate website wwwnpdno (converted into barrels of oil equivalent) Available at Department for Energy amp Climate Change website wwwgovukgovernmentorganisations department-of-energy-climate-change
14 International Monetary Fund (2013) Concluding Statement of IMF Article IV Mission to Norway 15 CPPR (2013) ldquoReflections on the latest Oil and Gas related analysis by the Scottish Government and the Office
for Budget Responsibilityrdquo
76 Scotland analysis Macroeconomic and fiscal performance
central expected path of borrowing since whilst upside surprises are diverted from the budget downside surprises (revenues undershooting forecasts) would need to be financed by higher borrowing As Martin Skancke commented in an IMF publication ldquofrom an asset management point of view [contributing to an oil fund whilst running a budget deficit] would hardly make senserdquo since ldquothe government would be forced to borrow money to cover allocations to the fundrdquo16 Moreover markets may demand higher interest rates on this borrowing And the extra borrowing adds to debt and comes with a debt interest cost (even without higher interest rates) This would reduce the room for spending on public services and
bull finally because contributions to the oil fund in this manner would add to borrowing and debt it is far from clear that the oil fund would be able to play an effective stabilisation role during a fiscal crisis
421 So the option of a ldquodeficit-funded oil fundrdquo is unlikely to escape fully the requirement for significant fiscal tightening to achieve an oil fund of a meaningful size and effectiveness
422 The scale of the fiscal challenge reinforces the fact that the task of smoothing volatility in oil revenues is far better served by the UKrsquos integrated fiscal model As set out in Chapter 2 by pooling tax receipts the UK has delivered stable and secure Scottish spending without the need for the very tight fiscal policy required to start an oil fund
Modelling an oil fund for an independent Scottish state 423 The section above has set out the radical scale of the spending cuts or tax rises needed
for an independent Scottish state to be able to contribute to an oil fund This section quantifies what such an oil fund might look like if an independent Scotland chose to undertake that level of spending cuts and tax rises
424 As set out above in Box 4A Norwayrsquos fund is a potential model for Scotland Norway contributes all of its offshore revenues to its oil fund and withdraws the real-terms return of the investments in the fund each year to benefit the public finances Norway assumes that the long-term average real return of the fund is 4 per cent and withdraws approximately that amount per year
425 What might such a fund look like for an independent Scottish state The key variables are the future path of oil revenues the year in which the fund is started what percentage of revenues flows into the fund each year what percentage of returns are withdrawn each year and the investment return of the fund
426 The future path of oil revenues reflects the independent Office for Budget Responsibilityrsquos central forecast as set out in the 2013 Fiscal sustainability report According to the OBR there is an equal probability of revenues coming in higher or lower An independent Scottish statersquos share of these revenues is far from clear but for the purposes of this modelling revenues are split geographically The Scottish share of UK revenues is assumed to remain at the 2011-12 percentage (94 per cent) All oil revenues flow into the fund and the real return of the fund is withdrawn each year following the Norwegian model As per the Norwegian fund the real return over time is assumed to be four per cent This may be optimistic the IMF note that actual returns have fallen short of four per cent historically17
16 Martin Skancke (2003) ldquoFiscal Policy and Petroleum Fund Management in Norwayrdquo in Jeffrey M Davis (ed) Fiscal Policy Formulation and Implementation in Oil-Producing Countries Washington DC International Monetary Fund
17 ldquoThe average rate of return over the life of the GPFG has been below 4 percent and experience with similar asset portfolios over longer periods indicates that returns are likely to be lowerrdquo International Monetary Fund (2013) Concluding Statement of IMF Article IV Mission to Norway
Chapter 4 Managing volatility in the public finances 77
427 The assumptions set out above for modelling a Norwegian-style oil fund for Scotland and the steps to calculate the estimated increase in the value of the fund in a given year are set out in the table below
Modelling a Norwegian-style oil fund for Scotland assumptions and methodology
Steps to calculate estimated increase in the nominal value of the oil fund in a given year of operation
Source
UK oil revenue forecast for that year OBR 2013 Fiscal sustainability report
multiplied by
Scottish geographical share of revenues in 2011-12 (94 per cent) Scottish Government Government Expenditure and Revenue Scotland 2011-12
equals
Notional Scottish geographical oil revenue forecast in that year Calculation
plus
Nominal annual return on the fund (4 real return per year + GDP HM Treasury calculation using annual real return of 4 per cent deflator)a consistent with assumptions of Norwegian fund GDP deflator
from OBR 2013 Fiscal Sustainability report
minus
Withdrawal in that year (equal to an assumed 4 real return on the value of fund at the end of that year)b
HM Treasury calculation
equals
Net increase in the nominal value of the fund in that year Calculation
a In each year the notional nominal annual return on the fund is calculated by multiplying the nominal rate of return ndash 4 per cent in real terms (consistent with real return assumed in Norwegian fund) plus the GDP deflator of 22 from 2021-22 used in the OBR 2013 Fiscal sustainability report ndash by the nominal value of the fund at the end of the previous year plus the oil revenue inflow in the current year gross of withdrawals This is the most favourable assumption for the calculation of returns in fact oil revenue is more likely to flow in over the course of the year and withdrawals may not be at the end of the fiscal year Both of these effects would serve to reduce actual returns
b In each year the withdrawal is calculated by multiplying the real rate of return ndash 4 per cent in real terms (consistent with real return assumed in Norwegian fund) ndash by the nominal value of the fund at the end of the current year (ie the nominal value of the fund at the end of the previous year plus the oil revenue inflow in the current year)
428 As set out above the fiscal consolidation needed to start an oil fund in 2016-17 and contribute all oil revenues is a massive pound125 billion in real terms implying 19 per cent lower public spending or 27 per cent higher onshore taxes So the central scenario modelled in this paper assumes that an oil fund is started five years later in 2021-22 Starting later would still require an extremely challenging fiscal consolidation not least as demographic pressures on the public finances will be starting to bite
429 Chart 4A models an oil fund for Scotland Some commentators have focussed on the total size of the fund But the annual withdrawal to benefit the public finances is a better measure of the benefits of an oil fund across generations
78 Scotland analysis Macroeconomic and fiscal performance
Chart 4A Oil fund including all oil revenues starting in 2021ndash22
00
02
04
06
08
10
12
14
16
18
20
Withdrawals
Oil revenue inflow
Per
cen
t of G
DP
2016ndash17 2020ndash21 2024ndash25 2028ndash29 2032ndash33 2036ndash37 2040ndash41
Source OBR Fiscal sustainability report (July 2013) OBR Economic and fiscal outlook (March 2013) HM Treasury calculations
430 If all offshore revenues were contributed to an oil fund it could be expected to provide a real return of 05 per cent of GDP a year from 2033-34 to 2040-41 to benefit the Scottish public finances (equal to the four per cent real return assumed on the fund) In 2011-12 prices that averages around pound1 billion per year Following the Norwegian rule that would allow Scotland to run an onshore deficit of around 05 per cent of GDP in those years
431 By 2030-31 the total size of the fund would reach around 10 per cent of GDP (almost pound20 billion in 2011-12 prices) By 2040-41 almost two decades after it was started the fund would reach almost 13 per cent of GDP (pound32 billion in 2011-12 prices)
432 On the face of it the total size of the fund may appear large But put in context it is in fact unlikely that an oil fund would be large enough meet any of the needs of an independent Scottish state
bull In principle an oil fund may improve the public finances and smooth volatility However a return of only around 05 per cent of GDP a year in the long term is very small in the context of Scotlandrsquos overall public finances
bull In the early years when oil revenues are larger and hence volatility has a bigger impact the return of the fund would be even smaller averaging just 02 per cent of GDP over the first five years Since devolution North Sea revenues have varied up or down by around 14 per cent of onshore GDP each year This suggests that in the medium term returns on an oil fund would be far from sufficient to counter volatility to the public finances from oil revenues and
bull An oil fund may also be used to save for future fiscal costs such as demographic pressures The IMF judges that Norwayrsquos fund at over 150 per cent of GDP after 17 years of contributions is not nearly sufficient to its tackle future fiscal costs And Scotlandrsquos oil fund after 20 years of contributions would reach less than a tenth of the current size of the Norwegian fund Moreover a report on demographics from the Scottish Parliament Finance Committee shows that Scotland is likely to face substantially more acute demographic pressures than Norway18
18 Scottish Parliament Committee (2013) ldquo2nd Report 2013 (Session 4) Demographic change and an ageing populationrdquo
Chapter 4 Managing volatility in the public finances 79
433 Box 4B sets out two alternative scenarios one in which an independent Scottish state chose to undertake the unprecedented spending cuts or tax rises required to start a fund in 2016-17 And a second in which Scotland establishes a ldquostabilisation fundrdquo while continuing to run a deficit as suggested by the Fiscal Commission Working Group
434 This analysis shows that not only does an oil fund require substantial fiscal consolidation under a realistic forecast of oil revenues and investment returns the benefits to Scotlandrsquos long-term public finances are relatively small As set out earlier in this chapter the objectives of establishing an oil fund to smooth volatility spread offshore revenues over time and save for future fiscal costs are all valid But each is far better served by Scotland remaining within the UKrsquos integrated fiscal model
Box 4B Alternative scenarios for a Scottish oil fund Starting a Norwegian-style oil fund in 2016-17
Although it is difficult to imagine in practice it is possible that an independent Scottish state could choose to undertake the unprecedented spending cuts or tax rises required to balance the onshore fiscal budget and start an oil fund in 2016-17 Given the benefit of contributions in earlier years when oil revenues are higher than the long-term average the total size of the fund and its returns would of course be larger the earlier the fund started The fund would return 07-08 per cent of GDP a year between 2026-27 and 2040-41 allowing Scotland to run an average onshore fiscal deficit of that level in those years The total size of the fund would peak at 19 per cent of GDP in the late 2030s after over 20 years of contributions compared with the Norwegian fund which currently stands at over 150 per cent of GDP (after 17 years of contributions) and then fall gradually as a percentage of GDP reflecting declining oil revenue inflows As set out earlier a Scottish fund of that magnitude is still insufficient to meet any of the challenges that an oil fund may be expected to solve
80 Scotland analysis Macroeconomic and fiscal performance
Oil fund including all oil revenues starting in 2016ndash17
35
30
Oil revenue inflow
25 Withdrawals
Per
cen
t of G
DP 20
15
10
05
00 2016ndash17 2020ndash21 2024ndash25 2028ndash29 2032ndash33 2036ndash37
Source OBR Fiscal sustainability report (July 2013) OBR Economic and fiscal outlook (March 2013) HM Treasury calculations
A ldquodeficit-funded oil fundrdquo the Fiscal Commission Working Group model
As set out earlier in Chapter 4 the Fiscal Commission Working Group (FCWG) set out an alternative option for a stabilisation fund In this model Scotland would contribute oil revenues into a fund even while running a deficit When oil revenues exceed forecasts the difference (ldquoupside surpriserdquo) could be transferred Unlike the Norwegian fund this model would imply increasing government borrowing as higher revenue than forecast would be diverted into the fund whilst lower revenues than forecast would need to be funded from higher borrowing There are a number of challenges associated with this approach both in principle and practice
The chart below addresses the specific question of what size such a fund could reasonably be expected to grow to After a decade of contributions starting in 2021-22 the fund would only reach around 2 per cent of GDP Even by 2040-41 the fund would be just over 35 per cent of GDP This assumes that there are no withdrawals and that all returns are reinvested in the fund And that there are no crises over the two decades out to 2040-41 which require the fundrsquos capital to be drawn down
This is vastly below the size of an effective stabilisation fund Just in an average year Scotlandrsquos deficit as part of the UK has been 37 per cent since devolution almost double the size of the fund after a decadersquos contributions In a crisis requiring stabilisation or a significant unexpected drop-off in revenues the deficit would be vastly larger It is difficult to imagine a stabilisation fund of 2-35 per cent of GDP being up to the challenge of tackling any fiscal crisis however small
Chapter 4 Managing volatility in the public finances 81
Total value of ldquodeficit-funded oil fundrdquo
40
35
30
Per
cen
t of G
DP
25
20
15
10
05
00 2016ndash17 2020ndash21 2024ndash25 2028ndash29 2032ndash33 2036ndash37
Source OBR Fiscal sustainability report (July 2013) OBR Economic and fiscal outlook (March 2013) HM Treasury calculations
The analysis assumes that
bull Forecasts are made on a three-year ahead basis in line with the FCWG suggestion that spending plans would be set based on a medium-term forecast If outturn exceeds the forecast made three years previously the difference is transferred to the fund
bull All returns are reinvested and no withdrawals are made The fund returns 4 per cent per year in real terms
bull In line with the performance of UK forecasts for the 2004-05 to 2011-12 period outturns exceed forecasts 50 per cent of the time When that happens the average ldquoupside surpriserdquo is around 38 per cent of total revenues That implies that in the average year 19 per cent of total revenues (50 per cent multiplied by 38 per cent) is transferred to the stabilisation fund If forecast accuracy improved in future contributions to the fund would reduce and the fund would be even smaller
Because this alternative model implies raising the deficit to contribute to a fund borrowing would be higher each year by the size of contributions to the fund 02 per cent of GDP in the average year with higher debt and debt interest consequences compounding this further
82 Scotland analysis Macroeconomic and fiscal performance
Conclusion 435 In the event of independence Scotland would be directly exposed to a narrower tax
revenue base and more volatile fiscal position An independent Scottish state could try to smooth its public finances as a small country and manage declining oil and gas reserves by establishing an oil fund
436 While the economic rationale for establishing one is clear an oil fund would come at a price Scotland is currently far from having the sustainable fiscal position that would make such a fund viable Implementing an oil fund in a similar way to Norway would imply very significant cuts to public spending or tax increases over and above the plans that have been set by the UK Government to repair the impact of the financial crisis To then begin contributing to the fund more fiscal consolidation would be required on top of that It would take considerable time to build up a fund of adequate size to manage volatility in the public finances
437 Scotland achieves many of the benefits of an oil fund within the UK The UKrsquos integrated fiscal model provides a very stable flow of Scottish expenditure without Scotland having to run the very tight fiscal policy required for an oil fund
Chapter 5 Conclusion
51 Over the past 300 years economic integration across the UK has strengthened to the benefit of all nations and regions The performance of the Scottish economy is strikingly similar to that of the UK as a whole On average a worker in Scotland produces almost exactly the same as a worker in the rest of the UK Scotland has the third highest economic output per person of all the nations and regions of the UK (behind only London and the South East of England) And Scottish output per person is closer to the overall UK average than any other nation or region of the UK Since 1963 growth in economic output per head of population has been slightly stronger in Scotland than in the UK averaging 20 per cent in Scotland and 19 per cent in the UK overall Differences in employment rates between the UK and Scotland have narrowed over time the latest data show that the employment rate in Scotland is now higher than the UK at 722 per cent compared with 715 per cent
52 The similarity of Scotlandrsquos economic performance to the UK as a whole is reflected in its fiscal position Scottish onshore tax revenues per person have been very close to the UK average since 1998 Over the same time period public spending per person in Scotland has been around 10 per cent higher than the UK average Therefore Scotlandrsquos notional onshore fiscal balance has been considerably weaker than the UKrsquos over the same timeframe In the event of independence the allocation of North Sea oil and gas revenues would be subject to negotiation On the basis of a geographical apportionment Scotlandrsquos notional fiscal balance for the period since devolution is very similar to the UKrsquos public finances over the same period
53 The best independent academic models show that international borders reduce trade The analysis in this paper shows that as an impediment to trade flows the border is likely to reduce the level of real income in the Scottish economy by around four per cent with the effect building over time The rest of the UK would also suffer from reduced trade flows but the impact on incomes would be less as Scotland constitutes a smaller share of total trade for the rest of the UK
86 Scotland analysis Macroeconomic and fiscal performance
54 In the event of independence Scotland would be directly exposed to a narrower tax revenue base and more volatile fiscal position An independent Scottish state could try to smooth its public finances and manage volatile and declining oil and gas revenues by establishing an oil fund Implementing an oil fund in a similar way to Norway would imply very significant tax increases or cuts to public spending over and above the plans that have been set by the UK Government to repair the impact of the financial crisis Based on CPPR forecasts of Scotlandrsquos fiscal position in 2016-17 to start an oil fund in 2016-17 from a balanced budget additional fiscal consolidation of 51 per cent of GDP (pound84 billion in real terms) would be needed That implies spending cuts of 13 per cent from current levels or onshore tax rises of 18 per cent Additional fiscal consolidation would then be required to begin making contributions to the fund
55 This would be a profound change Independence would fundamentally transform the relationship between Scotland and the rest of the UK As the historical links between the two countries weaken an independent Scottish state would have to adapt to a new and more challenging environment as a small independent country This would be expected to have deep implications for its economic and fiscal models
Annex A Scotlandrsquos economic performance as part of the UK
A1 This annex sets out a comprehensive picture of the Scottish economy as part of the UK to help inform the debate on independence Various statistical sources are available when looking at Scotlandrsquos economic performance produced and published mostly by the Office for National Statistics (ONS) and by the Scottish Government as described in Box 2A This annex uses these various sources to understand how Scotland has performed as part of the UK relative to the UK as a whole and to comparable countries
A2 This annex is structured in three parts
bull a snapshot of the Scottish economy today compared with the UK including the distinction between onshore and offshore activity
bull historical trends in the Scottish economy including the impact of the recent recession and
bull international comparisons of the Scottish economy with other independent comparable countries
A picture of Scotlandrsquos economic place in the UK The Scottish economy today Similarities with the UK average
A3 Across most key economic indicators the Scottish onshore economy is currently strikingly similar to the UK average
Economic performance
bull Scotlandrsquos GVA per head is 98 per cent of the UK average and Scotland has the third highest GVA per head of all regions See Chart AA
bull A number of Scottish cities Edinburgh in particular have similar income levels to London See Chart AB
bull Scotlandrsquos productivity is almost exactly equal to the UK average and also third highest of all UK regions and devolved countries See Chart AC
Structure of the economy
bull The industrial composition of Scottish output is very similar to the UK average (excluding extra regio) The correlation of industrial composition across the 20 industries of the Standard Industrial Classification 2007 (SIC07) is nearly 95 per cent See Table AA
90 Scotland analysis Macroeconomic and fiscal performance
bull Distribution of income from output between labour (in the form of compensation of employees) and capital (in the form of gross operating surplus and mixed income) is also very similar between Scotland and the UK average See Chart AD
bull The composition of domestic demand between household final consumption Governmentrsquos consumption and gross capital formation is relatively similar to the UK See Chart AE
bull Scotland exported nearly half of its GDP in 2011 (compared with less than a third for the UK as a whole) and the value of imports represented around 55 per cent of total nominal GDP (compared with less than 35 per cent for the UK as a whole)1 Of total Scottish trade a majority was made with the rest of the UK (around 60 per cent of exports and 70 per cent of imports according to the same source) See Chart AE
Labour market
bull Conditions in the Scottish labour market are very similar to the UK average In the latest data (three months to May 2013) Scottish employment and unemployment rates have been a little better than the UK average See Chart AF
bull Median gross earnings were pound498 per week in Scotland in April 2012 or 986 per cent of median gross weekly earnings for the UK as a whole (pound506 per week) See Chart AG
bull Reflecting the similarities in the composition of output the composition of Scottish employment is very close to the UK average See Table AB
Chart AA Output per head of regions and devolved countries (2011) London
South East
UK excluding extra region
Scotland
East
South West
UK ex London extra region
East Midlands
North West
West Midlands
Yorkshire amp the Humber
Northern Ireland
Wales
North East
0 10000 20000 30000 40000
GVA per capita (pound) excluding extra region 2011
Source ONS Regional Gross Value Added (December 2012)
1 Note that Scottish data are for the onshore economy only while UK data include North Sea oil and gas In particular they exclude Scottish exports of North Sea oil and gas and are therefore likely to overestimate UK exports as a share of GDP compared with Scottish exports In 2011 according to the UK Balance of Payments published by the ONS UK exports of crude oil contributed around pound17 billion to a total of pound493 billion (or around 35 per cent of total exports) Excluding crude oil exports would reduce the UK ratio of exports to GDP from around 34 per cent to around 33 per cent
Annex A Scotlandrsquos economic performance as part of the UK 91
Chart AB Economic output per head of London and Scottish cities (2011)
London
Edinburgh City of
Aberdeen City and Aberdeenshire
Glasgow City
0 10000 20000 30000 40000
GVA per capita (pound) excluding extra region 2011
Source ONS Regional Gross Value Added (December 2012)
Chart AC Labour productivity (2011) Output per job
Lon
SE
UK
Scot
East
SW
EM
WM
NW
YH
NE
NI Wal
989
0 50 100 150 Indexed UK=100
Output per hour worked
Lon
SE
UK
Scot 1000
East
SW
NW
NE
EM
WM
YH
Wal
NI
0 50 100 150 Indexed UK=100
Source ONS Regional Labour Productivity (June 2013)
92 Scotland analysis Macroeconomic and fiscal performance
Table AA Composition of output in UK and devolved countries (2010)
UK excl extra regio Wales Scotland Northern Ireland
Agriculture 07 04 07 12
Mining and utilities 33 43 75 26
Manufacturing 111 164 116 151
Construction 65 73 72 69
Distribution Hotels and restaurants 145 148 136 163
Transport and communication 106 71 85 67
Finance 96 48 83 43
Real estate 82 83 73 79
Business services 119 74 100 70
Public admin education and health 202 261 223 290
Others 35 32 31 29
Correlation with UK excl extra regio 089 095 089
Source ONS Regional Gross Value Added (December 2012)
Chart AD Labour share of output (2011) 65
640
Com
pen
satio
n of
em
ploy
ees
as a
sha
reof
tota
l GVA
64
63
62
61
60
59
58
57
618
599
618
Wales Scotland Northern Ireland UK excluding extra region
Source ONS Regional Gross Value Added (December 2012)
Annex A Scotlandrsquos economic performance as part of the UK 93
Chart AE Expenditure decomposition of output (2011) Composition of domestic demand
100
156 144
213233
612 643
As
a sh
are
of to
tal d
omes
tic d
eman
d
75
50
25
0 Scotland UK
Households final consumption
Government final consumption
Gross capital formation
Degree of trade openness
60 553
50 495
325 341
UKScotland
As
a sh
are
of G
DP
40
30
20
10
0
Exports Imports
Source ONS Quarterly National Accounts (2013Q1) Scottish Government Scotland National Account Project (2012Q3 and 2012Q4)
Chart AF Labour market in the three months to May 2013 80
719 714 70 Wales
60 Scotland
Northern Ireland 50
75 78
221 225
Employment rate Unemployment rate Inactivity rate
Per
cen
t
40
30
20
10
0
UK
Source ONS Labour Market Statistics (July 2013) Labour Force Survey
94 Scotland analysis Macroeconomic and fiscal performance
Chart AG Median earnings in UK regions and devolved countries (2012) London
South East
United Kingdom
Scotland
East
North West
West Midlands
South West
Yorkshire and The Humber
East Midlands
Northern Ireland
North East
Wales
0 100 200 300 400 500 600 700
Median full time gross weekly earnings (pound) April 2012
Source ONS Annual Survey of Hours and Earnings (ASHE) 2012 provisional results
Table AB Industrial composition of jobs
Wales Scotland Northern Ireland UK
Agriculture 23 19 40 13
Mining and utilities 15 26 10 12
Manufacturing 105 72 99 81
Construction 69 67 72 65
Distribution Hotels and restaurants 225 214 228 216
Transport and communication 60 73 59 86
Finance 22 36 23 36
Real estate 10 12 10 13
Professional business services 45 72 43 77
Administrative and support services 60 75 55 78
Public administration 63 59 74 53
Education 97 77 90 87
Health and social work 152 142 150 128
Others 53 56 48 57
Correlation with UK 095 099 094
Source ONS Workforce jobs by region and industry (December 2012)
Annex A Scotlandrsquos economic performance as part of the UK 95
Performance over time relative to the UK ndash long-term trends and the impact of the recession A4 Looking back to past developments in the Scottish economy relative to the UK there has
been volatility in the data between Scotland and the UK average but long-term economic trends have been broadly similar
Growth
bull The growth in Scotlandrsquos onshore GVA per head has been slightly above the UK average for the onshore economy between 1963 and 2012 (20 per cent a year compared with 19 per cent a year) See Table AC for onshore economic growth and population statistics
bull Real growth not adjusted for population growth in Scotlandrsquos onshore economy has lagged slightly behind the UK average between 1963 and 2012 with annual growth averaging 2 per cent compared with 22 per cent on average across the UK This is explained by faster population growth in the UK
bull Annual population growth in Scotland between 1963 and 2012 was 00 per cent lower than the 03 per cent growth in the UK Scotlandrsquos population fell for most of the last two decades of the 20th century declining from a peak of 524 million in 1974 to 505 million at its trough in 2002 The population in Scotland has increased since 2002
bull Since devolution annual onshore growth in Scotlandrsquos GVA per head has been the same as the UK at 14 per cent
bull Growth not adjusted for population changes in Scotlandrsquos onshore economy has lagged slightly behind the UK between 1998 and 2012 with annual growth averaging 17 per cent compared with 20 per cent on average across the UK This is accounted for by differences in population growth
bull Although the Scottish population has started to increase since 2002 population growth has still been lower than the UK Annual population growth in Scotland between 1998 and 2012 was 03 per cent lower than the 06 per cent growth in the UK
bull Cycles in the Scotlandrsquos onshore economy have been broadly in line with the rest of the UK contracting in similar periods most notably in the mid 1970s in the early 1980s and in 2008-09 See Chart AH
bull During the financial crisis the volume of onshore output in Scotland peaked in the second quarter of 2008 a quarter after the peak in total UK output (first quarter of 2008) Output then fell for five consecutive quarters reaching a trough in the third quarter of 2009 for Scotland and the second quarter of 2009 for the UK as a whole The initial decline (from peak to trough) was more limited in Scotland (-56 per cent) than for the UK as a whole (-74 per cent) See Chart AI
96 Scotland analysis Macroeconomic and fiscal performance
Labour market and productivity
bull Employment rates between Scotland and the whole UK have converged Between 1993 and 2012 the employment rate in Scotland (among those aged 16 to 64) increased by nearly 5 percentage points2 The increase was more moderate for the UK as a whole just above 3 percentage points The employment rate in Scotland is now just above the UK at 719 per cent compared to 714 per cent The unemployment rate has risen but is below the UK average at 75 per cent compared to 78 per cent See charts AJ and AK
bull Prior to the recession (between 1993 and 2007) the employment rate in Scotland increased by more than 7 percentage points The increase was more moderate for the UK as a whole just above 4 percentage points By 2007 the employment rate in Scotland was nearly 2 percentage points above the UK average
bull Scotlandrsquos unemployment rate has also converged towards the UK average falling more rapidly through the second half of the 1990s and prior to the 2008-09 recession
bull Scottish productivity growth (as measured by growth in real output per worker) has grown broadly in line with the UK average from 1993 to 2012 increasing by 17 per cent a year on average compared with 18 per cent for the UK as a whole Productivity growth lagged behind the UK average prior to the recession but has been stronger since See Chart AL
Table AC Onshore economic growth in Scotland and the UK
1963-2012 1998-2012
Scotland GVA growth 20 17
Population growth 00 03
GVA per head growth 20 14
UK GVA growth 22 20
Population growth 03 06
GVA per head growth 19 14
Source Scottish Government GDP statistical bulletin (2010Q1 and 2013Q1) ONS UK real GVA excluding North Sea oil and gas (KLHZ and UIZY) ONS mid-year population estimates General Register Office for Scotland
2 Employment data for Scotland are only available from 1993 Productivity data has been constructed using this employment data
Annex A Scotlandrsquos economic performance as part of the UK 97
Chart AH Annual growth in onshore economic activity per head
10
8
ndash6
ndash4
ndash2
0
2
4
6
Per
cen
t
ndash8 1964 1974 1984 1994 2004
Scotland UK
Source Scottish Government GDP statistical bulletin (2010Q1 and 2013Q1) ONS UK real GVA excluding North Sea oil and gas (KLHZ and UIZY) ONS mid-year population estimates General Register Office for Scotland
Chart AI Impact of the recession
92
94
96
98
100
Comparable country median
UK excl oil and gas
UK
Scotland
Rea
l GVA
ind
ex (P
eak=
100)
0 5 10 15 20
Quarters after peak in output
Source Scottish Government GDP statistical bulletin (2013Q1) ONS Gross Domestic Product Preliminary Estimate (2013Q2) Eurostat
98 Scotland analysis Macroeconomic and fiscal performance
Chart AJ Employment rate (proportion of the population aged 16 to 64 in employment) 76
68
70
72
74
Pro
port
ion
of 1
6+ p
opul
atio
n in
em
ploy
emnt
(per
cen
t)
66
64
62 Jan-93 Jan-98 Jan-03 Jan-08 Jan-13
Scotland UK Source ONS Labour market statistics (July 2013)
Chart AK Unemployment rate (unemployment as a proportion of the population aged 16 and above)
12
4
6
8
10
Une
mpl
oym
ent r
ate
16
and
abov
e (p
er c
ent)
2
0 Jan-93 Jan-98 Jan-03 Jan-08 Jan-13
Scotland UK Source ONS Labour market statistics (July 2013)
Chart AL Productivity growth Annual growth in output per worker
30
25 Scotland
ndash05
00
05
10
15
20 UK
Per
cen
t
ndash10 1993 to 2007 2007 to 2012 1993 to 2012
Source Scottish Government GDP statistical bulletin (2013Q1) ONS Gross Domestic Product Preliminary Estimate (2013Q1) ONS Labour market statistics (July 2013) HMT calculations
Annex A Scotlandrsquos economic performance as part of the UK 99
Scotlandrsquos economic performance relative to comparable independent countries A5 Having considered Scotlandrsquos performance relative to the UK average this section turns to
its relative performance against other comparable independent countries For its economic growth target the Scottish Government compares Scotlandrsquos economic performance against seven EU Member States Austria Denmark Ireland Finland Sweden Portugal and Luxembourg Not of all of these countries are similar in size to Scotland for example Luxembourg has a population of only approximately 500000 However for consistency this analysis uses the same set of countries
A6 There are a number of different indicators of economic performance This section focuses on the growth in output per head volatility of output and labour market performance
A7 The long-term historical comparison of Scotlandrsquos growth performance uses the annual series for Scottish onshore GVA at constant basic prices back to 1963 published by the Scottish Government The OECD provides historical series for GVA at constant basic prices for the majority of comparable countries (excluding Ireland) back to 19703 The Scottish Government also publishes quarterly data for Scotland onshore GVA at constant basic prices for the period 1998Q1 to 2012Q4 Quarterly GVA at constant basic prices for comparable independent countries is available from Eurostat4
A8 This analysis of performance focuses on Scotlandrsquos peformance as part of the UK It therefore focuses on onshore GVA This measure is more directly comparable with the independent countries chosen for this comparison (none of which had a large oil and gas sector) In addition whilst offshore activity (North Sea oil and gas) is impacted by economic policy choices it will ultimately be driven by the natural resources remaining and global trends in demand and supply Offshore activity is also highly volatile and can have a large impact on headline output measures masking changes in the onshore economy
Scotlandrsquos performance relative to independent comparable countries A9 Scotland is a prosperous country with high levels of income and employment rates
Scotlandrsquos growth performance over the last 20 years has been stronger than the median of comparator countries but was weaker in the 1970s and 1980s Scotland has achieved higher employment rates than the median of comparator countries Scotland experiences lower volatility in its growth rate than most of the comparator countries and the recession was milder in Scotland than all but one of the seven comparator countries
Output
bull Compared with the seven comparator countries Scotland ranks 5th out of 8 in the level of output per head In 2012 it was just above the level of Denmark and Finland and considerably higher than Portugal Luxembourg is the outlier it started from a higher level of income than Scotland in 1970 and has grown quickly This could in part be due to the cross border movement of labour such as German and French residents increasingly travelling to Luxembourg to work increasing GVA whilst not
3 OECD National Accounts Statistics Gross value added at basic prices national currencies OECD base year GVA (at constant basic prices) is available for Ireland back to 1995 growth in GDP (at constant market prices also from the OECD) is used to extend for the period 1971 to 1995
4 Eurostat Economy and finance Quarterly National Accounts GDP and main components (volume) Eurostat does not publish GVA (at constant basic prices) for Sweden or Ireland Growth in GDP (at constant market prices also from Eurostat) is used as a proxy
100 Scotland analysis Macroeconomic and fiscal performance
increasing the population of Luxembourg Chart AM below shows GVA per head levels from 1970 to 2012 for Scotland and the comparator countries
bull In terms of growth rates between 1970 and 2012 Scotlandrsquos performance has been poorer but still within the range of comparator countries Output per head in Scotland has grown faster than Denmark since 1970 and roughly the same as Sweden although still slower than other comparator countries
bull Annual growth in Scotlandrsquos onshore real GVA per head averaged 18 per cent between 1970 and 2012 The median growth rate per head across the seven comparator countries was 23 per cent over this same period As can be seen in Chart AM and Table AD some of this is due to catch-up in countries that started from a lower base for example Ireland and Portugal
bull However this long run average masks an improving trend in Scotlandrsquos economic performance During the 1990s Scotlandrsquos output per head growth was equal to the median of comparator countries it ranked joint 4th out of 8 In the period 2000 to 2012 Scottish output growth per head was superior to Denmark Finland Ireland Luxembourg and Portugal equal to Austria and behind Sweden It ranked joint 2nd out of these countries
bull Scotlandrsquos poorer performance during the 1970s explains the majority of the difference in performance over the whole period If the 1970s are excluded Scotland was firmly in amongst the comparator group of countries only outperformed by Luxembourg and Ireland over 1980 to 2012 A similar pattern of improving performance over these decades is evident in the UK further illustrating Scotlandrsquos economic integration
Volatility
bull As discussed Scotlandrsquos economic integration with the rest of the UK helps to reduce economic volatility This can be seen in the stability of Scotlandrsquos growth per head over time relative to the comparator countries Along with Austria Scotland had the lowest standard deviation in growth per head over the period 1970 to 2012 The median level of volatility in growth rates across the seven comparator countries for this period was 60 per cent higher See Chart AN
bull Perhaps the best example of how being part of a well integrated union can reduce volatility is Scotlandrsquos experience during the most recent recession Scotland has performed significantly better than most of the comparator countries as shown in Table AE and Chart AO While the financial crisis has badly affected the Scottish economy with output falling by 56 per cent from peak to trough the depth of the recession was shallower than all but one of the independent comparable countries The recession was twice as large in Ireland which required an IMFEU assistance programme The recession was also larger in Denmark Finland Luxembourg Portugal and Sweden
bull The overall output impact of the global financial crisis (from peak in output to the latest data in 2013Q1) remained more moderate in Scotland than in a majority of independent comparable countries While Scottish output remained below its peak by 20 per cent in the fourth quarter of 2012 output losses in Denmark Finland Ireland Luxembourg and Portugal all remain larger than that observed for Scotland
Annex A Scotlandrsquos economic performance as part of the UK 101
Labour Market
bull Overall Scotlandrsquos employment rate compares very favourably with that of the comparator countries and its unemployment rate is similar to the median of comparator countries See Chart AP and Chart AQ The Scottish employment rate was 711 per cent in 2012 compared with 694 per cent for the median of independent countries
bull As a whole the median employment rate across independent comparable countries has increased slightly more rapidly than the Scottish employment rate between 1992 and 2012 (by 28 percentage points and 24 percentage points) but starting from a lower base and remaining below Scotlandrsquos employment rate
bull In line with other measures of performance Scotlandrsquos unemployment rate has improved in the 15 years prior to the 2007 recession and is now in line with the performance of the independent comparable countries The unemployment rate steadily decreased from 95 per cent in 1992 to 48 per cent in 2007 and 2008 catching up and overtaking the unemployment rate of the median comparable country
bull The 2008 recession has had a similar negative impact on the unemployment rate in all of the independent comparable countries Scotland had a very slightly larger rise compared to the median of independent comparable countries unemployment was 8 per cent in Scotland in 2012 slightly higher than the median of 77 per cent
bull Scotland has avoided the worst of the volatility in the unemployment rate amongst the independent comparable countries Ireland and Finland had unemployment rates above 15 per cent in 1993 and Ireland and Portugal have had unemployment rates above 15 per cent at some point during 2012
US Dollars PPP
102 Scotland analysis Macroeconomic and fiscal performance
Chart AM Historical comparison of Scotlandrsquos output performance per head
5000
10000
15000
20000
25000
30000
35000
40000
Luxembourg
Sweden
Portugal
Ireland
Finland
Denmark
Austria
Scotland
US
Dol
lars
PP
P
0 1970 1980 1990 2000 2010
Source OECD National Accounts Statistics Gross value added at basic prices national currencies OECD base year Scottish Government GDP statistical bulletin (2010Q1 and 2013Q1) HMT calculations
Table AD Growth Rates in GVA per head
1970 to 2012 1970 to 1980 1980 to 1990 1990 to 2000 2000 to 2012
Austria 23 35 22 23 12
Denmark 16 20 22 22 01
Finland 22 34 26 18 11
Ireland 32 33 33 62 08
Portugal 23 38 31 25 02
Sweden 19 19 21 20 16
Luxembourg 31 38 45 38 08
Median of comparator countries 23 34 26 23 08
Scotland 18 16 21 23 12
Source OECD National Accounts Statistics Gross value added at basic prices national currencies OECD base year Scottish Government GDP statistical bulletin (2010Q1 and 2013Q1) HMT calculations
Chart AN Standard deviation of annual growth per head 60
50
Range across comparable countries
40 x Median across comparable countries
x Scotland 30 x
20 x x
x 10
00 1970 to 2012 1970s 1980s 1990s 2000s
Source OECD National Accounts Statistics Gross value added at basic prices national currencies OECD base year Scottish Government GDP statistical bulletin (2010Q1 and 2013Q1) HMT calculations
Annex A Scotlandrsquos economic performance as part of the UK 103
Table AE Impact of the recent global financial crisis
Timing of the recession Output impact of the recession
Quarter of Quarter of Duration (peak Peak to Trough to Peak to peak trough to trough) trough 2013Q1 2013Q1
Austria 2008Q2 2009Q2 4 -52 65 10
Denmark 2008Q2 2009Q2 4 -80 26 -56
Finland 2007Q4 2009Q2 6 -104 52 -57
Ireland 2007Q4 2009Q4 8 -115 20 -98
Luxembourg 2008Q1 2009Q2 5 -63 39 -26
Portugal 2007Q4 2013Q1 21 -86 00 -86
Sweden 2007Q4 2009Q1 5 -76 131 45
Median of comparable countries 2007Q4 2009Q2 6 -80 39 -56
Scotland 2008Q2 2009Q3 5 -56 38 -20
Source Eurostat Scottish Government GDP statistical bulletin (2013Q1)
Chart AO Output growth pre-recession peak=100 105
89
91
93
95
97
99
101
103
Luxembourg
Sweden
Portugal
Ireland
Finland
Denmark
Austria
Scotland
87
85 0 1 2 3 4 5 6 7 8 9 10 11 12 13 14 15 16 17 18 19 20 21
Source Eurostat Scottish Government Quarterly GDP (2013Q1)
Chart AP Scotlandrsquos employment rate relative to comparable countries 80
Scotland
Median across comparable countries
Range across comparable countries
50
55
60
65
70
75
Per
cen
t
1992 1994 1996 1998 2000 2002 2004 2006 2008 2010 2012
Source Eurostat OECD ONS Labour market statistics
104 Scotland analysis Macroeconomic and fiscal performance
Chart AQ Scotlandrsquos unemployment rate relative to comparable countries 20
2
4
6
8
10
12
14
16
18
Per
cen
t
Scotland
Median across comparable countries
Range across comparable countries
0 1992 1995 1999 2003 2007 2010
Source Eurostat OECD ONS Labour market statistics
Box AA Sources for Scotlandrsquos economic statistics There are a number of different sources of data on the Scottish economy This analysis draws on a wide range of these sources
Data on Scottish output are published by both the Scottish Government and the ONS Real GVA for the onshore economy is published quarterly by the Scottish Government as a National Statistic which means that it is considered to meet the UK Statistics Authorityrsquos rigorous production and quality standards The current publication is to 1998Q1 The longer term series to 1963 was last published in 2010
A more extensive set of data for nominal GVA and GDP is published quarterly by the Scottish Government in the Scottish National Accounts Project (SNAP) This includes a spilt for onshore and the Scottish share of extra-regio output These statistics are currently classified as experimental ie methodologies are still being developed and tested so estimates may be subject to more frequent and significant revision
The ONS also publishes annual regional GVA for all the regions and devolved countries as a national statistic
Data on the labour market is published monthly by the ONS in the regional labour market release as a national statistic Data on labour productivity is published quarterly by the ONS in the regional labour productivity release as a national statistic Data on population is published by the ONS as mid-year population estimates
Data on trade is from three main sources The annual Global Connections Survey provides a detailed breakdown of Scottish exports SNAP provides data for Scottish imports and exports The latest SNAP release does not include a split between imports and exports Instead a balancing item has been published Therefore the previous release has been used when considering Scottish imports and exports as the latest available data The Scottish input-output tables also provide very detailed data on Scottish imports and exports All of these statistics are currently classified as experimental
Data on migration between Scotland and the rest of the UK is published quarterly by the General Register Office for Scotland as a national statistic
Annex B Scotlandrsquos tax and spending as part of the UK 105
Annex B Scotlandrsquos tax and spending as part of the UK
B1 This annex provides more detail on Scotlandrsquos tax and spending as part of the UK since devolution The analysis in this annex is largely based on estimates published by the Scottish Government in Government Expenditure and Revenue Scotland (GERS) and Historical Fiscal Balance Calculations
bull GERS is a National Statistics publication which means that it is considered to meet the UK Statistics Authorityrsquos rigorous production and quality standards It is published annually and provides estimates of Scotlandrsquos tax and spending for the latest five year period and
bull the Historical Fiscal Balance Calculations publication provides a longer series of tax and spending data but is currently badged by the Scottish Government as experimental Ie methodologies are still being developed and tested so estimates may be subject to more frequent and significant revision
B2 The focus on the period since devolution in this annex is therefore partly because this is the period for which the more reliable data is available but it also reflects the fact that the choice facing Scotland is between devolution and independence
B3 These publications provide estimates of Scotlandrsquos historical tax and spending as part of the UK The figures do not represent the fiscal position of a hypothetical independent Scotland nor more obviously what this might look like in the future Given the UK (and therefore Scotland) derives significant economic and fiscal benefits from integration the fiscal position of an independent Scotland could therefore be substantially different from Scotlandrsquos position as part of the UK presented in GERS
B4 This annex is structured around three main areas
bull the approach to assessing Scotlandrsquos tax and spending as part of the UK
bull Scotlandrsquos public spending as part of the UK
bull Scotlandrsquos revenues as part of the UK including the distinction between onshore and offshore revenues
106 Scotland analysis Macroeconomic and fiscal performance
Assessing Scotlandrsquos tax and spending as part of the UK B5 Public spending in the UK is funded through taxation with shortfalls in tax revenues
supplemented by borrowing as shown in Chart BA The UKrsquos fiscal model collects and pools tax revenues from across the UK and redistributes these to fund spending based on a combination of need population opportunity formula and history Since devolution the UK has funded 90 per cent of spending from tax revenues and 10 per cent from borrowing
Chart BA How the UKrsquos public spending is funded
1999
00
2000
01
2001
02
2002
03
2003
04
2004
05
2005
06
2006
07
2007
08
2008
09
2009
10
2010
11
2011
12
2012
13
0
100000
200000
300000
400000
500000
600000
700000
800000
pound m
illio
n
SpendRevenuesNet borr owing
Source ONSHM Treasury Public Sector Finances (as used in GERS 2011-12 in March 2013)
B6 A geographical breakdown of the UKrsquos public spending is published in the Treasuryrsquos Country and Regional Analysis (CRA) The principles defined in this publication provide a framework for identifying the regional distribution of public spending across the UK The fundamental principle is to identify the people who benefit from public spending or for whom public spending is undertaken rather than necessarily where the spending takes place The key details are set out in Box BA
Annex B Scotlandrsquos tax and spending as part of the UK 107
Box BA Identifying Scotlandrsquos spending as part of the UK The fundamental principle is to identify the people who benefit from public spending or for whom public spending is undertaken
For most areas of spending it is relatively straightforward to produce geographical estimates consistent with this principle Considering some of the larger areas of public spending most health spending benefits people living in the countryregion where the money is spent the recipients of benefits and pensions payments can be readily identified and local authority spending is assumed to benefit the residents
Moreover even for spending areas where it is less straightforward methodologies consistent with this lsquowho benefitsrsquo principle have been developed and tested over many years (although are still subject to regular review and refinement where necessary) For example the administrative costs associated with paying benefits are assumed to follow the same pattern as the benefits payments themselves ndash so if 10 per cent of benefits are paid to Scotland it is considered that 10 per cent of the associated administrative costs are also incurred on behalf of Scotland
The spending presented in the CRA also reflects the ONS definition of which organisations are part of the public sector The CRA therefore reflects the size of the public sector in each countryregion as well as spending on comparable public services As the shape of the public sector is largely consistent across the UK this has little impact on the aggregate public spending numbers presented in the CRA
However it is worth noting that water has been privatised in England and Wales while it is part of the public sector in Scotland and Northern Ireland Public spending is therefore slightly higher in Scotland and Northern Ireland than if water was privatised although revenues in Scotland are correspondingly higher as water rates are treated as public sector receipts Specifically Scotlandrsquos tax and spending are both increased by around pound500 million per year which is most significant when considering the distribution of public spending across public services in Scotland
The spending presented in GERS uses the CRA publication as its main input The one key divergence is in the presentation of spending that is considered to benefit the whole of the UK equally (for example spending on defence or foreign representation) Specifically while the CRA shows all this non-regional (or lsquonon-identifiablersquo) spending in a separate category a population share (or similar) is allocated to Scotland in GERS This differing approach largely reflects the fact that GERS is additionally attempting to estimate Scotlandrsquos overall fiscal balance while the CRA limits its focus to a geographical breakdown of the UKrsquos public spending
B7 There is currently no similar overarching framework for attributing tax revenues to the countries and regions of the UK This is partly due to the difficulty in attributing certain taxes geographically but it also reflects the fact that the pooling and redistribution of most revenues means that the location where taxes accrue hasnrsquot been an important feature of tax collection (beyond the fact that it accrued within the UK) However HMRC will be publishing a country breakdown of tax revenues for the first time in October 2013 This publication like GERS will estimate tax revenues generated by Scotland as part of the UK rather than as an independent country
108 Scotland analysis Macroeconomic and fiscal performance
B8 While the assessment of the UKrsquos fiscal position is based on all UK tax and spending for an analysis of Scotland it is necessary to consider one extension ndash the treatment of North Sea tax revenues Consistent with the approach taken by the Scottish Government and other external commentators (notably the Centre for Public Policy for Regions) this assessment considers Scotlandrsquos onshore contribution before examining the impact of attributing a share of North Sea tax revenues
Scotlandrsquos public spending as part of the UK B9 Scotlandrsquos spending in this paper is based on the lsquowho benefitsrsquo principle It therefore
includes spending on functions that are devolved to the Scottish Parliament such as health social care education transport policing and housing as well as spending by the UK Government on reserved functions such as welfare and defence It is presented consistent with the National Accounts framework used by the ONS and the OBR to assess the UKrsquos public finances
Devolved spending
B10 The vast majority of Scottish Government spending is determined to benefit Scotland while all spending by Scottish local authorities is assumed to benefit Scotland (which is a simplifying assumption that the CRA makes for all local authorities throughout the UK) All spending by Scottish public corporations (notably Scottish Water) is also currently considered to benefit Scotland
B11 The devolved administrations are largely funded via the Barnett formula whereby a population share of any increase (or decrease) in comparable spending in England is added to their baseline funding This is commonly referred to as the block grant The Scottish Government determines how much of the block grant to allocate to each devolved function including allocations to local authorities The policy flexibility that this provides was set out in Chapter 2
B12 In addition to the block grant certain areas of Scottish Government spending are funded by the UK Government through Annually Managed Expenditure (AME) Spending funded through AME is essentially limited to those programmes that are particularly large and volatile so are not reasonably subject to multi-year budgets While most AME programmes are reserved (such as benefits and tax credits) the payment of Scotlandrsquos public service pensions for example is funded through Scottish Government AME Increases in spending on these programmes do not need to be offset by reductions in spending on other devolved services
B13 Both the Scottish Government and local authorities can augment their funding through sales of goods services and assets In addition to this local authorities obtain further funding through council tax and business rates while the revenue-raising responsibility of the Scottish Government is being enhanced through the ongoing implementation of the Scotland Act 2012 As well as increasing their financial accountability this will mean that the Scottish Government will have the ability to vary the overall levels of tax and spending in Scotland rather than just being responsible for allocating a fixed budget
Annex B Scotlandrsquos tax and spending as part of the UK 109
Reserved spending
B14 The spending analysis in this paper also includes spending reserved to the UK Government that is undertaken on behalf of the people of Scotland There are three approaches taken to determine the share of reserved spending that benefits Scotland
bull administrative data ndash many of the most significant areas of reserved spending (such as benefits state pension payments tax credits etc) can be identified to Scotland according to detailed administrative information
bull relevant indicators ndash a second subset includes spending that is geographically diverse but where the precise beneficiary cannot always be identified In these cases (eg research programmes museums and galleries etc) relevant indicators are used to determine the share of spending that is undertaken on behalf of the people of Scotland and
bull equal benefit ndash thirdly there are certain areas (such as defence and foreign affairs) where everyone across the UK is considered to benefit equally While the Treasuryrsquos CRA publication uses the concept of lsquonon-identifiablersquo for this category GERS attributes a population share (or similar) to Scotland
B15 It is important to note that this doesnrsquot necessarily reflect the spending that actually takes place in Scotland Ie the purpose is to identify the spending that benefits the people of Scotland rather than the economic impact of spending in Scotland (eg on jobs) Some spending that takes place in Scotland is therefore considered by the CRA (and therefore GERS) to benefit other parts of the country while some spending that takes place in other parts of the UK is determined to benefit Scotland
B16 For example the Department for International Development (DfID) has significant numbers of staff in Scotland working on behalf of the UK as a whole ndash much of the spending although in Scotland is therefore undertaken on behalf of other parts of the UK and so does not form part of Scotlandrsquos spending Conversely a share of DfIDrsquos spending overseas is undertaken on behalf of Scotland and therefore allocated accordingly Similar arrangements apply in a number of other departments notably HM Revenue and Customs (HMRC) the Department for Work and Pensions (DWP) the Ministry of Defence (MOD) and the Department for Energy and Climate Change (DECC)
B17 This further reinforces that GERS provides a view of Scotlandrsquos spending (as well as Scotlandrsquos tax) as part of the UK rather than what it might look like as an independent country
110 Scotland analysis Macroeconomic and fiscal performance
Scotlandrsquos funding as part of the UK B18 As part of the UK Scotlandrsquos spending is currently funded through local taxes (council
tax and non-domestic rates) plus pooled and redistributed national taxes and a share of UK borrowing
B19 While as part of the UK it isnrsquot necessary to determine how Scotlandrsquos funding is split between redistributed taxes and borrowing there are at least three logical ways to do so
bull assume that the UK borrows the same amount per person Ie Scotlandrsquos share of UK borrowing would mirror its population share which averages around 85 per cent since devolution
bull as the UK funds part of its spending through borrowing it could be assumed that Scotlandrsquos share of UK borrowing is the same as its share of spending which is 94 per cent since devolution or
bull Scotland could be considered to be funded by the tax revenues that it generates with borrowing filling any gap between this and the level of spending
B20 The next section of this paper considers this further starting with an assessment of revenues generated by Scotlandrsquos onshore economy
Scotlandrsquos onshore revenues B21 In addition to taxes raised locally (currently council tax and non-domestic rates) the
revenues considered in this section are those that can be attributed to people and (onshore) businesses in Scotland As explained earlier in this annex this is based on statistical methodologies rather than reflecting actual revenues generated by Scotland
B22 It should be noted that onshore revenues as presented in GERS includes all the income tax (and other taxes) paid by people who work offshore The only taxes that are excluded are those that are specific to the oil and gas companies operating in the North Sea Ie petroleum revenue tax North Sea corporation tax (including the supplementary charge) and licence fees (which have now been phased out)
B23 Estimates of Scotlandrsquos onshore tax revenues per head are slightly lower than the UK average This reflects the fact that the performance of Scotlandrsquos onshore economy closely mirrors the performance of the UKrsquos onshore economy (as highlighted earlier in this paper) and the fact that people and businesses across the UK are subject to the same levels of taxation (as the UK has a largely unified tax system)
B24 Chart BB shows Scotlandrsquos share of the UKrsquos spending onshore revenues and population since devolution It also shows Scotlandrsquos spending and onshore revenue indexed against the UK average Throughout this period Scotland has benefitted from relatively high levels of public spending while generating similar levels of taxation The British Academy and Royal Society of Edinburgh1 recognised Scotlandrsquos simultaneous low taxhigh spend position as part of the UK and the challenge of maintaining this as an independent country
1 British Academy and the Royal Society of Edinburgh Scotland and the United Kingdom 2012
Annex B Scotlandrsquos tax and spending as part of the UK 111
B25 Specifically since devolution Scotlandrsquos onshore economy has generated 83 per cent of the UKrsquos receipts which is slightly lower than a population share (which averaged 85 per cent over this period) At the same time Scotland has received an average of 94 per cent of UK public spending Relative to the UK generating and spending pound100 this means that Scotlandrsquos onshore economy has generated pound98 while Scotlandrsquos spending is pound112
Chart BB Scotlandrsquos onshore tax and spending compared to the UK average
o
f UK
tota
ls
80
85
90
95
100
105
110
2011
ndash12
2009
ndash10
2007
ndash08
2005
ndash06
2003
ndash04
2001
ndash02
1999
ndash00
Spending Revenue Population
Spe
ndin
g an
d re
venu
es p
er h
ead
(inde
xed
UK
=10
0)90
95
100
105
110
115
120
2011
ndash12
2009
ndash10
2007
ndash08
2005
ndash06
2003
ndash04
2001
ndash02
1999
ndash00
Scotland spending Scotland revenues UK
Source Scottish Government GERS 2011ndash12 and historical series (all figures to 2011ndash12) ONSHM Treasury Public Sector Finances (UK figures for 2012ndash13 excluding the one-off Royal Mail Pension Scheme asset transfer) HMRC Government revenues from UK oil and gas production (North Sea revenues for 2012ndash13) HM Treasury estimates (Scotlandrsquos share of 2012ndash13 UK totals based on the 2011ndash12 share)
B26 This highlights the significant fiscal gap that exists between Scotlandrsquos onshore revenues and spending Had Scotland instead received its population share of spending then it would have received some pound74 billion less since devolution or around pound6 billion less (in real terms) each year An allocation of the UKrsquos spending based on a share of onshore revenues would have further decreased Scotlandrsquos spending
B27 However it is worth reiterating that public spending is allocated across the UK according to a combination of need population opportunity formula and history Higher spending in Scotland than the UK average is therefore the result of a range of factors and like every other region of the UK doesnrsquot depend solely on population or on the share of tax revenues generated
B28 But clearly this means that there is a significant gap between Scotlandrsquos share of UK spending and onshore revenues And as shown in Chart BC there is a funding gap of pound95 billion since devolution even after a per capita share of the UKrsquos borrowing is included
0
2000
4000
6000
8000
10000
12000
14000
North Sea revenues
2012-132011-122010-11 2009-10 2008-09 2007-08 2006-07 2005-06 2004-05 2003-04 2002-03 2001-02 2000-011999-00
112 Scotland analysis Macroeconomic and fiscal performance
Chart BC Scotlandrsquos spending and funding (excluding North Sea revenues)
1999
00
2000
01
2001
02
2002
03
2003
04
2004
05
2005
06
2006
07
2007
08
2008
09
2009
10
2010
11
2011
12
2012
13
70000
60000
50000
pound m
illio
n 40000
30000
20000
10000
0
Onshor e Revenues SpendPer head shar e of borr owing
Source Scottish Government GERS 2011ndash12 and historical series (all tax and spend figures to 2011ndash12) ONSHM Treasury Public Sector Finances (UK figures for 2012ndash13 excluding the one-off Royal Mail Pension Scheme asset transfer) HMRC Government revenues from UK oil and gas production (North Sea revenues for 2012ndash13) HM Treasury estimates (Scotlandrsquos population share of UK borrowing in all years and Scotlandrsquos share of 2012ndash13 UK tax and spend based on the 2011ndash12 share)
Scotlandrsquos revenues including North Sea tax revenues B29 North Sea oil and gas is a hugely important resource for the UK both in terms of its
impact on the UK economy and the contribution it makes to UK tax revenues
B30 Total North Sea tax revenues have averaged pound71 billion a year since devolution in 1999 This corresponds to around 15 per cent of the UKrsquos total revenues during this period However as highlighted in Chart BD these revenues have been volatile ndash they have ranged from pound26 billion in 1999-00 to pound129 billion in 2008-09 which equates to between 07 per cent and 24 per cent of the UKrsquos revenues The largest year-on-year change is a fall of more than pound6 billion following the 2008-09 peak which corresponds to a reduction in UK revenues of just over 1 per cent
Chart BD North Sea tax revenues
2011-12
2012-13
1999-00
2000-01
2001-02
2002-03
2003-04
2004-05
2005-06
2006-07
2007-08
2008-09
2009-10
2010-11
2000
4000
6000
8000
10000
12000
14000
North Sea re venues
US Dollars PPP
pound m
illion
0
Source HMRC Government revenues from UK oil and gas production
Annex B Scotlandrsquos tax and spending as part of the UK 113
B31 As many external commentators have identified including the Institute for Fiscal Studies (IFS)2 and the Centre for Public Policy for Regions (CPPR)3 North Sea revenues have essentially filled the gap between Scotlandrsquos onshore revenues (and share of UK borrowing) and Scotlandrsquos spending
B32 Specifically while Chart BC identifies a pound95 billion onshore fiscal gap since devolution North Sea tax revenues have totalled pound99 billion4 Therefore as part of the UK this suggests that Scotland is already benefitting from the vast majority of North Sea tax revenues (in addition to the economic benefits surrounding the oil and gas industry)
B33 But the advantage of these revenues being pooled and redistributed to Scotland (alongside other UK-wide taxes) is that the volatility of North Sea revenues is smoothed As demonstrated in Chart BC and as discussed earlier in this paper Scotland has enjoyed steady and secure levels of spending as part of the UK rather than spending that mirrors the volatility of North Sea revenues in Chart BD Ie Scotland has effectively exchanged a volatile source of funding (a share of North Sea revenues) for a stable one (in the form of the block grant paid from pooled UK taxes)
Factors affecting North Sea tax revenues B34 There are a number of factors affecting North Sea tax revenues including production
levels oil and gas prices industry investment and operating costs and the governmentrsquos fiscal regime Not only does this make revenues volatile but as explained in Chapter 2 it also makes them unpredictable These factors and their impact on revenues are examined below
North Sea production levels
B35 As shown in Chart BE since peaking around the turn of the century oil and gas production has declined substantially ndash both are now at around a third of peak levels reflecting that extraction is becoming more difficult and aging infrastructure is leading to more frequent unplanned maintenance and temporary field closures
B36 For example in March 2012 Total shut its Elgin platform due to a gas leak It remained shut until March 2013 which is significant as Elgin and two nearby fields account for almost 8 per cent of North Sea gas production The impact of the Elgin shutdown on UK tax revenues taking into account the effect of the shutdown on the nearby Franklin field is estimated at pound750 million in 2012 and pound500 million in 2013
B37 Everything else being equal and as demonstrated in the above example lower production corresponds to lower profits and therefore lower tax revenues
2 Institute for Fiscal Studies lsquoScottish independence the fiscal contextrsquo November 2012 3 The Centre for Public Policy for Regions have published a series of papers on Scotlandrsquos economic and fiscal
performance 4 HMRC Government revenues from North Sea oil and gas production June 2013
114 Scotland analysis Macroeconomic and fiscal performance
Chart BE North Sea oil and gas production O
il (m
illio
n to
nnes
)
Gas
(bill
ion
ther
ms)
20
40
60
80
100
120
140
10
20
30
40
50
60
70
0
1998 2000 2002 2004 2006 2008 2010 2012 2014 2016
0
2018
Gas forecast (billion therms) Oil forecast (million tonnes)
Gas actuals (billion therms) Oil actuals (million tonnes)
Source DECC oil and gas UK field data
Oil and gas prices
B38 High prices in the first half of the 1980s were followed by low prices until the end of the 1990s The period since devolution has seen an upwards trend in the price of oil and gas alongside significant volatility both of which have fed through into tax receipts The price of a barrel of oil is shown in Chart BF For North Sea tax revenues the trend increase in price since devolution has essentially offset the decline in production
B39 However the impact of price fluctuations is exemplified by price changes during 2008 when the oil price fell from a high of pound67barrel to a low of pound27barrel in just 6 months As noted above UK oil and gas receipts halved during this period from nearly pound13 billion in 2008-09 to pound65 billion in 2009-10 It should also be noted that as oil is traded in dollars the pounddollar exchange rate produces a further effect on tax revenues
Annex B Scotlandrsquos tax and spending as part of the UK 115
Chart BF Oil prices
1980 1982
1984 1986
1988 1990
1992 1994
1996 1998
2000 2002
2004 2006
2008 2010
2012
80 2012 prices
10
20
30
40
50
poundb
oe
60
70 Nominal
0
Source BP statistical review of world energy 2013
The Governmentrsquos North Sea fiscal regime
B40 The Governmentrsquos fiscal regime is designed to encourage the investment needed to fully exploit remaining reserves as extraction becomes more difficult while ensuring a fair return for the tax payer
B41 In addition to recent announcements of new field allowances for large shallow water gas fields and brown fields the Governmentrsquos commitment to extending the productive life of the North Sea basin is reflected in the decision to provide industry with long-term decommissioning tax relief certainty (worth upwards of pound20 billion) through the introduction of contracts (Decommissioning Relief Deeds) with oil and gas companies
B42 This has encouraged vital new investment that creates jobs and growth in the short-term and is expected to extend the productive outputs of many fields in the longer-term The Governmentrsquos recent announcements have already been credited with helping to secure a range of new investment in the North Sea Following the announcement of the large shallow water gas allowance for example pound14 billion of investment was sanctioned in the Cygnus gas development which is expected to create 1200 jobs Many fields will also benefit from the introduction of the brown field allowance including the Thistle oil field where an incremental project is expected to safeguard 500 existing jobs and create almost 1000 new ones across the UK
B43 However it is important to note that the immediate impact of higher investment is to reduce short-term tax revenues as investment is subject to tax relief The Government can afford to take these long-term decisions even at the expense of short-term revenues in the current fiscal climate because of the size and diversity of the UK economy and the importance of making the most of remaining reserves in the long-term
116 Scotland analysis Macroeconomic and fiscal performance
Industry investment and operating costs
B44 Industry expenditure has a significant impact on tax revenues As explained above investment is subject to tax relief and so increased investment lowers short-term tax revenues Chart BG below shows that while investment was relatively stable in the first ten years following devolution the impact of increasing oil prices and the Governmentrsquos recent announcements has been to encourage a significant increase in investment from 2009 onwards This is most significant in relation to the forecasts of tax revenues over the next five years and is one of the key factors highlighted by the OBR for their forecast of lower tax revenues during this period
B45 Although less significant increased operating costs (as extraction becomes more difficult) reduce profits for a given level of production which in turn reduce tax revenues
Chart BG North Sea Investment 14
13
pound b
illio
n (c
ons
tant
201
2 p
rice
sus
ing
UC
CI d
efla
tor)
12
11
10
9
8 7
6
5
4
3
2
1
0
2000
2001
2002
2003
2004
2005
2006
2007
2008
2009
2010
2011
2012
2013
2014
2015
2016
2017
Source DECC oil and gas UK field data
B46 Further to the above Box BB provides a summary of the impacts of these key factors on the levels of North Sea tax revenues
Annex B Scotlandrsquos tax and spending as part of the UK 117
Box BB Summary of the impact of key factors on North Sea tax revenues As explained above it is the combined impact of production levels prices industry expenditure and the governmentrsquos fiscal regime that determines the level of tax revenues generated by the North Sea
The key impacts and interactions are as follows
bull decreasingincreasing production will lead to lowerhigher tax revenues everything else being equal
bull decreasingincreasing prices (or equivalent exchange rate effects) will lead to lower higher tax revenues everything else being equal
bull decreasingincreasing operating costs will lead to higherlower tax revenues everything else being equal
bull tax revenues from the North Sea are volatile as they are dependent on volatile oil and gas prices and production levels (which can be significantly affected by unplanned maintenance and temporary field closures)
bull industry investment is encouraged by the Governmentrsquos fiscal regime (through tax relief) and therefore reduces short-term government revenues Recent government announcements particularly on long-term decommissioning certainty have contributed to significant increases in planned investment While investment is expected to slow the decline in production it will actually contribute to the reduction in short-term revenues
118 Scotland analysis Macroeconomic and fiscal performance
Annex C Modelling the Effect of the Border
C1 There is a large body of literature which attempts to model the effect of a border on international trade flows One method which has been widely employed is a gravity model which seeks to capture the degree by which trade between regions is higher than trade across an international border A review of this literature as well as wider trade literature would suggest that the creation of a border is likely to be detrimental to the performance of the Scottish economy However there is great uncertainty over the magnitude of this effect The methodology in this paper has therefore adapted the well-known framework which has the benefit of being both parsimonious and transparent in order to provide illustrative estimates of how both the flow of goods and labour might be affected by the creation of an international border
Estimating the border effect on trade and migration for Scotland C2 The lack of a physical border between the rest of the UK and Scotland requires a
departure from the methodology used in the empirical gravity equation literature With a historical border in place studies tend to use a dummy variable which is equal to one when trade crosses the border and equal to zero when trade occurs within a region Performing an analysis of the counterfactual does not permit this approach
C3 Instead the methodological approach is to estimate a gravity equation for migration and trade within the Eurozone using this to predict the flows of goods and labour between Scotland and the continuing UK if they were in a monetary union with fiscal independence ndash the current macroeconomic policy framework within the Eurozone The difference between the prediction and the actual data is considered to be the estimated effect of a border
C4 The difference between the two numbers is unlikely to be solely due to the effect of a border with other unobservable characteristics creating the discrepancy (see below) Furthermore it is likely to overestimate the effect of the creation of a border between Scotland and the rest of the UK especially in the short term This is a result of the fact that the historical ties create hysteresis effects within the trade flows As such any estimates presented in this paper should be considered long term estimates of the potential effect on the flow of goods and labour
Annex C Modelling the Effect of the Border 119
Data C5 The data used comes from a variety of sources The data on bilateral migration flows
comes from Eurostat The trade statistics come from the IMF DOTS database and the GDP figures come from Eurostat The information about distance contiguity and colonial history comes from a dataset used by other authors in similar studies which has been published by the CEPII The data runs from 2002-2011 in order to capture the date at which the banknotes and coins came into circulation
Specification C6 The basic specification of the trade model is given below
ln(Xijt) = α0 + α1ln(Yjt) + α2ln(Yit) + α3 ln(Distij) + α4ComLangij + εijt
C7 This equation represents a double-log specification where i and j denote countries t denotes time and the variables are defined as follows
bull (Xijt) is exports from region i to region j
bull (Yi) and (Yj) are the gross domestic products of countries i and j
bull (Distij) is the distance from i to j
bull (Comlangij) is a dummy variable equal to one if the countries share the same language
C8 In the case of migration the equation takes the following form
ln(Migrijt) = α0 + α1ln(POPjt) + α2ln(POPit) + α3 ln(Distij) + α4ComLangij + α5 ln(relyijt) + εijt
C9 In this equation the variables are defined as follows
bull (Migrijt) is migration from region i to region j
bull (Popi) and (Popj) are the populations of countries i and j and
bull (Relyijt) is the ratio of destination to source per capita incomes This picks up the main driver of migration in labour market models which suggest that the attractive force between immigrant source and destination countries is the difference between labour incomes in the two countries
C10 This equation represents a baseline specification which can be used to run a pooled OLS regression As set out in a variety of papers there are econometric issues which arise from doing this
bull Omitted Variable Bias There are a variety of variables which may be omitted from the specification above For example Anderson and van Wincoop (2003)1 argue that the concept of lsquomultilateral resistancersquo (see box CA) needs to be addressed in order to create a specification consistent with micorfounded economic theory
bull Heteroskedasticity and Autocorrelation In order to be the best linear unbiased estimator (BLUE) the OLS estimator assumes constant variance of residuals (homoskedasticity) Heteroskedasticity in the residuals is likely to occur where the scale of the dependent variable varies across the cross-sections Autocorrelation is likely to occur if the time series dimension of the data causes it to display lsquomemoryrsquo
Gravity with Gravitas A solution to the Border Puzzle Anderson and van Wincoop (2003) 1
yiyj tij 1ndashσ xij = yw (PiPj)
120 Scotland analysis Macroeconomic and fiscal performance
bull Cross sectional correlation this assumption is likely to be violated in gravity models for trade because countries are facing similar global developments (eg world business cycle oil price etc) Furthermore cross-sectional correlation plays a much more important role for trade data because the development of bilateral trade reflects the economic situation of both the home and foreign economies
Box CA Multilateral Resistance Anderson and van Wincoop (2003)2 derive the following equation to explain trade flows
This equation gives exports from country i to j (xij) as a function of the combined income of the two countries relative to the rest of the world (y) bilateral trade barriers (tij) relative to the multilateral trade barrier of each country (P) and the elasticity of substitution between all goods (σ gt1 ) In other words bilateral exports depend on the bilateral trade barrier relative to the average trade barrier with all trading partners
One of the implications of this equation is that trade barriers reduce size-adjusted trade between large countries more than between small countries Furthermore trade barriers raise size adjusted trade within small countries more than within large countries
A simple illustration of the former implication is as follows for a large country (P) contains a larger proportion of internal barriers all of which are unaffected by an increase in the trade barrier Therefore an increase in (tij) increases (P) for both countries but this increase accounts for a smaller proportion of (P) so the ratio in the brackets increases by more than it does for a small country As (σ gt1 ) bilateral trade falls in response to the increase in the relative trade barrier between the two countries
Alternative estimation2
C11 To assess the robustness of the estimates it is possible to exploit the panel data structure to control for unobservables which may create bias some of the coefficients in the OLS regression Two different methodologies are presented here
bull Fixed Effects The fixed effects estimator allows for the specification of invariant effects across either the cross-section or time A variety of papers starting with Anderson and van Wincoop (2003)3 and more recently Head and Mayer (2013)4 argue that in order to estimate a gravity model which is consistent with economic theory time-varying importer and exporter fixed effects should be specified to capture the multilateral resistance terms
bull Random Effects The random effects estimator assumes that all time-invariant unobserved factors can be modelled by incorporating a random error term The individual effect is therefore assumed to be drawn independently from a distribution Coughlin and Novy (2012)5 use this estimator in their study of the intranational and international border effect in the USA
2 Gravity with Gravitas A solution to the Border Puzzle Anderson and van Wincoop (2003) 3 Gravity with Gravitas A solution to the Border Puzzle Anderson and van Wincoop (2003) 4 Gravity Equations Workhorse Toolkit and Cookbook Head and Mayer (2013) 5 Is the International Border Effect Larger than the Domestic Border Effect Evidence from US Trade Coughlin
and Novy (2012)
Annex C Modelling the Effect of the Border 121
C12 The results of both the fixed and random effects regression give similar coefficients on distance and common language to those obtained under the OLS regressions Using the estimated coefficients from the random effects regression illustrates the effect of the border is broadly similar to that estimated in the OLS regressions although the uncertainty around the estimate is wider6
Table CA Results from estimating the trade gravity equation
Pooled Ordinary Least Squares
Random Effects Fixed Effects
Exporter GDP 1109 1094 shy
(0013) (0034)
Importer GDP 0857 0852 shy
(0011) (0029)
Distance -1194 -1200 -1225
(0028) (0083) (0030)
Common Language 0309 0312 0411
(0062) (0177) (0078)
Constant -22358 -21824 28704
(0545) (1437) (0293)
Range of Fitted Values for Scottish Exports to rUK 2002-2011 (poundbn)
45-55 37-67 shy
Average Value of Scottish Exports to UK 2002-2011 (poundbn) 325 325 shy
Range of Implied Border Effect 83-86 79-89 shy
Range of Fitted Values for rUK Exports to Scotland 2002-2011 (poundbn)
80-100 63-122 shy
Average Value of rUK Exports to Scotland 2002-2011 (poundbn) 426 426 shy
Range of Implied Border Effect 77-81 71-85 shy
Robust Standard Errors in Parenthesis Significant at the 10 level Significant at the 5 level Significant at the 1 level
Exporter GDP Importer GDP and distance in logs
Source HMT calculations
6 An estimate of the border effect based on the fixed effects estimation is not possible as no dummy variables for Scotland and the continuing UK have been estimated
122 Scotland analysis Macroeconomic and fiscal performance
Table CB Results from estimating the migration gravity equation
Pooled Ordinary Least Random Effects Squares
Source Population 0683 0743
(0025) (0067)
Destination Population 0951 0985
(0029) (0072)
Distance -0758 -0723
(0060) (0150)
Common Language 1583 1413
(0181) (0453)
Relative Incomes 0431 0782
(0056) (0187)
Constant -15622 -17331
(0879) (2205)
Range of Fitted Values for Scottish migration to rUK 2002-2011 4292-8158 2257-11581
Average Migration Scotland to rUK 2002-2011 43809 43463-43809
Range of Implied Border Effect 81-90 74-95
Range of Fitted Values for rUK migration to Scotland 2002-2011 2346-4555 1370-7104
Average Migration rUK to Scotland 2002-2011 52195 52195
Range of Implied Border Effect 91-96 86-97
Robust Standard Errors in Parenthesis Significant at the 10 level Significant at the 5 level Significant at the 1 level
Exporter GDP Importer GDP and distance in logs
Source HMT calculations
Calculating Welfare Effects C13 Arkolakis Costinot and Rodriguez-Clare (2012)7 demonstrate that a range of trade models
allow gains from trade to be computed as follows W rsquo λrsquo 1
ε∆W = W = (( ) ndash1) 10 0
λ
C14 In this equation the variables are defined as follows
bull ∆W is the countryrsquos change in real income W
bull λ is the share of a countryrsquos expenditure devoted to domestic goods
bull ε is the elasticity of imports with respect to variable trade costs
C15 The OECD STAN indicators dataset Rev 3 2011 contains comparable import penetration ratios which are computed as follows
importsi (productioni ndash exportsi + importsi)
New Trade models Same old gains Arkolakis et al (2012) 7
Annex C Modelling the Effect of the Border 123
C16 Import penetration ratios for Scotland are computed in the same way using the Scottish National Accounts 2012 Quarter 3 data on gross output imports and exports
C17 The elasticity ε can be estimated from a model of trade flows on trade costs As discussed by Arkolakis Costinot and Rodriguez-Clare (2012)8 this may be done using a gravity equation where the parameter on the relative trade costs between two countries is ε
C18 A review of the literature shows that trade elasticity estimates differ across trade models and individual specifications Eaton and Kortum (2012 p77)9 recommend using an elasticity of -4 obtained by Simonovska and Waugh (2011)10 A more recent paper by Simonovska and Waugh (2012)11 comparing elasticities obtained using different trade models finds elasticities in the range of -28 to -52 Having undertaken a meta-analysis of 32 papers Head and Mayer (2013)12 take the view that the elasticity with respect to trade costs is -503 which forms the basis of estimates in this paper
Conclusion C19 The analysis in Chapter 3 is designed to be illustrative Taking a well-known approach in
trade analysis it captures what could happen to goods and labour flows as well as real income if in the long-run the relationship between Scotland and the continuing UK looked similar to countries in the euro area In the short-run any costs of economic disintegration are likely to be small as a result of the strong cultural and historical ties between Scotland and the continuing UK while in the estimate for the long-run effect of the border is in line with the literature
8 New Trade models Same old gains Arkolakis et al (2012) 9 Putting Ricardo to Work Eaton and Kortum (2002) 10 The Elasticity of Trade Estimates and Evidence Simonovska and Waugh (2011) 11 Different Trade Models Different Elasticities Simonovska and Waugh (2012) 12 Gravity equations Workhorse Toolkit and Cookbook Head and Mayer (2013)
124 Scotland analysis Macroeconomic and fiscal performance
Annex D References
Alesina A (2003) The size of countries Does it matter Journal of the European Economic Association 1 No 2-3 301-316
Anderson J E and E van Wincoop 2003 ldquoGravity with Gravitas A Solution to the Border Puzzlerdquo The American Economic Review 93 (1) 170-192
Arkolakis C Costinot A and Rodriguez-Clare A (2012) ldquoNew Trade Models Same Old Gainsrdquo American Economic Review 102 (1) 94-130
Badinger H (2001) ldquoGrowth Effects of Economic Integration The Case of the EU Member States (1950-2000)rdquo
Barro R and Sala-i-Martin X (1992) ldquoRegional growth and migration A Japan-United States comparisonrdquo Journal of Journal of the International and Japanese Economies
Borjas G (1995) ldquoThe economic benefits from immigrationrdquo Journal of Economic Perspectives 9(2) 322
Bun M and Klaassen F (2002) ldquoHas the Euro Increased Traderdquo Tinbergen Institute Discussion Paper 02-1082
Centre for Public Policy for Regions (2013) ldquoAnalysis of Scotlandrsquos Past and Future Fiscal Positionrdquo
Centre for Public Policy for Regions (2013) ldquoMeasuring an independent Scotlandrsquos economic performancerdquo
Centre for Public Policy for Regions (2013) ldquoReflections on the latest Oil and Gas related analysisrdquo by the Scottish Government and the Office for Budget Responsibility
Coughlin C C and Novy D (2012) ldquoIs the International Border Effect Larger than the Domestic Border Effect Evidence from US Traderdquo CEP Discussion Paper No 1162 September 2012 UCD Centre for Economic Research Working Paper Series WP 0110
De Groot H L F Linders G-J Rietveld P and Subramanian U (2004) The Institutional Determinants of Bilateral Trade Patterns Ky k lo s 57 pp 103-123
DellrsquoAriccia G (1999) ldquoExchange rate fluctuations and trade flows evidence from the European Unionrdquo IMF Staff Papers 46(3) pp 315-334
Down I (2007) ldquoTrade Openness Country Size and Economic Volatility The Compensation Hypothesis Revisitedrdquo Business and Politics Volume 9 Issue 2 2007 Article 3
Annex D References 125
Drinkwater S Levine P Lotti E and Pearlman J (2003) The Economic Impact of Migration A Survey Discussion Paper in Economics at the University of Surrey
Eaton J and Kortum S Putting Ricardo to Work Journal of Economic Perspectives Vol 26 No 2 pp 65-90
Eaton J and Kortum S (2002) ldquoTechnology Geography and Traderdquo Econometrica 70 (5) 1741
Feenstra R C (2004) ldquoAdvanced International Trade Theory and Evidencerdquo Princeton University Press Princeton New Jersey
Fic T Holland D Paluchowski P Rincon-Aznar A Stokes L (2011) Labour mobility within the EU ndash The impact of enlargement and transitional arrangements NIESR Discussion Paper No 379
Fitzsimmons E Hogan V and Neary J P (1999) ldquoA Gravity Model of North-South Traderdquo Economic and Social Review 30 (4) 391-402
Frankel amp Rose (2002) ldquoAn Estimate of the Effect of Common Currencies on Trade and Incomerdquo The Quarterly Journal of Economics May 2002
Frankel amp Romer (1999) ldquoDoes Trade Cause Growthrdquo The American Economic Review June 1999
Furceri D and Karras G (2008) ldquoBusiness cycle volatility and country size evidence for a sample of OECD countriesrdquo Economics Bulletin Vol 5 No 3 pp 1-7
Griffith R Redding S and Simpson H (2004) ldquoForeign Ownership and Productivity New Evidence from the Service Sector and the RampD Labrdquo CEP Discussion Paper No 649
Head K and Mayer T (2013) Gravity equations Workhorse Toolkit and Cookbook CEPR Discussion Papers 9322 CEPR Discussion Papers
Head K Mayer T Ries J (2010) ldquoThe erosion of colonial trade linkages after independencerdquo Journal of International Economics 81 (1) 114
Helliwell JF (1997 ldquoNational Borders Trade and Migrationrdquo Pacific Economic Review Vol 2 No 3 pp 165-85
Henrekson M Torstensson J and Torstensson R (1997) ldquoGrowth Effects of European Integrationrdquo European Economic Review 41(8) 1537-1557
HM Government (2013) ldquoScotland analysis Business and microeconomic frameworkrdquo
HM Government (2013) ldquoScotland analysis Currency and Monetary Policyrdquo
HM Government (2013) ldquoScotland analysis Devolution and the implications of Scottish independencerdquo
HM Treasury (2003) EMU and Trade EMU Study
HM Government (2013) ldquoScotland analysis Financial Services and Bankingrdquo
International Energy Agency (2012) ldquoKey World Energy Statistics 2012rdquo
International Monetary Fund (2013) ldquoConcluding Statement of IMF Article IV Mission to Norwayrdquo
Iwamoto Y and E van Wincoop (2000) ldquoDo Borders Matter Evidence from Japanese Regional Net Capital Flowsrdquo International Economic Review Department of Economics University of Pennsylvania and Osaka University Institute of Social and Economic Research Association vol 41 (1) pages 241-69 February
126 Scotland analysis Macroeconomic and fiscal performance
Kaminski B and Smarzynska B (2003) ldquoNever Too Late to Get Together Again Turning the Czech and Sloval Customs Union into a Stepping Stone to EU Integrationrdquo Policy Research Working Paper 2054 The World Bank Development Research Group
Karras G (2006) ldquoTrade Openness Economic Size and Macroeconomic Volatility Theory and Evidencerdquo Journal of Economic Integration
Kose M Prasad E S Rogoff K and Wei S-J (2006) ldquoFinancial Globalization A Reappraisalrdquo IMF Working Paper WP06189
Kose M A Prasad E S and Terrones ME (2005) ldquoHow Do Trade and Financial Integration Affect the Relationship Between Growth and Volatilityrdquo IMF Working Paper 0519
Landau D (1995) ldquoThe Contribution of the European Common Market to the Growth of its Member Countries An Empirical Testrdquo Weltwirtschaftliches Archiv 131(4) 774-782 IEF Working Paper Nr 40
McCallum J (1995) ldquoNational borders matter Canada-US regional trade patternsrdquo The American Economic Review 85 (3) 615-623
Nitsch V (2000) ldquoNational Borders and International Trade Evidence from the European Unionrdquo Canadian Journal of Economics 33 pp 1091-1105
Office for Budget Responsibility (March 2013) ldquoEconomics and fiscal outlookrdquo
Office for Budget Responsibility (2013) ldquoFiscal sustainability reportrdquo
Pacchioli C (2011) ldquoIs the EU internal market suffering from an integration deficit Estimating the lsquohome-bias effectrdquo Centre for European Policy Studies No348
Poot J Ganesh Nana G and Philpott B (1988) ldquoInternational migration and the New Zealand economy A long-run perspectiverdquo
Portes R and Rey H (2005) ldquoThe determinants of cross-border equity flowsrdquo Journal of International Economics 65 (2) 269
Rauch JE (2001) ldquoBusiness and Social Networks in International Tradersquo Journal of Economic Literaturerdquo 39 pp 1177-1203Wei S-J (1996) ldquoIntra-National versus International Trade How Stubborn are Nations in Global Integrationrdquo Working Paper 5531 NBER
Rauch JE (1999) lsquoNetworks versus markets in international tradersquo Journal of International Economics 48 pp 7-35
Requena F and Llano C (2006) ldquoThe border effects in Spain an industry-level analysisrdquo Dpto de Anaacutelisis Econoacutemico Universidad Autoacutenoma de Madrid 28049 Cantoblanco Madrid Spain
Rodrik D (1998) ldquoWho Needs Capital-Account Convertibilityrdquo In Stanley Fischer and others eds ldquoShould the IMF Pursue Capital-Account Convertibilityrdquo Essays in International Finance 207 Department of Economics Princeton University Princeton NJ
Rose AK (2000) ldquoOne money one market Estimating the effect of common currencies on traderdquo Economic Policy 30 pp7ndash45
Rose AK and van Wincoop E (2001) ldquoNational money as a barrier to international trade Thereal case for currency unionrdquo American Economic Review 91(2) pp386ndash390
Simonovska I and Waugh M (2012) Different Trade Models Different Elasticities Paper provided by Society for Economic Dynamics in its series 2012 Meeting Papers No 618
Annex D References 127
Simonovska I and Waugh M (2011) The Elasticity of Trade Estimates and Evidence NBER Working Paper No 16796
Skancke M (2003) ldquoFiscal policy and petroleum fund management in Norwayrdquo in Jeffrey M Davis (ed) Fiscal Policy Formulation and Implementation in Oil-Producing Countries Washington DC International Monetary Fund
The Scottish Government (2013) ldquoFiscal Commission Working Group First Report Macroeconomic Frameworkrdquo
The Scottish Government (2013) ldquoGovernment Expenditure amp Revenue Scotland 2011-12rdquo
The Scottish Government (2013) ldquoScottish National Accounts Projectrdquo
Thom R and Walsh B (2001) The effect of a common currency on trade Ireland before and after the Sterling link UCD Centre for Economic Research Working Paper Series WP 0110
Wei S-J (1996) Intra-National verses International Trade How Stubborn are Nations in Global Integration Working Paper 5531 NBER
Wolf H (2000) ldquoIntranational Home Bias in Trade Review of Economics and Statisticsrdquo 82 pp 555-563
Published by TSO (The Stationery Office) and available from
Online wwwtsoshopcouk
Mail telephone fax and email TSO PO Box 29 Norwich NR3 1GN Telephone ordersgeneral enquiries 0870 600 5522 Order through the Parliamentary Hotline Lo-Call 0845 7 023474 Fax orders 0870 600 5533 Email customerservicestsocouk Textphone 0870 240 3701
The Houses of Parliament Shop 12 Bridge Street Parliament Square London SW1A 2JX Telephone ordersgeneral enquiries 020 7219 3890 Fax orders 020 7219 3866 Email shopparliamentuk Internet httpwwwshopparliamentuk
TSOBlackwell and other accredited agents
- Scotland analysis Macroeconomic and fiscal performance
- Contents
- Executive summary
- Introduction
- Chapter 1 An integrated economic union
-
- Economic alignment between Scotland and the rest of the UK
- Scottish economic performance over time
- Performance during the financial crisis
- Including North Sea oil and gas
- Scottish economic performance compared to similar small advanced economies
- Benefits of economic integration for economic performance
- Scotlandrsquos integration with the rest of the UK
- Trade
- Labour
- Capital
- Integration and economic stability
- Chapter 1 Conclusion
-
- Chapter 2 The UKrsquos integrated fiscal model
-
- Fiscal alignment between Scotland and the rest of the UK
- Including North Sea oil and gas
- Pooling of resources
- Policy flexibility within an integrated fiscal model
- Scotlandrsquos spending policy flexibility
- The UKrsquos integrated tax system
- Scotlandrsquos tax policy flexibility introduced with the Scotland Act 2012
- Chapter 2 Conclusion
-
- Chapter 3 The Border Effect
-
- The ldquoborder effectrdquo impact of independence on economic integration
-
- Characterising the potential border between an independent Scottish state and the continuing UK
- Assessing the impact of a border on economic integration between Scotland and the rest of the UK
-
- Conclusion
-
- Chapter 4 Managing volatility in the public finances
-
- The case for an oil fund and its implications
- Economic rationale for an oil fund
- Fiscal implications of an oil fund
- Modelling an oil fund for an independent Scottish state
- Conclusion
-
- Chapter 5 Conclusion
- Annex A Scotlandrsquos economic performance as part of the UK
-
- A picture of Scotlandrsquos economic place in the UK
- Performance over time relative to the UK ndash long-term trends and the impact of the recession
- Scotlandrsquos economic performance relative to comparable independent countries
- Scotlandrsquos performance relative to independent comparable countries
-
- Annex B Scotlandrsquos tax and spending as part of the UK
-
- Assessing Scotlandrsquos tax and spending as part of the UK
- Scotlandrsquos public spending as part of the UK
- Scotlandrsquos funding as part of the UK
- Scotlandrsquos onshore revenues
- Scotlandrsquos revenues including North Sea tax revenues
- Factors affecting North Sea tax revenues
-
- Annex C Modelling the Effect of the Border
-
- Estimating the border effect on trade and migration for Scotland
- Data
- Specification
- Alternative estimation2
- Calculating Welfare Effects
- Conclusion
-
- Annex D References
-

Scotland analysis Macroeconomic and fiscal
performance
Presented to Parliamentby the Chief Secretary to the Treasury
by Command of Her MajestySeptember 2013
Cm 8694
pound3000
copy Crown copyright 2013
You may re-use this information (excluding logos) free of charge in any format or medium under the terms of the Open Government Licence To view this licence visit wwwnationalarchivesgovukdocopenshygovernment-licence or e-mail psinationalarchivesgsigovuk
Where we have identified any third party copyright information you will need to obtain permission from the copyright holders concerned
Any enquiries regarding this publication should be sent to us at The Correspondence and Enquiry Unit HM Treasury 1 Horse Guards Road London SW1A 2HQ
This publication is available for download from wwwgovukscotlandanalysis
ISBN 9780101869423
Printed in the UK by The Stationery Office Limited on behalf of the Controller of Her Majestyrsquos Stationery Office
ID 2582158 0913
Printed on paper containing 75 recycled fibre content minimum
Contents
Executive summary 5
Introduction 11
Chapter 1 An integrated economic union 15
Chapter 2 The UKrsquos integrated fiscal model 33
Chapter 3 The border effect 53
Chapter 4 Managing volatility in the public finances 69
Chapter 5 Conclusion 85
Annex A Scotlandrsquos economic performance as part of the UK 89
Annex B Scotlandrsquos tax and spending as part of the UK 105
Annex C Modelling the effect of the border 118
Annex D References 124
Executive summary
In September 2014 people in Scotland will take one of the most important decisions in the history of Scotland and the whole of the United Kingdom (UK) ndash whether to stay in the UK or leave it and become a new separate and independent state In advance of the referendum the UK Government will ensure through the Scotland analysis programme that the debate is properly informed by analysis and that the facts crucial to considering Scotlandrsquos future are set out
This paper sets out the role of economic and fiscal integration in shaping Scotlandrsquos economic performance as part of the UK and describes some of the potential economic and fiscal consequences of independence It follows the fourth paper in the Scotland analysis series Scotland analysis Business and microeconomic framework which sets out how the UKrsquos domestic market is a key part of Scotlandrsquos successful business environment
The economic benefits of integration shared opportunities pooled risk Integration is at the heart of the economic fiscal and political union between Scotland and the rest of the UK and produces tangible benefits for Scotlandrsquos macroeconomic performance The UKrsquos domestic market allows for the free movement of goods and services labour and capital to all parts of the UK The freedom to trade goods and services across the UK supports greater productivity through knowledge sharing specialisation and economies of scale There are significant trade flows across the UK in 2011 Scotland exported pound36 billion worth of goods and services to the rest of the UK and imported pound49 billion from the rest of the UK1
Workers can easily move throughout the UK helping to match individuals and jobs and to alleviate unemployment in particular areas in times of economic difficulty In 2011 33000 people of working age moved from the rest of the UK to Scotland and another 35000 moved in the opposite direction demonstrating the flexibility and ease of movement that the UK provides to people of working age2 Based on current data it is estimated over half a million people born in England Northern Ireland and Wales now live in Scotland and over 700000 people born in Scotland have moved to other parts of the UK3
Integrated capital markets across the UK ensure the best and most profitable investments gain access to finance Scottish holdings of assets in the rest of the UK diversifies risk reducing the impact of a Scotland-specific downturn on incomes in Scotland And Scotland is a more attractive place to invest because it is part of the UK domestic market meaning companies
1 Scottish Government Scottish National Accounts Project Quarterly National Accounts 2012 Q3 2 General Register Office for Scotland 3 2001 Census
6 Scotland analysis Macroeconomic and fiscal performance
investing in Scotland have access to a large market and diverse and skilled labour force Scotland was the most successful part of the UK outside London in attracting foreign direct investment in 2012
Scotlandrsquos economic performance as part of the UK The benefits of this deep economic integration can be seen in Scotlandrsquos economic performance as a part of the UK The performance of the Scottish economy is similar to that of the UK as a whole On average a worker in Scotland produces almost exactly the same as a worker in the rest of the UK4 Scotland has the third highest economic output per person of all parts of the UK behind only London and the South East of England5 While Londonrsquos performance is very strong it is in line with the stronger performing Scottish cities The annual growth in the cash value of economic output per person from 1995 to 2011 was 49 per cent in London 50 per cent in Glasgow City and 44 per cent in both the City of Edinburgh and Aberdeen and Aberdeenshire And Scottish output per person is closer to the overall UK average than any other part of the UK Since 1963 growth in economic output per person has been slightly stronger in Scotland than in the UK averaging 20 per cent in Scotland and 19 per cent in the UK overall 6 Differences in employment rates between the UK and Scotland have narrowed over time the latest data show that the employment rate in Scotland is now higher than the UK at 719 per cent compared with 714 per cent7
Scotland has performed well relative to comparable independent countries 8 Scotland has very slightly higher economic output per person than Denmark and Finland significantly higher than Portugal and not far behind Austria Ireland and Sweden Having been weaker in the 1970s and 1980s growth in output per person is above the median for comparable independent countries over the 1990s and 2000s9 Over the last 20 years Scotland has maintained a significantly higher employment rate than the median of these countries10
Scotlandrsquos economy has particular strengths in a number of sectors such as energy (including North Sea oil and gas) and finance However these sectors are comparatively vulnerable to economic shocks which has a significant impact on Scottish economic and fiscal performance year-to-year The integration of the Scottish economy into the larger and more diverse UK economy shields the Scottish economy from the damaging effects of economic volatility and limits the impact of global crises Scotlandrsquos growth has avoided some of the volatility observed elsewhere in comparable European countries A much more severe impact has been observed in smaller open economies that are more exposed to economic volatility the majority of which experienced deeper recessions than Scotland11
Scotlandrsquos fiscal position as part of the UK The similarity of Scotlandrsquos economic performance to the UK as a whole is reflected in the amount of tax that Scotland generates Scottish onshore tax revenues per person have been only slightly lower than the UK average since devolution in 1998 Over the same time period
4 ONS Regional Labour Productivity 5 ONS Regional Gross Value Added 6 Scottish Government GDP Statistical Bulletin (2010 Q1 and 2013 Q1) ONS UK Real GVA excluding North Sea
oil and gas (KLH7 and UIZY) ONS Mid-year population estimates General Register Office for Scotland 7 ONS Labour Market Statistics (July 2013) Labour Force Survey 8 Austria Denmark Finland Ireland Luxembourg Portugal and Sweden as identified by the Scottish
Government for their economic growth target 9 OECD National Accounts Statistics GVA at basic prices Scottish Government GDP Statistical Bulletin 10 Eurostat OECD ONS Labour Market Statistics 11 Eurostat Scottish Government Quarterly GDP (2013 Q1)
Executive summary 7
public spending per person in Scotland has been around 10 per cent higher than the UK average Therefore Scotlandrsquos notional onshore fiscal balance has been considerably weaker than the UKrsquos over the same timeframe In the event of independence the allocation of North Sea oil and gas revenues would be subject to negotiation On the basis of a geographical apportionment Scotlandrsquos notional fiscal balance for the period since devolution is very similar to the UKrsquos public finances over the same period12
North Sea oil and gas receipts are commonly one of the most volatile sources of revenue Since devolution Scotlandrsquos geographical share of North Sea oil and gas receipts has fluctuated between pound2 billion and pound12 billion from 24 per cent to 83 per cent of Scottish GDP Based on the earliest available data Scottish receipts since 1981-82 have been almost twice as volatile as UK-wide receipts while Scottish public spending has been just as stable13
Volatility in spending and tax revenues in Scotland and the UK 70
00
10
20
30
40
50
60
2 ndash1
11al 20
re
toin ch
ange
2 ndash8
8119
te
d sp
endi
ng
abso
lue
rag
e anA
v ts
ceip
re
Receipts volatility Spending volatility
UK Scotland UK Scotland
37
61
30 28
Source Scottish Government GERS HM Treasury calculations
The UKrsquos broader and more diverse tax base helps maintain the stability of public spending in Scotland and smooth the impact of volatile sources of revenue such as North Sea oil and gasThe high degree of fiscal integration across the UK means that fiscal resources can easily be deployed in response to shocks in individual parts of the UK For example there is no requirement that spending on pensions in Scotland need fall if oil revenues fall
This is the UK fiscal model in action diffusing the volatility of Scottish receipts across the UK while providing stability and security on public spending Through the pooling of major tax revenues across the UK Scotland therefore contributes a volatile revenue stream from North Sea oil and gas in return for secure and stable funding from the UK Government
The fiscal model protects Scotland from a more difficult set of fiscal choices In the absence of shared public finances in 2009-10 ndash in the aftermath of a halving of North Sea oil and gas revenues14 ndash Scotland would have faced a choice between implementing immediate spending cuts of pound6 billion (which equates to half Scotlandrsquos health budget) increasing other taxes by this amount or absorbing this volatility in its budget deficit As a small independent country Scotland would have less flexibility to absorb shocks of this kind in its budget deficit than the UK as it would be likely to pay higher borrowing costs
12 Scottish Government GERS (for all figures in this paragraph) 13 This is the impact of year-on-year volatility but in addition independent analysts expect North Sea oil and gas
revenues to decline over time which would require other taxes to increase by the same amount to maintain the same level of public spending
14 HM Revenue amp Customs Government revenues from UK oil and gas production
8 Scotland analysis Macroeconomic and fiscal performance
The economic consequences of independence the ldquoborder effectrdquo In the event of a vote for independence Scotland would leave the UK and a separate Scottish state would have to establish its own macroeconomic and institutional framework Institutional and policy divergence between Scotland and the continuing UK would be likely to lead to a weakening of economic integration And over the longer-term some business networks might end as a result of economic historical and cultural ties being weakened Devolution would end along with the pooling of fiscal risks across the UK the stabilising role of fiscal transfers between different parts of the UK and the ability to share costs and coordinate policies across the UK
Collectively these changes would be expected to trigger a ldquoborder effectrdquo international evidence shows that flows of trade labour and capital are much larger between two regions of the same country than between two (otherwise similar) regions of two different countries This effect occurs even when there is no physical border between countries and even where trade agreements and structures such as the European Single Market are in place The most well known example of this effect is trade between the US and Canada Independent academic evidence concludes that the border reduces trade between the US and Canada by 44 per cent15
While historical and cultural ties between an independent Scottish state and the continuing UK are likely to prevent an immediate fall off in flows evidence of previous separations points to the erosion of these ties as time passes In the case of Czechoslovakia the fall in trade shares between the two new states was very rapid Combined with regulatory divergence Scottish independence would lead to barriers to trade and obstacles to labour and capital mobility where there presently are none The choice of currency for an independent Scottish state could also introduce a barrier to trade and the Scotland analysis Currency and monetary policy paper established that the wider economic rationale for the continuing UK to enter a formal sterling union is not clear Even if the Scottish Governmentrsquos ambition of a common currency between an independent Scottish state and the continuing UK were to come to fruition the long term effect of independence on trade flows and labour mobility could still be considerable
If the relationship between Scotland the rest of the UK were to become similar to that between euro area countries there would be headwinds to Scottish (and continuing UK) growth On this basis the analysis in this paper shows that as an impediment to trade flows the border is likely to reduce the level of real income in the Scottish economy by around 4 per cent after 30 years with the effect building over time The rest of the UK would also suffer from reduced trade flows but the impact on incomes would be only 02 per cent of GDP as Scotland constitutes a smaller share of total trade for the rest of the UK This analysis assumes Scotland and the UK would have the same levels of trade between them as seen between euro area countries after allowing for differences in economic size distance between countries and language The euro area has been used as the basis for comparison as these countries are part of the Single Market and share a common currency This analysis assumes however that an independent Scottish state and the continuing UK are also able to use a common currency by agreeing to form a formal sterling currency union the Scotland analysis Currency and monetary policy paper established that this is unlikely An independent Scotland could look to new markets to offset this drag on growth but it is not clear whether this would be able to compensate for the effect on trade flows with the continuing UK
15 Gravity with Gravitas A solution to the border puzzle Anderson and van Wincoop (2003)
Executive summary 9
Managing volatility in the public finances the case for an oil fund In the event of independence Scotland would be directly exposed to a narrower tax revenue base and more volatile fiscal position An independent Scottish state could try to smooth its public finances and manage volatile oil and gas revenues by establishing an oil fund
While the economic rationale for an oil fund is clear for a country of Scotlandrsquos size establishing such a fund would affect the fiscal choices available to an independent Scottish state Implementing an oil fund in a similar way to Norway would imply very significant tax increases or cuts to public spending over and above the plans that have been set by the UK Government to repair the impact of the financial crisis Based on forecasts of Scotlandrsquos fiscal position in 2016-17 by the Centre for Public Policy for Regions for an independent Scotland to start an oil fund in 2016-17 from a balanced budget additional fiscal consolidation of 51 per cent of GDP16
or pound84 billion in real terms would be needed That implies nominal spending cuts of 13 per cent from current levels or onshore tax rises of 18 per cent Additional fiscal consolidation would then be required to begin making contributions to the fund17
Even if an independent Scotland were able radically to adjust fiscal policy and implement an oil fund this would not smooth all volatility in Scotlandrsquos public finances It may take considerable time to build up a fund of adequate size to manage volatility in the public finances Assuming an independent Scotland started a Norwegian-style oil fund in 2021-22 Scotlandrsquos oil fund after 20 years of contributions would reach less than a tenth of the current size of the Norwegian fund (after 17 years of contributions)18 As part of the UK Scotland achieves many of the benefits of an oil fund the UKrsquos integrated fiscal model provides a very stable flow of Scottish expenditure without the need for Scotland to run the onshore fiscal position required for an oil fund
Conclusion Integration is at the heart of the UKrsquos current economic and fiscal union playing a central role in supporting economic performance and fiscal sustainability Crucially it allows the free flow of goods services labour and capital The performance of the Scottish economy has been strong as part of the UK and in comparison to a set of small independent countries The fiscal model has allowed Scotland to maintain stable public spending per capita while contributing a fair share to revenues through onshore taxes and the substantial but volatile revenues from North Sea oil and gas
Independence would fundamentally transform and fragment this relationship The pooling of fiscal resources and risk-sharing between Scotland and the rest of the UK would end immediately And over the longer term as the institutions and structures of the two economies diverged the mutually beneficial flows of trade labour and capital would be lower than if Scotland were to remain a part of the UK
16 Centre for Public Policy for Regions Analysis of Scotlandrsquos Past and Future Fiscal Position (March 2013) 17 Scottish Government GERS 18 HM Treasury calculation based on data from the Office for Budget Responsibility Economic and fiscal outlook
(March 2013) Office for Budget Responsibility Fiscal sustainability report (July 2013) Norwegian Ministry of Finance website
Introduction
The objective of the UK Governmentrsquos Scotland analysis programme is to provide comprehensive and detailed analysis of Scotlandrsquos place in the UK and how that would be affected by independence The outputs of the analysis will provide sources of information and aim to enhance understanding on the key issues relating to the referendum As such the programme should be a major contribution to the independence debate
The 300 year union between Scotland and the rest of the UK has resulted in deep economic integration Bringing this union to an end would have considerable implications for the economic relationship between an independent Scottish state and the continuing UK The UK Government believes that Scotland is better off as part of the UK and that the UK is stronger with Scotland as part of it
This is the fifth paper in the Scotland analysis series It sets out the role of economic and fiscal integration in shaping Scotlandrsquos economic performance as part of the UK and describes the potential macroeconomic impact of independence It follows the fourth paper in the Scotland analysis series Scotland analysis Business and microeconomic framework which sets out how the UKrsquos domestic market is a key part of Scotlandrsquos successful business environment
The first paper in the series Scotland analysis Devolution and the implications of Scottish Independence examines the UKrsquos constitutional setup and the legal implications of independence Scotland would become an entirely new state The remainder of the UK would continue as before retaining the rights and obligations of the UK as it currently stands As a new state an independent Scotland would be required to apply to andor negotiate to become a member of whichever international organisations it wished to join and would need to seek new institutional arrangements
The second paper Scotland analysis Currency and monetary policy shows how the current currency and monetary policy arrangements within the UK serve Scotland well A move away from the current arrangements would require a set of decisions that would affect the wider management of the economy not only the currency but also the setting of monetary and fiscal policy The status quo would not be one of the options The analysis in this paper concludes that all of the alternative currency arrangements would be likely to be less economically suitable for both Scotland and the rest of the UK
The third paper Scotland analysis Financial services and banking shows that Scotland has a strong and vibrant financial services industry As part of the UK firms and individuals benefit from a world-leading financial services sector and a large integrated domestic market for financial services with clear and effective arrangements for protecting consumers This position would be put at risk if Scotland were to become independent fragmenting the market and the
12 Scotland analysis Macroeconomic and fiscal performance
bodies that have been put in place to protect customers
The fourth paper Scotland analysis Business and microeconomic framework shows that effective common regulations and institutions a unified labour market a shared knowledge base and integrated infrastructures are central to the success of the unified domestic market However much an independent Scottish state sought to stay aligned with regulations and institutions in the continuing UK a single market between two separate states is not the same as a fully integrated domestic market Divergence and fragmentation would be likely to lead to short-term and long-term costs and prolonged uncertainties for businesses and consumers
Structure of the paper Chapter 1 outlines the performance of the Scottish economy as part of the UK and investigates the role of economic integration in shaping Scotlandrsquos economic performance
Chapter 2 describes the UKrsquos single fiscal model and the role this plays in stabilising Scotlandrsquos public finances maintaining public spending in Scotland and providing automatic transfers across the UK especially in welfare and pensions spending
Chapter 3 discusses the effects of creating an international border between an independent Scotland and the continuing UK on movements of trade labour and capital between Scotland and the continuing UK
Chapter 4 discusses the case for an independent Scotland establishing an oil fund and the fiscal implications of setting up such a fund
Annex A describes Scotlandrsquos economic performance as part of the UK over the past four decades and assesses it against performance for the UK as a whole and for a set of independent comparable countries
Annex B describes Scotlandrsquos public finances as part of the UK
Annex C explains the approach that has been taken to modelling the potential impact of independence on trade labour and capital flows and summarises the literature on the ldquoborder effectrdquo
Chapter 1 An integrated economic union
Over the past 300 years the UK economy has become increasingly integrated and interconnected Scottish growth has contributed to and benefited from access to the large and diverse UK economy The UK provides a large stable and diverse economic environment in which Scottish businesses have thrived and which is very attractive to foreign investors A large domestic market is a crucial aspect of this environment and businesses and consumers benefit from the free flow of goods services labour and capital The domestic market is supported by a UK-wide system of tax and regulation as well as a single labour market a common knowledge base and integrated infrastructure This produces tangible benefits for Scotlandrsquos macroeconomic performance
Economic integration has brought benefits to all parts of the UK including Scotland The performance of the Scottish economy is similar to that of the UK as a whole Despite weaker performance in the 1970s and 1980s output per person in the Scottish economy has grown faster than the median for comparable independent countries since 1990
Integration with the UK economy also helps protect the Scottish economy from the damaging effects of economic volatility and the extremes of global financial crisis A much more severe impact from the recent global recession has been observed in smaller open economies that are more exposed to economic volatility During the financial crisis Iceland Ireland and Cyprus were exposed to large banking sectors which dwarfed their national wealth And in the recession that followed the financial crisis Spain and Italy were subject to volatile international financial markets compounding a weakening of their public finances
16 Scotland analysis Macroeconomic and fiscal performance
Economic alignment between Scotland and the rest of the UK Scotlandrsquos economic performance
11 Across a range of measures the performance of the Scottish economy is similar to the economy of the whole UK1 Economic output per head and output per worker are almost exactly equal to the UK average and both the industrial structure and income distribution of output are very similar to those for the UK as a whole Conditions in the Scottish labour market are also very well aligned with UK average conditions Poorer economic growth in the 1970s and into the 1980s was reversed in the 1990s and 2000s growth in output per head is above the median for a set of independent comparable countries over the 1990s and 2000s
12 Scotland is one of the strongest performing parts of the UK As shown in Chart 1A in 2011 output2 per person was pound20511 for Scotland compared with an average of pound20873 across the UK3 and behind only London and the South East
Chart 1A Onshore economic output per head of nations and regions (2011)
London
South East
UK excluding extra regio
Scotland
East
South West
UK ex London extra regio
East Midlands
North West
West Midlands
Yorkshire amp the Humber
Northern Ireland
Wales
North East
0 10000 20000 30000 40000
GVA per capita (pound) excluding extra regio 2011
Source ONS Regional Gross Value Added (December 2012) HMT calculation for UK excluding London
13 The outlying performance of London reflects its status as an international city and global financial centre But as the Scotland analysis Financial services and banking paper explained Scotlandrsquos successful financial centre has also benefited from the lsquocluster effectrsquo of its location in the UK economy Scotlandrsquos economic performance is superior to the rest of the UK when London is excluded Further while Londonrsquos performance is very strong Chart 1B shows that it is not out of line with the higher performing Scottish cities4
The annual growth in the cash value of economic output per person (known as nominal Gross Value Added (GVA))5 between 1995 and 2011 was also similar between London and
1 The analysis in this document is based upon data available up until 10 August 2013 2 Excluding North Sea oil and gas 3 ONS Regional Gross Value Added (December 2012) Extra-regio is the ONS category for output that cannot
be assigned to a specific region It includes offshore oil and gas activities 4 The Nomenclature of Units for Territorial Statistics (NUTS) is a hierarchical classification of geographical areas
London (NUTS 1) is a larger area than the Scottish cities (NUTS 3) 5 GVA is a measure of economic output Nominal means that it is not adjusted for inflation
Chapter 1 An integrated economic union 17
Scottish cities 49 per cent in London 50 per cent in Glasgow City and 44 per cent in the City of Edinburgh and Aberdeen and Aberdeenshire6
Chart 1B Economic output per head of London and Scottish cities (2011)
Glasgow City
Aberdeen City and Aberdeenshire
Edinburgh City of
London
0 10000 20000 30000 40000
GVA per capita (pound) excluding extra region 2011
Source ONS Regional Gross Value Added (December 2012)
14 The strength of the Scotlandrsquos economic performance is underpinned by the productivity of its workforce As Chart 1C shows Scottish productivity levels are also extremely close to the UK average whether measuring each person employed or by the hour worked7
On average a worker in Scotland produces almost exactly the same as a worker in the rest of the UK
Chart 1C Labour productivity (2011) Output per job
Lon
SE
UK
Scot
East
SW
EM
WM
NW
YH
NE
NI Wal
989
0 50 100 150 Indexed UK=100
Output per hour worked
Lon
SE
UK
Scot 1000
East
SW
NW
NE
EM
WM
YH
Wal
NI
0 50 100 150 Indexed UK=100
Source ONS Regional Labour Productivity (June 2013)
6 ONS Regional Gross Value Added (December 2012) 7 ONS Regional Labour Productivity (June 2013)
18 Scotland analysis Macroeconomic and fiscal performance
15 Conditions in the Scottish labour market are well aligned with the UK In the three months to May 2013 Scotland had a higher employment rate and a lower unemployment rate than the UK
Chart 1D Labour market in the three months to May 2013 80
719 714 70 Wales
60 Scotland
Northern Ireland 50
UK
40
30
Employment rate Unemployment rate Inactivity rate
Per
cen
t
75 78
221 225
Source ONS Labour Market Statistics (July 2013) Labour Force Survey
Scottish economic performance over time 16 Long-term trends in the Scottish economy have been very similar to UK trends and the
impact of the global financial crisis is comparable Chart 1E below compares annual growth in the volume of economic output per head for Scotland and the UK as a whole (excluding North Sea oil and gas) between 1963 and 2012 Scottish data are published by the Scottish Government as a National Statistic which means they meet the UK Statistics Authorityrsquos quality standards The current publication goes back to 1998 The longer series back to 1963 has not been updated since 2010
17 Cycles in Scotlandrsquos onshore economy have been broadly in line with the rest of the UK contracting in similar periods most notably in the mid 1970s in the early 1980s and in 2008-09 As was set out in Scotland analysis Currency and monetary policy the Scottish economy is well synchronised with the UK average The correlation in output growth rates is over 80 per cent from 1963 to 2012 The correlation in the claimant count rate between Scotland and the UK average is over 95 per cent between 1984 when data starts and 2012 Both these factors demonstrate that Scotlandrsquos growth and employment record is strongly aligned with the rest of the UK
18 Growth in Scotlandrsquos onshore economy has been similar to the UK average over this period after adjusting for the differential in population growth Average annual growth in onshore GVA per head from 1963 to 2012 was 20 per cent in Scotland compared with 19 per cent in the UK This is the main difference between the figures presented here and those presented by the Fiscal Commission Working Group who do not adjust growth rates for changes in population8 Dividing economic output by population gives a basic measure of standards of living Similarly it is important to adjust the growth in economic output for changes in population If economic growth is in line with population growth standards of living have not improved on this measure Table 1A shows onshore growth rates per head for Scotland and the UK for 1963 to 2012 and broken down by decade
0
10
20
8 Fiscal Commission Working Group First Report Macroeconomic Framework The Scottish Government 2013
Chapter 1 An integrated economic union 19
Table 1A Onshore economic growth in Scotland and the UK
Growth in GVA per head
1963-2012 1963-1970 1970-1980 1980-1990 1990-2000 2000-2012
Scotland 2 34 16 21 23 11
UK 19 24 15 25 22 11
Source Scottish Government GDP statistical bulletin (2010Q1 and 2013Q1) ONS UK real GVA excluding North Sea oil and gas (KLH7 and UIZY) ONS mid-year population estimates General Register Office for Scotland
Chart 1E Growth in onshore activity per head Scotland and the UK 10
8
ndash6
ndash4
ndash2
0
2
4
6
ndash8 1964 1974 1984 1994 2004
Scotland UK
Source Scottish Government GDP statistical bulletin (2010Q1 and 2013Q1) ONS UK real GVA excluding North Sea oil and gas (KLH7 and UIZY) ONS mid-year population estimates General Register Office for Scotland
Performance during the financial crisis 19 The recent financial crisis has highlighted serious issues in the UK economy a highly
indebted economy a poorly regulated financial system unbalanced growth across regions and an export base that is too reliant on Europe and the US UK and Scottish onshore GVA fell by -74 per cent and -56 per cent respectively (peak to trough) UK economic institutions continue to evolve in response to the financial crisis the UKrsquos macroeconomic framework provides clear governance and accountability that facilitates rapid crisis resolution This macroeconomic framework provides the underpinnings for future sustainable economic growth for both the UK and Scotland The OECD commented in its 2013 Economic Survey of the United Kingdom that the UK benefitted from a ldquostrong institutional frameworkrdquo9 Scotland has also outperformed the majority of comparitor countries The recession was larger in Ireland Denmark Finland Luxembourg Portugal and Sweden
Economic Survey of the United Kingdom 2013 OECD 9
20 Scotland analysis Macroeconomic and fiscal performance
Chart 1F Impact of the recession
92
94
96
98
100
Comparable country median
UK excl oil and gas
Quarters after peak in output
UK
Scotland
20151050
Rea
l GVA
ind
ex (P
eak=
100)
Source Scottish Government GDP statistical bulletin (2013Q1) ONS Gross Domestic Product Preliminary Estimate (2013Q2) Eurostat
110 Given the similarities in economic structures and cyclical position it is likely that the Scottish economy will recover from the recession on a similar trajectory to that forecast for the UK Recent economic data show that the UK recovery is strengthening with broad based growth across all sectors of the economy Long-term economic trends are also expected to be comparable although faster population ageing in Scotland is likely to weigh on long-term growth by restricting the growth in labour supply
Including North Sea oil and gas111 Including offshore production there is a clear structural difference between the Scottish
economy and the economy of the rest of the UK
Chart 1G Size and composition of the Scottish and UK economies
Scotland Rest of the UK UK
Other industries
Finance and insurance activities
Mining and quarrying
Source ONS Regional Gross Value Added (December 2012) Workplace based GVA by industry groups at current basic prices Scottish shares of extra regio GVA used for these calculations 90 of mining and quarrying GVA and 8 of public administation and defence GVA
112 In the event of independence the allocation of the UKrsquos oil and gas reserves would have to be negotiated between a separate Scottish state and the continuing UK The Scottish Government produces estimates of the contribution of a geographical share of North Sea oil and gas to the value of Scottish output According to these estimates North Sea oil and gas has contributed between 9 per cent and 18 per cent of total Scottish output between 1998 and 2012 Under this assumption Scottish output per capita would be above the UK average However as discussed in Box 1A as much of North Sea oil and gas profits are remitted abroad Scottish residents do not benefit from the total output of North Sea oil and gas
Chapter 1 An integrated economic union 21
Box 1A The impact of North Sea oil on economic performance GDP versus GNI Allocating to Scotland a geographic share of North Sea oil and gas output increases measures of economic output However it is not clear how much of the extra income from North Sea oil and gas actually contributes to the wealth of Scottish households and businesses as opposed to foreign investors
This distinction is captured in the difference between Gross Domestic Product (the total income generated in Scotland regardless of where or to whom this income flows) and Gross National Income (the total income generated by residents of Scotland) GNI is therefore a better measure of living standards for Scottish residents The inclusion of North Sea oil and gas in output figures will not increase GNI by as much as GDP Scotland is likely to be further down international rankings of economic performance when assessed on GNI
For countries with significant amounts of foreign ownership there can be a large difference between these measures of output For example Irish GDP is 20 per cent higher than Irish GNI because of the degree of foreign ownership in Ireland In 2011 Ireland ranked 8th in the OECD on the basis of GDP per capita but to 16th on the basis of GNI per capita1
No GNI estimate is currently produced for Scotland However there are reasons why GNI could well be lower than GDP in Scotland as identified by the Centre for Public Policy for Regions (CPPR)2 Large parts of the whisky and financial services sectors are internationally owned There would also be a large difference between GNI and GDP when considering North Sea oil and gas production HM Treasury analysis shows that over two thirds of North Sea oil and gas is produced by international companies (or subsidiaries of such companies)3
As North Sea activity is mostly internationally owned and the vast majority of output is received as capital rather than labour income a large majority of total North Sea post-tax income that is not reinvested in North Sea oil and gas production is sent abroad in the form of profits on foreign investment Where this is the case it will benefit GDP but not GNI4
1 OECD statistics 2011 data has been used as GNI data for some countries is not available for 2012 New Zealand Turkey and Canada excluded from the calculation due to missing data
2 CPPR httpwwwglaacukmediamedia_275906_enpdf ldquoMeasuring a independent Scotlandrsquos economic performancerdquo Reform Scotland ldquoScotlandrsquos economic futurerdquo
3 HM Treasury analysis of Wood Mackenzie data on UK oil and gas production in 2012 4 It should be noted that where internationally owned companies have Scottish shareholders some of the
profits sent abroad would flow back into Scotland via these shareholders However in a similar way where UK owned companies have international shareholders some of the profits will flow abroad
113 As a result of a higher dependence on the North Sea Scottish output would be much more volatile as oil and gas volumes of production and prices fluctuate substantially and the depletion of North Sea reserves and progressive decline in production would be a drag on growth and put pressure on Scotlandrsquos fiscal position Both oil and gas prices and production can add significant volatility to Scottish output the impact of price fluctuations is exemplified by price changes during 2008 when the oil price fell from a high of pound67 per barrel to a low of pound27 per barrel in just six months DECC forecast that oil production (MTOE) will halve between 2013 and 2030 Valuing the remaining North Sea oil and gas reserves is discussed in Box 1B
22 Scotland analysis Macroeconomic and fiscal performance
Chart 1H Quarterly Scottish nominal GDP growth 10
-6
-4
-2
0
2
4
6
8 Scotland GDP (onshore)
Scotland GDP (including a geographical share of extra-region)
UK GDP (including extra-region)
-8 1998 2001 2004 2007 2010
Source ONS Scottish Government Scottish National Accounts Project (2012Q4)
Box 1B Valuing remaining North Sea reserves The North Sea remains a hugely valuable resource to Scotland and the whole of the UK providing employment and revenues There are a variety of approaches to quantifying the value of remaining reserves The Scottish Government has suggested that ldquoeconomic benefits [of remaining oil and gas reserves] total around pound15 trillionrdquo1 This box explores the assumptions underpinning that calculation2 The pound15 trillion figure is based on
bull An assumption that remaining reserves are in line with the most optimistic scenario estimated by Oil and Gas UK
bull An assumption that oil and gas can be extracted from the seabed costlessly Capital and operating costs are large and reflecting that fact in the valuation of remaining reserves would reduce the figure significantly More than pound1 trillion (in todayrsquos prices) is likely to be needed to extract the remaining oil and gas resources assumed by the Scottish Government
bull The oil price is assumed to apply to both oil and gas However in recent years gas which accounts for roughly 40 per cent of forecast UK oil and gas production has sold for little more than half as much as the equivalent volume of oil and
bull The figure is not calculated in ldquonet present valuerdquo terms the standard approach recommended by international statistical frameworks for the quantification of environmental assets
A recent Office for National Statistics (ONS) publication offers an independent alternative approach to valuing remaining UK Continental Shelf oil and gas reserves3 According to the ONS paper the monetary value of UK oil and gas reserves is pound120 billion as of 31 December 2011 12 times lower than the Scottish Government estimate The ONS methodology is based on the United Nationsrsquo System of Economic and Environmental Accounts consistent with the System of National Accounts It is therefore in line with statistical best practice The estimate reflects the independent Office for Budget Responsibilityrsquos central projection of oil and gas production and prices operating and capital expenditure and decommissioning costs The figure is discounted at the social discount rate to reflect the true long-term value of reserves across current and future generations
Chapter 1 An integrated economic union 23
Since UK oil and gas production peaked at the turn of the century official forecasts have consistently overestimated production demonstrating the importance of applying realism in forecasts As the CPPR comment Scottish Government claims that UK Government forecasts are too pessimistic ldquoseem odd when juxtaposed with this evidence of repeated over-prediction of production by DECC and OBR in recent yearsrdquo4
Only the tax of the profits made from North Sea oil and gas production would flow into the UK Exchequer And as explained in Box 1A a large majority of total North Sea post-tax income that is not reinvested in North Sea oil and gas production is sent abroad in the form of profits on foreign investment
1 Scottish Government evidence to House of Commons Energy and Climate Change Committee 17 April 2012
2 As set out in an answer to a Parliamentary Question (S4W-06988 answered by Fergus Ewing on 16 May 2012)
3 Office for National Statistics (2013) Monetary valuation of UK continental shelf oil amp gas reserves Available at httpwwwonsgovukonsrelenvironmentaluk-environmental-accounts2013stb-ukea-2013 htmltab-background-notes
4 CPPR (2013) ldquoReflections on the latest Oil and Gas related analysis by the Scottish Government and the Office for Budget Responsibilityrdquo
Scottish economic performance compared to similar small advanced economies 114 Scotland as part of the UK has performed as well as a comparable group of independent
countries10 Scotland has a slightly higher economic output per head than Denmark and Finland significantly higher than Portugal and not far behind Austria Ireland and Sweden While Scotlandrsquos performance had been weaker in the 1970s and 1980s growth in onshore output per head of population is close to or above the median for independent comparable countries in the 1990s and 2000s Volatility of annual growth in Scotland is below that of most other comparable countries over the same period Over the last 20 years the time period for which data is available Scotland has maintained a significantly higher employment rate than the median across comparable independent countries
115 The overall output impact of the global financial crisis (from peak in output to the latest data in 2013Q1) remained more moderate in Scotland than in a majority of independent comparable countries While the financial crisis has badly affected the Scottish economy with output falling by 56 per cent from peak to trough the depth of the recession was shallower than all but one of the independent comparable countries The recession was twice as large in Ireland which required an IMFEU assistance programme The recession was also larger in Denmark Finland Luxembourg Portugal and Sweden
116 Many small countries are successful but they experience a different set of challenges to larger countries they need to overcome barriers to trade and face reduced flexibility in their set of fiscal and monetary policy choices Alesina (2003) argues that country size is a trade-off between the benefits of size and the costs arising from reduced ability to tailor policies to the preferences of the population A number of factors make larger countries more efficient economies of scale for the provision of government services such as infrastructure economies of scale for private companies if international borders inhibit market size (Chapter 4 argues that they will over time in the event of Scottish independence) and the provision of insurance in the form of fiscal transfers should
10 Independent comparable countries are Austria Denmark Finland Ireland Luxembourg Portugal and Sweden For its economic growth target the Scottish Government compares Scotland with these 7 EU Member States
24 Scotland analysis Macroeconomic and fiscal performance
economic shocks be uneven across regions Further smaller countries tend to be more volatile possibly as a result of greater exposure to international markets11 Independence could therefore create greater swings in GDP and employment
117 Country size is not the only determinant of economic performance the richest and fastest growing countries in the world include a number of small countries such as Norway Switzerland and Singapore However small countries are generally constrained in their choices of fiscal and monetary policy One way in which countries can overcome these challenges is to trade more extensively with other countries Success in this area will be important in mitigating the substantial effects the creation of an international border is likely to have It is unclear whether the border effect can be fully offset by reorientation to other markets Small countries can also maintain tax and regulatory alignment with other trading partners small countries need to balance flexibility in adjusting policy settings and the risk of undermining economic integration Managing that risk implies that their ability to adopt markedly different policy settings is constrained
118 Small countries tend to run relatively prudent fiscal policy In many cases running fiscal surpluses to build up reserves to ensure they are resilient to external shocks and to maintain access to international capital markets when needed Even then prudent fiscal policy has proved insufficient in some smaller euro area Member States to prevent funding problems in the recent financial crisis It would take time for Scotland to adjust its policy settings there would likely be significant costs for Scotland in both shifting to a position of fiscal surplus and in managing economic volatility in particular in the years following independence Smaller countries also generally have to place a much higher consideration on managing volatility when considering currency regime fixed or pegged exchange rates would provide low transactions costs which could help Scotland to overcome a border effect but this could be at the cost of flexibility needed to manage economic volatility An independent Scotlandrsquos currency choices are discussed more fully in Scotland analysis Currency and monetary policy
119 Annex A provides further detail on how economic outcomes in Scotland compare with those in the rest of the United Kingdom
Benefits of economic integration for economic performance 120 Over the past 50 years groups of countries have gone to great lengths to reinforce
their economic integration with one another in order to support economic growth and stability This can be seen in Europe starting with the creation of the European Economic Community in 1957 and continuing in the expansion of the European Union today in South America with the creation of the Mercosur in 1991 in South East Asia with the creation of the ASEAN in 1967 and in North America with the signature of NAFTA in 1994 The euro area countries continue to integrate further with a fiscal compact and a banking union
121 In June 2013 the European Commission and the United States announced that they would start negotiating a trade agreement to facilitate further the ease with which their respective producers can trade with each other Given the low average tariffs (under 3 per cent) these negotiations will focus on tackling non-tariff barriers These consist mainly of customs procedures and behind the border regulatory restrictions Such non-tariff barriers come from divergent regulatory systems (notably standards definitions) but also other non-tariff measures such as those related to certain aspects of security or consumer protection
11 Business cycle volatility and country size evidence for a sample of OECD countries Fuceri D and Karras G 2008
Chapter 1 An integrated economic union 25
122 While these are associations of states the direction of travel is clear to reduce barriers to economic integration rather than create them These agreements all involve pooling aspects of sovereignty in order to generate greater economic integration The global trend is to find ways to support greater economic integration rather than less
Scotlandrsquos integration with the rest of the UK 123 The level of economic integration is one of a number of factors that contributes to the
achievement of high levels of productivity and hence of living standards Differences in income levels across countries depend primarily on the strength of the business environment which in turn depends on a wide variety of factors including the institutional and legal infrastructure transport infrastructure and the skills of the workforce Differences in these factors affect firmsrsquo willingness and ability to build complex supply chains that enable them to reap the full benefits of specialisation They help to explain why some large countries remain poor and why a number of small mainly European countries number among the richest countries in the world12
124 As part of the UK Scotland benefits from common regulations a unified labour market and integrated infrastructure and the absence of border controls These are described in detail in Scotland analysis Business and microeconomic framework In addition the 300 year history of the United Kingdom has enabled the effects of shared institutions and policies to accumulate over time Businesses have been able to plan their investment and build their supply chains with a high level of confidence in the integrity of the political union between Scotland and the rest of the United Kingdom In the event of independence the level of integration between a separate Scottish state and the continuing UK would by definition diminish
125 There are many aspects to economic integration this paper assesses economic integration as being measured by the degree of trade labour and capital flows between the UK and Scotland
bull Trade integration is a measure of the degree to which different countries or regions trade goods and services
bull Labour market integration is a measure of the degree to which workers move between different regions or countries and
bull Capital flows are the cross border movements of money or assets
126 These and other measures of economic integration are discussed in Scotland analysis Business and microeconomic framework and Scotland analysis Financial services and banking
12 Henrekson et al (1997) find evidence for permanent growth effects of European integration (increasing growth by 06 to 13 percentage points per annum) Badinger (2000) finds evidence of a lsquoconsiderablersquo levels effect if no integration had taken place since 1950 GDP per capita would be a fifth smaller today Conversely Landau (1995) obtains no effect of EC-membership
26 Scotland analysis Macroeconomic and fiscal performance
Trade 127 Economic integration implies that producers are willing and able to engage with a wide
range of suppliers This allows individual producers to specialise in those activities where they are most efficient and to do so through buying in the goods and services that other suppliers can produce more efficiently than they can Scotlandrsquos most famous economist Adam Smith identified these mechanisms which he termed the division of labour as an important determinant of the Wealth of Nations13
128 Productivity levels will tend to be higher among countries that specialise in the production of the goods and services that they can produce most efficiently and who trade their surplus production for goods and services that can be produced more efficiently in the rest of the world Empirical evidence confirms that those countries that trade freely with the rest of the world have higher productivity levels and living standards than those where the barriers to trade are high
129 Frankel and Romer (1999) conclude that a one percentage point increase in the trade to GDP ratio raises real income per capita by around one per cent A later study by Frankel and Rose (2002) suggests that the impact may be smaller but still positive at around 13 of a per cent HM Treasuryrsquos EMU and trade14 publication in 2003 concluded that a one percentage point increase in the trade to GDP ratio would increase real income per capita by one third of a per cent These estimates should be interpreted as indicative rather than definitive given the broad range of factors that affect the rate of economic growth and as the authors acknowledge the sensitivity of these results to the measure of openness Nonetheless they suggest that lower barriers to cross border trade support higher rates of economic growth
130 There is close trade integration between Scotland and the rest of the UK Experimental data from the Scottish Government15 show that in 2011 Scotland ldquoexportedrdquo pound36 billion worth of goods and services to the rest of the UK and ldquoimportedrdquo pound49 billion from the rest of the UK or nearly 30 per cent and 40 per cent of Scottish GDP respectively This is a growing proportion of Scottish trade from 1998 to 2011 annual trade growth between Scotland and the rest of the UK has averaged 27 per cent per year compared to 22 per cent annual growth in trade with the entire rest of the world In 2009 across all industries exports to the rest of the UK account for approximately 24 per cent of total final demand The sectors with the highest exports to the rest of the UK as a percentage of Total Final Demand are Mining and Quarrying (86 per cent) Professional and Support Activities (61 per cent) and Energy and Supply (42 per cent) 16
131 Across all industries approximately 60 per cent of inputs are sourced from within Scotland 30 per cent from the rest of the UK and 10 per cent from the rest of the World Thus in terms of inputs into the supply chain Scotland is much more integrated with the rest of the UK than with the rest of the World The source of inputs varies dependent upon the industrial sector For example the agriculture sector is the most integrated with the rest of the UK 37 per cent of inputs come from the rest of the UK Manufacturing (34 per cent) financial insurance and real estate (33 percent) and professional and support activities
13 An inquiry into the Nature and Causes of the Wealth of Nations Smith Adam 14 EMU and Trade HM Treasury 2003 15 Scottish Government Scottish National Accounts Project (SNAP) Quarterly National Accounts 2012Q3 Other
export data is available from the Global Connections Survey but SNAP data is used for both imports and exports for consistency
16 Scottish Government Input-Output Tables 2009
Chapter 1 An integrated economic union 27
(33 per cent) are the other sectors with the highest source of inputs from the rest of the UK17 These sectors are currently benefiting from the best of both worlds targeted help from the Scottish Government but access to the UK domestic market
Chart 1I Scottish exports to the rest of the UK and Rest of World as a share of demand
Agriculture Scottish domestic
Mining amp utilities demand as of demand
Manufacturing Exports to UK as
Construction of demand
Distribution Hotels amp restaurants Exports to RoW as of demandTransport amp communication
Finance amp real estate
Business services
Public admin education amp health
Other
All industries
0 25 50 75 100
Source Scottish Goverment Input-Output Tables 2009
Labour 132 There can be both static and dynamic gains from migration Static gains arise if migrants
have a higher propensity to be employed than native workers or earn higher wages Some of these benefits will spill over to the wider economy in the form of taxes and returns to other factors of production such as capital especially if migrants fill shortage occupations Dynamic benefits of migration could increase the trend rate of growth for example by increasing innovation by bringing new skills or aptitudes that could spillover to non-immigrants increasing competition in labour or product markets or by improving trade links back to their origin countries There can also be costs in the form of higher public spending pressure on limited resources such as housing and social cohesion Borjas suggests that there is evidence that immigration can have negative economic impacts on groups such as low-skilled workers18 Not all migrants are as economically beneficial high skilled migrants and those who fill shortage occupations for example are likely to generate greater benefits and possibly lower costs The predictions from economic models are mixed (Drinkwater Levine Lotti and Pearlman (2003)) and depend on a variety of assumptions about for example the skill composition of migrants capital mobility and the existence of economies of scale in the host economy19
17 Scottish Government Input-Output Tables 2009 18 Increasing the Supply of Labour through Immigration measuring the Impact on Native-born Workers G Borjas
Centre for Immigration Studies May 2004 19 Fic et al (2011) estimate a small positive impact from migration on the UK economy A study by Poot Nana
and Philpott (1988) for New Zealand found that a net inflow of 15000 people increases GDP per capita by 02 percent per year and GDP per worker by 015 per cent per year For the US Borjas (1995) estimates the economic gains of immigration accruing to natives to be relatively small of the order of 01 percent of GDP while Barro and Sala-i-Martinrsquos (1992) results suggest that a 1 percentage point higher net migration rate in the US is associated with a 01 higher growth rate
28 Scotland analysis Macroeconomic and fiscal performance
133 Labour integration between Scotland and the rest of the UK is high This is shown through high migration flows In total it is estimated over half a million people born in England Northern Ireland and Wales now live in Scotland and over 700000 people born in Scotland have moved to other parts of the UK20 In 2010-11 nearly 44000 people moved from Scotland to the rest of the UK of which more than 35000 were of working-age and nearly 41000 moved from the rest of the UK to Scotland of which about 33000 were of working age (or about one per cent of the Scottish population of working age)21 There is also a high degree of commuting across the border In 2011 there were 30000 individuals who lived and worked on different sides of the border22 13000 of whom lived in Scotland and worked in the North of England23 This is higher than movements within other closely integrated European economies For example in 2008 17000 people moved from Austria to Germany and 22000 from Germany to Austria24
Capital 134 Flows of capital across regions and states have a positive effect on the level of economic
growth in an economy As a single domestic market the financial system operates to provide capital to businesses and households at low prices Scotland may also be more attractive as part of the union for other flows of capital such as Foreign Direct Investment (FDI) As set out in Scotland analysis Financial services and banking a more localised Scottish financial industry following independence may face more challenges in providing capital at least the same range of products at the same cost to households and businesses Costs could increase due to higher funding costs and the costs of operating in a smaller market The fragmentation of the domestic industry would make it harder to promote competition and address barriers to competition as they arise It is possible that as the Scottish and continuing UK markets diverge Scotland could become a less attractive location for FDI There is evidence that FDI brings benefits to the domestic economy Foreign owned firms tend to have higher productivity and higher levels of investment than domestic firms particularly compared with domestic non-multinationals Whilst evidence is more limited higher productivity may also spillover into the domestic economy eg through technology transfer25
135 If independence reduces capital flows it would be expected to impact on economic performance At a microeconomic level capital flows can enhance the efficiency of resource allocation the competitiveness of the domestic financial sector and support technology transfer The evidence on the effect of capital flows on economic growth is mixed Earlier studies such as Rodrick (1998) find no effect of capital flows on economic growth However more recent studies such as that by Kose Prasad and Terrones (2008) find that financial flows increase the growth of productivity in an economy Two possible reasons why the evidence is not conclusive is the volatility of capital flows which may have the effect of negating any potential benefits and that the flows have gone to countries which do not have the capacity to absorb the flows they are receiving This could be because they may not have a highly skilled workforce lack infrastructure or do not have
20 2001 Census 21 General Register Office for Scotland Migration between Scotland and the Rest of the UK (retrieved May 2013)
httpwwwgro-scotlandgovukstatisticsthememigrationmig-statsscotland-rest-of-ukhtml 22 Annual Population Survey January to December 2011 23 The North of England is defined as the following English regions North East North West Yorkshire and
the Humber 24 Eurostat Immigration by sex age group and country of previous residence July 2013 25 See for example Foreign ownership and Productivity New Evidence from the Service Sector and the RampD Lab
Griffith Redding and Simpson (2004)
Chapter 1 An integrated economic union 29
developed financial markets Despite this according to the IMF (2006) ldquothe weight of the evidence seems to be gradually shifting towards finding positive marginal effects on growthrdquo
136 These flows allow for capital to move to its most profitable use ensuring the best investments gain access to finance There are more limited data on flows of capital between Scotland and the rest of the UK However Scotland analysis Financial services and banking showed the extent that financial services are provided across the whole of the UK For example 51 per cent of Scottish mortgage and 70 per cent of Scottish pension products are supplied by non-Scottish firms Scottish Financial Enterprise (SFE) report that 90 per cent of its membersrsquo customers are based in the rest of the UK26
Integration and economic stability 137 A further benefit of integration is that it helps to create larger and more diverse markets
Economies that are part of a larger market are less susceptible to economic shocks and hence have less volatile economic growth Furceri and Karras (2008) and Down (2007) both find evidence to suggest that the larger economies are less volatile For example Scotland has avoided the very large negative impacts of the financial crisis that some other small economies have experienced The recession was twice as large in Ireland which required an IMFEU assistance programme The recession was also significantly larger in Denmark Finland and Sweden
138 Smaller economies which are more specialised and as a result more volatile can compensate for smaller domestic markets by being more open to international trade and orientating domestic production and consumption towards larger more stable international markets in order to mitigate some of the volatility However Down (2007) concluded that the benefits of diversification through international trade openness cannot fully compensate for the smaller size of the domestic market
139 Economic stability is an important aspect of economic performance Many studies have argued that higher levels of volatility have negative effects on average growth in output for example In one of the first studies Ramey and Ramey (1995) found a negative relationship between volatility and growth for a sample of 92 countries as well as in a sample of OECD countries This could be because for example entrepreneurs are discouraged from investing when the path of economic growth is more uncertain
140 Scottish integration with the rest of the UK as part of the large UK domestic market has played an important role in explaining the performance of the Scottish economy Scottish independence would have important implications for economic integration between Scotland and the rest of the UK which are discussed in the following chapter
26 Speech by Owen Kelly Chief Executive of Scottish Financial Enterprise at the Scotsman Conference A Question of Independence The Economics of Independence June 2012
30 Scotland analysis Macroeconomic and fiscal performance
Chapter 1 Conclusion 141 Across a range of measures the performance of the Scottish economy is similar to the
economy of the whole UK
bull Output per head and output per worker in Scotland are almost exactly equal to the UK average
bull Output growth over the last 40 years has grown at almost exactly the same rate as it has in the UK
bull The employment and unemployment rates in the UK and Scotland are very similar
142 Scotlandrsquos economic performance is comparable to a range of small independent countries
bull Scotlandrsquos economic output is within the range of comparable countries higher than Portugal Denmark and Finland
bull While Scotlandrsquos performance has been weaker in the 1970s and 1980s growth in output per head of population is above the median for independent comparable countries over the 1990s and 2000s
bull Scotland has maintained a consistently higher employment rate than most of the comparable countries
bull Scotland suffered a considerably less severe recession than most comparator countries
143 High levels of economic integration between Scotland and the UK in particular flows of goods and services labour and capital have underpinned Scotlandrsquos economic performance and helped to reduce economic volatility
Chapter 2 The UKrsquos integrated fiscal model
The UKrsquos integrated fiscal model supports Scotlandrsquos economic performance and delivers funding for public services The UKrsquos broader tax base helps maintain the stability of public spending in Scotland and smooth the impact of volatile and declining sources of revenue such as North Sea oil and gas Fiscal transfers are automatic across the UK which supports higher welfare and pensions spending in Scotland
Scotlandrsquos notional onshore fiscal balance is considerably weaker than the UKrsquos onshore public finances1 This reflects a slightly lower level of onshore tax revenue and public spending that is consistently 10 per cent higher than the UK average In the event of independence the allocation of North Sea oil and gas revenues would be subject to negotiation If North Sea oil and gas revenues are allocated on a geographical basis Scotlandrsquos notional fiscal balance since devolution is very similar to the UKrsquos public finances
However North Sea oil and gas receipts are one of the most volatile sources of revenue Since devolution Scotlandrsquos geographical share of North Sea oil and gas receipts has fluctuated between pound2 billion and pound12 billion from 25 per cent to 83 per cent of Scottish GDP2 As a result total receipts in Scotland are more volatile than for the UK as a whole Based on the earliest available data comparing receipts and spending demonstrates that Scottish receipts since 1981-82 have been almost twice as volatile while Scottish public spending has been just as stable as across the UK as a whole3
This is the UKrsquos fiscal model in action diffusing the volatility of Scottish receipts across the UK while providing stability and security for public spending Through the pooling of major tax revenues across the UK Scotland contributes a volatile revenue stream from North Sea oil and gas in return for secure and stable funding from the UK Government
1 Scottish Government GERS 2011-12 and historical series March 2013 2 Scottish Government GERS 2011-12 and historical series March 2013 3 This is the impact of year-on-year volatility but in addition independent analysts expect North Sea oil and gas
revenues to decline over time which would require other taxes to increase by the same amount to maintain the same level of public spending
34 Scotland analysis Macroeconomic and fiscal performance
The UKrsquos fiscal model protects Scotland from a more difficult set of fiscal choices In the absence of shared public finances in 2009-10 ndash in the aftermath of a halving of North Sea oil and gas revenues ndash Scotland would have faced a choice between implementing immediate spending cuts of nine per cent (or pound6 billion which equates to half of Scotlandrsquos health budget) increasing other taxes to offset the sharp fall in North Sea oil and gas revenues or absorbing this volatility in its budget deficit As a small independent country Scotland would be likely to have less flexibility to absorb shocks of this kind than the UK as it would be likely to pay higher borrowing costs
A clear benefit of the current fiscal framework is that the Scottish Government is able to take long-term decisions on the allocation of significant areas of public spending that have been devolved and do this secure in the knowledge that funding levels will remain stable irrespective of the volatility of Scottish receipts
The Scottish Parliamentrsquos budget for devolved public services is separate and predictably certain and is not affected by changes in demand for welfare Automatic welfare provision at the UK level means that if the number of welfare recipients or pensioners increases in Scotland then the Scottish Government does not need to adjust its budget The latest IFS figures4 show that UK Government spending on benefits and pensions for people in Scotland is now around two per cent per head higher than the UK average having converged in recent years This is pound340 million higher each year than what Scotland would receive based on a population share
A large and diversified tax base allows all parts of the UK to pool risks such as volatile tax revenues and to borrow at a lower cost to maintain public services By spending taxpayersrsquo money on a UK-wide basis for certain services the UK limits public costs through economies of scale (for example in defence tax collection and overseas representation) while also supporting integration in the domestic market (for example through unified social security and common regulators)
An integrated tax system works well for business and individuals providing a simple and efficient way to collect tax revenues across the UK The same taxes and rates apply across most of the UK ensuring the overall coherence of the tax system But as part of this integrated system the UK Government has devolved certain tax powers to the Scottish Parliament through the Scotland Act 2012 which will make the Scottish Parliament more accountable for funding its spending and enable greater tax and spending flexibility within Scotland
Independence would put an end to devolution as it would create a separate independent Scottish state This would also put an end to the pooling of fiscal risks across the UK the stabilising role of fiscal transfers between different parts of the UK and the ability to share costs and coordinate policies An independent Scotland would therefore be directly exposed to a more narrow and volatile tax base resulting in a more difficult set of tax and spending choices
4 Institute for Fiscal Studies Government spending on benefits and state pensions in Scotland July 2013
Chapter 2 The UKrsquos integrated fiscal model 35
21 In addition to close economic integration examined in Chapter 1 the UK is characterised by a high degree of fiscal integration combined with substantial devolution of spending policy powers
22 As well as being a fully integrated economic and political union with a sovereign parliament the UK is a fiscal union with a fully integrated tax and spending system Public spending in the UK is funded through taxation with shortfalls in tax revenues supplemented by borrowing This enables all nations and regions of the UK to pool fiscal resources benefit from economies of scale in public spending share fiscal risks and borrow as a single and credible participant in international financial markets The UKrsquos integrated fiscal model supports Scotlandrsquos economic performance ndash and the economic performance of all parts of the UK ndash and ensures that funding for Scotlandrsquos public services remains stable
23 Figures for Scotlandrsquos tax and spending published by the Scottish Government therefore reflect Scotlandrsquos position as part of the UK integrated within the UK economy and supported by the UKrsquos fiscal model They do not show tax and spending for an independent Scotland no longer benefitting from the economic or fiscal integration with the rest of the UK
24 Since the Scotland Act 1998 the UK Government has devolved responsibility for some 60 per cent5 of Scotlandrsquos public spending to the Scottish Parliament and following the Scotland Act 2012 the Scottish Parliament will be responsible for funding around one-third of its spending6 Fiscal devolution is taking place while retaining the overall coherence and integration of the UKrsquos tax and spending system Independence would mean an end to the UKrsquos fiscal model and an independent Scottish state would need to establish its own tax system and fund all public spending commitments including through borrowing in international financial markets when necessary
Fiscal alignment between Scotland and the rest of the UK 25 Just as Scotlandrsquos strong economic performance as part of the UK is closely aligned to
the UKrsquos overall performance the Scottish Government estimates that Scottish onshore tax revenues per person are very slightly lower than the UK average since devolution in 1998 as shown in Chart 2A This reflects the fact that the performance of Scotlandrsquos onshore economy closely mirrors the performance of the UKrsquos onshore economy as highlighted in Chapter 1 and the fact that people and businesses across the UK are subject to the same levels of taxation as the UK has a largely unified tax system
5 Scottish Government GERS 2011-12 March 2013 The Scottish Government and Local Authorities were responsible flor almost pound39 billion of Scotlandrsquos pound64 billion spending in 2011-12
6 Commission on Scottish Devolution final report June 2009
36 Scotland analysis Macroeconomic and fiscal performance
Chart 2A Comparison of Scotland and UK onshore tax revenues per head
1999
ndash00
2001
ndash02
2003
ndash04
2005
ndash06
2007
ndash08
2009
ndash10
2011
ndash12
13000
12000
Rev
enue
s pe
r he
ad (pound
)
6000
7000
8000
9000
11000
10000
5000
4000
Scotland UK 19
99ndash0
0
2001
ndash02
2003
ndash04
2005
ndash06
2007
ndash08
2009
ndash10
2011
ndash12
120
115
Rev
enue
s pe
r he
ad (i
ndex
ed U
K=
100)
100
105
110
95
90
Scotland UK
Source Scottish Government GERS 2011ndash12 and historical series (all figures to 2011ndash12) ONSHM Treasury Public Sector Finances (UK figures for 2012ndash13 excluding the one-off Royal Mail Pension Scheme asset transfer) HM Treasury estimates (Scotlandrsquos share of 2012ndash13 UK totals based on the 2011ndash12 share)
26 Onshore revenues are the levels of taxation that people and (onshore) businesses in Scotland actually pay Irrespective of the offshore revenues attributed to Scotland this demonstrates that people and (onshore) businesses in Scotland are making roughly the same contribution to the UKrsquos tax revenues as the UK (onshore) average
27 Scotlandrsquos notional onshore balance therefore reflects the levels of taxation people in Scotland face and the levels of public service they receive While Scotlandrsquos onshore revenues are slightly lower than the UK average public spending per person in Scotland has been around ten per cent higher than the UK average since devolution7 This is currently equivalent to almost pound1200 per head as shown in Chart 2B below Had Scotland instead received its population share of spending then it would have received some pound74 billion less since devolution or pound6 billion less each year (in real terms) which is equivalent to around half Scotlandrsquos health budget An allocation of the UKrsquos spending based on a share of onshore tax revenues would have further decreased Scotlandrsquos spending
Scottish Government GERS 2011-12 and historical series March 2013 7
Chapter 2 The UKrsquos integrated fiscal model 37
Chart 2B Comparison of Scotland and UK spending per head
1999
ndash00
2001
ndash02
2003
ndash04
2005
ndash06
2007
ndash08
2009
ndash10
2011
ndash12
13000
Spe
ndin
g pe
r he
ad (pound
)
6000
7000
8000
9000
10000
11000
12000
5000
4000
Scotland UK 19
99ndash0
0
2001
ndash02
2003
ndash04
2005
ndash06
2007
ndash08
2009
ndash10
2011
ndash12
120
Spe
ndin
g pe
r he
ad (i
ndex
ed U
K=
100)
100
105
110
115
95
90
Scotland UK
Source Scottish Government GERS 2011ndash12 and historical series (all figures to 2011ndash12) ONSHMT Public Sector Finances (UK figures for 2012ndash13 excluding the one-off Royal Mail Pension Scheme asset transfer) HMT estimates (Scotlandrsquos share of 2012ndash13 UK totals based on the 2011ndash12 share)
28 As shown in Chart 2C Scotlandrsquos significantly higher public spending per person compared to the UK as a whole is driven by
bull spending on social protection which is largely reserved (the main exception being social care) and determined by need and which is around pound260 per head higher in Scotland than the UK average and
bull other largely devolved areas of spending in particular economic affairs (which includes transport and agriculture) is pound350 per head higher in Scotland than the UK average health is pound180 per head higher and housing and community amenities is pound120 per head higher
Chart 2C Breakdown of Scotland and UK spending per head
10 S
ocial
pr
Accou
nting
adjus
tmen
ts
9 Edu
catio
n
otec
tion
8 Rec
reatio
n cult
ur
6 Hou
sing a
nd co
mmunity
amen
ities
7 Hea
lth
e and
relig
ion
5 Env
ironm
ent p
rotec
tion
4 Eco
nomic
affair
s
3 Pub
lic or
1 Gen
eral p
ublic
servi
ces
2 Defe
nce
der a
nd sa
fety
4000
UK
Scotland 3000
pound pe
r he
ad
2000
1000
0
Source Scottish Government GERS 2011ndash12 March 2013 (average of the five years 2007ndash08 to 2011ndash12)
38 Scotland analysis Macroeconomic and fiscal performance
29 It should be noted that the spending numbers presented in Government Expenditure and Revenue Scotland (GERS) reflects the spending that is determined to benefit people in Scotland or that was incurred on their behalf It does not necessarily reflect spending that actually took place in Scotland8
210 For example all parts of the UK are considered to benefit equally from spending on defence security and foreign representation even though the location of the spending may be concentrated in certain areas of the UK or overseas Similarly some spending that takes place in Scotland (for example administering tax and benefits) actually benefits people in other parts of the UK While this is explained further in Annex B the key point to note is that GERS shows the spending that Scotland benefits from as part of the UK and not what Scotlandrsquos spending would need to look like as an independent country
211 Combining Scotlandrsquos onshore revenues and public spending allocation in Chart 2D below shows that relative to the UK raising and spending pound100 Scotland generates pound98 and spends pound112 Scotlandrsquos notional onshore fiscal balance has therefore been considerably weaker than the UKrsquos onshore fiscal position in the period since devolution
Chart 2D Scotlandrsquos onshore tax and spending compared to the UK average
o
f UK
tota
ls
80
85
90
95
100
105
110
2011
ndash12
2009
ndash10
2007
ndash08
2005
ndash06
2003
ndash04
2001
ndash02
1999
ndash00
Spending Revenue Population
Spe
ndin
g an
d re
venu
es p
er h
ead
(inde
xed
UK
=10
0)
90
95
100
105
110
115
120
2011
ndash12
2009
ndash10
2007
ndash08
2005
ndash06
2003
ndash04
2001
ndash02
1999
ndash00
Scotland spending Scotland revenues UK
Source Scottish Government GERS 2011ndash12 and historical series (all figures to 2011ndash12) ONSHMT Public Sector Finances (UK figures for 2012ndash13 excluding the one-off Royal Mail Pension Scheme asset transfer) HMT estimates (Scotlandrsquos share of 2012ndash13 UK totals based on the 2011ndash12 share)
Including North Sea oil and gas 212 In the event of independence the allocation of the UKrsquos oil and gas reserves would have to
be negotiated between a separate Scottish state and the continuing UK
213 For illustrative purposes the Scottish Government presents both a ldquogeographical share of North Sea oil and gasrdquo and a ldquoper capita share of North Sea oil and gasrdquo9 Consistent with the economic analysis in Chapter 1 the rest of this section includes a geographical share of North Sea oil and gas within Scotlandrsquos overall revenues This does not reflect any UK Government position in the event of independence rather by allocating the largest share of resources to Scotland it ensures that the subsequent analysis represents the lsquobest casersquo for an independent Scotland
8 The spending methodology is set out in Annex B of GERS 9 Scottish Government GERS 2011-12 March 2013
Chapter 2 The UKrsquos integrated fiscal model 39
214 Any allocation of North Sea oil and gas receipts to Scotlandrsquos onshore tax revenues has the effect of increasing Scotlandrsquos contribution to UK tax revenues The geographical allocation used by the Scottish Government would see Scotlandrsquos contribution to UK tax revenues substantially increased
215 On this basis Scotlandrsquos notional fiscal balance as part of the UK is very similar to the UKrsquos fiscal position over the period since devolution albeit Scotlandrsquos revenues and spending both average around 10 per cent higher than the UK This is illustrated by Chart 2E below which demonstrates that there is no consistent fiscal surplus in Scotland compared to the UK
Chart 2E Scotlandrsquos overall tax and spending compared to the UK average
1999
ndash00
2001
ndash02
2003
ndash04
2005
ndash06
2007
ndash08
2009
ndash10
2011
ndash12
o
f UK
tota
ls
80
85
90
95
100
105
110
Spending Revenue Population 19
99ndash0
0
2001
ndash02
2003
ndash04
2005
ndash06
2007
ndash08
2009
ndash10
2011
ndash12 S
pend
ing
and
reve
nues
per
hea
d (in
dexe
d U
K=
100)
90
95
100
105
110
115
120
130
125
Scotland spending Scotland revenues UK
Source Scottish Government GERS 2011ndash12 and historical series (all figures to 2011ndash12) ONSHM Treasury Public Sector Finances (UK figures for 2012ndash13 excluding the one-off Royal Mail Pension Scheme asset transfer) HMRC Government revenues from UK oil and gas production (North Sea revenues for 2012ndash13) HM Treasury estimates (Scotlandrsquos share of 2012ndash13 UK totals based on the 2011ndash12 share)
216 Moreover as is shown by the fluctuation of total Scottish revenues North Sea receipts are among the most volatile sources of government funding Since devolution Scotlandrsquos geographical share of North Sea oil and gas receipts has fluctuated between pound2 billion in 1999-2000 and pound12 billion in 2008-09 from 25 per cent to 83 per cent of Scottish GDP10
Pooling of resources Stability of receipts
217 The pooling of most tax revenues across the UK ndash in particular volatile revenues such as corporation tax and North Sea taxes ndash provides greater stability and certainty for policy makers firms and households This creates a more favourable environment to develop tax and spending policies
218 At an aggregate level Scotlandrsquos onshore tax mix is similar to the UKrsquos onshore tax mix as shown in Chart 2F This is perhaps unsurprising given the high level of integration of the two economies and given that (with some limited exceptions) it is the same tax system with the same rates that is in operation across the whole of the UK
10 Scottish Government GERS 2011-12 March 2013
40 Scotland analysis Macroeconomic and fiscal performance
Chart 2F Onshore tax mix in Scotland and the UK
UK Scotland
Income Tax and NICS
VAT
Corporation Tax
Excise and other indirect taxes
Main local taxes
Other
4346
17 18
76
54
99
1817
Source Scottish Government GERS 2011ndash12 (average of the five years 2007ndash08 to 2011ndash12)
219 Chart 2G shows Scotlandrsquos tax mix including a geographic share of North Sea revenues alongside the UKrsquos tax mix also including North Sea revenues A geographical share of North Sea oil and gas significantly changes the Scottish tax mix compared to that across the UK as a whole
Chart 2G Tax mix in Scotland and the UK including North Sea revenues
UK Scotland
Income Tax and NICS
VAT
Corporation Tax
Excise and other indirect taxes
Main local taxes
Other
Oil and Gas
36
45
17 156
4
6 7
4
2
159
1617
Source Scottish Government GERS 2011ndash12 (average of the five years 2007ndash08 to 2011ndash12)
220 Specifically while total North Sea revenues average 17 per cent of UK revenues in the past five years attributing a geographical share to Scotland would mean that this averages 163 per cent of Scotlandrsquos revenues
221 Total receipts in Scotland are therefore more volatile than for the UK Based on earliest available data Scottish receipts have varied up or down by an average of 61 per cent each year11 For the UK as a whole the average annual variation in receipts is significantly lower at 37 per cent The driver of higher volatility in Scotland is offshore revenues from North Sea oil and gas as shown in Chart 2H This implies Scottish receipts vary by around pound670 per head each year (in 2013-14 prices) while total UK receipts vary by around pound330 per head each year
11 Over 1981-82 to 2011-12 in real terms
Chapter 2 The UKrsquos integrated fiscal model 41
Chart 2H Volatility in UK and Scottish receipts 70
00
10
20
30
40
50
60
Scotland ndash Total receipts volatility
UK ndash Total receipts volatility
ecei
pts
eal r
Ave
rage
abs
olut
e ch
ange
in r
1981
ndash82
to 2
011ndash
12
37
61
35
30 30
ecei
pts
eal r
Ave
rage
abs
olut
e ch
ange
in r
1981
ndash82
to 2
011ndash
12 25
20
15
10
5
0
35
Onshore volatility Offshore volatility
Source Scottish Government GERS 2011ndash12 and historical series HM Treasury calculations
222 North Sea oil and gas receipts are among the most volatile sources of revenue On average real-terms offshore receipts vary by 30 per cent from year to year as Chart 2H shows That means there are ldquoboomrdquo years (eg 2005-06 when revenues rose by over 75 per cent) but also ldquobustrdquo years such as 2009-10 when revenues halved
223 If revenues were volatile but predictable the challenge for fiscal planning might be eased But they are not North Sea revenues have a critical dependence on a range of external and interrelated factors that are difficult to predict These factors include world oil and gas prices exchange rates production and outages investment levels and the nature and stability of the policy regime in particular for taxation and decommissioning
224 While there are examples of small countries managing the volatility of revenues from natural resources (notably Norway) this is largely due to the existence of an oil fund The ability and necessity for an independent Scotland to create an oil fund is considered in Chapter 4
225 As Chart 2I illustrates the volatile path of outturn offshore revenues makes them difficult to predict despite the fact that forecasts are based on prices derived from market expectations and production estimates informed by the industryrsquos projections
42 Scotland analysis Macroeconomic and fiscal performance
Chart 2I Successive official forecasts of UK offshore revenues
16
4
6
8
10
12
14
pound bi
llion
2
0 2000ndash01 2003-04 2006ndash07 2009ndash10 2012ndash13 2015ndash16
Outturn Forecasts
Source HM Treasury and Office for Budget Responsibility forecasts from Budget 2002 to Budget 2013 including Pre-Budget Reports and Autumn Statements ONS outturn
226 This shows how difficult it is to forecast North Sea revenues A further example is provided by the Scottish Governmentrsquos recent Oil and Gas bulletin12 published in March 2013 Although published towards the very end of 2012-13 and including a range of scenarios the least optimistic forecast of Scotlandrsquos geographic share in 2012-13 (other than the forecast based on OBR assumptions) turned out to be pound400 million higher than the UKrsquos total offshore revenues and pound800 million higher than Scotlandrsquos geographic share (assuming the same share as 2011-12) Annex B explains in more detail the interactions between the range of factors that affect North Sea production and the impact on revenues
227 If peaks and troughs in North Sea oil and gas revenues could be aligned to counterbalance the onshore economic cycle the challenge of how to plan fiscal policy to mitigate the volatility of North Sea oil and gas might be eased But the most severe volatility tends to be caused by external factors For example the significant increase in revenues in 2005-06 was largely driven by oil prices almost doubling during 2005 from pound21 per barrel to pound36 per barrel while a fall from pound67 per barrel to pound27 per barrel during just six months in 2008 resulted in revenues halving between 2008-09 and 2009-1013
228 This final trough in 2009-10 was the largest single-year fall in offshore revenues since the early 1990s It coincided with the financial crisis and recession the associated shortfalls in onshore receipts and the fiscal costs of intervening in the financial sector Collectively these factors put historic pressure on the public finances The UKrsquos fiscal model pooled the shortfall in offshore revenues to better withstand the impact
229 Within the UK most public sector receipts are pooled allowing this exceptional source of volatility to be managed Since devolution offshore oil and gas receipts amounted to around 15 per cent of total UK receipts For Scotland North Sea revenues would have been almost 14 per cent of the total Shortfalls in North Sea revenues would need to be offset by borrowing in financial markets (to avoid spending cuts or tax rises) Markets may demand higher interest rates on this borrowing particularly for a newly-formed small independent state There are therefore clear risks from depending on such a volatile source of revenue for such a large proportion of tax revenues and clear benefits to pooling volatile sources of revenue across the UK as a whole
12 Scottish Government Oil and Gas bulletin March 2013 13 World Bank Dated Brent monthly oil prices
Chapter 2 The UKrsquos integrated fiscal model 43
Stability of spending
230 The analysis above shows Scottish tax receipts are almost twice as volatile as revenues across the UK as a whole In the absence of wider fiscal risk-sharing a more volatile revenue base would imply sharp annual changes in the affordable level of spending But thanks to the UKrsquos integrated fiscal model Scotland has access to stable and secure funding regardless of the fluctuating level of North Sea oil and gas receipts
231 The UK and Scottish Governments generally set public service spending plans over multiple years This gives Scotland the ability to plan spending efficiently over the medium term The stability of firm multi-year plans enables sound value-for-money decisions to be taken for Scotland and all parts of the UK maximising public service outcomes for a given funding envelope
232 Based on the earliest available data public spending in Scotland has varied up or down by an average of around 28 per cent each year14 That is very similar to the equivalent UK average of 30 per cent This implies that public spending in Scotland varies by pound350 per head each year in 2013-14 prices and population The UK figure is very similar
233 Chart 2J compares receipts and spending volatility to demonstrate that while Scottish tax receipts are more volatile Scottish spending is just as stable as that of the UK as a whole15 This is the UK fiscal model in action diffusing receipts volatility across the UK while giving Scotland stability and security on public spending
Chart 2J Volatility in UK and Scottish receipts and spending
Ave
rage
abs
olut
e ch
ange
in r
eal
rece
ipts
and
spe
ndin
g 1
981ndash
82 to
201
1ndash12
70
61
60
50
3740
30 2830
20
10
00 UK Scotland UK Scotland
Receipts volatility Spending volatility
Source Scottish Government GERS 2011-12 and historical series HM Treasury calculations
234 The fiscal model protects Scotland from a more difficult set of fiscal choices In the absence of shared public finances in 2009-10 ndash in the aftermath of a halving of North Sea oil and gas revenues16 ndash Scotland would have faced a choice between implementing immediate spending cuts of nine per cent (or pound6 billion which equates to half Scotlandrsquos health budget) increasing other taxes to offset the fall in North Sea revenues or absorbing this volatility in its budget deficit As a small independent country Scotland is likely to have less fiscal flexibility to absorb shocks of this kind within its deficit than the UK as it would be likely
14 Over 1981-82 to 2011-12 in real terms 15 This result is also robust over a shorter time period such as the last two decades (albeit with a smaller
magnitude of difference) Receipts and spending are deflated using the UK GDP deflator 16 HM Revenue amp Customs Government Revenues from UK oil and gas production June 2013
44 Scotland analysis Macroeconomic and fiscal performance
to pay higher borrowing costs For the UK the fall in offshore receipts that year was 05 per cent of GDP ndash a still significant but more manageable pressure
235 Through the pooling of major tax revenues across the UK Scotland therefore contributes a volatile revenue stream from North Sea oil and gas and benefits from secure and stable funding from the UK Government As will be explored in forward-looking analysis later in the Scotland analysis series oil and gas revenues remain extremely uncertain The only outcome that forecasters predict with any confidence is that the reserves in the North Sea will ultimately decline
Policy flexibility within an integrated fiscal model 236 The UKrsquos integrated fiscal model provides stable and secure funding across the UK
including for Scotland As a result of devolution the Scottish Government is responsible for many key public services in Scotland and has complete flexibility to determine how to use its funding for devolved public services This reflects that decisions in some areas are judged to be better taken locally by the Scottish Government But at the same time services that benefit from being delivered consistently on a UK-wide basis are provided by the UK Government and the UK Parliament The split between devolved and reserved functions is shown in Chart 2K
Chart 2K Devolved and reserved spending for Scotland
10 S
ocial
pr
Accou
nting
adjus
tmen
ts
9 Edu
catio
n
otec
tion
8 Rec
reatio
n cu
ltur
6 Hou
sing a
nd co
mmunity
amen
ities
7 Hea
lth
e and
relig
ion
5 Env
ironm
ent p
rotec
tion
4 Eco
nomic
affair
s
3 Pub
lic or
1 Gen
eral p
ublic
servi
ces
2 Defe
nce
der a
nd sa
fety
4000
Reserved
Devolved 3000
pound pe
r he
ad
2000
1000
0
Source Scottish Government GERS 2011ndash12 (average of the five years 2007ndash08 to 2011ndash12)
Note that reserved lsquogeneral public servicesrsquo includes international development foreign affairs tax collection and debt interest lsquoEconomic affairsrsquo includes transport and agriculture
237 The UK Government and the UK Parliament are responsible for those areas that are essential to the integrity of the state and where all people across the UK benefit from a common approach Key areas of responsibility reserved to the UK Parliament include defence and national security macro-economic policy foreign affairs immigration social security and pensions Not only does this mean that the public benefits from the same levels of service across the UK strengthening the UKrsquos union but it also enables the UK to benefit from economies of scale in relation to spending This is explored further in Box 2A
17 18 19
Chapter 2 The UKrsquos integrated fiscal model 45
Box 2A The UK Governmentrsquos spending for Scotland The UK Government is responsible for around pound26 billion17 of Scotlandrsquos annual spending Welfare spending (including benefits state pension and tax credits) accounts for almost two thirds (or pound16 billion) of reserved spending for Scotland The remaining pound10 billion of UK Government spending for Scotland is allocated across a range of reserved functions and responsibilities
Welfare ndash UK Government spending on benefits and pensions for people in Scotland is now around 2 per cent per head higher than the UK average18 having converged in recent years This is pound340 million higher each year than what Scotland would receive based on a population share
Foreign policy ndash The UK has influence with international institutions and in world affairs to represent the interests of people and businesses in Scotland
Defence ndash The UK Government spends around pound40 billion19 a year on defence to guarantee the safety and security of all UK citizens
Tax collection ndash As highlighted in the recent paper Scotland analysis Business and microeconomic framework Scotlandrsquos share of the UKrsquos tax collection costs are estimated by the Scottish Government at around pound300 million per year This compares to the Scottish Governmentrsquos estimates for tax collection costs in an independent Scotland of between pound575 million and pound626 million which is around double the current cost
Scotlandrsquos spending policy flexibility 238 The Scottish Government is responsible for many of the key public services that are
provided to people in Scotland It can therefore take decisions that are more specifically related to Scottish circumstances Its devolved responsibilities include many of the key levers relating to economic growth such as education skills and infrastructure investment as well as other key public services such as health social care policing justice and housing
239 The balance between reserved and devolved functions continues to evolve ndash additional responsibilities for public services (most notably railways) have been transferred to the Scottish Government since devolution while the Scotland Act 2012 represents the biggest transfer of fiscal (tax and borrowing) powers from the UK Parliament in 300 years Matters currently devolved comprise around 60 per cent20 of Scotlandrsquos spending
240 As part of the UK the Scottish Government can rely on stable and secure levels of funding but has the flexibility to determine how services are provided in Scotland and how much of their budget is allocated to each area This means that the Scottish Government has significant scope to determine the shape of Scotlandrsquos public services
17 Scottish Government GERS 2011-12 March 2013 This is the total of identifiable and non-identifiable UK Government spending for Scotland in 2011-12
18 Institute for Fiscal Studies Government spending on benefits and state pensions in Scotland July 2013 19 UK Government PESA 2013 July 2013 20 Scottish Government GERS 2011-12 March 2013 The Scottish Government and Local Authorities were
responsible for almost pound39 billion of Scotlandrsquos pound64 billion spending in 2011-12
46 Scotland analysis Macroeconomic and fiscal performance
241 This policy flexibility allows the Scottish Government to focus on different priorities For example the Scottish population is dispersed more widely and so transport spending tends to be relatively higher Similarly as fisheries form a larger part of Scotlandrsquos economy spending in this area is higher And Scottish Water is part of the public sector in Scotland whereas water services have been privatised in England and Wales It is also as part of the UK that the Scottish Government is able to provide certain universal services free at the point of access Box 2B examines some of these policy differences in greater detail
Box 2B Examples of the Scottish Governmentrsquos spending policy choices The allocation of public spending to the services under the control of the Scottish Government is for the Scottish Government to determine This means that the Scottish Government is afforded significant flexibility to decide what policies to pursue and how to prioritise spending on these services
In some of the examples below the Scottish Government elected either to forego revenue from fees and charges or to use its funding in a different way to other parts of the UK making offsetting savings in other areas funded by the block grant
Policing
The Police and Fire Reform (Scotland) Act 2012 brought together Scotlandrsquos eight regional police forces the Scottish Police Services Authority and the Scottish Crime and Drug Enforcement Agency into a single Police Service of Scotland At the same time the eight fire and rescue services across Scotland were amalgamated into a single new Scottish Fire and Rescue Service This contrasts with the regional fire and policing structure in England and Wales
Prescriptions and eye tests
In 2006 the Scottish Government elected to fund free eye tests for Scottish residents in an attempt to improve public health In 2011 the Scottish Government abolished prescription fees This followed successive reductions in prescription charges by Scottish Ministers in the three years preceding the abolition The decision to end prescription charges brought Scotland in line with the approach previously adopted by the Welsh Government and Northern Ireland Assembly
Education
Although the devolution of higher education in 1999 saw tuition fee regimes in Scotland and the rest of the UK develop differently the decision by the Scottish Government to abolish the graduate endowment scheme that had existed since 2001 saw the reintroduction of free higher education in Scotland in 2008 However while the UK Government has protected schools spending in England since 2010 the Scottish Government has not made this commitment
Social care
Free personal care is available in Scotland for over 65s who have been assessed as needing care Scotland is the only part of the UK to offer free personal care in care homes and in peoplersquos own homes
Chapter 2 The UKrsquos integrated fiscal model 47
The UKrsquos integrated tax system 242 There are significant benefits to business and individuals of the UKrsquos integrated tax system
as they can operate or livework across the UK without having to deal with a number of separate systems and institutions It also provides a robust and comparatively efficient way for the Government to collect tax avoiding unhelpful tax competition within the UK and helping to minimise the opportunities for tax evasion and avoidance
243 While the UKrsquos integrated tax system is substantially unified with the same taxes and rates largely applying across the whole of the UK the devolution of certain tax powers (while retaining the integration and coherence of the overall system) can empower and enhance the accountability of devolved governments
244 Under devolution it is possible to decide which tax powers to devolve in order to enhance accountability of the devolved administrations and bring economic benefits to the UK as a whole There are no rules about which tax powers should be reserved and which devolved but the UK Government has indicated that it will proceed with tax devolution only where this is supported by evidence gains cross-party support and would not be to the detriment of the rest of the UK As with spending the challenge is therefore to find the right balance between devolved and reserved responsibilities ndash and this balance can clearly evolve over time
245 The Scottish Parliament is already responsible for council tax and non-domestic (business) rates which usually fund slightly more than 10 per cent of the spending for which it is responsible (ie the spending by the Scottish Government and Scottish local authorities) The UK Government and Scottish Parliament established the Calman Commission in 2007 to consider as one part of its remit how to increase the financial accountability of the Scottish Government
246 The Calman Commissionrsquos report highlighted the current benefits of the UKrsquos unified tax system and the risks associated with having separate tax systems within the UK
ldquoWere different tax systems to operate in Scotland compared to the rest of the United Kingdom an overall increase in the governmentsrsquo total administrative costs would be created as two tax systems would have to be operated It would also create new compliance costs to individuals and businesses operating across both tax jurisdictions as they would have to separate and determine their liabilities in those two tax systems In other words a unified UK tax system represents an existing administrative efficiency The evidence is that the administrative costs associated with the tax system in the UK compare favourably with international competitorsrdquo
247 Similar observations have been made by the Institute of Chartered Accountants Scotland (ICAS)21 as well as in an Ernst and Young corporate tax survey22 of Scottish business leaders while for ease of paying taxes the World Bank23 ranked the UK ahead of every G8 country except Canada and every EU country except Luxembourg Denmark and Ireland
21 Institute of Chartered Accountants of Scotland Scotlandrsquos tax future the practicalities of tax devolution November 2012
22 Ernst and Youngrsquos Scotland corporate tax survey report ldquoGrasping the thistlerdquo 23 World Bankrsquos 2012 lsquoDoing Businessrsquo survey
48 Scotland analysis Macroeconomic and fiscal performance
248 The Calman Commissionrsquos recommendations therefore balanced the existing strengths of the UKrsquos unified tax system against the potential benefits of devolving tax powers The report considered where devolving tax policy might substantially increase revenue-raising responsibility andor be an effective additional fiscal lever in existing devolved spending areas taking into account the mobility of taxes in relation to the risk of tax competition and avoidance as well as the administrative impact on business individuals and government
249 Following a rigorous assessment of the report virtually all of the key recommendations were included in a Scotland Bill and are now being implemented following the Scotland Act 2012 This will increase the autonomy and financial accountability of the Scottish Government and Scottish Parliament while ensuring that the UKrsquos tax system remains integrated and coherent
250 For example the partial devolution of income tax whereby the Scottish rate of income tax remains within the UKrsquos income tax system provides the Scottish Government with the ability to affect overall tax and spending in Scotland but minimises costs and complexity In particular the income tax structure (such as personal allowances and thresholds) remains consistent across the UK which avoids businesses running separate payroll systems and limits additional tax collection costs
251 The two fully devolved taxes (stamp duty land tax and landfill tax) apply to transactions or activities that relate to policy responsibilities of the Scottish Parliament (housing and planning and waste management respectively) and have a clear location associated with them This also keeps it simple for business and individuals and minimises any increased risk of tax evasion and avoidance which helps to avoid the need for higher government spending on compliance
252 This is a key difference between devolution and independence While selected taxes can currently be devolved in a way that benefits Scotland without adversely affecting the UK as a whole independence would ultimately lead to two completely separate and potentially competing tax systems
Scotlandrsquos tax policy flexibility introduced with the Scotland Act 2012 253 The Scotland Act 2012 transfers significant tax powers to the Scottish Parliament
Alongside these tax powers the Act also provides the Scottish Government for the first time with commensurate capital borrowing powers to support further investment in infrastructure A summary of all the Scotland Act 2012 fiscal powers is provided in Box 2C
254 The Scotland Act 2012 includes full devolution of stamp duty land tax (SDLT) and landfill tax as they apply in Scotland and partial devolution of income tax Full devolution means that the Scottish Government will be responsible for determining the tax base and the rates Or in other words they will be responsible for determining when the tax applies and how much will be paid as they already are in relation to council tax and business rates Partial devolution gives the Scottish Government the responsibility for rate-setting with the tax base (such as income tax bands) remaining the responsibility of the UK Government
Chapter 2 The UKrsquos integrated fiscal model 49
255 In terms of the value of revenues raised the income tax powers are by far the most significant The OBR estimates that the Scottish Government will raise pound50 billion in the first year of operation (2016ndash17) compared to a combined pound06 billion from SDLT and landfill tax As part of the Scotland Act 2012 an element of income tax is being devolved to the Scottish Parliament from April 2016 Specifically each of the UK rates (basic higher and additional) is to be reduced by 10p in the pound for Scottish tax-payers and will be replaced by a Scottish rate of income tax set annually by the Scottish Parliament Setting the Scottish rate at 10p would lead to overall income tax rates in Scotland remaining aligned with the rest of the UK while a rate of 11p or 9p would lead to higher or lower rates respectively being paid in Scotland
256 This replaces (and extends) the Scottish variable rate (SVR) which gave the Scottish Government the power to vary the basic rate of income tax in Scotland by up to three pence in the pound While this provided the Scottish Government with the ability to vary overall levels of tax and spending in Scotland better to reflect Scottish circumstances the power was never used However there are a number of advantages in the design of the new system In addition to requiring the Scottish Government pro-actively to set the Scottish rate each year these new powers are being implemented in such a way that the Scottish Governmentrsquos funding will be linked to the performance of the Scottish economy
257 Specifically even if the Scottish Government decides to leave overall income tax rates aligned with the rest of the UK Scotland will benefit (compared to current arrangements) if the income tax base in Scotland grows faster than in the UK but will be less well off if this tax base grows more slowly This further incentivises the Scottish Government to create the conditions for growth in the economy while continuing to shield Scotland from UK-wide shocks that the UK Government is better placed to manage
258 In advance of income tax powers being devolved stamp duty land tax and landfill tax are being fully devolved to the Scottish Parliament from April 2015 HMRC will therefore disapply these UK taxes in Scotland with the Scottish Parliament responsible for deciding whether and if so how to legislate for replacement Scottish taxes
259 While the revenues generated by these taxes are relatively modest (particularly in comparison with the devolved income tax powers) they will provide the Scottish Government with new fiscal levers in areas of policy responsibility that are already devolved (housing and planning and waste management respectively) This will enable the Scottish Government to balance for example environmental priorities against revenue raising thereby increasing their accountability
50 Scotland analysis Macroeconomic and fiscal performance
Box 2C The Scotland Act 2012 tax and borrowing powers From Royal Assent
bull Existing UK-wide taxes can be devolved andor new Scottish taxes can be created by order-making process in both the UK and Scottish Parliaments
From April 2015
bull full devolution of stamp duty land tax and landfill tax
bull borrowing powers for capital spending set at an additional 10 per cent of the Scottish Governmentrsquos capital DEL budget each year (which equates to capital borrowing of pound296 million in 2015-16 as set out in the recent Spending Round) within an overall limit of pound22 billion
bull the Scottish Government can utilise a cash reserve if devolved tax receipts are lower than forecast In addition to using an element of devolved tax revenues to build up the reserve the Scottish Government can also make discretionary payments from their existing budgets (from June 2011 to June 2016) in order to support the transition to the new system
bull borrowing powers for current spending if devolved tax receipts are lower than forecast and there are insufficient funds in the cash reserve to cover the shortfall This is limited to pound200 million per year up to an overall limit of pound500 million
From April 2016
bull Income tax will be partially devolved Each of the UK rates (basic higher and additional) is to be reduced by 10p in the pound for Scottish tax-payers and will be replaced by a Scottish rate of income tax set annually by the Scottish Parliament There will be a two or three year transitional period during which the UK Government will retain the forecasting risk
260 To help the Scottish Government manage variation between devolved tax forecasts and actual receipts a cash reserve can be built up in good years and utilised when tax revenues are lower than forecast If there are insufficient funds in the cash reserve to deal with any shortfall the Scottish Government also has access to limited borrowing powers for current spending
261 Alongside the introduction of these fully devolved taxes in April 2015 the Scottish Government will also gain borrowing powers for capital spending to support infrastructure projects
262 This package of new powers mean that the Scottish Government will have the ability to vary the levels of tax and day-to-day spending in Scotland as well as having more flexibility to decide when and how much to invest in capital projects While the majority of public services are currently devolved (health education transport housing policing etc) the Scottish Government is currently delivering public services within a fixed budget
263 The devolution of tax powers in the Scotland Act 2012 will mean that the Scottish Government will be taking decisions over both tax and spending which therefore empowers the Scottish Parliament while making the Scottish Government more accountable for raising funds as well as for spending them
Chapter 2 The UKrsquos integrated fiscal model 51
264 As part of that enhanced accountability under the arrangements set out in the Scotland Act 2012 the Scottish Government will be able to decide whether they want to retain the same level of existing public services (essentially by setting similar rates of tax to the rest of the UK) or to vary this by increasing or decreasing certain taxes This therefore enables the Scottish Government to further shape Scotlandrsquos tax and spending to reflect the needs and requirements of the people in Scotland
Chapter 2 Conclusion 265 Scotlandrsquos tax and spending is supported by the UKrsquos integrated economy and fiscal
model
bull the Scottish economy generates slightly lower per capita onshore tax revenues than the UK average while Scotland benefits from public spending that is consistently 10 per cent higher than the UK average
bull while Scotlandrsquos onshore fiscal balance is therefore weaker than the UKrsquos onshore public finances the allocation of a geographical share of North Sea tax revenues closes this gap However there is no consistent fiscal surplus in Scotland compared to the UK as a whole
266 The pooling and redistribution of tax revenues across the UK enables Scotland to exchange volatile North Sea revenues for stable and secure levels of funding
bull on average Scottish tax receipts including a geographic share of the North Sea have varied up or down by 61 per cent each year while for the UK as a whole the average annual variation in receipts is significantly lower at 37 per cent This increased volatility in Scotland is driven by offshore revenues which on average have varied by 30 per cent from year to year
bull through pooling and redistributing these revenues across the UK public spending in Scotland (in addition to being around 10 per cent higher than the UK average) has varied by around 28 per cent each year which is similar to the equivalent UK average of 30 per cent
267 Within this integrated fiscal model Scotland benefits from UK-wide services provided by the UK Government while the Scottish Government has significant policy flexibility to deliver devolved services
bull the UK Government and the UK Parliament are responsible for those areas that are essential to the integrity of the state and where all people across the UK benefit from a common approach such as defence and national security macro-economic policy foreign affairs immigration social security and pensions
bull the Scottish Government has significant policy responsibility for many of the key levers relating to economic growth (such as education skills and infrastructure investment) and for other key public services such as health social care policing justice and housing The Scottish Government also has complete flexibility over how it uses its funding to deliver devolved services
bull through the implementation of the Scotland Act 2012 new tax and borrowing powers are being devolved to the Scottish Parliament This will enable the Scottish Government to further vary the overall levels of tax and spending in Scotland
Chapter 3 The Border Effect
In the event of a vote for independence an international border would be created between an independent Scottish state and the continuing UK Over time this is likely to lead to differences in tax and welfare policy and regulatory and administrative regimes Over the longer-term some business networks might end as a result of economic historical and cultural ties being weakened
Collectively these changes would be expected to trigger a ldquoborder effectrdquo international evidence shows that flows of trade labour and capital are much larger between two regions of the same country than between two (otherwise similar) regions of two different countries This effect occurs even when there is no physical border between countries and even where trade agreements and structures such as the European Single Market are in place While historical and cultural ties between Scotland and the continuing UK will prevent an immediate fall off in flows evidence of previous separations points to the erosion of these ties as time passes Combined with regulatory divergence Scottish independence would lead to barriers to trade and obstacles to labour and capital mobility Even if the Scottish Governmentrsquos ambition of a formal sterling union between an independent Scotland and the continuing UK were to come to fruition the long term effect of this arrangement on trade flows and labour mobility could still be considerable
Replacing the current relationship between Scotland and the rest of the UK with a relationship similar to that of euro area Member States would create significant headwinds to Scottish growth Estimates suggest that the movement of people between Scotland and the rest of the UK could fall below 10000 per annum in both directions compared with average rates of over 40000 people per annum in recent years As an impediment to trade flows the border is likely to reduce the level of real income in the Scottish economy by four per cent after 30 years While Scotland can look to new markets to offset this drag on growth it is not clear whether this would compensate for the decline in trade with the continuing UK
54 Scotland analysis Macroeconomic and fiscal performance
The ldquoborder effectrdquo impact of independence on economic integration Characterising the potential border between an independent Scottish state and the continuing UK
31 In the event of Scottish independence an international border would be created between an independent Scottish state and the continuing UK This would create barriers to cross-border transactions and lead to increased costs for businesses and households operating or travelling across the border These effects would cumulate across the economy and trigger a ldquoborder effectrdquo ndash the barrier to flows of trade labour and capital created by the weakening of economic integration
32 The extent of these barriers and costs and their overall impact on the economy would depend on the exact nature of the international border that would be created between an independent Scottish state and the continuing UK Characterising this border is complicated by the fact that many aspects of the relationships between an independent Scottish state and the continuing UK would be subject to policy choices and negotiations and cannot be known prior to the referendum As described in the benefits of integration in Chapter 1 countries try to mitigate the effects of borders by pooling aspects of sovereignty in order to generate greater economic integration A recent example is the mutual recognition of travel visas between the UK and Ireland These same incentives to reduce the effect of the border would exist for an independent Scotland and the continuing UK although their ability to do so may be limited However the creation of a border would still create barriers to economic integration that do not currently exist and would require policy choices in order to mitigate these barriers
33 The Scottish Governmentrsquos ambition is that an independent Scotland would be a member of the European Union the European Single Market and of the Common Travel Area1
and that it would continue to use sterling as part of a formal currency union with the continuing UK But a range of uncertainties exists around the feasibility of these ambitions and the time-frame over which they could be achieved As discussed in Scotland analysis Devolution and the implications of Scottish independence in the event of a vote in favour of leaving the UK in the eyes of the world and in law Scotland would become an entirely new and separate state The details of the currency issue were discussed in Scotland analysis Currency and monetary policy questions around membership of the European Single Market and of the Common Travel Area will be discussed in forthcoming publications
34 This analysis uses the Scottish Governmentrsquos ambition as the baseline for characterising the potential effects of the border between an independent Scottish state and the continuing UK In practice the UK Government considers it unlikely that the proposals would be agreed and could be made to work It is important to stress that of all the potential scenarios that could materialise in the event of Scottish independence the conclusion of successful negotiations with the continuing UK and the EU to deliver these proposals would provide a model for independence that is one of the closest to existing conditions within the UK Any further changes would be likely to create additional costs
1 The Common Travel Area (CTA) is the free movement zone that allows people to travel between the UK the Republic of Ireland the Isle of Man and the Channel Islands without internal borders for immigration purposes The Scottish Governmentrsquos position is that an independent Scottish state would join the European Union All members of the European Union are legally obliged to join the Schengen Area unless they negotiate an opt-out (the UK and Ireland are the only EU members with an opt-out from the Schengen agreement) It is not clear whether an independent Scottish state would manage to secure such an opt-out Membership of the Schengen Area is not compatible with membership of the CTA
Chapter 3 The Border Effect 55
to households and businesses such as transaction costs from using a different currency as described in Box 3A As such the baseline scenario assumed for the purposes of this chapter has a more limited impact on economic integration The potential effects on the flows of trade labour and output set out in this chapter should therefore be thought of as being at the lower end of likely outcomes in the event of independence
Box 3A Currency options and transaction costs The effects outlined above are likely to be relevant no matter which format Scottish independence takes However as noted in Scotland analysis Currency and monetary policy there are a variety of currency regimes which could be adopted Any one of these options could be subject to a form of exchange rate risk if markets lack confidence in the regime This could raise the cost of capital in Scotland relative to that in the rest of the UK If Scotland issued a new currency then a further effect is likely to present itself through exchange-rate volatility DellrsquoAriccia (1999) finds exchange rate uncertainty has a small but significant negative effect on international trade between 15 EU states and Switzerland the estimates find that total elimination of exchange rate variability in 1994 could have increased bilateral trade among these countries by between five and 12 per cent1
1 Exchange rate fluctuation and trade flows evidence from the European Union DellrsquoAriccia (1999)
35 Regardless of the main characteristics of an independent Scottish state all possible models of independence would constitute a fundamental change in the economic relationship between Scotland and the rest of the UK The UK Governmentrsquos Scotland analysis Business and microeconomic framework paper explained that independence would create new costs and barriers to transactions (trade labour and capital flows) between an independent Scottish state and the continuing UK Box 3B highlights some of the costs identified in the Scotland analysis Business and Microeconomic framework paper
56 Scotland analysis Macroeconomic and fiscal performance
Box 3B Administrative and transaction costs of independence ndash Summary from the Scotland analysis Business and microeconomic framework Administrative and Transaction costs Trade
The UK domestic market guarantees a free flow of goods and services Companies which operate across the UK are generally subject to the same regulations and requirements This ensures a level playing field and further reduces the costs of intra-UK trade The creation of a border could impose costs on firms and also consumers which are likely to reduce trade across the border significantly
For example Scottish firms who sell or buy their products in the rest of the UK do not incur additional costs typically associated with exporting abroad such as the cost of custom procedures However if procedures similar to the EU are introduced there could be an increase in costs for firms of trading across the border For example in the EU where trade exceeds pound250000 per annum businesses need to complete a monthly Intrastat declaration
Administrative and Transactions Costs Labour
A single regulatory framework between Scotland and the rest of the UK creates a unified national labour market and a more transparent and efficient allocation of resources Workers employees and employers across the UK are ensured a common set of rights and responsibilities which aids labour mobility and ability of the UK to respond to economic shocks Independence would pose a risk to this labour mobility For example
bull Differences in labour market regulations in an independent Scotland could reduce labour market mobility which in turn would reduce the efficiency of the labour market to the detriment of Scotland and the rest of the UKrsquos macroeconomic performance and
bull An independent Scotland may choose or be obliged to join the Schengen area as a condition of EU membership Membership of the Schengen area would require the removal of border controls between an independent Scotland and other members of that area and the establishment of border control with other EU Member States that were outside Schengen The Scottish Government has indicated that it would wish to remain in the CTA1 rather than join the Schengen area The UK Governmentrsquos paper Scotland analysis Devolution and the implications of Scottish independence notes that membership of the CTA would be subject to negotiation with the continuing UK and all existing CTA members and that membership of the Schengen area is not compatible with membership of the CTA Should an independent Scottish state become part of either the CTA or the Schengen area it would need to align its migration policy in certain aspects with the other members of those areas These issues will be considered in a future paper in the Scotland analysis series
1 Deputy First Minister Nicola Sturgeonrsquos statement to Scottish Parliament on an independent Scotlandrsquos continuing membership of the EU 13 December 2012
Chapter 3 The Border Effect 57
Administrative and Transactions Costs Capital
Scotland is a favourable location for Foreign Direct Investment (FDI) In 2012 it attracted the second most FDI projects in the UK and would have ranked twelfth in Europe above all the comparable independent countries except Ireland This attractiveness is enhanced by being part of the UK It expands Scotlandrsquos domestic market and improves its access to skilled labour The Ernst and Young 2013 International Executive Survey provides a detailed analysis of the relative attractiveness of the UK
bull Within the UK 84 per cent of international investors surveyed thought the stable political environment was attractive placing it as the second highest rated aspect after quality of life diversity culture and language and
bull The UKrsquos market size generally emerged as highly influential in a ranking of the most important factors for international investors when evaluating the UK as a potential investment location Some foreign investors might be deterred from investing in an independent Scotland if they judge that independence had increased the costs of supplying the wider UK market
Assessing the impact of a border on economic integration between Scotland and the rest of the UK
Evidence of the ldquoborder effectrdquo
36 International evidence shows that flows of trade labour and capital are much larger between two regions of a same country than between two (otherwise similar) regions of two different countries The most well known example of this effect is trade between the US and Canada After controlling for the effects of differences in regional incomes and distance between the various regions in the two countries McCallum (1995)2 concluded that Canadian provinces traded around 20 times more with each other than with US states of a similar size and proximity The size of this result prompted further studies which reduced the size of the estimated effect but the one of the most widely cited study concludes that the border between the US and Canada reduces trade by 44 per cent3 This is the border effect ndash the clear tendency to trade more within countries rather than across borders
37 This finding has since been replicated many times and is a well established phenomenon in global trade patterns The empirical estimates vary in size but are typically large suggesting that trade within a region or state can be anywhere between two and 22 times larger than trade across an international border More recent estimates are nearer the lower end of this range but still significant For example Anderson and van Wincoop (2003)4 conclude that borders reduce trade by a factor of 54 in other words the analysis suggests that we should expect to see a trade fall of around 80 per cent when comparing trade across a border to trade without the border Box 3C summarises the evidence for the border effect
38 The border effect is not limited to trade flows and has also been shown to reduce labour and capital flows The empirical estimates are again very large For example migration is found to be one hundred times more likely within Canada than it is from the USA to Canada (Helliwell 1997)5 Iwamoto and van Wincoop (2000)6 investigate the border effect in the context of capital flows They note that issues such as transaction costs regulatory
2 National borders matter Canada-US regional trade patterns McCallum (1995) 3 Gravity with Gravitas A solution to the Border Puzzle Anderson and van Wincoop (2003) 4 Gravity with Gravitas A solution to the Border Puzzle Anderson and van Wincoop (2003) 5 National Borders Trade and Migration Helliwell (1997) 6 Do borders matter Evidence from Japanese Regional net Capital flows Iwamoto and van Wincoop (2000)
58 Scotland analysis Macroeconomic and fiscal performance
differences language barriers and different accounting practices all reduce the incentive to take on foreign assets
Box 3C Estimates of the ldquoborder effectrdquo on trade McCallum (1995)1 made the original contribution to the border effect literature by looking at the trading patterns of US states and Canadian provinces using a model of trade flows (explained in detail in Annex C) The size of the estimated effects in McCallumrsquos study gave rise to a large number of research papers which have looked to estimate the effect of international borders on trade
Wei (1996)2 looked at a panel of OECD countries to identify the effect of home bias His central estimate implied that an OECD country trades two and half more times with itself than with a trading partner controlling for distance and size Using the 11 EU states and the same approach Nitsch (2000)3 found intra-country trade to be 10 times larger than inter-country trade
Further Wolf (2000)4 found that the border effect does not limit itself to the borders between sovereign states When looking at whether there was a bias in intra-state trade relative to inter-state trade in the US he found intra-state trade was around three times higher than interstate trade
Anderson and van Wincoop (2003)5 argue that McCallumrsquos estimates fail to take account of the fact that relative as opposed to absolute trade costs are what matter for trade between regions The intuition being that it is more attractive to trade with a country or region that has low trade costs relative to the average trading costs across all countries and regions (including regions in the same country) Taking this into account they found that international borders reduce trade by a factor of 54 More recent studies include an industry level study in Spain by Llano and Requena (2008)6 who found that intra-regional trade in Spain exceed intra-national trade by a factor of 30 and furthermore that intra-national trade in Spain exceeds international trade by a factor of 10 Coughlin and Novy (2012)7 perform a similar analysis for the USA comparing intra-state trade with inter-state trade and then comparing that with international trade They find a similar result that there is a larger border effect for trade between states than for trade between states and other countries Pacchioli (2011)8
considers the extent of home bias in EU trade finding that internal trade in EU Member States is three to four times greater than internal trade in US states
Head and Mayer (2013)9 find the average border effect to be a multiple of around seven implying that trade within a country is around 85 per cent higher than trade across an international border between countries
1 National borders matter Canada-US regional trade patterns McCallum (1995) 2 Intra-national versus International trade How stubborn are nations in Global Integration Wei (1996) 3 National Borders and International Trade Evidence from the European Union Nitsch (2000) 4 Intranational Home Bias in Trade Wolf (2000) 5 Gravity with Gravitas A solution to the Border Puzzle Anderson and van Wincoop (2003) 6 The border effects in Spain an industry-level analysis Requena and Llano (2006) 7 Is the International Border Effect Larger than the Domestic Border Effect Evidence from US Trade
Coughlin and Novy (2012) 8 Is the EU internal market suffering from an integration deficit Estimating the lsquohome-bias effectrsquo Pacchioli
(2011) 9 Gravity Equations Workhorse Toolkit and Cookbook Head and Mayer (2013)
Chapter 3 The Border Effect 59
What happens when a border is created Understanding the transition effects
39 These estimates of the border effect are in many cases based on countries that have had a long separate history but they give a clear indication of the likely result as the effects of independence begin to emerge Indeed the evidence suggests that the strong links that currently exist between Scotland and the rest of the UK would be likely to erode over time in the event of independence Reorientation towards new markets would be important in ensuring the effect of the border on trade flows is minimised
310 In the short term historical and cultural ties between Scotland and the rest of the UK may mean that flows initially remain similar to the pre-independence level In the event of Scottish independence it would take time for the close business networks and cultural and historical links that currently exist between Scotland and the rest of the UK to dissolve and for the full impact of introducing an international border between the two partners to materialise Proximity language and cultural links are likely to be important for the trade of goods that depend critically on relationships between customers and firms as all these factors make trading across a border simpler7 While this is likely to dampen any effect of the border over a shorter horizon changes that have a material effect on the ability of Scottish and the rest of the UKrsquos businesses to trade with each other (see for example the discussion in Box 3B) would make it more likely that the existing networks would dissolve as time passes
311 Experience of previous separations can help assess the process of erosion of existing trade links A study by Head Ries and Mayer (2010)8 found that trade flows between countries with strong historical and cultural ties (for example colonial links) which had been severed remained buoyant in the short run but reduced by 65 per cent in the four decades between 1948 and 2006 providing initial evidence of the effect of time on strong historical and cultural ties
312 International experiences of country separation ndash such as the dissolution of Czechoslovakia in 1993 and the independence of the Irish State in 1922 ndash can help shed light on this transition process although it is important to recognise that no two separations are the same
bull The dissolution of Czechoslovakia happened at the same time as the transition from a planned economy to a market economy implying important changes to patterns of trade for both countries There were also marked differences in living standards and productivity between Slovakia and the Czech Republic which were an important causes of the collapse of the monetary union and resulted in Slovakia experiencing a long period of catching up with the Czech Republic over the 1990s and the 2000s See Box 3D for further details and
bull In 1922 Irelandrsquos GDP per capita was around half that of the UK as a whole and was largely agriculture Independence also took place prior to an important wave of trade intensification globally and at the European level See Box 3E for further details
313 Importantly for Scotland these two case studies provide further evidence that institutional and regulatory divergence as well as the dissolution of business networks and historical links can happen when a separation occurs with negative consequences for economic integration and bilateral flows of capital labour and trade A weakening of the large and dynamic flows that currently exist between Scotland and the rest of the UK would create risks for Scotland given its current exposure to trade with the rest of the UK
7 The Institutional Determinants of bilateral trade patterns De Groot et al (2004) This is built on an argument focussed on networks first described by Rauch See Business and Social Networks in International Trade Rauch (2001)
8 The erosion of colonial trade linkages after independence Head Mayer and Ries (2010)
60 Scotland analysis Macroeconomic and fiscal performance
Box 3D Case study of Czechoslovakia On 1 January 1993 Czechoslovakia split into two separate states the Czech Republic and Slovakia The immediate aftermath of the split was characterised by two key choices First the Czech and Slovak Customs Union (CSCU) was formed to minimise the economic cost of a decline in economic ties between the countries Second the states attempted to preserve monetary and economic union
Monetary union was conditional either side could withdraw if fiscal deficits or transfers of private capital between the two countries exceeded preset limits or the shared monetary policy committee failed to agree a common policy But with an uncertain political commitment and no fiscal transfers the currency union lacked credibility Thirty-three days after independence the monetary union failed
Trade data for the Czech Republic and Slovakia show that the share of bilateral trade in total trade has fallen dramatically for both countries in the first decade following the dissolution of Czechoslovakia1 Between 1993 and 2003 the share of total Czech exports going to Slovakia fell from 22 to eight per cent and the share of total Slovakian exports going to the Czech Republic fell from 42 to 13 per cent The value of bilateral trade remained broadly flat for both countries over the same period
Central and Eastern European economies experienced fundamental reforms through the 1990s abandoning the Council for Mutual Economic Assistance and transitioning from a planned economy to a market economy and these trends in trade are likely to capture other effects most notably the opening to trade with the rest of the world However as shown in the chart below the share of trade with other neighbours from the Eastern bloc held up much better suggesting that opening to trade with Western economies was only part of the explanation for the collapse in the share of bilateral trade between the Czech Republic and Slovakia
Share of total exports
Czech Republic
5
10
15
20
25
Per
cen
t
0 1993 1998 2003 2008
To Slovakia To Poland and Hungary
Slovakia
10
15
20
25
30
35
40
45
5
0 1993 1998 2003 2008
To Czech Republic To Poland and Hungary
Source International Monetary Fund Direction of Trade Statistics (IMF dots)
From the IMF Direction of Trade Statistics starting in 1993 1
Chapter 3 The Border Effect 61
Furthermore the chart below shows that since 1993 the increase in trade in the Czech Republic and Slovakia has not been markedly different from the trade performance of other Eastern European states all experiencing strong growth from a low level in 1993
Value of exports to the rest of the world for selected Eastern European countries
0
20000
40000
60000
80000
100000
120000
140000
160000
180000
200000
Slovakia
Czech Republic
Bulgaria
Romania
Slovakia
Poland
Hungary
US
dol
lars
1993 1996 1999 2002 2005 2008 2011
Source International Monetary Fund Direction of Trade Statistics (IMF dots)
Kaminski and Smarzynska (2003)2 note that a number of new obstacles to trade were created along with the creation of two states ndash separate currencies administrative procedures required to control origin of traded goods and ldquocreeping-inrdquo of different technical standards The quick disappearance of monetary union exacerbated the decline in trade as did the devaluation of the Slovak koruna against the Czech koruna and the establishment of a complicated payment system Faced with a large deficit Slovakia introduced other barriers to imports from the Czech Republic including import taxes quotas on imports of nonshyalcoholic beverages and beer and burdensome technical certification procedures
2 Never too late to get together again Turning the Czech and Slovak Customs Union into a stepping zone to EU Integration Kaminski and Smarzynska (2003)
62 Scotland analysis Macroeconomic and fiscal performance
Box 3E Case study of Ireland In 1922 the 26 counties of the Irish Free State gained political independence having been part of the UK since the 1800 Act of Union At that time Ireland traded almost exclusively with the UK ndash 90 per cent of Irelandrsquos total trade was with the UK1 This continued to be the case in the first few years following independence However the ldquoeconomic warrdquo in which Ireland introduced protectionist measures saw the UKrsquos share of total Irish trade drop rapidly from around 90 per cent to 65 per cent (see chart below) After rebounding to near pre-protectionist levels after 1938 the UKrsquos share of Irelandrsquos trade has since been in long-term decline despite a UK-Irish free trade agreement being signed in 19652 This decline may have accelerated slightly after 1973 when both the UK and Ireland entered the European Economic Community causing Irish trade to further divert to other European countries The breaking of the punt-sterling link in 1979 did not appear to have any significant effect on the pattern of trade between the UK and Ireland3 For comparison the share of Scottish exports accounted for by the rest of the UK is approximately 60 per cent
UK Share of Irish Trade
100
20
30
40
50
60
70
80
90
Per
cen
t
10
0
1924 1934 1944 1954 1964 1974 1984 1994 2004
Source Thom amp Walsh 2001
Irish independence is also likely to have reduced Irish trade with the UK first through the consequences of the initial economic war and then through the progressive divergence between the Irish and UK economies despite institutional links such as the Anglo-Irish free trade agreement Thom and Walsh (2001)4 point to the gradual weakening of social and cultural ties as well as the emergence of differences in legal systems both contributed to the decline of trade between Ireland and the UK
Further evidence on how the passage of time has weakened the ties with the UK comes from Fitzsimmons Hogan and Neary (1999)2 who model trade flows between Northern Ireland and the Republic of Ireland While they find trade between the two remains higher than is predicted by their model trade between Northern Ireland and the Republic of Ireland is of a magnitude lower than that estimated for Scotland by the model in this paper
1 The effect of a common currency on trade Ireland before and after the Sterling link Thom and Walsh (2001) 2 The effect of a common currency on trade Ireland before and after the Sterling link Thom and Walsh (2001) 3 The effect of a common currency on trade Ireland before and after the Sterling link Thom and Walsh (2001) 4 The effect of a common currency on trade Ireland before and after the Sterling link Thom and Walsh (2001) 5 lsquoA Gravity model for North-South Tradersquo Fitzsimmons et al (1999)
Chapter 3 The Border Effect 63
How big could the border effect be
314 One way to estimate the likely effect of establishing an international border between Scotland and the UK is to compare current levels of trade and migration with the levels of trade and migration between euro area Member States The relationships between euro area countries have many of the same characteristics as the Scottish Governmentrsquos proposed model of Scottish independence and its relationship with the continuing UK they are members of the EUrsquos single market with a free movement of people share a common currency and in a number of cases a common border and language and social and cultural links are often strong
315 As already discussed earlier Scotland analysis papers have already established that such an outcome is unlikely In particular the Scotland analysis Currency and monetary policy paper explained that the economic rationale for the UK to agree to enter into a formal sterling union with a separate state is not clear But even if the continuing UK were to agree to a formal sterling union trade and migration flows between an independent Scotland and the continuing UK might be expected over time to resemble the flows between euro area Member States A summary of the approach used to calculate the border effect is described in Box 3F with a more detailed explanation set out in Annex C In brief the approach is to look at the effect of replacing the current relationship between Scotland and the rest of the UK with a relationship similar to that of euro area Member States after allowing for differences in economic size distance to markets and language
316 The results presented in this paper are based on the lower end of estimated effects to reflect the huge uncertainty around the future path of Scotland as an independent economy as well as the close cultural and social ties between Scotland and the UK Taking these factors into account the results remain in line with those obtained in other empirical studies Actual outcomes will depend critically on how policies adopted by the two states affect the ease of trading across the border and hence the rate at which current high levels of integration might be eroded
317 Taking the lower end of the estimates suggests that exports from an independent Scotland to the continuing UK would be 83 per cent lower after 30 years than if Scotland were to remain a part of the UK Exports from the rest of the UK to Scotland would be 77 per cent lower Migration flows could fall below ten thousand per annum in both directions compared with average rates of over 40000 people per annum in recent years
64 Scotland analysis Macroeconomic and fiscal performance
Box 3F Estimating the trade and migration effects if Scotland and the rest of the UK were to adopt a euro area-like relationship ndash an empirical study The first step is to identify how the patterns of trade and migration between different euro area Member States are influenced by the characteristics of any pair of euro area partners This is done by estimating a ldquogravityrdquo model of trade Put simply these models estimate trade flows based on the economic size of the countries involved the distance between them and other factors relevant to trade such as the use of a common language
The estimated effects of each characteristic are then applied to Scotland and the rest of the UK (given their size proximity and common language) to calculate what trade and migration flows could be if the relationship were similar to that between euro area Member States A more detailed explanation of the methodology can be found in Annex C
The calculated flows can then be compared with those currently observed between Scotland and the rest of the UK The difference between the flows gives an idea of the possible order of magnitude of the effect of the border under the current proposals from the Scottish Government
Results from estimating the trade gravity equation
Pooled Ordinary Least Squares
(1) Range of Predicted Values for Scottish Exports to rUK 2002-2011 (pound billion) 45-55
(2) Actual Value of Scottish Exports to rUK 2002-2011 (pound billion) 325
1-[(1)(2)] Range of Implied Border Effect 83-86
(1) Range of Predicted Values for rUK Exports to Scotland 2002-2011 (pound billion) 80-100
(2) Actual Value of rUK Exports to Scotland 2002-2011 (pound billion) 426
1-[(1)(2)] Range of Implied Border Effect 77-81
Note Equation fully specified in the Annex
Source HMT calculations
Results from estimating the migration gravity equation
Pooled Ordinary Least Squares
(1) Range of Predicted Values for Scottish Migration to rUK 2002-2010 4292-8158
(2) Actual Value of Scottish Migration to rUK 2002-2010 43809
1-[(1)(2)] Range of Implied Border Effect 81-90
(1) Range of Predicted Values for rUK Migration to Scotland 2002-2010 2346-4555
(2) Actual Value of rUK Migration to Scotland 2002-2010 52195
1-[(1)(2)] Range of Implied Border Effect 91-96
Note Equation fully specified in the Annex
Source HMT calculations
Chapter 3 The Border Effect 65
The effect on living standards
318 Barriers to the flow of goods and labour between economies are likely to reduce a countryrsquos level of output and lower living standards (see Box 3G) This means that the potential effect of changes in trade levels due to the creation of an international border between Scotland and the rest of the UK can be translated into an effect on real income (Arkolakis Costinot and Rodriguez-Clare (2012)9 suggest a straightforward framework) Employing this methodology the loss of trade implied by the analysis in this paper suggests a reduction in real income in Scotland of around four per cent after 30 years10
Applying the same methodology to the UK implies a reduction in real income of around 02 per cent The reason for the contrasting results rests on Scotlandrsquos dependence on trade with the continuing UK which accounts for around 60 per cent of total Scottish exports compared to Scotland accounting for just 13 per cent of continuing UK exports11
319 There is a great deal of uncertainty over the time period which this effect is likely to occur and the extent to which the loss of trade between Scotland and the continuing UK may be offset by the reorientation of trade towards other parts of the world Head et al (2010)12
use a period of four decades to estimate the fall in trade from the breaking of colonial links while evidence presented from the case study of Czechoslovakia shows that the erosion of trade links may happen over a shorter timescale Further evidence on integration effects on sovereign states forming a currency union suggests a period of 20 years (Bun and Klassen (2002))13 The table below summarises the link between changes in trade and real incomes including the impact on growth rates over 30 years
Table 3C Impact of Scottish Independence on output and growth in Scotland and the continuing UK
Scotland Continuing UK
Fall in bilateral exports (per cent) 83-86 77-81
Total Effect on real income (percentage points) -4 -02
Effect of the growth rate of real income over 30 years -013 -002 (percentage points)
9 New Trade models Same old Gains Arkolakis et al (2012) 10 The details of this analysis are set out in Annex C 11 The global connections survey has the rest of the UK accounting for 66 per cent of Scottish exports in 2011
whilst the Scottish National Accounts Project 2012Q3 has the rest of the UK accounting for 58 per cent of Scottish exports in 2011
12 The erosion of colonial trade linkages after independence Head Mayer and Ries (2010) 13 Has the Euro increased trade Bun and Klassen (2002)
66 Scotland analysis Macroeconomic and fiscal performance
Box 3G The effect on real incomes from declining trade flows alternative Scenarios based on European Countries Another way of gauging the impact of a reduction in trade flows on real income in Scotland is to compare the share of expenditure on domestic goods with a range of small European countries
Countries gain from trade through sourcing goods from other countries with lower production costs That way a country benefits from more advanced technology and productivity abroad via imports A reduction in gross trade flows all else being equal implies that a country will spend a higher proportion of its income on domestic goods
Using the Arkolakis et al (2012)1 methodology Table 3D highlights that if the share of expenditure on domestic goods in Scotland increased in line with other small independent countries in Europe there would be a reduction in real income While the results below are also consistent with the fall in trade between Scotland and the continuing UK estimated using the gravity model the size of the reduction depends importantly on how and to what extent Scotland may be able to offset the expected decrease in trade with the UK through trade with other countries
Table 3D Effect of decline in trade flows on real income
Share of expenditure on domestic goods Difference with Scotlandrsquos Effect on share of expenditure on real income domestic goods in 2011
Austria in 2009 81 +11ppt -29
Denmark in 2009 85 +15ppt -38
Finland in 2009 87 +17ppt -43
Ireland in 2007 83 +13ppt -33
Portugal in 2006 83 +13ppt -33
Sweden in 2008 82 +12ppt -31
Source Latest available data from OECD STAN indicators Rev3 2011 and Scottish National Accounts Project Tables from 2012Q3
The methodology is described in more detail in Annex C
1 New Trade models Same old Gains Arkolakis et al (2012)
Conclusion 320 Evidence suggests that international borders reduce economic integration impeding flows
of goods capital and labour even where countries are members of single markets with low formal barriers to trade the so called ldquoborder effectrdquo Empirical estimates suggest that even if an independent Scottish state was part of the European Single Market with the continuing UK and the Scottish Government was able to achieve its aims of a formal sterling currency union Scottish exports to the continuing UK could be reduced by around 80 per cent Migration flows could fall below 10000 per annum in both directions compared with average rates of over 40000 people per annum in recent years As an impediment to trade flows the border is likely to reduce the level of real income in the Scottish economy by four per cent over a 30 year period While Scotland can look to new markets to offset this drag on growth it is not clear whether this would compensate for the decline in trade with the continuing UK Even if Scotland did increase trade with other countries the income lost in the intervening period would not be regained
Chapter 4 Managing volatility in the public finances
In the event of independence Scotland would be directly exposed to a narrower tax revenue base and more volatile fiscal position A stabilisation mechanism to smooth the public finances is likely to be required An independent Scottish state could try to smooth its public finances as a small country and manage declining oil and gas reserves by establishing an oil fund
While the economic rationale for establishing one is clear an oil fund would come at a price Scotland is currently far from having the sustainable fiscal position that would make such a fund viable Implementing an oil fund in a similar way to Norway would imply very significant cuts to public spending or tax increases over and above the plans that have been set by the UK Government to repair the impact of the financial crisis Based on forecasts by the Centre for Public Policy for Regions for an independent Scotland to start an oil fund in 2016-17 from a balanced budget additional fiscal consolidation of 51 per cent of GDP (pound84 billion in real terms) would be needed That implies spending cuts of 13 per cent from current levels or onshore tax rises of 18 per cent To then begin contributing to the fund more fiscal consolidation would be required on top of that
It would take considerable time to build up a fund of adequate size to manage volatility in the public finances Assuming an independent Scotland started a Norwegian-style oil fund in 2021-22 Scotlandrsquos oil fund after 20 years of contributions would reach less than a tenth of the current size of the Norwegian fund (after 17 years of contributions)
Scotland achieves many of the benefits of an oil fund within the UK The UKrsquos integrated fiscal model provides a very stable flow of Scottish expenditure without Scotland having to run the very tight fiscal policy required for an oil fund
41 Chapter 2 explained that firstly Scotland benefits from the more diverse UK stabilising the Scottish fiscal position and the volatile nature of its revenue base in particular North Sea oil and gas Secondly Scotland benefits from the UKrsquos broader tax base which allows stable public spending to be resourced across a wider and more diverse set of revenue streams
42 There would be two fundamental fiscal consequences if Scotland became an independent country
bull an immediate end to Scotlandrsquos inclusion within the UKrsquos fiscal model which would lead to the end of risk-sharing through pooled and redistributed tax revenues (fiscal
70 Scotland analysis Macroeconomic and fiscal performance
transfers) Scotland would therefore rely on a narrower and more volatile tax base to fund spending on public services and
bull the break-up of the UKrsquos integrated tax system with a completely separate tax system being implemented in Scotland This could lead to implications for business individuals and both governments
The case for an oil fund and its implications 43 In the event of independence Scotlandrsquos reliance on oil and gas revenue would leave its
public finances vulnerable to fluctuations in prices and production and a declining stock of oil over time Managing the challenge of a narrower and more volatile revenue base is essential to ensuring fiscal sustainability A stabilisation mechanism is likely to be required The Scottish Governmentrsquos Fiscal Commission Working Group recommended that it ldquoshould seek in principle to establish a stabilisation fund such as an Oil Fundrdquo1
44 Many small and emerging countries with similar reliance on revenues from commodities have established some form of stabilisation fund Funds vary in their transparency but the largest appear to be those of Norway Saudi Arabia the United Arab Emirates Kuwait Qatar and Russia The Norwegian oil fund is most often cited as a model for Scotland to follow More detail on the Norwegian experience is set out in Box 4A
45 Only a small share of UK total revenue comes from oil and gas and the UK has a broad tax base overall meaning the UK does not require an oil fund to manage volatility in oil revenues Oil and gas receipts have averaged 15 per cent of overall UK revenue fluctuating within a range of 15 percentage points compared with average oil and gas receipts of 135 per cent for Scotland since devolution fluctuating within a range of 15 percentage points2 The merits of an oil fund were considered by the UK Government when North Sea oil and gas was discovered in the 1970s but the government of the day decided not to set up such a fund Other large developed economies have chosen not to set up national oil funds including the United States and Canada despite being the second and sixth largest oil producers in the world and receiving revenues at the federal level3
Economic rationale for an oil fund 46 The concept of an oil fund is to divert oil revenues from a governmentrsquos finances to a
standalone fund that generates income The income can be withdrawn now or in the future to improve the governmentrsquos onshore fiscal position Economically the principle behind setting up an oil fund is to maintain the nationrsquos capital stock by creating a financial asset above ground to offset the depletion of oil below ground By maintaining the nationrsquos capital stock an oil fund can transfer resources between generations It allows future generations to benefit from the future financial market value of the fund thus providing them compensation for the depletion of oil by the current generation
47 An oil fund can also provide an economic stabilisation function to lessen the impact of changes in oil production and oil price volatility on the wider economy In a country heavily reliant on oil exports volatility in the international oil price can have significant negative
1 The Scottish Government (2013) Fiscal Commission Working Group First Report Macroeconomic Framework page 20
2 Scottish Government GERS HM Revenue amp Customs Government Revenues from UK oil and gas production Assuming a geographical share of North Sea oil and gas revenues
3 International Energy Agency (2012) Key World Energy Statistics
Chapter 4 Managing volatility in the public finances 71
effects on wider prices in the economy and the exchange rate As is discussed in Scotland analysis Currency and monetary policy (see Box 1C page 35)4 an increase in oil prices or production can lead to an appreciation of the real exchange rate (when exchange rates are flexible) andor higher domestic inflation This can have a negative impact on the non-oil export sector by making it uncompetitive (ldquoDutch diseaserdquo)5 This can have long-term negative costs for the economy especially if the non-oil export sector provides wider benefits to the economy (eg from knowledge spillovers) Volatility in the real exchange rate of the non-oil sector can also discourage investment
48 Although the outcome of any negotiations that would be required over the split of oil and gas reserves in the event of independence is uncertain an independent Scottish state will be much more exposed to the oil and gas sector than the UK economy as a whole The real exchange rate of an independent Scottish state would be expected to be much more directly influenced by changes in the price or production of oil and gas An oil fund could help mitigate these effects regardless of the currency arrangement in a monetary union either with sterling or the euro an oil fund could provide a useful counter for occasions when a one-size-fits-all monetary policy is not appropriate for an independent Scotland if an independent Scotland had its own currency an oil fund could help to dampen the negative effects on non-oil export sector competitiveness (Dutch disease) through oil fund investments abroad
Fiscal implications of an oil fund 49 While the economic rationale for establishing one is clear an oil fund would come at a
price Currently revenues from oil and gas fund public spending in Scotland (and across the UK) If any government in an independent Scotland wished to establish an oil fund it would need to divert oil and gas revenues from the governmentrsquos finances to a standalone fund the money cannot be spent twice That implies raising onshore tax revenues or cutting spending in order to maintain the governmentrsquos level of fiscal deficitsurplus An independent Scottish state is unlikely to be able to contribute significantly to an oil fund without taking radical action to put its public finances in a much stronger position As the Centre for Public Policy for Regions (CPPR) comment ldquothe Scottish Government would need to rely on most or all of the tax revenues from the North Sea simply to attain the current implicit level of annual fiscal deficit This would mean that no such revenues would be available to build up a Sovereign (Oil) Fund or at least not without tax increases or budget cutsrdquo6
410 Even phased over a number of years once the current challenges in the public finances have been addressed the fiscal adjustment required is very large How much fiscal policy would need to be tightened over the medium term to afford an oil fund would depend on the evolution of Scotlandrsquos economy and public finances The analysis below sets out the potential scale of the challenge
4 HM Government (2013) ldquoScotland analysis currency and monetary policyrdquo 5 ldquoDutch diseaserdquo is named after the economic crisis that affected the Netherlands in the 1960s following the
discovery of North Sea gas and the sharp appreciation in the Dutch guilder 6 Centre for Public Policy for Regions (2013) ldquoReflections on the latest Oil and Gas related analysis by the Scottish
Government and the Office for Budget Responsibilityrdquo
72 Scotland analysis Macroeconomic and fiscal performance
Box 4A Norwayrsquos oil fund Until the mid-1990s a large proportion of Norwegian oil revenues were used to improve the governmentrsquos finances In 1990 Norway chose to establish an oil fund now known as the Government Pension Fund Global (GPFG) to ensure that the economy would not remain dependent on this non-renewable resource The first net contribution of revenues to the fund took place in May 1996 By the end of 2012 the market value of the GPFG was over pound400 billion using current exchange rates (NOK 3816 billion over 150 per cent of GDP) By 2019 the fund is forecast to be worth over pound675 billion (NOK 6410 billion)1
Under a mandate set by the Ministry of Finance the GPFG is managed by Norges Bank Investment Management (NBIM) As NBIM set out ldquothe fund was set up to give the government room for manoeuvring in fiscal policy should oil prices drop or the mainland economy contract It also served as a tool to manage the financial challenges of an ageing population and an expected drop in petroleum revenue The fund was designed to be invested for the long term but in a way that made it possible to draw on when required The fund was called the Petroleum Fund until 2006 when it was renamed the Government Pension Fund Global The change highlighted the fundrsquos role in saving government revenue to finance an expected increase in future public pension costs Despite its name the fund has no formal pension liabilitiesrdquo2
The fundrsquos capital inflow consists of all government oil revenue net of government expenditure on petroleum activities The capital is invested internationally to avoid overheating the Norwegian economy 60 per cent of the fund is invested in equity 35 to 40 per cent in fixed-income markets and the remainder in property
Norway only contributes to the fund when the overall budget including oil revenues is in surplus For the first years of the fund from 1990 to 1996 the public finances were in deficit so no contributions were made This fiscal position was relatively unusual for Norway which since the Second World War has generally run a budget surplus of two-four per cent of GDP3
The government can make transfers back from the fund each year to improve the public finances which partly offset the oil revenues that flow into the fund In 2001 the government set a spending rule that no more than the expected return of the fund estimated at four per cent of the fundrsquos capital in real terms should be returned to the governmentrsquos finances each year Fiscal policy is set in line with that On a cyclically-adjusted basis the non-oil deficit is set to broadly match the four per cent return over time while allowing for some flexibility around this Figure 1 set outs the flow
Norwegian oil fund mechanism
Oil revenues and return on
investments
Fund Transfer to finance
non-oil budget deficit
Non-oil revenues
Public finances
Expenditure
Spending rule Spend only the annual real return on the fund
(estimated at 4 annually)
Chapter 4 Managing volatility in the public finances 73
The GPFG has been described as a model for other natural resource exporters and there is a broad consensus in Norway and internationally on its strengths including from the IMF However like any policy it is not a panacea In its assessment of the Norwegian economy the IMF sets out three issues for the future4
bull the expected real return assumption of four per cent per year might prove too optimistic The average return to date has been below four per cent
bull Norwayrsquos long-run health pension and other costs associated with an aging population are ldquofar in excess of what could be financed from the GPFGrdquo The IMFrsquos assessment is that in the long term Norway will need to raise taxes (from already-high levels) cut other expenditure sharply or take other measures to contain age-related pressures and
bull if oil prices were to enter a prolonged decline during the remaining years of near-peak production the total assets of the GPFG could be significantly lower than expected If fiscal transfers from the fund did not reduce in line with this the fund would be further depleted
1 Norwegian Ministry of Finance (available at wwwregjeringennoendepfin Norges Bank Investment Management (available at wwwnbimnoen)
2 wwwnbimnoenAbout-usGovernment-Pension-Fund-Global 3 Martin Skancke (2003) ldquoFiscal policy and petroleum fund management in Norwayrdquo in Jeffrey M Davis (ed)
Fiscal Policy Formulation and Implementation in Oil-Producing Countries Washington DC International Monetary Fund
4 International Monetary Fund (2013) Concluding Statement of IMF Article IV Mission to Norway
411 As an accepted model for developed resource-exporting countries the Norwegian experience offers several important lessons for an independent Scottish state in setting up an oil fund As set out in Box 4A Norway only contributes revenues to the fund when its overall public finances are in surplus Despite creating the fund in 1990 it was not until May 1996 that any contributions were made reflecting the fact that Norway ran a budget deficit over this period
412 If an independent Scottish state were to adopt the Norwegian model and only contribute to a fund when it has a budget surplus it would face a difficult set of fiscal choices Scottish Government figures show that after the oil peaks of the 1980s Scotland has run a fiscal surplus only once The average position from 1999-00 to 2011-12 is a deficit of 37 per cent of GDP even assuming a geographical share of oil revenues7
413 The gap that Scotland faces to achieve fiscal balance (neither surplus nor deficit) and start a fund can be quantified in various ways
bull as set out above Scotlandrsquos average fiscal position since devolution is a deficit of 37 per cent of GDP or pound52 billion8 A fiscal consolidation of pound52 billion equates to reducing public spending in Scotland by fully eight per cent from current levels Or equivalently increasing onshore tax revenues by 11 per cent and
bull the Centre for Public Policy for Regions (CPPR) has produced medium-term projections for the Scottish public finances as part of the UK In 2016-17 they project a deficit for Scotland (including a geographic share of oil revenues) of 51 per cent9
7 Scottish Government GERS 8 In real terms 2011-12 prices calculated using the UK GDP deflator outturn and forecast 9 Centre for Public Policy for Regions (2013) ldquoAnalysis of Scotlandrsquos Past and Future Fiscal Positionrdquo
74 Scotland analysis Macroeconomic and fiscal performance
of GDP or pound84 billion in real terms10 That implies spending cuts of 13 per cent from current levels more than three-quarters of what the Scottish Government spent on health last year or onshore tax rises of 18 per cent
414 For context on the level of spending adjustments required under the UKrsquos current fiscal consolidation programme Scotlandrsquos total departmental spending is set not to fall in cash terms but increase by around one per cent from 2010-11 to 2015-16
415 The implied spending cuts or tax rises are very large and difficult to imagine without fundamental shifts in the shape of Scotlandrsquos public sector and society It is important to be clear that fiscal consolidation on this scale is what is required just to be in a position to start contributing to an oil fund as Norway was in 1996 The spending cuts or tax rises set out above are what is needed before the first revenues flow into the oil fund To build up an effective fund Scotland would of course need to divert a significant proportion of its oil revenues from the public finances To do that and maintain a balanced budget would require further consolidation
416 In 2016-17 the independent Office for Budget Responsibility forecasts that UK oil and gas revenues will be around pound48 billion11 or pound44 billion in real terms (2011-12 prices) An independent Scottish statersquos share of these revenues is far from clear but if revenues were split geographically as of 2011-12 Scotlandrsquos share would amount to around pound41 billion in real terms If in 2016-17 Scotland chose to allocate these revenues to a fund it would require further fiscal consolidation of this amount on top of the spending cuts or onshore tax rises set out above in order to maintain a balanced budget Based on the CPPR forecast for the underlying deficit that takes the total spending cuts or tax rises required by 2016-17 to pound125 billion in real terms In total spending would have to fall by 19 per cent from current levels or onshore taxes rise by 27 per cent It is very difficult to see how changes of this magnitude would be credible for a newly-formed Scottish state
417 So an independent Scottish state may well choose to see contributing to an oil fund as a long-term ambition rather than a realistic near-term possibility ndash as acknowledged by the Fiscal Commission Working Group12 That might give more time to phase in a fiscal adjustment However it would come at the cost of spending rather than saving the declining oil revenues in the meantime diminishing the total size and effectiveness of the eventual fund And importantly the fiscal challenge will not necessarily become any easier to tackle after the current programme of consolidation is complete An independent Scottish state is likely to face a significant burden of age-related fiscal pressures and higher debt servicing costs as a proportion of national income than it currently pays as part of the UK Future Scotland analysis work will explore these issues in more detail
418 Even if an independent Scotland were able radically to adjust fiscal policy and implement an oil fund it would not resolve Scotlandrsquos fiscal challenges And while Norwayrsquos fund has brought it great benefits comparisons with the hypothetical fund of an independent Scotland should be made with caution
bull comparisons with the wealth of Norwayrsquos fund should take into account the very different resource positions of the two countries The Norwegian area of the North Sea has substantially more oil remaining than the UKrsquos It is estimated that Norway has around 47 billion barrels of oil equivalent (boe) remaining while up to 20 billion boe are
10 In real terms 2011-12 prices calculated using the UK GDP deflator outturn and forecast 11 Office for Budget Responsibility (March 2013) Economic and fiscal outlook 12 ldquoIn the near term [an independent Scottish state] would therefore have to use North Sea revenues to fund
current public services and reduce public sector borrowingrdquo Page 167 Scottish Government (2013) Fiscal Commission Working Group First Report Macroeconomic Framework
Chapter 4 Managing volatility in the public finances 75
estimated to remain in the UK Continental Shelf13 Norwayrsquos remaining reserves are therefore at least double the UKrsquos of which the reserves of an independent Scottish state would form a proportion
bull an independent Scottish state may well find that even a very large oil fund proves insufficient on its own to tackle future fiscal costs Like most developed countries Norway faces a challenging demographic profile The IMF set out that despite the oil fundrsquos vast size (over 150 per cent of GDP) healthcare pension and other ageing costs will still be ldquofar in excess of what could be financed from the [fund]rdquo14
bull as the CPPR set out ldquothe government of an independent Scotland would be more reliant than Norway on using tax revenues from the North Sea to balance its budgetrdquo ldquoat present (2012-13) levels of expected UK North Sea tax revenues Scotland would need to use all such funds just to compensate for the loss in (higher) spend per head on public services as a result of leaving the UKrdquo15 Therefore it would take considerable time for an independent Scotland to build up an oil fund of significant size so the fund is unlikely to be in a position to smooth fiscal volatility for several years and
bull assuming revenues are invested in a portfolio of assets the fund itself is exposed to volatility in the value of the underlying investments Over time this should be substantially lower than that of oil revenues But like any investment an oil fund is not a risk-free proposition and the more ambitious the expected investment returns are the more risky it is likely to be
419 The analysis of receipts and spending volatility within the UK in Chapter 2 shows how Scotland achieves many of the key benefits of an oil fund simply by remaining within the UK The UKrsquos integrated fiscal model has provided a very stable flow of Scottish expenditure without the need for Scotland to run the fiscal surpluses required for an oil fund
420 Alongside its recommendation for Scotland to establish an oil fund the Fiscal Commission Working Group set out an alternative option for a stabilisation fund ndash a ldquodeficit-funded oil fundrdquo In this model Scotland would contribute oil revenues into a fund even while running a fiscal deficit When oil revenues exceed forecasts the difference (ldquoupside surpriserdquo) could be transferred Whilst this is technically possible unlike the Norwegian fund this model would imply increasing government borrowing and it is a not a model commonly associated with sovereign states operating oil funds for the reasons described below
bull if only upside surprises on oil revenues were used building a fund of an effective size is likely to take a very long time given no contributions would be made in the average year Modelling later in this section finds that a stabilisation fund would reach only a little over 2 per cent of GDP after a decade and little over 35 per cent of GDP by 2040-41 ndash far beneath the level required to provide effective stabilisation in a fiscal crisis
bull establishing such a fund eliminates the benefit of upside surprises to the budget from oil and gas revenues coming in above forecast That is equivalent to increasing the
13 Available at Norwegian Petroleum Directorate website wwwnpdno (converted into barrels of oil equivalent) Available at Department for Energy amp Climate Change website wwwgovukgovernmentorganisations department-of-energy-climate-change
14 International Monetary Fund (2013) Concluding Statement of IMF Article IV Mission to Norway 15 CPPR (2013) ldquoReflections on the latest Oil and Gas related analysis by the Scottish Government and the Office
for Budget Responsibilityrdquo
76 Scotland analysis Macroeconomic and fiscal performance
central expected path of borrowing since whilst upside surprises are diverted from the budget downside surprises (revenues undershooting forecasts) would need to be financed by higher borrowing As Martin Skancke commented in an IMF publication ldquofrom an asset management point of view [contributing to an oil fund whilst running a budget deficit] would hardly make senserdquo since ldquothe government would be forced to borrow money to cover allocations to the fundrdquo16 Moreover markets may demand higher interest rates on this borrowing And the extra borrowing adds to debt and comes with a debt interest cost (even without higher interest rates) This would reduce the room for spending on public services and
bull finally because contributions to the oil fund in this manner would add to borrowing and debt it is far from clear that the oil fund would be able to play an effective stabilisation role during a fiscal crisis
421 So the option of a ldquodeficit-funded oil fundrdquo is unlikely to escape fully the requirement for significant fiscal tightening to achieve an oil fund of a meaningful size and effectiveness
422 The scale of the fiscal challenge reinforces the fact that the task of smoothing volatility in oil revenues is far better served by the UKrsquos integrated fiscal model As set out in Chapter 2 by pooling tax receipts the UK has delivered stable and secure Scottish spending without the need for the very tight fiscal policy required to start an oil fund
Modelling an oil fund for an independent Scottish state 423 The section above has set out the radical scale of the spending cuts or tax rises needed
for an independent Scottish state to be able to contribute to an oil fund This section quantifies what such an oil fund might look like if an independent Scotland chose to undertake that level of spending cuts and tax rises
424 As set out above in Box 4A Norwayrsquos fund is a potential model for Scotland Norway contributes all of its offshore revenues to its oil fund and withdraws the real-terms return of the investments in the fund each year to benefit the public finances Norway assumes that the long-term average real return of the fund is 4 per cent and withdraws approximately that amount per year
425 What might such a fund look like for an independent Scottish state The key variables are the future path of oil revenues the year in which the fund is started what percentage of revenues flows into the fund each year what percentage of returns are withdrawn each year and the investment return of the fund
426 The future path of oil revenues reflects the independent Office for Budget Responsibilityrsquos central forecast as set out in the 2013 Fiscal sustainability report According to the OBR there is an equal probability of revenues coming in higher or lower An independent Scottish statersquos share of these revenues is far from clear but for the purposes of this modelling revenues are split geographically The Scottish share of UK revenues is assumed to remain at the 2011-12 percentage (94 per cent) All oil revenues flow into the fund and the real return of the fund is withdrawn each year following the Norwegian model As per the Norwegian fund the real return over time is assumed to be four per cent This may be optimistic the IMF note that actual returns have fallen short of four per cent historically17
16 Martin Skancke (2003) ldquoFiscal Policy and Petroleum Fund Management in Norwayrdquo in Jeffrey M Davis (ed) Fiscal Policy Formulation and Implementation in Oil-Producing Countries Washington DC International Monetary Fund
17 ldquoThe average rate of return over the life of the GPFG has been below 4 percent and experience with similar asset portfolios over longer periods indicates that returns are likely to be lowerrdquo International Monetary Fund (2013) Concluding Statement of IMF Article IV Mission to Norway
Chapter 4 Managing volatility in the public finances 77
427 The assumptions set out above for modelling a Norwegian-style oil fund for Scotland and the steps to calculate the estimated increase in the value of the fund in a given year are set out in the table below
Modelling a Norwegian-style oil fund for Scotland assumptions and methodology
Steps to calculate estimated increase in the nominal value of the oil fund in a given year of operation
Source
UK oil revenue forecast for that year OBR 2013 Fiscal sustainability report
multiplied by
Scottish geographical share of revenues in 2011-12 (94 per cent) Scottish Government Government Expenditure and Revenue Scotland 2011-12
equals
Notional Scottish geographical oil revenue forecast in that year Calculation
plus
Nominal annual return on the fund (4 real return per year + GDP HM Treasury calculation using annual real return of 4 per cent deflator)a consistent with assumptions of Norwegian fund GDP deflator
from OBR 2013 Fiscal Sustainability report
minus
Withdrawal in that year (equal to an assumed 4 real return on the value of fund at the end of that year)b
HM Treasury calculation
equals
Net increase in the nominal value of the fund in that year Calculation
a In each year the notional nominal annual return on the fund is calculated by multiplying the nominal rate of return ndash 4 per cent in real terms (consistent with real return assumed in Norwegian fund) plus the GDP deflator of 22 from 2021-22 used in the OBR 2013 Fiscal sustainability report ndash by the nominal value of the fund at the end of the previous year plus the oil revenue inflow in the current year gross of withdrawals This is the most favourable assumption for the calculation of returns in fact oil revenue is more likely to flow in over the course of the year and withdrawals may not be at the end of the fiscal year Both of these effects would serve to reduce actual returns
b In each year the withdrawal is calculated by multiplying the real rate of return ndash 4 per cent in real terms (consistent with real return assumed in Norwegian fund) ndash by the nominal value of the fund at the end of the current year (ie the nominal value of the fund at the end of the previous year plus the oil revenue inflow in the current year)
428 As set out above the fiscal consolidation needed to start an oil fund in 2016-17 and contribute all oil revenues is a massive pound125 billion in real terms implying 19 per cent lower public spending or 27 per cent higher onshore taxes So the central scenario modelled in this paper assumes that an oil fund is started five years later in 2021-22 Starting later would still require an extremely challenging fiscal consolidation not least as demographic pressures on the public finances will be starting to bite
429 Chart 4A models an oil fund for Scotland Some commentators have focussed on the total size of the fund But the annual withdrawal to benefit the public finances is a better measure of the benefits of an oil fund across generations
78 Scotland analysis Macroeconomic and fiscal performance
Chart 4A Oil fund including all oil revenues starting in 2021ndash22
00
02
04
06
08
10
12
14
16
18
20
Withdrawals
Oil revenue inflow
Per
cen
t of G
DP
2016ndash17 2020ndash21 2024ndash25 2028ndash29 2032ndash33 2036ndash37 2040ndash41
Source OBR Fiscal sustainability report (July 2013) OBR Economic and fiscal outlook (March 2013) HM Treasury calculations
430 If all offshore revenues were contributed to an oil fund it could be expected to provide a real return of 05 per cent of GDP a year from 2033-34 to 2040-41 to benefit the Scottish public finances (equal to the four per cent real return assumed on the fund) In 2011-12 prices that averages around pound1 billion per year Following the Norwegian rule that would allow Scotland to run an onshore deficit of around 05 per cent of GDP in those years
431 By 2030-31 the total size of the fund would reach around 10 per cent of GDP (almost pound20 billion in 2011-12 prices) By 2040-41 almost two decades after it was started the fund would reach almost 13 per cent of GDP (pound32 billion in 2011-12 prices)
432 On the face of it the total size of the fund may appear large But put in context it is in fact unlikely that an oil fund would be large enough meet any of the needs of an independent Scottish state
bull In principle an oil fund may improve the public finances and smooth volatility However a return of only around 05 per cent of GDP a year in the long term is very small in the context of Scotlandrsquos overall public finances
bull In the early years when oil revenues are larger and hence volatility has a bigger impact the return of the fund would be even smaller averaging just 02 per cent of GDP over the first five years Since devolution North Sea revenues have varied up or down by around 14 per cent of onshore GDP each year This suggests that in the medium term returns on an oil fund would be far from sufficient to counter volatility to the public finances from oil revenues and
bull An oil fund may also be used to save for future fiscal costs such as demographic pressures The IMF judges that Norwayrsquos fund at over 150 per cent of GDP after 17 years of contributions is not nearly sufficient to its tackle future fiscal costs And Scotlandrsquos oil fund after 20 years of contributions would reach less than a tenth of the current size of the Norwegian fund Moreover a report on demographics from the Scottish Parliament Finance Committee shows that Scotland is likely to face substantially more acute demographic pressures than Norway18
18 Scottish Parliament Committee (2013) ldquo2nd Report 2013 (Session 4) Demographic change and an ageing populationrdquo
Chapter 4 Managing volatility in the public finances 79
433 Box 4B sets out two alternative scenarios one in which an independent Scottish state chose to undertake the unprecedented spending cuts or tax rises required to start a fund in 2016-17 And a second in which Scotland establishes a ldquostabilisation fundrdquo while continuing to run a deficit as suggested by the Fiscal Commission Working Group
434 This analysis shows that not only does an oil fund require substantial fiscal consolidation under a realistic forecast of oil revenues and investment returns the benefits to Scotlandrsquos long-term public finances are relatively small As set out earlier in this chapter the objectives of establishing an oil fund to smooth volatility spread offshore revenues over time and save for future fiscal costs are all valid But each is far better served by Scotland remaining within the UKrsquos integrated fiscal model
Box 4B Alternative scenarios for a Scottish oil fund Starting a Norwegian-style oil fund in 2016-17
Although it is difficult to imagine in practice it is possible that an independent Scottish state could choose to undertake the unprecedented spending cuts or tax rises required to balance the onshore fiscal budget and start an oil fund in 2016-17 Given the benefit of contributions in earlier years when oil revenues are higher than the long-term average the total size of the fund and its returns would of course be larger the earlier the fund started The fund would return 07-08 per cent of GDP a year between 2026-27 and 2040-41 allowing Scotland to run an average onshore fiscal deficit of that level in those years The total size of the fund would peak at 19 per cent of GDP in the late 2030s after over 20 years of contributions compared with the Norwegian fund which currently stands at over 150 per cent of GDP (after 17 years of contributions) and then fall gradually as a percentage of GDP reflecting declining oil revenue inflows As set out earlier a Scottish fund of that magnitude is still insufficient to meet any of the challenges that an oil fund may be expected to solve
80 Scotland analysis Macroeconomic and fiscal performance
Oil fund including all oil revenues starting in 2016ndash17
35
30
Oil revenue inflow
25 Withdrawals
Per
cen
t of G
DP 20
15
10
05
00 2016ndash17 2020ndash21 2024ndash25 2028ndash29 2032ndash33 2036ndash37
Source OBR Fiscal sustainability report (July 2013) OBR Economic and fiscal outlook (March 2013) HM Treasury calculations
A ldquodeficit-funded oil fundrdquo the Fiscal Commission Working Group model
As set out earlier in Chapter 4 the Fiscal Commission Working Group (FCWG) set out an alternative option for a stabilisation fund In this model Scotland would contribute oil revenues into a fund even while running a deficit When oil revenues exceed forecasts the difference (ldquoupside surpriserdquo) could be transferred Unlike the Norwegian fund this model would imply increasing government borrowing as higher revenue than forecast would be diverted into the fund whilst lower revenues than forecast would need to be funded from higher borrowing There are a number of challenges associated with this approach both in principle and practice
The chart below addresses the specific question of what size such a fund could reasonably be expected to grow to After a decade of contributions starting in 2021-22 the fund would only reach around 2 per cent of GDP Even by 2040-41 the fund would be just over 35 per cent of GDP This assumes that there are no withdrawals and that all returns are reinvested in the fund And that there are no crises over the two decades out to 2040-41 which require the fundrsquos capital to be drawn down
This is vastly below the size of an effective stabilisation fund Just in an average year Scotlandrsquos deficit as part of the UK has been 37 per cent since devolution almost double the size of the fund after a decadersquos contributions In a crisis requiring stabilisation or a significant unexpected drop-off in revenues the deficit would be vastly larger It is difficult to imagine a stabilisation fund of 2-35 per cent of GDP being up to the challenge of tackling any fiscal crisis however small
Chapter 4 Managing volatility in the public finances 81
Total value of ldquodeficit-funded oil fundrdquo
40
35
30
Per
cen
t of G
DP
25
20
15
10
05
00 2016ndash17 2020ndash21 2024ndash25 2028ndash29 2032ndash33 2036ndash37
Source OBR Fiscal sustainability report (July 2013) OBR Economic and fiscal outlook (March 2013) HM Treasury calculations
The analysis assumes that
bull Forecasts are made on a three-year ahead basis in line with the FCWG suggestion that spending plans would be set based on a medium-term forecast If outturn exceeds the forecast made three years previously the difference is transferred to the fund
bull All returns are reinvested and no withdrawals are made The fund returns 4 per cent per year in real terms
bull In line with the performance of UK forecasts for the 2004-05 to 2011-12 period outturns exceed forecasts 50 per cent of the time When that happens the average ldquoupside surpriserdquo is around 38 per cent of total revenues That implies that in the average year 19 per cent of total revenues (50 per cent multiplied by 38 per cent) is transferred to the stabilisation fund If forecast accuracy improved in future contributions to the fund would reduce and the fund would be even smaller
Because this alternative model implies raising the deficit to contribute to a fund borrowing would be higher each year by the size of contributions to the fund 02 per cent of GDP in the average year with higher debt and debt interest consequences compounding this further
82 Scotland analysis Macroeconomic and fiscal performance
Conclusion 435 In the event of independence Scotland would be directly exposed to a narrower tax
revenue base and more volatile fiscal position An independent Scottish state could try to smooth its public finances as a small country and manage declining oil and gas reserves by establishing an oil fund
436 While the economic rationale for establishing one is clear an oil fund would come at a price Scotland is currently far from having the sustainable fiscal position that would make such a fund viable Implementing an oil fund in a similar way to Norway would imply very significant cuts to public spending or tax increases over and above the plans that have been set by the UK Government to repair the impact of the financial crisis To then begin contributing to the fund more fiscal consolidation would be required on top of that It would take considerable time to build up a fund of adequate size to manage volatility in the public finances
437 Scotland achieves many of the benefits of an oil fund within the UK The UKrsquos integrated fiscal model provides a very stable flow of Scottish expenditure without Scotland having to run the very tight fiscal policy required for an oil fund
Chapter 5 Conclusion
51 Over the past 300 years economic integration across the UK has strengthened to the benefit of all nations and regions The performance of the Scottish economy is strikingly similar to that of the UK as a whole On average a worker in Scotland produces almost exactly the same as a worker in the rest of the UK Scotland has the third highest economic output per person of all the nations and regions of the UK (behind only London and the South East of England) And Scottish output per person is closer to the overall UK average than any other nation or region of the UK Since 1963 growth in economic output per head of population has been slightly stronger in Scotland than in the UK averaging 20 per cent in Scotland and 19 per cent in the UK overall Differences in employment rates between the UK and Scotland have narrowed over time the latest data show that the employment rate in Scotland is now higher than the UK at 722 per cent compared with 715 per cent
52 The similarity of Scotlandrsquos economic performance to the UK as a whole is reflected in its fiscal position Scottish onshore tax revenues per person have been very close to the UK average since 1998 Over the same time period public spending per person in Scotland has been around 10 per cent higher than the UK average Therefore Scotlandrsquos notional onshore fiscal balance has been considerably weaker than the UKrsquos over the same timeframe In the event of independence the allocation of North Sea oil and gas revenues would be subject to negotiation On the basis of a geographical apportionment Scotlandrsquos notional fiscal balance for the period since devolution is very similar to the UKrsquos public finances over the same period
53 The best independent academic models show that international borders reduce trade The analysis in this paper shows that as an impediment to trade flows the border is likely to reduce the level of real income in the Scottish economy by around four per cent with the effect building over time The rest of the UK would also suffer from reduced trade flows but the impact on incomes would be less as Scotland constitutes a smaller share of total trade for the rest of the UK
86 Scotland analysis Macroeconomic and fiscal performance
54 In the event of independence Scotland would be directly exposed to a narrower tax revenue base and more volatile fiscal position An independent Scottish state could try to smooth its public finances and manage volatile and declining oil and gas revenues by establishing an oil fund Implementing an oil fund in a similar way to Norway would imply very significant tax increases or cuts to public spending over and above the plans that have been set by the UK Government to repair the impact of the financial crisis Based on CPPR forecasts of Scotlandrsquos fiscal position in 2016-17 to start an oil fund in 2016-17 from a balanced budget additional fiscal consolidation of 51 per cent of GDP (pound84 billion in real terms) would be needed That implies spending cuts of 13 per cent from current levels or onshore tax rises of 18 per cent Additional fiscal consolidation would then be required to begin making contributions to the fund
55 This would be a profound change Independence would fundamentally transform the relationship between Scotland and the rest of the UK As the historical links between the two countries weaken an independent Scottish state would have to adapt to a new and more challenging environment as a small independent country This would be expected to have deep implications for its economic and fiscal models
Annex A Scotlandrsquos economic performance as part of the UK
A1 This annex sets out a comprehensive picture of the Scottish economy as part of the UK to help inform the debate on independence Various statistical sources are available when looking at Scotlandrsquos economic performance produced and published mostly by the Office for National Statistics (ONS) and by the Scottish Government as described in Box 2A This annex uses these various sources to understand how Scotland has performed as part of the UK relative to the UK as a whole and to comparable countries
A2 This annex is structured in three parts
bull a snapshot of the Scottish economy today compared with the UK including the distinction between onshore and offshore activity
bull historical trends in the Scottish economy including the impact of the recent recession and
bull international comparisons of the Scottish economy with other independent comparable countries
A picture of Scotlandrsquos economic place in the UK The Scottish economy today Similarities with the UK average
A3 Across most key economic indicators the Scottish onshore economy is currently strikingly similar to the UK average
Economic performance
bull Scotlandrsquos GVA per head is 98 per cent of the UK average and Scotland has the third highest GVA per head of all regions See Chart AA
bull A number of Scottish cities Edinburgh in particular have similar income levels to London See Chart AB
bull Scotlandrsquos productivity is almost exactly equal to the UK average and also third highest of all UK regions and devolved countries See Chart AC
Structure of the economy
bull The industrial composition of Scottish output is very similar to the UK average (excluding extra regio) The correlation of industrial composition across the 20 industries of the Standard Industrial Classification 2007 (SIC07) is nearly 95 per cent See Table AA
90 Scotland analysis Macroeconomic and fiscal performance
bull Distribution of income from output between labour (in the form of compensation of employees) and capital (in the form of gross operating surplus and mixed income) is also very similar between Scotland and the UK average See Chart AD
bull The composition of domestic demand between household final consumption Governmentrsquos consumption and gross capital formation is relatively similar to the UK See Chart AE
bull Scotland exported nearly half of its GDP in 2011 (compared with less than a third for the UK as a whole) and the value of imports represented around 55 per cent of total nominal GDP (compared with less than 35 per cent for the UK as a whole)1 Of total Scottish trade a majority was made with the rest of the UK (around 60 per cent of exports and 70 per cent of imports according to the same source) See Chart AE
Labour market
bull Conditions in the Scottish labour market are very similar to the UK average In the latest data (three months to May 2013) Scottish employment and unemployment rates have been a little better than the UK average See Chart AF
bull Median gross earnings were pound498 per week in Scotland in April 2012 or 986 per cent of median gross weekly earnings for the UK as a whole (pound506 per week) See Chart AG
bull Reflecting the similarities in the composition of output the composition of Scottish employment is very close to the UK average See Table AB
Chart AA Output per head of regions and devolved countries (2011) London
South East
UK excluding extra region
Scotland
East
South West
UK ex London extra region
East Midlands
North West
West Midlands
Yorkshire amp the Humber
Northern Ireland
Wales
North East
0 10000 20000 30000 40000
GVA per capita (pound) excluding extra region 2011
Source ONS Regional Gross Value Added (December 2012)
1 Note that Scottish data are for the onshore economy only while UK data include North Sea oil and gas In particular they exclude Scottish exports of North Sea oil and gas and are therefore likely to overestimate UK exports as a share of GDP compared with Scottish exports In 2011 according to the UK Balance of Payments published by the ONS UK exports of crude oil contributed around pound17 billion to a total of pound493 billion (or around 35 per cent of total exports) Excluding crude oil exports would reduce the UK ratio of exports to GDP from around 34 per cent to around 33 per cent
Annex A Scotlandrsquos economic performance as part of the UK 91
Chart AB Economic output per head of London and Scottish cities (2011)
London
Edinburgh City of
Aberdeen City and Aberdeenshire
Glasgow City
0 10000 20000 30000 40000
GVA per capita (pound) excluding extra region 2011
Source ONS Regional Gross Value Added (December 2012)
Chart AC Labour productivity (2011) Output per job
Lon
SE
UK
Scot
East
SW
EM
WM
NW
YH
NE
NI Wal
989
0 50 100 150 Indexed UK=100
Output per hour worked
Lon
SE
UK
Scot 1000
East
SW
NW
NE
EM
WM
YH
Wal
NI
0 50 100 150 Indexed UK=100
Source ONS Regional Labour Productivity (June 2013)
92 Scotland analysis Macroeconomic and fiscal performance
Table AA Composition of output in UK and devolved countries (2010)
UK excl extra regio Wales Scotland Northern Ireland
Agriculture 07 04 07 12
Mining and utilities 33 43 75 26
Manufacturing 111 164 116 151
Construction 65 73 72 69
Distribution Hotels and restaurants 145 148 136 163
Transport and communication 106 71 85 67
Finance 96 48 83 43
Real estate 82 83 73 79
Business services 119 74 100 70
Public admin education and health 202 261 223 290
Others 35 32 31 29
Correlation with UK excl extra regio 089 095 089
Source ONS Regional Gross Value Added (December 2012)
Chart AD Labour share of output (2011) 65
640
Com
pen
satio
n of
em
ploy
ees
as a
sha
reof
tota
l GVA
64
63
62
61
60
59
58
57
618
599
618
Wales Scotland Northern Ireland UK excluding extra region
Source ONS Regional Gross Value Added (December 2012)
Annex A Scotlandrsquos economic performance as part of the UK 93
Chart AE Expenditure decomposition of output (2011) Composition of domestic demand
100
156 144
213233
612 643
As
a sh
are
of to
tal d
omes
tic d
eman
d
75
50
25
0 Scotland UK
Households final consumption
Government final consumption
Gross capital formation
Degree of trade openness
60 553
50 495
325 341
UKScotland
As
a sh
are
of G
DP
40
30
20
10
0
Exports Imports
Source ONS Quarterly National Accounts (2013Q1) Scottish Government Scotland National Account Project (2012Q3 and 2012Q4)
Chart AF Labour market in the three months to May 2013 80
719 714 70 Wales
60 Scotland
Northern Ireland 50
75 78
221 225
Employment rate Unemployment rate Inactivity rate
Per
cen
t
40
30
20
10
0
UK
Source ONS Labour Market Statistics (July 2013) Labour Force Survey
94 Scotland analysis Macroeconomic and fiscal performance
Chart AG Median earnings in UK regions and devolved countries (2012) London
South East
United Kingdom
Scotland
East
North West
West Midlands
South West
Yorkshire and The Humber
East Midlands
Northern Ireland
North East
Wales
0 100 200 300 400 500 600 700
Median full time gross weekly earnings (pound) April 2012
Source ONS Annual Survey of Hours and Earnings (ASHE) 2012 provisional results
Table AB Industrial composition of jobs
Wales Scotland Northern Ireland UK
Agriculture 23 19 40 13
Mining and utilities 15 26 10 12
Manufacturing 105 72 99 81
Construction 69 67 72 65
Distribution Hotels and restaurants 225 214 228 216
Transport and communication 60 73 59 86
Finance 22 36 23 36
Real estate 10 12 10 13
Professional business services 45 72 43 77
Administrative and support services 60 75 55 78
Public administration 63 59 74 53
Education 97 77 90 87
Health and social work 152 142 150 128
Others 53 56 48 57
Correlation with UK 095 099 094
Source ONS Workforce jobs by region and industry (December 2012)
Annex A Scotlandrsquos economic performance as part of the UK 95
Performance over time relative to the UK ndash long-term trends and the impact of the recession A4 Looking back to past developments in the Scottish economy relative to the UK there has
been volatility in the data between Scotland and the UK average but long-term economic trends have been broadly similar
Growth
bull The growth in Scotlandrsquos onshore GVA per head has been slightly above the UK average for the onshore economy between 1963 and 2012 (20 per cent a year compared with 19 per cent a year) See Table AC for onshore economic growth and population statistics
bull Real growth not adjusted for population growth in Scotlandrsquos onshore economy has lagged slightly behind the UK average between 1963 and 2012 with annual growth averaging 2 per cent compared with 22 per cent on average across the UK This is explained by faster population growth in the UK
bull Annual population growth in Scotland between 1963 and 2012 was 00 per cent lower than the 03 per cent growth in the UK Scotlandrsquos population fell for most of the last two decades of the 20th century declining from a peak of 524 million in 1974 to 505 million at its trough in 2002 The population in Scotland has increased since 2002
bull Since devolution annual onshore growth in Scotlandrsquos GVA per head has been the same as the UK at 14 per cent
bull Growth not adjusted for population changes in Scotlandrsquos onshore economy has lagged slightly behind the UK between 1998 and 2012 with annual growth averaging 17 per cent compared with 20 per cent on average across the UK This is accounted for by differences in population growth
bull Although the Scottish population has started to increase since 2002 population growth has still been lower than the UK Annual population growth in Scotland between 1998 and 2012 was 03 per cent lower than the 06 per cent growth in the UK
bull Cycles in the Scotlandrsquos onshore economy have been broadly in line with the rest of the UK contracting in similar periods most notably in the mid 1970s in the early 1980s and in 2008-09 See Chart AH
bull During the financial crisis the volume of onshore output in Scotland peaked in the second quarter of 2008 a quarter after the peak in total UK output (first quarter of 2008) Output then fell for five consecutive quarters reaching a trough in the third quarter of 2009 for Scotland and the second quarter of 2009 for the UK as a whole The initial decline (from peak to trough) was more limited in Scotland (-56 per cent) than for the UK as a whole (-74 per cent) See Chart AI
96 Scotland analysis Macroeconomic and fiscal performance
Labour market and productivity
bull Employment rates between Scotland and the whole UK have converged Between 1993 and 2012 the employment rate in Scotland (among those aged 16 to 64) increased by nearly 5 percentage points2 The increase was more moderate for the UK as a whole just above 3 percentage points The employment rate in Scotland is now just above the UK at 719 per cent compared to 714 per cent The unemployment rate has risen but is below the UK average at 75 per cent compared to 78 per cent See charts AJ and AK
bull Prior to the recession (between 1993 and 2007) the employment rate in Scotland increased by more than 7 percentage points The increase was more moderate for the UK as a whole just above 4 percentage points By 2007 the employment rate in Scotland was nearly 2 percentage points above the UK average
bull Scotlandrsquos unemployment rate has also converged towards the UK average falling more rapidly through the second half of the 1990s and prior to the 2008-09 recession
bull Scottish productivity growth (as measured by growth in real output per worker) has grown broadly in line with the UK average from 1993 to 2012 increasing by 17 per cent a year on average compared with 18 per cent for the UK as a whole Productivity growth lagged behind the UK average prior to the recession but has been stronger since See Chart AL
Table AC Onshore economic growth in Scotland and the UK
1963-2012 1998-2012
Scotland GVA growth 20 17
Population growth 00 03
GVA per head growth 20 14
UK GVA growth 22 20
Population growth 03 06
GVA per head growth 19 14
Source Scottish Government GDP statistical bulletin (2010Q1 and 2013Q1) ONS UK real GVA excluding North Sea oil and gas (KLHZ and UIZY) ONS mid-year population estimates General Register Office for Scotland
2 Employment data for Scotland are only available from 1993 Productivity data has been constructed using this employment data
Annex A Scotlandrsquos economic performance as part of the UK 97
Chart AH Annual growth in onshore economic activity per head
10
8
ndash6
ndash4
ndash2
0
2
4
6
Per
cen
t
ndash8 1964 1974 1984 1994 2004
Scotland UK
Source Scottish Government GDP statistical bulletin (2010Q1 and 2013Q1) ONS UK real GVA excluding North Sea oil and gas (KLHZ and UIZY) ONS mid-year population estimates General Register Office for Scotland
Chart AI Impact of the recession
92
94
96
98
100
Comparable country median
UK excl oil and gas
UK
Scotland
Rea
l GVA
ind
ex (P
eak=
100)
0 5 10 15 20
Quarters after peak in output
Source Scottish Government GDP statistical bulletin (2013Q1) ONS Gross Domestic Product Preliminary Estimate (2013Q2) Eurostat
98 Scotland analysis Macroeconomic and fiscal performance
Chart AJ Employment rate (proportion of the population aged 16 to 64 in employment) 76
68
70
72
74
Pro
port
ion
of 1
6+ p
opul
atio
n in
em
ploy
emnt
(per
cen
t)
66
64
62 Jan-93 Jan-98 Jan-03 Jan-08 Jan-13
Scotland UK Source ONS Labour market statistics (July 2013)
Chart AK Unemployment rate (unemployment as a proportion of the population aged 16 and above)
12
4
6
8
10
Une
mpl
oym
ent r
ate
16
and
abov
e (p
er c
ent)
2
0 Jan-93 Jan-98 Jan-03 Jan-08 Jan-13
Scotland UK Source ONS Labour market statistics (July 2013)
Chart AL Productivity growth Annual growth in output per worker
30
25 Scotland
ndash05
00
05
10
15
20 UK
Per
cen
t
ndash10 1993 to 2007 2007 to 2012 1993 to 2012
Source Scottish Government GDP statistical bulletin (2013Q1) ONS Gross Domestic Product Preliminary Estimate (2013Q1) ONS Labour market statistics (July 2013) HMT calculations
Annex A Scotlandrsquos economic performance as part of the UK 99
Scotlandrsquos economic performance relative to comparable independent countries A5 Having considered Scotlandrsquos performance relative to the UK average this section turns to
its relative performance against other comparable independent countries For its economic growth target the Scottish Government compares Scotlandrsquos economic performance against seven EU Member States Austria Denmark Ireland Finland Sweden Portugal and Luxembourg Not of all of these countries are similar in size to Scotland for example Luxembourg has a population of only approximately 500000 However for consistency this analysis uses the same set of countries
A6 There are a number of different indicators of economic performance This section focuses on the growth in output per head volatility of output and labour market performance
A7 The long-term historical comparison of Scotlandrsquos growth performance uses the annual series for Scottish onshore GVA at constant basic prices back to 1963 published by the Scottish Government The OECD provides historical series for GVA at constant basic prices for the majority of comparable countries (excluding Ireland) back to 19703 The Scottish Government also publishes quarterly data for Scotland onshore GVA at constant basic prices for the period 1998Q1 to 2012Q4 Quarterly GVA at constant basic prices for comparable independent countries is available from Eurostat4
A8 This analysis of performance focuses on Scotlandrsquos peformance as part of the UK It therefore focuses on onshore GVA This measure is more directly comparable with the independent countries chosen for this comparison (none of which had a large oil and gas sector) In addition whilst offshore activity (North Sea oil and gas) is impacted by economic policy choices it will ultimately be driven by the natural resources remaining and global trends in demand and supply Offshore activity is also highly volatile and can have a large impact on headline output measures masking changes in the onshore economy
Scotlandrsquos performance relative to independent comparable countries A9 Scotland is a prosperous country with high levels of income and employment rates
Scotlandrsquos growth performance over the last 20 years has been stronger than the median of comparator countries but was weaker in the 1970s and 1980s Scotland has achieved higher employment rates than the median of comparator countries Scotland experiences lower volatility in its growth rate than most of the comparator countries and the recession was milder in Scotland than all but one of the seven comparator countries
Output
bull Compared with the seven comparator countries Scotland ranks 5th out of 8 in the level of output per head In 2012 it was just above the level of Denmark and Finland and considerably higher than Portugal Luxembourg is the outlier it started from a higher level of income than Scotland in 1970 and has grown quickly This could in part be due to the cross border movement of labour such as German and French residents increasingly travelling to Luxembourg to work increasing GVA whilst not
3 OECD National Accounts Statistics Gross value added at basic prices national currencies OECD base year GVA (at constant basic prices) is available for Ireland back to 1995 growth in GDP (at constant market prices also from the OECD) is used to extend for the period 1971 to 1995
4 Eurostat Economy and finance Quarterly National Accounts GDP and main components (volume) Eurostat does not publish GVA (at constant basic prices) for Sweden or Ireland Growth in GDP (at constant market prices also from Eurostat) is used as a proxy
100 Scotland analysis Macroeconomic and fiscal performance
increasing the population of Luxembourg Chart AM below shows GVA per head levels from 1970 to 2012 for Scotland and the comparator countries
bull In terms of growth rates between 1970 and 2012 Scotlandrsquos performance has been poorer but still within the range of comparator countries Output per head in Scotland has grown faster than Denmark since 1970 and roughly the same as Sweden although still slower than other comparator countries
bull Annual growth in Scotlandrsquos onshore real GVA per head averaged 18 per cent between 1970 and 2012 The median growth rate per head across the seven comparator countries was 23 per cent over this same period As can be seen in Chart AM and Table AD some of this is due to catch-up in countries that started from a lower base for example Ireland and Portugal
bull However this long run average masks an improving trend in Scotlandrsquos economic performance During the 1990s Scotlandrsquos output per head growth was equal to the median of comparator countries it ranked joint 4th out of 8 In the period 2000 to 2012 Scottish output growth per head was superior to Denmark Finland Ireland Luxembourg and Portugal equal to Austria and behind Sweden It ranked joint 2nd out of these countries
bull Scotlandrsquos poorer performance during the 1970s explains the majority of the difference in performance over the whole period If the 1970s are excluded Scotland was firmly in amongst the comparator group of countries only outperformed by Luxembourg and Ireland over 1980 to 2012 A similar pattern of improving performance over these decades is evident in the UK further illustrating Scotlandrsquos economic integration
Volatility
bull As discussed Scotlandrsquos economic integration with the rest of the UK helps to reduce economic volatility This can be seen in the stability of Scotlandrsquos growth per head over time relative to the comparator countries Along with Austria Scotland had the lowest standard deviation in growth per head over the period 1970 to 2012 The median level of volatility in growth rates across the seven comparator countries for this period was 60 per cent higher See Chart AN
bull Perhaps the best example of how being part of a well integrated union can reduce volatility is Scotlandrsquos experience during the most recent recession Scotland has performed significantly better than most of the comparator countries as shown in Table AE and Chart AO While the financial crisis has badly affected the Scottish economy with output falling by 56 per cent from peak to trough the depth of the recession was shallower than all but one of the independent comparable countries The recession was twice as large in Ireland which required an IMFEU assistance programme The recession was also larger in Denmark Finland Luxembourg Portugal and Sweden
bull The overall output impact of the global financial crisis (from peak in output to the latest data in 2013Q1) remained more moderate in Scotland than in a majority of independent comparable countries While Scottish output remained below its peak by 20 per cent in the fourth quarter of 2012 output losses in Denmark Finland Ireland Luxembourg and Portugal all remain larger than that observed for Scotland
Annex A Scotlandrsquos economic performance as part of the UK 101
Labour Market
bull Overall Scotlandrsquos employment rate compares very favourably with that of the comparator countries and its unemployment rate is similar to the median of comparator countries See Chart AP and Chart AQ The Scottish employment rate was 711 per cent in 2012 compared with 694 per cent for the median of independent countries
bull As a whole the median employment rate across independent comparable countries has increased slightly more rapidly than the Scottish employment rate between 1992 and 2012 (by 28 percentage points and 24 percentage points) but starting from a lower base and remaining below Scotlandrsquos employment rate
bull In line with other measures of performance Scotlandrsquos unemployment rate has improved in the 15 years prior to the 2007 recession and is now in line with the performance of the independent comparable countries The unemployment rate steadily decreased from 95 per cent in 1992 to 48 per cent in 2007 and 2008 catching up and overtaking the unemployment rate of the median comparable country
bull The 2008 recession has had a similar negative impact on the unemployment rate in all of the independent comparable countries Scotland had a very slightly larger rise compared to the median of independent comparable countries unemployment was 8 per cent in Scotland in 2012 slightly higher than the median of 77 per cent
bull Scotland has avoided the worst of the volatility in the unemployment rate amongst the independent comparable countries Ireland and Finland had unemployment rates above 15 per cent in 1993 and Ireland and Portugal have had unemployment rates above 15 per cent at some point during 2012
US Dollars PPP
102 Scotland analysis Macroeconomic and fiscal performance
Chart AM Historical comparison of Scotlandrsquos output performance per head
5000
10000
15000
20000
25000
30000
35000
40000
Luxembourg
Sweden
Portugal
Ireland
Finland
Denmark
Austria
Scotland
US
Dol
lars
PP
P
0 1970 1980 1990 2000 2010
Source OECD National Accounts Statistics Gross value added at basic prices national currencies OECD base year Scottish Government GDP statistical bulletin (2010Q1 and 2013Q1) HMT calculations
Table AD Growth Rates in GVA per head
1970 to 2012 1970 to 1980 1980 to 1990 1990 to 2000 2000 to 2012
Austria 23 35 22 23 12
Denmark 16 20 22 22 01
Finland 22 34 26 18 11
Ireland 32 33 33 62 08
Portugal 23 38 31 25 02
Sweden 19 19 21 20 16
Luxembourg 31 38 45 38 08
Median of comparator countries 23 34 26 23 08
Scotland 18 16 21 23 12
Source OECD National Accounts Statistics Gross value added at basic prices national currencies OECD base year Scottish Government GDP statistical bulletin (2010Q1 and 2013Q1) HMT calculations
Chart AN Standard deviation of annual growth per head 60
50
Range across comparable countries
40 x Median across comparable countries
x Scotland 30 x
20 x x
x 10
00 1970 to 2012 1970s 1980s 1990s 2000s
Source OECD National Accounts Statistics Gross value added at basic prices national currencies OECD base year Scottish Government GDP statistical bulletin (2010Q1 and 2013Q1) HMT calculations
Annex A Scotlandrsquos economic performance as part of the UK 103
Table AE Impact of the recent global financial crisis
Timing of the recession Output impact of the recession
Quarter of Quarter of Duration (peak Peak to Trough to Peak to peak trough to trough) trough 2013Q1 2013Q1
Austria 2008Q2 2009Q2 4 -52 65 10
Denmark 2008Q2 2009Q2 4 -80 26 -56
Finland 2007Q4 2009Q2 6 -104 52 -57
Ireland 2007Q4 2009Q4 8 -115 20 -98
Luxembourg 2008Q1 2009Q2 5 -63 39 -26
Portugal 2007Q4 2013Q1 21 -86 00 -86
Sweden 2007Q4 2009Q1 5 -76 131 45
Median of comparable countries 2007Q4 2009Q2 6 -80 39 -56
Scotland 2008Q2 2009Q3 5 -56 38 -20
Source Eurostat Scottish Government GDP statistical bulletin (2013Q1)
Chart AO Output growth pre-recession peak=100 105
89
91
93
95
97
99
101
103
Luxembourg
Sweden
Portugal
Ireland
Finland
Denmark
Austria
Scotland
87
85 0 1 2 3 4 5 6 7 8 9 10 11 12 13 14 15 16 17 18 19 20 21
Source Eurostat Scottish Government Quarterly GDP (2013Q1)
Chart AP Scotlandrsquos employment rate relative to comparable countries 80
Scotland
Median across comparable countries
Range across comparable countries
50
55
60
65
70
75
Per
cen
t
1992 1994 1996 1998 2000 2002 2004 2006 2008 2010 2012
Source Eurostat OECD ONS Labour market statistics
104 Scotland analysis Macroeconomic and fiscal performance
Chart AQ Scotlandrsquos unemployment rate relative to comparable countries 20
2
4
6
8
10
12
14
16
18
Per
cen
t
Scotland
Median across comparable countries
Range across comparable countries
0 1992 1995 1999 2003 2007 2010
Source Eurostat OECD ONS Labour market statistics
Box AA Sources for Scotlandrsquos economic statistics There are a number of different sources of data on the Scottish economy This analysis draws on a wide range of these sources
Data on Scottish output are published by both the Scottish Government and the ONS Real GVA for the onshore economy is published quarterly by the Scottish Government as a National Statistic which means that it is considered to meet the UK Statistics Authorityrsquos rigorous production and quality standards The current publication is to 1998Q1 The longer term series to 1963 was last published in 2010
A more extensive set of data for nominal GVA and GDP is published quarterly by the Scottish Government in the Scottish National Accounts Project (SNAP) This includes a spilt for onshore and the Scottish share of extra-regio output These statistics are currently classified as experimental ie methodologies are still being developed and tested so estimates may be subject to more frequent and significant revision
The ONS also publishes annual regional GVA for all the regions and devolved countries as a national statistic
Data on the labour market is published monthly by the ONS in the regional labour market release as a national statistic Data on labour productivity is published quarterly by the ONS in the regional labour productivity release as a national statistic Data on population is published by the ONS as mid-year population estimates
Data on trade is from three main sources The annual Global Connections Survey provides a detailed breakdown of Scottish exports SNAP provides data for Scottish imports and exports The latest SNAP release does not include a split between imports and exports Instead a balancing item has been published Therefore the previous release has been used when considering Scottish imports and exports as the latest available data The Scottish input-output tables also provide very detailed data on Scottish imports and exports All of these statistics are currently classified as experimental
Data on migration between Scotland and the rest of the UK is published quarterly by the General Register Office for Scotland as a national statistic
Annex B Scotlandrsquos tax and spending as part of the UK 105
Annex B Scotlandrsquos tax and spending as part of the UK
B1 This annex provides more detail on Scotlandrsquos tax and spending as part of the UK since devolution The analysis in this annex is largely based on estimates published by the Scottish Government in Government Expenditure and Revenue Scotland (GERS) and Historical Fiscal Balance Calculations
bull GERS is a National Statistics publication which means that it is considered to meet the UK Statistics Authorityrsquos rigorous production and quality standards It is published annually and provides estimates of Scotlandrsquos tax and spending for the latest five year period and
bull the Historical Fiscal Balance Calculations publication provides a longer series of tax and spending data but is currently badged by the Scottish Government as experimental Ie methodologies are still being developed and tested so estimates may be subject to more frequent and significant revision
B2 The focus on the period since devolution in this annex is therefore partly because this is the period for which the more reliable data is available but it also reflects the fact that the choice facing Scotland is between devolution and independence
B3 These publications provide estimates of Scotlandrsquos historical tax and spending as part of the UK The figures do not represent the fiscal position of a hypothetical independent Scotland nor more obviously what this might look like in the future Given the UK (and therefore Scotland) derives significant economic and fiscal benefits from integration the fiscal position of an independent Scotland could therefore be substantially different from Scotlandrsquos position as part of the UK presented in GERS
B4 This annex is structured around three main areas
bull the approach to assessing Scotlandrsquos tax and spending as part of the UK
bull Scotlandrsquos public spending as part of the UK
bull Scotlandrsquos revenues as part of the UK including the distinction between onshore and offshore revenues
106 Scotland analysis Macroeconomic and fiscal performance
Assessing Scotlandrsquos tax and spending as part of the UK B5 Public spending in the UK is funded through taxation with shortfalls in tax revenues
supplemented by borrowing as shown in Chart BA The UKrsquos fiscal model collects and pools tax revenues from across the UK and redistributes these to fund spending based on a combination of need population opportunity formula and history Since devolution the UK has funded 90 per cent of spending from tax revenues and 10 per cent from borrowing
Chart BA How the UKrsquos public spending is funded
1999
00
2000
01
2001
02
2002
03
2003
04
2004
05
2005
06
2006
07
2007
08
2008
09
2009
10
2010
11
2011
12
2012
13
0
100000
200000
300000
400000
500000
600000
700000
800000
pound m
illio
n
SpendRevenuesNet borr owing
Source ONSHM Treasury Public Sector Finances (as used in GERS 2011-12 in March 2013)
B6 A geographical breakdown of the UKrsquos public spending is published in the Treasuryrsquos Country and Regional Analysis (CRA) The principles defined in this publication provide a framework for identifying the regional distribution of public spending across the UK The fundamental principle is to identify the people who benefit from public spending or for whom public spending is undertaken rather than necessarily where the spending takes place The key details are set out in Box BA
Annex B Scotlandrsquos tax and spending as part of the UK 107
Box BA Identifying Scotlandrsquos spending as part of the UK The fundamental principle is to identify the people who benefit from public spending or for whom public spending is undertaken
For most areas of spending it is relatively straightforward to produce geographical estimates consistent with this principle Considering some of the larger areas of public spending most health spending benefits people living in the countryregion where the money is spent the recipients of benefits and pensions payments can be readily identified and local authority spending is assumed to benefit the residents
Moreover even for spending areas where it is less straightforward methodologies consistent with this lsquowho benefitsrsquo principle have been developed and tested over many years (although are still subject to regular review and refinement where necessary) For example the administrative costs associated with paying benefits are assumed to follow the same pattern as the benefits payments themselves ndash so if 10 per cent of benefits are paid to Scotland it is considered that 10 per cent of the associated administrative costs are also incurred on behalf of Scotland
The spending presented in the CRA also reflects the ONS definition of which organisations are part of the public sector The CRA therefore reflects the size of the public sector in each countryregion as well as spending on comparable public services As the shape of the public sector is largely consistent across the UK this has little impact on the aggregate public spending numbers presented in the CRA
However it is worth noting that water has been privatised in England and Wales while it is part of the public sector in Scotland and Northern Ireland Public spending is therefore slightly higher in Scotland and Northern Ireland than if water was privatised although revenues in Scotland are correspondingly higher as water rates are treated as public sector receipts Specifically Scotlandrsquos tax and spending are both increased by around pound500 million per year which is most significant when considering the distribution of public spending across public services in Scotland
The spending presented in GERS uses the CRA publication as its main input The one key divergence is in the presentation of spending that is considered to benefit the whole of the UK equally (for example spending on defence or foreign representation) Specifically while the CRA shows all this non-regional (or lsquonon-identifiablersquo) spending in a separate category a population share (or similar) is allocated to Scotland in GERS This differing approach largely reflects the fact that GERS is additionally attempting to estimate Scotlandrsquos overall fiscal balance while the CRA limits its focus to a geographical breakdown of the UKrsquos public spending
B7 There is currently no similar overarching framework for attributing tax revenues to the countries and regions of the UK This is partly due to the difficulty in attributing certain taxes geographically but it also reflects the fact that the pooling and redistribution of most revenues means that the location where taxes accrue hasnrsquot been an important feature of tax collection (beyond the fact that it accrued within the UK) However HMRC will be publishing a country breakdown of tax revenues for the first time in October 2013 This publication like GERS will estimate tax revenues generated by Scotland as part of the UK rather than as an independent country
108 Scotland analysis Macroeconomic and fiscal performance
B8 While the assessment of the UKrsquos fiscal position is based on all UK tax and spending for an analysis of Scotland it is necessary to consider one extension ndash the treatment of North Sea tax revenues Consistent with the approach taken by the Scottish Government and other external commentators (notably the Centre for Public Policy for Regions) this assessment considers Scotlandrsquos onshore contribution before examining the impact of attributing a share of North Sea tax revenues
Scotlandrsquos public spending as part of the UK B9 Scotlandrsquos spending in this paper is based on the lsquowho benefitsrsquo principle It therefore
includes spending on functions that are devolved to the Scottish Parliament such as health social care education transport policing and housing as well as spending by the UK Government on reserved functions such as welfare and defence It is presented consistent with the National Accounts framework used by the ONS and the OBR to assess the UKrsquos public finances
Devolved spending
B10 The vast majority of Scottish Government spending is determined to benefit Scotland while all spending by Scottish local authorities is assumed to benefit Scotland (which is a simplifying assumption that the CRA makes for all local authorities throughout the UK) All spending by Scottish public corporations (notably Scottish Water) is also currently considered to benefit Scotland
B11 The devolved administrations are largely funded via the Barnett formula whereby a population share of any increase (or decrease) in comparable spending in England is added to their baseline funding This is commonly referred to as the block grant The Scottish Government determines how much of the block grant to allocate to each devolved function including allocations to local authorities The policy flexibility that this provides was set out in Chapter 2
B12 In addition to the block grant certain areas of Scottish Government spending are funded by the UK Government through Annually Managed Expenditure (AME) Spending funded through AME is essentially limited to those programmes that are particularly large and volatile so are not reasonably subject to multi-year budgets While most AME programmes are reserved (such as benefits and tax credits) the payment of Scotlandrsquos public service pensions for example is funded through Scottish Government AME Increases in spending on these programmes do not need to be offset by reductions in spending on other devolved services
B13 Both the Scottish Government and local authorities can augment their funding through sales of goods services and assets In addition to this local authorities obtain further funding through council tax and business rates while the revenue-raising responsibility of the Scottish Government is being enhanced through the ongoing implementation of the Scotland Act 2012 As well as increasing their financial accountability this will mean that the Scottish Government will have the ability to vary the overall levels of tax and spending in Scotland rather than just being responsible for allocating a fixed budget
Annex B Scotlandrsquos tax and spending as part of the UK 109
Reserved spending
B14 The spending analysis in this paper also includes spending reserved to the UK Government that is undertaken on behalf of the people of Scotland There are three approaches taken to determine the share of reserved spending that benefits Scotland
bull administrative data ndash many of the most significant areas of reserved spending (such as benefits state pension payments tax credits etc) can be identified to Scotland according to detailed administrative information
bull relevant indicators ndash a second subset includes spending that is geographically diverse but where the precise beneficiary cannot always be identified In these cases (eg research programmes museums and galleries etc) relevant indicators are used to determine the share of spending that is undertaken on behalf of the people of Scotland and
bull equal benefit ndash thirdly there are certain areas (such as defence and foreign affairs) where everyone across the UK is considered to benefit equally While the Treasuryrsquos CRA publication uses the concept of lsquonon-identifiablersquo for this category GERS attributes a population share (or similar) to Scotland
B15 It is important to note that this doesnrsquot necessarily reflect the spending that actually takes place in Scotland Ie the purpose is to identify the spending that benefits the people of Scotland rather than the economic impact of spending in Scotland (eg on jobs) Some spending that takes place in Scotland is therefore considered by the CRA (and therefore GERS) to benefit other parts of the country while some spending that takes place in other parts of the UK is determined to benefit Scotland
B16 For example the Department for International Development (DfID) has significant numbers of staff in Scotland working on behalf of the UK as a whole ndash much of the spending although in Scotland is therefore undertaken on behalf of other parts of the UK and so does not form part of Scotlandrsquos spending Conversely a share of DfIDrsquos spending overseas is undertaken on behalf of Scotland and therefore allocated accordingly Similar arrangements apply in a number of other departments notably HM Revenue and Customs (HMRC) the Department for Work and Pensions (DWP) the Ministry of Defence (MOD) and the Department for Energy and Climate Change (DECC)
B17 This further reinforces that GERS provides a view of Scotlandrsquos spending (as well as Scotlandrsquos tax) as part of the UK rather than what it might look like as an independent country
110 Scotland analysis Macroeconomic and fiscal performance
Scotlandrsquos funding as part of the UK B18 As part of the UK Scotlandrsquos spending is currently funded through local taxes (council
tax and non-domestic rates) plus pooled and redistributed national taxes and a share of UK borrowing
B19 While as part of the UK it isnrsquot necessary to determine how Scotlandrsquos funding is split between redistributed taxes and borrowing there are at least three logical ways to do so
bull assume that the UK borrows the same amount per person Ie Scotlandrsquos share of UK borrowing would mirror its population share which averages around 85 per cent since devolution
bull as the UK funds part of its spending through borrowing it could be assumed that Scotlandrsquos share of UK borrowing is the same as its share of spending which is 94 per cent since devolution or
bull Scotland could be considered to be funded by the tax revenues that it generates with borrowing filling any gap between this and the level of spending
B20 The next section of this paper considers this further starting with an assessment of revenues generated by Scotlandrsquos onshore economy
Scotlandrsquos onshore revenues B21 In addition to taxes raised locally (currently council tax and non-domestic rates) the
revenues considered in this section are those that can be attributed to people and (onshore) businesses in Scotland As explained earlier in this annex this is based on statistical methodologies rather than reflecting actual revenues generated by Scotland
B22 It should be noted that onshore revenues as presented in GERS includes all the income tax (and other taxes) paid by people who work offshore The only taxes that are excluded are those that are specific to the oil and gas companies operating in the North Sea Ie petroleum revenue tax North Sea corporation tax (including the supplementary charge) and licence fees (which have now been phased out)
B23 Estimates of Scotlandrsquos onshore tax revenues per head are slightly lower than the UK average This reflects the fact that the performance of Scotlandrsquos onshore economy closely mirrors the performance of the UKrsquos onshore economy (as highlighted earlier in this paper) and the fact that people and businesses across the UK are subject to the same levels of taxation (as the UK has a largely unified tax system)
B24 Chart BB shows Scotlandrsquos share of the UKrsquos spending onshore revenues and population since devolution It also shows Scotlandrsquos spending and onshore revenue indexed against the UK average Throughout this period Scotland has benefitted from relatively high levels of public spending while generating similar levels of taxation The British Academy and Royal Society of Edinburgh1 recognised Scotlandrsquos simultaneous low taxhigh spend position as part of the UK and the challenge of maintaining this as an independent country
1 British Academy and the Royal Society of Edinburgh Scotland and the United Kingdom 2012
Annex B Scotlandrsquos tax and spending as part of the UK 111
B25 Specifically since devolution Scotlandrsquos onshore economy has generated 83 per cent of the UKrsquos receipts which is slightly lower than a population share (which averaged 85 per cent over this period) At the same time Scotland has received an average of 94 per cent of UK public spending Relative to the UK generating and spending pound100 this means that Scotlandrsquos onshore economy has generated pound98 while Scotlandrsquos spending is pound112
Chart BB Scotlandrsquos onshore tax and spending compared to the UK average
o
f UK
tota
ls
80
85
90
95
100
105
110
2011
ndash12
2009
ndash10
2007
ndash08
2005
ndash06
2003
ndash04
2001
ndash02
1999
ndash00
Spending Revenue Population
Spe
ndin
g an
d re
venu
es p
er h
ead
(inde
xed
UK
=10
0)90
95
100
105
110
115
120
2011
ndash12
2009
ndash10
2007
ndash08
2005
ndash06
2003
ndash04
2001
ndash02
1999
ndash00
Scotland spending Scotland revenues UK
Source Scottish Government GERS 2011ndash12 and historical series (all figures to 2011ndash12) ONSHM Treasury Public Sector Finances (UK figures for 2012ndash13 excluding the one-off Royal Mail Pension Scheme asset transfer) HMRC Government revenues from UK oil and gas production (North Sea revenues for 2012ndash13) HM Treasury estimates (Scotlandrsquos share of 2012ndash13 UK totals based on the 2011ndash12 share)
B26 This highlights the significant fiscal gap that exists between Scotlandrsquos onshore revenues and spending Had Scotland instead received its population share of spending then it would have received some pound74 billion less since devolution or around pound6 billion less (in real terms) each year An allocation of the UKrsquos spending based on a share of onshore revenues would have further decreased Scotlandrsquos spending
B27 However it is worth reiterating that public spending is allocated across the UK according to a combination of need population opportunity formula and history Higher spending in Scotland than the UK average is therefore the result of a range of factors and like every other region of the UK doesnrsquot depend solely on population or on the share of tax revenues generated
B28 But clearly this means that there is a significant gap between Scotlandrsquos share of UK spending and onshore revenues And as shown in Chart BC there is a funding gap of pound95 billion since devolution even after a per capita share of the UKrsquos borrowing is included
0
2000
4000
6000
8000
10000
12000
14000
North Sea revenues
2012-132011-122010-11 2009-10 2008-09 2007-08 2006-07 2005-06 2004-05 2003-04 2002-03 2001-02 2000-011999-00
112 Scotland analysis Macroeconomic and fiscal performance
Chart BC Scotlandrsquos spending and funding (excluding North Sea revenues)
1999
00
2000
01
2001
02
2002
03
2003
04
2004
05
2005
06
2006
07
2007
08
2008
09
2009
10
2010
11
2011
12
2012
13
70000
60000
50000
pound m
illio
n 40000
30000
20000
10000
0
Onshor e Revenues SpendPer head shar e of borr owing
Source Scottish Government GERS 2011ndash12 and historical series (all tax and spend figures to 2011ndash12) ONSHM Treasury Public Sector Finances (UK figures for 2012ndash13 excluding the one-off Royal Mail Pension Scheme asset transfer) HMRC Government revenues from UK oil and gas production (North Sea revenues for 2012ndash13) HM Treasury estimates (Scotlandrsquos population share of UK borrowing in all years and Scotlandrsquos share of 2012ndash13 UK tax and spend based on the 2011ndash12 share)
Scotlandrsquos revenues including North Sea tax revenues B29 North Sea oil and gas is a hugely important resource for the UK both in terms of its
impact on the UK economy and the contribution it makes to UK tax revenues
B30 Total North Sea tax revenues have averaged pound71 billion a year since devolution in 1999 This corresponds to around 15 per cent of the UKrsquos total revenues during this period However as highlighted in Chart BD these revenues have been volatile ndash they have ranged from pound26 billion in 1999-00 to pound129 billion in 2008-09 which equates to between 07 per cent and 24 per cent of the UKrsquos revenues The largest year-on-year change is a fall of more than pound6 billion following the 2008-09 peak which corresponds to a reduction in UK revenues of just over 1 per cent
Chart BD North Sea tax revenues
2011-12
2012-13
1999-00
2000-01
2001-02
2002-03
2003-04
2004-05
2005-06
2006-07
2007-08
2008-09
2009-10
2010-11
2000
4000
6000
8000
10000
12000
14000
North Sea re venues
US Dollars PPP
pound m
illion
0
Source HMRC Government revenues from UK oil and gas production
Annex B Scotlandrsquos tax and spending as part of the UK 113
B31 As many external commentators have identified including the Institute for Fiscal Studies (IFS)2 and the Centre for Public Policy for Regions (CPPR)3 North Sea revenues have essentially filled the gap between Scotlandrsquos onshore revenues (and share of UK borrowing) and Scotlandrsquos spending
B32 Specifically while Chart BC identifies a pound95 billion onshore fiscal gap since devolution North Sea tax revenues have totalled pound99 billion4 Therefore as part of the UK this suggests that Scotland is already benefitting from the vast majority of North Sea tax revenues (in addition to the economic benefits surrounding the oil and gas industry)
B33 But the advantage of these revenues being pooled and redistributed to Scotland (alongside other UK-wide taxes) is that the volatility of North Sea revenues is smoothed As demonstrated in Chart BC and as discussed earlier in this paper Scotland has enjoyed steady and secure levels of spending as part of the UK rather than spending that mirrors the volatility of North Sea revenues in Chart BD Ie Scotland has effectively exchanged a volatile source of funding (a share of North Sea revenues) for a stable one (in the form of the block grant paid from pooled UK taxes)
Factors affecting North Sea tax revenues B34 There are a number of factors affecting North Sea tax revenues including production
levels oil and gas prices industry investment and operating costs and the governmentrsquos fiscal regime Not only does this make revenues volatile but as explained in Chapter 2 it also makes them unpredictable These factors and their impact on revenues are examined below
North Sea production levels
B35 As shown in Chart BE since peaking around the turn of the century oil and gas production has declined substantially ndash both are now at around a third of peak levels reflecting that extraction is becoming more difficult and aging infrastructure is leading to more frequent unplanned maintenance and temporary field closures
B36 For example in March 2012 Total shut its Elgin platform due to a gas leak It remained shut until March 2013 which is significant as Elgin and two nearby fields account for almost 8 per cent of North Sea gas production The impact of the Elgin shutdown on UK tax revenues taking into account the effect of the shutdown on the nearby Franklin field is estimated at pound750 million in 2012 and pound500 million in 2013
B37 Everything else being equal and as demonstrated in the above example lower production corresponds to lower profits and therefore lower tax revenues
2 Institute for Fiscal Studies lsquoScottish independence the fiscal contextrsquo November 2012 3 The Centre for Public Policy for Regions have published a series of papers on Scotlandrsquos economic and fiscal
performance 4 HMRC Government revenues from North Sea oil and gas production June 2013
114 Scotland analysis Macroeconomic and fiscal performance
Chart BE North Sea oil and gas production O
il (m
illio
n to
nnes
)
Gas
(bill
ion
ther
ms)
20
40
60
80
100
120
140
10
20
30
40
50
60
70
0
1998 2000 2002 2004 2006 2008 2010 2012 2014 2016
0
2018
Gas forecast (billion therms) Oil forecast (million tonnes)
Gas actuals (billion therms) Oil actuals (million tonnes)
Source DECC oil and gas UK field data
Oil and gas prices
B38 High prices in the first half of the 1980s were followed by low prices until the end of the 1990s The period since devolution has seen an upwards trend in the price of oil and gas alongside significant volatility both of which have fed through into tax receipts The price of a barrel of oil is shown in Chart BF For North Sea tax revenues the trend increase in price since devolution has essentially offset the decline in production
B39 However the impact of price fluctuations is exemplified by price changes during 2008 when the oil price fell from a high of pound67barrel to a low of pound27barrel in just 6 months As noted above UK oil and gas receipts halved during this period from nearly pound13 billion in 2008-09 to pound65 billion in 2009-10 It should also be noted that as oil is traded in dollars the pounddollar exchange rate produces a further effect on tax revenues
Annex B Scotlandrsquos tax and spending as part of the UK 115
Chart BF Oil prices
1980 1982
1984 1986
1988 1990
1992 1994
1996 1998
2000 2002
2004 2006
2008 2010
2012
80 2012 prices
10
20
30
40
50
poundb
oe
60
70 Nominal
0
Source BP statistical review of world energy 2013
The Governmentrsquos North Sea fiscal regime
B40 The Governmentrsquos fiscal regime is designed to encourage the investment needed to fully exploit remaining reserves as extraction becomes more difficult while ensuring a fair return for the tax payer
B41 In addition to recent announcements of new field allowances for large shallow water gas fields and brown fields the Governmentrsquos commitment to extending the productive life of the North Sea basin is reflected in the decision to provide industry with long-term decommissioning tax relief certainty (worth upwards of pound20 billion) through the introduction of contracts (Decommissioning Relief Deeds) with oil and gas companies
B42 This has encouraged vital new investment that creates jobs and growth in the short-term and is expected to extend the productive outputs of many fields in the longer-term The Governmentrsquos recent announcements have already been credited with helping to secure a range of new investment in the North Sea Following the announcement of the large shallow water gas allowance for example pound14 billion of investment was sanctioned in the Cygnus gas development which is expected to create 1200 jobs Many fields will also benefit from the introduction of the brown field allowance including the Thistle oil field where an incremental project is expected to safeguard 500 existing jobs and create almost 1000 new ones across the UK
B43 However it is important to note that the immediate impact of higher investment is to reduce short-term tax revenues as investment is subject to tax relief The Government can afford to take these long-term decisions even at the expense of short-term revenues in the current fiscal climate because of the size and diversity of the UK economy and the importance of making the most of remaining reserves in the long-term
116 Scotland analysis Macroeconomic and fiscal performance
Industry investment and operating costs
B44 Industry expenditure has a significant impact on tax revenues As explained above investment is subject to tax relief and so increased investment lowers short-term tax revenues Chart BG below shows that while investment was relatively stable in the first ten years following devolution the impact of increasing oil prices and the Governmentrsquos recent announcements has been to encourage a significant increase in investment from 2009 onwards This is most significant in relation to the forecasts of tax revenues over the next five years and is one of the key factors highlighted by the OBR for their forecast of lower tax revenues during this period
B45 Although less significant increased operating costs (as extraction becomes more difficult) reduce profits for a given level of production which in turn reduce tax revenues
Chart BG North Sea Investment 14
13
pound b
illio
n (c
ons
tant
201
2 p
rice
sus
ing
UC
CI d
efla
tor)
12
11
10
9
8 7
6
5
4
3
2
1
0
2000
2001
2002
2003
2004
2005
2006
2007
2008
2009
2010
2011
2012
2013
2014
2015
2016
2017
Source DECC oil and gas UK field data
B46 Further to the above Box BB provides a summary of the impacts of these key factors on the levels of North Sea tax revenues
Annex B Scotlandrsquos tax and spending as part of the UK 117
Box BB Summary of the impact of key factors on North Sea tax revenues As explained above it is the combined impact of production levels prices industry expenditure and the governmentrsquos fiscal regime that determines the level of tax revenues generated by the North Sea
The key impacts and interactions are as follows
bull decreasingincreasing production will lead to lowerhigher tax revenues everything else being equal
bull decreasingincreasing prices (or equivalent exchange rate effects) will lead to lower higher tax revenues everything else being equal
bull decreasingincreasing operating costs will lead to higherlower tax revenues everything else being equal
bull tax revenues from the North Sea are volatile as they are dependent on volatile oil and gas prices and production levels (which can be significantly affected by unplanned maintenance and temporary field closures)
bull industry investment is encouraged by the Governmentrsquos fiscal regime (through tax relief) and therefore reduces short-term government revenues Recent government announcements particularly on long-term decommissioning certainty have contributed to significant increases in planned investment While investment is expected to slow the decline in production it will actually contribute to the reduction in short-term revenues
118 Scotland analysis Macroeconomic and fiscal performance
Annex C Modelling the Effect of the Border
C1 There is a large body of literature which attempts to model the effect of a border on international trade flows One method which has been widely employed is a gravity model which seeks to capture the degree by which trade between regions is higher than trade across an international border A review of this literature as well as wider trade literature would suggest that the creation of a border is likely to be detrimental to the performance of the Scottish economy However there is great uncertainty over the magnitude of this effect The methodology in this paper has therefore adapted the well-known framework which has the benefit of being both parsimonious and transparent in order to provide illustrative estimates of how both the flow of goods and labour might be affected by the creation of an international border
Estimating the border effect on trade and migration for Scotland C2 The lack of a physical border between the rest of the UK and Scotland requires a
departure from the methodology used in the empirical gravity equation literature With a historical border in place studies tend to use a dummy variable which is equal to one when trade crosses the border and equal to zero when trade occurs within a region Performing an analysis of the counterfactual does not permit this approach
C3 Instead the methodological approach is to estimate a gravity equation for migration and trade within the Eurozone using this to predict the flows of goods and labour between Scotland and the continuing UK if they were in a monetary union with fiscal independence ndash the current macroeconomic policy framework within the Eurozone The difference between the prediction and the actual data is considered to be the estimated effect of a border
C4 The difference between the two numbers is unlikely to be solely due to the effect of a border with other unobservable characteristics creating the discrepancy (see below) Furthermore it is likely to overestimate the effect of the creation of a border between Scotland and the rest of the UK especially in the short term This is a result of the fact that the historical ties create hysteresis effects within the trade flows As such any estimates presented in this paper should be considered long term estimates of the potential effect on the flow of goods and labour
Annex C Modelling the Effect of the Border 119
Data C5 The data used comes from a variety of sources The data on bilateral migration flows
comes from Eurostat The trade statistics come from the IMF DOTS database and the GDP figures come from Eurostat The information about distance contiguity and colonial history comes from a dataset used by other authors in similar studies which has been published by the CEPII The data runs from 2002-2011 in order to capture the date at which the banknotes and coins came into circulation
Specification C6 The basic specification of the trade model is given below
ln(Xijt) = α0 + α1ln(Yjt) + α2ln(Yit) + α3 ln(Distij) + α4ComLangij + εijt
C7 This equation represents a double-log specification where i and j denote countries t denotes time and the variables are defined as follows
bull (Xijt) is exports from region i to region j
bull (Yi) and (Yj) are the gross domestic products of countries i and j
bull (Distij) is the distance from i to j
bull (Comlangij) is a dummy variable equal to one if the countries share the same language
C8 In the case of migration the equation takes the following form
ln(Migrijt) = α0 + α1ln(POPjt) + α2ln(POPit) + α3 ln(Distij) + α4ComLangij + α5 ln(relyijt) + εijt
C9 In this equation the variables are defined as follows
bull (Migrijt) is migration from region i to region j
bull (Popi) and (Popj) are the populations of countries i and j and
bull (Relyijt) is the ratio of destination to source per capita incomes This picks up the main driver of migration in labour market models which suggest that the attractive force between immigrant source and destination countries is the difference between labour incomes in the two countries
C10 This equation represents a baseline specification which can be used to run a pooled OLS regression As set out in a variety of papers there are econometric issues which arise from doing this
bull Omitted Variable Bias There are a variety of variables which may be omitted from the specification above For example Anderson and van Wincoop (2003)1 argue that the concept of lsquomultilateral resistancersquo (see box CA) needs to be addressed in order to create a specification consistent with micorfounded economic theory
bull Heteroskedasticity and Autocorrelation In order to be the best linear unbiased estimator (BLUE) the OLS estimator assumes constant variance of residuals (homoskedasticity) Heteroskedasticity in the residuals is likely to occur where the scale of the dependent variable varies across the cross-sections Autocorrelation is likely to occur if the time series dimension of the data causes it to display lsquomemoryrsquo
Gravity with Gravitas A solution to the Border Puzzle Anderson and van Wincoop (2003) 1
yiyj tij 1ndashσ xij = yw (PiPj)
120 Scotland analysis Macroeconomic and fiscal performance
bull Cross sectional correlation this assumption is likely to be violated in gravity models for trade because countries are facing similar global developments (eg world business cycle oil price etc) Furthermore cross-sectional correlation plays a much more important role for trade data because the development of bilateral trade reflects the economic situation of both the home and foreign economies
Box CA Multilateral Resistance Anderson and van Wincoop (2003)2 derive the following equation to explain trade flows
This equation gives exports from country i to j (xij) as a function of the combined income of the two countries relative to the rest of the world (y) bilateral trade barriers (tij) relative to the multilateral trade barrier of each country (P) and the elasticity of substitution between all goods (σ gt1 ) In other words bilateral exports depend on the bilateral trade barrier relative to the average trade barrier with all trading partners
One of the implications of this equation is that trade barriers reduce size-adjusted trade between large countries more than between small countries Furthermore trade barriers raise size adjusted trade within small countries more than within large countries
A simple illustration of the former implication is as follows for a large country (P) contains a larger proportion of internal barriers all of which are unaffected by an increase in the trade barrier Therefore an increase in (tij) increases (P) for both countries but this increase accounts for a smaller proportion of (P) so the ratio in the brackets increases by more than it does for a small country As (σ gt1 ) bilateral trade falls in response to the increase in the relative trade barrier between the two countries
Alternative estimation2
C11 To assess the robustness of the estimates it is possible to exploit the panel data structure to control for unobservables which may create bias some of the coefficients in the OLS regression Two different methodologies are presented here
bull Fixed Effects The fixed effects estimator allows for the specification of invariant effects across either the cross-section or time A variety of papers starting with Anderson and van Wincoop (2003)3 and more recently Head and Mayer (2013)4 argue that in order to estimate a gravity model which is consistent with economic theory time-varying importer and exporter fixed effects should be specified to capture the multilateral resistance terms
bull Random Effects The random effects estimator assumes that all time-invariant unobserved factors can be modelled by incorporating a random error term The individual effect is therefore assumed to be drawn independently from a distribution Coughlin and Novy (2012)5 use this estimator in their study of the intranational and international border effect in the USA
2 Gravity with Gravitas A solution to the Border Puzzle Anderson and van Wincoop (2003) 3 Gravity with Gravitas A solution to the Border Puzzle Anderson and van Wincoop (2003) 4 Gravity Equations Workhorse Toolkit and Cookbook Head and Mayer (2013) 5 Is the International Border Effect Larger than the Domestic Border Effect Evidence from US Trade Coughlin
and Novy (2012)
Annex C Modelling the Effect of the Border 121
C12 The results of both the fixed and random effects regression give similar coefficients on distance and common language to those obtained under the OLS regressions Using the estimated coefficients from the random effects regression illustrates the effect of the border is broadly similar to that estimated in the OLS regressions although the uncertainty around the estimate is wider6
Table CA Results from estimating the trade gravity equation
Pooled Ordinary Least Squares
Random Effects Fixed Effects
Exporter GDP 1109 1094 shy
(0013) (0034)
Importer GDP 0857 0852 shy
(0011) (0029)
Distance -1194 -1200 -1225
(0028) (0083) (0030)
Common Language 0309 0312 0411
(0062) (0177) (0078)
Constant -22358 -21824 28704
(0545) (1437) (0293)
Range of Fitted Values for Scottish Exports to rUK 2002-2011 (poundbn)
45-55 37-67 shy
Average Value of Scottish Exports to UK 2002-2011 (poundbn) 325 325 shy
Range of Implied Border Effect 83-86 79-89 shy
Range of Fitted Values for rUK Exports to Scotland 2002-2011 (poundbn)
80-100 63-122 shy
Average Value of rUK Exports to Scotland 2002-2011 (poundbn) 426 426 shy
Range of Implied Border Effect 77-81 71-85 shy
Robust Standard Errors in Parenthesis Significant at the 10 level Significant at the 5 level Significant at the 1 level
Exporter GDP Importer GDP and distance in logs
Source HMT calculations
6 An estimate of the border effect based on the fixed effects estimation is not possible as no dummy variables for Scotland and the continuing UK have been estimated
122 Scotland analysis Macroeconomic and fiscal performance
Table CB Results from estimating the migration gravity equation
Pooled Ordinary Least Random Effects Squares
Source Population 0683 0743
(0025) (0067)
Destination Population 0951 0985
(0029) (0072)
Distance -0758 -0723
(0060) (0150)
Common Language 1583 1413
(0181) (0453)
Relative Incomes 0431 0782
(0056) (0187)
Constant -15622 -17331
(0879) (2205)
Range of Fitted Values for Scottish migration to rUK 2002-2011 4292-8158 2257-11581
Average Migration Scotland to rUK 2002-2011 43809 43463-43809
Range of Implied Border Effect 81-90 74-95
Range of Fitted Values for rUK migration to Scotland 2002-2011 2346-4555 1370-7104
Average Migration rUK to Scotland 2002-2011 52195 52195
Range of Implied Border Effect 91-96 86-97
Robust Standard Errors in Parenthesis Significant at the 10 level Significant at the 5 level Significant at the 1 level
Exporter GDP Importer GDP and distance in logs
Source HMT calculations
Calculating Welfare Effects C13 Arkolakis Costinot and Rodriguez-Clare (2012)7 demonstrate that a range of trade models
allow gains from trade to be computed as follows W rsquo λrsquo 1
ε∆W = W = (( ) ndash1) 10 0
λ
C14 In this equation the variables are defined as follows
bull ∆W is the countryrsquos change in real income W
bull λ is the share of a countryrsquos expenditure devoted to domestic goods
bull ε is the elasticity of imports with respect to variable trade costs
C15 The OECD STAN indicators dataset Rev 3 2011 contains comparable import penetration ratios which are computed as follows
importsi (productioni ndash exportsi + importsi)
New Trade models Same old gains Arkolakis et al (2012) 7
Annex C Modelling the Effect of the Border 123
C16 Import penetration ratios for Scotland are computed in the same way using the Scottish National Accounts 2012 Quarter 3 data on gross output imports and exports
C17 The elasticity ε can be estimated from a model of trade flows on trade costs As discussed by Arkolakis Costinot and Rodriguez-Clare (2012)8 this may be done using a gravity equation where the parameter on the relative trade costs between two countries is ε
C18 A review of the literature shows that trade elasticity estimates differ across trade models and individual specifications Eaton and Kortum (2012 p77)9 recommend using an elasticity of -4 obtained by Simonovska and Waugh (2011)10 A more recent paper by Simonovska and Waugh (2012)11 comparing elasticities obtained using different trade models finds elasticities in the range of -28 to -52 Having undertaken a meta-analysis of 32 papers Head and Mayer (2013)12 take the view that the elasticity with respect to trade costs is -503 which forms the basis of estimates in this paper
Conclusion C19 The analysis in Chapter 3 is designed to be illustrative Taking a well-known approach in
trade analysis it captures what could happen to goods and labour flows as well as real income if in the long-run the relationship between Scotland and the continuing UK looked similar to countries in the euro area In the short-run any costs of economic disintegration are likely to be small as a result of the strong cultural and historical ties between Scotland and the continuing UK while in the estimate for the long-run effect of the border is in line with the literature
8 New Trade models Same old gains Arkolakis et al (2012) 9 Putting Ricardo to Work Eaton and Kortum (2002) 10 The Elasticity of Trade Estimates and Evidence Simonovska and Waugh (2011) 11 Different Trade Models Different Elasticities Simonovska and Waugh (2012) 12 Gravity equations Workhorse Toolkit and Cookbook Head and Mayer (2013)
124 Scotland analysis Macroeconomic and fiscal performance
Annex D References
Alesina A (2003) The size of countries Does it matter Journal of the European Economic Association 1 No 2-3 301-316
Anderson J E and E van Wincoop 2003 ldquoGravity with Gravitas A Solution to the Border Puzzlerdquo The American Economic Review 93 (1) 170-192
Arkolakis C Costinot A and Rodriguez-Clare A (2012) ldquoNew Trade Models Same Old Gainsrdquo American Economic Review 102 (1) 94-130
Badinger H (2001) ldquoGrowth Effects of Economic Integration The Case of the EU Member States (1950-2000)rdquo
Barro R and Sala-i-Martin X (1992) ldquoRegional growth and migration A Japan-United States comparisonrdquo Journal of Journal of the International and Japanese Economies
Borjas G (1995) ldquoThe economic benefits from immigrationrdquo Journal of Economic Perspectives 9(2) 322
Bun M and Klaassen F (2002) ldquoHas the Euro Increased Traderdquo Tinbergen Institute Discussion Paper 02-1082
Centre for Public Policy for Regions (2013) ldquoAnalysis of Scotlandrsquos Past and Future Fiscal Positionrdquo
Centre for Public Policy for Regions (2013) ldquoMeasuring an independent Scotlandrsquos economic performancerdquo
Centre for Public Policy for Regions (2013) ldquoReflections on the latest Oil and Gas related analysisrdquo by the Scottish Government and the Office for Budget Responsibility
Coughlin C C and Novy D (2012) ldquoIs the International Border Effect Larger than the Domestic Border Effect Evidence from US Traderdquo CEP Discussion Paper No 1162 September 2012 UCD Centre for Economic Research Working Paper Series WP 0110
De Groot H L F Linders G-J Rietveld P and Subramanian U (2004) The Institutional Determinants of Bilateral Trade Patterns Ky k lo s 57 pp 103-123
DellrsquoAriccia G (1999) ldquoExchange rate fluctuations and trade flows evidence from the European Unionrdquo IMF Staff Papers 46(3) pp 315-334
Down I (2007) ldquoTrade Openness Country Size and Economic Volatility The Compensation Hypothesis Revisitedrdquo Business and Politics Volume 9 Issue 2 2007 Article 3
Annex D References 125
Drinkwater S Levine P Lotti E and Pearlman J (2003) The Economic Impact of Migration A Survey Discussion Paper in Economics at the University of Surrey
Eaton J and Kortum S Putting Ricardo to Work Journal of Economic Perspectives Vol 26 No 2 pp 65-90
Eaton J and Kortum S (2002) ldquoTechnology Geography and Traderdquo Econometrica 70 (5) 1741
Feenstra R C (2004) ldquoAdvanced International Trade Theory and Evidencerdquo Princeton University Press Princeton New Jersey
Fic T Holland D Paluchowski P Rincon-Aznar A Stokes L (2011) Labour mobility within the EU ndash The impact of enlargement and transitional arrangements NIESR Discussion Paper No 379
Fitzsimmons E Hogan V and Neary J P (1999) ldquoA Gravity Model of North-South Traderdquo Economic and Social Review 30 (4) 391-402
Frankel amp Rose (2002) ldquoAn Estimate of the Effect of Common Currencies on Trade and Incomerdquo The Quarterly Journal of Economics May 2002
Frankel amp Romer (1999) ldquoDoes Trade Cause Growthrdquo The American Economic Review June 1999
Furceri D and Karras G (2008) ldquoBusiness cycle volatility and country size evidence for a sample of OECD countriesrdquo Economics Bulletin Vol 5 No 3 pp 1-7
Griffith R Redding S and Simpson H (2004) ldquoForeign Ownership and Productivity New Evidence from the Service Sector and the RampD Labrdquo CEP Discussion Paper No 649
Head K and Mayer T (2013) Gravity equations Workhorse Toolkit and Cookbook CEPR Discussion Papers 9322 CEPR Discussion Papers
Head K Mayer T Ries J (2010) ldquoThe erosion of colonial trade linkages after independencerdquo Journal of International Economics 81 (1) 114
Helliwell JF (1997 ldquoNational Borders Trade and Migrationrdquo Pacific Economic Review Vol 2 No 3 pp 165-85
Henrekson M Torstensson J and Torstensson R (1997) ldquoGrowth Effects of European Integrationrdquo European Economic Review 41(8) 1537-1557
HM Government (2013) ldquoScotland analysis Business and microeconomic frameworkrdquo
HM Government (2013) ldquoScotland analysis Currency and Monetary Policyrdquo
HM Government (2013) ldquoScotland analysis Devolution and the implications of Scottish independencerdquo
HM Treasury (2003) EMU and Trade EMU Study
HM Government (2013) ldquoScotland analysis Financial Services and Bankingrdquo
International Energy Agency (2012) ldquoKey World Energy Statistics 2012rdquo
International Monetary Fund (2013) ldquoConcluding Statement of IMF Article IV Mission to Norwayrdquo
Iwamoto Y and E van Wincoop (2000) ldquoDo Borders Matter Evidence from Japanese Regional Net Capital Flowsrdquo International Economic Review Department of Economics University of Pennsylvania and Osaka University Institute of Social and Economic Research Association vol 41 (1) pages 241-69 February
126 Scotland analysis Macroeconomic and fiscal performance
Kaminski B and Smarzynska B (2003) ldquoNever Too Late to Get Together Again Turning the Czech and Sloval Customs Union into a Stepping Stone to EU Integrationrdquo Policy Research Working Paper 2054 The World Bank Development Research Group
Karras G (2006) ldquoTrade Openness Economic Size and Macroeconomic Volatility Theory and Evidencerdquo Journal of Economic Integration
Kose M Prasad E S Rogoff K and Wei S-J (2006) ldquoFinancial Globalization A Reappraisalrdquo IMF Working Paper WP06189
Kose M A Prasad E S and Terrones ME (2005) ldquoHow Do Trade and Financial Integration Affect the Relationship Between Growth and Volatilityrdquo IMF Working Paper 0519
Landau D (1995) ldquoThe Contribution of the European Common Market to the Growth of its Member Countries An Empirical Testrdquo Weltwirtschaftliches Archiv 131(4) 774-782 IEF Working Paper Nr 40
McCallum J (1995) ldquoNational borders matter Canada-US regional trade patternsrdquo The American Economic Review 85 (3) 615-623
Nitsch V (2000) ldquoNational Borders and International Trade Evidence from the European Unionrdquo Canadian Journal of Economics 33 pp 1091-1105
Office for Budget Responsibility (March 2013) ldquoEconomics and fiscal outlookrdquo
Office for Budget Responsibility (2013) ldquoFiscal sustainability reportrdquo
Pacchioli C (2011) ldquoIs the EU internal market suffering from an integration deficit Estimating the lsquohome-bias effectrdquo Centre for European Policy Studies No348
Poot J Ganesh Nana G and Philpott B (1988) ldquoInternational migration and the New Zealand economy A long-run perspectiverdquo
Portes R and Rey H (2005) ldquoThe determinants of cross-border equity flowsrdquo Journal of International Economics 65 (2) 269
Rauch JE (2001) ldquoBusiness and Social Networks in International Tradersquo Journal of Economic Literaturerdquo 39 pp 1177-1203Wei S-J (1996) ldquoIntra-National versus International Trade How Stubborn are Nations in Global Integrationrdquo Working Paper 5531 NBER
Rauch JE (1999) lsquoNetworks versus markets in international tradersquo Journal of International Economics 48 pp 7-35
Requena F and Llano C (2006) ldquoThe border effects in Spain an industry-level analysisrdquo Dpto de Anaacutelisis Econoacutemico Universidad Autoacutenoma de Madrid 28049 Cantoblanco Madrid Spain
Rodrik D (1998) ldquoWho Needs Capital-Account Convertibilityrdquo In Stanley Fischer and others eds ldquoShould the IMF Pursue Capital-Account Convertibilityrdquo Essays in International Finance 207 Department of Economics Princeton University Princeton NJ
Rose AK (2000) ldquoOne money one market Estimating the effect of common currencies on traderdquo Economic Policy 30 pp7ndash45
Rose AK and van Wincoop E (2001) ldquoNational money as a barrier to international trade Thereal case for currency unionrdquo American Economic Review 91(2) pp386ndash390
Simonovska I and Waugh M (2012) Different Trade Models Different Elasticities Paper provided by Society for Economic Dynamics in its series 2012 Meeting Papers No 618
Annex D References 127
Simonovska I and Waugh M (2011) The Elasticity of Trade Estimates and Evidence NBER Working Paper No 16796
Skancke M (2003) ldquoFiscal policy and petroleum fund management in Norwayrdquo in Jeffrey M Davis (ed) Fiscal Policy Formulation and Implementation in Oil-Producing Countries Washington DC International Monetary Fund
The Scottish Government (2013) ldquoFiscal Commission Working Group First Report Macroeconomic Frameworkrdquo
The Scottish Government (2013) ldquoGovernment Expenditure amp Revenue Scotland 2011-12rdquo
The Scottish Government (2013) ldquoScottish National Accounts Projectrdquo
Thom R and Walsh B (2001) The effect of a common currency on trade Ireland before and after the Sterling link UCD Centre for Economic Research Working Paper Series WP 0110
Wei S-J (1996) Intra-National verses International Trade How Stubborn are Nations in Global Integration Working Paper 5531 NBER
Wolf H (2000) ldquoIntranational Home Bias in Trade Review of Economics and Statisticsrdquo 82 pp 555-563
Published by TSO (The Stationery Office) and available from
Online wwwtsoshopcouk
Mail telephone fax and email TSO PO Box 29 Norwich NR3 1GN Telephone ordersgeneral enquiries 0870 600 5522 Order through the Parliamentary Hotline Lo-Call 0845 7 023474 Fax orders 0870 600 5533 Email customerservicestsocouk Textphone 0870 240 3701
The Houses of Parliament Shop 12 Bridge Street Parliament Square London SW1A 2JX Telephone ordersgeneral enquiries 020 7219 3890 Fax orders 020 7219 3866 Email shopparliamentuk Internet httpwwwshopparliamentuk
TSOBlackwell and other accredited agents
- Scotland analysis Macroeconomic and fiscal performance
- Contents
- Executive summary
- Introduction
- Chapter 1 An integrated economic union
-
- Economic alignment between Scotland and the rest of the UK
- Scottish economic performance over time
- Performance during the financial crisis
- Including North Sea oil and gas
- Scottish economic performance compared to similar small advanced economies
- Benefits of economic integration for economic performance
- Scotlandrsquos integration with the rest of the UK
- Trade
- Labour
- Capital
- Integration and economic stability
- Chapter 1 Conclusion
-
- Chapter 2 The UKrsquos integrated fiscal model
-
- Fiscal alignment between Scotland and the rest of the UK
- Including North Sea oil and gas
- Pooling of resources
- Policy flexibility within an integrated fiscal model
- Scotlandrsquos spending policy flexibility
- The UKrsquos integrated tax system
- Scotlandrsquos tax policy flexibility introduced with the Scotland Act 2012
- Chapter 2 Conclusion
-
- Chapter 3 The Border Effect
-
- The ldquoborder effectrdquo impact of independence on economic integration
-
- Characterising the potential border between an independent Scottish state and the continuing UK
- Assessing the impact of a border on economic integration between Scotland and the rest of the UK
-
- Conclusion
-
- Chapter 4 Managing volatility in the public finances
-
- The case for an oil fund and its implications
- Economic rationale for an oil fund
- Fiscal implications of an oil fund
- Modelling an oil fund for an independent Scottish state
- Conclusion
-
- Chapter 5 Conclusion
- Annex A Scotlandrsquos economic performance as part of the UK
-
- A picture of Scotlandrsquos economic place in the UK
- Performance over time relative to the UK ndash long-term trends and the impact of the recession
- Scotlandrsquos economic performance relative to comparable independent countries
- Scotlandrsquos performance relative to independent comparable countries
-
- Annex B Scotlandrsquos tax and spending as part of the UK
-
- Assessing Scotlandrsquos tax and spending as part of the UK
- Scotlandrsquos public spending as part of the UK
- Scotlandrsquos funding as part of the UK
- Scotlandrsquos onshore revenues
- Scotlandrsquos revenues including North Sea tax revenues
- Factors affecting North Sea tax revenues
-
- Annex C Modelling the Effect of the Border
-
- Estimating the border effect on trade and migration for Scotland
- Data
- Specification
- Alternative estimation2
- Calculating Welfare Effects
- Conclusion
-
- Annex D References
-