SCMS JOURNAL ISSN 0973- 3167 OF Journal July-Septemb… · SCMS JOURNAL OF INDIAN ... been...
136
Volume XIII Number 3 July - September 2016 ISSN 0973- 3167 Estd. 1976 SCMS COCHIN SCHOOL OF BUSINESS, INDIA SCMS JOURNAL OF INDIAN MANAGEMENT Embedded in Cabell’s Directory, Ulrich’s, EBSCO, & ProQuest UGQR Impact Factor 1.1 Copernicus Index Value 5.34 Efficiency Analysis of Indian Life Insurance Firms: A DEA Investigation Joy Chakraborty Expiration Day Effects of Derivatives in India Neetu Chadha and Neha Singhal Corporate Governance and Performance: Indian Manufacturing Sector Dr. Virendra Khanna Eliminating Corruption from Organizations : Role of Business Schools Dr. Ajith P. SMEs and Corporate Social Responsibility : Indian Perception Dr. Kiran Mehta and Dr. Renuka Sharma Measures of Market Penetration by Banks: Indian Perspective Dilpreet Singh and Dr. Harpreet Singh Marketing Ethics: Enhancing Firm Valuation and Building Competitive Advantages Dr. Pankaj M. Madhani Interferences and Moderation of Job and Family Life Sheeja Krishnakuamar Work-Life Balance: Assessing Perceptions Nandini Borah and Nehal Bagla Employee Engagement: Hotel Industry Venkateswarlu Karumuri
Transcript of SCMS JOURNAL ISSN 0973- 3167 OF Journal July-Septemb… · SCMS JOURNAL OF INDIAN ... been...

Volume XIII Number 3
July - September 2016
ISSN 0973- 3167
Estd. 1976
SCMS COCHIN SCHOOL OF BUSINESS, INDIA
SCMS JOURNAL OF
INDIAN MANAGEMENT
Embedded in
Cabell’s Directory, Ulrich’s,
EBSCO, & ProQuest
UGQR
Impact Factor 1.1Copernicus
Index Value 5.34
Efficiency Analysis of Indian Life Insurance Firms: A DEA InvestigationJoy Chakraborty
Expiration Day Effects of Derivatives in India Neetu Chadha and Neha Singhal
Corporate Governance and Performance: Indian Manufacturing SectorDr. Virendra Khanna
Eliminating Corruption from Organizations : Role of Business Schools Dr. Ajith P.
SMEs and Corporate Social Responsibility : Indian Perception Dr. Kiran Mehta and Dr. Renuka Sharma
Measures of Market Penetration by Banks: Indian Perspective Dilpreet Singh and Dr. Harpreet Singh
Marketing Ethics: Enhancing Firm Valuation and Building Competitive AdvantagesDr. Pankaj M. Madhani
Interferences and Moderation of Job and Family Life Sheeja Krishnakuamar
Work-Life Balance: Assessing Perceptions Nandini Borah and Nehal Bagla
Employee Engagement: Hotel Industry Venkateswarlu Karumuri


Articles
Contents July- September 2016, Vol. XIII, Issue No. 3Articles
5 Efficiency Analysis of Indian Life Insurance Firms: A DEA InvestigationJoy Chakraborty
25 Expiration Day Effects of Derivatives in IndiaNeetu Chadha and Neha Singhal
33 Corporate Governance and Performance: Indian Manufacturing SectorDr. Virendra Khanna
46 Eliminating Corruption from Organizations : Role of Business SchoolsDr. Ajith P.
58 SMEs and Corporate Social Responsibility : Indian PerceptionDr. Kiran Mehta and Dr. Renuka Sharma
68 Measures of Market Penetration by Banks : Indian PerspectiveDilpreet Singh and Dr. Harpreet Singh
80 Marketing Ethics: Enhancing Firm Valuation and Building Competitive AdvantagesDr. Pankaj M. Madhani
100 Interferences and Moderation of Job and Family LifeSheeja Krishnakuamar
112 Work-Life Balance: Assessing PerceptionsNandini Borah and Nehal Bagla
120 Employee Engagement: Hotel IndustryVenkateswarlu Karumuri

Chairman’s OverviewThe life insurance industry in India is the biggest in the world and is predicted to grow at a CompoundAnnual Growth Rate of 12-15 percent over the next five years. The insurance market offers a hugebusiness opportunity waiting to be exploited.
The industry as such has undergone a marked transformation ever since it was liberalised in 2000.There have been a number of products and operational innovations necessitated by consumerdemand and intense competition in the field. Changes in the regulatory environment also had path-breaking impact on the growth of the industry.
The future of the industry looks attractive with further changes in the regulatory framework that willbe necessitated in the way industry conducts its business and engages with its customers. Our leadarticle on efficiency analysis of Indian Life Insurance firms, we hope, will throw more light on thescope for improvement in this sector.
Derivatives have largely changed the landscape of modern financial markets. The stock marketaffects the effective functioning of the derivative market because the value of the derivatives dependson the underlying securities. Our second lead article is a study to examine the impact of the expirationof the derivative contracts on the trade volumes and the returns from the securities.
By implementing principles of good corporate governance a company can increase profitability,improve competitiveness, credibility and reputation. Highest standards of governance reduce manyrisks that may arise from daily operations. A study paper to measure the relationship betweencorporate governance and financial performance of a company appears as the third lead article inthis issue.
We also feature in this issue a number of learned articles on a variety of topics such as EliminatingCorruption, Marketing Ethics, Marketing Penetration by Banks, Job and Family Life, Work-LifeBalance, Employee Engagement and the like.
I am confident that this issue will be truly informative and educative to our readers.
Dr. G. P. C. NAYARChairman, SCMS Group of Educational Institutions.

SCMS Journal of Indian ManagementA Quarterly Publication of
SCMS-COCHIN
EditorsEditor-in-Chief
Dr. G. P. C. NayarChairman
SCMS Group of Educational Institutions
EditorDr. D. Radhakrishnan NairProfessor EmeritusSCMS-Cochin School of Business
Dr. Subramanian SwamyPhD (Economics, Harvard University)Formerly Union Cabinet Minister of
Commerce, Law & Justice,Formerly Professor of Economics, IITDelhi & Department of Economics,
Harvard University, USA
Editorial Board
Dr. Filomina P. GeorgeDirector
SCMS-Cochin School of BusinessKochi
Dr. Radha ThevannoorDirector, SSTM
Kochi
Dr. Abhilash S. NairCo-ordinator
Management Development ProgramsIIM (K), Kochi Campus, Kerala
Dr. I.M. PandeyProfessor of Reseach
Delhi School of BusinessNew Delhi
Dr. Azhar KazmiProfessor, King Fahd University
of Petroleum and MineralsDhahran, Saudi Arabia
Dr. George SleebaJoint Mg. Director, V Guard
Industries Ltd., Kochi
Mr. Jiji Thomson IASFormerly Chief Secretary
Kerala
Dr. Thomas Steger(Chair of Leadership and Organization)
Faculty of Business, Economics andManagement Indoraction System
University of RegensburgGermany
Dr. Kishore G. Kulkarni Distinguished Professor of Economics and Editor
Indian Journal of Economics and BusinessDenver, US
Dr. Naoyuki YoshinoProfessor of Economics
Keio UniversityTokyo, Japan
Dr. Jose Maria Cubillo-PinillaDirector of Marketing Management
ESIC Business and Marketing School Madrid, Spain
Dr. Mathew J. ManimalaProfessor
Indian Institute ofManagement, Bangalore

SCMS Journal o f Indian Management , July - September 2016 4
A Quarterly Journal
Editorial
Dr. D. Radhakrishnan Nair
Edi to r ia l Ass i s tan t :
James Paul
Prof. K. J. Paulose
Prof. B. Unnikrishnan
Edi tor ia l Commit tee :
Invoke Solar Energy: Save thComputer Literate and Information Literate
Scientific modes of knowledge have undergone great changes. Information technologyhas also developed along similar lines. In other words, the Internet has been using itssupportive role for these changes in our research and social life. To be precise, the Internethas been a powerful medium in research activities and has been transforming society.Yes, consequent on these, we have been experiencing both internationalization andglobalization. There has been a growing demand for inter-trans disciplinary strategies and
methods for that. Therefore scholars in humanities and social sciences have had to work together to meet thegrowing demands.
Digital resources are extensively distributed across a range of sites: libraries, museums, traditional and digitalarchives, websites etc. They are catalogued according to very different practices and standards that reflect in somecombination: the resources’ initial location, their intellectual content, and their physical form. Presently, internetaccessible resources are located by users who know how and where to find them.
All of us must acknowledge and address the problem and form a community of interests to formulate the needs anddesires. If we ignore the changes going on and the requirements that they cause, we risk being left out. We riskbeing provided with information, organized according to the needs or conceptions of information engineers ornatural scientists.
Within this entire struggle for information on the World Wide Web, another tool of the Internet, e-mail has beenwidely used, also within the humanities, making contacts between scholars and students faster and easier, nomatter which geographical distance may separate them.
Mailing list, Twitter, Facebook, WhatsApp ,etc. as forums of (permanent) discussion form new communities unitedsolely by their fields of interest. Everybody may enter-without respect of person or position- as soon as he or sheknows where the discussion is held and how to subscribe- as soon as he or she has access to the Internet. Butgenerally taking part in the discussion is once a question of computer literacy as the ability to find lists wheretopics you are interested in are treated. Furthermore, participants are pointed towards new publications, onlineand printed, appearing in the field, and receive comments on new features of the Internet and new software fordifferent purposes
During the past many decades we became computer literate. Now during the last few decades we have felt the needto become information literate and we have been vying with one another to achieve the goal. It all shows ComputerLiterate and Information Literate is complementary to each other. Shall we have introspection: despite all informationsurpluses how far we have trapped information with propriety?

SCMS Journal o f Indian Management , July - September 2016 5
A Quarterly Journal
Efficiency Analysis of Indian LifeInsurance Firms: A DEA Investigation
Joy Chakraborty
Abstract
Joy ChakrabortyAssistant Professor (Finance)Alliance School of BusinessAlliance University, BangaloreAnekal, Bangalore – 562106Karnataka, IndiaE mail: [email protected]: 8861982673
he insurance sector in India has been opened upfor private participation since the year 2000. Tillthen, the life insurance business continued to
remain under the monopoly of the state-owned LifeInsurance Corporation of India (LICI) from its inception in1956. With the enactment of the Insurance Regulatory andDevelopment Authority of India (IRDAI) Act in 1999, thecountry’s insurance market was opened up for privateparticipation based on the recommendations of the MalhotraCommittee Report, 1994. As a result, the monopoly of thegovernment-owned LICI eventually suffered a setback withthe entry of private-sector life insurance companies, eitherindependently or in collaboration with foreign partners. Atthe end of the FY 2014-15, the market share of LICI stood at73.48 per cent with the number of players having risen to 24(inclusive of LICI) in the country’s life insurance sector.The collective performances of the private life insurers havebeen commendable since the privatization of the country’sinsurance sector. That is evident from the 26.52 percent gainin market shares at the end of the FY 2014-15, almost fromscratch.
The present study addresses the efficiency aspects of the country’s life insurance sector using a panel data-set of 18 life
insurance companies covering the study-period from 2008-09 to 2014-15, against the backdrop of the US financial
crisis.The application of the non-parametric Data Envelopment Analysis (DEA) has pointed out the inconsistencies in
the operational efficiencies of the life insurers, along with the directions for improvement.
Keywords: Life Insurance, DEA, efficiency, LICI, financial crisis, IRDAI
Abstract
T

SCMS Journal o f Indian Management , July - September 2016 6
A Quarterly Journal
Sl. No.Author (s) &
Year ofPublication
Input Variables Output Variables Period of Study Area of Work
1Bawa and Bhagat
(2015)Number of Agents,Number of Offices
Net Premiums, Numberof Policies sold
2006 - 2013 Life Insurance
2Bawa and Ruchita
(2011)Equity Capital,
LabourNet Premiums 2002 - 2010 Health Insurance
3Chakraborty andSengupta (2012)
Operating Expenses,Commission
Expense
Net Premium, Numberof Products launched
2003 - 2010 Life Insurance
4Chakraborty and
Sinha (2010)
Operating Expenses,Commission
Expenses
Net Premium, Numberof Products launched
2003 - 2008 Life Insurance
5 Dutta (2013)
Labour Expenses,Business Service
and MaterialExpenses, Total
Investment
Premiums Earned,Income fromInvestments
2005 - 2010Life & General
Insurance
6 Dutta (2011)
Labour Expenses,Business Service
and MaterialExpenses, Total
Investment
Premiums Earned,Income fromInvestments
2005 - 2010Life & General
Insurance
The rise in the number of new entrants in the country’s lifeinsurance sector promoted a healthy competition amongthe life insurers that eventually lead to a reduction ininsurance services, improvement in the customer-servicefacilities and strengthening of their competitive positionwithin the ambit of IRDAI regulations. At the same time, theabrupt rise in the number of players in the country’s lifeinsurance sector has also raised concerns about theefficiency of the life insurers in the protection of consumers’interest and timely payment of assured returns to thepolicyholders. Hence, identification of operationalefficiencies in the performances of the life insurers over thetime holds importance from the view-point of safeguardingpolicyholders’ interests against the backdrop of insurancesector reforms.
The present study addresses the operational efficiencies ofthe 18 public and private-sector players in the country’s lifeinsurance sector during the post-deregulation study-periodfrom 2008-09 to 2014-15, against the backdrop of the US
financial crisis of 2007-08. The present study has beenstructured as follows: Section - 2 summarises the literaturereview. Section - 3 presents the conceptual framework ofthe non-parametric DEA approach as undertaken in thepresent study. Section - 4 discusse the research objectives,sample selection, methodologies used along with thelimitations and future scope of the study. Section - 5 reportedthe findings and analysis. Section - 6 highlights theconcluding observations.
Literature review
Having reviewed the most pertinent past research papers,the researcher did not find evidence of any such studies inIndia or in abroad that comprehensively dealt with theefficiency aspects of the Indian life insurance industry,against the background of the global financial crisis. Thepresent study intended to fill that research gap. Some of theliteratures reviewed by the researcher have been summarisedbelow in Table-1.
Table –1: Summary of Past Studies on Efficiency of Insurance Firms

SCMS Journal o f Indian Management , July - September 2016 7
A Quarterly Journal
7Garg and Deepti
(2008)
Number of Agents,Operating Expenses,
Equity Capital
Net Premium,Operating Income
2002 - 2006General
Insurance
8Janjua and Akmal
(2015)
Business Services,Debt Capital, Equity
Capital, LabourExpenses, Number
of Branches
Net Premium,Investment Income,
Net Claims2006 - 2011
Life & GeneralInsurance
9Mandal and
Dastidar (2014)
Operating Expenses,Commission
Expenses,Equity Capital
Net Premium, ClaimsProcessed
2006 - 2010General
Insurance
10 Nandi (2014)Commission Paid,
Operating ExpensesNet Premium, Net
Benefits Paid2002 - 2012 Life Insurance
11Owusu-Ansah et.
al.(2010)
Debt Capital,Equity Capital,Management
Expenses
Net Premium, ClaimsSettled, Income on
Investment2002 - 2007
GeneralInsurance
12Saad and Idris
(2011)
Commission Paid,Management
Expenses
Net Premium, NetIncome on Investment
2000 - 2005 Life Insurance
13Singh and Kumar
(2011)
Operating Expenses(including
commission),Capital
Net Premium, Incomeon Investment,
Claims2000 - 2008
GeneralInsurance
14 Sinha (2013)Commission
Expenses, OperatingExpenses
Net Premium,Net Benefits Paid
2001 - 2012 Life Insurance
15Sinha (2012)[Ph.D work]
CommissionExpenses, Operating
Expenses
Net Premium,Net Benefits Paid
2001 - 2010 Life Insurance
16 Sinha (2015) Operating ExpensesPremiums Collected,
Sum Assured2005 - 2012 Life Insurance
17 Sinha (2007) Operating ExpensesBenefits paid,
Operating Income,Net Premium
2002 - 2006 Life Insurance
18 Sinha (2007)Operating Expenses,Number of Agents,
Equity Capital
Net Premium,Gross Income
2003 - 2005General
Insurance
19 Sinha (2006)Number of Agents,
Equity CapitalNet Premium,
Operating Income2004 - 2005 Life Insurance
20Tone and Sahoo
(2005)
Business services,Labour Expenses,
Policyholder-supplied debt capital,
Equity capital
Claims Settled, Ratioof Liquid Assets to
Liabilities1982 - 2001 LifeInsurance
Source: - Compiled from the Respective Studies

SCMS Journal o f Indian Management , July - September 2016 8
A Quarterly Journal
CONCEPTUAL FRAMEWORK
An Introduction to DEA
Data Envelopment Analysis (DEA) is the most preferredfrontier model for performance measurement and determiningthe efficiency levels of Decision Making Units (DMUs),which can be a financial institution, a department, a division,etc. The DEA approach is non-parametric in nature since itdoes not make any assumptions about the populationparameter. DEA effectively uses the maximization linearprogramming technique to create the efficient frontier byfinding a set of linear estimates that bound (envelope) theobserved data, resulting in a convex production possibilityset. It is a benchmarking technique in the sense that ‘bestpractice firms’ lie on the frontier and envelope otherinefficient firms. The relative efficiency level of a firm isdetermined with respect to the ‘best-practice firms’. Thefirm which is found to be relatively most efficient attains ascore of 1 (or 100%) and the relatively inefficient firms securea score between 0 and 1 (or between 0% and 100%). Theefficiency or inefficiency level of the firms is determined bytheir distances from the production frontier. More is thedistance signifies farther is the position of the firm from theefficient or best-practice firms which are positioned on thefrontier. A point on the frontier is considered to be efficienteither (a) if it produces maximum output using the sameinput, referred to as a case of output-maximization, or (b) if ituses minimum inputs to produce the same output level,referred to as a case of input minimization. The DEA approachtakes into consideration either the input-oriented or theoutput-oriented model. In an input-oriented model, theamount of inputs used by the firms would be comparedagainst the efficient firms who would use to produce thesame output. In case of the output-oriented model, the actualoutput produced by the firms would be compared with thatwhich an efficient firm would produce using the same input.DEA was originally developed by Charnes, Cooper andRhodes (1978) and was later further extended by Banker,Charnes and Cooper (1984). The DEA approach is describedin brief as follows:-
Let us consider a productive unit producing a scalar outputY from bundles of m inputs x=(x1, x2, …, xm). Let (xj, yj) bethe observed input-output bundle of firm j (j=1, 2, …, n).
The technology is defined by the production possibilityset:
Ps = {(x, y): y can be produced from x}
An input-output combination (x0, y0) is feasible if and onlyif (x0, y0) ε Ps
The underlying assumptions are as follows:
(i) All observed input-output combinations are feasible.Thus (xj, yj) ε Ps (j=1, 2,…, n)
(ii) The production possibility set Ps is convex. Hence, if(x1, y1) ε Ps and (x2, y2) ε Ps then {ωx1 + (1-ω) x2, ωy1+(1- ω) y2} ε Ps i.e. weighted averages of feasible input-output combinations are also feasible.
(iii) Inputs are freely disposable. Hence, if (x0, y0) “ Ps andx1 ≥ x0 then (x1, y0) ε Ps
(iv) Output is freely disposable. Hence if (x0, y0) ε Ps andy1≤y0 then (x0, y1) ε Ps
2 DEA Models
There are 2 basic models under the DEA technique. Thebasic DEA model proposed by Charnes, Cooper and Rhodesin 1978 is the CCR model which is built on the assumption ofConstant Returns to Scale (CRS). Later on the model wasmodified in 1984 by Banker, Charnes and Cooper (BCCmodel) with an assumption of Variable Returns to Scale(VRS). The difference in the two models is with regard to theassumptions about the technology. According to both themodels, the efficiency aspect covers the measure of‘Technical Efficiency’ (TE). For both the models, a DMU isconsidered to be efficient if the TE score is equal to 1.
Technical efficiency values of one, determined from anoutput-orientated perspective, represents a point on thefrontier that would produce the maximum output using thesame inputs as that of the other firms, and hence consideredas efficient. An output-orientated DEA is illustrated, asshown in Figure – 1, by a piecewise linear productionpossibility curve based on a production process involvingtwo outputs (q1 and q2) and a single input (x). The curve ZZ/
depicts the unit production possibility curve and firms lyingon this frontier would be considered as the ‘best practice’firms, such as ‘B’. Firms lying below the frontier, such as‘A’, are considered as inefficient firms, because ZZ/
represents the upper bound of the production possibilities.

SCMS Journal o f Indian Management , July - September 2016 9
A Quarterly Journal
Source: - Cooper, W. W., Seiford, L. M. & Tone, K. (2007). “Data Envelopment Analysis:A Comprehensive Text with Models, Applications, References and DEA-Solver Software(2nd Edition).” Springer Publications, USA.
Figure – 1: Output-orientated DEA
Under the CRS and VRS assumptions, the efficiencies areknown as Technical (or Total Technical) Efficiency (TTE)and Pure Technical Efficiency (PTE) respectively. If there isa difference between CRS and VRS with a TechnicalEfficiency score of less than 1, it implies the existence ofScale Inefficiency.
Scale efficiency is the ratio of Technical Efficiency (CRS)/Pure Technical Efficiency (VRS). It is the indicator of thelocal returns to scale enjoyed by the firm (at the point of theobservation). The result relating to ‘Scale Efficiency’ (SE)can be used to draw inferences about the Most ProductiveScale Size (MPSS). Scale Efficiencies vary between 0 and 1.If the SE is less than 1, then the respective firm exhibits VRS(increasing/decreasing). If the ratio is equal to 1, then thefirm exhibits CRS. In other words, if the SE attains a score of1, it implies that the DMU is operating at the minimum pointof the cost curve with respect to CRS, which signifies thatthe firm is said to be operating at MPSS. If the results do notshow a score of 1, it implies an instance of non-optimumscale utilization thereby representing to either a case ofIncreasing Returns to Scale (IRS) or Decreasing Returns toScale (DRS). Existence of IRS and DRS implies about thesize of the firms to be too small (sub-optimal level ofoperations) or too large (over-optimal levels of operation)respectively. In determining the SE, the TE scores under
both CRS and VRS assumptions are taken into consideration.The relation between the three factors demonstrates adecomposition of efficiency as follows:-
TTE (CCR model, CRS) = PTE (BCC model, VRS) x SE
The results of the DEA model are sensitive to the informationabout inputs and outputs. The selection of input-outputvariables are difficult to identify for any life insurance firmssince input prices are often implicit, and outputs are mostlyintangible. Unlike the measurement of output, input measuresin an insurance industry are more tangible and directlyobservable. With regard to the variables selection for thepresent study, the following three important thumb rulesshould be kept in mind (Cooper et. al., 2007).
1. The data-set should be strictly positive for both theoutputs and the inputs used in the study.
2. There should be a significant positive relationshipbetween the input and output variables, which can beverified through the correlation matrix.
3. In addition to the above, the following conditions alsoneed to be satisfied: n ≥ p x q, and r = 3 (p + q), where ‘n’ isthe number of DMUs, ‘p’ is the number of inputs, ‘q’ is thenumber of outputs, and ‘r’ is the total number ofobservations.

SCMS Journal o f Indian Management , July - September 2016 10
A Quarterly Journal
RESEARCH METHODOLOGY
1 Objectives of the Study
Based on the research gap as found from the literaturereview, the present study has two-fold objectives which arelisted as follows:-
(a) To examine the technical, pure technical and scaleefficiencies of the 18 life insurance companies in India,inclusive of the sole public-sector LICI, for the periodfrom 2008-09 to 2014-15.
(b) To evaluate the impact of the global financial meltdownon the operational performances of the life insurancefirms during the period under review.
2 Sample Selections
The objective of the present study is confined only to thepost-reform period, after the liberalization of the country’sinsurance sector since the financial year 1999-2000, so thesubsequent period of reforms has only been considered.The purposive sampling approach has been employed inthe selection of the sample that comprises 01 public-sectorand 17 private-sector life insurance firms in India, who havebeen consistently in operation covering all the years of thestudy-period. Moreover, the reason behind the selection ofthe time-period from 2008-09 to 2014-15 was also to evaluatethe extent of the impact of the global financial crisis uponthe performances of the life insurance firms under review.
3 Research Tools
While deciding on the most suitable tool of analysis, theresearcher has found that extensive literature review revealsthe application of the non-parametric DEA as the appropriatemodel for studies related to efficiency. Hence, the presentstudy has adopted the non-parametric DEA for efficiencyanalysis of the life insurance firms under review on the basisof the output-oriented model under the Variable Returns toScale (VRS) assumptions, using the DEAP computerprogram, version 2.1
4 Specifications of Input and Output Variables Used
The choice of the variables was based on the study ofliterature. Further, literature review shows that there areprimarily two approaches, i.e. the intermediation approachand value-added (or, production) approach, in analysingthe operational efficiencies through DEA. The present studyhas used both the intermediation and the value-addedapproach to determine the input and the output variablesused. Accordingly, the ‘net premiums earned’ and the‘Benefits paid (Net) to the policyholders’ has been selectedas the outputs following the value-added approach, inaddition to the third output i.e. ‘Income from Investments’following the intermediation approach. For the purpose ofefficiency analysis of the life insurance firms, the researcherhas used the ‘Operating Expenses,’ ‘Commission Expenses,’following the intermediation approach, and the‘Investments’ following the value-added approach as thethree inputs for the study. The Input and the Outputvariables used in the present study for the application ofoutput-orientated DEA has been summarised as follows inTable – 2.
Table - 2: Summary of Input-Output Variables used in DEA
Variables Used Input/Output Description
Operating Expenses Input
All Operating Expenses (excludingcommission) borne by the life insurers,obtained as per Schedule-3 of AnnualReports.
Commission InputAll Commission Expenses borne by the lifeinsurers, obtained as per Schedule-2 ofAnnual Reports.
Investments Input
All Investments made by the life insurers outof policyholders' and shareholders' funds,obtained as per Schedules 8 & 8Brespectively of Annual Reports.
SCMS Journal o f Indian Management , July - September 2016 11
A Quarterly Journal
Net Premiums OutputNet Premiums earned by the life insurers,obtained as per Schedule-1 of AnnualReports.
Benefits paid (Net) OutputBenefits Paid (Net) by the life insurers,obtained as per Schedule-4 of AnnualReports
Income from InvestmentsOutput
Income from Investments (i.e. GrossInterests, Dividends & Rent plus Profit onsale of Investments less Loss on sale ofInvestments), obtained from Policyholders’and Shareholders’ Accounts respectively ofAnnual Reports.
Source: - Compiled by the author
5 Data Sources
The secondary data for the present research work has beencollected from the IRDA Annual Reports from 2008-09 to2014-15, and from the websites of the respective life insurers.The data-sources were based on the financial statements(i.e. Policyholders’ Account, Shareholders’ Account and theBalance Sheet) of the Indian life insurance firms underreview.
6 Limitations and Scope of Study
The data collected for the present study has been derivedfrom the published financial statements of the respectivenon-life insurers without any emphasis on primary data.Hence, the study incorporates all the limitations that areinherent in the published financial statements. The study isrestricted to a time span of 7 years focussing on the post-recessionary phase of the reform period from 2008-09 to2014-15 since the outbreak of the global financial crisis.Hence, the future studies of research in this area could takeinto account more number of players covering both thecountry’s life insurance and general insurance sectors foran extended time-period. Moreover, many other areas that
can be studied include the cost-efficiency analysis,application of stochastic frontier models for analysis inconjunction with the efficiency and productivity analysisof the country’s insurance sector.
Findings and Analysis
In order to apply the model and to ensure that all monetaryvalues are directly comparable, all the nominal values of thedata of each year for the selected variables have beendeflated using the all-India Consumer Price Index ofindustrial workers w.r.t. to the base year 2001-02. Hence, thethree inputs are Deflated Commission Expenses (DEF_CEX),Deflated Operating Expenses (DEF_OEX), and DeflatedInvestments (DEF_INV). The three outputs are Deflated NetPremium (DEF_NP), Deflated Net Benefits paid (DEF_NBP),and Deflated Income from Investments (DEF_IINV).
To establish a production mechanism of inputs and outputsand to test whether DEA can be applied on the deflateddata-set, a correlation analysis between the variables hasbeen carried out in the present study related to the FYs2008-09 to 2014-15. Table – 3 presents the Correlation Matrixof the Input and Output variables used in the present study.
Table – 3: Correlation Matrices of the Input-Output Variables Used
VARIABLESINPUTS OUTPUTS
DEF_CEP DEF_OEP DEF_INV DEF_NP DEF_NBP DEF_IINV
INP
UT
S DEF_CEP 1 0.980 0.982 0.998 0.976 0.978DEF_OEP 0.980 1 0.978 0.980 0.979 0.979DEF_INV 0.982 0.978 1 0.981 0.988 0.997
OU
TP
UT
S
DEF_NP 0.998 0.980 0.981 1 0.973 0.977
DEF_NBP 0.976 0.979 0.988 0.973 1 0.993DEF_IINV 0.978 0.979 0.997 0.977 0.993 1
Source: - Compiled by the author

SCMS Journal o f Indian Management , July - September 2016 12
A Quarterly Journal
Based on the results obtained from Table-3, we find that allthe selected variables depicted high positive correlationcoefficients among each other thereby indicating theappropriateness of the selection of variables within thescope of the DEA framework. The above results are alsoindicative of the fact that all selected variables were
Table – 4: Descriptive Statistics (FY: 2008-09)(Figures in Rs. Lakhs)
significant proxies of the production process in the country’slife insurance sector.
Tables 4 – 10 given below presents the descriptive statisticsrelating to the input-output variables used in the presentstudy for analysing the efficiencies of the 18 life insurers’under review in the post-deregulation period for the FYs2008-09 to 2014-15.
Particulars
INPUTS OUTPUTS
DEF_OEX DEF_CEX DEF_INV DEF_NBP DEF_IINV DEF_NP
Mean 95147 57755 2510370 219003 229051 829113Standard Deviation 134864.41 151524.47 9868220.02 807605.26 924397.81 2389300.82Coefficient of Variation ( in Times) 1.42 2.62 3.93 3.68 4.03 2.88Maximum Value 612452 677922 43194676 3545820 4040372 10620714Minimum Value 2684 1044 7779 51 15 9998
Table – 5: Descriptive Statistics (FY: 2009-10)
Source: - Calculated
Particulars
INPUTS OUTPUTS
DEF_OEX DEF_CEX DEF_INV DEF_NBP DEF_IINV DEF_NP
Mean 91815 58407 2861075 312327 309812 860056Standard Deviation 157170.62 159387.20 11197188.30 1057607.01 1004834.53 2457886.11Coefficient of Variation ( in Times) 1.71 2.73 3.91 3.38 3.24 2.86Maximum Value 720342 712371 49023237 4654745 4439785 10940348Minimum Value 2176 1393 8084 206 2109 14736
(Figures in Rs. Lakhs)
Table – 6: Descriptive Statistics (FY: 2010-11)
Source: - Calculated
Particulars
INPUTS OUTPUTS
DEF_OEX DEF_CEX DEF_INV DEF_NBP DEF_IINV DEF_NP
Mean 95770 54143 3089331 426818 359645 862605Standard Deviation 201797.60 161793.72 11976477.51 1361455.21 1147504.81 2469654.52Coefficient of Variation ( in Times) 2.11 2.98 3.87 3.18 3.19 2.86Maximum Value 917853 719388 52462144 6013037 5068941 10992327Minimum Value 1783 1194 10883 414 2902 13152
Source: - Calculated
(Figures in Rs. Lakhs)

SCMS Journal o f Indian Management , July - September 2016 13
A Quarterly Journal
Table – 7: Descriptive Statistics (FY: 2011-12)
Particulars
INPUTS OUTPUTS
DEF_OEX DEF_CEX DEF_INV DEF_NBP DEF_IINV DEF_NP
Mean 78724 50525 3177485 421737 335052 777411Standard Deviation 162863.91 157434.41 12148926.00 1319632.75 1192452.09 2267771.35Coefficient of Variation ( in Times) 2.07 3.11 3.82 3.13 3.56 2.92Maximum Value 742010 698290 53259247 5844385 5246104 10089697Minimum Value 1944 1104 14902 2955 258 11235
Table – 8: Descriptive Statistics (FY: 2012-13)
(Figures in Rs. Lakhs)
Source: - Calculated
Particulars
INPUTS OUTPUTS
DEF_OEX DEF_CEX DEF_INV DEF_NBP DEF_IINV DEF_NP
Mean 75169 47172 3211151 474797 371593 696462Standard Deviation 164449.36 148803.41 12089897.17 1354372.59 1263572.03 2096707.72Coefficient of Variation ( in Times) 2.18 3.15 3.76 2.85 3.40 3.01Maximum Value 745878 659285 53046064 6021486 5574054 9312041Minimum Value 1797 839 14743 7888 3518 9163
(Figures in Rs. Lakhs)
Table – 9: Descriptive Statistics (FY: 2013-14)
Particulars
INPUTS OUTPUTS
DEF_OEX DEF_CEX DEF_INV DEF_NBP DEF_IINV DEF_NP
Mean 77601 47789 3549046 499707 390920 714738Standard Deviation 188115.79 157939.56 13252501.01 1488707.41 1335970.95 2235431.88Coefficient of Variation ( in Times) 2.42 3.30 3.73 2.98 3.42 3.13Maximum Value 848447 697962 58174915 6611529 5891540 9907869Minimum Value 1486 642 26504 9218 3820 8556
(Figures in Rs. Lakhs)
Source: - Calculated
Source: - Calculated
SCMS Journal o f Indian Management , July - September 2016 14
A Quarterly Journal
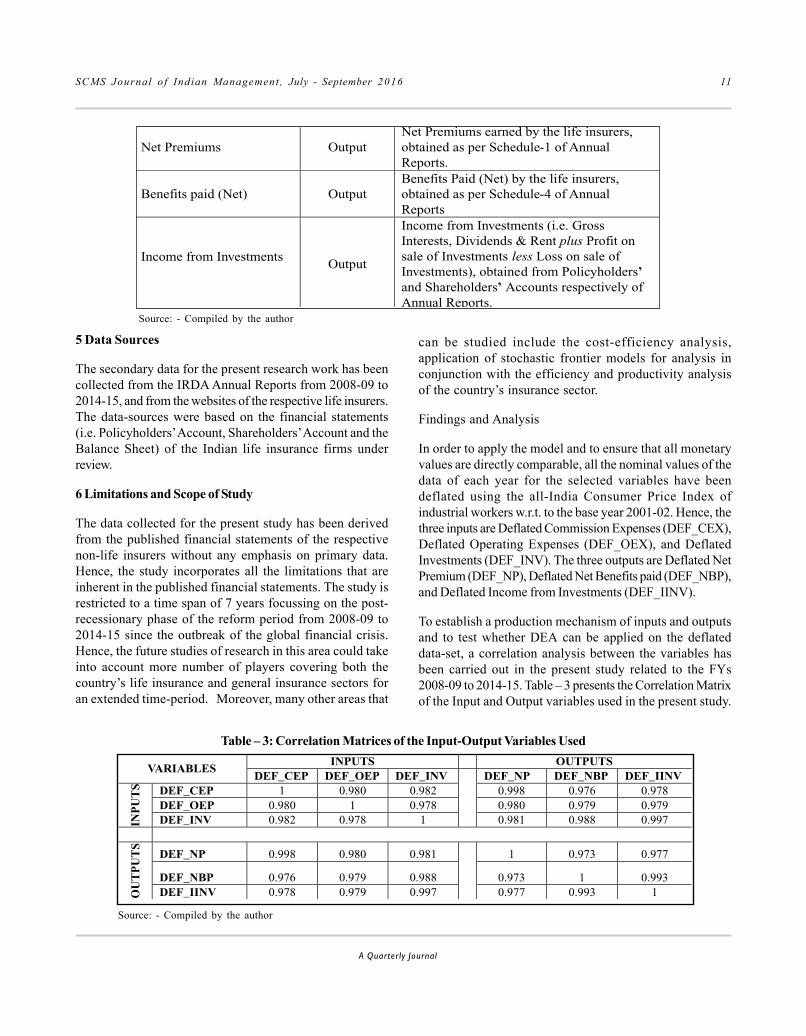
Based on the results obtained from Tables 4 – 10, we findthat the maximum and minimum mean (or, average) valuesover the entire data-set were recorded at 40, 47,007 (Rs. inLakhs) and 41, 860 (Rs. in Lakhs) against the variablesDEF_INV and DEF_CEX respectively during the FY 2014-15. The maximum values obtained against all the selectedvariables were consistently recorded in favour of LICI overthe study-period. Among the input and output variablesused in the present study, the lowest values against all theselected variables were jointly shared by Sahara Life, Bharti-AXA Life and IDBI Federal Life respectively. The maximumand minimum standard deviations over the study-periodwere respectively recorded for the variables DEF_INV andDEF_CEX against the FY 2014-15. The coefficient ofvariation, expressed as a ratio of standard deviation to mean,is considered as a useful statistic ahead of standarddeviation while comparison between data-sets with widelydifferent means. The highest and lowest coefficients ofvariations (measured in times), over the selected study-period, were recorded at 4.03 and 1.42 against the variablesDEF_IINV and DEF_OEX respectively during the FY 2008-09. The coefficient of variation in all the years registered avalue more than one against all the selected input-outputvariables, thereby indicating a high amount of variation inrelation to the mean values across the data-set during theperiod under review.
For the determination of different efficiency results, theapplication of both the CCR and BCC models have beenused in the present study. Value of an efficiency index ‘one’indicates that the insurer lies on the production frontier,
Particulars
INPUTS OUTPUTS
DEF_OEX DEF_CEX DEF_INV DEF_NBP DEF_IINV DEF_NP
Mean 77366 41860 4047007 451467 471396 699818Standard Deviation 195960.69 134252.43 15048167.15 1273904.85 1435143.25 2125230.38Coefficient of Variation ( in Times) 2.53 3.21 3.72 2.82 3.04 3.03Maximum Value 881602 594177 66072742 5674242 6366106 9428456Minimum Value 1051 220 33409 5640 3210 4108
Table – 10: Descriptive Statistics (FY: 2014-15)(Figures in Rs. Lakhs)
Source: - Calculated
and is considered as a ‘best-practice’ insurer relative toothers in the sample under two different assumptions ofscale. Value of an efficiency index less than one indicatesthat the insurer is less efficient than the ‘best practice’insurers in the sample. If there is no difference in efficiencyscores of TE and PTE for an insurer, then the correspondingvalue of Scale Efficiency (SE) is one, which means that theinsurer is operating at the CRS level. In determining SE,there is a need to measure the TE under CRS (also called asTotal TE, as defined in CCR model), and TE under VRSassumptions (also called as Pure TE, as defined in BCCmodel), which is denoted as follows:-
SE = TE (CCR model, CRS) / PTE (BCC model, VRS)
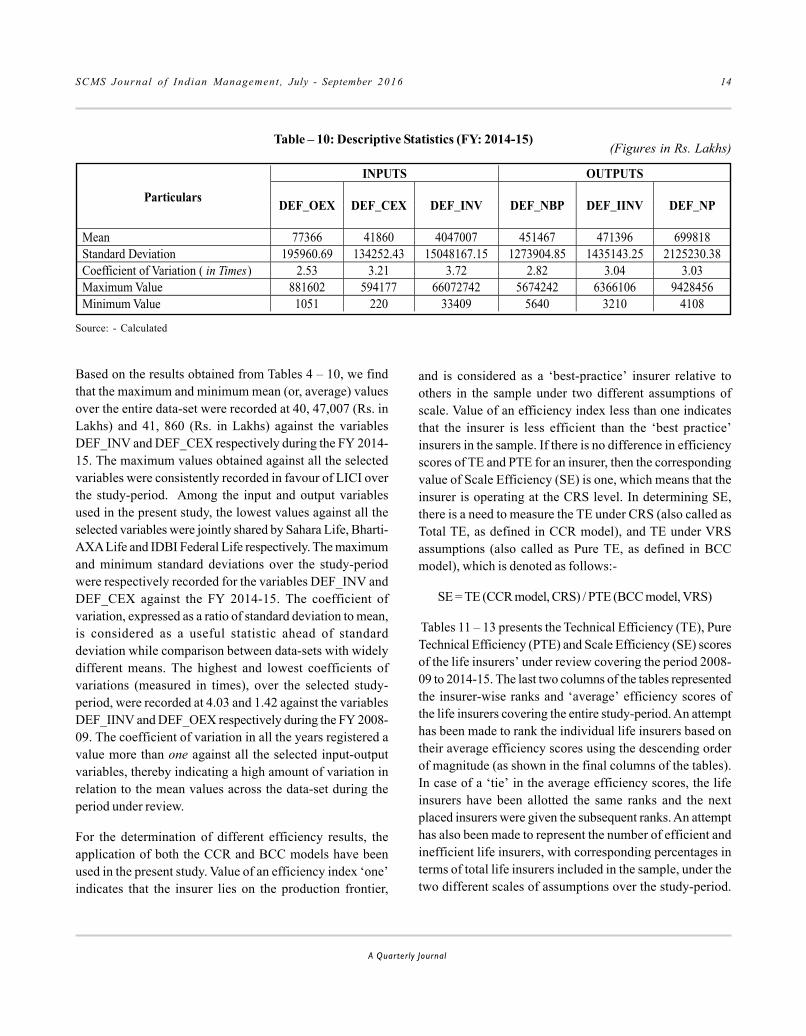
Tables 11 – 13 presents the Technical Efficiency (TE), PureTechnical Efficiency (PTE) and Scale Efficiency (SE) scoresof the life insurers’ under review covering the period 2008-09 to 2014-15. The last two columns of the tables representedthe insurer-wise ranks and ‘average’ efficiency scores ofthe life insurers covering the entire study-period. An attempthas been made to rank the individual life insurers based ontheir average efficiency scores using the descending orderof magnitude (as shown in the final columns of the tables).In case of a ‘tie’ in the average efficiency scores, the lifeinsurers have been allotted the same ranks and the nextplaced insurers were given the subsequent ranks. An attempthas also been made to represent the number of efficient andinefficient life insurers, with corresponding percentages interms of total life insurers included in the sample, under thetwo different scales of assumptions over the study-period.
SCMS Journal o f Indian Management , July - September 2016 15
A Quarterly Journal
DMUs
/Life
Insu
rers
TECR
S
(200
8-09
)TE
CRS
(200
9-10
)TE
CRS
(201
0-11
)TE
CRS
(201
1-12
)TE
CRS
(201
2-13
)TE
CRS
(201
3-14
)TE
CRS
(201
4-15
)Av
g.TE
CRS
(200
8-20
15)
Rank
s
LICI
11
11
11
0.98
60.
998
2
ICIC
I Pru
Life
11
11
11
11
1
HDFC
Stan
dard
0.64
00.
655
0.75
41
11
10.
864
8
SBI L
ife1
11
11
11
11
BAJA
JALL
IANZ
Life
0.99
61
0.75
31
11
10.
964
4
MNY
L0.
453
0.49
20.
549
0.68
90.
665
0.71
60.
679
0.60
614
Birla
SLI
11
0.98
31
11
10.
998
2
Relia
nce L
ife1
11
11
0.88
01
0.98
33
TATA
-AIA
Life
0.52
40.
499
0.51
61
10.
961
0.97
30.
782
9
Kotak
-M L
ife1
0.78
00.
835
11
0.87
80.
722
0.88
87
Exid
e Life
0.99
40.
548
0.41
80.
526
0.66
10.
574
0.58
20.
615
13
PNB
MET
LIFE
0.65
90.
665
0.89
00.
868
0.84
50.
730
0.66
00.
760
10
AVIV
A Li
fe1
11
11
10.
880
0.98
33
SAHA
RA L
ife0.
885
0.65
20.
573
0.63
60.
703
0.82
70.
730
0.71
511
SHRI
RAM
Life
10.
826
0.99
21
0.94
70.
803
0.74
60.
902
6
BHAR
TI-A
XA0.
694
0.80
81
11
11
0.92
95
Futu
re G
ener
ali0.
467
0.32
00.
432
0.50
20.
548
0.61
00.
684
0.50
915
IDBI
Fed
eral
0.94
20.
638
0.60
10.
641
0.62
50.
612
0.61
30.
667
12
Mea
ns0.
847
0.77
10.
794
0.88
10.
889
0.86
60.
847
Num
ber o
f Effi
cient
DM
Us8
(44.
4%)
7(38
.9%
)6
(33.
3%)
12(6
6.7%
)11
(61.
1%)
8 (4
4.4%
)7(
38.9
%)
Num
ber o
f In
-Effi
cient
DM
Us10
(55.
6%)
11(6
1.1%
)12
(66.
7%)
6 (3
3.3%
)7
(38.
9%)
10(5
5.6%
)11
(61.
1%)
Tabl
e – 11
: Tec
hnic
al E
ffici
ency
Sco
res o
f the
Life
Insu
rers
und
er C
RS
Sour
ce:
- C
alcu
late
d

SCMS Journal o f Indian Management , July - September 2016 16
A Quarterly Journal
Tabl
e – 1
2: P
ure T
echn
ical
Effi
cien
cy S
core
s of t
he In
dian
Life
Insu
rers
und
er V
RS
DM
Us/
Life
Ins
urer
sPT
EV
RS
(200
8-09
)PT
EV
RS
(200
9-10
)PT
EV
RS
(201
0-11
)PT
EV
RS
(201
1-12
)PT
EV
RS
(201
2-13
)PT
EV
RS
(201
3-14
)PT
EV
RS
(201
4-15
)A
vg. P
TE
VR
S
(200
8-20
15)
Ran
ks
LIC
I1
11
11
11
11
ICIC
I Pru
Lif
e1
11
11
11
11
HD
FC S
tand
ard
0.64
10.
658
0.75
41
11
10.
865
8SB
I Lif
e1
11
11
11
11
BA
JAJA
LL
IAN
Z L
ife
11
0.75
31
11
10.
965
6M
NY
L0.
456
0.49
60.
550
0.68
90.
666
0.71
80.
682
0.60
814
Bir
la S
LI
11
0.99
61
11
10.
999
2R
elia
nce
Lif
e1
11
11
0.91
71
0.98
85
TATA
-AIA
Lif
e0.
525
0.50
40.
526
11
0.98
70.
996
0.79
110
Kot
ak-M
Lif
e1
0.80
50.
838
11
0.88
60.
735
0.89
57
Exi
de L
ife
10.
593
0.45
00.
543
0.67
20.
594
0.59
10.
635
13PN
B M
ET
LIF
E0.
672
0.68
11
0.87
10.
846
0.73
50.
686
0.78
411
AVIV
A L
ife
11
11
11
0.95
70.
994
3SA
HA
RA
Lif
e1
11
11
11
11
SHR
IRA
M L
ife
11
11
11
0.95
40.
993
4B
HA
RTI-
AX
A1
11
11
11
11
Futu
re G
ener
ali
10.
399
0.45
20.
533
0.63
30.
710
0.77
60.
643
12ID
BI F
eder
al1
10.
604
0.70
40.
764
0.75
50.
731
0.79
49
Mea
ns0.
905
0.84
10.
829
0.90
80.
921
0.90
60.
895
Num
ber
of E
ffic
ient
DM
Us
14(7
7.8%
)11
(61.
1%)
9(5
0.0%
)13
(72.
2%)
13(7
2.2%
)10
(55.
6%)
9 (5
0.0%
)
Num
ber
of I
n-E
ffic
ient
DM
Us
4 (2
2.2%
)7
(38.
9%)
9 (5
0.0%
)5
(27.
8%)
5 (2
7.8%
)8
(44.
4%)
9 (5
0.0%
)N
umbe
r of
Eff
icie
nt D
MU
s E
xhib
iting
CR
S8
(57.
2%)
7 (6
3.6%
)6
(66.
7%)
12(9
2.3%
)11
(84.
6%)
8(8
0.0%
)7
(77.
8%)
Num
ber
of E
ffic
ient
DM
Us
Exh
ibiti
ngIR
S5
(35.
7%)
4 (3
6.4%
)3
(33.
3%)
1(7
.7%
)2
(15.
4%)
2(2
0.0%
)1
(11.
1%)
Num
ber
of E
ffic
ient
DM
Us
Exh
ibiti
ngD
RS
1(7
.1%
)0
(Nil)
0(N
il)0
(Nil)
0(N
il)0
(Nil)
1(1
1.1%
)
Sour
ce:
- C
alcu
late
d

SCMS Journal o f Indian Management , July - September 2016 17
A Quarterly Journal
Tabl
e – 1
3: S
cale
Effi
cien
cy S
core
s of t
he In
dian
Life
Insu
rers
DM
Us/
Life
Insu
rers
SE(2
008-
09)
SE(2
009-
10)
SE(2
010-
11)
SE(2
011-
12)
SE(2
012-
13)
SE(2
013-
14)
SE(2
014-
15)
Avg.
SE
(200
8-20
15)
Ran
ks
LIC
I1
11
11
10.
986
0.99
83
ICIC
I Pru
Life
11
11
11
11
1H
DFC
Sta
ndar
d0.
999
0.99
51
11
11
0.99
92
SBI L
ife1
11
11
11
11
BAJA
JALL
IAN
Z Li
fe0.
996
11
11
11
0.99
92
MN
YL
0.99
40.
993
11
0.99
80.
998
0.99
60.
997
4B
irla
SLI
11
0.98
71
11
10.
998
3R
elia
nce
Life
11
11
10.
959
10.
994
5TA
TA-A
IA L
ife0.
997
0.98
90.
981
11
0.97
40.
977
0.98
87
Kot
ak-M
Life
10.
968
0.99
71
10.
991
0.98
20.
991
6Ex
ide
Life
0.99
40.
924
0.93
00.
969
0.98
50.
967
0.98
60.
965
9PN
B M
ETLI
FE0.
980
0.97
60.
890
0.99
70.
998
0.99
40.
963
0.97
18
AVIV
A L
ife1
11
11
10.
919
0.98
87
SAH
AR
A L
ife0.
885
0.65
20.
573
0.63
60.
703
0.82
70.
730
0.71
514
SHR
IRA
M L
ife1
0.82
60.
992
10.
947
0.80
30.
782
0.90
711
BH
ART
I-A
XA
0.69
40.
808
11
11
10.
929
10Fu
ture
Gen
eral
i0.
467
0.80
30.
957
0.94
20.
866
0.85
90.
881
0.82
513
IDB
I Fed
eral
0.94
20.
638
0.99
50.
909
0.81
80.
811
0.83
90.
850
12
Mea
ns0.
942
0.92
10.
961
0.97
00.
962
0.95
50.
947
Num
ber
of S
cale
Effi
cien
tD
MU
s8
(44.
4%)
7(3
8.9%
)9
(50.
0%)
13 (7
2.2%
)11
(61.
1%)
8 (4
4.4%
)7
(38.
9%)
Sour
ce:
- C
alcu
late
d

SCMS Journal o f Indian Management , July - September 2016 18
A Quarterly Journal
Based on the results obtained from Table – 11, we find thatICICI PruLife and SBI Life consistently recorded TE scoresof 1 (one) over all the years of the study-period, under theCRS assumptions. Hence, they were jointly ranked as first.As evident from Table – 11, the number of efficient firms,with a perfect score of one, in the CCR model (i.e. under CRSconstraints) ranged between 6 (i.e. 33.3 percent) to 12 (i.e.66.7 percent) out of the total number of firms under reviewover the entire duration of the study-period. The seven-year average TE scores revealed that LICI and Birla Sun Lifewere jointly ranked as second with scores of 0.998 each,followed by AVIVA Life and Reliance Life at the third positionwith similar scores of 0.983 respectively. Hence, the abovetwo life insurers with TE scores of less than one wereconsidered as ‘inefficient’, since they could have producedon an average 0.2 percent and 2 percent of more outputrespectively using the same input as that of the efficientfirms. Excepting ICICI PruLife and SBI Life, all the other lifeinsurers depicted average TE scores of less than one overthe study-period, although they were found to be efficientin phases with scores of one or 100 percent efficiency levels.Table – 11 also manifested that out of a total of 18 life insurers’under review, 16 of them were considered as inefficient basedon their average TE scores covering the study-period whichis indicative of the fact that the life insurers could haveactually produced more outputs using the same input levelsas used by the efficient firms. The TE scores of the lifeinsurers ranged between a minimum of 0.320 to a maximumof 1 (one) over all the individual years of the study-period.The lowest rank though was obtained by Future GeneralLife with an average TE score of 0.509, given their newnessand inexperience in the country’s life insurance sector.
Based on the results obtained from Table – 12, we find thatthe situation is much better in case of PTE with more playersattaining the scores of ‘one’ or 100 percent efficiency. It hasbeen found that a total of five life insurers namely LICI,ICICI PruLife, SBI Life, Sahara Life and Bharti-AXA Lifeconsistently recorded PTE scores of one over all theindividual years of the study-period, under the VRSassumption. Hence, they were jointly placed in the firstposition with average efficiency scores of one. Out of the18 life insurers included in the sample, the number of efficientfirms under the BCC model (i.e. relaxation of the CRSconstraint) was higher than those obtained under the CCR
model since the data is expected to be enveloped more tightlyunder the BCC model, and ranged between a minimum of 9(or, 50 percent) to a maximum of 14 (or, 77.8 percent). Thisindicates that the number of efficient life insurers marginallyincreased under the VRS assumption than compared to thatunder the CRS assumption over the corresponding study-period. As evident from Table – 12, the PTE scores of the lifeinsures ranged between a minimum of 0.399 (as recorded inthe year 2009-10) to a maximum of ‘one’ over the study-period. The seven-year average PTE scores depicted BirlaSun Life and AVIVA Life in the second and third positionwith scores of 0.999 and 0.994 respectively. This indicatesthat the above two life insurers could have produced, on anaverage 0.1 percent and 0.6 percent, more outputrespectively using the same inputs as that of the efficientfirms and hence were considered as inefficient. The leastefficient life insurer was found to be MNYL with an averagePTE score of 0.608 over the entire study-period. The lastthree rows of the table represented the number of efficientinsurers with different scale of returns (IRS, CRS and DRS)under the VRS assumptions. The results showed that, onan average, the number of efficient life insurers exhibitingCRS, IRS and DRS in their operations for the entire study-period stood at around 70 percent, 20 percent and 10 percentrespectively. It also appears that the number of life insurersoperating under IRS and DRS showed marginal decreaseand increase respectively over the study-period. Thepercentages ranged between a minimum of 7.7 percent to amaximum of 36.4 percent in case of IRS, but in case of DRSthe percentages ranged between ‘zero’ to a maximum of 11.1percent respectively.
Based on the results obtained from Table – 13, we find thatICICI PruLife and SBI Life were the only players thatconsistently secured a SE score of 100 percent in all theyears of the study-period. As a result, both these playersjointly achieved the first rank in terms of their average scaleefficiency scores covering the entire study-period. The scaleefficiency for each DMU is calculated as a ratio between theCCR and BCC efficiency scores i.e. the ratio of TE scores toPTE scores. The number of scale-efficient insurers showeda fluctuating trend over the study-period, thereby depictingthe inconsistencies in terms of maintaining the optimumoperational scale. Looking at the scores, we find that towardsthe beginning and end of the study-period, around 40

SCMS Journal o f Indian Management , July - September 2016 19
A Quarterly Journal
percent of the DMUs fell in the scale-efficiency zone.However, towards the middle of the study-period, thepercentage of DMUs depicting scale-efficiency showed anincrease of more than 60 percent. As is evident from thetable, the maximum number of DMUs with a scale-efficiencyscore of ‘one’ or 100 percent was mostly recorded duringthe years 2011-12 and 2012-13. With regard to the averagescale-efficiency scores covering the entire study-period,most of the players fell within the range of 80 percent to 100
percent. A low scale-efficiency score of less than 100 percentfor LICI during the year 2014-15 was mostly attributed to alow TE score during the said period.
A look at the following tables 14 and 15 given below showsa more precise distribution of the total life insurers includedin the sample in terms of different scale of operations (viz.,Increasing, Decreasing and the Constant Returns to Scale)under the VRS technology assumptions.
Table – 14: Number and Percentage of Life Insurers Operating at Different Returns to Scale
Years ofOperation
Efficiency Range of DMUs/Life InsurersTotal
CRS IRS DRSNo. ofDMUs
% ofDMUs
No. ofDMUs
% ofDMUs
No. ofDMUs
% ofDMUs
No. ofDMUs
% ofDMUs
2008-09 8 44.4 9 50.0 1 5.6 18 1002009-10 7 38.9 11 61.1 0 Nil 18 1002010-11 9 50.0 9 50.0 0 Nil 18 1002011-12 13 72.2 5 27.8 0 Nil 18 1002012-13 11 61.1 7 38.9 0 Nil 18 1002013-14 8 44.4 9 50.0 1 5.6 18 1002014-15 7 38.9 10 55.6 1 5.6 18 100
Source: - Calculated
Based on the results obtained from Table – 14, we find thataround 40 percent to 70 percent of the entire sample of lifeinsurers was found to operating at the constant returns toscale (CRS) in almost all the years of the study-period. Inother words, majority of the life insurers in the range of 60 to70 percent were found to be operating at the Most ProductiveScale Size (MPSS) during the period 2011-12 to 2012-13. Asignificant number of life insurers in the range of 35 to 50percent were found to be operating either at the sub-optimalscale or at the supra-optimal scale during the initial and inthe concluding years of the study-period; hence the mostefficiency level in case of such life insurers was not obtainedduring the period under review.
Table – 15 presents the year-wise number of efficient andprojected life insurers with different returns to scale. Thetable clearly shows that a majority of the life insurers werefound to be operating at the sub-optimal level as reflectedin the increasing returns to scale (IRS) during the beginningand final years of the study-period. Out of the total lifeinsurers included in the sample, a few of them were found tobe operating at the supra-optimal scale as reflected in thedecreasing returns to scale (DRS). Hence, it is clear thatunless there is a significant increase in the number of insurersoperating at the CRS, the country’s life insurance sector willcontinue to give a dismal look in terms of efficiency. Hence,the insurance companies need to increase their firm-size sothat they can operate more at the CRS.

SCMS Journal o f Indian Management , July - September 2016 20
A Quarterly Journal
DM
Us/
Life
Insu
rers
Year
s of O
pera
tion
2008
-09
2009
-10
2010
-11
2011
-12
2012
-13
2013
-14
2014
-15
Effic
ient
Proj
ecte
dEf
ficie
ntPr
ojec
ted
Effic
ient
Proj
ecte
dEf
ficie
ntPr
ojec
ted
Effic
ient
Proj
ecte
dEf
ficie
ntPr
ojec
ted
Effic
ient
Proj
ecte
d
LICI
CRS
CRS
CRS
CRS
CRS
CRS
DRS
ICIC
I Pru
Life
CRS
CRS
CRS
CRS
CRS
CRS
CRS
HD
FC S
tand
ard
IRS
IRS
CRS
CRS
CRS
CRS
CRS
SBI L
ifeCR
SCR
SCR
SCR
SCR
SCR
SCR
S
BAJA
J Life
DRS
CRS
CRS
CRS
CRS
CRS
CRS
MN
YL
IRS
IRS
CRS
CRS
IRS
IRS
IRS
Birla
SLI
CRS
CRS
IRS
CRS
CRS
CRS
CRS
Relia
nce
Life
CRS
CRS
CRS
CRS
CRS
DRS
CRS
TATA
-AIA
Life
IRS
IRS
IRS
CRS
CRS
IRS
IRS
KO
TAK
-M L
ifeCR
SIR
SIR
SCR
SCR
SIR
SIR
S
EXID
E LI
FEIR
SIR
SIR
SIR
SIR
SIR
SIR
S
PNB
MET
LIFE
IRS
IRS
IRS
IRS
IRS
IRS
IRS
AVIV
A L
ifeCR
SCR
SCR
SCR
SCR
SCR
SIR
S
SAH
ARA
Life
IRS
IRS
IRS
IRS
IRS
IRS
IRS
SHRI
RAM
Life
CRS
IRS
IRS
CRS
IRS
IRS
IRS
BHA
RTI-
AX
AIR
SIR
SCR
SCR
SCR
SCR
SCR
S
FUTU
RE L
ifeIR
SIR
SIR
SIR
SIR
SIR
SIR
S
IDBI
Fed
eral
IRS
IRS
IRS
IRS
IRS
IRS
IRS
Tab
le –
15:
Lif
e In
sure
r-w
ise
Ret
urns
to S
cale
Sour
ce:
- C
alcu
late
d

SCMS Journal o f Indian Management , July - September 2016 21
A Quarterly Journal
A look at Table – 15 also reveals the increase in the totalnumber of life insurers with CRS and IRS, with a relativelyfewer number of DRS insurers. These results are indicativeof the fact that there is immense scope for improvement forthe life insurers to enhance their efficiencies and firm-sizesso as to operate at the minimum point of the long-run averagecost curve. The results also indicated that ICICI PruLife andSBI Life were the only players who operated at the mostproductive scale size (MPSS) under constant returns to scale
during all the years of the study-period. The other lifeinsurers such as LICI, Bajaj Allianz Life, Birla SLI, RelianceLife and AVIVA Life also showed commendable results interms of exhibiting CRS, with exceptions, in most of theyears of the study-period. The life insurers operating at theCRS or IRS have the opportunity to be more efficient withhigher growth, whereas the ones operating at DRS areconsidered to be too large in terms of scale economies. Theresults were also evident from the following Figure – 2.
Figure –2: Year-wise Returns to Scale of Indian Life Insurers
Source: - Calculated
Figure – 2 exhibits the year-wise number of efficient andprojected life insurers with different returns to scale. Thefigure also substantiates a fluctuating trend in the totalnumber of life insurers with CRS, IRS and DRS levels ofoperating scales. It is also evident that the number of playersoperating at CRS and IRS are more in comparison to DRSover the study-period. Hence, the life insurance companieshave to make necessary adjustments in their scale size so asto operate at the constant returns to scale.
Figure – 3 given below depicts the yearly average TE, PTEand SE scores of the life insurers’ under review covering the
study-period from 2008-09 to 2014-15. The figure exhibited asharp decline in the average efficiency scores of the lifeinsurers during the initial years of the study-period during2008 to 2011, after which it revived again. In terms of PTEscores that indirectly talks about managerial competenceand proper allocation of resources, there was not muchfluctuations observed in the scores over the study-period,barring the years 2008-09 to 2010-11. A similar trend wasalso noticed in case of TE and SE scores of the life insurersduring the period under review.

SCMS Journal o f Indian Management , July - September 2016 22
A Quarterly Journal
Figure – 3: Year-wise Average Efficiency Scores of the Indian Life InsurersSource: - Calculated
As evident from the Figure – 3, there was a substantial fallin all the year-wise average efficiency scores of the lifeinsurers in the country’s life insurance sector during theyears 2008-09 to 2010-11. The reasons for such a declinecould be attributed to the contagion effects of the globalfinancial meltdown, owing to the US sub-prime crisis, thatoccurred during the year 2007-08. The life insurancecompanies showed commendable signs of recovery sincethe FY 2011-12 from the impact of such a financial crisis.Since the year 2011-12, the average efficiency scores of thelife insurers under review became more or less streamlined,as is evident from the figure - 3. Hence, it would be wise onthe part of the insurance companies to develop strategies inorder to mitigate any spill-over effects of any future globalcrisis in their respective businesses. Moreover, theinsurance companies should also take a relook at theproducts, pricing and operational strategies in order to figureout the areas of improvements in terms of efficiency oroutput-maximisation.
Conclusion
It has been observed that there is immense scope forimprovement in the country’s life insurance sector. Theefficiency and productivity levels of the life insurers’ under
review showed fluctuating trends over the study-period,thereby depicting the inconsistencies in terms of maintainingthe optimum operational scale. It has been found thatapproximately an average of 55.5 percent of the total lifeinsurers has exhibited CRS in their operation under thevariable returns to scale assumptions. In some of the cases,the insurers were found to be operating at the sub-optimalor supra-optimal scale over the study-period; hence the mostefficiency level was not obtained. ICICI PruLife and SBI Lifewere the only players who operated at the most productivescale size (MPSS) under constant returns to scale over allthe years of the study-period. It has been observed that theaverage PTE scores exceed the average TE scores of the lifeinsurers against all the individual years of the study-period.The best TE scores, relative to CRS technology, wereattained by ICICI PruLife and SBI Life with results of 100percent throughout the study-period. A further investigationinto the results shows that the main contributor to the lowTE scores was mainly because of PTE, and not SE. The lowPTE scores indirectly talks about the poor managerialcompetence and improper allocation of resources by the lifeinsurers. Hence, looking at the competitive wave prevailingin the country’s life insurance domain, the life insurers mustwork upon all aspects of efficiency for sustainability ofoperations in the long-run. This would not only improve

SCMS Journal o f Indian Management , July - September 2016 23
A Quarterly Journal
the operational efficiencies of the individual players butwould also result in a better performing industry as a whole.In addition, the insurance companies need to makenecessary adjustments in their scale-size so that they canoperate at the CRS.
Moreover, the researcher finds that there is a substantialfall in the efficiency scores of most of the private life insurersduring the initial years of the study-period, the reason forwhich could be attributed to the global slowdown periodafter 2007-08. Thus, it would be wise on the part of thestrategy-thinkers to adopt right changes in order to arrestspill-over effects in the country’s life insurance segmentfrom any future financial crisis.
References
Bawa, S. K. and N. Bhagat(2015). “Efficiency of Life insuranceCompanies Operating in Punjab.” Pacific BusinessReview International, 7 (9), 76-85.
Bawa, S. K. and Ruchita (2011). “Efficiencies of HealthInsurance Business in India: An Application ofDEA.” American Journal of Social and ManagementSciences, 2 (2), 237-247.
Chakraborty, J. and P. P. Sengupta (2012). “MeasuringPerformance and Efficiency Growth of the SelectedIndian Life Insurance Companies: A Total FactorProductivity Approach.” Arth-Prabhand: A Journalof Economics and Management (APJEM), 1(6) 1-20.
Chakraborty, J. and R. P. Sinha, (2010). “MeasuringProductivity and Efficiency of the Indian LifeInsurance Industry: A Total Factor ProductivityApproach”. SURVEY (A Quarterly ManagementResearch Journal), 50 (3 & 4), 67-76.
Cooper, W. W., L. M. Seiford, and K.Tone (2007). DataEnvelopment Analysis: A Comprehensive Text withModels, Applications, References and DEA-SolverSoftware (2nd Edition). Springer Publications, USA.
Dutta, A. (2013). “Impact of Privatization on Productivity: ANon-Parametric Analysis of Indian InsuranceSector.” Global Business Review, 14 (2), 297–314.
Dutta, A. (2011). “Efficiency and Productivity Analysis ofIndian Insurers in Post Reform Era.” (UnpublishedPh.D Thesis), Department of Humanities & SocialSciences, National Institute of Technology,Durgapur, West Bengal, India.
Garg, M. C. and Deepti (2008). “Efficiency of GeneralInsurance Industry in India in the Post-LiberalizationEra: A Data Envelopment Approach.” Journal of Risk& Insurance, 5 (1), 32-49.
Janjua, P. Z. and K.Akmal(2015). “A Comparative Analysisof Economic Efficiency of Conventional and IslamicInsurance Industry in Pakistan.” Pakistan BusinessReview, 17 (1), 21 - 44.
Mandal, S. and S. G. Dastidar(2014). “A DEA-investigationof efficiency of the Indian general insurance duringrecession.” Journal of Advances in ManagementResearch, 11 (1), 115 – 136.
Nandi, J. K. (2014). “Relative Efficiency Analysis of SelectedLife Insurers in India using Data EnvelopmentAnalysis.” Pacific Business Review International,6 (8), 69-76.
Owusu-Ansah, E., Dontwi, I. K., Seidu, B., Abudulai, G. &Sebil, C. (2010). “Technical efficiencies of Ghanaiangeneral insurers.” American Journal of Social andManagement Sciences, 1 (1), 75 – 87.
Saad, N. M. and N. E. H. Idris(2011). “Efficiency of LifeInsurance Companies in Malaysia and Brunei: AComparative Analysis.” International Journal ofHumanities and Social Science, 1 (3), 111-122.
Singh, M. and R. Kumar (2011). “Efficiency Analysis of thePublic Sector General Insurance Companies: AComparative Study of Pre- and Post-Reform Period.”Journal of Risk & Insurance, 8 (4), 28-46.
Sinha, A. (2013). “Efficiency Analysis of Private Life Insurersin India: An Application of Data EnvelopmentAnalysis.” Pacific Business Review International,5 (9), 37-48.

SCMS Journal o f Indian Management , July - September 2016 24
A Quarterly Journal
Sinha, A. (2012): “A Study on Performance of Public andPrivate Sector Life Insurance Companies in India.”(Unpublished Ph.D. Thesis). Department ofCommerce, University of Kalyani, West Bengal, India.
Sinha, R. P. (2015). “A Dynamic DEA Model for Indian LifeInsurance Companies.” Global Business Review, 16(2), 258-269.
Sinha, R. P. (2007). “Operating Efficiency of Life InsuranceCompanies-An Assurance Region Model.” ArthaVijnana, 49 (3 – 4), 305 - 320.
******
Sinha, R. P. (2007). “Productivity and Efficiency of IndianGeneral Insurance Industry.” Journal of Risk &Insurance, 4 (2), 33-43.
Sinha, R. P. (2006). “Operating Efficiency of Life InsuranceCompanies: A Data Envelopment Approach.”Journal of Risk & Insurance, 3 (4), 29-37.
Tone, K. and B. K. Sahoo (2005). “Evaluating cost efficiencyand returns to scale in the Life Insurance Corporationof India using data envelopment analysis.” Socio-Economic Planning Sciences, 39 (4), 261 – 285.

SCMS Journal o f Indian Management , July - September 2016 25
A Quarterly Journal
Expiration Day Effects ofDerivatives in India
Neetu Chadha and Neha Singhal
Abstract
Neetu ChadhaAssistant ProfessorDelhi Institute of Advanced StudiesDelhi Institute of Advanced StudiesPlot No. 6, Sector- 25, Rohini, New Delhi-110085+919999736728. [email protected]
NehaSinghalSenior Analyst, Copal Research Pvt. LtdCopal Research Pvt. Ltd, 267, Shankar Chowk RDUdyogVihar II, Sector-20, Gurgaon, Haryana.D-96, prashantvihar, Rohini sector-14, New Delhi+919999432371 [email protected]
ndian economy took a shift from a closed one to anopen one after 1991 reforms. The government wasentirely restructured to reduce their role in the financial
sector. A number of reforms were introduced forimprovements in the legal and technological framework. Thereforms made Indian firms compete in the global market andalso increased the foreign participation. The setting up ofprices and fixing interest rates were no more regulated bythe government or CCI. They were now left to be decidedby the free market forces.
Year 1994 marked the establishment of NSE by a group ofIndian Financial Institutions. It was formed as a strongcompetitor to BSE, the oldest stock exchange of India. NSEensured that the trading was not confined to a few brokersrather cover all those who were qualified to trade. Theobjectives were clearly achieved by the unveiled astonishingresults. Since 1994, the market cap at NSE grew up by 2462%.
But, the unexpected fluctuations in the prices and interestrates were not evaded by such a startling performance of
The present study examines the impact of the expirations of derivative contracts on trade volumes and returns fromsecurities. Descriptive statistics to check any such volatility in S & P CNX Nifty for a period of 10 years i.e., 1st April2005 to 31st March 2015. ADF model validates the stationarity of the data. Moreover AR (4) and ARCH model havebeen used to check the existence of any residual error in the data under consideration. GARCH/TGARCH modelsanalyses the existence of any price reversal effect on the day following the expiration day. The results indicate thatthe trade volumes on the expiration days were notably higher than the volumes on the non-expiration days. A highvolatility has been observed in the returns on the expiration days as compared to the usual trend followed on the non-
expiration days. No price reversal has been observed
Keywords: Derivatives, Price Reversal, ARCH, GARCH, Expiration, Volatility, Return, Volume
Abstract
I
SCMS Journal o f Indian Management , July - September 2016 26
A Quarterly Journal
the market and it resulted in risk and uncertainty and madeit quite difficult for the companies to estimate their futurerevenues. This complication was resolved by the emergenceof derivatives market in the two major stock exchanges ofIndia, NSE and BSE. A derivative is an agreement with itsworth from the capacity of a principal entity. The objectivewas to improve the risk management by the investors andbring the informational efficiency in the market. Muchrefinement was awaited after the introduction of thederivative market.
The performance exhibited was considerably satisfactory.Between April 2005 and March 2015, the total turnover ofthe equity derivatives went up by 176 percent. 1808companies were found listed on the exchange by the end ofMarch 2015, whereas 1014 of the listed stocks were regularlytraded. In 2016-2017, the turnover in the derivatives segmentof the equity market has been calculated (till date) to be 364percent of the corresponding turnover in the underlyingcash market.
On the contrary, the link between the derivatives and cashmarkets facilitated by the trade programs and index arbitrageraised a number of concerns among the market regulators inrelation to crisis. The investors looked forward to realize thearbitrage profits due to the availability of the price and returnvolatility in the underlying cash market. A number ofmeasures, thus, have been aimed at reducing such marketvolatilities leading to abnormal profits to certain investors.Consideration of expiration day effects is one such measure.
The expiration day effects occur when the traders adjusttheir short positions before the derivative contracts expire.This not only affects the prices and volume of the securitieson that particular day but it also has a price reversal effecton the day following the expiration day, if a number ofarbitrageurs move in the same direction and liquidate theirsecurities at the same time. The investors trading in thederivative market would have concerns in regards to thesettlement price and they will try to influence and manipulatethe market price of the underlying security in the favourabledirection, which necessitates the clear understanding of theexpiration day effects for the investors trading in derivativemarket as well as the stock market.
Literature Review
The increasing concern of the expiration day effects has ledto a number of researchers studying the impact of thederivative expiration on the volatility of the returns and
volumes traded in the market and the possible reasonsbehind such impact. The researches have different modelsapplied resulting in different results and conclusions. A fewof them have been considered before undertaking thefollowing study: Stoll and Whaley, (1997), Bhaumik, S andBose, S. (2007), Feinstein, S.P., Goetzmann, W.N., 1988,Bollerslev, T. (1986), and a few others.
Bollerslev, T. (1986) studied about the generalizedautoregressive conditional heteroscedasticity. Theconditions of stationarity and autocorrelation structures werederived to study this model. The study involved a numberof estimations and application of tests so as to generalizethe ARCH model. GARCH model has been extended toinclude the ARCH effects. An example of the uncertainty ofthe rate of inflation was used for the empirical analysis.
Feinstein and Goetzman(1988) observed extraordinaryvolume on expiration-days with insignificant price effect.They investigated a period when the stock options, indexstock options, and index stock futures expiredsimultaneously to check the volatility in the stock marketduring this period. They used the concept of the expirationrule change to Friday and observed that the high volatilityseen at the time of expiration was reduced as theconsequence of the rule change.
After the new settlement price rule changed to the Fridayopening rather than in 1987, Stoll and Whaley (1991) againobserved high trading volume and highly volatile assets onthe expiration-days, Friday opening being the onlydifference.
Bhaumik, S and S. Bose, (2007) investigated the impact ofderivative expiration on the trade volume, returns and thevolatility of returns of the underlying cash market. AR-GARCH model was used to analyze the impact taking thelargest stock exchange of India into consideration. Theresults given by them presented that the trade volumes onexpiration days (weeks) were higher than those on non-expiration days (weeks). They also observed the volatilityin the daily returns of the market index.
Debasish, (2010) examined whether the expiration effectsexist on the NSE nifty index. The period of analysis coversindex future. They used the pooled t-test along with theWilcoxon rank sum test to check whether return, price, andtrading volume were notably different at expiration with thaton non-expiration. Findings here suggested that the Indian

SCMS Journal o f Indian Management , July - September 2016 27
A Quarterly Journal
stock market had expiration day effects in relation to thederivative trading. Investors and speculators were able tomake profits by exercising the arbitrage opportunities arisingfrom the temporary mismatch in prices in cash and derivativemarket.
Narang and vij (2012) evaluated the impact of expiration ofthe derivatives on the Indian spot volatility by using theregression techniques and GARCH models includingTGARCH, EGARCH and PGARCH. They found that therewas concentration of volumes in some particular months.The conclusion drawn was that it was a speculators’ market.The manipulation by the speculators was found to be themain reason behind the high volatility during and after expiryof the studied contracts. The impact of expiration day onthe volume, return and volatility depicted that the priceswere speculative and traders cover their risk by taking largespot positions resulting in high volatility during expirationperiod.
Objectives of the study
The main objectives of the present study are:
To measure the expiration day effects ofderivative trading on trading volume, returns,and volatility of Indian stock market, and
To examine the presence of price reversalon days following the expiration days.
Hypothesis
Testable Hypothesis has been stated as:
H0: Variance of returns for expiration-days is not significantlydifferent from variance of return during non-expiration days.
Variables and Data
In the study, NSE is selected for finding evidences on theexpiration-day effects of derivatives in the Indian stockmarket. NSE has established itself as the sole market leaderin the derivatives segment in the country and it currentlyaccounts for more than 99% of derivatives market share. Asstock market index is considered as a good barometer forthe overall market behaviour, CNX Nifty index of NSE isselected as proxy for stock market behaviour. The underlyingstocks have been chosen in a way that they reflect differentliquidities for the associated derivatives.
The Nifty is a 50-stock market capitalization weighted index.The companies included in nifty cover 22 different industries.Overall, the data for 2484 trading days have been sorted, ofwhich 157 were the days on which derivatives contractsexpired at the exchange. The derivative contracts expire onthe last Thursday of every month.
For empirical analysis the daily price and turnover data
on S&P CNX Nifty for 1stApril 2005 to 31stMarch2015 is used. This data is obtained from NSE s officialwebsite. For 10 years sample period, there are 3804observations
Research Methodology
In this study, the measure of return for a given trading dayis the difference between the value of Nifty on that day andthe value of the Nifty on the previous trading day.
The variance of return for a particular day is used as ameasure of volatility.
The volume is taken as the natural logarithm of the value ofthe turnover of Nifty on a particular day.
Price reversal is defined as the reversal of the Nifty price(reflected through return/volatility)in opposite directionwhen the expiration-day passes.
The price, volume and return are investigated for theirvolatility by comparing the values of these variables for theday prior to expiration, the day of expiration and the dayafter the expiration of the derivative contracts with the valuesrecorded 1 week and 2 week prior the expiration days.
For the study on Indian market, there search one xpirationday effects has been extended in th efollowingways:
First,theexpirationeffect on the market has been examinedonaccount of the growth of the trade volume andreturns.
Second, a more sophisticated approach has been used toconsider the expiration day effects than taking a merecomparison of the measures of central tendency by includingthe generalized auto regressive conditional heteroscedasticity (GARCH/TGARCH) models to generate themean and variance equations of returns in the marke toveranex tended time period.

SCMS Journal o f Indian Management , July - September 2016 28
A Quarterly Journal
Figure 1: Comparativetrading (Cr.):Expirationdayvs.control Note:Control is calculated as an AverageofreportedvolumeonThursdays1and2weekspriortoexpiration
Thursday.
Ratio calculated is of expiration day to control.The total number of trade realised on the exchange, and theratio of the trades on expiration Thursdays to the trades ona control category are highlighted in Figure 1. The controlcategory is the average of the volume of trades on the non-
expiration Thursdays. The volumes of trade on expirationdays (weeks) were notably higher than the volumes observedon non-expiration days (weeks).Also, the numbers of trades on expiration days and thosedepicted by the control category are closely correlated; thecorrelation coefficient being 0.59.
Table1.1: Growthrate of volumes (No. of sharestraded)
EXPIRATION_DAY EXPIRATION_WEEKNON_EXPIRATION_DAYNON_EXPIRATION_WEEK
Mean 66.02397 14.96305 35.10106 11.09553Median 128.8100 69.74000 87.52500 -11.38000Maximum 14104.49 12109.12 5096.100 25888.27Minimum -7671.900 -9054.940 -6222.630 -9084.630Std. Dev. 2896.627 2204.384 1997.730 1955.882Skewness 0.523036 -0.101548 -0.151385 4.076694Kurtosis 5.818120 5.868082 3.945972 61.45519
Jarque-Bera 58.73445 259.3817 6.576877 77362.44Probability 0.000000 0.000000 0.037312 0.000000
Sum 10299.74 11267.18 5616.170 5913.920Sum Sq. Dev. 1.30E+09 3.65E+09 6.35E+08 2.04E+09
Observations 156 753 160 533
Empirical Analysis

SCMS Journal o f Indian Management , July - September 2016 29
A Quarterly Journal
The descriptive statistics for the growth rate of volumes forexpiration and non-expiration days (and weeks) has beenreported in Table 1.1. The growth rate of volumes has beencalculated by taking the difference between the volumetraded on a particular day and the volume traded on theprevious day. The null hypotheses that the measures ofcentral tendency for the growth rate of trade volume on theexpiration days (weeks) equals the measures of central
tendency for the non-expiration days (weeks) is being testedin the statistics studied.
It can be seen that the null hypotheses is rejected as theexercise for the database was conducted.
Thus, it can be concluded that the growth rate of tradevolumes is greater on the expiration days (weeks) than thoseon the non-expiration days (weeks).
Table 1.2:Returns
EXPIRATION_DAY EXPIRATION_WEEK NON_EXPIRATION_DAY NON_EXPIRATION_WEEK
Mean 41.03109 8.465870 41.22125 12.60779Median 45.35000 8.650000 74.15000 4.200000Maximum 1254.850 1156.250 1291.700 1516.000Minimum -1413.500 -1167.400 -1476.650 -963.8000Std. Dev. 293.3991 122.8386 293.9800 160.3413Skewness -0.578896 -0.617905 -0.672813 1.504611Kurtosis 7.927287 28.74643 8.848916 22.64288
Jarque-Bera 166.5211 20845.73 240.1368 8770.031Probability 0.000000 0.000000 0.000000 0.000000
Sum 6400.850 6374.800 6595.400 6719.950Sum Sq. Dev. 13342871 11347175 13741450 13677361
Observations 156 753 160 533
A similar exercise for the returns of securities on the Niftyindex has been undertaken, and the results are reported inTable 1.2. The returns for a given trading day has beencalculated by taking the difference between the value ofNifty on that day and the value on the previous day.
The descriptive statistics for the returns on the expirationand non-expiration days (& weeks) have been reported inthe table.
The null hypotheses that the measures of central tendencyfor the return on the expiration days (weeks) equals the
measures of central tendency for the non-expiration days(weeks) has been tested in the statistics studied.
Besides the visible acceptance of the hypothesis that thevariance of return for expiration days equals that for thenon-expiration days, all the rest can be rejected for thisdatabase as well.
The highly volatile market return can thus be assumed to beaffected enormously by the expiration of equity futures andoptions contracts.

SCMS Journal o f Indian Management , July - September 2016 30
A Quarterly Journal
Expiration day effects and price reversals
The evaluation of the descriptive statistics calculated aboveindicates that the expiration day of derivatives affects thevolatility of the returns but it does not directly affect thereturn itself. Another careful study has been done below soas to understand the impact of the derivative expiration onthe market returns. The study analyzes not only the impactof the derivative expiration on the returns of the expirationday itself but also on the returns of the day following theexpiration.
Price reversal occurs when the return on the expiration dayis different from the usual trend in returns, thus necessitatingthe reversal in the return on the day following the expiration.Mixed evidences have been reported about such reversalsin the past researches.
A stationary time series is the one whose statisticalproperties (mean, variance, autocorrelation, etc.) are foundto be constant over time.
The modern theories are concerned with the stationary timeseries, so, the Volume and Return series of the index niftyare tested for stationarity with augmented Dickey Fuller(ADF) test.Augmented Dickey Fuller (ADF) Test
Table 2.1: ADF test for RETURN series
Test Statistic: -49.31968
Critical Values 1% 5% 10%
t-statistic 3.96174 3.41162 3.12768
Table 2.2: ADF test for VOLUME series
Test Statistic: -6.365747CriticalValues 1% 5% 10%
t-statistic 3.96175 3.41162 3.12768
The results of unit root test shown in the tables 2.1 & 2.2indicates that Nifty volume and return series are stationaryas ADF test statistic is higher than its critical values at allthe levels, thus rejecting the null hypothesis of unit root inreturn and volume series implying the stationarity of thedata.
AR (4) Model
AR (4) model is used as under to check any residual errorsin the return and the volume series.
ARCH statistics is also applied to check the availability ornon-availability of the ARCH effects i.e., whether the errorterms has a characteristic variance or not.
Table 3.1: AR model for VOLUME series
Variable Coefficient Std. Error t-statistic Prob.C 6121.752 49.10083 124.6772 0.0000
Table 3.2: AR model for RETURN seriesVariable Coefficient Std. Error t-statistic Prob.
C 0.034644 0.02617 1.323802 0.1857
ARCH ModelTable 4: Heteroscedasticity test: ARCH
Variable Coefficient Std. Error t-Statistic Prob.
C 3505865 261624.8 13.40035 0.0000
RESID^2(-1) 0.412192 0.018313 22.50819 0.0000
Unlike table 3.1, table 3.2 i.e., AR (4) model for the returnseries observes an insignificant value. Table 4 displayingthe ARCH statistics also indicates that the data inconsideration have ARCH effects. Thus, the null hypothesisof no ARCH effects is rejected. The below used GARCHmodel is thus extended to include the arch effects.
GARCH Model
In the illustration, the commonly used ARCH(1) andGARCH(1, 1) models are outlined. The (G)ARCH model isextended to account for possible expiration day effects andprice reversals on the day(s) after.
3 variables i.e. Return, Dummy 1 and Dummy 2 are consideredto find the significant level.
Volume is taken to be the dependent variable.
Where Dummy 1 is the dummy variable for expiration daywhich is used to find expiration-day effect on volume, returnand volatility and this dummy takes the value of unity for allexpiration-days and the value of zero otherwise i.e. for allnon-expiration days.
Dummy 2 is the dummy variable for the next day succeeding(Friday) the expiration day for checking price reversal effect.

SCMS Journal o f Indian Management , July - September 2016 31
A Quarterly Journal
This dummy takes the value of unity for the next day’ssucceeding the expiration-days and the value of zerootherwise i.e. for all other days.
GARCH equation
GARCH=C(5)+C(6)*RESID(-1)^2+C(7)*GARCH(-1)
Variable Coefficient Std. Error z-statistic Prob.
C 5802.51 39.99545 145.0756 0.0000
RETURN -29.64993 24.16336 -1.227061 0.2198
DUMMY_1 2163.827 100.4012 21.5518 0.0000
DUMMY_2 358.1682 133.155 2.689859 0.0071
Table 5.2: Variance Equation
Variable Coefficient Std. Error z-statistic Prob.
C 345175.3 41983.54 8.221681 0.0000
RESID(-1)^2 0.257925 0.020319 12.6936 0.0000
GARCH(-1) 0.681856 0.021041 32.40508 0.0000
Table 5.1 i.e., the mean equation indicates a non-significantvalue, thus implying an acceptance of the defined hypothesis.So, it can be said that there is neither a positive nor a negativeprice reversal following the expiration of the derivativecontracts.
TGARCH Model
Finally, a threshold GARCH (or TGARCH) model is estimatedthat takes into account the possibility that over-pricing andunder-pricing in the mean equation may affect volatilitydifferently.
TGARCH equation
GARCH = C (5) + C (6)*RESID (-1)^2 + C(7)*RESID (-1)^2 *(RESID(-1)<0) + C (8)*GARCH (-1)
Variable Coefficient Std. Error z-statistic Prob.
C 5796.572 42.424 136.6343 0.0000
RETURN -28.6595 24.55722 -1.16705 0.2432
DUMMY_1 2163.187 100.6485 21.49249 0.0000
DUMMY_2 363.389 133.3425 2.72523 0.0064
Table 6.1: Mean Equation
Table 5.1: Mean Equation
Table 6.2: Variance EquationVariable Coefficient Std. Error z-statistic Prob.
C 356556.7 44150.75 8.075893 0.0000
RESID(-1)^2 0.272476 0.02525 10.79093 0.0000
RESID(-1)^2*(RESID(-1)<0) -0.02303 0.029878 -0.77022 0.4412
GARCH(-1) 0.675719 0.022048 30.64804 0.0000
The result of the TGARCH Model, in table 6.1 & 6.2, is non-significant thus leading to the acceptance of the hypothesis.Thus, there is no evidence of significant over-shooting orunder-shooting of the index on account of expiration ofderivatives contracts.
CONCLUSION
The study indicated a significant expiration day effect ofderivatives in India. The volume of trading is higher onexpiration days than on non-expiration days. Both the meanand volatility of the returns to the market index at theNational Stock Exchange were significantly different onexpiration days, compared with other days.
No evidence of price reversals on the day following theexpiration day was found. In other words, either the pricereversal occurred on the expiration days itself, or themagnitude of the changes on the expiration day were notso large so as to necessitate a correction on the followingday.
The derivatives trading in India has eventually improvedthe overall market depth and market liquidity thus reducingthe asymmetric information and thereby reducing thevolatility of the market even at expiration.
Thus, it can be concluded that there is no destabilization inthe underlying stock market as a result of the expirationdays of the equity derivatives.
References
Alkeback, P. and N. Hagelin (2004). “Expiration day effectsof index futures and options: Evidence from a marketwith a long settlement period.” Applied FinancialEconomics, 14:6, 385-396.
Bhaumik, S., and S. Bose, “Impact of Derivatives Tradingon Emerging Capital Markets: A note on ExpirationDay Effects in India.” William Davidson InstituteWorking Paper Number 863, March 2007.

SCMS Journal o f Indian Management , July - September 2016 32
A Quarterly Journal
Bollerslev, T. “Generalised Autoregressive ConditionalHeteroskedasticity.” Journal of Econometrics, Vol. 31,no. 3, pp 307-328, 1986.
Bollerslev, T. (1987). “A conditionally heteroskedastic timeseries model for speculative prices and rates ofreturn.” Review of Economics and Statistics, 69:3,542-547.
Debasish, “Investigating expiration day effects in stockindex futures in India.” Journal of Economics andBehavioural Studies, Vol. 1, pp. 04-09, December 2010.
Feinstein, S.P., and W.N., Goetzmann, The effect of the‘‘triple witching hour’’ on stock market volatility,Economic Review (September, October), 02–18, 1988.
Hancock, G.D. (1993). “Whatever happened to the triplewitching hour?” Financial Analysts Journal, 49:3,66-72.
Narang and vij, “long –term effects of expiration ofderivatives on Indian spot volatility”, pp. 02-05, 2012.
Sadath and Kamaiah, “Expiration effects of stock futures onthe price and volume of underlying stocks: evidencefrom India.” The Journal of Applied Economics, Vol.X, No. 3, pp. 25-38, July 2011.
Stoll, H.R., and R.E. Whaley, “Program Trading & ExpirationDay Effects,” Financial Analysts Journal, Vol. 43, no.2, pp. 16-28, 1987.
Stoll, H.R., and R.E. Whaley (1991). “Expiration day effects:What has changed?” Financial Analysts Journal,47, 58-72.
Stoll, H.R. and R.E. Whaley (1997). “Expiration day effectsof the All Ordinaries Share Price index futures:Empirical evidence and alternative settlementprocedures.” Australian Journal of Management, 22,139-174.
http://www.hindawi.com/journals/isrn/2013/718538/
http://www.nseindia.com
******

SCMS Journal o f Indian Management , July - September 2016 33
A Quarterly Journal
Corporate Governance andPerformance:
Indian Manufacturing SectorDr. Virendra Khanna
Abstract
Dr. Virendra KhannaHead of the DepartmentFDDI School of Business & [email protected]
orporate governance mainly comprises the gener-ally accepted customs, habits, norms, laws and regu-lations; which determine the manner in which a
company operates its day to day functions. Thecomprehensive perspective of corporate governance canbe defined as “corporate governance means all the effortswhich took place for maximization of the shareholder’s valuewithout any adverse effect on the interests of the otherstakeholders of the firm such as; employees, customers,suppliers, competitors, government, society and theinvestors.” From the business perspective, corporategovernance comprises all the processes and structures usedto control and direct the companies. It defines the rightsand duties of all the stakeholders of the company and alsothe rules and procedures to be followed by the company formaking decisions related to corporate affairs. Hence,corporate governance defines the processes and structuresfor planning, implementing and monitoring the objectivesof the company and ensures accountability of the companytowards its stakeholders. The main objective of the corporate
Current study is based on the secondary data from 32 manufacturing companies of consumable goods, FMCG,
pharmaceutical, and automobile sectors. The stepwise regression analysis has been performed to measure the impact
of seven parameters of corporate governance given in SEBI clause 49 of the listing agreement. The study vindicates
that the board composition, board ownership or shareholding pattern, disclosures, and other compliances are parameters
of the corporate governance which have a positive and significant impact on the profitability of the manufacturing
companies. It substantiates that degree of corporate governance is high among Indian manufacturing companies.
Keywords: Corporate governance, profitability, performance, manufacturing sector, disclosures, SEBI.
Abstract
C

SCMS Journal o f Indian Management , July - September 2016 34
A Quarterly Journal
governance is to ensure the fair degree of transparency inmanaging the affairs of the company, which can developtrust and secure the buoyancy of the stakeholders of thecompany. Globalization and liberalization have popularizedthe concept of corporate governance in developed countries.Due to the increased investment by the foreign institutionalinvestment in the country, corporate governance has gainedmore importance, as the foreign investors need to ensurethat the safety and utilization of their funds in the interest ofthe company and to increase the value of the shareholders.The managers of the company can provide this surety bymanaging high degree of transparency in the corporateaffairs and by following good corporate governancepractices. Corporate governance is the means through whichthe managers can develop trust among itsstakeholders.{Cadbury Report (1992), “CorporateGovernance can be defined as a system by which businessesare directed and controlled”.}
The concept of corporate governance highlighted andbecame a matter of concern after the formulation of Clause49 of the Listing Agreements by the SEBI in 2000. Clause 49of the Listing Agreements was the first formal regulatoryframework which is applied on all the listed companies. In2009, Ministry of Corporate Affairs has also formulated someguidelines for the corporate governance in corporate sector,which are not mandatory but can be voluntarily adopted bythe corporate sector. In India, National Foundation forCorporate Governance (NFCG) was established to promoteand develop a framework for fair corporate governancepractices among the companies and to promote ethicaloperations and processes of the businesses. The mainobjective of the NFCG is to raise the standard of the Indiancompanies by following the good corporate governancepractices.
There is strong evidence based on the past researches thatcorporate governance affects the performance of thecompanies. There are many evidences available in the pastwhich clearly shows that bad corporate governance affectsthe performance of the company negatively. Satyam Scandalin the year 2009 was one of the live examples which showthat corporate governance and performance of the firm arecorrelated. Similarly, the instances of WorldCom and Enron,also established the relationship between corporategovernance and corporate performance. Therefore, it is
suggested that regulatory bodies and all the stakeholdersshould carefully monitor the weak corporate governancepractices of the companies, because weak corporategovernance will have adverse impact on the corporateperformance. Companies in developed countries are facingintense competition both from the domestic andmultinational companies. Corporate governance can be usedto gain competitive advantage to compete in the marketsand for survival also. It is well established fact that corporategovernance and value creation by the firm are related toeach other. Companies can get success by embracing anddemonstrating ethical conduct towards its stakeholders andin the operations and processes of the company. Numerousstudies are available in the literature, where the researchershave measured the relationship between corporategovernance and corporate performance; the studies haveshown mixed results. Some studies have proved a positiverelationship between corporate governance and financialperformance and some studies have proved a negativerelationship between corporate governance and financialperformance of the company.
Literature Review
Coskun and Sayilir (2012) measured the relationship betweencorporate governance and value of the firm. Researchersalso explored the impact of corporate governance overprofitability of the firms. The research was attempted onthirty one Turkish companies, using secondary dataaccessed from the financial reports of the companies. It wasfound from the study that corporate governance did nothave any significant relationship with the profitability andfirm’s value. It was stated by the researchers that goodcorporate governance practices did not ensure goodfinancial performance or high value of the firm.
Amba Muni(2014) aims to measure the relationship betweencorporate governance and financial performance of the firms.The research was attempted on 39 companies of Bahrain.The researchers used various variables to measure thecorporate governance namely; CEO duality, Proportion ofNon-executive Directors, Chairman of Audit Committee,Concentrated Ownership structure, Gearing Ratio,Institutional Investors and Return on Assets to denotefinancial performance of the company. It was found fromthe study that corporate governance had a significant effecton the financial performance of the companies of Bahrain.

SCMS Journal o f Indian Management , July - September 2016 35
A Quarterly Journal
Ehikioya, B. I. (2009) found during his research that CEOduality had a significant impact over the overall financialperformance of the company. It was also stated in theresearch that if the positions of both the CEO and chairmanwere held by one person only, the agency cost would getcreated, as it might also restrict the board from effectivelyexercising oversight and monitoring duties, which wouldlead to lower performance of the company, Coles, et al. (2001).
Core et al. (2005) found in their study that the higherproportion of independent directors in the board of acompany would have a positive impact on the financialperformance of the company. The value of the firms wasfound to be higher whose board consisted higher numberof independent directors in comparison to dependentdirectors. In contrast to the above study, Vafeas andTheodorou (1998) stated that there was no relationshipbetween number of independent directors and the value ofthe firm. Yammeesri and Herath (2010) found in their studythat independent directors did not contribute in the financialperformance of the firms. The relationship betweenindependent directors and corporate performance had beenfound insignificant in Thai companies.
Salami, K. A. (2011) measured the impact of ownershipstructure and financial performance of the companies. Itwas stated in the research that conflicts of interests,ownership structure and poor governance system all thesehad a negative impact over the corporate performance. Itwas found from the study that low ownership concentrationled to lower profitability of the firm. Sorensen (2007)measured the impact of ownership structure on the costefficiency. It was clear from the study that ownershipstructure had a significant impact on the corporateperformance and cost efficiency. Research also revealed thefact that indirect ownership and dispersion both affectedthe control over the company, which resulted into higheragency costs and lower performance of the company. Costinefficiency had been found in the firms who had fragmentedownership.
Chen, Lai, and Chen (2012) found during their research thathigher use of internal funds have a positive impact on thecorporate performance. Weill (2003) established that therelationship between leverage and corporate performancehad been found negative in the companies of Italy, while
the impact of leverage on the corporate performance wasfound significantly positive leverage in the companies ofFrance and Germany. Majumdar and Chhibber (1999)investigated the relationship of leverage and profitability ofthe Indian companies. The relationship was found negativebetween leverage and corporate performance.
Aggarwal (2013) measured the relationship betweencorporate governance and corporate performance. Theresearch was focused on 20 Indian companies. It was foundfrom the study that corporate governance had a significantimpact over the performance of the companies in India.Further, the study reveals that governance rating had apositive and significant impact on the corporate performance.It was also stated in the research that environmental ratingsand employees ratings also had a significant impact overthe corporate performance.
Vo Duc and Phan Thuy (2013) measured the impact ofcorporate governance over the performance of thecompanies. The study was conducted on 77 companies ofVietnam. Researchers measured the corporate governanceusing nine parameters such as; size of board, presence offemale board members, duality of the CEO, presence ofindependent directors, ownership of the board, educationlevel of board members, compensation of the board andblock holders. The results of this study revealed thatparameters of the corporate governance were found to bepositively related with the corporate performance. Presenceof female board members, compensation of board membersand duality of the CEO, are found to be positively andsignificantly related with the financial performance ofcompanies in Vietnam. The study also revealed thatownership of board members did not have a significantrelationship with the financial performance of the companies.
Peters and Bagshaw (2014) measured the impact of corporategovernance over the corporate performance of thecompanies of Nigeria. The research was based on thesecondary materials collected from the 33 Nigeriancompanies from manufacturing, oil & gas and financialsector, for the period 2010 to 2011. It was found from thestudy that corporate governance practices were very highin the banking sector in comparison to manufacturing andoil & gas companies. The results of the study also indicatedthat corporate governance and corporate performance were

SCMS Journal o f Indian Management , July - September 2016 36
A Quarterly Journal
not significantly related to each other. No significantdifference had been found in the financial performance ofthe companies with different level of corporate governance.
The literature review shows that most of the researchershave measured the corporate governance by using thenumerous variables. There is a lack of studies in context ofIndian companies, who have measured the corporategovernance using the SEBI guidelines under Section 49 ofthe Listing Agreement. The current study will bridge thegap of literature and will be focused on measuring thecorporate governance using the variables or parametersgiven in SEBI section 49 of the Listing Agreement. Thuskeeping in view the importance of the corporate governance,the current study is an attempt to measure the corporategovernance among manufacturing sector and its relationshipwith the financial performance of the companies.
Objectives of the Study:
The main objective of the study is to measure the corporategovernance of the manufacturing sector of India and alsoto measure the relationship between corporate governanceand profitability of the company.
Research Methodology
The study is purely based on the secondary data, takenfrom the annual reports of the companies for the period2011 to 2015. Corporate governance has been measuredusing seven parameters which are mentioned in the SEBISection 49 of the Listing Agreement. These parameters forcompliance are mainly; board composition, shareholdingpattern, board level committees, role and power of auditcommittee, number of subsidiaries, disclosures, and othercompliance. Total 32 manufacturing companies had beenselected for the purpose of study, listed on National stockexchange. The sampling is done using stratified randomsampling techniques. Manufacturing companies have beendivided into different strata and four types of strata havebeen taken in the study namely; consumable durable,automobile, pharmaceutical, and FMCG. From each of thefour strata eight companies have been selected randomly.Variables used in the study are mainly, parameters ofcorporate governance (Independent variables), profitability(dependent variable) and organizational factors (controlvariables).
The explanation of the variables is given below in detail.The conceptual model used in the study is given in figure 1below.
1.Board composition2.Shareholding pattern3.Board level committees4.Auditcommittee5.Number of subsidiaries6.Disclosures7.other compliance
1.Size of thecompany
2.Age of thecompany
3.Industry4.Ownership5.Leverage
1.Return on Assets
Corporate Governance OrganizationalFactors
Profitability
Figure 1: Conceptual Model
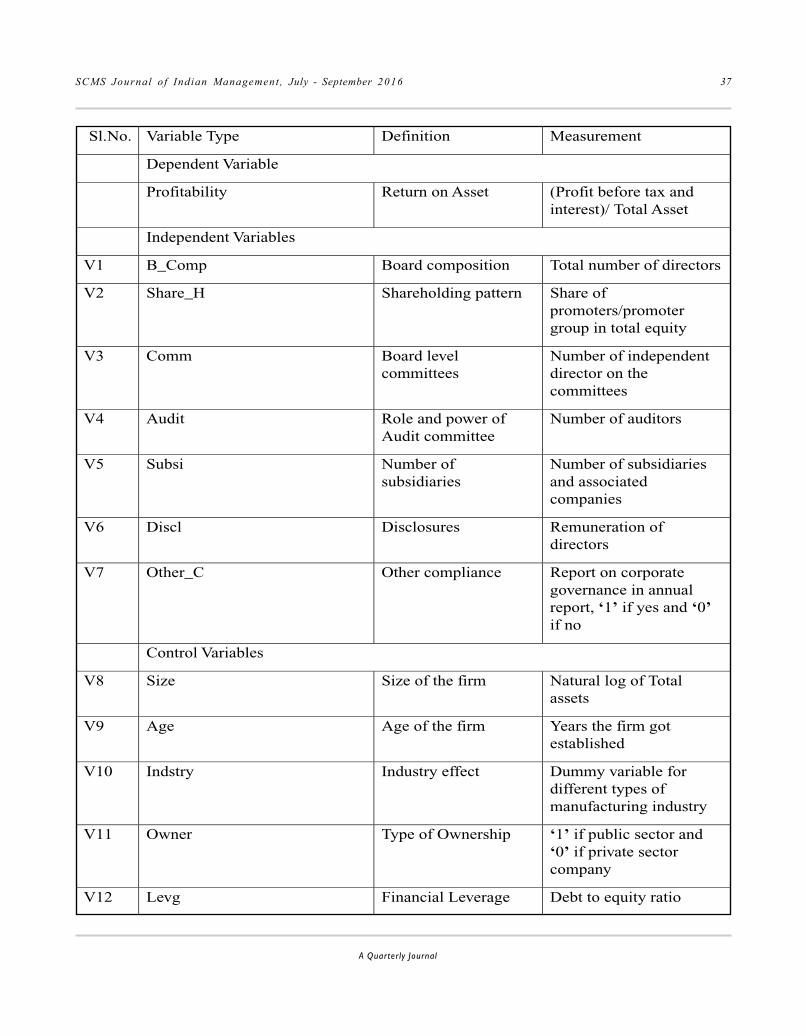
SCMS Journal o f Indian Management , July - September 2016 37
A Quarterly Journal
Sl.No. Variable Type Definition Measurement
Dependent Variable
Profitability Return on Asset (Profit before tax andinterest)/ Total Asset
Independent Variables
V1 B_Comp Board composition Total number of directors
V2 Share_H Shareholding pattern Share ofpromoters/promotergroup in total equity
V3 Comm Board levelcommittees
Number of independentdirector on thecommittees
V4 Audit Role and power ofAudit committee
Number of auditors
V5 Subsi Number ofsubsidiaries
Number of subsidiariesand associatedcompanies
V6 Discl Disclosures Remuneration ofdirectors
V7 Other_C Other compliance Report on corporategovernance in annualreport, ‘1’ if yes and ‘0’if no
Control Variables
V8 Size Size of the firm Natural log of Totalassets
V9 Age Age of the firm Years the firm gotestablished
V10 Indstry Industry effect Dummy variable fordifferent types ofmanufacturing industry
V11 Owner Type of Ownership ‘1’ if public sector and‘0’ if private sectorcompany
V12 Levg Financial Leverage Debt to equity ratio

SCMS Journal o f Indian Management , July - September 2016 38
A Quarterly Journal
Formulation of Hypothesis
Board Composition: Board composition has been measuredusing the number of directors. The previous studies showthat board size has both negative and positive effect on theprofitability of the companies. Garg (2007) finds in hisresearch that firms with smaller boards outperform the firmswith larger board. There is an inverse relationship betweennumber of directors and the profitability of the company.Lipton and Lorsch (1992), and Yermack (1996) conclude intheir research that the small number of directors in the boardwill positively affect the company. The profitability of thecompany gets improved if the number of directors is less inthe company. Klein (1998) and Dalton (1999) state in theirresearch that large number of directors will contribute to thesuccess of the firm, as the larger is the number of directorsin the board of the company, the larger will be the informationcollected by these directors. Therefore the number ofdirectors in the board affects the profitability of the company.On the basis of the above literature the null hypothesis isframed as follows:
Null hypothesis (H01): There is no relationship betweennumber of directors and profitability of the company.
Shareholding Pattern: Shareholding pattern shows thenumber of equity shares owned by the promoters or thepromoters group. Adenikinju and Ayorinde (2001) find intheir study that ownership of board does not have anysignificant effect on the corporate performance. Theprofitability of the firms is not affected by the shareholdingpattern of the company.
Null hypothesis (H02): There is no relationship betweenshareholding pattern and profitability of the company.
Board level committees: Board level committees indicatedthe total number of independent directors. Kaur (2014) statedin his research that board level committees and performanceof the companies were positively related to each other. Boardlevel committees played important role in enhancing thecompetitiveness and performance of the companies. Incontrast to this the study of Hussain and Othman (2012)stated that the number of independent directors in the boardlevel committees did not have any impact over theprofitability measures. Imam and Malik (2007) stated in theirresearch that firms whose board had high number ofindependent directors were able to raise more funds withequity.
Null hypothesis (H03): There is no relationship betweennumber of independent directors and profitability of thecompany.
Audit committee: The audit committee parameter ofcorporate governance indicates the number of auditors. Itis one of the best corporate governance practices to showthe number of auditors in the annual report of the company.The audit committee of the company executes theaccounting functions and external audit. Kojola (2008)measured the relationship between audit committees andthe performance of the company. It was found from the studythat there was a positive and significant relationship betweenaudit committees and the profitability of the company.
Null hypothesis (H04): There is no relationship between auditcommittee and profitability of the company.
Number of subsidiaries: Number of subsidiaries is anotherimportant parameter of corporate governance. Under thisvariable, the number of subsidiaries is shown. Thecompanies which show the number of subsidiaries and theinformation about their subsidiary companies in theircorporate governance report indicates the high degree oftransparency and higher level of profitability.
Null hypothesis (H05): There is no relationship betweennumber of subsidiaries and profitability of the company.
Disclosures: Disclosure parameters include theremuneration of the directors of the company. Kapooria etal. (2013) and Jensen and Murphy (1990) stated in theirresearches that the disclosure of the remuneration of thedirectors in the annual report of the company positivelyaffects the financial performance of the company. Thedisclosure of remuneration of directors builds confidencein the shareholders, and creates a positive image about thecompany. Positive and sustainable corporate image leadsto the profitability and overall good performance of thecompany. Therefore, it can be concluded that the disclosureof remuneration of directors and profitability of the firmshave a positive relationship. Further the studies of, Jensenand Meckling (1976) and Mehran (1995) stated thatremuneration of the directors is a parameter of corporategovernance which attaches financial benefits to themanagement of the company and helps in running thecompany in the interest of the shareholders. It also helps insolving the agency problem between shareholders andmanagement and affects the performance of the companypositively.
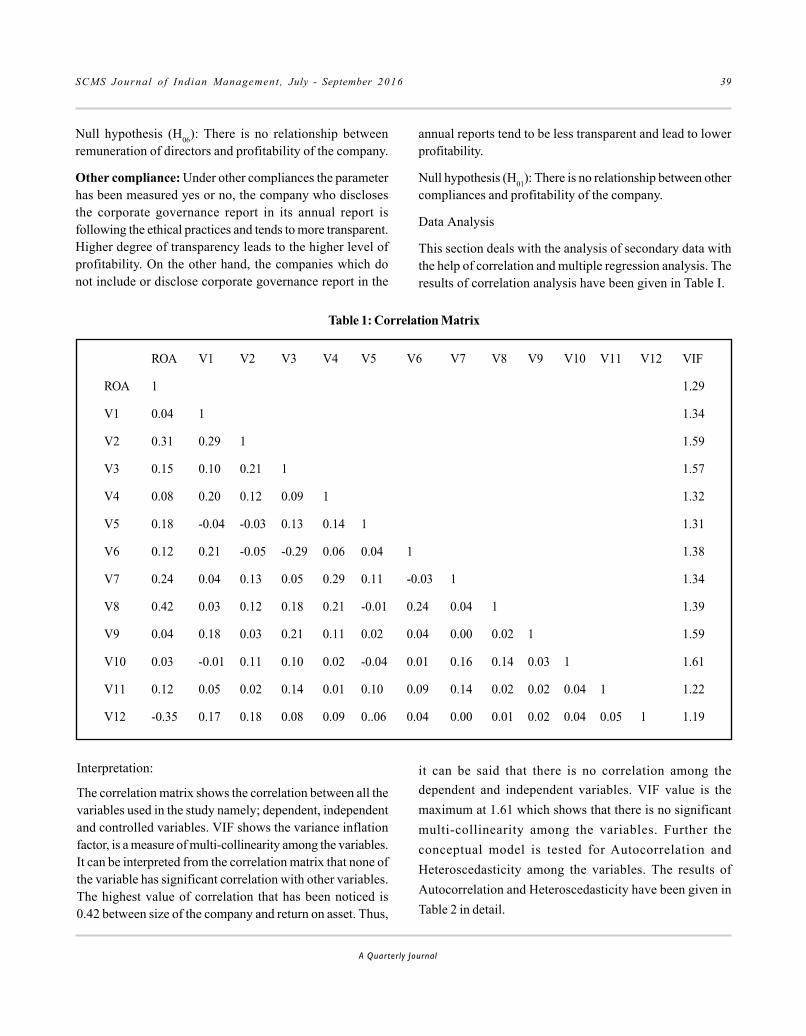
SCMS Journal o f Indian Management , July - September 2016 39
A Quarterly Journal
Null hypothesis (H06): There is no relationship betweenremuneration of directors and profitability of the company.
Other compliance: Under other compliances the parameterhas been measured yes or no, the company who disclosesthe corporate governance report in its annual report isfollowing the ethical practices and tends to more transparent.Higher degree of transparency leads to the higher level ofprofitability. On the other hand, the companies which donot include or disclose corporate governance report in the
annual reports tend to be less transparent and lead to lowerprofitability.
Null hypothesis (H01): There is no relationship between othercompliances and profitability of the company.
Data Analysis
This section deals with the analysis of secondary data withthe help of correlation and multiple regression analysis. Theresults of correlation analysis have been given in Table I.
Table 1: Correlation Matrix
ROA V1 V2 V3 V4 V5 V6 V7 V8 V9 V10 V11 V12 VIF
ROA 1 1.29
V1 0.04 1 1.34
V2 0.31 0.29 1 1.59
V3 0.15 0.10 0.21 1 1.57
V4 0.08 0.20 0.12 0.09 1 1.32
V5 0.18 -0.04 -0.03 0.13 0.14 1 1.31
V6 0.12 0.21 -0.05 -0.29 0.06 0.04 1 1.38
V7 0.24 0.04 0.13 0.05 0.29 0.11 -0.03 1 1.34
V8 0.42 0.03 0.12 0.18 0.21 -0.01 0.24 0.04 1 1.39
V9 0.04 0.18 0.03 0.21 0.11 0.02 0.04 0.00 0.02 1 1.59
V10 0.03 -0.01 0.11 0.10 0.02 -0.04 0.01 0.16 0.14 0.03 1 1.61
V11 0.12 0.05 0.02 0.14 0.01 0.10 0.09 0.14 0.02 0.02 0.04 1 1.22
V12 -0.35 0.17 0.18 0.08 0.09 0..06 0.04 0.00 0.01 0.02 0.04 0.05 1 1.19
Interpretation:
The correlation matrix shows the correlation between all thevariables used in the study namely; dependent, independentand controlled variables. VIF shows the variance inflationfactor, is a measure of multi-collinearity among the variables.It can be interpreted from the correlation matrix that none ofthe variable has significant correlation with other variables.The highest value of correlation that has been noticed is0.42 between size of the company and return on asset. Thus,
it can be said that there is no correlation among thedependent and independent variables. VIF value is themaximum at 1.61 which shows that there is no significantmulti-collinearity among the variables. Further theconceptual model is tested for Autocorrelation andHeteroscedasticity among the variables. The results ofAutocorrelation and Heteroscedasticity have been given inTable 2 in detail.

SCMS Journal o f Indian Management , July - September 2016 40
A Quarterly Journal
Table 2: Results of Autocorrelation and Heteroscedasticity
The White Test Breusch Godfrey Test
F-Statistics 1.6728 F-Statistics 5.6258
Observed R Sqaure 26.8935 Observed R Sqaure 31.2345
p-value of F (26276) 0.2156 p-value of F (26276) 0.1972
p-value of chi-square (30) 0.1924 p-value of chi-square (30) 0.1634
Interpretation:
It can be seen from the Table 2 that chi square and F-valueboth are found to be insignificant while using the Whitetest, which shows that multicollinearity is not present amongthe variables. The results of Breusch Godfrey Test showthat chi square and F-value both are found to beinsignificant, thus there is no sign of autocorrelation amongthe variables. Thus both the tests show that data is suitablefor further analysis and the data set can be used for multipleregression analysis. Table 3 shows the results of multiple
regression model analysis. The following regressionequation has been used to measure the relationship betweendependent variable and independent variables:
ROAi= β0 + β1B_Compi + β2Share_Hi + β3Commi + β4Auditi+ β5Subsii + β6Discli + β7Other_Ci + β8Sizei + β9Agei +β10Indsi + β11Owni + β12Levgi + εi
The regression equation has been solved using stepwiseregression equation, where the organizational variables havebeen controlled during the analysis.
Table 3: Results of regression analysis
Model Variables Entered Method
1 B_CompForward (Criterion: Probability-of-F-to-enter <= .050)
2 Share_H Forward (Criterion: Probability-of-F-to-enter <= .050)
3 Discl Forward (Criterion: Probability-of-F-to-enter <= .050)
4 Other_C Forward (Criterion: Probability-of-F-to-enter <= .050)
Table 4: Results of regression analysis
Model R RSquare
AdjustedR
Square
Std. Error ofthe Estimate
Change Statistics
RSquareChange
FChange
df1 df2 Sig. FChange
1 0.621a 0.386 0.385 18.2985633 0.386 1297.482 1 2067 0.000
2 0.631b 0.398 0.397 18.1201897 0.012 41.895 1 2066 0.000
3 0.636c 0.404 0.403 18.0323286 0.006 21.182 1 2065 0.000
4 0.645d 0.408 0.414 18.0112567 0.004 17.321 1 2064 0.000
a. Predictors: (Constant), B_compb. Predictors: (Constant), B_comp, Share_Hc. Predictors: (Constant), B_comp, Share_H, Discld. Predictors: (Constant), B_comp, Share_H, Discl, Other_C

SCMS Journal o f Indian Management , July - September 2016 41
A Quarterly Journal
Tables 3 and 4 show that from the stepwise regressionmodel, four significant models have been emerged whichshow the relationship between dependent and independentvariables in the current study. First regression model showsthe relationship between board composition and return onasset. The value of R and R-square is 0.621 and 0.386respectively. The value of r-square changes increases withthe addition of some more independent variables in theregression model. Second regression model includes thetwo independent variables namely; board composition andshareholding pattern. The value of r-square changes from0.386 to 0.398 after adding the variable shareholding pattern.That shows that the relationship of board compositionwith return on asset gets stronger if we add the independentvariable shareholding pattern in the regression model.Regression model 3 indicates that the change in r-squareincreases from 0.398 to 0.404 if we add one moreindependent variable which is disclosure in the regressionmodel. Thus a significant change can be seen in the
relationship of dependent and independent variables.Similarly, the regression model 4 indicates that the value ofR-square further gets changed if we add one moreindependent variable in the regression model which is theother compliance. The value of R-square increases from 0.404to 0.408 by adding other compliance variable in the model.Thus, the last model seems to be most significant model formeasuring the relationship between corporate governanceand profitability of the firms because the value of R-squarehas been found to be 0.645. It can be indicated from thevalue of R-square that the 65 percent of the total variation inthe value dependent variable is due to the independentvariables and rest 35 percent is due to other factors.Therefore, the four independent variables which are foundto be significant in the regression model namely; boardcomposition, shareholding pattern, disclosure and othercompliance can explain the 65% of the total variance in theprofitability of the firm.
Table 5 : Anova Table
Model Sum ofSquares df Mean Square F Sig.
1 Regression 434445.635 1 434445.635 1297.482 0.000
Residual 692108.946 2067 334.837
Total 1126554.581 2068
2 Regression 448201.508 2 224100.754 682.524 0.000
Residual 678353.073 2066 328.3412744
Total 1126554.581 2068
3 Regression 455089.114 3 151696.3713 466.521 0.000
Residual 671465.466 2065 325.1648746
Total 1126554.581 2068
4 Regression 466088.213 4 116522.0533 402.813 0.000
Residual 660466.368 2064 319.9933953
Total 1126554.581 68
Table 5 depicts the value of Anova for each of the fourmodels derived by the stepwise regression model. In thefirst regression model the value of F is 1297.482, which isfound to be significant at 99 percent of confidence level.Similarly in the second, third and fourth models, the value
of F is found to be significant at 99 percent of confidencelevel. Thus the null hypothesis is rejected which states thatthere is no relationship between corporate governance andprofitability. A significant relationship has been found inthe dependent and independent variables used in the study.

SCMS Journal o f Indian Management , July - September 2016 42
A Quarterly Journal
Table 6: Coefficients
ModelUnstandardized
CoefficientsStandardizedCoefficients
t Sig.
B Std. Error Beta Std. Error
1 (Constant) -72.217 3.199 -22.573 0.000
B_Comp 8.648 0.240 0.621 0.017 36.021 0.000
2 (Constant) -81.795 3.497 -23.392 0.000
B_Comp 7.877 0.266 0.566 0.019 29.621 0.000
Share_H 0.198 0.031 0.124 0.019 6.473 0.000
3 (Constant) -79.806 3.506 -22.760 0.000
B_Comp 7.579 0.272 0.544 0.020 27.822 0.000
Share_H 0.189 0.031 0.118 0.019 6.203 0.000
Discl 0.085 0.019 0.082 0.018 4.602 0.000
4 (Constant) -75.183 3.629 -21.675 0.000
B_Comp 7.124 0.281 0.512 0.200 26.137 0.000
Share_H 0.173 0.031 0.108 0.019 5.982 0.000
Discl 0.079 0.021 0.069 0.019 4.128 0.000
Other_C 0.068 0.018 0.043 0.020 3.982 0.000
Table 6 depicts the results of regression coefficients alongwith the t-value and p-value for all the four regressionmodels. In the first regression model the value ofunstandardized coefficients for board composition variablewas 8.648 and beta value was 0.621. These values getreduced if we add some more independent variables in theregression model. The least values of unstandardizedcoefficients and beta are of other compliance variable. Thet-values are found to be significant for all the independentvariables in all the four regression models. In the currentstudy only four variables out of seven independent variableswere found to be significant and successfully represent thecorporate governance of a firm.
Null hypothesis 1 which states that there is no relationshipbetween board composition and profitability of the firms, isfound to be rejected and it can be said on the basis of pvalue that there is a significant and positive relationshipbetween board composition and return on assets. Thenumber of directors in the board committee is an importantindicator of the corporate governance of a firm and it affectsthe profitability of the company. The higher number of
directors in the board committee positively affects theprofitability of the firms.
Null hypothesis 2, which states that there is no relationshipbetween shareholding pattern and profitability of thecompany, is found to be rejected in the current study and itcan be said on the basis of p value that there is a significantand positive relationship between shareholding pattern andreturn on assets. The number of equity shares owned bythe promoters of the company, which is also called the boardownership, is an important indicator of the corporategovernance of a firm and it affects the profitability of thecompany. The higher proportion of shareholding patternby the promoters encourages the better control of promoterson the company and also ensures the better corporategovernance practices, which leads to higher performanceof the company. Therefore, the proportion of equity sharesowned by the promoters of the company positively affectsthe performance of the company.
Null hypothesis 6 which states there is no relationshipbetween remuneration of directors and profitability of the
SCMS Journal o f Indian Management , July - September 2016 43
A Quarterly Journal
company is found to be rejected in the current study.Disclosure norms under corporate governance as per SEBIclause 49 of listing agreement has a positive impact on thecorporate financial performance. The companies whichdisclose the amount of remuneration in their annual reportsindicate a high level of transparency in their corporategovernance practices and it positively affects theperformance of the firms. The higher degree of disclosuresensures the higher degree of transparency in corporateaffairs and it is a good signal for the corporate performance.
Null hypothesis 7 which states that there is no relationshipbetween other compliances and profitability of the companyis found to be rejected during the study. Other compliancesof corporate governance have indicated the fact that whetherthe company shows the corporate governance report in theirannual report or not? The companies which prepare thecorporate governance report and make it available to beaccessed by any individual are known to be more transparentcompanies. The companies which follow ethical practicesduring their day to day operations and disclose thecorporate affairs publicly in a trustful manner, show higherperformance than the companies which do not disclose thefacts about the corporate affairs to the stakeholders of thecompany.
It was also found from the study that board level committees,audit committee and number of subsidiaries; do not have asignificant impact on the profitability of the company. Theboard level committee is measured by number ofindependent directors in the board level committees of thecompany. The higher or lower number of independentdirectors in the board level committees does not have asignificant impact on the profitability of the company. Auditcommittee which indicates the number of auditors in thecompany and number of subsidiaries, does not make asignificant impact on the profitability of the company.
It can be concluded from the study that corporategovernance and profitability of the firm are related to eachother. Higher number of disclosures in the corporategovernance report shows the fair degree of transparency inthe operations of the company. Board composition, boardownership or shareholding pattern, disclosures and othercompliances are the parameters of the corporate governancewhich have a positive and significant impact on the
profitability of the manufacturing companies of India. It wasalso found from the study that degree of corporategovernance is high among Indian manufacturing companies.All the selected companies completely follow the SEBI clause49 of the listing agreement.
Limitations
The study has the following limitations:
1. Current study is limited to the manufacturing sectorof India; the study can be extended to other sectorsalso.
2. The sample size of the study is Limited to 32manufacturing companies listed on NSE.
3. The study is based on the secondary data aboutthe corporate governance report derived from theannual reports of the companies.
Future scope
The study can be extended to the financial and other sectorsof the economy. Primary data can also be collected to havemore insights about the corporate governance practices ofthe companies from the employees, customers and otherstakeholders’ point of view. The voluntary parameters ofcorporate governance can also be measured to examine theirrelationship with the profitability of the firm.
Implications
The managerial implications of the study are that thecompanies which follow better corporate governancepractices can achieve higher profitability. The bettercorporate governance practices show the higher degree oftransparency in the corporate affairs, which develop arelation of trust between company and its stakeholders. Thehealthy relationship between management and stakeholdershas a positive impact on the profitability of the firm.Companies which follow ethical practices and disclose themandatory information in their annual report and preparecorporate governance, report accordingly and tend togenerate high profits than their counterparts. Therefore, themanufacturing companies should follow better corporategovernance practices and fair degree of transparency intheir day to day operations.

SCMS Journal o f Indian Management , July - September 2016 44
A Quarterly Journal
References
Aggarwal, Priyanka (2013). “Impact of Corporate Governanceon Corporate Financial Performance.” IOSR Journalof Business and Management (IOSR-JBM), Vol. 13,Issue 3 (Sep. - Oct. 2013), pp. 01-05.
Adenikinju, O and F. Ayorinde (2001). Ownership structure,corporate governance and corporate performance:The case of Nigerian quoted companies, unpublishedfinal report presented at the AERC biannual researchworkshop, Nairobi, Kenya, May.
Amba Muni (2014). “Corporate governance and firms’financial performance,” Journal of Academic andBusiness Ethics, derived from http://www.aabri.com/copyright, pp. 1-11.
Cadbury, A. (1992). Report of the Committee on the financialaspects of corporate governance, London: GeePublishing.
Chen, I. J., H. Lai, J. and C.C Chen, (2012). “IndustrialConcentration, Innovation and Corporate LayoffAnnouncements.” International Research Journalof Finance and Economics, (87).
Coles, J. W., V. B McWilliams., and Sen, N. (2001). “Anexamination of the relationship of governancemechanisms to performance,” Journal ofManagement, 27(1), 23-50.
Core, J. E., R. W. Holthausen, and Larcker, D. F. (1999).“Corporate governance, chief executive officercompensation, and firm performance,” Journal offinancial economics, 51(3), 371-406.
Coskun and Sayilir (2012). “Relationship between CorporateGovernance and Financial Performance of TurkishCompanies,” International Journal of Business andSocial Science, Vol. 3 No. 14 [Special Issue – July2012], pp. 59-64.
Dalton, D., R. et al (1999). “Number of Directors and FinancialPerformance: A Meta-Analysis.” The Academy ofManagement Journal, 42(6), 674-686.
Duc VO and Thuy Phan (2013). “Corporate Governance andFirm Performance: Empirical Evidence from Vietnam,”accessed from www.iosrjournals.org.
Ehikioya, B. I. (2009). “Corporate governance structure andfirm performance in developing economies: evidencefrom Nigeria.” Corporate Governance, 9(3), 231-243.
Garg, Ajay (2007). “Influence of Board Size andIndependence on Firm Performance: A Study of IndianCompanies,” Vikalpa, Vol. 32, No. 3, pp. 39-60.
Hussain N. and R.Othman (2012). “Code of corporategovernance and firm performance,” British Journalof Economics, Finance and Management Sciences,6(2).
Imam, M. and M. Malik, (2007). “Firm performance andcorporate governance through ownership structure,”Evidence from Bangladesh stock market.International Review of Business Research Papers,3 (4), 88-110.
Jensen, M., C. and W. H. Meckling, (1976). “Theory of theFirm Managerial Behavior, Agency Costs andOwnership Structure,” Journal of FinancialEconomics. 3(4), 305-360.
Jensen, M. C. and K. J. Murphy, (1990), “Performance Payand Top-Management Incentives,” Journal ofPolitical Economy, 98(2), 225-264.
Kapooria, R. C. Sharma and Kaul (2013). “Impact of CorporateGovernance on Firm Performance: An EmpiricalAnalysis of IT and Manufacturing Sectors,”International Global Research Analysis, Vol. 2, No.6, pp. 123-124.
Kaur (2014). “Corporate Governance and FinancialPerformance: A case study of Indian BankingIndustry,” Asian Journal of MultidisciplinaryStudies, Vol. 2, No. 2, pp. 91- 96.
Klein, A. (1998). “Firm Performance and Board CommitteeStructure,” Journal of Law and Economics, 41(1), 275-303.
Kojola, O. (2008). “Corporate governance and firmperformance: The case of Nigerian listed firms,”European Journal of Economics, Finance andAdministrative Sciences, (14) 1450-2275.
Lipton, M. and J. W. Lorsch, (1992). “A modest proposal forimproved corporate governance,” Business Lawyer,48(1), 59-77.

SCMS Journal o f Indian Management , July - September 2016 45
A Quarterly Journal
Majumdar, S. K., and P. Chhibber, (1999). “Capital structureand performance: Evidence from a transition economyon an aspect of corporate governance,” PublicChoice, 98(3-4), 287-305.
Mehran, H. (1995). “Executive Compensation Structure,Ownership and Firm Performance,” Journal ofFinancial Economics, 38(2), 163-184.
Peters, George and Karibo Bagshaw, (2014). “CorporateGovernance Mechanisms and Financial Performanceof Listed Firms in Nigeria: A Content Analysis,”Global Journal of Contemporary Research inAccounting, Auditing and Business Ethics, Vol. 1,Issue 2, pp. 103-128.
Salami, K. A. (2011). “Analysis of the Relationship betweenShare Ownership Structure, Corporate GovernanceStructure, and Corporate Investment Efficiency, using
******
GSE Market Data (2005-9),” Journal of Accountingand Finance, 11(4), 111-118.
Sørensen, R. J. (2007), “Does dispersed public ownershipimpair efficiency? The case of refuse collection inNorway,” Public administration, 85(4), 1045-1058.
Vafeas, N., and E. Theodorou, (1998), “The relationshipbetween board structure and firm performance in theUK,” The British Accounting Review, 30(4), 383-407.
Weill, L. (2003), “Leverage and corporate performance: Afrontier Efficiency Analysis on European Countries”.
Yammeesri, J.,S.K Herath, (2010). “Board characteristicsand corporate value: evidence from Thailand,”Corporate Governance, 10(3), 279-292.
Yermack, D. (1996), “Higher Market Valuation of Companieswith a Small Board of Directors,” Journal of FinancialEconomics, 40(2), 185-211.

SCMS Journal o f Indian Management , July - September 2016 46
A Quarterly Journal
ransparency International (TI), originally foundedin Germany in May 1993, is a global civil societyorganization leading the fight against corruption.
It brings people together in a powerful worldwide coalitionto end the devastating impact of corruption on men, womenand children around the world. The mission of TI is to createchange towards a world free of corruption. It publishes anannual Global Corruption Barometer and CorruptionPerceptions Index, a comparative listing of corruptionworldwide. The headquarters of TI is located in Berlin,Germany. TI defines corruption as the ‘misuse of entrustedpower for private gain.’
Corruption is one of India’s greatest challenges. It is a majorobstacle for growth and sustainable development. It divertsresources from proper use, thwarts the promotion ofnecessary competition among various firms (leading tomonopoly) and thus hurts all the people in the country.Corruption can tarnish the image of the nation and impedethe progress towards becoming a developed nation.
Eliminating Corruption fromOrganizations : Role of Business
SchoolsDr. Ajith P
Abstract
Dr. Ajith P.Associate ProfessorMDI-Murshidabad, RaghunathganjMurshidabad(Dist.), West Bengal - 742235, India.Mobile- 7894185018E-mail: [email protected]
This paper delineates the contribution b schools can make in elimination of corruption in organizations.Annually around three lakh MBAs are produced by b schools in India. Majority of them join variousexisting organizations as positive change agents. PRME has laid the foundation for responsible managementeducation at a global level. The paper elaborates the strategy Indian business schools need to adopt tomake a significant contribution towards elimination of corruption in organizations. The paper concludeswith the hope that the b schools and the academic leaders who steer them are expected to play a verycritical role in eliminating corruption from organizations by grooming ethical managers and leaders.
Keywords: PRME, Corruption, Organizations, B-schools, Academicians, Managers, Leaders
Abstract
T

SCMS Journal o f Indian Management , July - September 2016 47
A Quarterly Journal
Transparency in all transactions by administrators, managersand leaders can reduce corruption to a large extent. Thebasic facts, figures, policies and mechanisms should berevealed by all organizations for anyone to scrutinize(especially public organizations). India rose to 76th rank(2015) from 85th rank (2014) on the perception of corruptionindex where the first rank marks the country perceived asleast corrupt (Ram, 2016). Though India has improved itsperception, we have to travel a long way before India will beperceived as a corruption-free-nation.
Organizations should commit themselves for responsibleand sustainable business practices. They can do this bypromoting transparency in all transactions they undertakein addition to other good governance measures.Transparency is about shedding light on rules, plans,processes and actions. It is knowing why, how, what, andhow much. Transparency ensures that public officials, civilservants, managers, board members and businesspeople actvisibly and understandably, and report on their activities. Italso means that the general public can hold themaccountable. It is the surest way of guarding againstcorruption, and helps increase trust in the people andorganizations on which the future of every citizen depends.Trust can reduce the transaction cost, making organizationsmore efficient, effective and ethical (Urban, 2005).
1.1 Categories of Corruption
According to TI, corruption can be classified as grand, pettyand political, depending on the amounts of money lost andthe sector where it occurs. Grand corruption consists ofacts committed at a high level of government that distortpolicies or the central functioning of the state, enablingleaders to benefit at the expense of the public good. Pettycorruption refers to everyday abuse of entrusted power bylow and mid-level public officials in their interactions withordinary citizens, who often are trying to access basic goodsor services in places like hospitals, schools, policedepartments and other agencies. Political corruption is amanipulation of policies, institutions and rules of procedurein the allocation of resources and financing by politicaldecision makers, who abuse their position to sustain theirpower, status and wealth.
Corruption impacts societies in a multitude of ways. In theworst cases, it costs lives. Short of this, it costs people theirfreedom, health or money. The cost of corruption can bedivided into four main categories: political, economic, social,
and environmental. On the political front, corruption is amajor obstacle to democracy and the rule of law. In ademocratic system, offices and institutions lose theirlegitimacy when they are misused for private advantage.This is harmful in established democracies, but even moreso in newly emerging ones. It is extremely challenging todevelop accountable political leadership in a corrupt climate.
Economically, corruption depletes national wealth. Corruptpoliticians invest scarce public resources in projects thatwill line their pockets rather than benefit communities, andprioritize high-profile projects such as dams, power plants,pipelines and refineries over less spectacular but more urgentinfrastructure projects such as schools, hospitals and roads.Corruption also hinders the development of fair marketstructures and distorts competition, which in turn detersinvestment. Corruption corrodes the social fabric of society.It undermines people’s trust in the political system, in itsinstitutions and its leadership. A distrustful or apatheticpublic can then become yet another hurdle to challengingcorruption. Environmental degradation is anotherconsequence of corrupt systems. The lack of, or non-enforcement of, environmental regulations and legislationmeans that precious natural resources are carelesslyexploited, and entire ecological systems are ravaged. Frommining, to logging, to carbon offsets, companies across theglobe continue to pay bribes in return for unrestricteddestruction.
Given the above described backdrop, the objectives of thispaper include; (1) Discuss the role of b schools in eliminatingcorruption from organizations, (2) Elaborate the strategythat can be adopted by all b schools to eliminate corruptionfrom organizations.
1. Role of b schools in eliminating corruption
Business schools play an important role in shaping future business managers, entrepreneurs and leaders; and also in educating them on the importance of responsible citizenship. Through research, educationalresources, learning know-how and educationalinfrastructure, b schools can increase knowledgeand understanding of responsible organizational behaviorand citizenship. Business leaders who are values-led andpurpose driven have to redefine the role of business insociety and shape them with the right values and culture toachieve service excellence (Manwani, 2013). Rationalleadership capability alone is no longer adequate and needs

SCMS Journal o f Indian Management , July - September 2016 48
A Quarterly Journal
to be complemented with a new set of competenciesassociated with developing ‘wise’ responsible leaders whocan steer organizations to sustainability and responsiblegrowth while putting purpose along with profits. Higherorder thinking and decision-making skill aligned with valuesand vision, and incorporating the best possible outcomefor all stakeholders is expected from business leaders.
Between 2008 and 2012, the total number of b schools in thecountry doubled to 2,385, according to AICTE, while thetotal student intake rose from around 100,000 to300,000(Murray, 2014). According to the apex regulator fortechnical education - All India Council for TechnicalEducation (AICTE), there are 3644 b schools in the countryoffering Master of Business Administration (MBA) and 308institutions offering Post Graduate Diploma Management(PGDM) as on May 2012. Currently there are more than 4500b schools in the country and is perhaps the highest in theworld. The time has come for India to look beyond, and be abeacon to the world in the field of management education.This is possible only by effectively blending the easternmanagement principles, in which we are leaders, and themodern western outlook, which we have already borrowedin good amount. The way ahead for management institutesof India is of higher responsibility. On one side it will haveto meet the national aspirations and on the other side it willhave to show the right and better direction to the modernmanagement education which is at crossroads globally(Paninchukunnath, 2013).
Many initiatives were created worldwide to fight againstcorruption and to advance transparency. Among them, theUN Global Compact (UNGC) was launched in July 2000, asa policy platform and a practical framework for companiesthat are committed to sustainability and responsiblebusiness practices. The initiative seeks to align companies’business operations and strategies with ten universallyaccepted principles in the areas of human rights, labour,environment and anti-corruption. In this direction the GCand leading academic institutions jointly developed in2007 the Principles for Responsible Management Education(PRME), a set of six principles which lay the foundationfor the global platform for responsible managementeducation. The PRME are inspired by internationallyaccepted values such as the principles of the UNGC. ThePRME seeks to establish a process of continuousimprovement amongst institutions of managementeducation in order to develop a new generation of
business leaders capable of managing the complexchallenges faced by business and society in the 21stCentury.
2. The PRME
The Principles for Responsible management education(PRME), which were unveiled by a group of scholars andleading academic organization at the UN Global CompactLeaders Summit in July of 2007 and now endorsed by over600 business schools and management-related academicinstitutions, serve as guidelines for management educationproviders to enhance curricula, pedagogy, research andincentives to prepare organizational leaders who will balanceeconomic with societal goals. The six principles to beadopted by management institutions are given below:
2.1 The six principles for responsible managementeducation:
A. Purpose: We will develop the capabilities ofstudents to be future generators of sustainablevalue for business and society at large and to workfor an inclusive and sustainable global economy.
B. Values: We will incorporate into our academicactivities and curricula the values of global socialresponsibility as portrayed in internationalinitiatives such as the United Nations GlobalCompact.
C. Method: We will create educational frameworks,materials, processes and environments that enableeffective learning experiences for responsibleleadership.
D. Research: We will engage in conceptual andempirical research that advances ourunderstanding about the role, dynamics, andimpact of corporations in the creation ofsustainable social, environmental and economicvalue.
E. Partnership: We will interact with managers ofbusiness corporations to extend our knowledgeof their challenges in meeting social andenvironmental responsibilities and to explorejointly effective approaches to meeting thesechallenges.

SCMS Journal o f Indian Management , July - September 2016 49
A Quarterly Journal
F. Dialogue: We will facilitate and support dialogueand debate among educators, business,government, consumers, media, civil societyorganizations and other interested groups andstakeholders on critical issues related to globalsocial responsibility and sustainability.
Business schools should implement all the above sixprinciples, starting with those that are more relevant to theircapacities and mission. They have to report on progress inadopting the above six principles to all our stakeholdersand exchange effective practices related to these principleswith other academic institutions. The practices in the b schoolshould serve as example of the values and attitudes theywish to convey to their students.
3. Managerial Approaches to Fight Corruption
Managers adopt two broad ways to address corruption -one is ‘inspirational leadership’ and the second is‘compliance system.’ Both paths integrally address theindividual as the centre of their concerns. Moreover theyboth rely on the ability of each individual to act inaccordance with the established standards. A personcould be inspired by good leadership, identifying andconforming to the leader’s values. Inspiration focuses onaffective motivation that in the end, if effective, will drivetheir own enthusiasm to seek out more efficient and betterpractices.
Within a compliance system the individual faces, rules,processes, and roles that restrain them from certain actions.Both systems focus on either eliminating the opportunityor strengthening the enforcement. It is imperative that
organizations use these two tools simultaneously as theyare complementary. They should propose goals, rolesand incentive systems that allow a person to proliferate inconformation with human dignity, justice and truth. Inthis way the development and nourishment of honestyoverall contributes to the common good. Compliancesystems should help to diminish opportunities of corruptivebehavior, while enforcing rules and norms. The human beingcan only thrive by living freely all the positive values.Society should contribute with systems , norms andrules that unite people’s actions under a global umbrellaof driving the common good. Organizations accomplishtheir mission of providing goods and services efficientlywhen their constituents can work respecting human dignity,collaborating with the common good, developing justice,and ultimately being true and honest in their dailydecision-making.
4. Strategic Approaches which b schools can Adopt
In the current academic environment, corporate responsibility and sustainability have enteredbut not yet become embedded in the mainstream of business related education. The PRME therefore emphasize a timely global call for business schoolsand universities world-wide to gradually adapt theircurricula, research, teaching methodologies and institutional strategies to the new business challengesand opportunities. The six strategic approaches which bsschools can adopt to eliminate corruption in theorganizations is shown in the figure 1. Each of theapproaches which can be implemented by any b school iselaborated below.
B-Schools
Administration
Faculty
Students
Strategic Approaches
A. Nishkama attitudeB. Ethical valuesC. Curriculum modificationD. MBA oathE. Ethics researchF. Partnership
Organizations
Elimination of
corruption
Figure 1. Strategic Approaches which all b schools can adopt

SCMS Journal o f Indian Management , July - September 2016 50
A Quarterly Journal
A. Train budding managers to adopt Nishkama attitude
In order to encourage budding managers tofight against corruption, it is important to propose clearlythe foundations of positive behaviour. It is notjust to meet some ethical standards considering them asexternal constraints, but to realize that the constructionof a better society is expected from managers andorganizations. Budding managers, who are receivingtraining, mentoring and development in b schools, shouldbe encouraged to uphold human dignity, common good,justice, truth and honesty.
World’s most admired companies’ survey uses nineattributes to evaluate the reputation of the companies (seeAppendix 1 for all nine attributes). Corporate culture shapesthe internal environment of a service organization. It includesfactors such as vision, mission, values, commitment to
continuous improvement, customer orientation, ethicalconduct etc. Thus to shape the employee behavior,Nishkama-Karma concept has to be made an integral part ofservice organization’s culture. This will reinforce the effortsundertaken to shape the new employees in the initial daysin the organization. Living the right values, right attitudeand demonstrating the appropriate behaviours (as given inFigure 2) by all employees will spread a Nishkama-Karmaculture across the organization and help the organization tosustain service excellence and achieve service leadership.The values in the model are based on AMA ethics code andthe employee behaviours are based on the study done with113 consumers who availed interpersonal services andexperienced service satisfaction. The focus of employeeswith nishkama attitude will be to undertake selfless serviceand not on the personal gains (Paninchukunnath and Jain,2010).
? Honesty? Responsibility? Fairness? Respect? Transparency? Citizenship
Values Attitude Behaviour
Nishkama-Karma
? Professional? Adaptability? Spontaneity? Service recovery? Connecting? Response to deviant
behavior? Information sharing? Courteous
All the three to be ensured in all the service employees through right selection, induction,continuous training and development.
Figure 2. Nishkama-Karma Model for achieving service excellence in interpersonal services
Source: (Paninchukunnath and Jain, 2010)
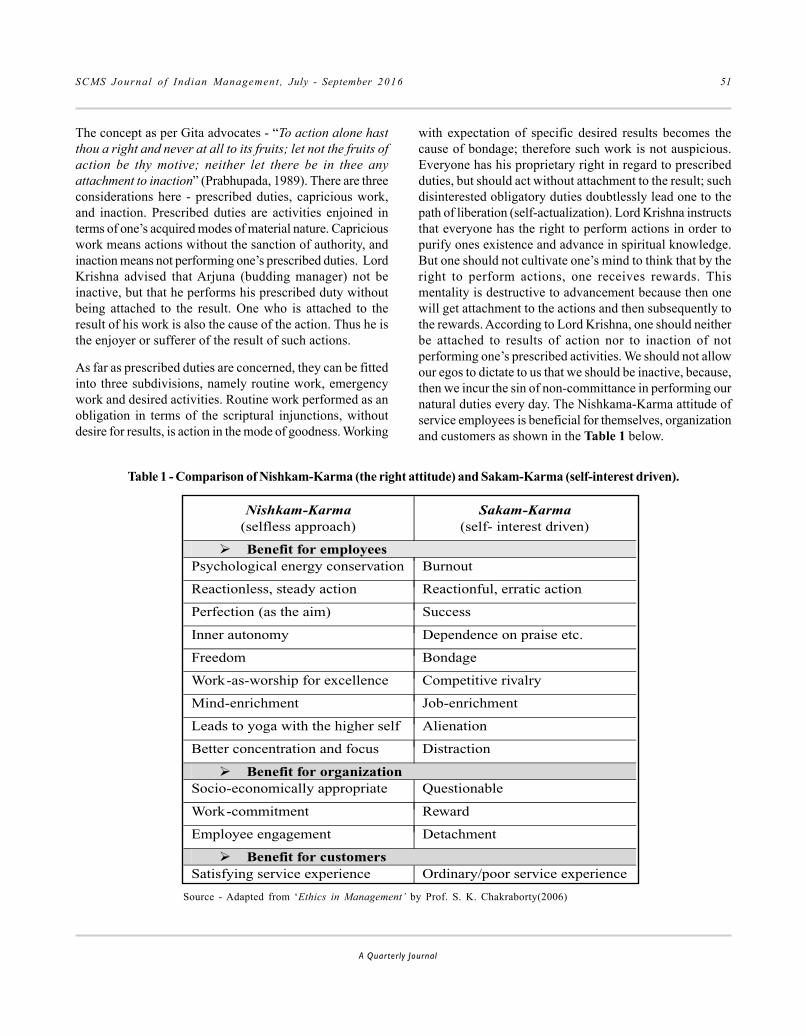
SCMS Journal o f Indian Management , July - September 2016 51
A Quarterly Journal
The concept as per Gita advocates - “To action alone hastthou a right and never at all to its fruits; let not the fruits ofaction be thy motive; neither let there be in thee anyattachment to inaction” (Prabhupada, 1989). There are threeconsiderations here - prescribed duties, capricious work,and inaction. Prescribed duties are activities enjoined interms of one’s acquired modes of material nature. Capriciouswork means actions without the sanction of authority, andinaction means not performing one’s prescribed duties. LordKrishna advised that Arjuna (budding manager) not beinactive, but that he performs his prescribed duty withoutbeing attached to the result. One who is attached to theresult of his work is also the cause of the action. Thus he isthe enjoyer or sufferer of the result of such actions.
As far as prescribed duties are concerned, they can be fittedinto three subdivisions, namely routine work, emergencywork and desired activities. Routine work performed as anobligation in terms of the scriptural injunctions, withoutdesire for results, is action in the mode of goodness. Working
with expectation of specific desired results becomes thecause of bondage; therefore such work is not auspicious.Everyone has his proprietary right in regard to prescribedduties, but should act without attachment to the result; suchdisinterested obligatory duties doubtlessly lead one to thepath of liberation (self-actualization). Lord Krishna instructsthat everyone has the right to perform actions in order topurify ones existence and advance in spiritual knowledge.But one should not cultivate one’s mind to think that by theright to perform actions, one receives rewards. Thismentality is destructive to advancement because then onewill get attachment to the actions and then subsequently tothe rewards. According to Lord Krishna, one should neitherbe attached to results of action nor to inaction of notperforming one’s prescribed activities. We should not allowour egos to dictate to us that we should be inactive, because,then we incur the sin of non-committance in performing ournatural duties every day. The Nishkama-Karma attitude ofservice employees is beneficial for themselves, organizationand customers as shown in the Table 1 below.
Table 1 - Comparison of Nishkam-Karma (the right attitude) and Sakam-Karma (self-interest driven).
Nishkam-Karma(selfless approach)
Sakam-Karma(self- interest driven)
� Benefit for employeesPsychological energy conservation Burnout
Reactionless, steady action Reactionful, erratic action
Perfection (as the aim) Success
Inner autonomy Dependence on praise etc.
Freedom Bondage
Work-as-worship for excellence Competitive rivalry
Mind-enrichment Job-enrichment
Leads to yoga with the higher self Alienation
Better concentration and focus Distraction
� Benefit for organizationSocio-economically appropriate Questionable
Work-commitment Reward
Employee engagement Detachment
� Benefit for customersSatisfying service experience Ordinary/poor service experience
Source - Adapted from ‘Ethics in Management’ by Prof. S. K. Chakraborty(2006)

SCMS Journal o f Indian Management , July - September 2016 52
A Quarterly Journal
Along with ‘Nishkama Attitude’, when the employee ishaving positive attitude, the benefits to organizationmagnifies many fold. Positive attitude manifests in theemployee in the form of positive, constructive and creativethinking; optimism, the motivation and energy to do thingsand accomplish goals, and a happy demeanor.
The dynamic and fast-changing nature of our world todayis best described by managerial acronym- VUCA, short forvolatility, uncertainty, complexity, and ambiguity. Nishkama-Karma Model is useful in employee selection but it does notdiscuss the skill dimension and does not directly discusshardworking orientation, ambition to self-actualize andemotional intelligence which are critical qualities needed inemployees of an organization which want to excel in VUCAworld. Given the narrow approaches adopted by majority ofthe organizations, the need for a holistic framework is veryhigh. Paninchukunnath (2015) has proposed a holisticframework for employee selection in the VUCA world- theKESHAVA framework (K-framework). The frameworkconsists of seven key qualities needed in an employee toadapt and perform in a VUCA environment. Theorganizations need to explore all the seven components inan applicant to assess his/her fitness to face theorganizational challenges in the VUCA world. Thecomponents of the holistic KESHAVA framework are -Knowledge, Emotional Intelligence, Skill, Hardwork, Attitude,Values and Ambition. KESAVA framework will helporganization select the candidates who are always drivenby good ethical values (who can work againstcorruption).Employees having good character andcompetence in equal measure is most suited for the VUCAworld. Leaders of the firms in VUCA world should ensurethat the employees go beyond merely serving customers tocreate unique, delightful, experiences; to honorablyrepresent their company and nurture its brand, not onlywhen they are on the job, but whenever they publiclyexpress themselves in tweets, blog posts, emails, or anyother interaction; and to be creative with fewer resourcesand resilient in the face of unimaginable uncertainty.According to UNESCO, the four pillars of learning include-
1. Learning to know: to provide the cognitive tools requiredto better comprehend the world and its complexities, and toprovide an appropriate and adequate foundation for futurelearning.
2. Learning to do: to provide the skills that would enableindividuals to effectively participate in the global economyand society.
3. Learning to be: to provide self-analytical and social skillsto enable individuals to develop to their fullest potentialpsycho-socially, affectively as well as physically, for a all-round complete person.
4. Learning to live together: to expose individuals to thevalues implicit within human rights, democratic principles,intercultural understanding and respect and peace at alllevels of society and human relationships to enableindividuals and societies to live in peace and harmony.
A. Encourage students to imbibe ethical values
Rokeach (1973) defined values as enduring beliefs that aspecific mode of conduct or end-state of existence ispersonally or socially preferable to an opposite or conversemode of conduct or end-state of existence. ‘Enduring beliefs’means that; values are generally stable, although they canchange as people continue to make decisions that involveputting one value ahead of another. According to AmericanMarketing Association (AMA) values represent thecollective conception of what people find desirable,important and morally proper. Values serve as the criteria forevaluating the actions of others. Marketing practitionersmust recognize that they not only serve their enterprisesbut also act as stewards of society in creating, facilitatingand executing the efficient and effective transactions thatare part of the greater economy. Marketers must embrace,communicate and practice the fundamental ethical valuesthat will improve consumer confidence in the integrity ofthe marketing exchange system. Values for marketers whichare intentionally aspirational include honesty, responsibility,fairness, respect, transparency and citizenship (AMA, 2014).
1. Honesty—to be truthful and forthright in our dealingswith customers.
2. Responsibility—to accept the consequences of ourmarketing decisions and strategies. Make strenuousefforts to serve the needs of customers.
3. Fairness—to try to balance justly the needs of the buyerwith the interests of the seller.

SCMS Journal o f Indian Management , July - September 2016 53
A Quarterly Journal
4. Respect—to acknowledge the basic human dignity ofall stakeholders. Value individual differences and avoidstereotyping customers. Listen to the needs ofcustomers and make all reasonable efforts to monitorand improve their satisfaction on an ongoing basis.
5. Transparency – to create a spirit of openness inmarketing operations.
6. Citizenship—to fulfill the economic, legal, philanthropicand societal responsibilities that serve stakeholders in astrategic manner.
As per Chakraborty and Chakraborty (2005), the foundationof ethics in practice lies in values within. Values are thecause and ethics is the effect. Behaviour is the purest formof the expression of one’s values, intent, priorities andfeelings. Good behavior of employees emanates from thegood value system present in them and the values nurturedby the leaders of the organization. Values like truth,goodness, beauty, Atithi Devo Bhava (guest is God),Vasudhaiva Kutumbakam (the cosmos is one family),tolerance, and simplicity are at the core of Indian culture.The concept of Vasudhaiva Kutumbakam(VK) is used in atheory presented by Marshall McLuhan as global village.
B. Curriculum Modification
B schools can modify their curriculum in two broad ways toteach and learn ethical practices;
(a) Vertical approach - Introduce compulsory courses inareas like - business ethics, leadership, corporategovernance, corporate social responsibility, natural resourcemanagement, climate change, personality development,business sustainability etc. Such compulsory courses willsensitize students to learn and adopt ethical practices. Suchcourses will also contribute to make the MBA curriculummore holistic.
(b) Horizontal approach - Under this approach, the ethicalprinciples and values have to be incorporated in the variousexisting foundation and specialization courses. All thefaculties in the b school have to be trained to incorporateand deliver ethical principles and values in their respectivecourses as a mandatory requirement. This approach willintroduce, remind and reinforce the ethical values almost ona daily basis for the entire duration of two years startingfrom the first semester.
The traditional approach to designing the businesscurriculum around a core of functional areas that embracethe “value-free” assumptions of social science while addinga gloss of value-based ethical platitudes and mini-casesalong the way has not worked well. Without business ethicsfront and center in every business school curriculum, ourfuture record may be more tarnished (Swanson and Frederick,2003). Thus, adopting both vertical and horizontal approachin combination can help generate the right level of ethicalsensitivity and learning in future managers.
C. Code of Conduct - The MBA Oath
The oath is a voluntary pledge for graduating MBAs andcurrent MBAs to “create value responsibly and ethically.”By formalizing a written oath and creating forums forindividuals to personally commit to an ethical standard, theinitiative hopes to accomplish three goals: (1) to make adifference in the lives of the individual students who takethe oath, (2) to challenge other classmates to work towardsa higher professional standard, whether they sign the oathor not, (3) to create a public conversation in the press aboutprofessionalizing and improving management (Andersonand Escher, 2010). The oath can be taken by students at thetime of induction into the MBA program or during the initialweeks of first trimester/semester. This will ensure that thestudents get enough time to understand and practise theirrole from the initial days of their grooming into an ethicaland responsible manager. The oath also needs to bedisplayed prominently in the campus, especially in the classrooms, library, hostel, canteen and seminar halls so thatthey see it daily and reinforce their commitment to make it apart of their daily life. The oath is as follows:
• As a business leader I recognize my role in society.
• My purpose is to lead people and manage resources tocreate value that no single individual can create alone.My decisions affect the well-being of individuals insideand outside my enterprise, today and tomorrow.
• Therefore, I promise that:
I will manage my enterprise with loyalty and care, andwill not advance my personal interests at the expense ofmy enterprise or society.
I will understand and uphold, in letter and spirit, the lawsand contracts governing my conduct and that of myenterprise.

SCMS Journal o f Indian Management , July - September 2016 54
A Quarterly Journal
I will refrain from corruption, unfair competition, orbusiness practices harmful to society.
I will protect the human rights and dignity of all peopleaffected by my enterprise, and I will oppose discriminationand exploitation.
I will protect the right of future generations to advancetheir standard of living and enjoy a healthy planet.
I will report the performance and risks of my enterpriseaccurately and honestly.
I will invest in developing myself and others, helping themanagement profession continue to advance and createsustainable and inclusive prosperity.
In exercising my professional duties according to theseprinciples, I recognize that my behavior must set anexample of integrity, eliciting trust and esteem from those Iserve. I will remain accountable to my peers and to societyfor my actions and for upholding these standards. Thisoath I make freely, and upon my honor.
Although the MBA oath has formalized a written version ofan ethical code of conduct for managers, the concept behindethics in business can be traced back to the initial formationof management education in the early 20th century. RakeshKhurana, a professor at HBS, traces the evolution of themanagement degree in his book- From Higher Aims to HiredHands: The Social Transformation of American BusinessSchools and the Unfulfilled Promise of Management as aProfession (Princeton University Press, 2007). Accordingto Khurana, the original intent of instituting a managementdegree was to educate a managerial class that would runAmerica’s corporations in a way that would serve thebroader interests of society rather than the narrowly definedinterests of capital or labour (Khurana, 2007). B studentsneed to be made aware of the fact that they have duties toothers in society than themselves and their paymasters(Swanson and Frederick, 2003).
D. Conducting Research on Ethics
Research is one of the six principles of PRME. B schoolsneed to undertake constant research to discover innovativeways of addressing the corruption challenge at variouslevels of organization. The research need to cover allcategories of corruption like grand, petty and political.Conducting seminars and workshops from time to time willhelp to disseminate the research findings as well as inorganizing brainstorming sessions among academicians andpractitioners. The students should also be actively involvedin all activities of research and dissemination of findingsamong all stakeholders of the b school.
E. Partnership
B-schools have to collaborate with industry and variousother governmental and non-governmental organizations.The collaboration can be for undertaking various jointinitiatives involving students and faculty. The initiative canrange from awareness creation about ethical practices toimplementing and monitoring good governance systems inorganizations. Such partnerships can facilitate the transferof knowledge and expertise among the partneringorganizations and there by accelerate the process ofeliminating corruption. Partnership as a corruption fightingstrategy is unique as it brings various stakeholders to oneplatform. Corruption can only be eliminated ifrepresentatives from government, business and civil societywork together to develop standards and procedures whichall of them are willing to support. Corruption can’t be rootedout in one big sweep. A steady step-by-step or project-by-project process of fighting corruption can yield better results.A partnership approach is necessary to get all relevantparties around the negotiating table to accelerate correctionand change. Partnership is one of the six principles of PRME.
5. Link between PRME and Fighting Corruption
In the table 2 given below, the link between each PRME andhow through its practice, any b school can contributetowards fighting corruption is explained.
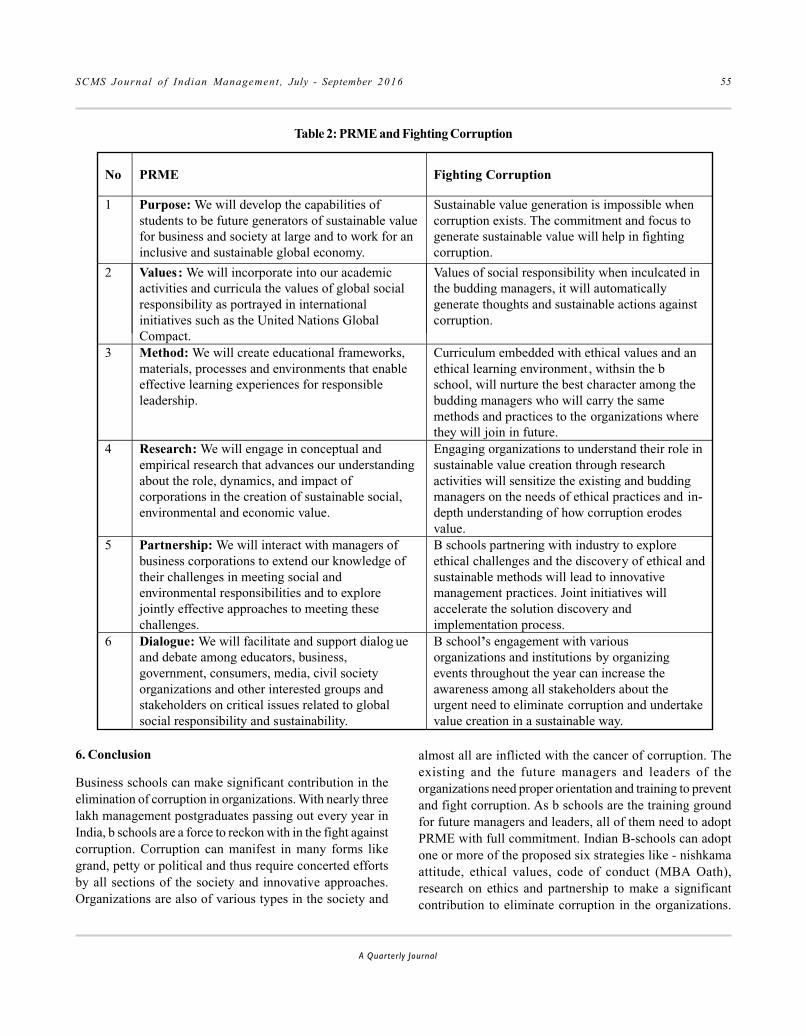
SCMS Journal o f Indian Management , July - September 2016 55
A Quarterly Journal
Table 2: PRME and Fighting Corruption
No PRME Fighting Corruption
1 Purpose: We will develop the capabilities ofstudents to be future generators of sustainable valuefor business and society at large and to work for aninclusive and sustainable global economy.
Sustainable value generation is impossible whencorruption exists. The commitment and focus togenerate sustainable value will help in fightingcorruption.
2 Values: We will incorporate into our academicactivities and curricula the values of global socialresponsibility as portrayed in internationalinitiatives such as the United Nations GlobalCompact.
Values of social responsibility when inculcated inthe budding managers, it will automaticallygenerate thoughts and sustainable actions againstcorruption.
3 Method: We will create educational frameworks,materials, processes and environments that enableeffective learning experiences for responsibleleadership.
Curriculum embedded with ethical values and anethical learning environment, withsin the bschool, will nurture the best character among thebudding managers who will carry the samemethods and practices to the organizations wherethey will join in future.
4 Research: We will engage in conceptual andempirical research that advances our understandingabout the role, dynamics, and impact ofcorporations in the creation of sustainable social,environmental and economic value.
Engaging organizations to understand their role insustainable value creation through researchactivities will sensitize the existing and buddingmanagers on the needs of ethical practices and in-depth understanding of how corruption erodesvalue.
5 Partnership: We will interact with managers ofbusiness corporations to extend our knowledge oftheir challenges in meeting social andenvironmental responsibilities and to explorejointly effective approaches to meeting thesechallenges.
B schools partnering with industry to exploreethical challenges and the discovery of ethical andsustainable methods will lead to innovativemanagement practices. Joint initiatives willaccelerate the solution discovery andimplementation process.
6 Dialogue: We will facilitate and support dialog ueand debate among educators, business,government, consumers, media, civil societyorganizations and other interested groups andstakeholders on critical issues related to globalsocial responsibility and sustainability.
B school’s engagement with variousorganizations and institutions by organizingevents throughout the year can increase theawareness among all stakeholders about theurgent need to eliminate corruption and undertakevalue creation in a sustainable way.
6. Conclusion
Business schools can make significant contribution in theelimination of corruption in organizations. With nearly threelakh management postgraduates passing out every year inIndia, b schools are a force to reckon with in the fight againstcorruption. Corruption can manifest in many forms likegrand, petty or political and thus require concerted effortsby all sections of the society and innovative approaches.Organizations are also of various types in the society and
almost all are inflicted with the cancer of corruption. Theexisting and the future managers and leaders of theorganizations need proper orientation and training to preventand fight corruption. As b schools are the training groundfor future managers and leaders, all of them need to adoptPRME with full commitment. Indian B-schools can adoptone or more of the proposed six strategies like - nishkamaattitude, ethical values, code of conduct (MBA Oath),research on ethics and partnership to make a significantcontribution to eliminate corruption in the organizations.

SCMS Journal o f Indian Management , July - September 2016 56
A Quarterly Journal
Contribution to the elimination of corruption in organizationis a mission which the nearly 4500 b -schools in the countrycan jointly undertake through the adoption of PRME andthe six strategies recommended in this paper. The buddingmanagers and leaders of India can script a new corruptionfree era, if oriented in the right direction during their formativeyears in the b schools which are ever increasing in India.
References
AMA, (2014) Statement of Ethics available at - https://www.ama.org/AboutAMA/Pages/Statement-of-Ethics.aspx - [Accessed 12th November 2015]
Anderson, M. and Peter Escher (2010) The MBA Oath:Setting a Higher Standard for Business Leaders,Penguin Group (USA) Incorporated.
Chakraborty D. and Chakraborty S.K., (2005), Corporatevalues, personal values, cultural congruence andethics: A critical exploration, Metamorphosis-Journalof Management,4(2),138-156.
Chakraborty, S. K.(2006), ‘Ethics in Management’ NewDelhi: Oxford University Press
Haygroup (2014), Who are the FORTUNE World’s MostAdmired Companies 2014? , Available at-http://www.hayg roup . com/ww/bes t_compan ie s /index.aspx?id=155, [Accessed on 18 September 2015].
Khurana R. and Nohria N.(2008), “It’s Time to MakeManagement a True Profession”, Harvard BusinessReview, Vol.86,October, 70-77
Khurana, Rakesh.( 2007) From Higher Aims to Hired Hands:The Social Transformation of American BusinessSchools and the Unfulfilled Promise of Managementas a Profession. Princeton University Press.
Manwani, H.(2013), Leadership in a vuca world, Availableat- http://www.hul.co.in/Images/Harish-AGM-Speech-2013-Leadership-in-a-VUCA-World_tcm114-365167.pdf, [Accessed on 13 November 2015].
Murray, S. (2014), Hundreds Of Indian B-Schools Are ForcedTo Close As Business Bites, Available at- http://www.businessbecause.com/news/mba-india/2558/hundreds-of-schools-forced-close-as-indian-business-bites, [Accessed on 2 November 2015].
Paninchukunnath, A. and Jain, A K. (2010), “The Concept ofNishkama - Karma and Service Excellence” at theInternational Conference on Indian Management for
Global Effectiveness: Insights from the Mahabharata,February 2010 at Indian Business Academy,Bangalore.
Paninchukunnath, A. (2012), Holistic Approach toManagement Education- What Business SchoolsNeed to Do, International Journal of Advances inComputing and Management, 1(1), Jan.– Dec., pp.53-61
Paninchukunnath, A. (2013),Value Proposition of ModernManagement Education and India’s Role, PacificBusiness Review International, Vol. 6(4), 15-24
Paninchukunnath, A. (2015), KESHAVA - Holistic EmployeeSelection Framework in the VUCA World, SCMSJournal of Indian Management,Vol: 12(4), 5-18.
Prabhupada, A. C. B (1989), Bhagavad-Gita As It Is, 2ed,Mumbai, The Bhaktivedanta Book Trust.
Ram,V.(2016), India improves its ranking on corruption index,Available at- http://www.thehindubusinessline.com/economy/india-improves-its-ranking-on-corruption-index/article8159155.ece, Accessed on 28 January2016.
Rokeach, Milton J. (1973), The Nature of Human Values,New York, The Free Press
Swanson, Diane L. and William C. Frederick (2003), AreBusiness Schools Complicit in Corporate Corruption?,Available at- https://www.baruch.cuny.edu/facultyhandbook/documents/AACSB_ethics.doc,Accessed on 13 March 2016.
Urban, Glen L.,(2005), Customer Advocacy: A New Era inMarketing, Journal of Public Policy and Marketing,Vol. 24(1), 155-159.
Notes:
1. http://www.transparency.org/what-is-corruption/?gclid=CjwKEAiApYGyBRC-g_jIstudu V8SJABCEzhZSjY4bjkvJK1DFds_CawnSd L37Do8mmFPjBfirpq CwRoCmErw_wcB#define- Accessed on4 November 2015
2. http://www.unprme.org/ -Accessed on 5 November 2015
3. http://edglossary.org/21st-century-skills/- Accessed on11November 2015
4. http://www.unesco.org/new/en/education/networks/global-networks/aspnet/about-us/strategy/the-four-pillars-of-learning - Accessed on 13 June 2016

SCMS Journal o f Indian Management , July - September 2016 57
A Quarterly Journal
Appendix
Appendix 1: The attributes of reputation on which companies are evaluated in
determining the industry rankings (Haygroup, 2014).
1. Ability to attract and retain talented people
2. Quality of management
3. Social responsibility to the community and the environment
4. Innovativeness
5. Quality of products or services
6. Wise use of corporate assets
7. Financial soundness
8. Long-term investment value
9. Effectiveness in doing business globally
Raters are asked to evaluate each eligible company on each attribute by assigning a score from zero (‘Poor’) to ten (‘Excellent’).For the purposes of the industry rankings, a company’s overall score is determined through a simple average of the individualattribute scores. Companies who rank in the top half of their industry are defined as “most admired” within their industry. Theattributes were developed prior to the inception of the Most Admired Companies rankings in the mid-1980s through a seriesof interviews with executives and industry analysts to determine the qualities that make a company worthy of admiration.
******

SCMS Journal o f Indian Management , July - September 2016 58
A Quarterly Journal
SMEs and Corporate SocialResponsibility : Indian Perception
Dr. Kiran Mehta and Dr. Renuka Sharma
Abstract
he CSR is a multidisciplinary concept and still thereis no consensus developed for a standard defini-tion and scope of Corporate Social Responsibility.
But the contribution of origin of term Corporate SocialResponsibility goes to Bowen (1953) when he defined theterm in his book entitled Social Responsibilities ofBusinessmen. He gave an insightful thought to industryand academia to focus on the relevance of corporate socialresponsibility (CSR) as a very serious affair for both largeand small organizations. One of other earlier books writtenby Davis and Blomstrom (1966) defined social responsibilityas:
“Social responsibility, therefore, refers to a person’sobligation to consider the effects of his decisionsand actionson the whole social system. Businessmen apply socialresponsibility when they considerthe needs and interest ofothers who may be affected by business actions. In so doing,they lookbeyond their firm’s narrow economic and technical
The present study has made an attempt to know the CSR activities done by Small and Medium Enterprises in India
and how do these SMEs perceive the term CSR. The findings of the study have indicated that the SMEs are poor in
communicating their CSR activities to all stakeholders in general and external stakeholders in particular. The major
managerial implications of the current research are to provide training, awareness and orientation to SMEs to
understand the scope of CSR activities and develop a strategic approach towards CSR for sustainability and growth
through proper communication to all stakeholders.
Keywords : Sustainability, Corporate Social Responsibility, Philanthropy, Charity, SMEs, India.
Abstract
T
Dr. Kiran MehtaAssociate Professor (Finance)Chitkara Business SchoolChitkara University, Punjab
Dr. Renuka SharmaAssociate Professor (Finance)Chitkara Business SchoolChitkara University, Punjab
Sustainable Development is development that meets the needs of the present without compromising the ability offuture generations to meet their own needs-
Brundtland Commission’s Report, 1987

SCMS Journal o f Indian Management , July - September 2016 59
A Quarterly Journal
interests (p. 12).”According to Davis and Blomstroom (1975)“CSRs are obligations of decision makers to take actionswhich protect and improve the welfare of society as a wholealong with their own interest.”
The World Business Council for sustainable Development(WBCSD) has said,”Corporate Social Responsibility is thecontinuing commitment by business to behave ethically andcontribute to economic development while improving thequality of life of the workforce and their families as well as ofthe local community and society at large.”
The institute of Chartered Accountants in England andWales describes it as ensuring organizations manage theirbusinesses to make a positive impact on society and theenvironment, at the same time maximizing value for theirshareholders.
The Australian Centre for Corporate Social Responsibilitydefines CSR as the actions taken by an organization tominimize negative social and environmental impacts andleverage, core competencies, products or services to createpositive social and environmental impacts.
The CSR has become a proliferating discourse at all economicand social platform so that the nexus between the societyand business can be established and social responsibilityof business especially large business houses can beestablished.
The above definitions have indicated that the term CSR hasbeen described in various ways. Hopkins (2005) focused onethical treatment to all stakeholders both within and outsidethe organization. It was Archie Carol (1991) who gave abroader and multilayered elaboration of the concept ofCorporate Social Responsibility in four inter-related aspects.They are:
Economic,
Legal,
Ethical, and
Philanthropic responsibilities.
There is a huge consensus among researchers andacademicians regarding these four aspects of corporatesocial responsibility expressed by Carroll.
Figure 1

SCMS Journal o f Indian Management , July - September 2016 60
A Quarterly Journal
“Public policy also has a key role in encouraging a greatersense of corporate social responsibility and in establishinga framework to ensure that business integratesenvironmental and social considerations into theiractivities…Business should be encouraged to take a pro-active approach to sustainable development in itsoperations both within the EU and elsewhere.” Source:European Commission’s Communication on SustainableDevelopment, from EU
The Corporate Social Responsibility has become a globalphenomenon and even if a firm producing least achievementat local level has started thinking about CSR activities tobuild a strong corporate brand image in the market. The bigcompanies have understood that in addition to increasingtheir market size in the global world they have to be goodcorporate citizens too and that is possible by fulfilling thesocial responsibility. But all these big corporates are notdoing such activities deliberately. But many times socialpressures and regulations have strained them to follow acode of conduct, ensures a good governance system andsocially responsible behavior throughout the completechain of stakeholders (from raw material supplier to enduser of product), i.e., all internal and external stakeholders.But continuous uses of CSR practices by big corporateshave several challenges too. As majority of these bigcompanies are operating in various countries with differentculture, laws, regulations and code of conduct therefore,following a long series of socially responsible practices inmany countries is a big challenge. Another major challengecan be the measurement criteria of socially responsiblepractices. How one can actually examine the impact of CSRpractices of a company when other factors are alsocontributing to the economic and non-economicperformance of the company.
Majority of the large and big corporations have beenadopting CSR practices because of one or more of thesethree reasons. The impact of globalization can be observedon the work culture of all big and small organizations. Undersuch a competitive environment, it is really important fororganizations to make their distinctive reputation in themarket place and CSR activities help in attaining this motivetoo. The impact of CSR is tremendously important. It doesnot talk about protecting the interest of closely relatedstakeholders but also to those stakeholders far from the
list. It considers thinking from the perspective of futuregenerations too. There is vast literature available on variousaspects of CSR practices by multinational and transnationalcorporations. But there is an equal importance of suchpractices in small and medium enterprises too. It is moreimportant in case of one of the fastest growing developingcountries like India where this sector can play a pivotal rolein providing employment to large population and cansupport government and industry to meet the targets set in“Make in India” regime. The growth of small and mediumenterprises can give great contribution to reduce poverty inthe country and bring distribution of income at parity level.India being an agro-based economy has more relevance ofachieving growth in small and medium enterprises becausethis sector provides enormous opportunities for sustainablelivelihood through simple production processes adoptedby them. They are the promoters of entrepreneurship tooand can contribute to a sustainable and more resilienteconomic system in a global dynamic environment. Theseare the backbones of large companies too by providingcustomized output usable for industry and for niche marketstoo. The CSR activities can definitely increase thesustainability of SMEs in India. The CSR activities help theSMEs to understand the broader needs of the society andboost innovation in SMEs, reduce cost, reach to worldmarket space and thus increase its own welfare as well as ofsociety. There are critics too for CSR activities who say thatit increases the barricades to open the world economy bypromoting cultural values of a specific society only. But inany case the benefits and opportunities associated withcorporate social responsibility fulfillment are unmatchable.In case of India, the majority of SMEs are run on theirtraditional practices. They have their own culture of servingdifferent stakeholders. The terms “Philanthropy” and“Charity” are also frequently used by the employers of theseSMEs and they use these two forms also as a way to fulfilltheir social and moral duties towards society andenvironment.
CSR is a concept whereby companies integrate social andenvironmental concerns in their business operations and intheir interaction with their stakeholders on a voluntarybasis.” Vast literature is available on how CSR isimplemented in large corporations and its impact on variousefficiency parameters of company. But in case of SMEs,there is relatively much lesser number of studies available.
SCMS Journal o f Indian Management , July - September 2016 61
A Quarterly Journal
The initial evidences were documented by Andersen (1996)and mentioned various benefits of CSR to SMEs whichincluded better sales and brand image, better employeerecruitment and more retention of employees in theorganization etc. Prior to this, Savage (1994) reported that incase of South African companies, approximately 50 percentof the sampled companies were making social disclosuresin which disclosures related to human resource were givenmore importance. It documented that disclosures related toworking conditions, compensation related to employeeswere primarily focused by companies.
Belal (1999) conducted a study on Bangladesh and reportedthat disclosure practices by companies in Bangladeshfocused more on employees and some of the firmsconsidered environmentally related disclosures as a practiceof social disclosures. Purushotahman et al. (2000) concludedthat in Singapore, the economically better performingcompanies were found more inclined towards corporatesocial responsibility disclosure practices in comparison tocompanies performing economically lesser. The corporatesocial disclosure practices were focused on five broadthemes which include, environment, human resources,energy, community involvement and products and services.Ricks (2005) says that CSR in SMEs help them to increaseviability and improve corporate image. It also helps SMEsto get rid of appalling image of corporate. Nielsen andThomsen (2009) document that CSR is more driven bypersonal values of managers of SMEs rather than a strategicfocus of profitability and sustainability. It was identifiedthat the SMEs, in their study, were using only indirectmethods to communicate their CSR activities which wasfruitful in case of internal stakeholders but in case of externalstakeholders indirect or word-of-mouth style ofcommunicating the CSR activities was insufficient.
In more recent study by Dzansi (2011), it was identified thatthe CSR activities in SMEs result in communityimprovement, customer satisfaction, happy workers, moreemployability, better sales and profits, motivated employeeswith increased loyalty and community goodwill. Santos(2011) documented the similar results. In case of India,majority of the research evidences are available in the contextof CSR practices adopted by large corporations. The initialevidences in this regard were documented by Singh andAhuja (1983) when they analyzed annual reports of 40
companies by doing content analysis and made an attemptto identify relationship between corporate reportingpractices with other factors taken in the study. Cowen et al.(1987), Porwal and Sharma (1991), Agarwal (1992), Chander(1992) and Batra (1996) were among others who initiatedresearch on CSR in various public and private companieswherein several evidences were reported related to disclosurepractices and earning or profitability position of thecompanies under study. Shah and Bhaskar (2010) conducteda case study on BPCL in which they extensively discussedthe importance of fulfilling social responsibilities by anorganization being a part of the society. The case studydocumented that the BPCL, a public sector undertaking wastaking many initiatives to fulfill its social responsibility. In amore recent study by Moon (2011), the researcherdocumented that in case of India, CSR activities are assumedto be performed by large companies. The SMEs providehuge employment opportunities in the country andcontribute significantly to the overall GDP of world economy;therefore SMEs should contribute more to the social welfare(Aras and Crowther, 2010). While the overall impact of CSRactivities might be profitable but some individual CSRprojects or activities could not be profitable in the sensethat such CSR activities might not have positive impact onthe profits of the company (Moser and Martin, 2012). Inyang(2013) conducted a study on SMEs by adopting qualitativeliterature survey method and found that SMEs were engagedwith the roles associated with consumerism, environmentalaction, community development, employee initiatives, andsupply chain requirement. As by the study SMEs plausibleengaged in CSR activities and this could be achieved byincreasing training programmes, development of SMEs-oriented tools, increased resources for the SMEs, standardsto guide adoption and implementation of CSR activities,government support etc. Mayr (2015) conducted a casestudy on Austrian Construction Company which was thewell-known example of social activities in Austria and itsowner symbolized the ideal of responsible entrepreneur. Inthis study the author showed that how this company haveintegrated CSR into corporate activities and analyzed theprocess of CSR implementation. Finding of the study statedthat the successful implementation and operationalizationof CSR in SMEs is dependent upon straightforward andrigorous process with both top-down and bottom-upobligations. Johnson and Schaltegger (2015) conducted a
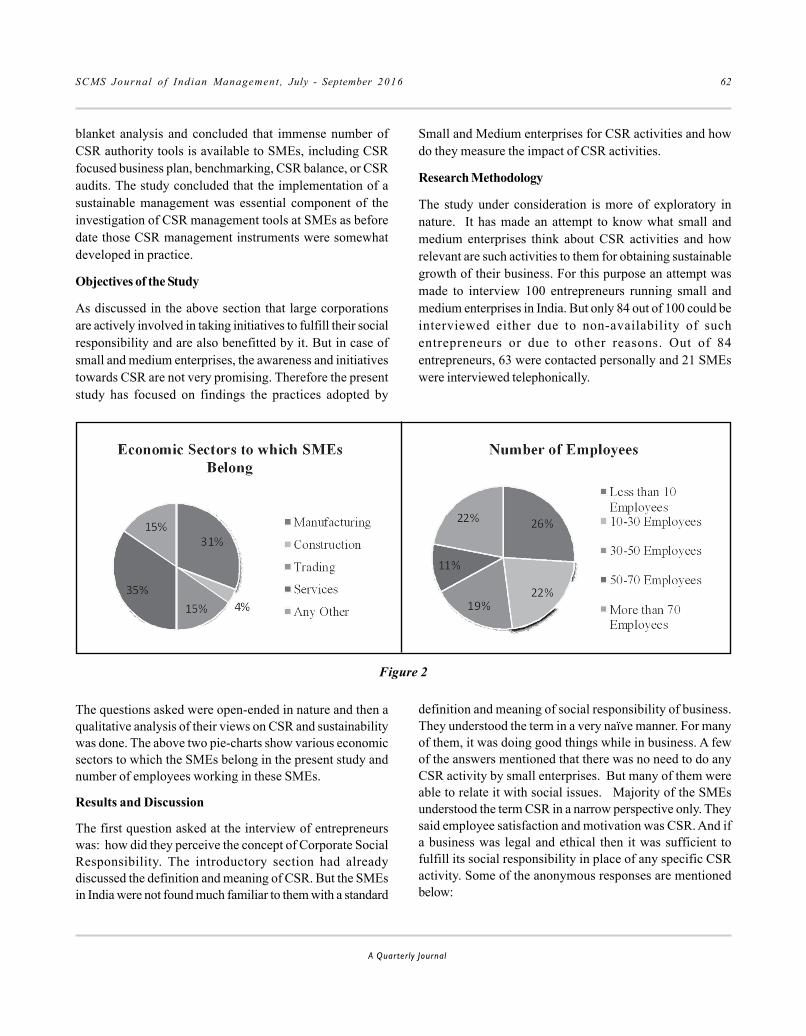
SCMS Journal o f Indian Management , July - September 2016 62
A Quarterly Journal
blanket analysis and concluded that immense number ofCSR authority tools is available to SMEs, including CSRfocused business plan, benchmarking, CSR balance, or CSRaudits. The study concluded that the implementation of asustainable management was essential component of theinvestigation of CSR management tools at SMEs as beforedate those CSR management instruments were somewhatdeveloped in practice.
Objectives of the Study
As discussed in the above section that large corporationsare actively involved in taking initiatives to fulfill their socialresponsibility and are also benefitted by it. But in case ofsmall and medium enterprises, the awareness and initiativestowards CSR are not very promising. Therefore the presentstudy has focused on findings the practices adopted by
Small and Medium enterprises for CSR activities and howdo they measure the impact of CSR activities.
Research Methodology
The study under consideration is more of exploratory innature. It has made an attempt to know what small andmedium enterprises think about CSR activities and howrelevant are such activities to them for obtaining sustainablegrowth of their business. For this purpose an attempt wasmade to interview 100 entrepreneurs running small andmedium enterprises in India. But only 84 out of 100 could beinterviewed either due to non-availability of suchentrepreneurs or due to other reasons. Out of 84entrepreneurs, 63 were contacted personally and 21 SMEswere interviewed telephonically.
The questions asked were open-ended in nature and then aqualitative analysis of their views on CSR and sustainabilitywas done. The above two pie-charts show various economicsectors to which the SMEs belong in the present study andnumber of employees working in these SMEs.
Results and Discussion
The first question asked at the interview of entrepreneurswas: how did they perceive the concept of Corporate SocialResponsibility. The introductory section had alreadydiscussed the definition and meaning of CSR. But the SMEsin India were not found much familiar to them with a standard
Figure 2
definition and meaning of social responsibility of business.They understood the term in a very naïve manner. For manyof them, it was doing good things while in business. A fewof the answers mentioned that there was no need to do anyCSR activity by small enterprises. But many of them wereable to relate it with social issues. Majority of the SMEsunderstood the term CSR in a narrow perspective only. Theysaid employee satisfaction and motivation was CSR. And ifa business was legal and ethical then it was sufficient tofulfill its social responsibility in place of any specific CSRactivity. Some of the anonymous responses are mentionedbelow:

SCMS Journal o f Indian Management , July - September 2016 63
A Quarterly Journal
“CSR is promoting self-regulatory mechanism of followingrules, regulations, standards and compliance and servingthe end consumers.”
“To contribute something to society and a spirit of givingback.”
“I understand it as an obligation to pursue those policiesor to make those decisions or to follow lines of actionsdesirable in terms of the objectives of our society and tocreate and maintain values of our society.”
“CSR marks a great impact on society. It makes a businessto put some efforts in building a well-structured societyand upgrade it in one or the other way.”
“CSR is an activity which is beyond profits of the companyand which helps in uplifting the society.”
“CSR covers economic, legal, ethical, philanthropicactivities and fulfilling responsibilities towards betterenvironmental. All these act as a driving force to force thebusiness organizations to expand their CSR strategiesflanking the desired objectives of the business. It is implicitthat with CSR activities only, the society can sustain forfuture generations.”
“The only purpose of CSR is to build sustainable businesswith healthy economies, markets and societies.”
Succinctly, it can be said that majority of the SMEscomprehend that CSR is an approach thinking beyond ‘JustProfit Maximization’ objective and it involves welfareactivities. Some exceptions were also identified when 2-3small and medium enterprises said that their organization
was too small in size therefore they were not required to doany CSR activity which mainly concerned with medium orbig sized organizations. Even 2-3 entrepreneurs said thatbeing entrepreneurs they had already generated employmentopportunities for the society therefore nothing else was tobe expected from them. Certainly, majority of the SMEs werenot able to make out the strategic aspect of CSR, i.e.,sustainability of business. Further, it is important to knowhow these organizations implemented their CSR activities.
Implementation of CSR Activities
As discussed above, the SMEs in India do not comprehendthe term CSR as big corporate are using it to take strategicadvantage. Almost every entrepreneur interviewed duringthe present study is doing something good for society. Butit is not done in a specific policy framework of business.They are doing welfare activities as per their individualmindful comprehension. More than fifty percent of theentrepreneurs think that looking at the needs of theiremployees is biggest contribution to CSR as it has win-winresults for both organization and employees. Employees feelmotivated with welfare activities supported by theiremployers and they work with more loyalty and efficiencywhich ultimately helps the employer to grow economically.Some of them give utmost importance to disseminatingeducation in the society which will have a sustainable impacton the overall development of society. A few of themspecifically focused on the protection of environment as amajor CSR activity. Broadly, the CSR activities areimplemented through a range of different methods whichare broadly classified into following five categories.

SCMS Journal o f Indian Management , July - September 2016 64
A Quarterly Journal
It was identified that the SMEs considered in the studywere indulged in societal welfare activities and the nextstrategic decision is with regard to communication of CSRactivities of a business
Communicating the CSR Practices to VariousStakeholders
When asked the SMEs how they communicated to differentstakeholders regarding CSR activities done by them, theirretort was quite fascinating. At first, many of entrepreneursreacted as why there was a need to publicize the welfareactivities. These were not done with fortitude to getsomething in reparation.
Many of these entrepreneurs said that they organized someannual event where they show cased the outstandingcontribution made by their workers. It was a kind of revelationto see that motivating employees defined the scope of CSRactivities. Only 20 (approx.) percent organizations have aculture of rolling out emails to different stakeholdersregarding their CSR activities. The point of fact is that thereis trifling understanding among these SMEs regarding theneed of communicating CSR activities. Only theorganizations which focus on employee welfare as a majoractivity of fulfilling social responsibility are using internalcommunication methods or organizing an event where theseare communicated which are targeted to internalstakeholders and external stakeholders come to know aboutall this indirectly not as a result of initiative taken byemployers.
Drivers for CSR Activities by SMEs
Values, Strategies and Public Pressure are the three mostimportant factors identified as basic drivers of corporatesocial responsibility. But if these drivers are related with theentrepreneurs surveyed in the present study then values,public pressure and strategies can be ranked one, two andthree respectively as drivers for CSR activities. Themainstream entrepreneurs said that it was in their valuesystem at family level and that was the main driver for themto behave socially responsible. The respondents of thepresent study highlighted the following as main drivers ofdoing CSR activities.
• Internal Satisfaction
• Value System
• Spirit of Giving Back to Society
• To fulfill responsibility towards society
• Increasing the Goodwill and Reputation ofBusiness
• Good Relationships with labor and employees
• To motivate employees
• Environment Protection
• Helping needy and poor people
• Influence of Other (only 2-3 SMEs reported this)
• Economic sustainability (Only two entrepreneursdirectly link the CSR activities with economicsustainability)
Philanthropy, Charity or Corporate SocialResponsibility?
An interesting part of this issue is that CSR in India isprevalent in its philanthropic form. Philanthropy is anessential part of Indian values and cultures. When we say,values are one of the major drivers of CSR activities, andthen it seems more appropriate and relevant in India. TheSMEs interviewed for the present study, are fulfilling theirresponsibility towards society in the name of charity andphilanthropy also. More than fifty percent of therespondents have agreed that they are involved in charityand philanthropic activities but they do not have a specificpolicy framework in the name of CSR. Even 3-4 SMEs havesaid that they are not aware about the term CSR but they arefunctioning for the betterment of society either in the nameof philanthropy or charity. Majority of the SMEs show areligious and philanthropic attitude and believe that sacredgiving and sharing their income with less-privileged peopleresults in eternal gain.
Measuring the Impact of CSR activities
Since majority of SMEs characterize CSR activities withhumanity and providing better working environment toworkers therefore they perceive the level of self-satisfactionand motivate employees as a measure to witness the impactof CSR activities. It was fascinating to hear when majorityof the SMEs say that they do not know how to measure theimpact of CSR activities and even they never think ofmeasuring the impact of CSR activities. Following are thesome parameters which are focused by SMEs as an upshotof CSR activities.

SCMS Journal o f Indian Management , July - September 2016 65
A Quarterly Journal
• Increased Performance by Employees• Self-Satisfaction• Better reputation of Firm• Happiness• Better Environment and less Pollution• Better Product quality• Increase Profits• Better Relationship with Stakeholders• Easy to find Industry Collaborators• It should not be show-cased therefore there is no
need to explicitly mention the results of CSRactivities.
Conclusion
The society expects business to go beyond their traditionalgoal of profit maximization and undertake corporate socialresponsibility for a sustainable environment and socio-economic growth of a country. The SMEs have been definedon the basis of various parameters, viz., annual turnover,ownership structure, asset value or number of employeesetc. More than 50% of global GDP is produced by SMEs.The idea of CSR practices have also been related to bigcorporates. But recently CSR and SMEs discourse is foundeverywhere. Like big corporate, the responsible practicesby SMEs can also result in sustainability in competitivebusiness eco-system. The current study has observed thatSMEs think about CSR from a very narrow perspective.Majority of them either relate CSR to helping the poor andneedy who give them internal satisfaction and they do itout of humanitarian ground. Or they are relating it just tohelp their employees by providing them some betteramenities, bonuses and incentives so that their turnout ratiocan be reduced and they work with more efficiency. It isdifficult to identify the SMEs who could relate CSR activitiesto all the stakeholders and can think from a broaderperspective which results in sustainability of their businessfor future generations too.
These SMEs are not found interested in making anymandatory provision to perform socially responsibleactivities by government or regulatory bodies. Chahoud etal. (2007) also reported that the Indian companies are in astate of ambiguity regarding their corporate socialresponsibility. Their study has also reported that the Indiancompanies are getting matured in understanding the scope
of CSR and the focus is shifting towards sustainability, self-regulation and multi-stakeholder aspect rather than aphilanthropic attitude.
The current study also supports the prior work that uncoversonly limited use of sustainability management tools in SMEs(Johnaon and Schaltegger, 2015). The rationales for thislimited implementation are that SMEs principally set outquite simple management tools, and the execution ofmultifaceted CSR tools often fails due to resource limitations.Likewise, the present study also confirms that not all CSRactivities at SMEs are profitable (Moser and Martin, 2012).Entrepreneurs and managers of SMEs generally do notquestion whether one or another CSR measure has asuperior outcome on the success of the company; rather,they often set priorities instinctively. Thus, it might be oneof the primary reasons that SMEs do not implement specificCSR management tools, that no need for such tools isalleged by SMEs and that SMEs do not confiscateknowledge about such tools.
Suggestions, Recommendations and Practical Implications
Chaudhary and Wang (2007) reported that the IT companiesin India are lagging behind in a proactive approach towardscommunicating their CSR activities. The 100 IT companiesin their study have been found active in CSR activities butthese companies have not been using the right method tocommunicate such activities to various stakeholders. Incase of present study, the small and medium enterpriseshave been found even more unapprised when it comes tocommunicating the CSR activities to various stakeholders.Using proper Ways of Communicating CSR activities:
The Small and Medium Enterprises have not been foundactive in communicating their CSR activities to internalstakeholders as well as to external stakeholders. Tocommunicate the same to internal stakeholders, differentmethods like internal newsletters, award ceremonies for staffand employees, and internal departmental meetings can beused to showcase CSR activities. Similarly, to communicatethe same to external stakeholders, internet, website, usingsome vernacular newspapers and communicating all relevantinformation to suppliers, debtors, vendors and distributorscan also be helpful.
The present study gives an insight into the very practicalapproach to CSR activities in SMEs and thus makes avaluable contribution to the theory development specificallyin Indian context. In particular the present study shows that

SCMS Journal o f Indian Management , July - September 2016 66
A Quarterly Journal
CSR management at SMEs is not a particular discipline butquite varies based on company culture and on the mindsetof the founder or entrepreneur. It also states that SMEsshould link CSR activates to their corporate strategies. SMEsgenerally have a propensity to spotlight stoutly on day-to-day business and operational objectives. Therefore, CSRmanagement can expand the perspective of the SME andreinforce company’s awareness of resources andcompetencies. All this will help SMEs to prepare them betterfor the future and will make them even more competitive.
One more observation during the study is worth mentioningthat these SMEs are expecting Government to acknowledgethe endeavors made by these enterprises for the upliftmentof society. There is no formal platform for suchacknowledgement. So governments can strengthen SMEby acknowledging those SMEs which are successfully doingCSR activities. The current study also defines that howSMEs can execute their CSR activities. Similarly SMEsshould consider individual contextual factors, such as thegeneral business environment and individual stakeholder’sinterest while implementing the CSR activities in their ownorganization (Baumgartner 2014). However, the possibilitythat CSR will be subjugated and used utterly for marketingand communication purposes cannot be barred. Theintentional utilization of CSR activities that has a vigorousconnection to the company’s core business and the notionthat CSR is a long term investment (Burke and Logsdon,1996), both of which indirectly enhance enterprise value,are felicitous from an ethical standpoint and even desirablein terms of overall convivial welfare (Husted and Allen 2000).This understanding in particular must be promoted to a morepreponderant extent among entrepreneurs and managers.
This study designates a desideratum for additional researchon the motives for and rudimentary understanding of CSRactivities in SMEs. Moreover, it would be subsidiary toexamine the expedient by which CSR core areas are definedand the methods for linking CSR activities to the corebusiness. From a hardheaded viewpoint, the perpetuatingabsence of CSR activities implements at SMEs should beaddressed (Johnson and Schaltegger, 2015). Conducting avariety of studies/research will yield more concrete anddetailed recommendations for the strategic implementationof CSR at SMEs, taking into account the particularcharacteristics of each company. Another fascinating issueis how SMEs (companies in general) address CSR
commitments in times of economic difficulties and financialcrises; finding a felicitous balance between profit orientationand CSR commitment seems to be quite exigent (Mayr 2010).
References
Agarwal, R. (1992). “Corporate Social InformationDisclosure- A Comparative Study.” Effectivemanagement, pp. 76-85.
Andreasen, A. R. (1996). “Profits for non-profits: Find acorporate partner.” Harvard Business Review, 74, 47-59.
Aras, G. and D. Crowther, (2010). A Handbook of CorporateGovernance and Social Responsibility GowerPublishing Limited.
Batra, G S, (1996). Dynamics of social auditing in corporateenterprises: A study of the Indian corporate sector,Managerial Auditing Journal-Bradford, 11(2), 36-45.
Belal, A R, (1999). Corporate Social Reporting in Bangladesh,Social and Environmental Accounting, 19(1), 8-12.
Bowen, H. R. (1953). Social responsibilities of businessman.New York: Harper & Brothers.
Burke, Lee and Logsdon, Jeanne (1996).” How CorporateSocial Responsibility Pays Off.” Long RangePlanning, 29(4), 495–502.
Carol, A (2002). “Internal Organizational Factors InfluencingCorporate Social and Ethical Reporting: BeyondCurrent Theorizing.” Accounting, Auditing andAccountability Journal, 15(2), 223-250.
Chander, S.(1992). Corporate Reporting Practices in Publicand Private Sector. Deep and Deep publications, NewDelhi.
Chaudhri, V., and J.Wang. (2007).” Communicating corporatesocial responsibility on the Internet: A case study ofthe top 100 IT companies in India.” ManagementCommunication Quarterly, 21, 232-247.
Cowen, S. F., Ferreri, and L.D. Parker. (1987). “ The Impact ofCorporate Characteristics on Social ResponsibilityDisclosure: A Topology and Frequency basedAnalysis.” Accounting, Organisations and Society,12(2), 111-122.

SCMS Journal o f Indian Management , July - September 2016 67
A Quarterly Journal
Davis, K. and R.L. Blomstrom. (1966). Business and ItsEnvironment, New York: McGraw- Hill publications,
Dzansi, D .Y. (2011). “ Social responsibility of smallbusinesses in a typical rural African setting: Someinsights from a South African study.” African Journalof Business Management, 5(14), 5710-5723.
EU Commission (2001). Green Paper - Promoting a Europeanframework for Corporate Social Responsibility, COM(2001). 366
Hopkins. M. (2005). “Measurement of Corporate SocialResponsibility.” International Journal ofManagement and Decision Making. 6 (3/4), 213-231.
Husted, W. Bryan and Allen, B. David (2000). “Is It Ethicalto Use Ethics as Strategy?” Journal of BusinessEthics, 27(1/2), 21–31.
Inyang Benjamin James (2013). “Defining the RoleEngagement of Small and Medium-Sized Enterprises(SMEs) in Corporate Social Responsibility (CSR).”International Business Research, 6(5).
Johnson, P. Matthew and Stefan. Schaltegger (2015). “TwoDecades of Sustainability Management Tools forSMEs: How Far Have We Come?” Journal of SmallBusiness Management, Pages n/a.
Mayr, Stefan (2015). “Corporate Social Responsibility inSMEs: The Case of an Austrian ConstructionCompany.” International Journal of BusinessResearch, 15(2), 61-72. Available at SSRN: http://ssrn.com/abstract=2621750
Moon, U. (2011). “Corporate Social Responsibility in India,National Conference on Corporate SocialResponsibility Issues and Challenges.” MarathasMandir’s Babasahed Gawde institute of ManagementStudies, retrieved on dated: 20 August, 2012 fromhttp://www.mmbgims.com/docs/full_ paper/36_Urmila%20Moon_ab .pdf.
Moser, V. Donald, and Martin, R. Patrick , (2012). A BroaderPerspective on Corporate Social Responsibility
Research in Accounting, The Accounting Review,87(3), 797–806.
Nielsen, A. E, and C.Thomson, (2009). Corporate socialresponsibility communication in small and medium-sized enterprises, International Journal of corporatecommunication, 14(2), 176-189
Porwal, L., and N.Sharma, (1991). “Social ResponsibiltyDisclosures by Indian Companies.” The CharteredAccountants , XXXIX(8), 630-635.
Purushotahman, M, Phil, H and T. Ross, (2000). “Determinants of Corporate Social Reporting Practicesof Listed Singapore Companies.” An AccountingReview, 101.
Ricks, J. M. Jr, (2005). “ An assessment of strategic corporatephilanthropy on perceptions of brand equityvariables.” Journal of Applied Business Research, 7,121-134.
Santos, M. (2011). “ CSR in SMEs: Strategies, practices,motivations and obstacles.” Social ResponsibilityJournal, 7(3), 490-508. http://dx.doi.org/10.1108/17471111111154581
Savage, A. (1994). “ Corporate Social Disclosure Practicesin South Africa: A Research Note.” Social andEnvironmental Accounting, 14(1), 2-4.
Shah, Shashank and Sudhir Bhaskar, ( 2010). “CorporateSocial Responsibility in an Indian Public SectorOrganization: A Case Study of Bharat PetroleumCorporation Ltd.” Journal of Human Values, 16(2),143-156.
Singh, D and J. Ahuja, (1983). “ Corporate Social Reportingin India.” The International Journal of Accounting,18(2), 151-169.
Tatjana Chahoud et.al, (2007). “Corporate Social andEnvironmental Responsibility in India - Assessing theUN Global Compact’s Role.” German DevelopmentInstitute (DIE), Bonn.
******
SCMS Journal o f Indian Management , July - September 2016 68
A Quarterly Journal
Measures of Market Penetration byBanks: Indian Perspective
Dilpreet Singh and Dr. Harpreet Singh
Abstract
or the past two decades, market penetration bybanks has been a subject matter of concern forbankers and regulators. There has been a lot of talk
inside and outside the banking industry regarding the manybenefits of penetration of banking services (Bihari, 2011).While regulators view it as a means to achieve financial andsocial inclusion, bank strategists consider it a route toenhance growth and profits (Singh and Singh, 2015). Butwhat ever may be the end, social, economic or commercial,deepening of banking services has been accorded a highpriority by both regulators (Mukhopadhyaya, 2014) andbanks (Kumar and Radcliffe, 2015).
India is the seat of the largest unbanked population in theworld (CRISIL, 2015). On an average, only 35 percent peoplehave a bank account or a formal access to banking services(World Bank, 2015a). The rest of the 65 percent populationof the country is excluded from mainstream banking services.When compared with the global average of 50 percent (WorldBank, 2015a), India is found severely lagging behind. Thissituation is worrisome from the point of view of both, theindividual and the economy.
Although literature on market penetration by banks is replete with the motives and recompenses ofpenetration ofbanking services, little light has been shed on how market penetration by banks can be measured. Within the context,the present study is an attempt to conclusively establish the measures of market penetration by banks. An empiricalanalysis of the views of 364 bank officials engaged in the development or execution of strategies revealed that increasein number of account holders, increase in total number of branches, increase in aggregate deposits, and increase innumber of ATMs, are the most important measures of banking penetration. It is therefore recommended that whenattempting to capture market penetration by banks, these parameters should be used.
Keywords: Bank, market penetration, India, multi-dimensional scale
Abstract
F
Dilpreet [email protected] Professor,Chitkara Business School,Chitkara University, Chandigarh
Dr. Harpreet [email protected] and Head,PG Department of Commerce,Government Bikram College, Patiala

SCMS Journal o f Indian Management , July - September 2016 69
A Quarterly Journal
At an individual level, access to banking services canimprove the standard of living and break the vicious circleof poverty (Dangi, 2013). It can enable access to cheaporganized credit, releasing the currently unbanked from thecontrol of spurious moneylenders and create opportunitiesfor livelihood generation, savings and investments (Gargand Agarwal, 2014). This will insulate individuals and theirfamilies from economic shocks and create avenues for wealthcreation.
From the point of view of the economy, penetration ofbanking services shall pave way for inclusive growth. Withall sections of the society participating in the process ofeconomic growth and development, India shall be able toarrest the perpetual problems of slow economic growth andpersistent income inequality (GPFI, 2015). Realization of smallbusiness opportunities in the wake of access to affordablecapital shall generate welfare effects that will manifestthemselves in the form of greater economy activity, incomegeneration (Nayak, 2014) and reduced poverty (Scronce,2014).
Realizing the social and economic benefits of penetration ofbanking services, national policy-makers and regulators haveembarked on a very ambitious program of penetration ofbanking services (Garg and Agarwal, 2014). Embracing it asa development priority, the government has publicallycommitted to achieve a deep penetration of banking services.It announced the Pradhan Mantri’s Jan Dhan Yojanaenvisioning a bank account for every Indian(Mukhopadhyaya, 2014). It relaxed the KYC norms andadopted many technology and knowledge basedapproaches to ensure the hassle free and cost-effectivepenetration of banking services (Garg and Agarwal, 2014).Not only this, the Reserve Bank of India launched manyawareness and literacy campaigns to promote theacceptance of banking services among the masses (Thapar,2013). The Central Bank also facilitated bank linkages bydeveloping the banking correspondent model. This helpedprevent the hemorrhage of money in the process ofpenetration by outsourcing the actual process of reachingthe unbanked. Undoubtedly the efforts made by thegovernment to improve the penetration of banking servicesare laudable.
Moving ahead, if we look at the situation from the point ofview of the bankers, we find an equal if not more emphasis
laid by them on penetration of banking services. This makesone wonder why market penetration has caught the fancyof bank strategists and become an integral part of theirplanning.
Reaching the unbanked is a means to enhance the profits ofbanks (Singh and Singh, 2015). Contemporary banks areconsequently penetrating virgin markets and designing newproducts and services to cater to the needs of the unbanked(Sarma, 2008). Banks are vigorously opening new accountsand establishing new branches aiding in deposit and creditpenetration (CRISIL, 2015). These initiatives are helpingbanks explore new avenues of growth in the wake ofstagnation in current markets (Muldoon, 1989; Javalgi et al.,1990; Philp et al., 1992; Anthony et al., 2006; Howley &Savage, 2007), as well as beat the competition (Meidan, 2007).Therefore, in adopting the strategy of market penetration,banks are looking to achieve growth, enhance profits andsnatch a larger share of the market.
Having established that the government and bankers areboth concerned with the deepening of banking services, itmay be suitable to explore what exactly penetration ofbanking services entails and how it can be measured.
The finance ministry believes that the number of bankaccounts, irrespective of the volume of deposits is the mostsignificant measure of banking penetration (Srinivasan,2014). The Reserve Bank of India considers ATM networkand branch network (inclusive of business correspondents)as the most important indicators of penetration of bankingservices (RBI, 2013). The Government deems electronicbenefits transfer as a measure of penetration of bankingservices since a hundred percent success in electronictransfer of subsidies would imply that every household hasat least one bank account (Srinivasan, 2014). In other words,the Government too thinks that an increase in the number ofbank accounts signifies penetration of banking services.
Further, taking up the case of international bodies, thenumber of commercial bank branches is the most importantG20 indicator of penetration of banking services. The otherparameters that G20 uses to measure banking penetrationare formally banked adults, formally banked enterprises andpoints of banking service (GPFI, 2011). The InternationalMonetary Fund accounts for banking penetration throughthe number of commercial bank branches. The World Bank

SCMS Journal o f Indian Management , July - September 2016 70
A Quarterly Journal
however differs in its approach and considers the numberof bank accounts and the number of transactions per accountas the most important gauges of the extent of marketpenetration by banks (World Bank, 2015b). The samemeasures are also used by the credit rating agency CRISIL(CRISIL, 2015).
Moving away from regulators, and towards researchers,Meidan (2007) points out that penetration strategies forbanks include construction of additional bank branches,attracting new customers, establishing electronic fundtransfer points, increasing the usage rate of existing servicesand developing new markets. Howley and Savage (2007)feel that penetration of banking services entails extension
of range of banking interests and foray into internationalbanking. Kane (2005) believes that it not possible to achievepenetration of banking services “without a culture of depositgathering and deposit growth.” On the basis of an empiricalresearch, Demirguc-Kunt and Klapper (2013) establishaccount penetration and access to bank credit as measuresof penetration of banking services. Mukkawar (2012)expresses banking penetration as a function of number ofrural bank braches. Nayak (2014) uses the increase in numberof smart cards in circulation to measure the extent ofpenetration of banking services and Samra (2012) believesthat an increase in the number of banks and bank branchesindicates a higher penetration of banking services (Table 1captures the review of literature).
Sl. No. Author and date Measures/Indicators of penetration of banking servicesRegulatory bodies
1. Finance ministry Number of bank accounts2. Government of India Electronic benefits transfer
Number of bank accounts3. Reserve Bank of India ATM network
Branch network (inclusive of businesscorrespondents)
International bodies4. G20 (GPFI, 2011) Number of commercial bank branches
Formally banked adultsFormally banked enterprisesPoints of banking service
5. International Monetary Fund Number of commercial bank branches6. CRISIL Number of bank accounts
Number of active accounts7. World Bank Number of bank accounts
Number of transactions per accountResearchers
8. Kane (2005) Volume of deposits9. Howley& Savage (2007) Extension of range of banking interests
Foray into international banking10. Meidan (2007) Number of bank branches
Number of customersNumber of fund transfer pointsUsage rate of existing servicesDevelopment of new markets
11. Mukkawar (2012) Number or rural bank branches12. Samra (2012) Number of banks
Number of bank branches13. Nayak (2014) Number of smart cards14. Demirguc-Kunt&Klapper
(2013)Account penetrationAccess to bank credit
Table 1: Snapshot of review of literature

SCMS Journal o f Indian Management , July - September 2016 71
A Quarterly Journal
From previous studies, it can be safely inferred that thoughthe end is the same, each researcher has used a differentapproach to measure the extent of penetration of bankingservices. Further, while the regulators and internationalbodies both support the conviction of bankers, who believethat market penetration can increase growth, leading to socialand economic prosperity; they lack consensus on howpenetration of banking services can be measured or whatits chief indicators are. The present study attempts toestablish the same.
There is a lot of debate inside and outside the bankingindustry regarding market penetration by banks. Literatureis replete with the economic and social rewards of penetrationof banking services (Anthony et al., 2006; Trivelli, 2013). Anumber of previous researchers have proffered differentdefinitions (Meidan, 2007), motives (Singh and Singh, 2015)and advantages (Howley & Savage, 2007; Sarma, 2008) ofmarket penetration by banks; and there exists a consensusamong their views. However, the authors found a lack of
agreement among the previous researchers regarding howmarket penetration by banks can be measured. Within thecontext, the present study is an attempt to establish themeasures of market penetration by banks.
Study Methodology
Questionnaire and Data Collection: A questionnairecontaining the possible variables that may be used tomeasure market penetration by banks (for study variablesrefer to table 2) was drafted. A review of literature andinterviews with senior bank officials helped collate thestudy variables. In order to assess the relative importanceof a particular variable, the responses of the respondentswere anchored on a five-point Likert scale with 1 indicating“very important” and 5 indicating “very unimportant.” Thequestionnaire also contained questions on the demographicprofile of the respondents. The questionnaire was pretestedfor validity and clarity on respondents selected from therelevant population.
Table 2: Variables used in the questionnaire
Sl. No. Study variables1. Increase in total number of branches2. Increase in number of branches in metropolitan cities3. Increase in number of branches in urban areas4. Increase in number of branches in semi-urban areas5. Increase in number of branches in rural areas6. Increase in number of employees7. Increase in number of ATMs8. Increase in aggregate deposits9. Increase in term deposits10. Increase in demand deposits11. Increase in savings bank deposits12. Increase in aggregate amount of loans13. Increase in amount of term loans14. Increase in non fund income15. Increase in debit cards16. Increase in credit cards17. Increase in number of cheques18. Increase in number of account holders19. Increase in number of rural bank account holders20. Increase in number of urban bank account holders21. Increase in number of transactions per account22. Increase in number of banking correspondents
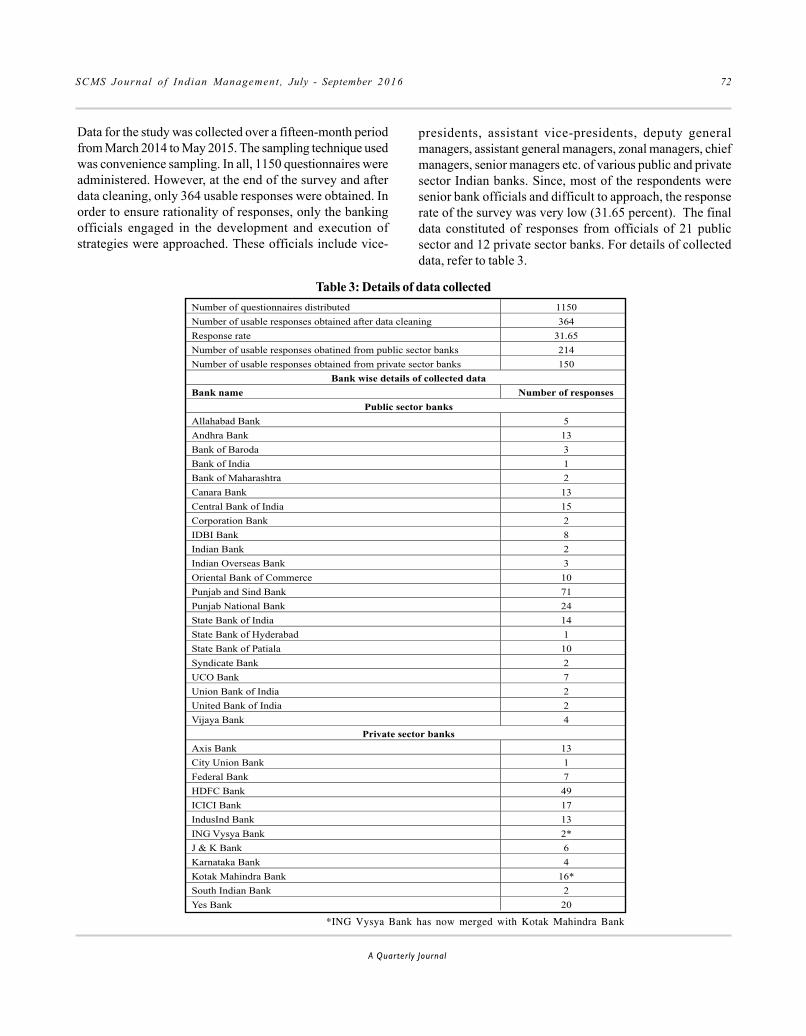
SCMS Journal o f Indian Management , July - September 2016 72
A Quarterly Journal
Data for the study was collected over a fifteen-month periodfrom March 2014 to May 2015. The sampling technique usedwas convenience sampling. In all, 1150 questionnaires wereadministered. However, at the end of the survey and afterdata cleaning, only 364 usable responses were obtained. Inorder to ensure rationality of responses, only the bankingofficials engaged in the development and execution ofstrategies were approached. These officials include vice-
presidents, assistant vice-presidents, deputy generalmanagers, assistant general managers, zonal managers, chiefmanagers, senior managers etc. of various public and privatesector Indian banks. Since, most of the respondents weresenior bank officials and difficult to approach, the responserate of the survey was very low (31.65 percent). The finaldata constituted of responses from officials of 21 publicsector and 12 private sector banks. For details of collecteddata, refer to table 3.
Number of questionnaires distributed 1150
Number of usable responses obtained after data cleaning 364
Response rate 31.65
Number of usable responses obatined from public sector banks 214
Number of usable responses obtained from private sector banks 150
Bank wise details of collected data
Bank name Number of responses
Public sector banks
Allahabad Bank 5
Andhra Bank 13
Bank of Baroda 3
Bank of India 1
Bank of Maharashtra 2
Canara Bank 13
Central Bank of India 15
Corporation Bank 2
IDBI Bank 8
Indian Bank 2
Indian Overseas Bank 3
Oriental Bank of Commerce 10
Punjab and Sind Bank 71
Punjab National Bank 24
State Bank of India 14
State Bank of Hyderabad 1
State Bank of Patiala 10
Syndicate Bank 2
UCO Bank 7
Union Bank of India 2
United Bank of India 2
Vijaya Bank 4
Private sector banks
Axis Bank 13
City Union Bank 1
Federal Bank 7
HDFC Bank 49
ICICI Bank 17
IndusInd Bank 13
ING Vysya Bank 2*
J & K Bank 6
Karnataka Bank 4
Kotak Mahindra Bank 16*
South Indian Bank 2
Yes Bank 20
Table 3: Details of data collected
*ING Vysya Bank has now merged with Kotak Mahindra Bank

SCMS Journal o f Indian Management , July - September 2016 73
A Quarterly Journal
Data Analysis Techniques: In order to establish the mostimportant measures of market penetration by banks, meanscores for each variable were calculated. It was consideredappropriate to calculate mean scores since it is the mostsuitable technique if the purpose is to arrive at a singlemost representative value for a set of known numbers(Medhi, 1992; Salkind & Rasmussen, 2006). It is the bestpredictor of the centroid of a set of values. This techniquewas also considered fitting because it makes theincomparable attributes (measures of market penetration bybanks in the present case) comparable and prioritizes themby reducing and aggregating the information into onestandardized score. This process provides a clear cutranking of the alternatives (Herwijnen, 2006) andcategorically helps judge, which score is high and whichscore is low (Cohen et al., 2011).
Further, to convert the results into an easy to visualizestructure (Ding, 2006) multi dimensional scaling wasemployed. It was considered particularly appropriate in thepresent case because it helped create faithful geometricrepresentations of rated similarity between each pair of items(Hout et al., 2013).
Profile of respondents: Table 4 represents the demographicprofile of the respondents. As can be seen, the percentageof male respondents was nearly three times the femalerespondents. The percentage of male respondents was 76.10percent, while the percentage of female respondents was23.90 percent. Further, 28.85 percent respondents were under30 years, 22.53 percent respondents were in the age groupof 31 to 40 years, 14.56 percent respondents were between41 and 50 years and 34.07 percent respondents were over 51years (age categories have been adopted from Sarros et al.(2012)).
Table 4: Demographic profile of respondents (n = 364)
Variable Classification of variable Frequency PercentageGender Male 277 76.10
Female 87 23.90Age Under 30 years 105 28.85
31 – 40 years 82 22.5341 – 50 years 53 14.56Over 51 years 124 34.07
Data Analysis and DiscussionTable 5 shows the mean scores attained by each studyvariable. A lower mean score indicates a higher importanceof the variable and vice-versa. Variables have been arrangedin decreasing order of importance. Further, variables have
also been ranked on the basis of the scores they haveattained (Herwijnen, 2006).
In the succeeding paragraphs each of the study variableshave been discussed in detail.
Table 5: Measures of market penetration by banks
Study variable Mean Score RankIncrease in number of account holders 1.21 1Increase in total number of branches 1.29 2Increase in aggregate deposits 1.39 3Increase in number of ATMs 1.40 4Increase in number of branches in rural areas 1.41 5Increase in debit cards 1.51 6Increase in aggregate amount of loans 1.56 7Increase in non fund income 1.57 8Increase in number of rural bank account holders 1.61 9Increase in number of employees 1.64 10Increase in credit cards 1.68 11

SCMS Journal o f Indian Management , July - September 2016 74
A Quarterly Journal
Increase in savings bank deposits 1.71 12Increase in amount of term loans 1.75 13Increase in number of urban bank account holders 1.81 14Increase in demand deposits 1.84 15Increase in number of branches in semi-urban areas 1.89 16Increase in term deposits 1.92 17Increase in number of banking correspondents 1.97 18Increase in number of cheques 1.99 19Increase in number of branches in urban areas 2.04 20Increase in number of branches in metropolitan cities 2.09 21Increase in number of transactions per account 2.78 22
Increase in number of account holders: “Increase in numberof account holders” has emerged as the most significantmeasure of market penetration by banks. Interestingly, thisfinding is in synchronization with the indicators of bankpenetration used by the finance ministry, the World Bankand the credit rating agency CRISIL. Further, many previousresearchers (Meidan, 2007; Derirguc-Kunt and Klapper, 2013)have also considered an increase in the number of bankaccounts as a vital measure of penetration of bankingactivity.
Though an increase in the number of bank accounts is apopular determinant of penetration of banking services,many previous researchers have not used it to measure theextent of banking penetration (Kane, 2005; Mukkawar, 2012;Samra, 2012; Nayak, 2014). This probably could be becausemany critics feel that the number of accounts irrespective ofthe volume of deposits is meaningless (Howley and Savage,2007). Citing the particular case of India, in the wake of thegovernment’s mission to achieve financial inclusion, over100 million new bank accounts have been opened. Out ofthese new accounts, only 54 percent are actively used(Murthy, 2015). Thus, the approach of achieving bankingpenetration by opening new accounts may be flawed due tothe lack of universality of the method and the sheer focuson speed and numbers (Ramaswamy, 2014).
To over come this problem, banking experts recommend theuse of a more superior measure of banking penetration -number of transactions per account (CRISIL, 2015; WorldBank, 2015b). Critics believe that an increase in the numberof transactions per account indicates an increase in bankingactivity and hence banking penetration (Meidan, 2007).
However, in the current study bank strategists have notaccorded any importance to this parameter (rank 22).
Despite the drawbacks in this approach, the number of bankaccounts remains the most important and popular measureof penetration of banking services. Further, while the absolutenumber of bank accounts has emerged as the most importantparameter to measure banking penetration, the respondentsdo not accord an equal importance to the geographicallocation of the bank accounts. The variable “Increase innumber of rural bank account holders” (rank 9) has managedto achieve a rank among the top ten variables, but the variable“Increase in number of urban bank account holders” (rank14) has not emerged as a significant indicator of marketpenetration by banks in the present study. This couldprobably be a reflection of the understanding of the bankstrategists that a higher potential for banking penetrationexists in the rural markets.
Furthermore, closely associated with the number of bankaccounts, is the number of debit cards (most account holderspossess a debit card). This could have accounted for therelatively high rank (rank 6) achieved by the variable –“Increase in number of debit cards.” It may not be amiss topoint here that while the number of debit cards has emergedas a reasonably important measure of banking penetration,the number of credit cards has not been afforded a similartreatment (rank 11). This could be a reflection of the loan-averse nature of the Indian population, where resorting toborrowed money is still a social taboo. If we compare theseresults with those of a study conducted by Nayak (2014),we find a dichotomy in the results of the two studies. Nayak(2014) considered an increase in number of smart cards as

SCMS Journal o f Indian Management , July - September 2016 75
A Quarterly Journal
the most important measure of penetration of bankingservices. This finding is not seconded by the current study.
Increase in total number of branches: “Increase in totalnumber of branches” has emerged as the second mostimportant measure of penetration of banking services. Thisfinding coincides with the banking penetration indicatorsused by the Reserve Bank of India (Reserve Bank of India,2015), G20 and the International Monetary Fund. Individualresearchers, such as, Meidan (2007) and Samra (2012) havealso recommended an increase in the number of commercialbank branches as an important measure of bankingpenetration.
Banking experts opine that not only the number of branches,but also their location plays an important role in achievingpenetration of banking services (Philp et al., 1992). Sincegrowth in the current markets has saturated and mostmetropolitan cities in India have achieved a 100 percentpenetration of banking services (CRISIL, 2015), a move intothe rural markets is recommended. For this reason perhaps,in the current study “Increase in the number of branches inrural areas” has emerged as the fifth most important measureof penetration of banking activity. This finding of the currentstudy is supported by the findings of a previous studyconducted by Mukkawar (2012). Given the Indian scenario,Mukkawar (2012) recommends an increase in the number ofrural bank branches as the most significant measure ofbanking penetration. Further, apart from rural branches, noneof the other study variables specifying the location of newbank branches – “Increase in number of branches in semi-urban areas” (rank 16), “Increase in number of branches inurban areas” (rank 20) and “Increase in number of branchesin metropolitan cities” (rank 21) have emerged as significantindicators of penetration of banking services.
Though an increase in number of branches is a popularmeasure of banking penetration, many previous researchershave not taken it into consideration while accounting forpenetration of banking services (Nayak, 2014; Demirguc-Kunt & Klapper, 2015). This may be on account of a decreasein reliance on physical bank branches and popularity ofbranchless banking (PwC, 2012). It may also not be amiss topoint out here that although the use of Internet andInformation Technology are an important alternate channel
of delivery of banking services, this strategy may not workvery well in India. Given the focus of the government onfinancial inclusion and the poor penetration of Internetservices in the rural areas, a wide network of bank branchesis required. But in the light of the high cost associated witha wide branch network, many experts recommend that helpof banking correspondents may be sought to achievepenetration of banking services (Srinivasan, 2012, RBI, 2015).In the present study however, the variable “Increase innumber of banking correspondents” has not fared well (rank18). This can only mean that while expanding the network ofbanking correspondents is a means to achieve bankingpenetration, it is not a measure of the extent of penetrationachieved.
Increase in aggregate deposits: Bank strategists consider“Increase in aggregate deposits” as the third most importantmeasure of penetration of banking activity. This finding issupported by previous literature (Kane, 2005; Ben-David etal., 2014). This also explains the government’s latest initiativeto open payment banks (specialized in accepting deposits)to achieve penetration of banking services.
Further, within the type of deposits, none of the variableshave fared well – “Increase in savings bank deposits” (rank12), “Increase in demand deposits” (rank 15) and “Increasein term deposits” (rank 17). This indicates that while anincrease in aggregate deposits is important to achievepenetration of banking services, the type of deposit in itselfmay not be very significant.
Having established that increase in deposits is a keyindicator of penetration of banking services, the widespreadconcern in the Indian banking industry on account ofdeceleration in aggregate deposits (Business Standard, 2015)is understandable. While the number of bank accounts issteadily increasing (CRISIL, 2015), the increase in aggregatedeposits is slowing down (Business Standard, 2015). Thisindicates a need to focus on deposit gathering and depositgrowth along with an increase in number of bank accounts.Indian banks should thus shift their focus from merelyopening bank accounts to vigorously chasing deposits.
Furthermore, critics are worried that the weakened aggregatedeposit inflows will disrupt the role of banks as liquidity

SCMS Journal o f Indian Management , July - September 2016 76
A Quarterly Journal
creators (Acharya and Mora, 2012). Ability to create loansis directly proportional to bank deposits (Jayaratne andMorgan, 2000; Berger and Bouwman, 2009) and hence Indianbanks may not be in a position to create adequate loans tomeet the growing credit needs of the economy. And as perthe current study, “Increase in aggregate amount of loans”is a measure of banking penetration, albeit not a veryimportant one (rank 7). Also, the other variable specifying aloan type– “Increase in amount of term loans” (rank 13) hasnot fared well in the current study.
Of the many banking services, credit is a major one. Thoughthis variable has not achieved a very high rank in the currentstudy, many experts believe that credit penetration / accessto bank credit is an important measure of penetration ofbanking services (Demirguc-Kunt and Klapper, 2013). Since,credit penetration is a corollary of deposit penetration, it issuggested that Indian banks should graduate from the roleof passive recipients of deposits to active seeker of deposits.
Moving ahead, though credit penetration indicates bankingpenetration, a mindless increase in aggregate amount ofloans is not recommended. Loans enhance the exposure ofa bank and considerably increase risk (Altunbas et al., 2011).They also directly and negatively impact the return on equity(Kohler, 2015). What may be done in such a scenario?
A good solution to stabilize banks in the face of high creditexposure is an increase in non-fund income. It can beachieved through a diversification of income sources(Demirguc-Kunt et al., 2000; Kohler, 2015). This may haveaccounted for the popularity of universal banking and feebased banking activities in the recent past. Banks are todaytrying to deepen penetration by extending their range ofbanking activities (Demirguc-Kunt and Klapper, 2013) andthis may be the reason why the variable “Increase in non-fund income” has emerged as one among the top tenmeasures (rank 8) of penetration of banking services in thepresent study.
Increase in number of ATMs: Against the backdrop of thegovernment’s objective of financial inclusion, ATMs providean easy and convenient means of penetration of bankingservices. In fact, since ATMs are open typically at all timesof the day and night; and all days of the week, they are
considered even more convenient and cost effective thantraditional banking offices in achieving penetration ofbanking services (Humphrey, 1994).
Experts believe that “there is nothing like a real worldindicator for an economic phenomenon and it is gratifyingto discover a new proxy for banking penetration – thenumber of automated teller machines” (Gapper, 2011). Thisexplains why the variable “Increase in number of ATMs”features among the top measures (rank 4) of penetration ofbanking services in the present study.
As of May 2015, the total number of ATMs in India is 183887and individually, State Bank of India tops the list of numberof ATMs per bank (source: RBI). Given the total populationof the country, these figures indicate poor penetration ofbanking services. In fact, the number of ATMs per 1000square kilometers in India is far below the average of otheremerging economies (source: RBI). Thus, keeping in mindthe extent of financial exclusion, there is a lot of scope ofincrease in number of ATMs in India.
Other variables: In the present study, the variable “Increasein number of employees” has attained rank 10 among the 22variables used. The contention that a higher number ofemployees signifies a deeper penetration of bankingservices is questionable. Though it may sound logical topresume that workforce expansion will aid in achievingpenetration, the fact remains that in the absence of duecontribution to profit or business, additional employees area liability for banks. For this reason perhaps, while thenormative goal of many banks is market penetration, theyare simultaneously reducing their workforce to enhanceproductivity and efficiency (Preez, 2015; Shankar, 2015).
Lastly, the variable “Increase in number of cheques” hasnot been given much importance as a measure of bankingpenetration (rank 19). For this reason, in the present study,this variable has emerged as an insignificant measure ofpenetration of banking services.
Figure 1 represents a visual spatial display of the preferencesand perceptions of the respondents (Malhotra and Dash,2010). This depiction reduces the complexity of the dataallowing a visual appreciation of the underlying relationshipsbetween variables (Hout et al., 2013).

SCMS Journal o f Indian Management , July - September 2016 77
A Quarterly Journal
The above scatter plot of variables in a two-dimensionalplane has helped arrive at an arrangement that bestapproximates the responses of the respondents. Clearpatterns of clusters, based on perceived similarity emergethat provide a meaningful representation of the views ofthe respondents.
Conclusion and Implications
On the basis of current study, it can be concluded thatincrease in number of account holders, increase in totalnumber of branches, increase in aggregate deposits andincrease in number of ATMs, are the most significantmeasures of penetration of banking services. Therefore,when attempting to measure or compare penetration ofbanking services, these four variables should be used. Thiswill not only help standardize the process of measurementof banking penetration, but also facilitate an easycomparison between the works of different researchers/bodies.
Limitations of the Study
The sampling technique used for the current study wasconvenience sampling. Because of the inherent limitationsof this technique, future researchers may rethink the use ofthis technique.
References
Acharya V.V. and N. Mora (2012), “Are Banks PassiveLiquidity Backstops? Deposit Rates and Inflows during the2007-09 Crisis”, available at http://web.law.columbia.edu/sites/default/files/microsites/law-economics-studies/Acharya,%20Viral%20V%20-%202012%20Fall%20WS.pdfaccessed on 21.08.2015.
Altunbus Y., S. Manganelli and Marques-Ibanez (2011),“Bank Risk During the Financial Crisis: Do Business ModelsMatter?”, available at https://www.ecb.europa.eu/pub/pdf/scpwps/ecbwp1394.pdf accessed on 21.08.2015.
Anthony S.D., Eyring M., and L. Gibson L. (2006), “MappingYour Innovation Strategy.” Harvard Business Review, May,pp. 1-11.
Ben-David I., Palvia A., and C. Spatt (2014), “Banks’ InternalCapital Markets and Deposit Rates.” available at file:///Users/namratasandhu/Downloads/BanksInternalCapitalMarketsAndDepo_preview.pdf accessed on21.08.2015.
Berger A.N., and C.H.S Bouwman (2009), “Bank LiquidityCreation.” Review of Financial Studies, Vol. 22(9), pp. 3779-3837.
Figure 1: A visual spatial display of perception of the respondents

SCMS Journal o f Indian Management , July - September 2016 78
A Quarterly Journal
Bihari S.C. (2011), “Financial Inclusion for Indian Scene.”SCMS Journal of Indian Management, Vol. VIII(III), pp.5-16.
Business Standard (2015), “Bank Credit and Deposit GrowthDecelerates.” available at http://www.business-standard.com/ article/finance/bank-credit-and-deposit-growth-decelerates-115022701190_1.html accessed on21.08.2015.
Cohen L., L.Manion. and K. Morrison (2011), ResearchMethods in Education, Routledge; 7 edition.
CRISIL (2015), “Financial Inclusion Continues to GatherPace”, available at CRISIL_Press_Release_Financial_inclusion_continues_to_gather_pace_25_June_2015.pdfaccessed on 12.09.2015.
Dangi N. (2013), “Current Situation of Financial Inclusion inIndia and its Future Visions.” International Journal ofManagement and Social Sciences Research, Vol. 2(8), pp.155-157.
Demirguc-Kunt A., E. Detragiache E., and Gupta P. (2000),“Inside the Crisis: An Empirical Analysis of Banking Systemin Distress.” available at https://www.imf.org/external/pubs/ft/wp/2000/wp00156.pdf accessed on 21.08.2015.
Demirguc-Kunt A., and L. Klapper (2013), “MeasuringFinancial Inclusion: Explaining Variation in Use of FinancialServices Across and Within Countries.” Brookings Paperson Economic Activity, pp. 279-340.
Ding C.S. (2006), “Multidimensional Scaling ModelingApproach to Latent Profile Analysis in PsychologicalResearch.” Journal of Psychological Research, Vol. 41(3),pp. 226-238.
Gapper J. (2011), “Measuring Growth by ATMs.” availableat http://blogs.ft.com/businessblog/2011/03/measuring-economic-growth-by-atms/ accessed on 25.08.2015.
Garg S. and P. Agarwal (2014), “Financial Inclusion In India– A Review of Initiatives and Achievements.” IOSR Journalof Business and Management, Vol. 16(6), pp. 52-61.
GPFI (2011), “The GSO Set of Basic Financial InclusionIndicators.”available at http://www.gpfi.org accessed on12.09.2105.
GPFI (2015), “Why Financial Inclusion,” available athttp://www.gpfi.org/about/why-financial-inclusionaccessed on 12.09.2015.
Herwijnen M. (2006), “Weighted Summation,”available athttp://www.ivm.vu.nl/en/Images/MCA2_tcm53-161528.pdfaccessed on 17.08.2015.
Hout M.C., Papesh M.H. and S.D. Goldinger (2014),“Multidimensional Scaling,” available at http://www.ncbi.nlm.nih.gov/pmc/articles/PMC3555222/ accessedon 19.08.2015.
Howley J.C. and G.P. Savage (2007), “Bank Marketing in thePersonal Sector,” Managerial Finance, Vol. 5(3), pp. 271-276.
Humphery D.B. (1994), “Delivering Deposit Services: ATMsVersus Branches.” Economic Quarterly, Vol. 80(Spring), pp.59-81.
Javalgi R.G., J.Belonax and A.M. Robinson (1990), “MatureConsumers in the Financial Services Marketplace – PotentialMarket Segments.” Journal of Professional ServicesMarketing, Vol. 6(1), pp. 81-107.
Jayaratne J. & Morgan D.P. (2000), “Capital Market Frictionsand Deposit Rates at Banks.”Journal of Money, Credit andBanking, Vol. 30(1), pp. 74-92.
Kane M. (2005) “Strategies and Tactics to Improve DepositGrowth.”available at http://kanebankservices.com/WIB2%2009-05.pdf accessed on 21.08.2015.
Kohler M. (2015), “Which Banks Are More Risky? The Impactof Business Models on Bank Stability.” Journal of FinancialStability, Vol. 16, pp. 195-212.
Kumar K. and D. Radcliffe (2015), “Advancing FinancialInclusion to Improve the Lives of the Poor.” available athttp://www.cgap.org/blog/2015-set-be-big-year-digital-financial-inclusion-india accessed on 12.09.2015.
Malhotra N.K. and S. Dash (2010), Marketing Research:An Applied Orientation, Pearson; 6 edition.
Medhi J. (1992), Statistical Methods: An Introductory Text.New Age International.
Meidan A. (2007), “Bank Marketing Strategies.”International Journal of Bank Marketing, Vol. 1(2),pp. 3-17.
Mukhopadhyaya J.N. (2014), “Financial Inclusion in India:Moving Beyond Bank Accounts.” available at http://knowledge.wharton.upenn.edu/article/financial-inclusion-

SCMS Journal o f Indian Management , July - September 2016 79
A Quarterly Journal
india-aims-move-beyond-bank-accounts/ accessed on12.09.2015.
Mukkawar R. (2012), “An Eye-Opener for the Policy Makers”available at http://www.thehindubusinessline.com/opinion/financial-inclusion-for-whose-benefit/article3473538.eceaccessed on 12.09.2015.
Muldoon K. (1989), “Are Planners Neglecting ProfessionalWomen?.” Personal Financial Planning, July-August, pp.34-37.
Murthy G. (2015), “Financial Inclusion Insights.” availableat http://finclusion.org/fii-blog/moving-beyond-the-first-step-to-financial-inclusion-in-india/ accessed on 25.08.2015.
Nayak A. (2014), “Benefits of Financial Inclusion to India,”available at http://indiamicrofinance.com/benefits-financial-inclusion-india.html accessed on 12.09.2015.
Philp P.R., P.J. Haynes, and M.M. Helms (1992), “FinancialService Strategies: Neglected Niches.” InternationalJournal of Bank Management, Vol. 10(2), pp. 25-28.
Preez D. (2015), “Barclays Set to Cut 30,000 Jobs.” availableat http://diginomica.com/2015/07/20/barclays-set-to-cut-30000-jobs-as-it-looks-to-increase-automation-and-reduce-costs/#.VgIpzp3zr6Y accessed on 20.09.2015.
PwC (2012), “Rebooting the Branch: Branch Strategy in aMulti-Channel, Global Environment.” available at http://www.pwc.com/us/en/financial-services/publications/viewpoints/reinventing-branch-banking-network.jhtmlaccessed on 21.08.2015.
Ramaswamy K. (2014), “Financial Inclusion in India: MovingBeyond Bank Accounts.” available at http://knowledge.wharton.upenn.edu/article/financial-inclusion-india-aims-move-beyond-bank-accounts/ accessed on 25.08.2015.
Reserve Bank of India (2012-13), “Statistical Tables Relatedto Banks in India.” https://rbidocs.rbi.org.in/rdocs/Publications/PDFs/0STR191113FL.pdf accessed on17.08.2015.
Reserve Bank of India (2015), “Annual Report.” available ath t t p s : / / w w w. r b i . o r g . i n / s c r i p t s / A n n u a l R e p o r tPublications.aspx?Id=1041 accessed on 12.09.2015.
Salkind N.J. & Rasmussen K. (2006), Encyclopedia ofMeasurement and Statistics, Sage Publications; 1 edition.
Samra P. (2012), “Penetration of Banking in India.” availableat http://www.thehindubusinessline.com/opinion/financial-inclusion-for-whose-benefit/article3473538.ece accessed on12.09.2015.
Sarma M. (2008), “Index of Financial Inclusion.” availableat http://www.icrier.org/pdf/Working_Paper_215.pdfaccessed on 12.09.2015.
Sarros J.C., A. Pirola-Merlo and R. Baker (2012), “The Impactof Age on Managerial Style.” available at http://www.aimqld.com.au/research/documents/TheImpact Of AgeOn ManagerialStyle.pdf accessed on 19.08.2015.
Scronce E. (2014), “Impact Evidence Confirms the Benefitsof Financial Inclusion.” available at http://www.cgap.org/news/impact-evidence-confirms-benefits-financial-inclusionaccessed on 12.09.2015.
Shankar B. (2015), “Top Private Banks ICICI, Axis ReduceEmployee Count.” International Business Times, May 27,2015.
Singh D.and H. Singh (2015), “Market Penetration by IndianBanks – Motives and Motivators.” Manuscript submittedfor publication.
Srinivasan R. (2014), “Financial Inclusion for WhoseBenefit?” The Hindu, May 30, 2012.
Thapar A. (2013), “A Study on the Effectiveness of theFinancial Inclusion Program in India.” VSRD InternationalJournal of Business and Management Research, Vol. 3(6),pp. 211-216.
Trivelli C. (2013), “Social Inclusion cannot be AchievedWithout Financial Inclusion.” available at http://www.cgap.org/blog/social-inclusion-cannot-be-achieved-without-financial-inclusion accessed on 12.09.2015.
World Bank (2015a), “Key Global Indicators.” available atdatatopics.worldbank.org/g20fidata accessed on 12.09.2015.
World Bank (2015b), “How to Measure Financial Inclusion?,”available at http://www.worldbank.org/en/topic/financialinclusion/brief/how-to-measure-financial-inclusionaccessed on 12.09.2015.
******

SCMS Journal o f Indian Management , July - September 2016 80
A Quarterly Journal
Marketing Ethics: Enhancing FirmValuation and Building Competitive
AdvantagesDr. Pankaj M. Madhani
Abstract
thics is a collection of principles of right conductthat shape the decisions people or organizationsmake. Ethics studies morality through the critical
examination of right and wrong in human action. Moralityrefers to the customs, principles of conduct and moral codesof an individual, group or society. One way in which anorganization influence ethics is by formally and explicitlydefining right from wrong. Practicing ethics in marketingmeans applying standards of fairness, or moral rights andwrongs, to marketing decision making, behavior, and practicein the organization. The purpose of marketing ethics is tocreate a long term sustainable competitive advantage. Thoseorganizations that develop this advantage are able to satisfythe needs of both customers and the organization. Thisfocus has come about for two reasons. First, when anorganization behaves ethically, customers develop morepositive attitudes about the firm, its products, and itsservices. Second, when marketing practices depart from
Marketing ethics plays a critical role in forming, maintaining and sustaining long-term customer relationships. Anethical marketing practice is a key factor of organization’s success because it affects the organizations’ capability tobuild strong relationships with customers, and accordingly, it is one of the organizational drivers enhancing CustomerLifetime Value (CLV). The CLV of a customer represents the amount the customer will contribute to the bottom lineof the firm over the span of the business relationship with them. Ethical marketing are practices that emphasizetransparent, trustworthy, and responsible personal and organizational marketing policies and actions that exhibitintegrity as well as fairness to consumers and other stakeholders. The ethical reputation of the organization results incustomer trust which in turn leads to satisfaction and commitment to the organization and hence builds competitiveadvantages. Research provides various marketing ethics frameworks and valuation matrix along with numericalillustrations to understand how marketing ethics help organizations in improving overall performance and ultimatelyfirm valuation.
Keywords : Marketing ethics, Customer satisfaction, Customer trust, Customer loyalty, Customer lifetime value, Firmvaluation
Abstract
E
Dr. Pankaj M. MadhaniProfessorICFAI Business School (IBS)IBS House, Opp. AUDA LakeScience City Road, Off. S.G. RoadAhmedabad – 380 060, [email protected]

SCMS Journal o f Indian Management , July - September 2016 81
A Quarterly Journal
standards that society considers acceptable, the marketprocess becomes less efficient.
The ethical marketing activity is especially important intoday’s environment of increased customer awareness;demanding customers; shorten product life cycle (PLC) andstiff competition. Some organizations are using marketingethics as a key selling point, because more customersconsider an organization’s ethical reputation when makingpurchasing decisions. Not employing ethical marketingpractices may lead to dissatisfied customers, bad publicity,lack of trust, lost business, or, sometimes, legal action. Thus,most organizations are very sensitive to the needs andopinions of their customers and look for ways to protecttheir long-term interests.
Marketing ethics plays a critical role in forming, maintainingand sustaining long-term customer relationships. As thecustomer base forms a large part of an organization’s overallvalue, valuing customers makes it possible to value theenterprise. This is especially applicable to the process ofbuilding long term customer relationship, whose financialvalue is better captured by the concept of Customer LifetimeValue (CLV), which is the sum of the individual value of allpresent and future customers measured over their lifetimeswith the organization. The CLV concept proposes that priceis not the only criterion that wins the battle as customersatisfaction, customer loyalty and the long term relationshipalso matters. Although organizations are interested inknowing the CLV of their customers, they are also keen onidentifying the factors that are in their control that couldincrease the CLV. An ethical marketing practice is a key factorof organization’s success because it affects theorganizations’ capability to build strong relationships withcustomers, and accordingly, it is also one of theorganizational drivers enhancing CLV.
Literature Review
Ethics is defined as an “inquiry into the nature and groundsof morality where morality means moral judgments,standards, and rules of conduct” (Tsalikis and Fritzsche,1989). Business ethics is the total of rules of conduct andprinciples of conduct that is based on ideas relating to whichbusiness attitude is correct and which one is false (Scholl etal.,1993). Good business ethics can enhance businessresults, which leads to sustainable development oforganizations (Weeks et al., 2004). The marketplace isbecoming increasingly aware of, and increasingly
discriminating against, corporations that fail to meet thecriteria of ethical business operations and ethicalmanagement principles (Svensson and Wood, 2004).
According to Kotler and Armstrong (2003), “organizationsdetermine the needs, wants, and interests of target marketsand then strive to deliver superior value to customers in away that maintains or improves the customers’ and thesociety’s well being.” But consistent with the idea ofmarketing also influencing societal well-being, it is alsoimperative to thoughtfully analyze the ethics of marketingpractices. Trust is the foundation for the efficiency andeffectiveness of the market system, and it is nurtured withhigh ethical standards. The law alone is not enough to ensurea sufficient quantity of honesty such that the marketplaceoperates smoothly and fairly. Hence, more emphasis is onthe habitual ethical actions of marketing managers strivingto keep their promises to customers by creating fair andtransparent exchange within the economic system. If theoverall market system has ethical integrity, exchangebecomes simpler to carry out (Laczniak and Murphy, 2006).
Marketing ethics concerns the application of ethicalconsiderations to marketing decision making (Smith, 1993).Ethical marketing are practices that emphasize transparent,trustworthy, and responsible personal and organizationalmarketing policies and actions that exhibit integrity as wellas fairness to consumers and other stakeholders. Marketingethics is defined as “the systematic study of how moralstandards are applied to marketing decisions, behaviors andinstitutions” (Murphy et al., 2005). Marketing ethics can beconsidered as moral judgment and behavior standards inmarketing practice or moral code or system in marketingarea (Gaski, 1999). In other words, marketing ethics is theresearch of the base and structure of rules of conduct,standards, and moral decisions relating to marketingdecisions and practices (Lu et al., 1999).
Marketing ethics encompasses the societal and professionalstandards of right and fair practices that are expected ofmarketing managers. The most basic ethical standards areoften articulated in professional codes of marketing conduct.Professional organizations such as the American MarketingAssociation (AMA) likewise document ethicalconsiderations as instrumental to their purposes.Specifically, the AMA mission statement (2004) includes asone of its central tenets, “To advance the thought,application and ethical practice of marketing.” The Norms

SCMS Journal o f Indian Management , July - September 2016 82
A Quarterly Journal
and Values statement of the AMA, revised in 2004,represents a useful, duty-based specification of marketerresponsibilities that exceed those codified in law. Ethicalmarketers must achieve a behavioral standard in excess ofthe obligations embedded in the law. Typically, the lawrepresents the lowest common denominator of expectedbehavior for marketing and business practice (Carroll, 1991).Ethical marketing organizations always should strive toexceed the obligations embedded in the law and the legalminimums of social compliance.
Marketing activity can be ethical or unethical based uponthe degree to which a proposed act is perceived as right orwrong, fair or unfair, just or unjust. Marketing has beenfrequent targets of ethical issues. Marketing managers whotake strategic decisions often face with ethical conditionsand their decisions is related to all sides of marketing mixsuch as product, price, place and promotion (Rallapalli etal., 2000). Ethical issues in marketing such as misleadingadvertising, unsafe and harmful products, abuse ofdistribution channel power, and promotion of materialism,which were the main ethical concerns of the 1950’s, are stillserious problems today (Kotler, 2004). Product adulterationis one sort of malpractice done by the marketers wherebythey mix artificial, inferior or spurious ingredients substancesin the product as well as offers the low-standard productsto the consumers in order to save cost and make more profit.Adulterated food includes additives, preservatives, artificialcolors or flavoring (Memery et.al., 2005). Over and above,new issues are regularly added to this list, including stealthmarketing, predatory lending, promotion of off-label usesof pharmaceuticals, and online privacy (Karpatkin, 1999).
Unethical marketing activity cause various problems fororganizations such as lack of customer trust, spoiledcustomer relationships, declined customer retention, andreduced sales (Jones et al., 2005). Research suggestspractices like dishonest actions and high pressure sellingtactics have a negative effect on customer trust (Kennedyet al., 2001). Unethical sales behavior negatively impactsthe profitability of the firm (Madhani, 2014). There is apositive association between ethical behavior andorganizational performance and accordingly the financialperformance of firms committed to ethical behavior is superiorto those that are not (Verschoor, 1999; 2003).
Ethical marketing activity is related to fair play, honesty andfull disclosure in customer relationship. Ethical marketingactivity does not seem to translate into short-term salesperformance (Román and Munuera, 2005). Examples of ethicalmarketing activity include: selling products that meetcustomers’ needs, providing true information about theproducts in terms of its benefits or availability andimplementing low-pressure selling techniques. The ethicalreputation of the organization results in customer trust whichin turn leads to satisfaction and commitment to theorganization. Commitment is one of the most crucialdimensions in relationship marketing. Moorman et al., (1992)defined commitment as the desire or intention to sustain avaluable relationship.
It was also found that ethical behavior has a strong positiverelationship with customer satisfaction with the sales person.Sales people who behave in an ethical manner are honest intheir communications, sell only those products and servicesthey believe will benefit the customer, promise only whatcan be delivered, and treat customer information in aconfidential manner. Conversely, unethical marketing activitycan be defined as any short-run conduct that enables thesales person to gain at the expense of the customer (Románand Ruiz, 2005).
According to Gruca and Rego (2005), an organizationgenerates benefits for itself beyond the present transactionby satisfying a customer. These benefits arise from thepositive influence of the satisfied customer’s futureshopping behavior. Customer satisfaction is an importantprecursor to customer loyalty and subsequent repurchase(Seiders et al., 2005). For example, satisfied customers aremore loyal and over time impact their purchase intention(Anderson and Sullivan, 1993). Some of this increased levelof purchasing is due to satisfied customers being morereceptive to cross-selling efforts (Fornell, 1992). Andersonet al., (1994) and Rust et al., (2002) found a positive influenceof customer satisfaction on financial performance indicatorsof a firm, such as return on investment (ROI) and return onassets (ROA). Luo et al., (2007), also underline that, customersatisfaction is an important driver of a firm’s profitability.
The CLV of a customer represents the amount the customerwill contribute to the bottom line of the firm over the span ofthe business relationship with them (Kumar and Shah, 2009).

SCMS Journal o f Indian Management , July - September 2016 83
A Quarterly Journal
CLV is influenced by retention rate, lifetime revenue ofcustomer as well as profit margin. Customer lifetime durationis also dependent on retention rate; with any increase inretention rate after value of 70% results into steep rise inaverage customer lifetime (Madhani, 2015a).
CLV provides the present value of a customer relationshipover the lifetime with an organization, and is calculated basedon a number of sales transactions with customers (Kumarand Rajan, 2009). CLV of customers (current as well as future),and ultimately customer equity (CE) often eventually formsa proxy for valuation of firms (Gupta et al., 2004). CE is definedas the total of the CLV (customer lifetime value) of all theorganization’s current and potential customers (Rust et al.,2004). CE seeks to assess the value of not only a firm’scurrent customer base but also its potential or futurecustomer base and represents the entire operating cash flowof a firm.
This research works in this direction and provides variousmarketing ethics frameworks and valuation matrix tounderstand how marketing ethics help organizations inimproving overall performance and ultimately firm valuation.
Marketing Ethics: Enhancing Customer Trust and Loyalty
Today it is not enough to have satisfied customers; firmsshould also target and try to retain their most valuablecustomers by building customer trust and loyalty. Ethicalmarketing facilitates firms to foster long-term relationshipswith customers based on customer satisfaction, trust andloyalty. Trust is defined as the belief, feeling or expectationfrom partner’s expertise, reliability and intentions (Cater andZabkar, 2008) in all relational exchanges. Customer trust willresult in the customer’s willingness to develop and maintaina relationship with the firm. Customer trust is based on theongoing relationship with the firm and not merely based ona single transaction as trust is developed through repeatedinteractions in which customer observes the offerings ofthe firm to be consistent. The trust in a firm occurs when thecustomer ‘has confidence in the firm’s future product/serviceperformance because the level of such past performancehas been consistently satisfactory’. Customer trust is an
essential element for building and maintaining long-termcustomer relationships, a sustainable market share and solidcustomer loyalty.
Customer trust has a positive correlation with customerloyalty. Customer loyalty can be defined as a complementof trust (Rosanas and Velitta, 2003). Customer loyalty isgenerally described as occurring when customers repeatedlypurchase a good or service over time and customers holdfavourable attitudes about it. Customer loyalty is consideredas a key underlying variable in maintaining customerretention (Pritchard and Howard, 1997) and it concerns withthe likelihood of a customer returning frequently, makingreferrals, building strong word-of-mouth reputation, as wellas providing references and publicity (Bowen andShoemaker, 1998) and hence potentially expanding thecustomer base (Huddleston et al., 2004). Customer loyaltyhas been recognized as an important source of sustainablecompetitive advantages due to customer retention,repurchase, and long-term customer relationships (Rust etal., 2000).
Customer loyalty causes customers to buy a particularbrand, which improves the customer’s value and ultimatelythe firm’s performance. Customer loyalty can result infavorable operating cost advantages for retailers, fewermarkdowns, reduction in inventory and simplified capacityforecasting due to lesser fluctuations in demand. Customerloyalty is seen as one of the most important criteria for acompany to obtain competitive advantage because itdetermines customers’ repurchases in future (Oliver, 1999).Customer loyalty and repurchase decisions are highlyregarded by the firm as they determine firm’s profitabilityand growth (Palmatier et al., 2006). Since customer loyalty isconsidered to be the complement of trust, the degree ofcustomer loyalty is an important consideration for firms.Organizations that maintain relationships with customerson the basis of trust, ethics, and integrity will have acompetitive advantage over those that do not. Frameworkof Figure 1, shows how marketing ethics influencerelationship between customer trust, loyalty and long termcustomer relationship.
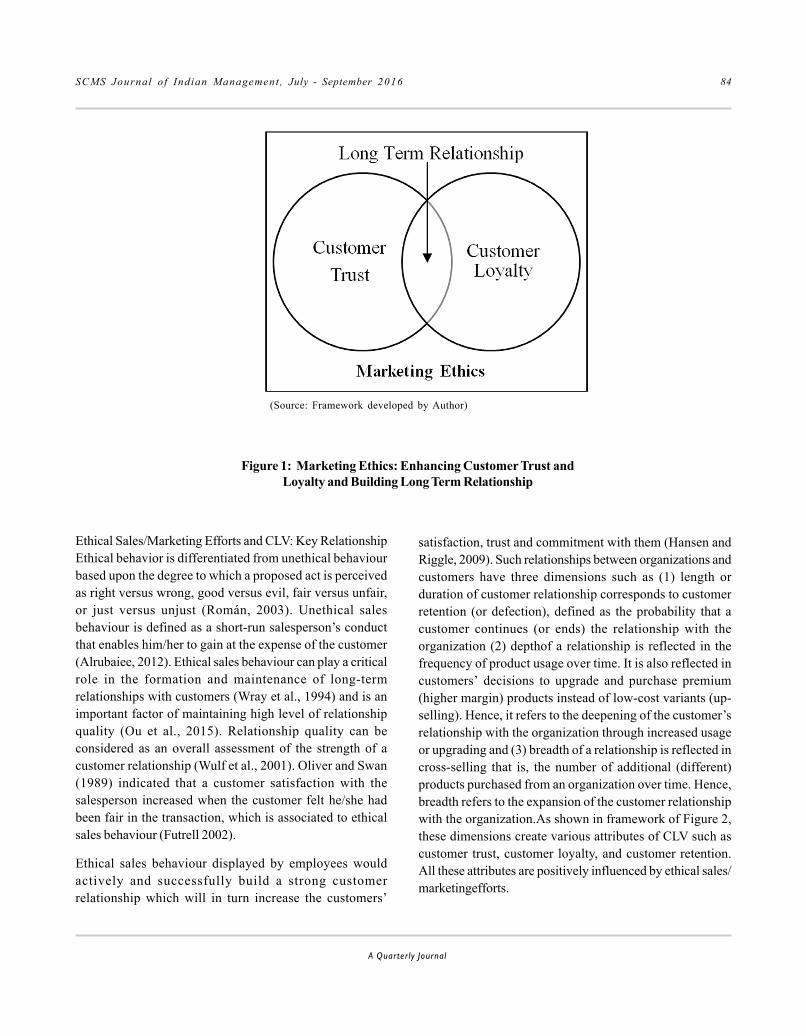
SCMS Journal o f Indian Management , July - September 2016 84
A Quarterly Journal
Figure 1: Marketing Ethics: Enhancing Customer Trust andLoyalty and Building Long Term Relationship
(Source: Framework developed by Author)
Ethical Sales/Marketing Efforts and CLV: Key RelationshipEthical behavior is differentiated from unethical behaviourbased upon the degree to which a proposed act is perceivedas right versus wrong, good versus evil, fair versus unfair,or just versus unjust (Román, 2003). Unethical salesbehaviour is defined as a short-run salesperson’s conductthat enables him/her to gain at the expense of the customer(Alrubaiee, 2012). Ethical sales behaviour can play a criticalrole in the formation and maintenance of long-termrelationships with customers (Wray et al., 1994) and is animportant factor of maintaining high level of relationshipquality (Ou et al., 2015). Relationship quality can beconsidered as an overall assessment of the strength of acustomer relationship (Wulf et al., 2001). Oliver and Swan(1989) indicated that a customer satisfaction with thesalesperson increased when the customer felt he/she hadbeen fair in the transaction, which is associated to ethicalsales behaviour (Futrell 2002).
Ethical sales behaviour displayed by employees wouldactively and successfully build a strong customerrelationship which will in turn increase the customers’
satisfaction, trust and commitment with them (Hansen andRiggle, 2009). Such relationships between organizations andcustomers have three dimensions such as (1) length orduration of customer relationship corresponds to customerretention (or defection), defined as the probability that acustomer continues (or ends) the relationship with theorganization (2) depthof a relationship is reflected in thefrequency of product usage over time. It is also reflected incustomers’ decisions to upgrade and purchase premium(higher margin) products instead of low-cost variants (up-selling). Hence, it refers to the deepening of the customer’srelationship with the organization through increased usageor upgrading and (3) breadth of a relationship is reflected incross-selling that is, the number of additional (different)products purchased from an organization over time. Hence,breadth refers to the expansion of the customer relationshipwith the organization.As shown in framework of Figure 2,these dimensions create various attributes of CLV such ascustomer trust, customer loyalty, and customer retention.All these attributes are positively influenced by ethical sales/marketingefforts.

SCMS Journal o f Indian Management , July - September 2016 85
A Quarterly Journal
Figure 2:
Length
Depth
Breadth
Customer
LoyaltyCustomer
Trust
Customer
Retention
Ethical Sales/Marketing Efforts and CLV Framework: Key Dimensions
(Source: Framework developed by author, adopted from Madhani (2014))
Hence, all these dimensions should be applied empiricallyto estimate CLV, by assigning the underlying behaviors into
the equation (Verhoef, 2004). Equation below represents CLVframework shown in Figure 2:
Where
P(retention)it = The probability of continuation of therelationship for customer iat time t
= (length of the relationship)
Product ijt: The purchase of product j by customeri at time t(breadth)
Usageijt: The usage of product j by customer i at time t(depth)
Marginjt: The contribution margin for product j per usage orvolume entity on time t.
d : Discount rate
n : Number of periods
Customer trust has a positive influence on customer loyalty.The greater the customer trust is, the higher the customer
loyalty becomes. As customers think their sales person’ssales behaviors are ethical then they would tend to trust thesales person as well as the organization. Both customertrust in the sales person and customer trust in theorganizations are positively related to customer loyalty.Trustis a cumulative process that develops over the course ofrepeated and satisfactory interactions with the sales person.The sales person’s ethical sales/marketing efforts positivelyaffect customer trust in the sales person and hence whenthe degree of the sales person’s ethical sales behavior isperceived to be high, the customer will have more trust inthe sales person. The sales person’s ethical sales/marketingefforts also positively affect customer trust in theorganization.
The level of trust a customer has in the sales person isconsidered as key link to the relationship and future

SCMS Journal o f Indian Management , July - September 2016 86
A Quarterly Journal
intentions. Trust is a global belief on the part of the customerthat the sales person will fulfill its obligations as understoodby the customer and can be relied on to deliver on itspromises. Ethical sales/marketing effortsare positivelyassociated with customer trust, customer loyalty andcustomer retention, thus enhancing relationship quality andCLV.
Ethical Marketing: A Conceptual Framework
Marketing focus on designand control various marketingmix variables in order to best satisfy needs of customers inthe target market. The marketing mix includes the Product(what the actual offering comprises), Price (the valueexchanged for that offering), Promotion (the means of
communicating that offering to the target audience) andPlace (the means of having the product offering available tothe target audience) or distribution deals with the movementof the product to the final consumer (McCarthy, 1960). Thetraditional marketing mix is also known as the 4 P’s ofmarketing. The organization attempts to generate a positiveresponse in the target market by blending these fourmarketing mix variables (Product, Price, Place and Promotion)ethically. Marketing ethics systematically examinesmarketing variables related to 4P-issues such as unsafeproducts, deceptive pricing, discrimination in distributionand deceptive advertising. Ethical marketing processespositively influence marketing mix variables and also increaseCLV (Figure 3).
Ethical
Marketing
Product Price
Place Promotion
Higher CLV
Higher CLV
Higher
CL
VHig
her
CL
V
Figure 3: Ethical Marketing: A Conceptual Framework
(Source: Framework developed by Author)
Product
The product is the physical product offered to the consumer;it also refers to any services or conveniences that are partof the offering such as product authentication, productrecall, product quality, product packaging etc. Most
Various marketing mix variables along with ethical considerations are explained below:
marketers develop or market products suited to definedmarket segments, as this (along with appropriate targetingand positioning) should help maximize sales and brandequity. Marketing face with a lot of ethical problems in newproduct development process, since ethics is discussed less

SCMS Journal o f Indian Management , July - September 2016 87
A Quarterly Journal
than it is needed, faulty products are put on the market andso these products harm consumers (Morgan, 1993). Otherethical issues related to product such as rubbish problemwhich packing cause after its usage (Menezes, 1993),information on product labels can sometimes be used asdeceptive although it is technically true, decline of recallingof product although it is problematic, failing in terms ofguarantee related to product and performing plannedproduct obsolescence to shorten product life cycle (Chonko,1995). The deceptive packaging can be termed as thepackaging that will contain false identity, faulty informationand which will unfairly promote the products to theconsumers. Mann and Thornton (1978) indicated deceptivepackaging as one sort of unscrupulous practice done bythe marketers whereby the faulty product information ormisinformation is provided on the label or package in orderto deceive consumers.
Price
Pricing includes not only the value of product to the firms,but also considers value to the customers for the price paid.Too high prices are not ethical, when they are a means totake advantage of consumers as it happens in the caseof monopolies, oligopolies or cartels. From the ethical pointof view pricing is probably one of the most difficult areas ofmarketing. Unfair pricing can be defined as charging eitheran excessive price compared to its original price or chargingfictitious pricing (Kaynak, 1985). Ethically, price should beequal or proportional to benefit which is taken by theconsumers (Kehoe, 1985). However, during situations ofmonopolistic power, it results into unreasonable priceincrease (Ortmeyer, 1993). Other ethical issues related topricing include non-price price increases, misleading pricereduction, price advertisements which can be misleading orconsidered as deceitful, predatory pricing which aims tohave monopolistic position, discriminatory pricing, pricingapplications of products according to the products’ unit orquantity basis and practicing of misleading pricing methods(Chonko, 1995).
Place
Place (or distribution) decisions are those associated withchannels of distribution that serve as the means for gettingthe product to the prospective customers. The distributionchannel performs transactional, logistical, and facilitatingfunctions. Ethical issues related to this marketing mix variable
grow out of firms, which form channel of distribution (suchas direct marketing and internet marketing), and havedifferent needs and goals. Ethical issues in direct marketingare privacy, confidentiality and intrusion (Chonko, 1995). Itis not ethical from marketers to send unwanted spams toconsumers, because such emails violate consumers’ privacy.Ethical problems which are faced while using of internet formarketing are reliability of operations, illegal activities,privacy, accuracy, pornographic, product guarantees,burglary, aiming at children, spams, and deceptiveadvertisements (Bush et al., 2000).
Promotion
Promotion decisions are those related to communicating andselling to potential consumers. Aim of promotion is to attractthe customers to purchase the product and to increase thenumber of customers by making them switch to the brandunder promotion. Promotion is an effective tool to increasethe market share in the competitive market by attracting thecustomers to purchase a brand. Consumers desire to obtainmore for the same price and are thus sensitive to salespromotion like free gift, price reduction or special offers.The ethical issue is that companies may be tempted to takeadvantage of customers by making promises andpromotions that cannot be kept. Deceptive or false promisesinclude failure to provide promised benefits (i.e. mail in rebate)or failure to provide a gift in conformity to what was promised.
Ethical issues related to promotion can be analyzed undertwo topics; advertising and personal selling. Therelationship between advertising and ethics can be analyzedfrom the point of view of persuasive trait of advertising,deception, puffery and making promises that cannot be kept.Other ethical issues related to advertising includeadvertising to children, demonstrations, mock-ups,endorsements and testimonials (Drumwright, 1993). Anadvertisement will be deemed misleading or deceptive onlyif it is reasonable to expect that persons exposed to it, orthose targeted by it, would come to hold false beliefs as aresult of exposure to it. A misleading advertisement is onethat causes a distorted perception and for which theadvertiser is considered responsible. It could be that theconsumer misled by an advertisement will be tempted tobuy the advertised product and in that way either gettingless than he thought he would or paying more than heshould (Attas, 1999).

SCMS Journal o f Indian Management , July - September 2016 88
A Quarterly Journal
Personal selling by sales people who act in an ethical mannerare more effective at building strong customer relationships- their customers are more satisfied with them, more trustingof them, and more committed to them. Customer trust withthe sales person is defined as the confidence that thecustomer has in the integrity and reliability of the salesperson. This confidence in turn will result in the customer’swillingness to develop and maintain a relationship with thesales person (Madhani, 2014). Ethical sales behavior isdefined as fair and honest actions that enable the salespersonto foster long-term relationships with customers based oncustomer satisfaction and trust. Examples of such activitiesinclude: selling products that meet customers’ needs,
Table 1:Marketing Mix Variables and Ethical Considerations
providing true information about the product (e.g. whencomparing with the competitors’ products or in terms of itsbenefits or availability) and implementing low-pressureselling techniques (Singhapakdi et al., 1999). The propensityfor sales person to make unethical choices can be reducedby organization in various ways: developing a code of ethics,reinforcing ethical behavior through an ethical climate anddesigning a compensation system that rewards ethicalbehavior and punishes unethical behavior (Madhani, 2015b).
Ethical concerns can arise in every element of the marketingmix. Table 1 below shows various marketing mix variablesand ethical considerations.
Sr.No.
Marketing Mix Variables
A) Product1. Marketer should not manipulate the availability of a product for the purpose of exploitation.2. Marketer should not exaggerate or lying the benefits of a product offering .3. Information regarding all substantial risks associated with product or service usage should be
disclosed.4. Products and services offered should be safe and fit for their intended uses.5. Marketer should not misrepresent the credentials of the product / service provider.6. Any product constituent substitution that might materially change the product or impact the
buyers purchase decision should be disclosed.7. Obligation and responsibilities in contracts and mutua l agreements should be met in a timely
manner.
B) Price1. The full price associated with any purchase should be disclosed.2. All extra-cost added feature should be identified.3. Marketer should not engage in price fixing.4. Predatory pricing should not be practiced.
C) Place1. Coercion should not be used within the marketing channel.2. Undue influence should not be exerted over the resellers’ choice to handle a product.3. Marketer should not implement manipulative influence techniques or high pressure selling tac tics.4. Marketer should not sell products that customers do not need5. Marketer should not hide mistakes or errors in product/ service delivery
D) Promotion1. Communications about products and services offered should not be deceptive.2. False and misleading advertising should be avoided.3. High pressure manipulations or misleading sales tactics should be avoided.4. Sales promotions that use deception or manipulation should be avoided.5. Marketer should not treat customers unfairly or neglect customer requests .6. Marketing practices that m ake it difficult to invoke a product/service guarantee for promotional
item should be avoided.
(Source: Table developed by Author)
SCMS Journal o f Indian Management , July - September 2016 89
A Quarterly Journal
Honest actions such as low pressure selling techniques,fairness, responsible acts, forbearance from opportunismand benevolence of a sales person are observable and aresuggested to increase customer trust in the sales person.Sales person’s honest actions and ethical sales behaviorincreases customer trust and loyalty.
Illustration
Although unethical sales behaviors can damage thecustomers, organization, or both, it is the organization thatultimately loses (Schwepker et al., 2005). The case of Sears’sautomotive center service advisors, who routinely addedcontrived repairs to customers’ bills, is a good example ofhow unethical sales behavior negatively impact organization(Babin et al., 2000). In 1992, automotive service advisorswere accused of overcharging auto repair customers in orderto earn higher commissions. It was found by Sears that itsautomotive service advisers, acting under a commissionsales plan, were selling parts and services that customersdid not need. That behavior harmed both the customer andcompany in the long run. Sears was charged for fraud, makingfalse and misleading statements and willful departure fromaccepted trade practices. Though customers were the firstvictims of unethical behavior of sales people, Sears’sreputation was irreparably damaged. Sears’ total cost tosettle pending lawsuits was huge, i.e. about $60 million(Paine, 1994).
Research Methodology
A two stage methodological approach is adopted in thisresearch. In the first stage, research focuses ondevelopment of a business value added framework tohighlight value added for organization because of ethicalmarketing. The second stage involves the development ofCLV framework along with valuation matrix to supportbusiness value added framework.
A) Development of a Business Value Added Framework
In the present scenario of competitive environment, moreand more organizations are aggressively searching forcompetitive advantages in order to get a better position inthe markets.
Competitive advantage is the extent to which an organizationis able to create a defensible position over its competitors(Porter, 1985). The source of competitive advantage can be
found in a firm’s ability to differentiate itself from thecompetitors (Morgan and Strong, 2003). To gain competitiveadvantage over its competitors, a firm must deliver value toits customers through cost advantage by performingactivities more efficiently than its competitors or by creatinggreater differentiation advantage by performing theactivities in a unique way in relation to competitors (Barney,1991; Peteraf, 1993; Slater, 1996). Having a competitiveadvantage for organization generally suggests that theycan have one or more of the following capabilities whencompared to its competitors: lower prices, higher quality,higher dependability, and shorter delivery time. All thesecapabilities are positively influenced by ethical marketing.
To grow and prosper in the time ahead, organizations mustdevelop and implement competitive business strategy thatsatisfies the needs of the target market. The core of anybusiness strategy is the customer value proposition, whichdescribes the unique mix of product and service attributes,customer relations, and overall image that an organizationoffers. It also explains how the organization will differentiateitself from rivals to attract, retain, and strengthenrelationships with targeted customers.
To demonstrate the ways in which ethical marketing cangenerate overall business values for an organization,Porter’s (1985) value chain framework is used as a basis topresent a business value-added framework as shown inFigure 4. The role of added value has long been accepted asa means of securing competitive advantage (Normann andRamõÂrez, 1994; Naumann, 1995) and long-term success ofthe firm (de Chernatony and McDonald, 1998). Accordingto Brown (1997), the value chain is a tool to segregate abusiness into strategically relevant activities. Thisclassification enables identification of the source ofcompetitive advantage by performing these activities morecheaply or better than its competitors. Slywotzky andMorrison (1997) used a ‘customer-centric’ approach topropose a modern value chain in which the customer is thefirst link to all that follows. Prior researchers have also usedvalue added framework (Moon and Ngai, 2008; Madhani2011; Madhani 2012; Madhani 2015c).
As shown in Figure 4, ethical marketing by organization willhave positive impacts on all elements of marketing mix of 4P’s (product, price, place and promotion) and enhancescustomer value proposition. However, such marketing mix

SCMS Journal o f Indian Management , July - September 2016 90
A Quarterly Journal
elements are independent variables for 4A’s (Acceptability,Affordability, Accessibility and Awareness) of customervalue chain drivers which are in turn dependent variable
and creates added value for the customers as well as for theorganization (Figure 4).
Ethical Marketing
PRODUCT PRICE PROMOTIONPLACE
Ethical Marketing Mix
I Provide the Value Communicate the Value
Enterprise V
alue
Custom
erV
alueProposition
RO
I / RO
A
Revenue
/ Operating
Income
STP
Customer Value Chain Drivers Business Value Added
I = Identify the ValueS = SegmentationBased onCustomerValue NeedT = Select TargetP = Positioning the Value
Acceptability– DesiredproductAffordability– FairpricingAccessibility – No discrimination in
distribution(place)Awareness– Ethical salespromotion
Figure 4: Ethical Marketing: A Business Value Added Framework
(Source: Framework developed by author)
B-1) Development of a CLV Framework
Ethical marketing influence customer behavior (such ascustomer acquisition, customer retention, and customerexpansion in the form of cross-selling / up-selling), which inturn affects customers’ CLV or their profitability to the firm.CLV is the key method for determining how much eachcustomer adds to the value of the organization. Lifetimerevenue of customer is dependent on average life time ofcustomer and number of purchases during lifetime.
CLV is the only financial metric that incorporates into one,all the elements of revenue, expense and customer behaviorthat drive profitability. CLV focuses on long-term profitabilityinstead of immediate sales outcome. CLV depends on threemain components of customer relationship – acquisition,retention, and cross-selling. The lifetime value of a customerfor an organization is the net revenues obtained from thatcustomer over the life time of transactions with that customerminus the cost of attracting, selling, and servicing thecustomer taking into account the time value of money (Jain

SCMS Journal o f Indian Management , July - September 2016 91
A Quarterly Journal
and Singh, 2002). This metric also manages to score overother metrics by adopting a customer-centric approachinstead of a product-centric one, as the driver of profitability.CLV is a calculation of projected net cash flows that a firmexpects to receive from the customer, adjusted to theprobability of occurrence and are then discounted. Hence,it measures the present value of all future profit streams of acustomer across the entire customer life cycle. Although atrue CLV measure implies measuring the customer’s valueover his or her lifetime, for most applications it is three yearsas in most cases the majority of a customer’s lifetime valueis captured within the first three years (Gupta and Lehmann,2005). For example, if the retention rate is equal to 75%, andthe discount rate is equal to 20%, then three years accountsfor about 86% of the CLV (Kumar et al., 2008).
On average, firms spend six times more to acquire customersthan they do to keep them (Gruen, 1997). As the cost ofacquiring customers is high, the profitability from a customerarises if customers make many repeat purchases. Customerretention is very much a function of customer loyalty, andhence, strategies that strengthen the relationship betweenthe firm and the customer should improve retention. Manyauthors have documented the financial benefits to a firm ofincreasing retention rates. Firms can boost profits by almost100% by retaining just 5% more of their customers (Reichheldand Sasser, 1990). Retention can be increased with betterproducts and services, more competitive pricing,
promotions, particularly value added ones, and increasedbrand value (Malthouse and Mulhern, 2008). Another studyfound that increasing customer retention rates by 5% couldincrease firm’s profit by 2% to 9% (Gupta et al., 2004).Unethical marketing practices decrease customer retentionrate thereby ultimately reduces CLV of customer.
One of the most effective ways to boost CLV is to increasecustomer satisfaction as it enhances customer trust, loyaltyand retention rate. A positive link between satisfaction andusage has been documented in prior research (Bolton andLemon, 1999). Research on a meta-analysis of purchaseintentions studies found that satisfied customers are moreloyal (Szymanski and Henard, 2001). A study conducted byDeloitte Consulting found that firms which recognize theimportance of understanding CLV are 60% more profitablethan firms that do not consider CLV (Kale, 2004). Researchhas found that a 5% increase in customer retention canincrease customer lifetime profits by 25% to 95%. The samestudy found that it costs six to seven times more to gain anew customer than to keep an existing one (Reichheld andTeal, 2001).
As shown in Figure 5, ethical marketing enhances customertrust, loyalty and satisfaction, strengthens customerrelationship and ultimately increase CLV through customeracquisition, retention and expansion. CLV, impact CE andeventually valuation of the firm.
ENTERPRISEVALUE
CLV
CUSTOMEREXPANSION
CUSTOMERACQUISITION
CUSTOMERRETENTION
ETHICAL MARKETING
CUSTOMERSATISFACTION
CUSTOMERTRUST AND LOYALTY
LONG TERMRELATIONSHIP
Ethical Marketing Mix
(Source: Framework developed by author)
Figure 5: Ethical Marketingand CLV: A Conceptual Framework

SCMS Journal o f Indian Management , July - September 2016 92
A Quarterly Journal
As the CLV concept is based on customer value, it increasesmarketing’s accountability, emphasizes long termrelationship with customers and sensitizes the organizationregarding negative consequences of unethical marketingpractices. The CLV approach quantifies the potentialmonetary value of customers over their lifetime and buildslinkages between ethical marketing and the financialperformance of the organization.
B-2) Development of a Valuation Matrix
Typically, CLV is a function of the contribution margin, thepropensity for a customer to continue in a relationship(customer retention), and the marketing resources allocated
to the customer and hence, marketing ethics directlyinfluence CLV. Unethical marketing practices such asaggressively selling to customers when not requested orhiding the facts regarding product or services might resultin customer defection. Hence, with unethical marketingpractices, customer dissatisfaction increases, resulting inhigher cost burden in maintaining a customer relationship.In contrast, having gained customers’ trust through honestand ethical marketing behavior might provide enduringadvantage to the organization in terms of higher CLV ascompetitors struggle to convince customers to take the riskand switch to a different organization (Figure 6).
H
CustomerOrientation
SalesOrientation
Sales Objective
Quadrant –Unethical
1. Unethical Sales/Marketing2. Customer Trust and
Loyalty– Low3. Customer Relationship
– ShortTerm4. Customer Retention
– Low5. CLV andEnterpriseValue
– Low
Quadrant – Ethical
1. Ethical Sales/Marketing2. Customer Trust and
Loyalty– High3. Customer Relationship
– Long Term4. Customer Retention
– High5. CLV and EnterpriseValue
– High
Cus
tom
er L
ifet
ime
Val
ue(C
LV
)
LongTerm
ShortTerm
Low
High
EnterpriseV
alue
High
Low
Orientation
Figure 6: Ethical Marketing – Enterprise Value Matrix
(Source: Matrix developed by Author)
Customers are more inclined to identify themselves with theorganization and continue to do business when organizationthat is perceived as ethical (Ahearne et al., 2005). There is anegative relationship between unethical sales behavior andcustomer-oriented selling. Ethical sales practices may avoidshort term decisions that hamper long term benefits. In
contrast, unethical sales practices may focus on short termgain by misleading customer to gain immediate sale, butsuch deception will likely jeopardize future sales. As suchethical behavior - behavior that is both legal and morallyacceptable - plays a very important role in customer orientedselling.

SCMS Journal o f Indian Management , July - September 2016 93
A Quarterly Journal
Unethical marketing practices not only destroy salesopportunities but also waste marketing resources in effortsto gain new customers. These organizations need to spendmore on marketing (advertising and sales promotion) budgetas their practices also reduce the impact of marketing efforts.The unethical marketing practices increases customerdissatisfaction and churn rate and hence decreases retentionrate. With low retention rate of customers, organizationswon’t be able to up-sell or cross-sell products, there byfurther decreasing sales revenue. Hence, it translates in tolower CLV as well as enterprise value (Figure 6).
Various Illustrations
1) Unethical Marketing Practices (Deceptive Promotion)
After going through initial rapid growth, the business growthof Royal Limited, a tea processing and marketing companybegan to slow down mainly because of stiff competitionand increased demands of customers for natural flavors.After much R&D and with very encouraging customerresponse during pilot test, Royal launched a new variant ofginger herbal tea in the market. To revive overall growth,Royal launched a promotion scheme for the new product.As new flavor - ginger tea contained herbal medicinalingredients; it was good for health in long term as it increases
vitality of the body. However, to increase sales volumequickly, marketing indulged in unethical practices by creatingunrealistic product expectations as promotion campaignapart from highlighting good test of ginger tea also claimedthat it is health supplement and quickly reduces obesity.Under this circumstance, as customers were given wrongpromise about product, they were highly dissatisfied withthe newly flavored ginger tea although it was unique in testand liked by most customers.
Hence, after initial good response of promotion for gingerflavored tea, demand for product quickly died down. Theretention rate, from existing data of Royal Limited, showedthat a 17% of new users become light users, 38% of lightusers become medium users and 40% of medium usersbecome heavy users. Royal market research team found thatcustomers felt cheated by unethical marketing promotion(i.e. wrong promise about the product). It was the case ofcreating unrealistic expectations (exaggerating or lying thebenefits of a product offering). Accordingly, unethicalmarketing promotion resulted into decreased customersatisfaction and trust, lower retention rate of customer (i.e.retention rate decreased by 50%) and ultimately decreasesin CLV and enterprise value (Table 2).
Table 2: New Product Launch and Unethical Marketing Promotion
CalculationCustomer Hierarchy
New(A)
Light(B)
Medium(C)
Heavy(D)
(1) Number of purchases / lifetime - 20 60 100(2) Average lif etime (years) - 2 4 7(3) Lifetime revenue ($) 300 1100 3300 6400(4) Profit margin (%) 15 9 9 9(5) Profit by category = (3) x (4) ($) 45 99 297 576(A) Ethical Marketing(6) Average retention rate (%) 100 22 43 45(7) Initial number of customers 100 - - -(8) Customers retained from 100 = (8)prior x (6) 100 22 9 4
(9) Total profit = (5) x ( 8) ($) 4500 2178 2673 2304(10) Profit per new customer = (9)/(8A) ($) 45 21.78 26.73 23.04
(11) CLV of new customer =(10A) + (10B) + (10C) + (10D) ($)
116.55
(12) Number of customers 1000
(13) Firm value (in terms of CE) = (12) x (11) ($) 116,550
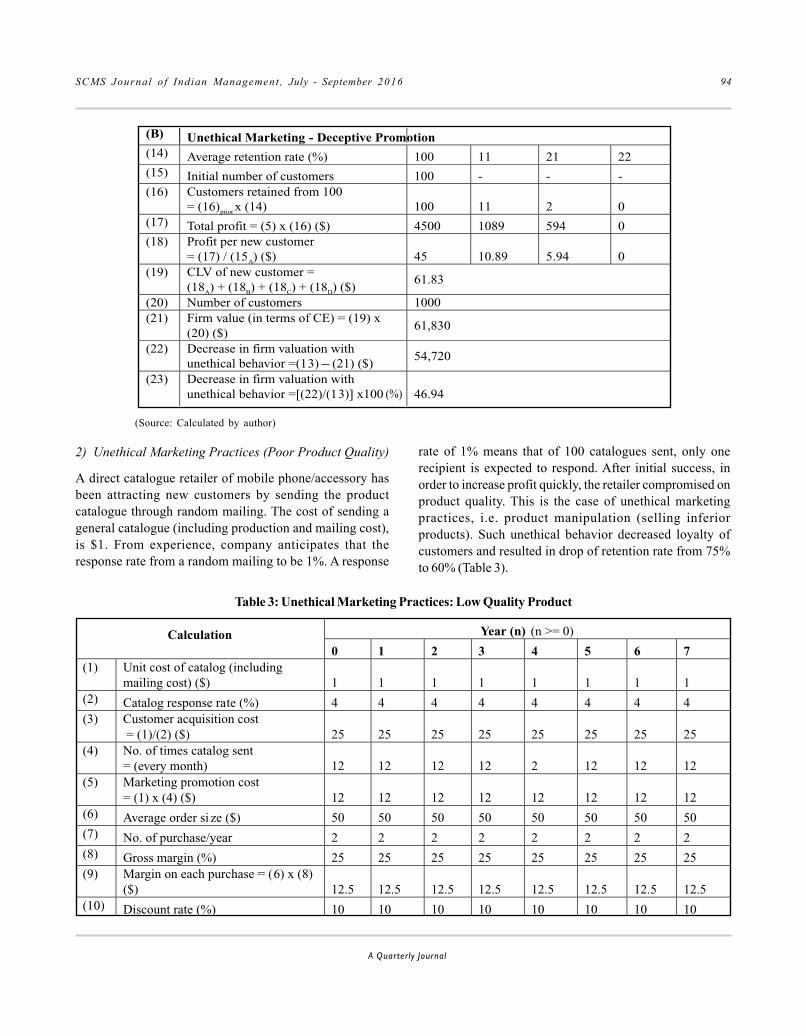
SCMS Journal o f Indian Management , July - September 2016 94
A Quarterly Journal
(B) Unethical Marketing - Deceptive Promotion(14) Average retention rate (%) 100 11 21 22(15) Initial number of customers 100 - - -(16) Customers retained from 100
= (16)prior x (14) 100 11 2 0(17) Total profit = (5) x (16) ($) 4500 1089 594 0(18) Profit per new customer
= (17) / (15A) ($) 45 10.89 5.94 0(19) CLV of new customer =
(18A) + (18B) + (18C) + (18D) ($)61.83
(20) Number of customers 1000(21) Firm value (in terms of CE) = (19) x
(20) ($)61,830
(22) Decrease in firm valuation withunethical behavior =(13) – (21) ($)
54,720
(23) Decrease in firm valuation withunethical behavior =[(22)/(13)] x100 (%) 46.94
2) Unethical Marketing Practices (Poor Product Quality)
A direct catalogue retailer of mobile phone/accessory hasbeen attracting new customers by sending the productcatalogue through random mailing. The cost of sending ageneral catalogue (including production and mailing cost),is $1. From experience, company anticipates that theresponse rate from a random mailing to be 1%. A response
(Source: Calculated by author)
Table 3: Unethical Marketing Practices: Low Quality Product
rate of 1% means that of 100 catalogues sent, only onerecipient is expected to respond. After initial success, inorder to increase profit quickly, the retailer compromised onproduct quality. This is the case of unethical marketingpractices, i.e. product manipulation (selling inferiorproducts). Such unethical behavior decreased loyalty ofcustomers and resulted in drop of retention rate from 75%to 60% (Table 3).
Calculation Year (n) (n >= 0)
0 1 2 3 4 5 6 7(1) Unit cost of catalog (including
mailing cost) ($) 1 1 1 1 1 1 1 1(2) Catalog response rate (%) 4 4 4 4 4 4 4 4(3) Customer acquisition cost
= (1)/(2) ($) 25 25 25 25 25 25 25 25(4) No. of times catalog sent
= (every month) 12 12 12 12 2 12 12 12(5) Marketing promotion cost
= (1) x (4) ($) 12 12 12 12 12 12 12 12(6) Average order si ze ($) 50 50 50 50 50 50 50 50(7) No. of purchase/year 2 2 2 2 2 2 2 2(8) Gross margin (%) 25 25 25 25 25 25 25 25(9) Margin on each purchase = (6) x (8)
($) 12.5 12.5 12.5 12.5 12.5 12.5 12.5 12.5(10) Discount rate (%) 10 10 10 10 10 10 10 10

SCMS Journal o f Indian Management , July - September 2016 95
A Quarterly Journal
(A) Ethical Marketing Practices(retention rate ‘r’= 75%)
(11) Retention rate across years = (r)n (%) 100 75 56 42 32 24 18 13(12) Expected profit/customer =
[ [(7) x (9) – (5)] x (11)] ($) 13 9.75 7.31 5.48 4.11 3.08 2.31 1.74(13) NPV of profit/ customer =
[(12)/((1+(10))n] ($) 13 8.86 6.04 4.12 2.81 1.92 1.31 0.89(14) CLV = Cumulative profit / customer
(net of acquisition cost) ($) -12 -3.14 2.91 7.03 9.84 11.75 13.06 13.95(15) CLV of new customer ($) 13.95(16) Number of customers 10,000(17) Firm value (in terms of CE) = (15) x
(16) ($)139,500
(B) Unethical Marketing Practices – Low Product Quality (retention rate ’r’ = 60%)
(18) Retention rate across years = (r)n (%) 100 60 36 21.6 12.96 7.78 4.67 2.80(19) Expected profit/customer =
[ [(7) x (9) – (5)] x (18)] ($) 13 7.80 4.68 2.81 1.68 1.01 0.61 0.36(20) NPV of profit/ customer =
[(17)/((1+(10))n] ($) 13 7.09 3.87 2.11 1.15 0.63 0.34 0.19(21) CLV = Cumulative profit / customer
(net of acquisition cost) ($) -12 -4.91 -1.04 1.07 2.22 2.85 3.19 3.38(22) CLV of new customer ($) 3.38
(23) Number of customers 10,000
(24)Firm value (in terms of CE) = (22) x(23) ($)
33,800
(25)Decrease in firm valuation withunethical behavior= (17) – (24) ($)
105,700
(26)Decrease in firm valuation withunethical behavior= [(25)/(17)] x100 (%)
76
As calculated in Table 3, unethical marketing practicesdecrease firm valuation by 76%.
Conclusion
Ethical marketing practices increase customer satisfaction,trust and loyalty, and builds long term customer relationship.As customer lifetime value is a concept based on customervalue, it’s derived from the long term relationship contextoccurring throughout the customer lifetime. Ethicalmarketing practices foster an environment of heightenedcustomer trust and loyalty necessary for building long termcustomer relationship and enhance CLV as well as CE. Thus,an emphasis on marketing ethics can help salesorganizations attract new customers, maintain and expand
relationships with existing customers and expand marketshare through cross-selling and up-selling.
With ethical marketing process, organizations exhibit astrong sense of integrity and avoid deceptive and dishonestpractices in satisfying customer needs and hence buildtrusting and long term customer relationships. Ethicalmarketing practices play a significant role in enhancingfinancial performance and firm valuation. In long run, ethicalmarketing is much more likely to achieve better corporateperformance in terms of sales, profitability and market sharebecause of higher customer satisfaction, trust and loyaltyand ultimately higher CLV and valuation of firm. Marketingethics strengthen long-term viability of the organizationsand build competitive advantages.
(Source: Calculated by author)

SCMS Journal o f Indian Management , July - September 2016 96
A Quarterly Journal
References
Ahearne M., C.B. Bhattacharya, and T. Gruen,. (2005).“Antecedents and consequences of customer-company identification: Expanding the role ofrelationship marketing.” Journal of AppliedPsychology, 90(3): 574-585.
Alrubaiee, L. (2012). “Exploring the Relationship betweenethical sales behavior, relationship quality, andcustomer loyalty.” International Journal of MarketingStudies, 4(1): 7-25.
American Marketing Association updates association’s codeof ethics (2004). Marketing News, September 1, 42: 40.
Anderson, E. W., C.Fornell., and D.R. Lehmann,(1994).”Customer satisfaction, market share andprofitability: Findings from Sweden.” Journal ofMarketing, 58(3): 53-66.
Anderson, E. W. and M.W. Sullivan, (1993).”Theantecedents and consequence of customer satisfactionfor firms.” Marketing Science, 12(2): 125-143.
Attas, D. (1999). “What’s wrong with “deceptive”advertising?.”Journal of Business Ethics,21(1): 49-59.
Babin, B. J., J. S. Boles, and D. P. Robin. (2000).“Representing the perceived ethical work climateamong marketing employees”,Journal of theAcademy of Marketing Science, 28(3):345-358.
Barney, J. (1991).” Firm resources and sustained competitiveadvantage.” Journal of Management, 17(1): 99-120.
Bolton, R. N. and K. N. Lemon (1999).”A dynamic model ofcustomers’ usage of services: Usage as an antecedentand consequence of satisfaction.” Journal ofMarketing Research, 36(2): 171-186.
Bowen, J.T. and S.Shoemaker. (1998).”Loyalty: A strategiccommitment?” Cornell Hotel and RestaurantAdministration Quarterly, 39(1): 12-25.
Brown L. (1997). Competitive Marketing Strategy.Melbourne: ITP Nelson.
Bush, V.D., B.T. Venable, and A.J. Bush.(2000). “Ethics andmarketing on this internet: Practitioners’ perceptionsof societal, industry and company concerns.” Journalof Business Ethics, 23(3):237-248.
Carroll, A. B. (1991). “The pyramid of corporate socialresponsibility: Toward the moral management oforganizational stakeholders.” Business Horizons, 34(4):39-48.
Cater, B. and V.Zabkar(2008). “Antecedents andconsequences of commitment in marketing researchservices:The client’s perspective.”IndustrialMarketing Management, 38(7):785-797.
Chonko, L.B. (1995). Ethical Decision Making inMarketing. Thousand Oaks, CA: Sage.
de Chernatony, L. and M.H.B. McDonald (1998).CreatingPowerful Brands in Consumer, Service and IndustrialMarkets. Oxford, Butterworth-Heinemann.
Drumwright, M.E. (1993). “Ethical issues in advertising andsales promotion.” Ethics in Marketing, N. Craig Smithand John A. Quelch (Eds.), 607-625, Homewood, IL:R.D.Irwin.
Fornell, C. (1992).”A national customer satisfactionbarometer: The Swedish experience.” Journal ofMarketing, 56(1): 6-21.
Futrell, CM. (2002). Fundamentals of Selling: Customersfor Life, 7th Edition, New York: McGraw-Hill.
Gaski, J.F.(1999). “Does marketing ethics really have anythingto say?A critical inventory of the literature.” Journalof Business Ethics, 18(3): 315-334.
Gruca, T. S. and L.L. Rego (2005).”Customer satisfaction,cash flow, and shareholder value.” Journal ofMarketing, 69(3): 1-130.
Gruen, T.W. (1997). “Relationship marketing: The route tomarketing efficiency and effectiveness.” BusinessHorizons, 40(6): 32-38.
Gupta, S. andD. R. Lehmann (2005). Managing Customersas Investments: The Strategic Value of Customers inthe Long Run, Upper Saddle River, NJ: WhartonSchool Publishing.
Gupta, S., D. R. LehmannandJ. A. Stuart(2004). “Valuingcustomers.” Journal of Marketing Research, 41(1): 7-18.
Hansen, J.D. and R.J. Riggle (2009). “Ethical salespersonbehavior in sales relationships.” Journal of PersonalSelling & Sales Management, 29(2):151-166.

SCMS Journal o f Indian Management , July - September 2016 97
A Quarterly Journal
Huddleston, P., J. Whipple, and A .VanAuken,. (2004).”Foodstore loyalty: Application of a consumer loyaltyframework.” Journal of Targeting, Measurement andAnalysis for Marketing, 12(3): 213-230.
Kale, S. H. (2004).”CRM failure and the seven deadly sins.”Marketing Management, 13(5): 42-46.
Karpatkin, R. H. (1999). “Toward a fair and just marketplacefor all consumers: The responsibilities of marketingprofessionals.” Journal of Public Policy & Marketing,18(1): 118-122.
Kaynak, E.(1985). “Some thoughts on consumerism indeveloped and less developed countries.”International Marketing Review, 2(2): 15-30.
Kehoe, W.J. (1985). “Ethics, price fixing, and the managementof price strategy.” Marketing Ethics: Guidelines forManagers, G. R. Laczniak and P. E. Murphy (Eds.), 71-83, Lexington, MA: Lexington Books.
Kennedy, M. S., L. K., Ferrell, and D. T. LeClair (2001).“Consumers’ trust of salesperson and manufacturer:An empirical study,”Journal of BusinessResearch, 51(1): 73-86.
Kotler, P. (2004). “Wrestling with ethics.” MarketingManagement, 13(6): 30-36
Kotler, P. and Armstrong, G. (2003). Principles of Marketing,9th ed. Englewood Cliffs, NJ: Prentice Hall.
Kumar, V., R. Venkatesan.,T. Bohlingand, and D.Beckmann(2008). “Practice prize report-The power of CLV:Managing customer lifetime value at IBM.” MarketingScience, 27(4):585-599.
Laczniak, G.R. and P.E Murphy.(2006). “Normativeperspectives for ethical and socially responsiblemarketing.” Journal of Macromarketing, 26(2):154-177.
Lu, L.C., G.M. Rose, and J.G. Blodgett, (1999). “The effectsof cultural dimensions on ethical decision making inmarketing: An exploratory study.”Journal of businessEthics, 18(1):91-105.
Luo, X. and C. Homburg (2007).”Neglected outcomes ofcustomer satisfaction.” Journal of Marketing, 71(2):133-149.
Madhani, P. M. (2015a). “Sales and marketing: Integration.”SCMS Journal of Indian Management, 12(2): 17-28.
Madhani, P. M. (2015b). “Ethical behavior in salesorganizations: Key dimensions.” World at WorkJournal, 24(1): 55-69.
Madhani, P. M. (2015c). “Enhancing customer lifetime valuein fast fashion retailing with RFID initiatives.”International Journal of Business and Globalisation,5(2): 205-237.
Madhani, P. M. (2014). “Compensation, ethical sales behaviorand customer lifetime value.” Compensation &Benefits Review, 46(4): 204-218.
Madhani, P. M. (2012). “Sales and marketing integration:Applying the theoretical lens of the resource-basedview.” International Journal of Electronic CustomerRelationship Management, 6(3/4): 292-322.
Madhani, P. M. (2011). “Business value added through RFIDdeployment in retail: A synthesis, conceptualframework and research propositions.” InternationalJournal of ElectronicCustomer RelationshipManagement, 5(3/4):305-322.
Malthouse, E. and , F. Mulhern (2008).”Understanding andusing customer loyalty and customer value.” Journalof Relationship Marketing, 6(3/4): 59-86.
Mann, J. and P. Thornton (1978). “Consumerism inperspective”,European Journal of Marketing, 12(4):253-263.
McCarthy, E. J. (1960). Basic Marketing: A ManagerialApproach, Homewood, IL: R.D. Irwin.
Memery, J., P. Megicks, and J.Williams, (2005). “Ethical andsocial responsibility issues ingrocery shopping: Apreliminary typology,”Qualitative Market Research:An International Journal, 8(4): 399-412.
Menezes, M. A. J (1993). “Ethical issues in product policy.”Ethics in Marketing, N. C. Smith and J. A. Quelch(Eds.), 283- 301, Homewood, IL: R.D. Irwin.
Moon, K.L. and E.W.T. Ngai, (2008). “The adoption of RFIDin fashion retailing: A business value-addedframework.”Industrial Management & DataSystems, 108(5): 596-612.
Moorman, C., G. Zaltman, and R Deshpande. (1992).“Relationships between providers and users of marketresearch: The dynamics of trust within and betweenorganizations.” Journal of Marketing Research,29(3):314-328.

SCMS Journal o f Indian Management , July - September 2016 98
A Quarterly Journal
Morgan, F. W. (1993), “Incorporating a Consumer SafetyPerspective into the Product Development Process.”Ethics in Marketing, N. C. Smith and J. A. Quelch(Eds.), 350-358, Homewood, IL: R.D. Irwin.
Morgan, R.E. and C.A. Strong (2003).”Businessperformance and dimensions of strategic orientation.”Journal of Business Research, 56(3): 163-176.
Murphy, P. E., G. R.Laczniak, N. E. Bowie, andT. A Klein,.(2005). Ethical Marketing: Basic Ethics in Action,Upper Saddle River: Prentice Hall.
Naumann, E. (1995).Creating Customer Value: The Path toSustainable Competitive Advantage. Cincinnati:Thomson Executive Press.
Normann, R. and R.RamõÂrez. (1994).Designing InteractiveStrategy from Value Chain to Value Constellation,Chichester. John Wiley & Sons.
Oliver, R. L. (1999). “Whence customer loyalty?” Journal ofMarketing, 63(4):33-44.
Oliver, R.L. and J.E Swan,. (1989). “Consumer perceptionsof interpersonal equity and satisfaction intransactions: A field survey approach.” Journal ofMarketing, 53(2): 21-35.
Ortmeyer, G. K. (1993). “Ethical Issues in Pricing.” Ethics inMarketing, N. C. Smith and J. A. Quelch (Eds.), 389-404, Homewood, IL: R.D. Irwin.
Ou, W.M., C.M. Shih, and C .Y. Chen (2015). “Effects ofethical sales behaviour on satisfaction, trust,commitment, retention and words-of-mouth.”International Journal of Commerce and Management,25(4): 673-686.
Paine, L. S. (1994). “Managing for organizational integrity.”Harvard Business Review, 72(2):106-117.
Palmatier, R. W., S. Gopalakrishna, and M.B. Houston. (2006).“Returns on business-to-business relationshipmarketing investments: Strategies for leveragingprofits.” Marketing Science, 25(5): 477-493.
Peteraf, M. A. (1993). “The cornerstones of competitiveadvantage: A resource-based View.” StrategicManagement Journal, 14(3): 179-191.
Porter, M.E. (1985). Competitive Advantage, New York: TheFree Press.
Pritchard, M.P. and D.R. Howard, (1997). “The loyal traveler:Examining a typology of service patronage.” Journalof Travelers Research, 35(4): 2-11.
Rallapalli, K.C. (1999). “A paradigm for development andpromulgation of a global code of marketing ethics.”Journal of Business Ethics, 18(1):125-137.
Reichheld, F. F. and W.E. Sasser(1990).”Zero defections:Quality comes to services.” Harvard Business Review,68(5):105-111.
Reichheld, F. F. and Teal, T. (2001).The Loyalty Effect: TheHidden Force Behind Growth, Profits, and LastingValue, Boston, Massachusetts: Harvard BusinessPress.
Román, S. and J. L.Munuera, (2005). “Determinants andconsequences of ethical behaviour: An empirical studyof salespeople.” European Journal of Marketing, 39(5/6): 473-495.
Román, S. andS. Ruiz, (2005). “Relationship outcomes ofperceived ethical sales behaviour: The customer’sperspective.” Journal of Business Research, 58(4): 439-445.
Román, S. (2003). “The impact of ethical sales behaviour oncustomer satisfaction, trust and loyalty to thecompany: An empiricalstudy in the financial servicesindustry.” Journal of Marketing Management, 19(9-10): 915-939.
Rosanas, J.M. and M. Velitta,. (2003). “Loyalty and trust asthe ethical bases of organizations.” Journal of BusinessEthics, 44(1): 49-59.
Rust, R. T., K. N. Lemon, andV. A. Zeithaml, (2004). “Returnon marketing: Using customer equity to focus marketingstrategy.” Journal of Marketing, 68(1):109-127.
Rust, R. T., C. Moorman, and P. R. Dickson, (2002).”Gettingreturns from service quality: Revenue expansion, costreduction, or both.” Journal of Marketing, 66(4): 7-24.
Rust, R. T., V. A Zeithaml,. and K. N. Lemon, (2000). DrivingCustomer Equity: How Customer Lifetime Value isReshaping Corporate Strategy, New York: Free Press.
Schoell, W.F., G.Dessler, andJ.A.Reinecke. (1993).Introduction to Business (7th ed.),Boston:Allyn andBacon.

SCMS Journal o f Indian Management , July - September 2016 99
A Quarterly Journal
Schwepker, C. H., Jr. andM.D Hartline (2005). “Managingthe ethical climate of customer-contact serviceemployees.” Journal of Service Research, 7(4): 377-397.
Seiders, K., G.BVoss, D.Grewal, andA.L. Godfrey. (2005).”Dosatisfied customers buy more? Examining moderatinginfluences in a retailing context.” Journal of Marketing,69(4): 26-43.
Singhapakdi, A., S.J. Vitell, andG.R. Franke. (1999).“Antecedents, consequences, and mediating effectsof perceived moral intensity and personal moralphilosophies.” Journal of the Academy of MarketingScience, 27(10): 19-36.
Slater, S. F. (1996). “The challenge of sustaining competitiveadvantage.” Industrial Marketing Management,25(1): 79-86.
Slywotzky, A.J. and.J Morrison (1997). The Profit Zone, NewYork, Wiley.
Smith, C.N. (1993). “Ethics and the marketing manager.”Ethics in Marketing, N. C. Smith and J. A. Quelch(Eds.), 3-34, Homewood, IL: R.D.
Svensson, G. and G. Wood. (2004). “Corporate ethics andtrust in intra-corporate relationships.” Journal ofEmployee Relations, 26(3): 320-336.
Szymanski, D.M. and D.H Henard (2001).”Customersatisfaction: A meta-analysis of the empiricalevidence.” Journal of the Academy MarketingScience, 29(1): 16-35.
Tsalikis, J. and D.J Fritzsche(1989). “Business ethics: Aliterature review with a focus on marketingethics.” Journal of Business Ethics, 8(9): 695-743.
Verhoef, P. C. (2004). “The use of econometric models topredict customer lifetime value.” MediumEconometrischeToepassingen, 12(3): 22-25.
Verschoor, C. C. (2003). “Ethical corporations are still moreprofitable.” Strategic Finance, 84 (June): 22-23.
Verschoor, C. C. (1999). “Corporate performance is closelylinked to a strong ethical commitment.”Business&Society Review, 104(4): 407-415.
Weeks, W. A., T. W.Loe, L.B. Chonko, and K. Wakefield(2004). “The effect of perceived ethical climate on thesearch for sales force excellence.” Journal of PersonalSelling and Sales Management, 24(3): 199-214.
Wray, B., A. Palmer, and D.Bejou (1994). “Using neuralnetwork analysis to evaluate buyer-sellerrelationships.” European Journal of Marketing,28(10): 32-48.
Wulf, K.D., G.Odekerken-Schröder, and D. Iacobucci(2001).“Investments in consumer relationships: A cross-country and cross-industry exploration.” Journal ofMarketing, 65(4):33-50.
******

SCMS Journal o f Indian Management , July - September 2016 100
A Quarterly Journal
Interferences and Moderation ofJob and Family Life
Sheeja Krishnakuamar
Abstract
Sheeja KrishnakuamarAsst ProfessorResearch Scholar, VTUIndian Academy School of Management Studies202B, Celestial Greens, Old Madras RoadC.V.Raman Nagar. P.O., Bangalore 560093Email: [email protected]
here are changes happening in the organizationdue to the social, economic and demographicalvariations. One of the major changes that are visible
in the organization is the participation of women in theworkforce. Entry of women in great numbers has forcedorganizations to bring a change in policies and programs.This has brought transformations in the family structurealso. Previously men earn from outside and women takecare of household activities. Educated women for morefinancial stability started entering the corporate world. Thiscreated an imbalance in the sharing of household work asmost of the time women are outside the house. Sweepingchanges in the composition of families and the workforce,such as more dual-career couples and working mothers withyoung children, have increased the likelihood that both maleand female employees have substantial householdresponsibilities in addition to their work responsibilities(Gilbert, Hallett, and Eldridge, 1994). This created pressurefor both men and women who are working in the corporate.Thus policies in the organization have been rewritten for
The study tries to understand the interference of family issues into work and work issues into family. This study isundertaken to find out the level of job satisfaction in spite of the distracting factors. Important objectives of the studyinclude finding the interference of work domain factors into family satisfaction and the family domain factors into jobsatisfaction. The study is conducted on women employees working in IT companies. Collected data is analyzed usingdescriptive and inferential statistical tools. The study on the influence of cultural factors helps to understand itsimportance as a moderating factor for the success of the organization. The study throws light on the factors thatcompanies have to concentrate for the smooth functioning of it. The model created may be useful to identify thefactors that are relevant to be taken care for balancing life and work.
Keywords : Job involvement, work hours, supervisor support, co-worker support, policies
Abstract
T

SCMS Journal o f Indian Management , July - September 2016 101
A Quarterly Journal
the employees to adjust the work and family life so that theircommitment to the organization is not disturbed. Companiesare taking many measures to ease the situation. The abilityof employees to balance their work and family lives dependson the characteristics of their jobs and workplaces, as wellas on their family situations (Berg, Kalleberg andAppelbaum, 2003). Advent of technologies is another factorthat influenced their lives. There is a chance for the employeesto work from home without venturing out of the house. Butthis facility made employees to get connected with the jobmost of the time. So the pressure related to the job increasedand so imbalance still existed among the employees. Forsome employees elderly members in the house or small kidsat home are the major issues. Organizational and jobcharacteristics, along with individual and family variables,affect the individual towards his commitment towards thejob. The support that is provided from the organization isfavourable to employees depending on the familybackground, nature of job, family support etc. All thesefactors, in turn, affect one’s organizational commitment (Berg,Kalleberg, and Appelbaum, 2003).
Committed and dedicated employees are the greatest assetof the organization. Retaining them in the organization isthe utmost challenge that management face. A good cultureof the organization supports the employees to perform wellin the organization. A well maintained environment isessential for the proper understanding and dedicationtowards the job. Their personal issues, especially familyproblems, may interfere with the job. This may result in lessconcentration towards the job. By supporting the employeesto manage the work and family facilitate company to havecommitted and devoted workers.
Existence of an organization mainly depends on thededicated, committed and loyal employees. They decide thegrowth of the company. An environment away frominterferences of the family life would allow employees toconcentrate on the work. Galinsky and Stein (1990) contendthe environment of the company is crucial to the success ofpolicy implementation. So companies should take measuresto see that employees are focused fully to the work.Companies started to take steps that make employees workwith total dedication while other family issues like child orelder care are supported by them. These initiatives are putforth in the form of policies for the employees to use it and
get adapted to the situation. But the initiatives like workfrom home, flexible timing, child care assistance etc. arelooked upon by individuals in different ways. This studytries to find out the level of interference of work into familylife and family life into work.
Women at Corporate
There are information from information technologycompanies that the number of women employees isincreasing and their requirement in the companies alsoincreasing twofold. The statistics show that TataConsultancy Services recruit maximum number of femaleemployees and has crossed more than one lakh. In TCS theratio of female to male is 25:75. More than one-third of theemployees in information technology companies are women.Some of the other companies that follow TCS are IBM, Wipro,and Accenture etc. At Wipro Technologies, 10 percent ofwomen employees hold outstanding designations. Thenumbers show that women employees are exhibiting a goodperformance and their dedication to the work is tremendousthat employers do not want to avoid considering this genderfor work. Studies reveal that women are twice hard workingcompared to male counterpart and take their job seriously.NASSCOM survey reveals that women comprise 25 percentout of the 2 lakh employees of information technology majorslike TCS and Wipro. NASSCOM study points that thepresent ratio is 76:24 of males verses females would changeto 65:33 in the near future.
Model Framework
The two domains that an employee has to balance are thatof the work and family. Grandey et al. (2005) proposed thatamong various roles, work and family roles are the two mostimportant life roles for most people and incompatibilitybetween them may create tension and negative feelings.The interference of one domain into other may result in thetension within and disagreement with others. The conflictwithin occurs when the family domain factors interfere anddestroy the concentration to do the work. In the same waywork domain factors may interfere into family life and createunnecessary disturbances. Work-family conflict is a formof inter-role conflict in which the demands from one domain(work or family) are incompatible with role demandsstemming from another domain, family or work (Greenhausand Beutell, 1985). It is important to identify the crucial

SCMS Journal o f Indian Management , July - September 2016 102
A Quarterly Journal
variables that kill harmony. Organization should identifythose aspects and focus on it and rectify it for improvingthe performance of the employees. The unwanteddisturbances can be controlled by the interference of thesupervisor or colleagues by supporting the employees. Byformulating family-friendly policies and implementing wellin the organization can also reduce the annoyances. Satisfiedemployee towards his family and job would succeed well inthe organization. A great deal of enthusiasm is noticed insuch employees. Research literature suggests that if workis considered to be the source of this interference then theemployee may develop a negative attitude towards his orher job, resulting in lower job satisfaction (Grandey et al.,2005).
Satisfaction
Locke (1969) defines job satisfaction as the individual’ssubjective valuation of different aspects of the job. Themain aspects of job satisfaction can be considered assynonyms of affect and attitude. Job satisfaction arises froma variety of feelings related to the characteristics of the job,like feelings about the working conditions, about the levelof earnings, about the risk of losing the job, about theopportunity for personal control, and so on. Locke hasdefined job satisfaction as enjoyable state of mind that anindividual gets from job appraisal.
Job satisfaction is defined as “a pleasurable emotional statethat results from an individual appraisal of one’s job” (Locke,1969). Family satisfaction, on the other hand, may be definedas the degree to which the individual feels satisfied with thetime spent with family members and fulfilling their needsand wants. Grandey and her colleagues (2005) found thatwork-to-family and family-to-work conflict are negativelyassociated with the job satisfaction. However, in their study,work-to-family conflict was observed to show strongercorrelation with job satisfaction than family-to-work conflict.
Involvement
Job involvement according to Byron can be explained asthe extent to which employee identify themselves involvedwith their employment roles and the degree to which theirinterests are focussed on the work. In the same way familyinvolvement is the extent to which an individual is engrossedin household duties such as housework and child-care-
related obligations that can create time-based pressure fromthe family realm (Frone et al. 1992a).
Stress
Stress can be defined as a situation when an individualcannot adjust with normal situation and feel that ability toadjust is not possible and affect the performance. When aperson is confronted with a situation which poses a threat,and perceives that she or he does not have the capability orresources to handle the stressors the imbalance that resultsat that point in time is termed as stress (Luthan, 2005). Thisstress is felt in job and family life. Those individuals feelexcited, and take tension and find that productivity andperformance is reducing.
Time
Time–related pressure occurs when an individual is mentallyinvolved with either the work or family related area that itdifficult to concentrate on other role responsibilities(Greenhaus and Beutell, 1985). Studies done by Byron, 2005finds the long working hours create interference of workinto family life. Inappropriate shift timing, overtime workingand sudden work load can cause intrusion of duties fromone domain into another. This will result in conflict betweenwork and family roles. A growing aspiration to balance workwith other aspects of life can doubtless be linked to thelong hours that many individuals have to devote to work.
Cultural Support
Support from work place or family helps to reduce the inter-role conflict and lead to higher job satisfaction. Carlson andPerrewé (1999) have demonstrated that a supportive cultureat work can reduce the degree of work/family conflictindividual’s experience. A caring culture creates a perceptionin the mind of the employees that they are protected andconsidered. This enhances their dedication towards theorganization and improves productivity. There are policiesthat are formulated that are friendly in nature. These policiesare called “family-friendly benefits” and includeinterventions such as flexible work schedules, child-carereferrals, and leaves of absence (Allen 2001). The family-friendly benefits can be implemented properly in theorganization by an accompanied change in organizationalnorms and values. In a study done on Taiwanese and Britishemployees by Lu and colleagues (2010) found that cultural

SCMS Journal o f Indian Management , July - September 2016 103
A Quarterly Journal
support function as a moderating effect on the relationshipof work-family conflict with job and family satisfaction.Another study by Hsu (2011) found that there is a significantinteraction effect of supervisor support on the relationshipbetween work-family conflict and job satisfaction.
The variables considered for the study related to work andfamily are job involvement, job stress, work hours, jobsatisfaction, family involvement, family stress, family hoursand family satisfaction. Other factors that support the culturalaspects include supervisor support, co-worker support and
The model is created to explain the interference of workdomain factors like job involvement, job stress and workinghours into the family life that impact family satisfaction.Same way the interference of family domain factors like familyinvolvement, family stress and family hours impact jobsatisfaction are depicted in the figure 1. There are somecultural factors that may act as moderators considered inthe study are family-friendly policies; superior support andco-worker support are also demonstrated in the model. Theimpact of each variable towards other is examined andanalysed in this study.
Methodology
The data is collected from the IT employees working in threedifferent companies in Bangalore. The three companies
chosen are well established companies. Care is taken to findthat organization has been established 20 years ago inBangalore. This is to confirm that organization is experiencedenough the problems related to balance of work and familylife among the employees. The questionnaire has beenprepared and handed to the respective HR managers tocollect the data. Three known companies have beenapproached. About 150 questionnaires have beendistributed but only 120 returned. All the respondents havebeen females. Majority of the respondents, sixty eight, werebetween 30 and 40years. Number of employees between 20and 30years, have been 42. There are only 10 employeesbetween 40 and 50 years. In that, majority of employeesbetween the age group between 30 and 40 years have beenmarried with children (fifty). All women employees between
policies that support work-family balance. Balancing thejob and family in the rapid changing environment is difficultfor both male and female employees working in any sector.According to studies of Chandra, understanding andpractising the art of work-life balance are ways ofcounteracting against to circumstances to help to personsfulfil their responsibilities and aspirations to lead to mutualbenefit of the individual, business and society at large.
A model created to understand the relation of variablesexplained in detail is given below:
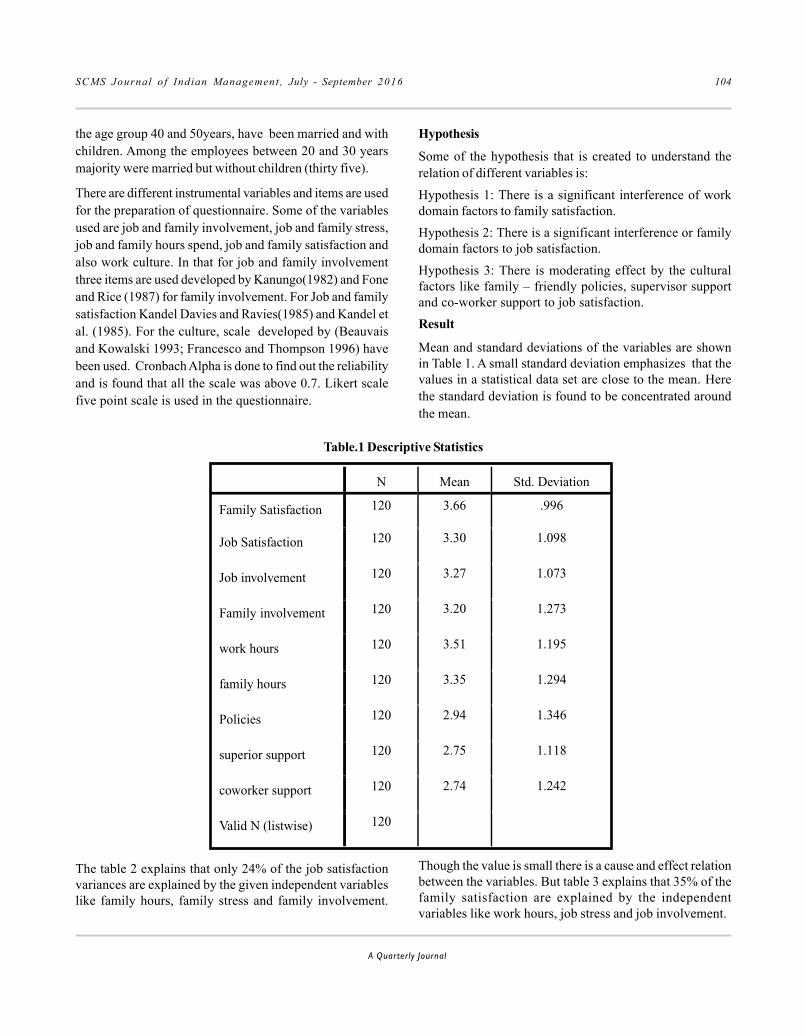
SCMS Journal o f Indian Management , July - September 2016 104
A Quarterly Journal
the age group 40 and 50years, have been married and withchildren. Among the employees between 20 and 30 yearsmajority were married but without children (thirty five).
There are different instrumental variables and items are usedfor the preparation of questionnaire. Some of the variablesused are job and family involvement, job and family stress,job and family hours spend, job and family satisfaction andalso work culture. In that for job and family involvementthree items are used developed by Kanungo(1982) and Foneand Rice (1987) for family involvement. For Job and familysatisfaction Kandel Davies and Ravies(1985) and Kandel etal. (1985). For the culture, scale developed by (Beauvaisand Kowalski 1993; Francesco and Thompson 1996) havebeen used. Cronbach Alpha is done to find out the reliabilityand is found that all the scale was above 0.7. Likert scalefive point scale is used in the questionnaire.
Hypothesis
Some of the hypothesis that is created to understand therelation of different variables is:
Hypothesis 1: There is a significant interference of workdomain factors to family satisfaction.Hypothesis 2: There is a significant interference or familydomain factors to job satisfaction.Hypothesis 3: There is moderating effect by the culturalfactors like family – friendly policies, supervisor supportand co-worker support to job satisfaction.Result
Mean and standard deviations of the variables are shownin Table 1. A small standard deviation emphasizes that thevalues in a statistical data set are close to the mean. Herethe standard deviation is found to be concentrated aroundthe mean.
Table.1 Descriptive Statistics
N Mean Std. Deviation
Family Satisfaction 120 3.66 .996
Job Satisfaction 120 3.30 1.098
Job involvement 120 3.27 1.073
Family involvement 120 3.20 1.273
work hours 120 3.51 1.195
family hours 120 3.35 1.294
Policies 120 2.94 1.346
superior support 120 2.75 1.118
coworker support 120 2.74 1.242
Valid N (listwise) 120
The table 2 explains that only 24% of the job satisfactionvariances are explained by the given independent variableslike family hours, family stress and family involvement.
Though the value is small there is a cause and effect relationbetween the variables. But table 3 explains that 35% of thefamily satisfaction are explained by the independentvariables like work hours, job stress and job involvement.

SCMS Journal o f Indian Management , July - September 2016 105
A Quarterly Journal
Model R R SquareAdjusted R
SquareStd. Error of the
Estimate Durbin-Watson
1 .490a .240 .221 .992 1.027
Table 2: Job Satisfaction - Model Summaryb
a. Predictors: (Constant), Family involvement, family hours, family stressb. Dependent Variable: Job Satisfaction
Table 3: Family Satisfaction - Model Summaryb
Model R R SquareAdjusted R
SquareStd. Error of the
Estimate Durbin-Watson
1 .595a .354 .338 .846 1.238
While compared to both the tables, tables 2 and 3, thestandard error is found to be less in the table 3 that is in thecase of family satisfaction,compared to table 2.The lowerthe value of the standard error, the better it is. Durbin –
a. Predictors: (Constant), Job involvement, job stress , work hours
b. Dependent Variable: Family Satisfaction
Watson Test explains that when values are closer to 2 thenthere is no auto correlation between the errors. So that isalso proved to be good in both the cases.
Table 4: ANOVA for Job Satisfaction
Model Sum of Squares df Mean Square F Sig.
Regression 36.116 3 12.039 12.223 .000a
Residual 114.250 116 .985
Total 150.367 119
Table 5: ANOVA for Family Satisfaction
a. Predictors: (Constant), Family involvement, family hours, family stress
b. Dependent Variable: Job Satisfaction
In tables 4and 5 the F test proves to be significant. HereANOVA does not explain about comparison of the variables
but only explain the significance of model. Same is the casein table 4, F test is significant.
Model Sum of Squares df Mean Square F Sig.
1 Regression 45.599 3 15.200 21.225 .000a
Residual 83.068 116 .716
Total 128.667 119
a. Predictors: (Constant), Job involvement, job stress , work hoursb. Dependent Variable: Family Satisfaction

SCMS Journal o f Indian Management , July - September 2016 106
A Quarterly Journal
Table 6: Coefficients for Job Satisfaction
Model
UnstandardizedCoefficients
StandardizedCoefficients
t Sig.
B Std. Error Beta
1 (Constant) 1.538 .321 4.785 .000
family hours .135 .070 .160 1.927 .056
family stress .226 .069 .284 3.267 .001
Familyinvolvement
.214 .072 .252 2.967 .004
The table shows that there is a significant relation betweenfamily stress and family involvement with job satisfaction
Table 7: Coefficientsfor Family Satisfaction
as the p value is less than 0.05 but the family hours is notsignificant as the value is greater than 0.05.
Model Unstandardized CoefficientsStandardizedCoefficients t Sig.
B Std. Error Beta
1 (Constant) 1.311 .312 4.204 .000
work hours .247 .066 .294 3.753 .000
job stress .100 .062 .123 1.609 .110
Job involvement .380 .072 .407 5.263 .000
a. Dependent Variable: Family Satisfaction
The p value for jobstress is more than 0.05. Other variablesare significantly related to family satisfaction as the p valueis less than 0.05.
From the study it is found that there is an interference ofwork domain factors to family satisfaction and from familydomain to job satisfaction. Thus the Hypotheses 1and 2arepartially significant.
Hypothesis 1: There is a significant interference of workdomain factors to family satisfaction.
Hypothesis 2: There is a significant interference or familydomain factors to job satisfaction.
It is partially significant as family hours and job stress arenot statistically significant.
The moderating effect of the cultural factors is studied usingHayes Regression. The different factors taken intoconsideration include supervisor, co-worker and policies.Through this study it can be estimated the influence of thecultural factors on the job domain factors like jobinvolvement, job stress and job work hours towards jobsatisfaction. The result of the study related to jobsatisfaction and job factors with supervisor as moderatorfactor is shown in the table below.

SCMS Journal o f Indian Management , July - September 2016 107
A Quarterly Journal
Table 8: Moderating Effect of Supervisor Support
Model = 1Y = JS
X = JFM = SU
Sample size120
**************************************************************************
Outcome: J S
Model Summary
R R-sq MSE F df1 df2p
.2505 .0628 .5508 8.1935 3.0000 367.0000.0000
Model coeff se
constant 4.5932 .8903 5.1590 .0000 2.8424 6.3439
SU -.2986 .2313 -1.2909 .1975 -.7536 .1563
JF -.2561 .2244 -1.1413 .2545 -.6973 .1852
int_1 .1114 .0575 1.9393 .0532 -.0016 .2244
Interactions:
int_1 JF X SU
R-square increase due to interaction(s):
R2-chng F df1 df2 p
int_1 .0096 3.7608 1.0000 367.0000 .0532
ULCILLCIpt
The result shows that supervisor support does not act as amoderator as the p value is more than 0.05. This shows thatsupervisor support as a cultural factor will not help toachieve job satisfaction.
Through Hayes Regression considering co-worker supportas a cultural factor is examined to find whether it is acting asa moderator.
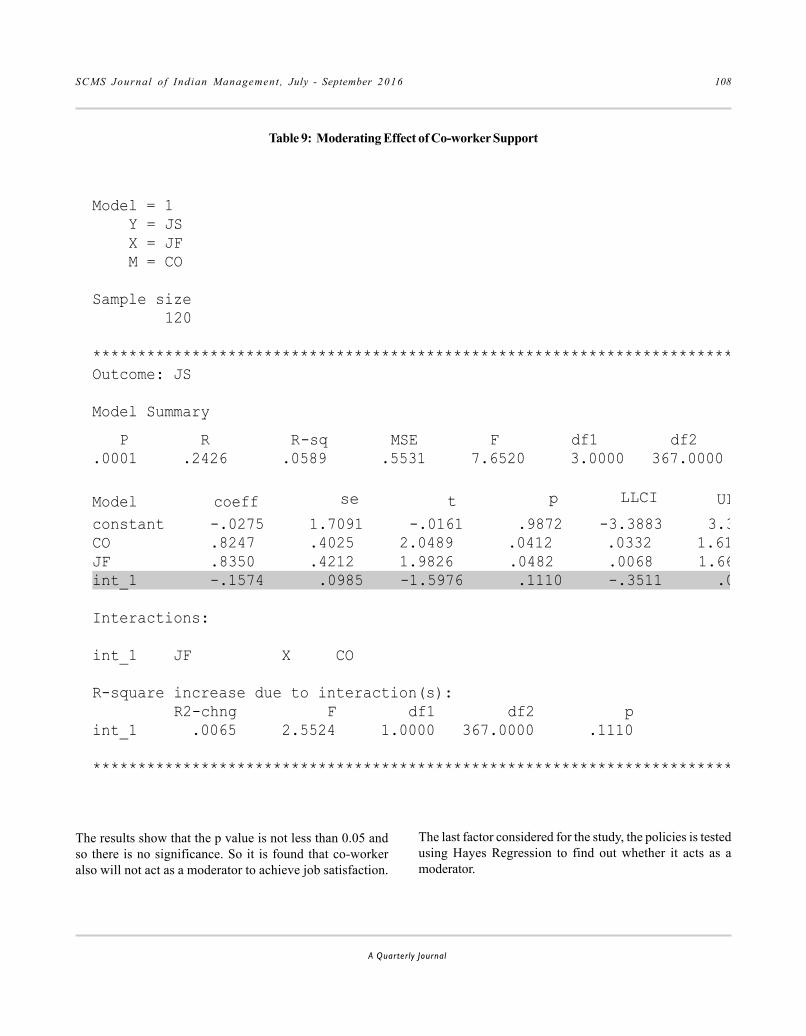
SCMS Journal o f Indian Management , July - September 2016 108
A Quarterly Journal
Table 9: Moderating Effect of Co-worker Support
Model = 1Y = JS
X = JFM = CO
Sample size120
***********************************************************************
Outcome: JS
Model Summary
P R R-sq MSE F df1 df2.0001 .2426 .0589 .5531 7.6520 3.0000 367.0000
Model coeff
constant -.0275 1.7091 -.0161 .9872 -3.3883 3.3CO .8247 .4025 2.0489 .0412 .0332 1.61
JF .8350 .4212 1.9826 .0482 .0068 1.66int_1 -.1574 .0985 -1.5976 .1110 -.3511 .0
Interactions:
int_1 JF X CO
R-square increase due to interaction(s):
R2-chng F df1 df2 pint_1 .0065 2.5524 1.0000 367.0000 .1110
***********************************************************************
ULLLCIptse
The results show that the p value is not less than 0.05 andso there is no significance. So it is found that co-workeralso will not act as a moderator to achieve job satisfaction.
The last factor considered for the study, the policies is testedusing Hayes Regression to find out whether it acts as amoderator.

SCMS Journal o f Indian Management , July - September 2016 109
A Quarterly Journal
Table 10: Moderating Effect of Policies
Model = 1
Y = JS
X = JF
M = PO
Sample size
120
**************************************************************************
Outcome: JS
Model Summary
p R R-sq MSE F df1 df2
.0000.3073 .0944 .5322 12.7540 3.0000 367.0000
Model
coeff se t p LLCI ULCI
constant 5.7267 .7706 7.4312 .0000 4.2113 7.2422
PO -.2888 .1829 -1.5793 .1151 -.6484 .0708
JF -1.1406 .3614 -3.1560 .0017 -1.8512 -.4299
int_1 .2311 .0876 2.6391 .0087 .0589 .4032
Interactions:
int_1 JF X PO
R-square increase due to interaction(s):
R2-chng F df1 df2 p
int_1 .0172 6.9646 1.0000 367.0000 .0087
*************************************************************************
The above table shows that the p value is less than 0.05 andcan be interpreted that there is a significant relation. In thisstudy it is clear that policies of the company act as amoderator to cushion the effect of job domain factors tosatisfaction. From this Hypothesis 3 is partially significant.
Hypothesis 3: There is moderating effect by theculturalfactors like family – friendly policies, superior supportand co-worker support to job satisfaction.Among the three cultural factors only one cultural factor isstatistically significant while other two, supervisor supportand co-worker support are not significant.

SCMS Journal o f Indian Management , July - September 2016 110
A Quarterly Journal
Discussion
The study related to the interference of work into family andfamily into work affecting the satisfaction of family and jobare studied in detail. The study tries to find out whethercultural factors have any role to reduce the impact of jobdomain factors like job involvement, job stress and workhours. The study is conducted in IT companies whereparticipation of female employees is more. Only womenemployees are requested to participate for the study. Thestudy shows a positive relation between work domain factorslike family involvement and family stress to job satisfaction.Also there is a positive relation between family domain factorslike job hours and job involvement with family satisfaction.The significant relation is understood through theregression. Both the factors related to work like workinvolvement and working hours, in excess will always disturbthe family satisfaction. Carrying work to home, attendingfrequent official calls during dinner or while attending familyget-together may irritate other family members and may inturn upset the employee’s mental peace. In the same way,frequent phone calls from home or attending more household chores during the office hours would lose concentrationon the job. The R² estimates the functional relationshipbetween dependent and independent variables.
The culture of the organization can act as moderators. Forthis study some of the cultural factors considered are policies,supervisor support and co-worker support. According toClark (2001),temporal flexibility is the ability to havediscretion in one’s work schedule. Bailyn defined operationalflexibility as control over the conditions of work. Thisincludes having the autonomy to decide how the work is tobe done without unnecessary monitoring or restrictions.These flexibilities can be brought into the organizationthrough policies. So in this study supervisor support andco-worker is considered separately and family-friendlybenefits are under policies.
Without supervisors to encourage employees to use leavepolicies and flexible work policies, and to judge employeeperformance on the basis of output and not just “face time,”a policy-based strategy to reinforce a family-friendly culturewill have limited effect. Studies of Repetti claim jobsatisfaction and productivity at work improves withsupportive supervision.
Co-worker support is also considered as one of the importantfactor for adjusting the work and family life (Clark, 2001). In
a longitudinal study, O’Driscoll and colleagues (2004) foundthat support from work colleagues moderated therelationship of work-to-family and family-to-work conflictwith job satisfaction and family satisfaction.
But in this study, using Hayes Regression it is found that pvalue for both supervisor support and co-worker supportare not significant. For supervisor support the p value is0.0532 and that of co-workers is 0.1110. Both were greaterthan 0.05. But the p value of policies is 0.0087. This is lessthan 0.05. So supervisor support and co-worker support arenot considered as the important factors that can beconsidered as moderators for job satisfaction in theorganizations. The study tries to stress the point thatworking environment can be made effective by the policiesof the organization.
Implication
Today in this competitive world, increasing the morale ofthe employees, attract and retain a dedicated workforce isnot easy. For the existence and sustained growth of thecompany understanding the requirements and difficultiesof their employees are important. A study of this nature willhelp to solve some of the uncertainties that company facesin today’s turbulent work environment. Each organizationhas its own way of functioning. The gender of theemployees, nature of work, the kind of work pressure andthe way it is handled, flexibility etc vary from company tocompany. This study was concentrated on three ITcompanies to understand the work related issues and familyrelated issues and the interference of each into otherdomains. The work involvement and hours spend in thecompany can badly influence the satisfaction of the familylife. Too much of work load that extends beyond the workinghours may be carried back home may create unwantedproblems which may reduce the interest in the family aspects.Even too much family interferences like working couple witha small child or elderly parents without relatives supportmay be forced to find time to solve such issues. This maybuild too much pressure within the mind of employees thatleads to less interest in job. These issues can be addressedusing relevant policies of the organization. Study revealsthat supervisor support and co-worker support vary fromindividual to individual and the impact of it cannot be judgeduniformly. But well-structured and implemented policies inthe organization can be utilised and be of benefit to theemployees in the organization.

SCMS Journal o f Indian Management , July - September 2016 111
A Quarterly Journal
Previously employees were looking for paid vacations,pension plan, health insurance etc for balancing happinessbetween job and family. But now as both husband and wifeare working in the organizations, they are interested morefor flexible working time, child or elder care, work from homeetc that can balance work and family life. It is found thatsome talented, efficient female employees even leave thejob to solve these issues. Loosing such talented employeesis a loss to the organization. Well formulated companypolicies may help employees to balance work and familyissues. Policies have to be revised every now and thendepending on the changing scenario of the environment. Ithas to be audited so that it can solve the issues of theemployees. Well planned and structured policies can takecare of the issues that employees face and balancing act ofwork and family life will become smooth and comfortable.Supervisor and co-worker support can contribute to an extentto balance but only policies can really bring about the act ofbalancing work and family life without much interferencefrom one domain to another.
Reference
Tammy, Allen D. (2001) “Family-Supportive WorkEnvironments: The Role of Organizational Perceptions,”Journal of Vocational Behavior 58, 414–435 (2001)
Berg, P., A. L. Kalleberg, and E. Appelbaum (2003).“Balancing Work and Family: The Role of High-CommitmentEnvironments. Industrial Relations,” A Journal of Economyand Society, 42: 168–188
Carlson, D. and P. Perrewé (1999). “The role of social supportin the stressor-strain relationship: an examination of work-family conflict.” Journal of Management, 25: 4, 513-540.
Clark. (2001). “Work Cultures and Work/Family Balance.”Journal of Vocational Behaviour , 58, 348-365.
Friedman, D. E., and E. Galinsky (1998). “Work and familyissues: A legitimate business concern. In S. Zedeck (Ed.),”San Francisco: Jossey–Bass. Work, families, andorganizations (pp. 168–207).
Frone, M. R., M. Russell, and M. L. Cooper (1992a).“Antecedents and outcomes of work-family conûict: Testinga model of the work-family interface.” Journal of AppliedPsychology, 77,65–78.
Galinsky, E., and P. J. Stein (1990). “The impact of humanresource policies on employees.” Journal of Family Issues,11, 368–383.
GrandeyA. A., B.L. Cordeiro, and A.C. Crouter (2005). “Alongitudinal and multi-source test of the work-family conflictand job satisfaction relationship.” Journal of Occupationaland Organizational Psychology, 78(3), 305-323.
Greenhaus, J., and N Beutell (1985).” Sources of conflictbetween work and family roles.” Academy of ManagementReview, 10(1), 76-88.
Gilbert, L. A.,M. Hallett and N. S. Eldridge (1994) “ Genderand dual-career families: Implications and applications forthe career counseling of women. In W. B. Walsh & S. H.Osipow (Eds.),” Hillsdale, NJ: Erlbaum Associates. CareerCounseling for Women (pp. 135–164).
Hsu, Y.R. (2011). “Work-family conflict and job satisfactionin stress working environments: The moderating roles ofperceived supervisor support and internal locus of control.”International Journal of Manpower, 32(2), 233-248.
Locke E (1969). “What is Job Satisfaction?.” OrganizationalBehavior and Human Performance, 4(2), 309-336.
O’Driscoll, M.P., P.Brough, and T.J. Kalliath (2004). “Work/family conflict, psychological well-being, satisfaction andsocial support: A longitudinal study in New Zealand.”Equality, Diversity, and Inclusion: An InternationalJournal, 23(1), 36-56.
******

SCMS Journal o f Indian Management , July - September 2016 112
A Quarterly Journal
Work-Life Balance:Assessing Perceptions
Nandini Borah and Nehal Bagla
Abstract
he evolving intricacies of modern organizationalwork as well as personal aspects of life offer greatchallenges to the modern teacher. Teachers
participate in diverse and unbounded work and life roles;which creates challenges when they try to balance theresponsibilities and pressure associated with each role. Withintensifying work pressure a teacher finds himself or herselfjuggling through a myriad of activities. Conflictingresponsibilities, multiple roles, family and job demands havedisturbed the existing balance between a teacher’s work lifeand family life. These imbalances in work-life relationshipscan lead to severe health problems and hamper jobperformance as well. Enlightened institutions acknowledgethe fact that work-life balance of the teachers’ is critical totheir success. However, improving the quality of work-lifeand maintaining a positive work-life balance remains a toughchallenge.
For those who seek out to sustain a fine balance betweentheir work roles and family roles work-life balance remainsas an issue of concern (Guest, 2002). The profession ofteaching is a demanding one (Crutchfield, Ritz, and Burris,2013) and therefore, work-life balance for teaching
Much research has been done on Work-Life Balance, but little work has been done to probe the work-life balance of
teachers in technical institutions. The purpose of the study was to describe the teachers’ perceived work-life balance.
Additionally, the study sought to describe the relationship between perceived work-life balance and job demands and
family demands. The results of the study showed that perceived work-life balance is negatively related to greater
perceived family demands as well as greater perceived job demands. The paper also discusses the implications of the
findings.
Keywords: work-life balance, family characteristics, job characteristics, teacher
Abstract
T
Nandini BorahAssistant ProfessorRoyal School of BusinessRoyal Group of InstitutionsOpp. TirupatiBalaji TempleBetkuchi, Guwahati- 781035e-mail id: [email protected]
Nehal BaglaStudent MBA 4th semesterRoyal School of BusinessRoyal Group of InstitutionsOpp. Tirupati Balaji TempleBetkuchi, Guwahati- 781035e-mail id: [email protected]

SCMS Journal o f Indian Management , July - September 2016 113
A Quarterly Journal
professional has become one of the supreme challenge intoday’s world. Teachers’ work load not only demand theirtime in the institution but it also extends beyond theinstitutional boundaries- to their homes. Apart from teachingand maintaining student records, which are the primary workactivities, a teacher is also expected to attend to variousactivities related to the institution which increases theirworkload. Harmonizing work and family roles has become achallenging task for teachers as they are required to spendexcessive hours at work, leaving little time to devote to otherlife roles (Cooper and Nelson, 1981; Lawver, 2007; Murray,Flowers, Croom and Wilson, 2011).
Statement of the problem
Maintaining a balance between one’s personal andprofessional life has become an important matter in thesociety. Employees struggle to juggle between their workand non-work duties and responsibilities. The expressionof work-life balance was first used in the mid-1970s todescribe the balance between one’s work and personal life.Kanter (1977) opined about the “myth of separate world”and called attention to the reality that work and home areinescapably linked. Work-life balance is one construct whichexplains the relationship between the institutional andcultural time and space of non-work and work in societieswhere income plays a major role (Gregory and Milner, 2009).In the past few years there has been an increasing interestin work-life balance and many organizations have takenproactive steps to maintain their employees work and lifebalance. However, very little research has been done to probework-life balance amongst teachers.
This study makes an empirical investigation to explain theperceived work-life balance amongst teachers of technicalinstitutions in Guwahati region of Assam. The study furtherattempts to explain teachers’ perceived job demands andfamily demands and its relationship with their perceivedlevel of balance between work and life roles.
Literature review
Work-life balance
The term work-life balance gained popularity in researchand policy matters, facilitating the understanding of non-work concerns with employment (Gregory and Milner, 2009).Despite the popularity of the construct, most of the majorreviews of work-life balance articles either do not mentionwork- life balance per se, or when it is mentioned it is not
explicitly defined (Greenhaus et al., 2003). There has been agreat debate over a formal definition of work life balance.Furthermore, in studies where work-life balance or relatedconstructs are explored, researchers seem to have usedseveral different approaches to operationally define andmeasure the construct (Greenhaus et al., 2003; Potgieter &Barnard, 2010). For the purpose of this study the definitionproposed by Kalliath and Brough (2008) was adopted.According to Kalliath and Brough (2008) “work-life balanceis the individual perception that work and non-work activitiesare compatible and promote growth in accordance with anindividual’s current life priorities.” It is important to notefrom this definition that work-life balance is aboutindividuals’ perception as they fulfill multiple and oftencompeting roles.
Traditionally work-life balance has been viewed throughthe lens of women employment. However, the horizons ofwork-life balance have widened to include men’s andwomen’s negotiation of the demands from paid employmentand domestic life. Although rates of women participation inthe workforce have increased considerably, the organizationof labour in the workplace and family has not changedcommensurately (Brewster and Padavic, 2000; Gerson, 1998).Furthermore, women are still primarily held responsible forhome and child care (Bond, Galinksy and Swanberg, 1998)and employers continue to orient their expectations basedon a male model that presumes the presence of a nonworkingspouse (Acker, 1990; Gerson, 1998).
Research on work-life balance has found that multiple rolecommitments lead to mental and physical exhaustion leadingto increased stress (Goode 1960; Pearlin, 1989; Mui, 1992)whereas favorable balance between work and family lifereduced intention to leave through increased job satisfaction(Forsyth and Polzer-Debruyne, 2007; Bilal, Zia-ur-Rahman,and Raza, 2010). Although most of the literature is focusedon negative spillover, there are evidences of positiveconsequences such as increasing economic resources,improving self-esteem, and enhancing social integration(Barnett, 1999; Baruch and Barnett, 1986; Crosby, 1991;Moen, Robinson, and Dempster-McClain, 1995).
Research suggests that two groups of factors namely, familycharacteristics and job characteristics, relate to how menand women manage multiple role demands from work andfamily. Both these factors are described in the followingsection.

SCMS Journal o f Indian Management , July - September 2016 114
A Quarterly Journal
Family characteristics
Family characteristics play an important role on employeewell-being. Several research studies have indicated thatfamily characteristics have an important impact on well-being,role satisfaction and perceptions of balance (Keene andQuadango, 2004). Child care responsibility and familystructure have been found to have significant impact onsatisfaction (Hochschild, 1997; Greif, DeMaris and Hood,1993; Saltzstein, Ting, and Hall Saltzstein, 2001). It has beenfound that family involvement has a negative impact onsatisfaction with work-family balance. Moreover, familyfactors and life stage are important determinants of balance(White, 1999).
Job characteristics
Job characteristics seem to be an important predictor ofperceived work-life balance because the work characteristicsdetermine the employee’s freedom to negotiate betweenconflicting demands. However, research has shown mixedresults with respect to job characteristics. Glass andCamarigg (1992) have demonstrated that higher-leveloccupations are more accommodating to family life. Milkieand Peltola (1999) found that work demands influence rolebalance whereas Hecht (2001)has established that greaterscheduling flexibility at work is positively associated withwell-being. On the contrary, Moen and Yu (1999) have foundthat autonomy and scheduling flexibility are not associatedwith overall feelings of work-life satisfaction.
Objectives suggest the following: to determine the effect ofgender on perception of work-life balance. And to study theimpact of family and job characteristics on perceived worklife balance.
Hypotheses
To determine the effect of gender on perceptions of work-life balance, following hypothesis is formulated:
H1: Gender differences exist in levels of perceived work-life balance.
To fulfill the second objective the following hypothesis wasformulated:
H2: Greater family demands will negatively relate toperceived balance.
H3: Greater job demands will negatively relate to perceivedbalance.
Methodology
A self-report questionnaire was designed and completedby teaching professionals employed in technical institutionsin Guwahati region of Assam. Data was gathered using ahardcopy survey. Employees were informed about thepurpose of the study and its confidentiality. The sampleconsisted of randomly selected 250 teaching professionalsfrom seven technical institutions in Guwahati. A total of 227usable questionnaires were returned (90% response rate).The final sample consisted of 56% men and 44% women;the average age was 36 years; and the average tenure was 5years and 6 months. Perceived work-life balance wasmeasured through 15-items adapted from an instrumentreported by Fisher-McAuley, Stanton, Jolton, and Gavin(2003). Each item was presented in the form of a statementwith a five point Likert scale from 1 (strongly agree) to 5(strongly disagree). Family demands and job demands weremeasured by developing five items each. Family demandsrelated to the amount of time and energy sought by thefamily and job demands related to the working hours andwork activities and work spillover.
Analysis and findings
In order to determine the reliability of the instrument usedfor the study, a reliability analysis is conducted. Reliabilityis the degree to which an assessment tool produces stableand consistent results. It is also the overall consistency ofa measure. A measure is said to be highly reliable if itproduces similar results under consistent conditions.Cronbach’s alpha is the most frequently used measure ofreliability.
Reliability Statistics
Cronbach's Alpha N of Items
.731 25
Table 1. Reliability statistics for the 25-item scale

SCMS Journal o f Indian Management , July - September 2016 115
A Quarterly Journal
From the table (Table 1) it can be seen that the Cronbach’salpha score for the 25 items scale is found to be 0.731. Areliability coefficient of 0.7 or higher is considered acceptablein most social science research situations. The Cronbach’salpha score suggests that the items have high internalconsistency and therefore, it can be concluded that the scaleused in the study is internally consistent and reliable.
Gender differences in work-life balance
Hypothesis 1 deals with the differences in the perceivedwork-life balance with respect to gender. An independentsample t-test has been done to find out if there exists anydifference in the perceived work-life balance with respect togender.
Group Statistics
Table 2. Group statistics
Gender N Mean Std. Deviation Std. Error Mean
Work-lifebalance
Men 127 3.9921 .97993 .08695
Women 100 1.8800 1.11265 .11126
Levene's Test forEquality ofVariances
t-test for Equality of Means
F Sig. T df Sig.(2-
tailed)
MeanDifference
Std. ErrorDifference
95% ConfidenceInterval of the
Difference
Lower Upper
Work-lifebalance
Equalvariancesassumed
5.502 .020 15.185 225 .000 2.11213 .13910 1.83803 2.38622
Equalvariancesnotassumed
14.957 198.640 .000 2.11213 .14121 1.83366 2.39059
Independent Samples Test
The result of the independent sample t-test shows thatsignificance against the F-value of 5.502 is 0.020 which isless than 0.05. Therefore, equal variances are assumed forthe sample. The t-value against equal variances assumed is15.185 and significance against the t-value is 0.000 which isless than 0.05. Therefore, the null hypothesis is rejected.This implies that there is a difference between the meanscores of perceived work-life balance between male and
Table 3. Independent sample t-test
female employees. It is evident from the group statisticstable that the mean perceived work-life balance for men is3.9921 and for women is 1.8800. Women, thus, tend toperceive their work-life balance negatively as compared tomen.
Family demands and job demands: impact on work-lifebalance

SCMS Journal o f Indian Management , July - September 2016 116
A Quarterly Journal
To assess the impact of family demands and job demandson work-life balance multiple regression analysis is used.Forthe multiple regression tests, the independent or predictorvariables are: family characteristics and job characteristics
and the dependent or criterion variable is perceived worklife balance.
The mathematical model for the multiple regression analysisis as follows:
where,
Y = Perceived work life balance
X1 = Family demands
X2 = Job demands
α = Constants
β1, β2 =Coefficients
The results of the multiple regression tests are displayed below:
Y = α + β1x1 + β2 x2
Mean Std. Deviation N
Work-life balance 3.0617 1.47717 227
Family demands 2.3921 1.53154 227
Job demands 2.6740 1.57114 227
Correlations
Table 4. Descriptive statisticsDescriptive Statistics
Work-life balance Family demands Job demands
Pearson Correlation
Work-life balance 1.000 -.701 -.655
Family demands -.701 1.000 .474
Job demands -.655 .474 1.000
Sig. (1-tailed)Work-life balance . .000 .000Family demands .000 . .000Job demands .000 .000 .
N
Work-life balance 227 227 227
Family demands 227 227 227
Job demands 227 227 227
Table 5. Correlations table

SCMS Journal o f Indian Management , July - September 2016 117
A Quarterly Journal
The correlations table shows that the Pearson correlationcoefficient, r, is –0.701, for work-life balance and familydemands, and that is statistically significant (p < 0.05).Similarly, the Pearson correlation coefficient, r, is –0.655, forwork-life balance and job demands, and that is also
Model Summary
statistically significant (p < 0.05). This basically implies thatgreater family and job demands negatively relates to work-life balance. Increase in family and job demands negativelyimpacts the perceived balance of work and life.
a. Predictors: (Constant), Job demands, Family demands
Table 6. Model summary of multiple regression analysis
Model R R Square Adjusted R Square Std. Error of the Estimate
1 .791a .626 .622 .90799
ANOVAa
Model Sum of Squares df Mean Square F Sig.
1
Regression 308.462 2 154.231 187.074 .000b
Residual 184.674 224 .824
Total 493.137 226
Table 7. ANOVA table of multiple regression analysis
Table 8. Coefficients table of multiple regression analysis
The overall predictability of the model is shown by theadjusted R2 value of 0.622 which indicates that 62% of thefactors (family demands and job demands) are responsiblefor the perceived work life balance of teachers.
From the analysis of variance (ANOVA) test it can be seenthat the significance value of 0.00 is less than 0.05 whichimplies that there is a significant correlation between thedependent and independent variables, that is, perceivedlevel of work-life balance with respect to differentdimensions of family demands and job demands.
Coefficient analysis shows that the relationship betweenthe dependent and independent variables according to thecalculated significance value, the factors that is familydemands and job demands have a significant relationshipwith the perceived work life balance as the calculatedsignificance values are less than 0.05.
This implies that variation in perceived level of work-lifebalance can be explained with the knowledge of the family
and job demands. The R2 value of 0.622 indicates thatapproximately 62% of variance in perceived level of balancecan be accounted for by the knowledge of family demandsand job demands.
Conclusion and discussion
The results of this study describe important characteristicsand descriptions regarding the sample. Although the resultsof this research are not generalizable to the entire teachingfraternity, the characteristics and descriptions might beinformative in handling issues related to work-life balanceof teachers. In this study nearly half of the respondentsconsisted of female respondents which clearly show theincreasing number of female teachers in the academicprofession. This is indicative of the increasing number offemale teachers entering the profession. Moreover, it hasalso been found that perceptions of work-life balance differsignificantly among men and women teachers. This isconsistent with the fact that women are still primarily held

SCMS Journal o f Indian Management , July - September 2016 118
A Quarterly Journal
responsible for home and child care (Bond, Galinksy andSwanberg, 1998) and organization of labour in the workplaceand family has not changed proportionately to accommodatethe women worker (Brewster and Padavic, 2000; Gerson,1998). The study has also revealed that family demands andjob demands are important predictors of perceived work-lifebalance. Both family demands and job demands account for62% of variance in perceived work-life balance of teachers.Teachers who have to devote long hours at work and whosework spillover to their home resulting in an intrusion intotheir family life are more susceptible to feeling that they areunable to maintain balance in their lives. Moreover, greaterfamily demands also make teachers vulnerable to theperceptions that there is an imbalance between their worklife and personal life.
Most educational institutions continue to operate on thebasis of the traditional beliefs with respect to gender.Educational institutions have failed to recognize or ratherignore women’s increased labour force participation. Besidesthis, institutions are yet to realize the changing nature ofduties and responsibilities of the traditional Indian maleteacher who has a working women counterpart. Additionally,there has been a change in the nature of duties andresponsibilities of a teacher. Teaching no longer remains atraditional nine to five job and a teacher apart from teachingis expected to accomplish a lot of additional tasks related tothe institution. These changes in the work environment andwork practices have a tremendous effect in the life of theteachers. It is high time that educational institutions realizethe mounting pressure of work as well as the increasingfamily demands. There is a need for designing andimplementing work-life balance policies and practices ineducational institutions as well. The corporate world, to agreat extent, has already adopted employee friendly stepstowards improving the work-life balance of their employees.Now it is the turn of educational institutions to churn outwork-life balance policies for their employees.
References
Acker, J. (1990). “Hierarchies, jobs, bodies: A theory ofgendered organizations.”Gender and Society, 4(2),139-158.
Barnett, R. C. (1999). “A new work-life model for the twenty-first century.”The Annals of the American Academy ofPolitical and Social Science, 562(1), 143-158.
Baruch, G. K., and R.C Barnett(1986). “Role quality, multiplerole involvement, and psychological well-being inmidlife women.”Journal of Personality and SocialPsychology, 51(3), 578.
Bilal, Muhammad, Zia-ur-Rahman, MuhammadandRaza,Irfan (2010), “Impact of FamilyFriendly Policies onEmployees Job Satisfaction and Turnover Intention: Astudyon work-life balance at workplace,”Interdisciplinary Journal of Contemporary Researchin Business,2 (7): 378 – 95
Brewster, K. L., and I.Padavic (2000). “Change in genderideology, 1977–1996: The contributions of intracohortchange and population turnover.”Journal of Marriageand Family, 62(2), 477-487.
Cooper, E. L., and C.L. Nelson (1981). “Professionalism-Spouse and House.”Agricultural EducationMagazine, 54(1), 17-18.
Crosby, F. J. (1993). “Juggling: The unexpected advantagesof balancing career and home for women and theirfamilies.”Touchstone.
Crutchfield, N., Ritz, R., and S. Burris (2013). “Whyagricultural educators remain in theclassroom.”Journal of Agricultural Education, 54(2),1-14.
Fisher-McAuley, G., J. Stanton, J. Jolton and J. Gavin (2003,April).”Modeling the relationship between work lifebalance and organisational outcomes. In AnnualConference of the Society for Industrial-Organisational Psychology. Orlando (pp. 1-26).
Forsyth, S. and A.Polzer Debruyne (2007). “Theorganisational pay offs for perceived work—lifebalance support.”Asia Pacific Journal of HumanResources, 45(1), 113-123.
Galinsky, E., T. Bond and D.E. Friedman (1993). “Nationalstudy of the changing workforce.” New York: Familiesand Work Institute.
Gerson, K. (1998). “Gender and the future of the family:Implications for the postindustrialworkplace.”Challenges for work and family in thetwenty-first century, 11-21.

SCMS Journal o f Indian Management , July - September 2016 119
A Quarterly Journal
Glass, J., and V.Camarigg(1992). “Gender, parenthood, andjob-family compatibility.” American Journal ofSociology, 131-151.
Goode, W. J. (1960). “A theory of role strain.”Americansociological review, 483-496.
Greenhaus, J. H., K.M Collins, and J.D. Shaw (2003). “Therelation between work–family balance and quality oflife.”Journal of vocational behavior, 63(3), 510-531.
Greif, G. L., A. DeMaris and J.C. Hood (1993). “Balancingwork and single fatherhood.”Men, Work, and Family,176-194.
Gregory, A., and S. Milner (2009). “ Editorial: work–lifebalance: a matter of choice?.” Gender, Work andOrganization, 16(1), 1-13.
Guest, D. E. (2002). “Perspectives on the study of work-lifebalance.” Social Science Information, 41(2), 255-279.
Hecht, L. M. (2001). “Role conflict and role overload:Different concepts, different consequences.”Sociological Inquiry, 71(1), 111-121.
Hochschild, A. R. (1997). “When work becomes home andhome becomes work.”California Management Review,39(4), 79-97.
Hochschild, A. (1997). “The time bind.”WorkingUSA, 1(2),21-29.
Kalliath, T., and P.Brough, P. (2008). “Work–life balance: Areview of the meaning of the balance construct.”Journal of Management & Organization, 14(03), 323-327.
Kanter, R. M. (1977). Work and Family in the United States:A Critical Review and Agenda for Research and Policy.Russell Sage Foundation.
Keene, J. R., and J.Quadagno (2004). “Predictors of perceivedwork-family balance: Gender difference or gendersimilarity?”Sociological Perspectives, 47(1), 1-23.
Lawver, R. G. (2007). “Work and family life balance amongsecondary agricultural educators.”
Milkie, M. A., and P. Peltola (1999). “Playing all the roles:Gender and the work-family balancing act.”Journal ofMarriage and the Family, 476-490.
Moen, P., J. Robison, and Dempster-McClain, D. (1995).“Caregiving and women’s well-being: A life courseapproach.”Journal of Health and Social Behavior, 259-273.
Moen, P., and Y. Yu (1999). “Having it all: Overall work/lifesuccess in two-earner families.”Research in Sociologyof Work, 109-140.
Mui, A. C. (1992). “Caregiver strain among black and whitedaughter caregivers: A role theory perspective.”TheGerontologist, 32(2), 203-212.
Murray, K.,J. Flowers, B.Croom, and B. Wilson (2011). “TheAgricultural Teacher’s Struggle for Balance betweenCareer and Family.” Journal of Agricultural Education,52(2), 107-117.
Pearlin, L. I. (1989). “The sociological study ofstress.”Journal of health and social behavior, 241-256.
Potgieter, S. C., and A. Barnard (2010). “The construction ofwork-life balance: the experience of black employees ina call-centre environment.” SA Journal of IndustrialPsychology, 36(1), 1-8.
Saltzstein, A. L.,Y. Ting and G.H.Saltzstein (2001). “Workfamily balance and job satisfaction: The impact of familyfriendly policies on attitudes of federal governmentemployees.”Public administration review, 61(4), 452-467.
White, J. M. (1999). “Work-family stage and satisfactionwith work-family balance.”Journal of ComparativeFamily Studies, 163-175.
******

SCMS Journal o f Indian Management , July - September 2016 120
A Quarterly Journal
n order to survive and gain competitive advantage inthis rapid changing environment, organisations attributemore importance to their work force. The recent buzz
among the industry, consulting firms and academia still withvast scope for research is the concept of employeeengagement. There is an increasing awareness that employeeengagement is pivotal to successful commercial and businessperformance. An engaged workforce will always providecompetitive advantage over rivals. It is “engaged” factorwhich differentiates effective work to most effective work.Engaged employees are the ‘backbone of good workingenvironments where people are industrious, ethical andaccountable’(Levinson, 2007a; Cleland et al, 2008).Theemployee engagement concept initiator, Kahn (1990) definedengagement as “harnessing of organization members’ selvesto their work roles; in engagement, people employ andexpress themselves physically, cognitively, and emotionallyduring role performances” (p. 694). In short, Kahn assertsengagement as psychological presence at work (Kahn, 1990,1992). Rothbard (2001, p. 656) also defines engagement aspsychological presence but goes further to state that it
Employee Engagement:Hotel Industry
Venkateswarlu Karumuri
Abstract
Venkateswarlu KarumuriAssistant ProfessorDepartment of Management StudiesGayatri Vidya Parishad College for Degree andPG coursesVisakhapatnamAndhra Pradesh-530045Mobile No: +91-9704662676Mail ID: [email protected]
The main objective of the study is to identify different employee engagement practices being followed in Indian hotel
industry. The opinions of the employees towards the engagement practices are taken on Likert five point scale with
the help of a structured questionnaire designed and distributed to the employees working in leading hotels in
Visakhapatnam, Andhra Pradesh. A statistical tool, Factor Analysis was used to measure the preferences of the
employees related to engagement in their organisations. The results may help the industry for effective implementation
of engagement practices for optimum results.
Keywords: engagement, employee engagement,factor analysis, hotel industry, employee motivation
JEL Classification: M10, M12, M30, M31.
Abstract
I

SCMS Journal o f Indian Management , July - September 2016 121
A Quarterly Journal
involves two critical components: attention and absorption.Attention refers to “cognitive availability and the amountof time one spends thinking about a role” while absorption“means being engrossed in a role and refers to the intensityof one’s focus on a role. Maslach, Schaufeli and Leiter (2001,p. 417) refer to engagement, as a psychological andemotional state, a ‘persistent, positive affective motivationalstate of fulfilment’. Harter et al., (2002), defined employeeengagement as “the individual’s involvement andsatisfaction as well as enthusiasm for work.” According toInternational Survey Research (2003), employee engagementis defined as the practice by which a firm increases thecommitment and contribution of its employees or humanresources to achieve greater business outcomes. TheInternational Survey Research resolved that employeeengagement is a mixture of an employee’s cognitive,behavioural and affective dedication to his or herorganization. The concept of employee engagement hasbecome famous amongst organisational practitioners(Robinson et al., 2004, Saks, 2006, Roberts 2006, Koyuncuet al., 2006, Ellis and Sorensen, 2007, Kular et al., 2008, Maceyand Schneider, 2008; Halbesleben and Wheeler, 2008, VanRooy et al., 2011). According to Robinson et al., engagementis a” A positive attitude held by the employee towards theorganisation and its values. An engaged employee is awareof business context and works with colleagues to improveperformance within the job for the benefit of the organisation.The organisation must work to develop and nurtureengagement which requires a two way relationship betweenemployer and employee.” According to Saks (2006), thegood way for employees to repay their organization isthrough their level of engagement. Employees will choosewhether or not to engage themselves in relation to theresources they get from their organization. He suggests thatemployee engagement is not an attitude, but the degree towhich an individual is attentive and absorbed in their workenvironment. Right Management (2006) defines trueengagement as every person in the organisation beingcommitted to the success of the business strategy. It goesbeyond more than just simple job satisfaction andincorporates aspects of commitment, pride, and advocacyabout the organisation’s products and brand. Towers Perrinbelieves that engagement involves both emotional andrational factors relating to work and the overall workexperience. The emotional factors tie to people’s personalsatisfaction and the sense of inspiration and affirmationthey get from their work and from being part of theirorganisation, or instance, having a strong sense of personal
accomplishment from one’s job. The rational factors, bycontrast, generally relate to the relationship between theindividual and the broader corporation.
The CIPD Annual Survey report (2006c) defines engagementin terms of three dimensions of employee engagement:Emotional engagement: being very involved emotionally inone’s work; Cognitive engagement: focusing very hardwhilst at work; and Physical engagement: being willing to‘go the extra mile’ for the employer.
Employee engagement is the level of enthusiasm anddedication a worker feels towards his or her job. Employeeengagement, according to Tripathy (2007) refers to the levelof commitment and involvement an employee has towardsthe organisation and values. It is also said to be a statewherein employees are emotionally attached, in addition tointellectually committed to the job (Hewitt Associates, 2004).Sangeetha (2006), says that employee engagement involvesemployee understanding of the aims of a business and theirindividual contribution, a desire to perform well in a jobthey consider interesting, a belief that the employer caresabout their needs, and finally, a belief that they are supported.
Employee engagement is the level of emotional andintellectual commitment one has to their organization as wellas the willingness of employees to “go the extra mile” tohelp their company to achieve its objectives. Employeescan increase the probability of higher profitability, betterservices, customer loyalty, safety and sales by employingdiscretionary efforts in their work roles they are engaged(Kruse, 2012). When an employee cares more, there is thetendency to get involved and make greater contributions tothe company, thereby resulting in organizational citizenship,commitment and intent to stay; reducing employee turnover(Kruse, 2012). Employee engagement encompasses manytraditional concepts such as job satisfaction, organisationalcommitment, employee turnover and retention, employeemotivation as well as emerging concepts in the field such asproactivity, adaptivity and flow.
The hotel industry plays a vital role in sustainabledevelopment. Hotel groups are found all over the globe, indowntown areas and suburbs, in metropolitan and in ruralareas, in mountains and along coasts, from the most modernregions to the most remote. This infinite variety of locationsmakes the hotel sector a direct and privileged witness tomajor world developments, such as economic development,fight against diseases and illiteracy. The Indian hotel

SCMS Journal o f Indian Management , July - September 2016 122
A Quarterly Journal
industry is an oligopoly, with a few key players grapplingfor control. At present India is witnessing the entry of manyhotel giants to the country. This is further intensifying thecompetition among the players. The organisations shouldfocus on delivering customer value with ultimate satisfactionthat is possible only with engaging the internal customersto optimum extent. The present study focuses on theempirical study of employee engagement practices that areimplemented in hotel industry with reference toVisakhapatnam city, India.
Objectives of the study:
The major objective of the study is to make out the existingpractices of employee engagement in hotel industry andthereby analyzing the perception of the employees towardsthe implementation of the engagement practices in theirorganizations.
Methodology
The study focuses on the present engagement practicesbeing implemented, and to what extent the employeesworking in different star rated hotels were able to getengaged with those practices in their jobs. A total of 21variables were taken into consideration to measure theengagement levels of the employees in different departmentsin star rated hotels. The respondents were asked to givetheir opinion (using a 5-point Likert scale; strongly agree[5], agree [4], slightly agree [3], disagree [2], strongly disagree[1]) of the 21 variables. A statistical tool like Factor analysiswas used to study the engagement levels of the employeeswith the current practices. Factor Analysis reduced the datainto definite factors of dimensions by removing theredundant variables. With the application of this tool on thedata of the current engagement practices, the variables that
were not making the employees engaged were revealed(because these variables were eliminated by Factor analysis).
The study is empirical, both qualitative and quantitativevariables were used. The study is based on both primaryand secondary data. The secondary data was collected fromvarious magazines and journals. The primary data wascollected from 140 employees working in different hotels inVisakhapatnam like Novotel, Taj Gateway, Four Points, PalmBeach, The Park, Green Park etc. The respondents were theemployees who were working in different departments oftheir respective hotels, selected on a random basis.
Research Instrument: A structured questionnaire wasspecifically designed to elicit the opinions of the respondentsdepending on the objectives of the study. Questionnairewas framed in such a way that the respondents gave theiropinions mostly for the questions on 5 point Likert scale.The study was conducted in Visakhapatnam, which is oneof the north coastal districts of Andhra Pradesh.
Analysis and results
An attempt has been made to identify the presentengagement practices being implemented in the hotelindustry.
Reliability of Data: Kaiser-Meyer-Olkin (KMO) andBartlett’s Test:
To determine the appropriateness of factor analysis for theproposed study in hotel industry, Kaiser-Meyer-Olkin(KMO) and Bartlett’s Test were conducted. KMO measuresthe magnitude of observed correlation coefficients to themagnitude of partial correlation coefficients. Bartlett’s testmeasures the correlation of variables.
Table 1: Kaiser-Meyer-Olkin (KMO) and Bartlett’s Test for measurement of salesmen motivation
KMO and Bartlett's Test
Kaiser-Meyer-Olkin Measure of Sampling Adequacy. 0.601
Bartlett's Test of Sphericity Approx. Chi-Square 812.78
df 210.00
Sig. 0.000
The KMO measure was observed to be 0.601 and Bartlett’stest measures gave the value of 0.000. Hence, it can beinterpreted that there was no error in 60.10% of the sample.The level of significance, which is less than 0.05 is desirable
and acceptable as shown in the Table 1. At the end, it can beconcluded that the data collected for the study wasappropriate for factor analysis.

SCMS Journal o f Indian Management , July - September 2016 123
A Quarterly Journal
Table 2: Measurement of employee engagement in hotel industry
Variables 1 2 3 4 5 6 7 8
Autonomy at work (Q1) 0.819
fair treatment(Q2) 0.651
provision of equal opportunities(Q3) 0.818
image of the organization(Q4) 0.825
organizational policies(Q5) 0.558
pay and benefit(Q6) 0.923
recognition for work done(Q7) 0.511
customer focus(Q8) 0.521
training and development(Q9) 0.756
direct communication with management(Q10) 0.709
relationship with superiors(Q12) 0.776
co operation among the employees (Q13) 0.737
performance appraisal(Q14) 0.614
emphasis for improvement of performance(Q18) 0.781
trust(Q19) 0.555
leaders are role models to me (Q20) 0.820
team work is encouraged (Q21) 0.842
Extraction Method : Principal Component AnalysisRotation Method : Varimax with Kaiser NormalisationSource : Primary data
Table 3: Factor Eigen Values, Cumulative Value and Goodness of Fit
Factors Eigen Values % of total Variance Cumulative %
FACTOR 1 4.089 19.471 19.471
FACTOR 2 1.927 9.174 28.645
FACTOR 3 1.658 7.895 36.54
FACTOR 4 1.611 7.674 44.214
FACTOR 5 1.392 6.627 50.841
FACTOR 6 1.282 6.107 56.948
FACTOR 7 1.236 5.884 62.832
FACTOR 8 1.148 5.466 68.298
Factor Eigen Values, Cumulative Value, and Goodness ofFit: The Eigen Values explained cumulative values and Chi-Square value – a test for goodness of fit- all are arranged in
Source: Primary Data
the form on table in Table 3. All variables together explained68.298% of the variance, with Eigen values more than 1. TheEigen Value or latent root is sum of squared values of factor
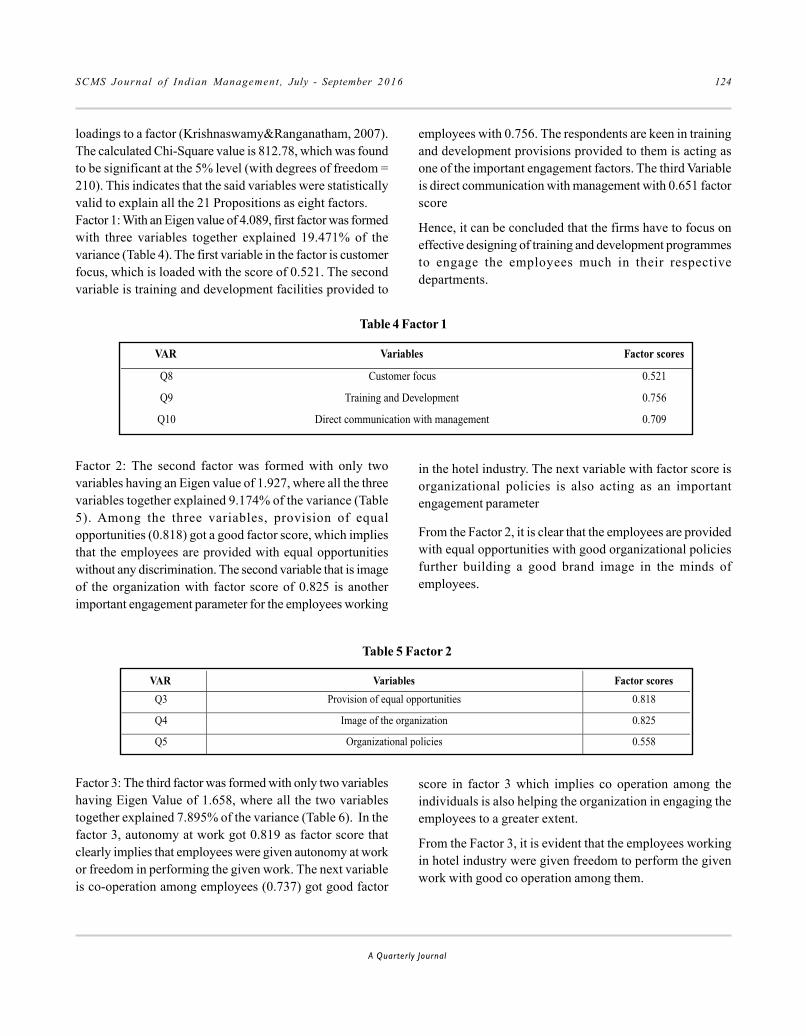
SCMS Journal o f Indian Management , July - September 2016 124
A Quarterly Journal
loadings to a factor (Krishnaswamy&Ranganatham, 2007).The calculated Chi-Square value is 812.78, which was foundto be significant at the 5% level (with degrees of freedom =210). This indicates that the said variables were statisticallyvalid to explain all the 21 Propositions as eight factors.Factor 1: With an Eigen value of 4.089, first factor was formedwith three variables together explained 19.471% of thevariance (Table 4). The first variable in the factor is customerfocus, which is loaded with the score of 0.521. The secondvariable is training and development facilities provided to
employees with 0.756. The respondents are keen in trainingand development provisions provided to them is acting asone of the important engagement factors. The third Variableis direct communication with management with 0.651 factorscore
Hence, it can be concluded that the firms have to focus oneffective designing of training and development programmesto engage the employees much in their respectivedepartments.
Table 4 Factor 1
VAR Variables Factor scores
Q8 Customer focus 0.521
Q9 Training and Development 0.756
Q10 Direct communication with management 0.709
Factor 2: The second factor was formed with only twovariables having an Eigen value of 1.927, where all the threevariables together explained 9.174% of the variance (Table5). Among the three variables, provision of equalopportunities (0.818) got a good factor score, which impliesthat the employees are provided with equal opportunitieswithout any discrimination. The second variable that is imageof the organization with factor score of 0.825 is anotherimportant engagement parameter for the employees working
in the hotel industry. The next variable with factor score isorganizational policies is also acting as an importantengagement parameter
From the Factor 2, it is clear that the employees are providedwith equal opportunities with good organizational policiesfurther building a good brand image in the minds ofemployees.
Table 5 Factor 2
VAR Variables Factor scores
Q3 Provision of equal opportunities 0.818
Q4 Image of the organization 0.825
Q5 Organizational policies 0.558
Factor 3: The third factor was formed with only two variableshaving Eigen Value of 1.658, where all the two variablestogether explained 7.895% of the variance (Table 6). In thefactor 3, autonomy at work got 0.819 as factor score thatclearly implies that employees were given autonomy at workor freedom in performing the given work. The next variableis co-operation among employees (0.737) got good factor
score in factor 3 which implies co operation among theindividuals is also helping the organization in engaging theemployees to a greater extent.
From the Factor 3, it is evident that the employees workingin hotel industry were given freedom to perform the givenwork with good co operation among them.

SCMS Journal o f Indian Management , July - September 2016 125
A Quarterly Journal
VAR Variables Factor scores
Q2 Fair treatment 0.651
Q12 Relationship with superiors 0.776
Q14 Performance appraisal 0.614
Table 6 Factor 3
VAR Variables Factor scoresQ1 Autonomy at work 0.819
Q13 Cooperation among the employees 0.737
Factor 4: The fourth factor was formed with three variableshaving Eigen value of 1.611, where all the variables togetherexplained 7.674% of the variance (Table 7). Among the threevariables, fair treatment (0.651) got good factor score in thisstudy, which implies that fair treatment is acting as animportant engagement parameter. The second variablerelationship with superiors got 0.776 as factor score whichimplies relationship with superiors was acting as an
engaging variable. The third variable performance appraisal(0.614) also got a good factor score.
From the Factor 4, it is evident that the fair treatment alongwith provision of harmonious relationships with superiorsand performance appraisal are being provided to engagethe employees for better productivity.
Table 7 Factor 4
Factor 5: The fifth factor was formed with only one variablehaving Eigen value of 1.392, where it explained 6.627% ofthe total variance (Table 8). The only variable in this factoris emphasis for improvement of performance, which is
Table 8 Factor 5
loaded with a good score of 0.781, which means that therespondents strongly perceived that emphasis forimprovement of performance followed by the managers inthe firms as a better engagement practice.
VAR Variables Factor scores
Q18 Emphasis for improvement of performance 0.781
Factor 6: The sixth factor was formed with two variableshaving Eigen Value of 1.282 where it explained 6.107% ofthe total variance (Table 9). Among the two variables payand benefits got an excellent factor score in this studywith 0.923 which implies that pay and benefits is acting as
a sound engagement parameter of the respondents in thestudy. The second variable, recognition for work done (0.511)got a good factor score which implies that recognition forwork done is acting as engagement variable to a good extent.
VAR Variables Factor scores
Q6 Pay and benefits 0.923
Q7 Recognition for work done 0.511
Table 9 Factor 6
Factor 7: The seventh factor was loaded with two variableshaving Eigen value of 1.236 where it explained 5.884% of thetotal variance (Table 10). The first variable, trust shown onthe employees got a factor score for 0.555. The second
variable, team work is encouraged (0.842) got a good factorscore which gives implication that the organizationencourages teamwork in each and every activity or task thatis performed.

SCMS Journal o f Indian Management , July - September 2016 126
A Quarterly Journal
Table 10 Factor 7VAR Variables Factor scores
Q19 Trust shown on the employees 0.555
Q21 Teamwork is encouraged 0.842
Factor 8: The eighth factor was loaded with only one variablehaving Eigen value of 1.148 where it explained 5.466% of thetotal variance (Table 11). Leaders are role models to be with
Table 11.Factor 8
factor score of 0.820 is the only variable in factor 8 impliesthat leaders in the organization are acting as the role modelsto the employees which helps in engaging the employees.
VAR Variables Factor scores
Q20 Leaders are role models to me 0.820
Eliminated Variables form Factor Analysis: after performingthe factor analysis, 21 variables were reduced to 17variablesand four variables were eliminated from the analysis (whichwere loaded with less factor score than the threshold value
Table 12: Eliminated Variables form Factor Analysis
of 0.5 that means these variables were not explaining anyfactor significantly). The four eliminated variables are shownin the Table 13.
Q11 Job security
Q15 Constructive feedback
Q16 Work itself
Q17 Relationship with co workers
These variables were not contributing to salesmenmotivation, and were not useful for measuring the motivationlevels of the respondents in the retail sector.
Recommendations
The present study recommends the following strategies canbe adopted for better engagement of employees in theirwork.
The organisations should send employees to differentleadership training programmes for the inculcation ofleadership qualities organised by various institutes suchas IIMs, premier Business Schools and various Professionalbodies like NIPM, ISTD, and NHRD Network etc.
Sound compensation policy structure should be designedin such a way that it should attract the potential employees.
Different types of allowances should be given in the form ofbenefits so that employees can be engaged further.
Organisations should concentrate on some welfare facilitiesto the internal employees like education, medicine andtransport to increase the image of the organisation in theform of concern for employees. The organisations shouldalso focus on corporate social responsibility activities byimproving the livelihood of nearby communities.
Teams and group based work environment should be createdwhere people will work in the form of collaborated teamsand groups to give optimum results
The organisations should clearly communicate the growthpotential to the employees, if they really work hard andprove themselves. Promotions should be provided purelyon the basis of merit and expertise.

SCMS Journal o f Indian Management , July - September 2016 127
A Quarterly Journal
From the study it is also identified that autonomy at workalso acting as good engaging variable in the firms. Theorganizations should give freedom to the employees toperform their work with autonomy where they can dischargetheir duties in an efficient manner.
Fair treatment of employees in the organisation can becomean urgency factor to make engaged employees that helps inbuilding the trust among the employees.
Conclusion
From the study it is identified that pay and benefits,encouragement of team-work, image building process of theorganisation, the type of leadership and leaders had in theorganisations and provision of equal opportunities, arecreating huge impact on the engagement levels of theemployees working in the hotel industry. The organisationsshould certainly focus on these elements to engage theemployees fully. It is also evident that too much focus oncustomers, organisational policies, trust shown onemployees, recognition for performance done, performanceappraisal are least five variables that are not creating anyimpact on engagement levels of the employees. Though theorganisations allocate time to look into these variables thesemay not engage the employees fully. It is suggested forgetting better results the organisations can focus on thetop five variables. The study of employee engagementpractices in hotel industry will enable the organizations tounderstand what really engages the employees to performefficiently for customer satisfaction, the ultimate value andthereby increasing effectiveness of the business. If theirneeds are identified properly, they will be motivated andfully engage in their jobs. Employee engagement enhancesthe commitment of employees towards work andorganizations in all three dimensions such as physical,cognitive and emotional.
Limitations of the study
The results may not be applicable to other cities and statesof Indias the study is covering only Visakhapatnam. Thestudy has taken only 21 engagement variables to identifythe engagement levels but there might be some moreelements which are implemented and practised by the firms.
The study can be extended to other cities and states alsolocated in India. The study can be extended to other sectorslike banking, manufacturing, retail etc.
References
Buchanan, Leigh (2004). “The Things They Do for Love, inHarvard Business Review, Vol 82 No 12, Dec 2004,p. 19(2). Chartered Institute of Personnel andDevelopment (CIPD) (2006c) Working Life: Employeeattitudes and engagement 2006 Research Report.
Ellis, C.M. and A. Sorensen, 2007. “Assessing EmployeeEngagement: The Key to Improving Productivity.”Perspectives: The Segal Group publication, Inc.,pp: 15.
Halbesleben, J.R.B. and Wheeler, A.R. (2008),”The relativeroles of engagement and embeddedness in predictingjob performance and intention to leave,” Work & Stress,Vol. 22 No. 3, pp. 242-256.
Harter, J.K., F.L. Schmidt and T.L. Hayes.(2002). “Business-unit-level relationship between employee satisfaction,employee engagement and business outcomes: A meta-analysis.” J. Applied Psychol., 87: 268-279.
Hewitt Associates (2004). Double Digit Growth andEngagement
International Survey Research (2003). Engaged EmployeeDrives the Bottom Line. Research Summary, Chicago,Illinois, 10-35
Kahn WA (1990), “Psychological conditions of personalengagement and disengagement at work.” Academy ofManagement Journal, 33(4), 692–724.
Kahn, W. A. (1990). Psychological conditions of personalengagement and disengagement at work. Academy ofManagement Journal, 33, 692-724.
Koyuncu, M., Burke, R.J. and Fiksenbaum, L. (2006), “Workengagement among women managers andprofessionals in a Turkish bank potential antecedentsand consequences.” Equal OpportunitiesInternational, Vol. 25 No. 4, pp. 299-310.
Krishnaswamy, O. R. and Ranganatham, M. (2007).Methodology of research in social sciences (pp.338-339).Hyderabad: Himalaya Publishing House.
Kruse, K, E. (2012). Employee Engagement 2.0: How toMotivate Your Team for High Performance (A Real-World Guide for Busy Managers). Available on: http://www.forbes.com/sites/kevinkruse/2012/09/04/why-employee-engagement

SCMS Journal o f Indian Management , July - September 2016 128
A Quarterly Journal
Kular, S., Gatenby, M., Rees, C., Soane, E. and Truss, K.(2008), “Employee engagement: a literature review.”Working Paper No. 19, Kingston Business School,Kingston University, London, October.
Langford P.H (2010). The nature and consequences ofemployee engagement: Searching for a measure thatmaximizes the prediction of organizational outcomes,in Albrecht, S. (Ed.) “Handbook of employeeengagement.” London: Edward Elgar Publishing.
Levinson E (2007a), Developing High EmployeeEngagement Makes Good Business Sense,www.interactionassociates.com/ideas/2007/05/developing_high_employee_ engagement_makes_good_business_sense.php
Macey, W.H. and Schneider, B. (2008), “The meaning ofemployee engagement.” Industrial and OrganizationalPsychology, Vol. 1 No. 1, pp. 3-30
Maslach C, Schaufeli WB, Leiter MP (2001), “Job burnout.”Annual Review of Psychology, 52, 397–422
Meere, Michael (December 2005) High cost of disengagedemployees Victoria: Swinburne University ofTechnology. Available online at http://www.swinburne.edu.au/corporate/industrysolutions/ee/reports/Employee%20Engagement%20Industry%20Briefing%20Paper%20Dec%202005%20.pdf[retrieved on 6 March 2007].
MujdelenYener, Mirayyaldiran, sinem Ergun. (2012). “Theeffect of ethical climate on work engagement. ProcediaSocial and Behavioral Sciences 58, pp. 724 – 733
Richman, A. Everyone wants an engaged workforce howcan you create it? Work span, 2006, Vol. 49, p. 36-9.
Right Management (2006) Measuring True EmployeeEngagement. Philadelphia: Right Management.
Roberts, J.V., 2006. Employee engagement and commitment:A guide to understanding, measuring and increasingengagement in your organization. US: SHRMFoundation.
Robinson D, Perryman S, Hayday S (2004), The Drivers ofEmployee Engagement, Institute for EmploymentStudies.
Robinson, D., Perryman, S. and Hayday, S. (2004), “Thedrivers of employee engagement.” Report No. 408,Institute for Employment Studies, Brighton, April.
Robinson, S.L. (1996), “Trust and breach of thepsychological contract.” Administrative ScienceQuarterly, Vol. 41 No. 4, pp 574-599.
Rothbard, N.P. (2001), “Enriching or depleting? Thedynamics of engagement in work and family roles.”Administrative Science Quarterly, Vol. 46, pp. 655-84
Saks, A.M. (2006), “Antecedents and consequences ofemployee engagement.” Journal of ManagerialPsychology, Vol. 21 No. 7, pp. 600-619.
Sangeetha, K (2006).Employee Engagement: An EmergingParadigm, HRM Review, April, pp.19-23
Towers Perrin (2003), Working Today: Understanding WhatDrives Employee Engagement, Towers Perrin HRServices
Tripathy, ManasRanjan (2007). Employee Engagement forOrganisational Excellence, Personnel Today, July-September, pp.17-25
V.V.Devi Prasad Kotni, Venkateswarlu Karumuri (2014). “Anempirical Investigation on the identification ofsalesforce engagement drivers: A study of selected retailoutlets in Visakhapatnam.” Prabandhan: IndianJournal of Management, Vol 7, Issue 7, pp.31-45.
Van Rooy, D.L., Whitman, D.S., Hart, D. and Caleo, S. (2011),“Measuring employee engagement during a financialdownturn: business imperative or nuisance?”,Journalof Business Psychology, Vol. 26 No. 2, pp. 147-152.
******

SCMS Journal o f Indian Management , July - September 2016 129
A Quarterly Journal
SCMS JOURNAL OF INDIAN MANAGEMENT123456789012345678901234567890121234567890123456789012345678901212345678901234567890123456789012123456789012345678901234567890121234567890123456789123456789012345678901234567890121234567890123456789012345678901212345678901234567890123456789012123456789012345678901234567890121234567890123456789
Aims and ScopeThe SCMS Journal of Indian Management is a blind peer-reviewed Journal. The Journal deems it its mission tosubmit to the readers fresh fruit of management thoughts and rich cream of current innovative research. The format ofthe Journal is designed reader-friendly. The academia and the corporates have an easy access to the Journal.
The Journal looks for articles conceptually sound, at once methodologically rigorous. The Journal loves to deal knowl-edge in management theory and practice individually and in unison. We wish our effort would bear fruit. We hope theJournal will have a long life in the shelves catering to the needs of b-students and b-faculty.
§ Proposals for articles that demonstrate clear and bold thinking, fresh and useful ideas, accessible and jargon-free expression, and unambiguous authority are invited. The following may be noted while articles are pre-pared.
§ What is the central message of the article you propose to write? Moreover, what is new, useful, counterintuitive,or important about your idea?
§ What are the real-world implications of the proposed article? Can the central message be applied in businessestoday, and if so, how?
§ Who is the audience for your article? Why should a busy manager stop and read it?
§ What kind of research have you conducted to support the argument or logic in your article?
§ What academic, professional, or personal experience will you draw on to make the argument convincing? Inother words, what is the source of your authority?
§ The manuscript of reasonable length shall be sent to the Editor—SCMS Journal of India Management (Both forpostal and electronic submission details are given here under).
The manuscript should accompany the following separately:§ An abstract (about 100 words) , a br ief biographical sketch of above 100 words for authors describing
designat ion, aff i l ia t ion, special izat ion, number of books and ar t ic les published in the referee journals ,membership on edi tor ial boards and companies etc .
§ The declaration to the effect that the work is original and it has not been published earlier shall be sent.
§ Tables, charts and graphs should be typed in separate sheets. They should be numbered as Table 1, Graph 1 etc.
§ References used should be listed at the end of the text.
§ Editors reserve the right to modify and improve the manuscripts to meet the Journal’s standards of presentation andstyle.
§ Editors have full right to accept or reject an article for publication. Editorial decisions will be communicated within a period of four weeks of the receipt of the manuscripts.
§ All footnotes will be appended at the end of the article as a separate page. The typo script should use smaller size fonts.123456789012345678901234567890121234567890123456789012345678901212345678901234567890123456789012123456789012345678901234567890121234567890123456789
Address for SubmissionElectronic Submission : E-mail: edi [email protected]
The electronic submission must be in the form of an attachment with a coveringlet ter to be sent as e-mail
Post Submission : The EditorSCMS Journal of Indian Management,SCMS New Campus, Prathap Nagar, Muttom,Aluva – 683106, Kochi, Kerala, IndiaPh : +91 484 2623803, 2623804, 2623885, 2623887Fax : +91 484 2623855
123456789012345678901234567890121234567890123456789012345678901212345678901234567890123456789012123456789012345678901234567890121234567890123456789123456789012345678901234567890121234567890123456789012345678901212345678901234567890123456789012123456789012345678901234567890121234567890123456789

CERTIFICATE OF REGISTRATION
Title of Newspaper : SCMS JOURNAL OF INDIAN MANAGEMENT
Language : English(in which it is to be published)
Registration Number : KERENG/2009/32718
Periodicity of the publication and the : Quarterlyday on which it is published 1 January, 1 April, 1 July, and 1 October
Retailing Selling price of the : ` 1000/- (One Year Subscription)Journal
Publisher’s Name : Dr. D. Radhakrishnan Nair
Nationality : Indian
Address : 25/74, Ambady,Kothamangalam-686691, Ernakulam.
Place of publication : Prathap Nagar, Muttom,(with complete Postal address) Aluva-683106, Ernakulam District, Kerala.
Printer’s Name : Dr. D. Radhakrishnan Nair
Nationality : Indian
Address : 25/74, Ambady,Kothamangalam-686691, Ernakulam.
Name of the Printing Press(with complete address where printing : Maptho Printings, Kalamassery, Cochin-683104is to be conducted)
Editor’s Name : Dr. D. Radhakrishnan Nair
Nationality : Indian
Address : 25/74, Ambady,Kothamangalam-686691, Ernakulam.
Owner’s Name : SCMS COCHIN SCHOOL OF BUSINESS
Place : Prathap Nagar, Muttom.
SCMS Journal o f Indian Management , July - September 2016 130
A Quarterly Journal

SCMS Journal of Indian Managementa quarterly publication
ofSCMS COCHIN SCHOOL OF BUSINESS
Dates of Release: -
Number I – January-March on 1 April
Number II – A p r i l - J u n e o n 1 J u l y
Number III – July-September on 1 October
Number IV – October-December on 1 January
© SCMS Journal of Indian Management, SCMS New Campus, Prathap Nagar, Muttom, Aluva-683106, Kochi, Kerala, IndiaPh: 91-484-262 3803 / 262 3804 / 262 3885 / 262 3887 Fax: 91-484-262 3855, Website: www.scms.edu.inE-mail:[email protected] Journal Website : www.scms.edu.in/jim
All rights reserved. No part of this publication may be reproduced in any form without the written consent of thepublisher. School of Communication and Management Studies and SCMS Journal of Indian Management assume noresponsibility for the views expressed or information furnished by the authors. Edited and published by the Editorfor and on behalf of SCMS and printed at Maptho Printings, Cochin-683104.
SCMS Journal of Indian ManagementSCMS COCHIN SCHOOL OF BUSINESS
SCMS New Campus, Prathap NagarMuttom, Aluva-683 106, Kochi, Kerala, India
Ph: 91-484-262 3803 / 262 3804 / 262 3885 / 262 3887 Fax: 91-484-262 3855E-mail: edi [email protected]: www.scms.edu.in/jim
SCMS Journal o f Indian Management , July - September 2016 131
A Quarterly Journal

SCMS Journal o f Indian Management , July - September 2016 132
A Quarterly Journal
Name :Address :
City :Zip Code :Country :E-mail :Phone :Draft Number :
(in favour of “SCMS Payable at Cochin”)
Advertisement Rate
Outside back cover : 30,000 in colour, 15,000 in black and white
Inside front cover : 17,500 in colour, 10,000 in black and white
Inside back cover : 15,000 in colour, 6,000 in black and white
Inner full-page : 7500 in colour, 4,000 in black and white
Inner half-page : 5000 in colour, 3,000 in black and white
Subscription Rates 1 Year 2 Years Per Issue
Companies/Academic Institutes: 1000 ($60) 1800 ($100) 250 ($15)
Individual 800 1500 200
SCMS Journal of Indian Management
Subscription / Advertisement Form
Contact:Editor, SCMS Journal of Indian Management, Prathap Nagar, Muttom,
Aluva - 683106, Ernakulam, Kerala, India.Phone: 91-484-262 3803 / 262 3804 / 262 3885 / 262 3887 Fax: 91-484-262 3855
E-mail: [email protected], Journal Website: <www.scms.edu.in/jim>


Registration Number : KERENG/2009/32718
For information, please visit our website <www.scms. edu.in>
SCMS COCHIN SCHOOL OF BUSINESS
Estd. 1976
PRATHAP NAGAR, MUTTOM, ALWAYE, COCHIN-683106, KERALA, Ph: 0484 - 2623803/04, 2623885/87, Fax: 0484-2623855Email: [email protected], Website: <www.scmsgroup.org>
Journal Website: <www.scms.edu.in/jim>
? Recognized as equivalent to MBA by theAssociation of Indian Universities (AIU).
? Centrally air-conditioned world-class campus, anexcellent team of 56 full time faculty, well-stockedlibrary, full-fledged computer centre, superiorteaching aids etc.
? Academic tie-ups with Foreign Universities to givethe programme global focus and innovation. Ninefaculty members from the universities of USA,Australia & Switzerland teaching full course at SCMS.
? Dewang Mehta National Award for excellence inleadership training systems
? Impact Marketing National Award forintegration of exceptional communication skilldevelopment system
? The only recipient of a grant for track record inperformance from AICTE
? Ranking within the first 25 B.Schools in theA++ category
? Only B.School which has a Universityapproved Research Centre for PhD inManagement
? Only B.School in India to establish a Chair forClimate Change
? SCMS- is nowCochin School of Business
PGDM OF SCMS COCHIN SCHOOL OF BUSINESS
ISSN-0973-3167
SCMS COCHIN SCHOOL OF BUSINESS [Night View]
SC
MS
Jo
urn
al
of
Ind
ian M
an
ag
em
en
t, V
olu
me
XII
I,
Nu
mb
er
3,
Ju
ly -
Se
pte
mb
er
20
16
, P
ag
es
1-1
32
ACCRE D I T E D
B . S C H O O L
Edited, printed and published by Dr. D. Radhakrishnan Nair on behalf of SCMS COCHIN SCHOOL OF BUSINESS and printed at Maptho Printings, Kalamassery, Cochin-683104
and published at Muttom, Aluva-683106, Cochin.
SCMS COCHIN
-The first
accredited, AIU
recognized and
ISO certified
business school in
Southern India
SCHOOL OF BUSINESS
ACBSP (US)
Cochin School of Business
one of the seven ACBSP (US) accredited B-Schools in India.