Cross-Border Labor Mobility and Human Capital Development ...
Upload
hoangtuongCategory
view
216download
0
Scientific Report on the Mobility of Cross-Border Workers within the EU-27/EEA/EFTA Countries FINAL REPORT
commissioned by
European Commission
DG Employment and Social Affairs
presented by
MKW Wirtschaftsforschung GmbH, Munich
Empirica Kft., Sopron Gernot Nerb
Franz Hitzelsberger
Andreas Woidich
Stefan Pommer
Sebastian Hemmer
Petr Heczko
January 2009
Scientific Report on the Mobility of Cross-Border Workers within the EU-27/EEA/EFTA Countries
II
Table of contents page List of tables and figures......................................................................................................................... IV List of abbreviations.................................................................................................................................V Executive Summary................................................................................................................................VI
1 Introduction .........................................................................................................................1
1.1 Background.....................................................................................................................1
1.2 Objectives .......................................................................................................................3
1.3 Structure of the report.....................................................................................................4
2 Literature review: current trends and development on cross-border labour markets
in Europe ............................................................................................................................5
3 Research design and methodology...................................................................................7
3.1 Definitional issues: cross-border commuting ..................................................................7
3.2 Methodology ...................................................................................................................9
3.2.1 Data collection..........................................................................................................9
3.2.2 Field research ........................................................................................................10 3.2.2.1 Online survey...................................................................................................11 3.2.2.2 Interviews ........................................................................................................13
3.3 Output – regional data sheets.......................................................................................14
4 Major findings on cross-border commuting...................................................................16
4.1 Quantitative analysis of cross-border commuting.........................................................17
4.1.1 Development of cross-border commuting in recent years......................................17
4.1.1.1 Development of out-commuting in recent years ..............................................17 4.1.1.2 Development of in-commuting in recent years ................................................20 4.1.1.3 Level of commuting .........................................................................................23
4.1.2 Relevance of wage and income differentials..........................................................26
4.2 Qualitative analysis of cross-border commuting ...........................................................27
4.2.1 Most important branches of cross-border commuting............................................27 4.2.1.1 Construction ....................................................................................................29 4.2.1.2 Hotels and restaurants ....................................................................................30 4.2.1.3 Manufacturing..................................................................................................32 4.2.1.4 Other branches................................................................................................33
Scientific Report on the Mobility of Cross-Border Workers within the EU-27/EEA/EFTA Countries
III
4.2.2 Structure of cross-border workers..........................................................................35
4.2.2.1 Social structure of cross-border workers .........................................................35 4.2.2.2 Prevalent types of commuters and employment status...................................40
4.2.3 Obstacles on cross-border commuting ..................................................................43
4.2.3.1 Language.........................................................................................................44 4.2.3.2 Lack of information ..........................................................................................45 4.2.3.3 Tax systems ....................................................................................................46 4.2.3.4 Cross-border infrastructure, transport systems and geographic barriers ........48 4.2.3.5 Acceptance of qualifications ............................................................................49 4.2.3.6 Other rights to social insurances .....................................................................51 4.2.3.7 National labour market restrictions ..................................................................53 4.2.3.8 Rights to pensions ...........................................................................................54 4.2.3.9 Mentality ........................................................................................................566
4.2.4 Influence of the housing market on cross-border commuting ................................57
4.2.5 Relevance of the extended Schengen area ...........................................................59
4.2.6 Illegal employment and fake self-employment in cross-border regions .................60
4.2.7 Labour displacement or complement of domestic workforce .................................64
4.2.8 Globalisation, economic restructuring and cross-border labour markets - the
example “Czech Republic and Bavarian border region”.............................................66 5 Geographic coverage for cross-border commuting in the enlarged EU......................67
6 Mobility potentials in cross-border regions ...................................................................71
7 Future trends and challenges ..........................................................................................79
List of literature ...................................................................................................................................... 84
Annex A Annex B

Scientific Report on the Mobility of Cross-Border Workers within the EU-27/EEA/EFTA Countries
IV
List of tables and figures Tables: Table 1: Availability of data by countries ............................................................................................... 10 Table 2: Number of commuters by country of origin 2006/2007 ........................................................... 18 Table 3: Number of commuters by country of destination 2006/2007 .................................................. 20 Table 4: Level of commuting ................................................................................................................. 25 Table 5: Income differentials and level of in-commuting ....................................................................... 26 Table 6: Importance as commuting branches (mean values) ............................................................... 28 Table 7: In-commuters to Switzerland by gender and branches (2007, 4th quarter)............................ 36 Table 8: Obstacles on mobility (mean values) ...................................................................................... 43 Table 9: Index of Mobility (computation for cross-border directions) .................................................... 73 Table 10: Mobility potentials by cross-border regions........................................................................... 76 Figures: Figure 1: Experts participating in the online survey – by type of organisation ...................................... 12 Figure 2: Participation overview by country........................................................................................... 13 Figure 3: Presentation of the cross-border regional data scheme ........................................................ 14 Figure 4: Overview of countries under study......................................................................................... 16 Figure 5: Development of commuting by country of origin.................................................................... 19 Figure 6: Development of commuting by country of destination ........................................................... 21 Figure 7: Commuting balance by countries (2006/2007) ...................................................................... 24 Figure 8: Importance of branch “construction” by border regions (mean values) ................................. 29 Figure 9: Importance of branch “hotels and restaurants” by border regions......................................... 30 Figure 10: Importance of branch “manufacturing” by border regions.................................................... 32 Figure 11: Qualification of cross-border workers by border regions (mean values) ............................. 37 Figure 12: Qualification of cross-border commuters by branches......................................................... 38 Figure 13: Prevailing economic sector of cross-border commuters by border regions......................... 39 Figure 14: Structure of cross-border commuters – temporal delimitation ............................................. 40 Figure 15: Employment status of cross-border commuters by border regions (mean values) ............. 42 Figure 16: Language barriers as an obstacle on cross-border commuting........................................... 44 Figure 17: Lack of information as an obstacle on cross-border commuting ......................................... 45 Figure 18: Kinds of information deficits ................................................................................................. 46 Figure 19: Differences in tax systems as obstacles on cross-border mobility ...................................... 47 Figure 20: Cross-border infrastructure as an obstacle on cross-border commuting............................. 49 Figure 21: Recognition of foreign diplomas as an obstacle on mobility ................................................ 50 Figure 22: Differences within other rights to social insurance as obstacles on cross- border mobility..57 Figure 23: National labour market restrictions as obstacles on cross-border mobility.......................... 53 Figure 24: Rights to pension as obstacle to mobility............................................................................. 55 Figure 25: Mentality as an obstacle on cross-border commuting.......................................................... 56 Figure 26: “The housing market (rents, real estate prices) within my borderregion has a significant
influence on cross-border commuting.”............................................................................................ 58 Figure 27: Influence of the Schengen enlargement in 2004 on cross-border development ................. 59 Figure 28: Appearance of illegal employment in cross-border work (mean values) ............................. 61 Figure 29: “The still missing implementation of free movement for workers in the EU results in an
emergence of illegal employment.” .................................................................................................. 63 Figure 30: “The rising number of commuters from the neighbouring country results in labour
displacement of domestic workers on the local labour market.” ...................................................... 65 Figure 31: Trans-European high-speed lines network 2004 ................................................................. 67 Figure 32: Top overseas commuter belt destinations ........................................................................... 69 Figure 33: Correlation of mobility and level of commuting (directed cross-border regions).................. 74 Figure 34: Development of cross-border commuting in the following years (expert estimates) ........... 78
Scientific Report on the Mobility of Cross-Border Workers within the EU-27/EEA/EFTA Countries
V
List of abbreviations cb cross-border cf. confer EC European Commission ECB European Central Bank EEA European Economic Area EEC European Economic Community EFTA European Free Trade Association e.g. exempli gratia EU European Union EURES European Employment Service EURES-T "EURES Transfrontalier" (cross-border partnerships) GDP Gross domestic product i.e. id est LAU Local Administrative Unit NACE Statistical Classification of Economic Activities in the European Community NUTS Nomenclature of Territorial Units for Statistics OECD Organisation for Economic Co-operation and Development PES Public Employment Service PPP Purchasing power parity SPSS Statistical Package for the Social Sciences EU-15: Austria, Belgium, Denmark, Finland, France, Germany, Greece, Ireland, Italy,
Luxembourg, The Netherlands, Portugal, Spain, Sweden, The United Kingdom (+ Andorra and Monaco)
EU-12: Bulgaria, The Czech Republic, Estonia, Hungary, Latvia, Lithuania, Poland, Romania, Slovakia, Slovenia (Cyprus and Malta are not analysed on cross-border mobility of workers)
EU-8: The Czech Republic, Estonia, Hungary, Latvia, Lithuania, Poland, Slovakia, Slovenia EU-27: Austria, Belgium, Bulgaria, Cyprus, The Czech Republic, Denmark, Estonia, Finland,
France, Germany, Greece, Hungary, Ireland, Italy, Latvia, Lithuania, Luxembourg, Malta, The Netherlands, Poland, Portugal, Romania, Slovakia, Slovenia, Spain, Sweden, The United Kingdom
EU-25: EU-27 countries except Bulgaria and Romania EFTA: Island (not analysed), Liechtenstein, Norway, Switzerland EEA: EU-27 + EFTA countries except Switzerland AND Andorra AUT Austria B Belgium BG Bulgaria CH Switzerland CZ Czech Republic DK Denmark EST Estonia F France FIN Finland GER Germany GR Greece HU Hungary IRE Ireland ITA Italy LAT Latvia
LIE Liechtenstein LIT Lithuania LUX Luxemburg MO Monaco NED The Netherlands NOR Norway P Portugal PL Poland RO Romania SLO Slovenia SPA Spain SVK Slovakia SWE Sweden UK United Kingdom
Scientific Report on the Mobility of Cross-Border Workers within the EU-27/EEA/EFTA Countries
VI
EXECUTIVE SUMMARY
Main aims of the study Geographic labour mobility within EU member countries – both in terms of trans-national migration as well as cross-border commuting – has remained at a relatively low level until now. Whereas much research activity has been devoted over the years to different kinds of migration, the other type of geographic labour mobility – cross-border commuting – has been to a much lesser degree object of research studies.
To shed more light on those issues the EU Commission (GD Employment and Social Affairs) commissioned a study on current trends and practices as regards cross-border commuting within the EU-27 (enlarged by EEA and EFTA countries). The focus of this study lies on analysing new trends and orientations in this area, both on a quantitative basis (number of commuting workers, shifts in mobility flows) as well as on a qualitative basis (importance/changes of sectors involved, analysis of motivations, expectations etc.). Though the knowledge on the size and the motivation structure of cross-border commuting is rather scarce in the old EU member states (EU-15), it is even less pronounced in the new member states (EU-12) and concerning movements of labour between EU-15 and EU-12. Therefore, special attention will be given to countries that have joined the EU in 2004, respectively in 2007. Beyond the more recent developments in commuting also foreseeable future trends and challenges are dealt with.
Applied research methodology In total 41 European cross-border regions (21 regions within EU-15 countries, 10 within EU-12 countries and 10 between EU-12 and EU-15 countries) were covered in the study.
The applied methodology in the first place is based on literature research and analysis of all available data relevant for this purpose. Due to partially large diversities in the availability of statistics (e.g accessibility on regional level, date of data entry), the consistency of data for single border regions is given priority over an overall comparability. In addition – and this constituted the main part of the study – own field research was conducted, both in terms of an online survey and qualified expert interviews. In total 440 labour-market experts participated in the online survey and gave additional information in in-depth interviews in the tradition of the Delphi-technique. Size and structure of the results gained in the field work enable to draw general conclusions. Above the extensive data gathering and analysing it was tried to develop new analytical instruments which at the end lead to a more thorough and theoretically founded approach of explaining and forecasting cross-border commuting.
Scientific Report on the Mobility of Cross-Border Workers within the EU-27/EEA/EFTA Countries
VII
Major findings
Status quo and dynamics on cross-border labour market mobility in the EU In total, about 780,000 people in the EU (including EEA/EFTA) were cross-border commuters in the year 2006/2007. Commuting streams are clearly condensed in the area of Central-Western Europe. For EU-15/EEA/EFTA the total number of commuters has increased by 26% from about 490,000 in 1999/2000 to about 660,000 in 2006/2007.
The main countries of destination are Switzerland (206,000), Luxembourg (127,000), Germany (86,000), the Netherlands (58,000), Austria (48,000) and Belgium (39,000), together receiving about ¾ of all EU-commuters. The main countries of origin are France (284,000), Germany (117.000) and Belgium (78,000), providing about 60% of all out-commuters in the EU.
Although underrepresented in absolute commuting numbers, in relation to the number of employees in the border region important countries of origin are also Estonia, Belgium, Slovakia and Slovenia. Important countries of destination are Finland and Ireland and the small principalities of Monaco, Liechtenstein and Andorra.
Significant increases of in-commuting streams have been observed between 2000 and 2007 in Switzerland (+59,000), Luxembourg (+40,000), Austria (+34,000) and the Netherlands (+25,000). The amount of in-commuters to Germany is declining (-16,000) in the same space of time, constituting the only exception of EU-countries. Significant increases with regard to the number of out-commuters have been registered between 2000 and 2007 in France (+53,000), Germany (+46,000) and Belgium (+25,000).
Although most commuting streams are still centred in the “heart” of Europe, additional lines are developing, like in the Scandinavian countries or in the Austrian border area. Commuting potentials that should be fostered in the following years mainly lie in Eastern and Southern Europe (Baltic states, the Balkans).
Low cross-border mobility between EU-12 countries In comparison to countries of EU-15/EEA/EFTA, constituting target regions for nearly 95% of European cross-border commuters, cross-border mobility is very low between the so-called “new member states”. This can be ascribed on the one hand to the structural weakness of border regions of formerly centralised, post-socialist countries, on the other hand to significantly lower wage differences between those countries.
This situation might even intensify with the implementation of the free movement of labour, latest in 2011. Revealing in this context is the Slovak-Hungarian cross-border region, where – according to local labour market experts – the ratio of commuters to Hungary is expected to decrease, also due to the remarkable economic growth in Slovakia.
Mobility in cross-border regions between “old“ and “new“ EU member states is notably higher, for instance from Estonia to Finland (20,000), Hungary to Austria (16,000) or Slovenia to Italy (10,000) in 2006/2007. The EU-12 countries represent almost 15% of all out-
Scientific Report on the Mobility of Cross-Border Workers within the EU-27/EEA/EFTA Countries
VIII
commuters. This development is fostered mainly by income differences, but hampered by labour market restrictions. Exceptions are the German cross-border regions of Poland and the Czech Republic, where commuting streams are very low because of a weak economic structure in the target region and an unemployment rate above the national average. According to the empiric findings in the present study, however, the region counts with an articulate mobility potential, also from Germany to Poland or the Czech Republic. Structure of cross-border workers - branches, sex and level of qualification The branches most occupied by cross-border commuters are the construction industry, hotels & restaurants and manufacturing, while commuter flows concentrate within the EU-15 and/or between EU-15 and EU-12 member states. However, the branches agriculture as well as health & social work still reach punctual relevance in some cross-border regions.
Contrary to the general dominance of the tertiary sector over the secondary sector on national labour markets, in terms of cross-border commuting a slight predominance of the secondary sector is observed in all border regions. Though, for instance in the case of Switzerland (27% of all in-commuters), official statistics point to a strong increase of commuting to the tertiary sector in the following years.
Cross-border commuters are predominantly male and by the majority covering the age-group between 25-45 years. Besides a branch correlation of cross-border commuters is obvious. While men are clearly overrepresented in the construction industry and manufacturing, women hold the majority in the branches health & social work and education. The branch hotels & restaurants shows an almost balanced gender distribution.
Concerning the qualification level of cross-border commuters significant differences between EU-15 and EU-12 states arise, while the qualification level simultaneously corresponds to the employment status: High skilled cross-border commuters (mainly from EU-15) are mainly employed on a permanent basis in economic core areas, whereas low skilled workers (predominantly out of EU-12) mostly occupy temporary jobs in peripheral business areas. Mismatches of personal qualifications and factual job positions are determined for Bulgarian workers commuting to Greece.
In most cross-border regions in-commuters are predominantly noticed as complementary working resources to the local labour force on the strength that they predominantly occupy peripheral activities and economic niches which are of little interest for domestic workers. Solely Switzerland shows a significant level of resentments and felt labour displacement due to the reason that in-commuters occupy well remunerated, attractive job positions in great quantities (e.g. high-skilled Germans in the branch “health and social work”). However actual labour displacement remains rather small in Switzerland. Instead a process of „new immigration“ into elite positions is to be observed attributing substantial positive effects on productivity and economical growth to foreign migrants and commuters (Müller-Jentsch et. al. 2008).
Drivers on cross-border mobility With regard to economic theories of commuting, it has to be reasoned that “push-factors”, (unfavourable economic indicators that cause an outflow of workforce) have less importance in causing mobility trends than “pull-effects” (the attraction of markets of destination). Thus,
Scientific Report on the Mobility of Cross-Border Workers within the EU-27/EEA/EFTA Countries
IX
income advantages and better job profiles in the region of destination outweigh high unemployment rates and recession in the region of origin in explaining the clear majority of commuting streams – a large majority of which come from economically strong countries like France, Germany or Belgium. Nevertheless, cross-border commuting cannot be explained using economic indicators exclusively. Although the analysis of an income difference factor delivers some hints on effective commuting numbers, it does not serve as a sufficient indicator of commuting streams.
Infrastructural accessibility has been identified as an important factor of a region’s potential on cross-border mobility. The absence of geographic barriers and a well developed transport infrastructure have a large share in promoting uncomplicated and daily forms of commuting, as exemplified in the border regions Germany–Denmark or France–Belgium. Furthermore, the development of infrastructure can connect border areas with urban agglomerations and economic centres “in the second row”. Such additional mobility potentials, however, are currently opened up by only a few trans-national high-speed connections (e.g. EUROSTAR, ICE, TGV, Thalys), especially between France, UK, Germany and the Benelux countries, which are not totally adequate for daily commuting yet.
With regard to the temporal scale daily commuting is observed to be prevalent. Though types of „long term commuting“ due to geographical barriers, decrease of commuting frequencies in consequence of high commuting costs (fuel, ticket prices, tolls…) and the increase of flexible job activities gain in importance. While weekly commuting takes a comparatively subordinated role in cross-border areas, it gains attractiveness over longer distances (long distance commuting).
A further element important to forward cross-border mobility has been detected in the housing market. Housing prices can exercise particular “pull-effects” by reason of considerable differences in the cross-national real estate and renting situation. In the border region of Denmark↔Sweden the renting market exerts the strongest influence on cross-border commuting. Due to lower real estate prices, rents and living costs in Sweden numerous Danes still move from Copenhagen to Sweden (e.g. to Scania) and commute back into their jobs in Denmark as “in-commuting nationals”. The same trend can be observed also for workers from South-East England moving to Nord-Pas de Calais in France. In Germany sinking renting and housing prices in recent years contribute to the fact that numerous persons prefer commuting to neighbouring countries (Netherlands, Denmark) instead of a permanent change of residence. In general, cross-border commuting seems to be affected mostly by housing market developments in border regions where daily commuting is prevalent.
The Schengen enlargement in 2004 was able to facilitate the present passenger traffic in the appropriate border areas but less able to boost cross-border commuting in terms of a significant increase of commuting numbers. The abolishment of border controls promotes the movement of goods by shortened waiting periods, bureaucratic deregulations and less delays. Keeping in mind that the actual abolishment of border controls was first implemented in 2007, the rising numbers of cross-border commuters observed in some border regions between 2004 and 2007 can not be primarily attributed to the Schengen enlargement in 2004.
Scientific Report on the Mobility of Cross-Border Workers within the EU-27/EEA/EFTA Countries
X
Obstacles on cross-border mobility
As the investigation of economic factors has only been partially sufficient, also legal, social and infrastructural barriers have to be considered in analysing the grounds of labour mobility. The present study develops a detailed investigation on so-called “obstacles on mobility” for each border region. According to this study, the biggest problems both within the EU-15 and the EU-12 exist in:
• different languages and
• the lack of information (knowledge about responsible offices, transparency in taxation, knowledge about the acceptance of formations/graduations).
However, deficits reach the highest level between the EU-15 and the EU-12, with the most striking relevance in:
• restrictions on labour market regulations (e.g. working permits, transition periods),
• the insufficient (de jure and/or de facto) acceptance of qualifications,
• different tax and social security systems.
Those frictions can be traced back to structural differences in current social and legal systems, still persisting between the “old” and “new” member states. With regard to EU-15 it is caused by long lasting processes of harmonisation (by EU regulations and bilateral agreements) in the last decades, with regard to EU-12 caused by the similarity of post-socialist structures that systems seem to intertwine better internally.
Infrastructural problems are very similar in most cross-border regions: cross-border public transport is often inadequate, ticket prices, tolls or border crossing fees are too expensive and high-speed-connections hardly developed or not exposed to competition. As a matter of fact the cross-border infrastructure is better between EU-15 and EU-12 member states than within EU-12 member states.
Labour market restrictions are an obstacle on cross-border mobility mainly between EU-15 and EU-12 countries. In case of Austria, Italy and Greece, labour market restrictions also push the emergence of illegal employment as shown by statistics, studies and expert assessments. An immediate abolition of transition periods could reduce the number of clandestine workers and diminish the displacement of domestic workers by an increase of legalised employment.
There is a chance that such measures will slowly diminish existing obstacles on mobility and thus create new potential for cross-border labour markets. However, the EU’s frame of actions is limited (sovereign rights in taxation and education). For the future, further integration and the breakdown of obstacles on mobility will largely depend on the member states’ willingness and the implementation of common principles in their own national administrative practice.
Scientific Report on the Mobility of Cross-Border Workers within the EU-27/EEA/EFTA Countries
XI
Mobility potentials In order to comprise economic, legal and social aspects relevant for cross-border mobility, an integrative explanatory model was created: the index of mobility. This indicator serves as a solid predictor on the level of commuting in the respective border regions. Regions with a high level of commuting generally show lower mobility barriers (obstacles, unfavourable income level and unemployment rate), and vice versa.
In addition to the experts’ assessment on future commuting developments this index also enables to estimate mobility potentials in cross-border regions.
One the one hand, good development prospects are assigned to regions that already feature large commuting streams due to favourable markets. Thus, for instance mobility trends to Switzerland are predicted to further increase (from Italy, France and Germany). With regard to in-commuting expectations are also positive for Austria (from Hungary and Germany) and the Netherlands (from Belgium and Germany), which implies that the out-commuting trend is supposed to continue in Germany, and with regard to Scandinavia also in Sweden (to Denmark and Norway).
On the other hand, specific mobility potentials are also determined for border regions whose commuting potential is still limited by economic structures or legal and social obstacles. In that sense, the border regions Bulgaria↔Romania and Slovakia↔Poland are estimated to open up mobility potentials. The abolishment of current restrictions on mobility is foreseen to increase commuting also in the case of Germany↔Poland, Austria↔Hungary, Czech Republic→Germany (Saxony) or Italy↔France.
Particularly low mobility prospects are found for borders where the economic situation in the country of origin blocks pull factors from the other side, as in the case of Austria→Germany, Switzerland→Italy, Slovakia→Hungary or Finland→Sweden. Additionally, commuting numbers may stagnate in the light of considerable growth in the past (e.g. Slovenia→Italy, France→Germany, Czech Republic→Germany (Bavaria)) or, like for many EU-12 border areas close to a more appealing border, not even develop at a higher level (e.g. Hungary→Romania, Czech Republic→Poland, Estonia→Latvia or Austria→Slovenia/ Slovakia.
Scientific Report on the Mobility of Cross-Border Workers within the EU-27/EEA/EFTA Countries
1
1 INTRODUCTION
1.1 Background
In its efforts to enhance the EU's competitiveness and foster job creation, the European Council has identified mobility as a key element for achieving the goals of the revised Lisbon strategy and for the implementation of the European Employment Strategy. Notwithstanding the efforts undertaken to facilitate mobility, in both geographic and labour market terms, the current mobility rates of workers in the EU remain relatively low. As a follow up to the 2006 European Year of Workers' Mobility, the Commission proposed to consolidate its knowledge base on mobility patterns and practices as a means to facilitate geographic and job-to-job mobility in the European Union, to remove remaining barriers, and to contribute to the emergence of a mobility culture within the European labour market.
The following study has been conducted with reference to Section 2.1.1 of the 2007 Work Programme for PROGRESS, which mentions specifically "the continued need to improve matching of labour market needs through the modernisation of labour market institutions, notably employment services, and through removing obstacles to mobility for workers across Europe" (EC 2007).
The European integration process and the model of a European Single Market have increased awareness towards the mobility phenomenon. There is broad political consensus regarding freedom of movement of the production factors in the European Economic Area (EEA). The mobility of capital, goods and services is well represented in current research. In contrast, however, labour mobility, migration and commuting have not really been a subject of traditional socio-economic theory. The designation of 2006 as the European Year of Workers' Mobility has provided a broader vision of mobility issues, and enhanced the knowledge base about mobility flows and practices, as well as the identification of current obstacles to geographic and job-to-job mobility in the EU. During the European Year, mobility has been the subject of several surveys and studies, particularly in the light of the accession of 10 (now 12) new Member States to the EU. Still, there is little evidence concerning the design of a genuine theory of geographical mobility. The available scientific evidence has always seen geographical mobility as one of the results of the work of the socioeconomic fabric and not as a determinant.
The following study, in contrast, tends to underpin the findings of recent research which contribute to the emergence of a global theory concerning geographic and job-to-job mobility and consequently focuses on cross-border labour mobility in the European Union as a core phenomenon.
The issue of cross-border mobility seems to be the composite result of several partially overlapping trends:
- improvements in infrastructure – for instance the Channel Tunnel – and in existing transport systems – in particular high speed trains – have created new dimensions of
Scientific Report on the Mobility of Cross-Border Workers within the EU-27/EEA/EFTA Countries
2
migration and commuting. Improved transport systems seem to facilitate daily commuting instead of migration;
- globalisation and economic restructuring has led to the identification of new cross-border imbalances in specific sectors of activity;
- likewise, in addition to traditional cross-border movements, the enlargement of the EU has opened up new perspectives for cross-border exchanges and commuting in a much expanded geographic coverage.
Mobility patterns are traditionally selective. They may differ considerably with regards to motivation, age, level of skills and experiences. Historical ties also seem to play a lasting role in the shaping and importance of cross-border movements.
Recent research on cross-border mobility has identified three parameters which determine decisions to move between living and working places:
- wage and income differentials;
- employment opportunities;
- individual opportunity and risk assessment.
With regard to cross-border mobility, an important role is attached to the regional distribution of economic wealth and the chances of finding gainful employment. Commuting in this respect is closely related to the hierarchy of central places and is primarily a function of accessible job markets. Although migration and commuting are currently interpreted under the umbrella of geographical or regional mobility, there are basic differences to be considered:
- Commuting is more temporary in nature than migration, in that commuting leaves the place of residence unaffected. The journey to work with a few exceptions, is undertaken on a short-term basis. Longer-haul commuting may involve longer periods of time. However, this form of commuting is less frequent.
- Migration involves the movement of one’s residence to another place. In some instances the previous residence may be kept as a secondary residence. Students or high-income migrants are examples of this type of geographical mobility.
- The principal difference between migration and commuting lies in the fact that, in a broad definition, a very large majority of the labour force commute (home-workers are an exception, but this group represents an insignificant part of the workforce). In that sense, migration is a much more fundamental decision that affects both the change of workplace and residence and is therefore undertaken preferably few times during ones working life. When analysing collective working trends, migration represents significantly less than ten percent of the labour force. Mobility, in contrast, is a rather common category of synchronic labour market structures whose general effects can be analysed in a broadly based, comparative method.
Although recent developments perceived during the European Year of Worker's Mobility 2006 have permitted to better grasp the specificity of cross-border mobility, within the larger
Scientific Report on the Mobility of Cross-Border Workers within the EU-27/EEA/EFTA Countries
3
context of workers' mobility, there are still a number of determinants that need to be analysed. These concern both quantitative and qualitative parameters:
- on the one hand, the evolution in mobility trends at cross-border level between EU Member States, with special reference to the successive 2004 and 2007 enlargements (quantitative dimension).
- on the other hand, an evolution of mobility determinants at cross-border level, as regards both the sectors involved and the motivations of cross-border workers to live and work in different countries.
The present study focuses on cross-border mobility patterns taking place between two Member States and doesn’t cover mobility trends between regions within a given country, nor trans-national mobility/migration trends (e.g. from Poland to Ireland).
In addition, the study sets a high level of importance on the fact that in the framework of EURES, the European Job Mobility Portal, the European Commission has devoted specific attention to the cross-border issue. Twenty cross-border partnerships have been founded in this perspective, involving a large number of local and regional actors (social partner organisations, local and regional authorities etc), and feasibility studies have been conducted with fourteen additional ones, concerning mainly cross-border activities between EU-15 and EU-12 countries, or between EU-12 Member States. Nonetheless the cross-border relations between the EU-15 states continue to play an important role in the European dimension of cross-border labour mobility and are therefore covered in this study.
The present study is an extension of the “Scientific Report on Mobility of Cross-border Workers within the EEA” carried out by MKW in 2001 - both in geographic terms as well as by applying a broader methodological approach.
1.2 Objectives
The task of the study is to provide an overview of current trends and practices as regards cross-border mobility within the EU. Based on an analysis of existing trends and practices, the study analyses new trends and orientations, both
- on a quantitative basis (numbers of commuting workers, shifts in mobility flows)
- on a qualitative basis (importance/changes in sectors involved; analysis of motivations, expectations etc).
It pays specific attention to the emergence of new cross-border practices among Member States of the EU, with particular reference to the countries that have joined the EU in 2004 and 2007.
The study will comprise an analytical evaluation of the importance of cross-border practices in the development of employment opportunities in Europe and the progressive emergence of a mobility culture within the European labour market. Specific attention will be paid in this context to foreseeable future trends and challenges.
Scientific Report on the Mobility of Cross-Border Workers within the EU-27/EEA/EFTA Countries
4
1.3 Structure of the report
Having defined the political background of the present study in chapter 1 and thus enunciated essential expectations, chapter 2 deals with current trends and changes of cross-border labour mobility in the EU. By means of a short listing of previous studies, the additional benefit of the present empirical investigation is pointed out.
Subsequently, chapter 3 will define fundamental scientific concepts and enlarge upon the research design underlying the present survey. The process of data collection is explained, which took place in two stages, by a quantitative-statistical investigation and by a semi-standardised online survey.
Following up, chapter 4 will elaborately describe the empirical results. Chapter 4.1 presents the findings of the quantitative data collection. Developments of cross-border commuting (distinct by countries of destination and countries of origin) will be presented in detail and the influence of income differences on them will be additionally analysed. In chapter 4.2 the major findings of the online survey will be exposed. First of all, economic sectors and branches most frequented by cross-border commuters are determined for respective border regions. After that the structure of cross-border commuters will be examined by socio-demographic traits, such as age, sex and level of qualification. Additionally, temporal delimitations of commuting in the border regions under study will be identified. Attention is also paid to the specific relevance of potential obstacles on cross-border mobility, by an extensive examination in chapter 4.2.3. The subsequent chapters will be dedicated to additional factors as regards cross-border commuting, such as significance of local housing and real estate markets (chapter 4.2.4) or influence of the extended Schengen area (chapter 4.2.5).
Concomitant phenomena of the increasing relevance of commuting, such as tendencies towards illegal employment as a consequence of restrictions on the free movement of labour or perceived effects of labour displacement will be discussed in the chapters 4.2.6 and 4.2.7. In an excursus, chapter 4.2.8 will address possible interrelations between cross-border commuting developments and structural changes in national economics, exemplified by the Bavarian-Czech border region.
Subsequently, chapter 5 dwells on the geographic coverage of commuting streams, before chapter 6 gives a synthesis of quantitative and qualitative data under survey, deducing an explanatory model of cross-border mobility potentials.
To summarize, chapter 7 will provide an outlook on future trends and challenges.
Scientific Report on the Mobility of Cross-Border Workers within the EU-27/EEA/EFTA Countries
5
2 LITERATURE REVIEW: CURRENT TRENDS AND DEVELOPMENT ON CROSS-BORDER LABOUR MARKETS IN EUROPE
The mobility of labour (both in the way of trans-national migration and cross-border commuting) has been identified as a key element for the achievement of the revised Lisbon strategy and the implementation of the European Employment Strategy. Meantime there is broad political consensus - also on national and regional level - that the compensation of “skills shortage” and “demographic change” is a highly crucial challenge to ensure future competitiveness and prosperity. For the EU-25 as a whole, cross-border labour mobility is likely to offer a number of advantages, by allowing a more efficient matching of workers‘ skills with job vacancies and facilitating the general upskilling of the European workforce. The current restrictions on labour mobility from the EU-8 countries to other EU member countries stand in contrast with one of the central principles of the EU – the free movement of labour. Furthermore, these restrictions may decrease the efficient use of labour resources in the face of demographic change and globalisation and hamper an important adjustment mechanism within EU (ECB 2006).
In recent years corresponding studies have been carried out in order to analyse and forecast the dimension and the economic and labour market related importance of migration, to devise scenarios and strategic recommendation on labour market policy-making, not least in the context of the enlargement of the European Union in 2004 and 2007 (e.g. ifo Munich 2001, ifo Dresden 2001, ISF 2004, OECD 2004, Münz / Fassmann 2004, HIIE 2005, GCIM 2005).
Forecast of labour force movements across borders and reality The effects of labour migration from Eastern European countries to the old EU member countries have, as a rule, been overestimated in most studies. According to an ifo study from September 2001 based on a computable general equilibrium model the following estimates were made: “The model projections conclude that three years after the accession to the EU and the free movement of labour, at least one million migrants from accession countries will live in Germany of which more than 200,000 will settle in Bavaria. After 10 years, depending on income developments, the stock will increase from 2.6 to three million, of which 490,000 to 570,000 will be in Bavaria. After 15 years the result for Germany will be 3.2 to 4 million immigrants of which 590,000 to 760,000 will fall on Bavaria (ifo Munich 2001)”. In reality the latest available figures for the first three years after accession to the EU point to an increase of immigrants from these countries which is less than one third of the above mentioned estimate. However, a final conclusion cannot be drawn for the time being as a completely free movement of labour will not be realized before the end of 2011. Nevertheless, the overestimation of immigration based on econometric models focussing mainly on income differentials cast some doubts on the dominant importance of income aspects for the decision to work abroad. This view is supported by much more successful estimates of forecasting commuter developments based on models where the commuter potential is essentially determined by the population size of the sending and the target country and the geographical distance. This approach was e.g. applied by the ifo institute in the above mentioned study. The philosophy of this model was based on the experience gained examining models which explained the intra-German commuting from East to West Germany. German unification is one of the few historical situations where an immediate freedom of movement between two regions with great wage differentials was granted after borders were opened. It has been shown that the commuter potential is essentially determined by the

Scientific Report on the Mobility of Cross-Border Workers within the EU-27/EEA/EFTA Countries
6
population size of the sending and the target country, the geographical distance and to a lesser degree by income differentials. In analogy this approach was used for the projection of the amount of commuters from the Czech Republic to Bavaria. As a result, projections expect a commuting potential of 46,000 people for all Bavarian planning regions. This corresponds to a proportion of 0.56% of the population and 1.53% of Bavarian employment. The potential varies substantially between planning regions. The highest potential of commuters in the magnitude of 1.4% of population and 4.5% of employment can be expected for the planning region Oberpfalz-Nord. The relatively modest numbers estimated can be explained to a significant extent because the bordering regions of the Czech Republic are among the most sparsely settled regions in this country and Bavarian planning regions along the border are also relatively sparsely settled. An estimation model based mainly on income differentials (in 2001 the relevant wage differential for commuting industrial employees in terms of exchange rates was 1:8 at Bavarian and Czech border regions) would have yielded a much higher commuter potential. Thus, the lesson was also learned from intra-German commuting from East to West after German unification appears to hold true also in this case. Apart from this ifo study there are several other examples of overestimating the commuting and/or migration effect from Eastern European countries to some of the old EU member countries (EU 15). So the German labour market research institute IAB points out that the catching up process of wages in Eastern European countries was, as a rule, much faster than had be assumed in the majority of studies. Also foreign direct investments in Eastern Europe were much bigger than assumed in most labour market studies, thus creating a strong incentive to look for employment at home and not to commute or migrate.
Newer studies on East-West labour migration often deal with field research and case studies on labour migrants motives’ and expectations (e.g. IER 2007, Glorius 2007, IER 2008). However, comparable studies on cross-border labour market dynamics and cross-border commuting are strongly underrepresented in the scientific research on a European level (e.g. MKW 2001). Most of the studies conducted on this level (e.g. ECB 2006, EC 2006), however, describe and analyse migration trends instead.
Single studies concerning commuting in separate cross-border regions have been carried out during the last few years (e.g. PricewaterhouseCoopers 2001, EURES Channel 2005, EURES Oberrhein 2005, IAB 2008, Hönekopp / Stichter-Werner 2005, PLG 2005, Translake 2008) but a coherent European examination is still to be conducted.
The objective of the following study is to analyse trends and practices of cross-border commuting in a pan-European view. Due to the aim of the study, which is to provide elements of a global theory and a practicable method for cross-border mobility, this study primarily strives for comparability on an international – i.e. European – level. This aim is also reflected on the methodological level, by an integrative approach which combines complementary empirical sources and procedures. The research design is exposed in the following chapter.
Scientific Report on the Mobility of Cross-Border Workers within the EU-27/EEA/EFTA Countries
7
3 RESEARCH DESIGN AND METHODOLOGY
3.1 Definitional issues: cross-border commuting
In order to establish a common level of understanding while analysing cross-border issues, a definition of basic terms is essential. Although often subsumed under one coherent paradigm “mobility of workforce”, cross-border commuting as a social phenomenon has to be considered as quite different from trans-national migration (Massey et al. 1998). There are different kinds of cross-national workers’ mobility generally subsumed under the designation “job migration” (Eliasson et al. 2003). This general notion also includes guest workers, au pair jobs or fixed term IT specialists with green cards. In order to describe the often smooth transition of migration and commuting Constantin introduced the concept of “long-term commuting” (Constantin 2004). This concept will be subject of discussion in chapter 4.2.2.2.
Albeit different issues of job migration cannot be discussed extensively within this study there are a few basic variables used which specify the character of commuting as distinguished from migration. Among other aspects the time period, place of residence and partially also the distance can be considered as the prevailing distinctive features. While cross-border commuting between neighbouring countries takes place within smaller geographical areas and in short, regular periods up to a weekly level, migration mainly describes a wide-ranging process of permanent relocation of workers residence (or even the whole household) with a view to improve both income and the standard of living.
Definition of “cross-border commuter“
In dealing with cross-border issues a multitude of definitions for the term “cross-border commuter” exists. Therefore, a unified description of cross-border mobility is only possible to a limited extent.
Using the EU-terminology, cross-border commuters (also called “cross-border workers”) are characterized on the basis of two criteria, a political and a temporal one. Leaning on these principles, cross-border commuters are workers1 including the self-employed who pursue their occupation within the territory of a Member State and reside in another (neighbouring) Member State (political criterion).
Compared to the place of residence, nationality cannot be taken as a significant indicator classifying cross-border workers because there are cases where workers from one country move to a neighbouring state by reason of lower costs for renting and living and commute back to their home state virtually as “in-commuting nationals”.2
1 Temporary workers hired out abroad by employers to a third party for a fixed or open ended period cannot be subject of
quantitative data analysis, because it is impossible to categorise these workers under a specific border region since their place of work changes frequently and therefore cannot be determined exactly. However the qualitative analysis includes appraisements of on site experts concerning the kind and level of fixed term employment (see chapter 4.2.1).
2 This example is given for many Swedish workers who move their residence to Denmark. Similar conditions can also be assumed for German, Dutch and Swiss workers living outside their country of origin but commute back to their workplace in Germany/Netherlands/Switzerland, cf. MKW (2001): Scientific Report on Mobility of Cross-border Workers within the EEA, 19
Scientific Report on the Mobility of Cross-Border Workers within the EU-27/EEA/EFTA Countries
8
A second criterion is, that cross-border commuters must return to their main place of residence abroad at least once a week (temporal criterion).3
Having a look at the structure of cross-border commuters in border regions under study, this rigid definition implicates only types of daily and weekly commuting. But how to regard, consequently, workers who spend two or more contiguous weeks in the state of workplace before coming back to their country of residence, for long distances or in default of daily traffic connections? Moreover, appreciable numbers of seasonal workers working abroad for a special period of intense demand of workforce must also be taken into account – especially in Southern Europe, e.g. in the border region of Catalonia and Languedoc-Roussillon, as well as between EU-15 and EU-12 countries (e.g. Estonia-Finland; Hungary-Austria)4
Hence, it is necessary to broaden the definition above, in order to include real occurring forms of “long-term commuting” into cross-border analysis (also chapter 4.2.2.2): A periodical returning to the main place of residence is essential to satisfy the criterion of commuting, while the duration of working periods has to be extended from one week to several weeks or even months.
Definition of “border region“
The denotation “border region” like it is used in this study characterises the sum of administrative districts along a common border of two neighbouring countries. These districts are predominantly defined on NUTS 3 level, as proposed in the definition of EURES border regions. Exceptions5 are made where NUTS 3 units are too small-scaled to cover the entire border area, for example between Germany and Austria where administrative units are classified according to regional public employment services (PES) districts. With reference to the statistical data, this definition was used in order to ensure attainability and to provide comparability as accurately as possible.
Paying attention to the economic importance of urban agglomerations the range of coverage for potential commuting has to be extended. Correspondingly, also the existing transport infrastructure, e.g. fully developed highways or high-speed trains, as well as population or job density have a significant influence on the catchment area of a border region. Thus, cities located in a second row outside the border region like Berlin, Brussels, Cologne, Krakow or Vienna, are also subject to research activities.
To summarize, the subject of the study are all administrative units along the respective borders – whenever possible according to NUTS 3 definition – and in some cases units around urban centres in the second row.
3 Regulation (EEC) No. 1408/71, Article 1b). 4 In these border areas seasonal workers predominantly frequent branches like agriculture, construction and hotels/restaurants. 5 Exceptions: In Czech Republic, the Czech border regions of Slovakia and the Baltic countries areas are defined at LAU 1 level,
German (with the exception of the Danish border region, which is described at NUTS 3 level) and Austrian border regions are classified according to regional public employment services (PES) districts. The northern and middle part of the border region between Sweden and Finland is classified on a municipal level.
Scientific Report on the Mobility of Cross-Border Workers within the EU-27/EEA/EFTA Countries
9
3.2 Methodology
The research design is classified in two different methodologies, each carried out separately but analysed in combination for their main findings.
3.2.1 Data collection
As a first step, the data collection was set up, gathering statistical information concerning cross-border mobility in the EU-27, EEA/EFTA countries including Monaco and Andorra. With reference to data sources provided by government authorities, social insurance agencies and statistical offices as well as taking into account similar studies (e.g. feasibility studies EURES-T) data sheets have been prepared for all border regions under study. These regional data sheets are compiled in Annex B. The following basic indicators were observed per border region:
• number of inhabitants / area (sq km) / population density
• number of employees / employment rate
• number of unemployed / unemployment rate
• GDP (nominal) per capita / purchasing power parity per inhabitant.
Apart from these economic indicators the major part of the research was to gather the number of commuters for each border region (in- and out-commuters for both sides).
All collected data bases upon the temporal horizon of 2006-20076, the GDP-levels refer to 2005 (obtained from the Eurostat database, the most recent data on a regional dimension). Whenever available, earlier data was also included into the compilation, thus enabling statements to be made on recent labour market and mobility developments.
In contrast to basic indicators of economical and population statistics, regular data concerning commuting activities is rarely available – with only a few exceptions, namely Switzerland, Germany and Scandinavia – because monitoring is still missing or conducted in much lower frequency. In case of obsolete or unavailable data, appraisements and estimates are used in some border regions to assure an overall comparability of information.7 Some difficulty existed in different classifications of “cross-border workers” from country to country. Most countries record the number of in-commuting employees, obliged to pay social insurance taxes, but there is a different handling of self-employed workers and officials in assessing the total number of commuters. In general the number of commuters embraces all economically active cross-border workers (excluding students, apprentices). In case of a significant level of illegal employment, also illegal cross-border workers are included, if relevant statistics are available (e.g. Austria, Italy). Furthermore, the term “commuter” is sometimes falsely associated with migrants (i.e. legal alien residents with professional activity in the concerned country) and applied by official sides which lack regular statistical
6 Exceptions: For border regions LUX→B, SPA↔F and GER→DK the number of commuters refers to 2005, for SWE↔FIN to
2004. 7 Estimates are facilitated by use of additional qualitative data analysis as explained in 3.2. All estimated numbers are explicitly
labelled in the evaluation (see data sheets in Annex B).
Scientific Report on the Mobility of Cross-Border Workers within the EU-27/EEA/EFTA Countries
10
information about commuters8. In these cases, the number of foreign employees could be compared to the quantity of foreign residents, thus allowing extrapolations to the effective number of commuters in these areas.
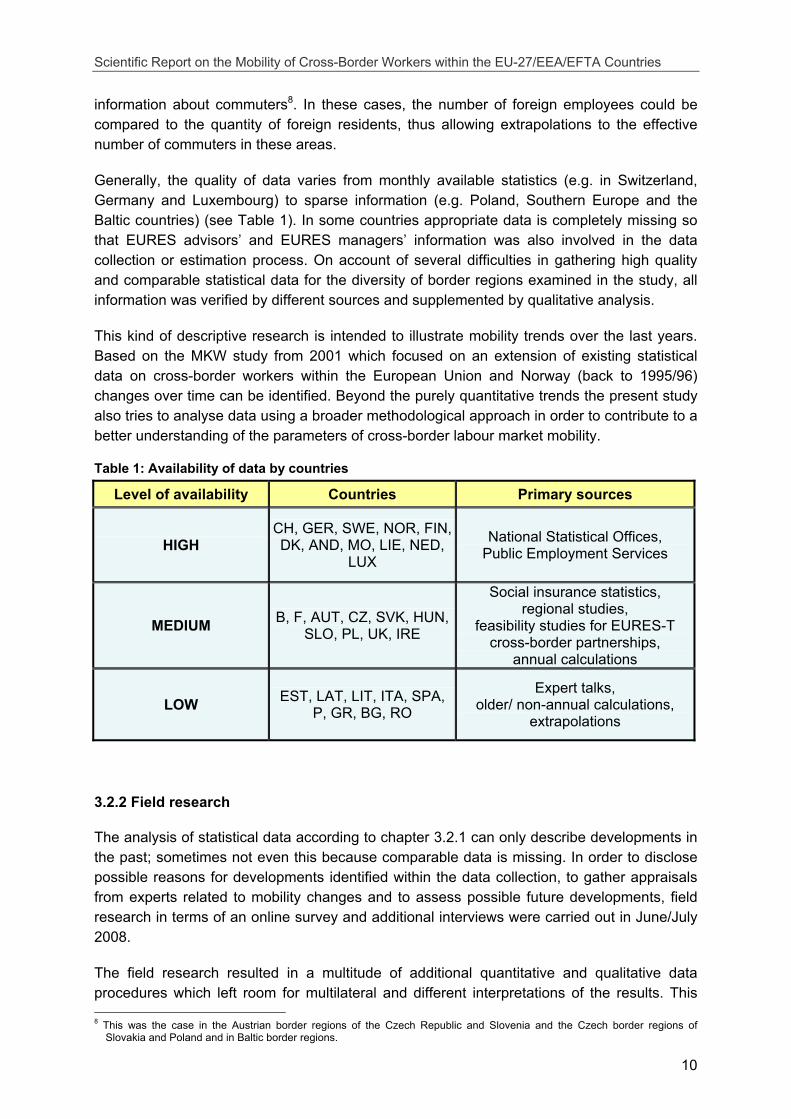
Generally, the quality of data varies from monthly available statistics (e.g. in Switzerland, Germany and Luxembourg) to sparse information (e.g. Poland, Southern Europe and the Baltic countries) (see Table 1). In some countries appropriate data is completely missing so that EURES advisors’ and EURES managers’ information was also involved in the data collection or estimation process. On account of several difficulties in gathering high quality and comparable statistical data for the diversity of border regions examined in the study, all information was verified by different sources and supplemented by qualitative analysis.
This kind of descriptive research is intended to illustrate mobility trends over the last years. Based on the MKW study from 2001 which focused on an extension of existing statistical data on cross-border workers within the European Union and Norway (back to 1995/96) changes over time can be identified. Beyond the purely quantitative trends the present study also tries to analyse data using a broader methodological approach in order to contribute to a better understanding of the parameters of cross-border labour market mobility.
Table 1: Availability of data by countries
Level of availability Countries Primary sources
HIGH CH, GER, SWE, NOR, FIN, DK, AND, MO, LIE, NED,
LUX
National Statistical Offices, Public Employment Services
MEDIUM B, F, AUT, CZ, SVK, HUN, SLO, PL, UK, IRE
Social insurance statistics, regional studies,
feasibility studies for EURES-T cross-border partnerships,
annual calculations
LOW EST, LAT, LIT, ITA, SPA, P, GR, BG, RO
Expert talks, older/ non-annual calculations,
extrapolations
3.2.2 Field research
The analysis of statistical data according to chapter 3.2.1 can only describe developments in the past; sometimes not even this because comparable data is missing. In order to disclose possible reasons for developments identified within the data collection, to gather appraisals from experts related to mobility changes and to assess possible future developments, field research in terms of an online survey and additional interviews were carried out in June/July 2008.
The field research resulted in a multitude of additional quantitative and qualitative data procedures which left room for multilateral and different interpretations of the results. This 8 This was the case in the Austrian border regions of the Czech Republic and Slovenia and the Czech border regions of
Slovakia and Poland and in Baltic border regions.
Scientific Report on the Mobility of Cross-Border Workers within the EU-27/EEA/EFTA Countries
11
procedure, scientifically described as “triangulation” of data obtained from different surveys, is particularly brought to bear in combining quantitative and qualitative analyses (Tashakkori, Teddlie 1998). Consequently, this research design was applied during the whole study, thus forming the fundament of empirical evidence.
3.2.2.1 Online survey
The aim of the online survey was to interview as many cross-border labour market experts as possible in a standardised way. The sample of the survey was made up by the entire EURES network, but also by additional experts (at government departments, universities, trade unions) who were named by members of the EURES network.
The questionnaire was available in three languages (English, German, French). First, respondents had to select their home country, organisation and border perspective. In order to identify the point of reference during the whole questionnaire each respondent had to choose which kind of commuting flow he/she is answering for: e.g. country A → country B (in-commuters to her/his home country).
The survey provided a set of qualitative statements (open answers) in addition to questions with a fixed structure of answers to the following topics:
• The most relevant branches of economic activity in the region of residence with regard to cross-border commuting from neighbouring country
• Major characteristics of commuters from across the border concerning their socio-economic background, qualifications, employment levels and commuting period
• The past and future development of cross-border commuting in the area under study (with special regard to the EU enlargement after 2004)
• Major obstacles on cross-border mobility (sorted by types of obstacles and intensity)
• Statements to current trends on employment and workers’ mobility in the European Union
Due to the fact that some people are experts for more than one border region (e.g. in Luxembourg), the possibility to answer the questionnaire several times was provided as well. However, these cases rarely occurred.
Before actually posting the questionnaire on the internet it was subject to a pre-test with about 30 participants in May 2008, which led to certain amendments and methodological adjustments.
Subsequently, the survey participants were informed about the survey by e-mail and asked to fill in the questionnaire. With regard to the sample, beside EURES managers, EURES advisors and EURES–T co-ordinators representing the majority of participants (see Figure 1), other experts with various backgrounds have been included (e.g. representatives of labour administrations, government departments, trade unions). In case of no response or absence
Scientific Report on the Mobility of Cross-Border Workers within the EU-27/EEA/EFTA Countries
12
the contacting procedure was repeated in several runs. With a sample size of about 1,000 addresses and a response rate of over 40% finally 440 completed data sets were obtained.9
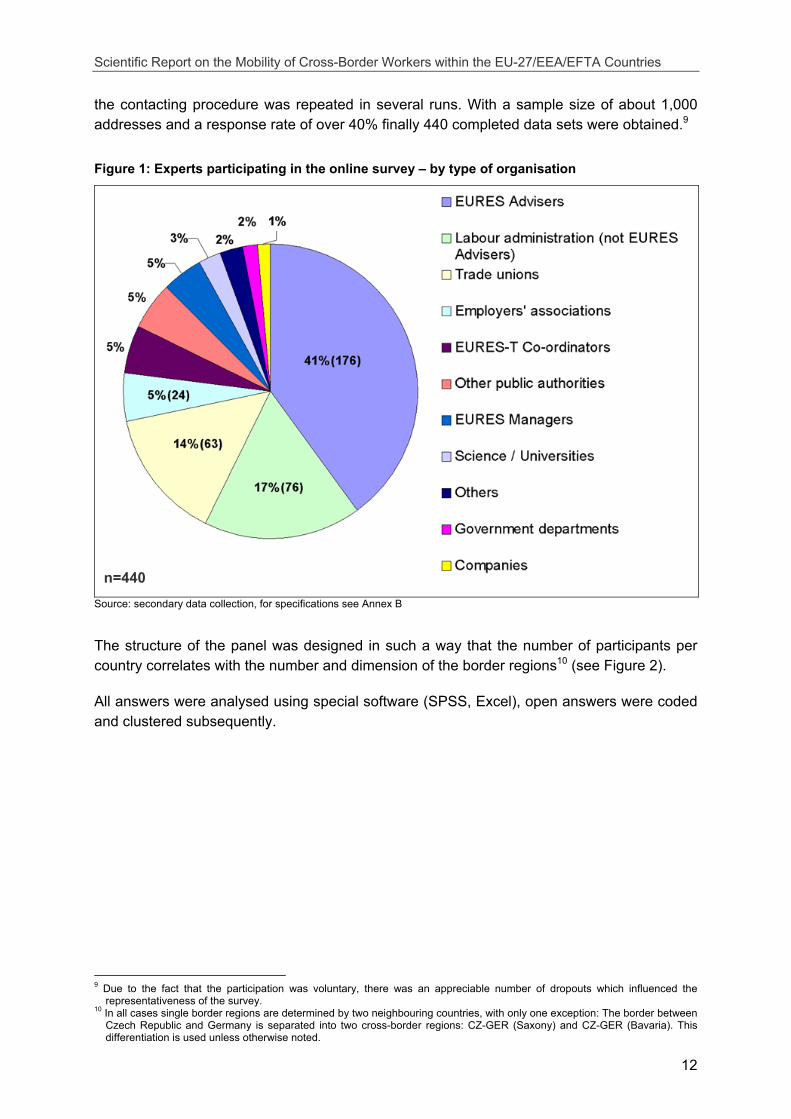
Figure 1: Experts participating in the online survey – by type of organisation
Source: secondary data collection, for specifications see Annex B
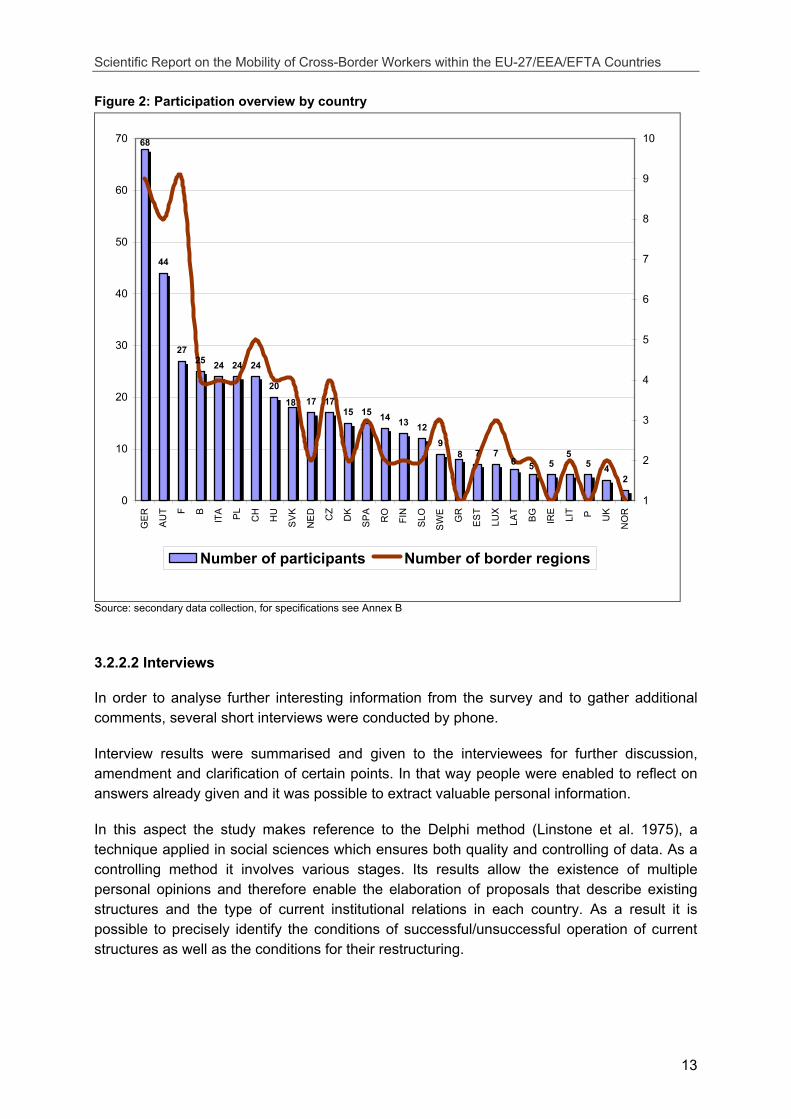
The structure of the panel was designed in such a way that the number of participants per country correlates with the number and dimension of the border regions10 (see Figure 2).
All answers were analysed using special software (SPSS, Excel), open answers were coded and clustered subsequently.
9 Due to the fact that the participation was voluntary, there was an appreciable number of dropouts which influenced the
representativeness of the survey. 10 In all cases single border regions are determined by two neighbouring countries, with only one exception: The border between
Czech Republic and Germany is separated into two cross-border regions: CZ-GER (Saxony) and CZ-GER (Bavaria). This differentiation is used unless otherwise noted.
n=440
Scientific Report on the Mobility of Cross-Border Workers within the EU-27/EEA/EFTA Countries
13
Figure 2: Participation overview by country
44
2725 24 24 24
2017 17
15 15 14 13 129
7 75 5 4
2
18
8 556
68
0
10
20
30
40
50
60
70G
ER
AU
T F B
ITA PL
CH
HU
SV
K
NE
D CZ
DK
SP
A
RO
FIN
SLO
SW
E
GR
ES
T
LUX
LAT
BG
IRE
LIT P
UK
NO
R
1
2
3
4
5
6
7
8
9
10
Number of participants Number of border regions
Source: secondary data collection, for specifications see Annex B
3.2.2.2 Interviews
In order to analyse further interesting information from the survey and to gather additional comments, several short interviews were conducted by phone.
Interview results were summarised and given to the interviewees for further discussion, amendment and clarification of certain points. In that way people were enabled to reflect on answers already given and it was possible to extract valuable personal information.
In this aspect the study makes reference to the Delphi method (Linstone et al. 1975), a technique applied in social sciences which ensures both quality and controlling of data. As a controlling method it involves various stages. Its results allow the existence of multiple personal opinions and therefore enable the elaboration of proposals that describe existing structures and the type of current institutional relations in each country. As a result it is possible to precisely identify the conditions of successful/unsuccessful operation of current structures as well as the conditions for their restructuring.
Scientific Report on the Mobility of Cross-Border Workers within the EU-27/EEA/EFTA Countries
14
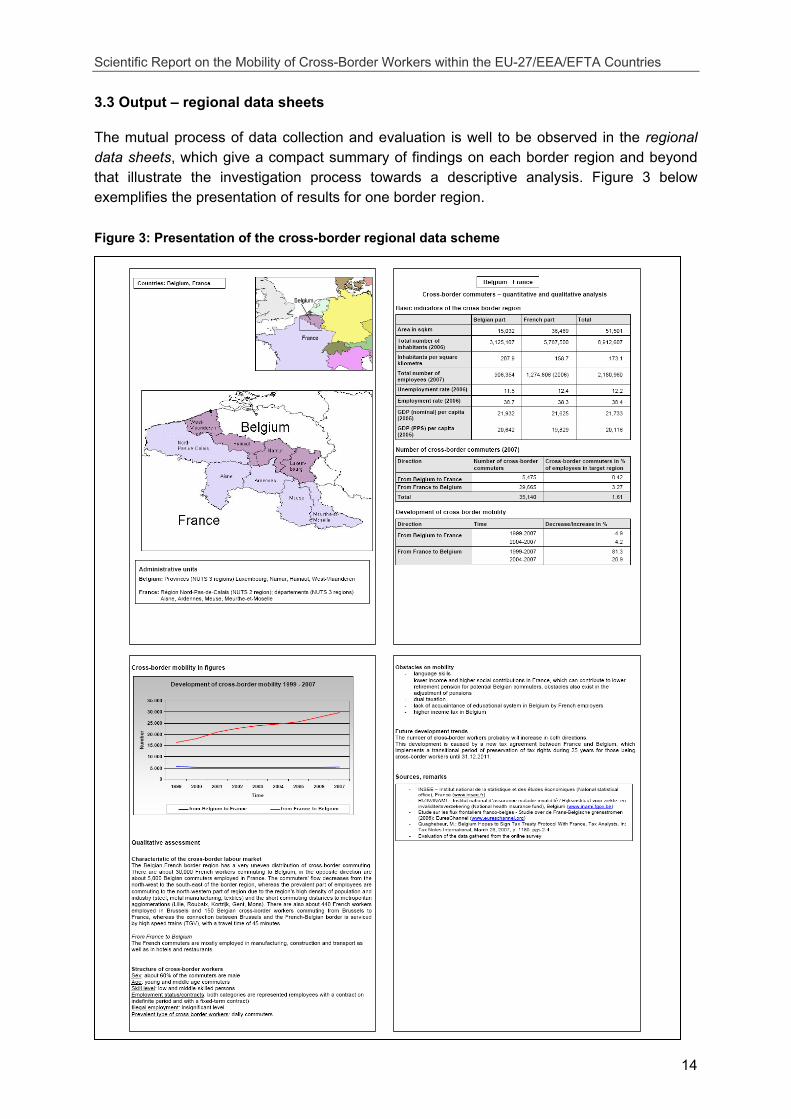
3.3 Output – regional data sheets
The mutual process of data collection and evaluation is well to be observed in the regional data sheets, which give a compact summary of findings on each border region and beyond that illustrate the investigation process towards a descriptive analysis. Figure 3 below exemplifies the presentation of results for one border region.
Figure 3: Presentation of the cross-border regional data scheme
Scientific Report on the Mobility of Cross-Border Workers within the EU-27/EEA/EFTA Countries
15
The sheet is divided up into four sections.
• The first section presents a geographical overview of the examined cross-border region in two maps. The first map depicts the wider geographical area, while the second map displays the border region in a detailed view, including the administrative units on both sides of the border.
• The second section describes the region and its commuting profile using quantitative data. It presents basic economic and geographical indicators, lists the number of cross-border commuters and its changes within the last decade. Additionally, the development of cross-border mobility is depicted in figures for areas with sufficiently high availability of data.
• A qualitative analysis of the cross-border region is given in the third section. Cross-border mobility and commuting flows are characterised on each side of the border separately. A qualitative assessment highlights the regional aspects of commuting, explains the socio-economic background of commuters and focuses on obstacles and future trends.
• The last section itemises the data sources and gives additional remarks concerning its availability or informative value.
Consequently the content of the data sheets – whose complete collection is presented in Annex B – contributes to two aspects of this evaluation. Firstly, it reveals the methodological approach underlining the representativeness of the study. In a second step a description of the results is undertaken, thus forming the base for detailed analysis in the following chapters.
Scientific Report on the Mobility of Cross-Border Workers within the EU-27/EEA/EFTA Countries
16
4 MAJOR FINDINGS ON CROSS-BORDER COMMUTING
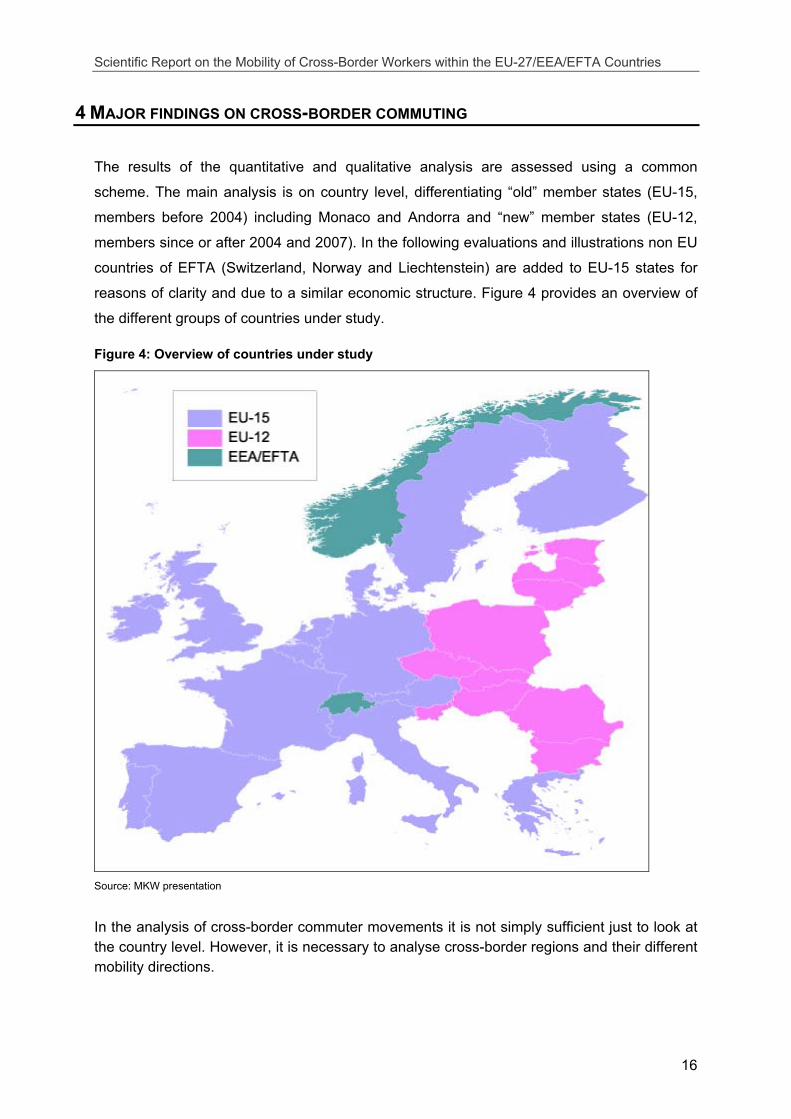
The results of the quantitative and qualitative analysis are assessed using a common
scheme. The main analysis is on country level, differentiating “old” member states (EU-15,
members before 2004) including Monaco and Andorra and “new” member states (EU-12,
members since or after 2004 and 2007). In the following evaluations and illustrations non EU
countries of EFTA (Switzerland, Norway and Liechtenstein) are added to EU-15 states for
reasons of clarity and due to a similar economic structure. Figure 4 provides an overview of
the different groups of countries under study.
Figure 4: Overview of countries under study
Source: MKW presentation
In the analysis of cross-border commuter movements it is not simply sufficient just to look at the country level. However, it is necessary to analyse cross-border regions and their different mobility directions.
Scientific Report on the Mobility of Cross-Border Workers within the EU-27/EEA/EFTA Countries
17
4.1 Quantitative analysis of cross-border commuting
4.1.1 Development of cross-border commuting in recent years
One can look at cross-border commuting in two different ways: from the country where cross-border commuters are living or from the country where they are working. In the following chapters we will use two technical terms for these two points of view:
• Out-commuting: the perspective that commuters leave their country of residence to work in a neighbouring country.
• In-commuting: the perspective that commuters from a neighbouring country enter the labour market of the respective country.
These two terms relate to the “push and pull factors” developed in migration theory (Lee 1972). According to the “push factors” theory poverty and unemployment push people away from their home region, thus regulating the level of “out-commuting”. In contrast “pull factors”, for example high income and good living conditions, attract people, “pulling” them towards a region; pull-factors regulate the level of “in-commuting”.
In the following chapters we will have a closer look at the development of out-commuting and in-commuting in the regions under study.
4.1.1.1 Development of out-commuting in recent years
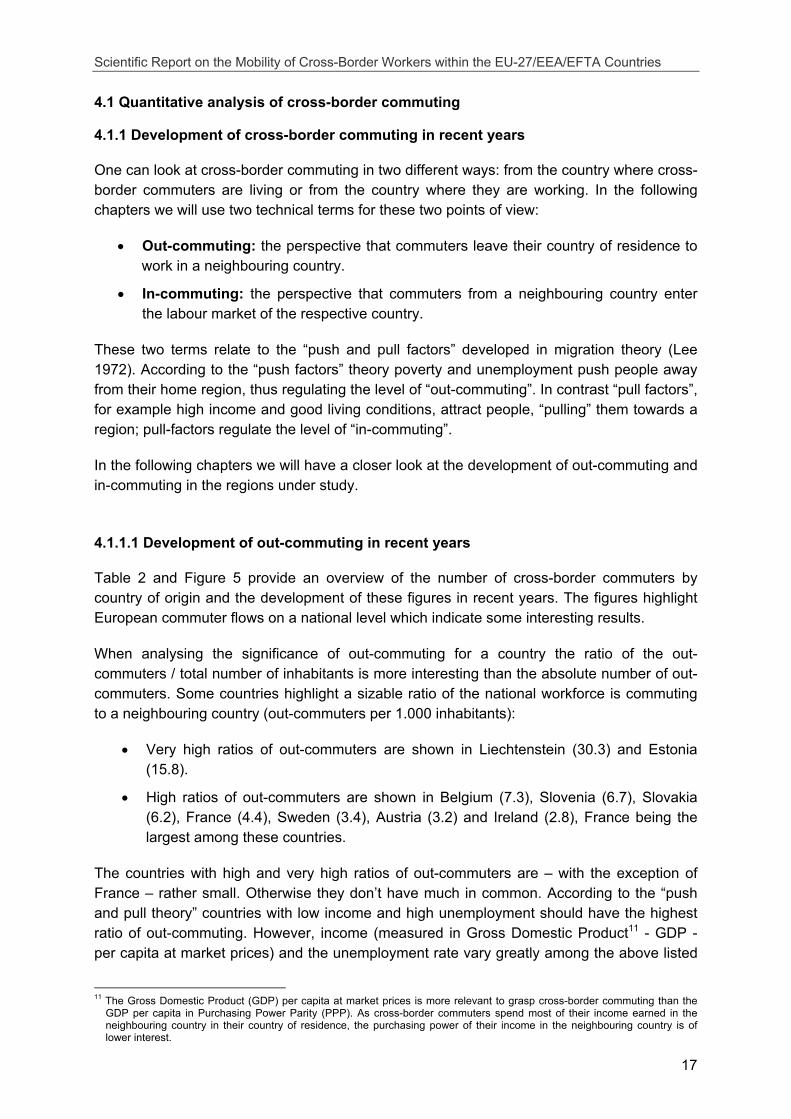
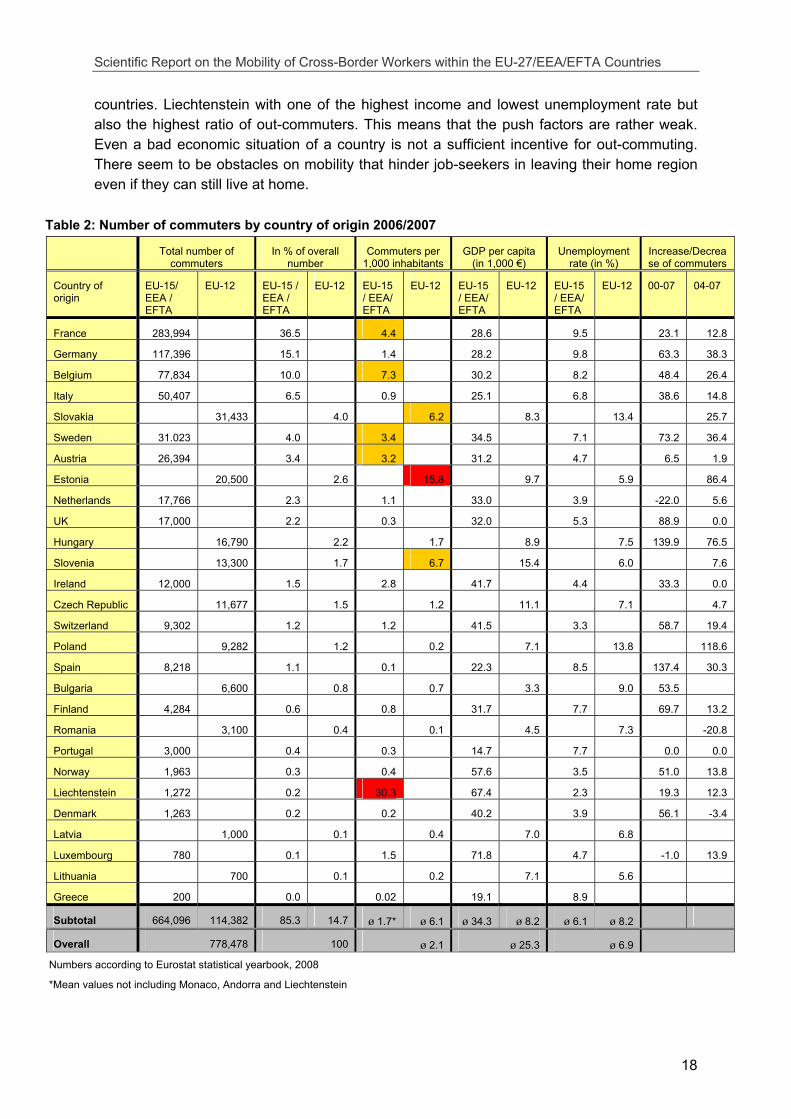
Table 2 and Figure 5 provide an overview of the number of cross-border commuters by country of origin and the development of these figures in recent years. The figures highlight European commuter flows on a national level which indicate some interesting results.
When analysing the significance of out-commuting for a country the ratio of the out-commuters / total number of inhabitants is more interesting than the absolute number of out-commuters. Some countries highlight a sizable ratio of the national workforce is commuting to a neighbouring country (out-commuters per 1.000 inhabitants):
• Very high ratios of out-commuters are shown in Liechtenstein (30.3) and Estonia (15.8).
• High ratios of out-commuters are shown in Belgium (7.3), Slovenia (6.7), Slovakia (6.2), France (4.4), Sweden (3.4), Austria (3.2) and Ireland (2.8), France being the largest among these countries.
The countries with high and very high ratios of out-commuters are – with the exception of France – rather small. Otherwise they don’t have much in common. According to the “push and pull theory” countries with low income and high unemployment should have the highest ratio of out-commuting. However, income (measured in Gross Domestic Product11 - GDP - per capita at market prices) and the unemployment rate vary greatly among the above listed
11 The Gross Domestic Product (GDP) per capita at market prices is more relevant to grasp cross-border commuting than the
GDP per capita in Purchasing Power Parity (PPP). As cross-border commuters spend most of their income earned in the neighbouring country in their country of residence, the purchasing power of their income in the neighbouring country is of lower interest.
Scientific Report on the Mobility of Cross-Border Workers within the EU-27/EEA/EFTA Countries
18
countries. Liechtenstein with one of the highest income and lowest unemployment rate but also the highest ratio of out-commuters. This means that the push factors are rather weak. Even a bad economic situation of a country is not a sufficient incentive for out-commuting. There seem to be obstacles on mobility that hinder job-seekers in leaving their home region even if they can still live at home.
Table 2: Number of commuters by country of origin 2006/2007
Total number of commuters
In % of overall number
Commuters per 1,000 inhabitants
GDP per capita (in 1,000 €)
Unemployment rate (in %)
Increase/Decrease of commuters
Country of origin
EU-15/ EEA / EFTA
EU-12 EU-15 / EEA / EFTA
EU-12 EU-15 / EEA/ EFTA
EU-12 EU-15 / EEA/ EFTA
EU-12 EU-15 / EEA/ EFTA
EU-12 00-07 04-07
France 283,994 36.5 4.4 28.6 9.5 23.1 12.8
Germany 117,396 15.1 1.4 28.2 9.8 63.3 38.3
Belgium 77,834 10.0 7.3 30.2 8.2 48.4 26.4
Italy 50,407 6.5 0.9 25.1 6.8 38.6 14.8
Slovakia 31,433 4.0 6.2 8.3 13.4 25.7
Sweden 31.023 4.0 3.4 34.5 7.1 73.2 36.4
Austria 26,394 3.4 3.2 31.2 4.7 6.5 1.9
Estonia 20,500 2.6 15.8 9.7 5.9 86.4
Netherlands 17,766 2.3 1.1 33.0 3.9 -22.0 5.6
UK 17,000 2.2 0.3 32.0 5.3 88.9 0.0
Hungary 16,790 2.2 1.7 8.9 7.5 139.9 76.5
Slovenia 13,300 1.7 6.7 15.4 6.0 7.6
Ireland 12,000 1.5 2.8 41.7 4.4 33.3 0.0
Czech Republic 11,677 1.5 1.2 11.1 7.1 4.7
Switzerland 9,302 1.2 1.2 41.5 3.3 58.7 19.4
Poland 9,282 1.2 0.2 7.1 13.8 118.6
Spain 8,218 1.1 0.1 22.3 8.5 137.4 30.3
Bulgaria 6,600 0.8 0.7 3.3 9.0 53.5
Finland 4,284 0.6 0.8 31.7 7.7 69.7 13.2
Romania 3,100 0.4 0.1 4.5 7.3 -20.8
Portugal 3,000 0.4 0.3 14.7 7.7 0.0 0.0
Norway 1,963 0.3 0.4 57.6 3.5 51.0 13.8
Liechtenstein 1,272 0.2 30.3 67.4 2.3 19.3 12.3
Denmark 1,263 0.2 0.2 40.2 3.9 56.1 -3.4
Latvia 1,000 0.1 0.4 7.0 6.8
Luxembourg 780 0.1 1.5 71.8 4.7 -1.0 13.9
Lithuania 700 0.1 0.2 7.1 5.6
Greece 200 0.0 0.02 19.1 8.9
Subtotal 664,096 114,382 85.3 14.7 ø 1.7* ø 6.1 ø 34.3 ø 8.2 ø 6.1 ø 8.2
Overall 778,478 100 ø 2.1 ø 25.3 ø 6.9
Numbers according to Eurostat statistical yearbook, 2008
*Mean values not including Monaco, Andorra and Liechtenstein
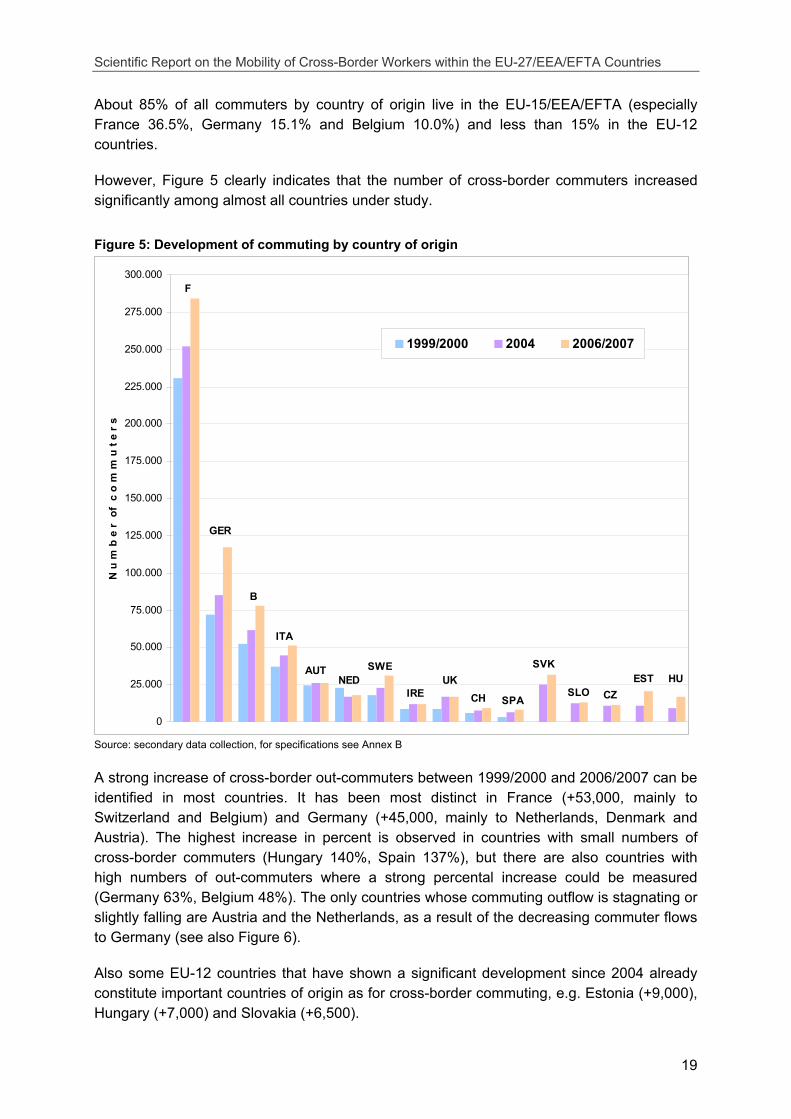
Scientific Report on the Mobility of Cross-Border Workers within the EU-27/EEA/EFTA Countries
19
About 85% of all commuters by country of origin live in the EU-15/EEA/EFTA (especially France 36.5%, Germany 15.1% and Belgium 10.0%) and less than 15% in the EU-12 countries.
However, Figure 5 clearly indicates that the number of cross-border commuters increased significantly among almost all countries under study.
Figure 5: Development of commuting by country of origin
HUESTCZSLO
SVK
SPACHUK
IRE
SWENED
AUT
ITA
B
GER
F
0
25.000
50.000
75.000
100.000
125.000
150.000
175.000
200.000
225.000
250.000
275.000
300.000
N u
m b
e r
of
c o
m m
u t
e r
s
1999/2000 2004 2006/2007
Source: secondary data collection, for specifications see Annex B
A strong increase of cross-border out-commuters between 1999/2000 and 2006/2007 can be identified in most countries. It has been most distinct in France (+53,000, mainly to Switzerland and Belgium) and Germany (+45,000, mainly to Netherlands, Denmark and Austria). The highest increase in percent is observed in countries with small numbers of cross-border commuters (Hungary 140%, Spain 137%), but there are also countries with high numbers of out-commuters where a strong percental increase could be measured (Germany 63%, Belgium 48%). The only countries whose commuting outflow is stagnating or slightly falling are Austria and the Netherlands, as a result of the decreasing commuter flows to Germany (see also Figure 6).
Also some EU-12 countries that have shown a significant development since 2004 already constitute important countries of origin as for cross-border commuting, e.g. Estonia (+9,000), Hungary (+7,000) and Slovakia (+6,500).
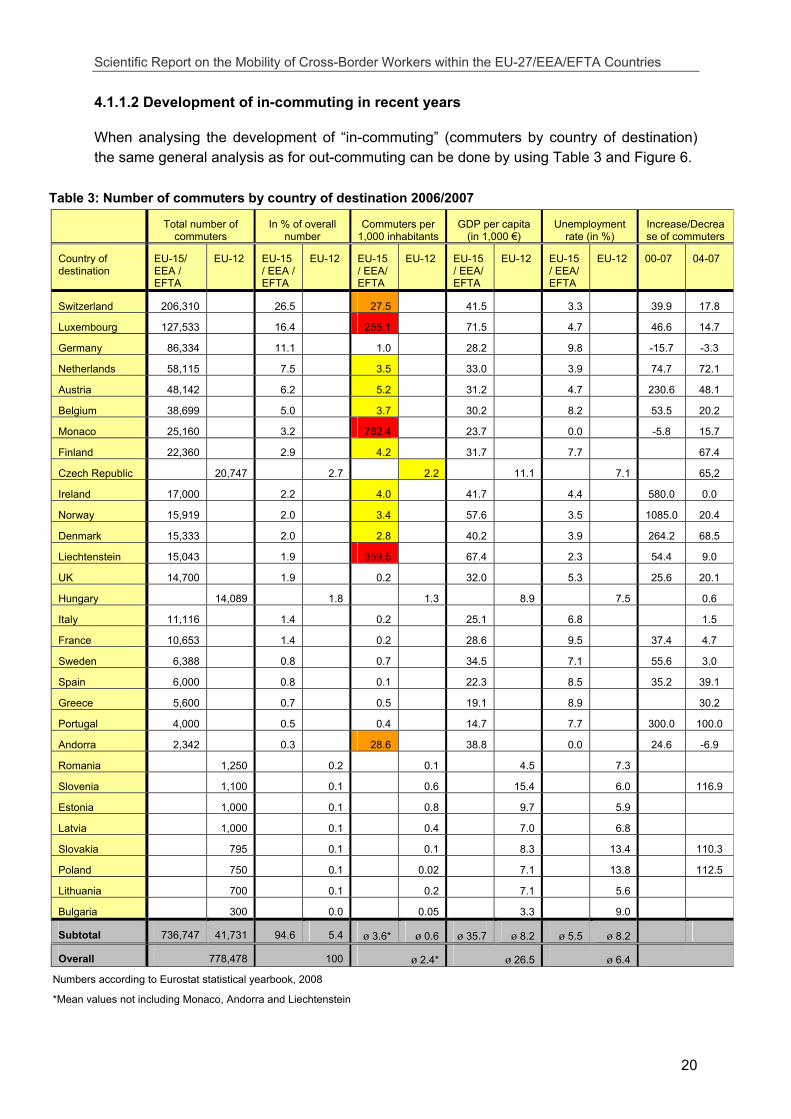
Scientific Report on the Mobility of Cross-Border Workers within the EU-27/EEA/EFTA Countries
20
4.1.1.2 Development of in-commuting in recent years
When analysing the development of “in-commuting” (commuters by country of destination) the same general analysis as for out-commuting can be done by using Table 3 and Figure 6.
Table 3: Number of commuters by country of destination 2006/2007
Total number of commuters
In % of overall number
Commuters per 1,000 inhabitants
GDP per capita (in 1,000 €)
Unemployment rate (in %)
Increase/Decrease of commuters
Country of destination
EU-15/ EEA / EFTA
EU-12 EU-15 / EEA / EFTA
EU-12 EU-15 / EEA/ EFTA
EU-12 EU-15 / EEA/ EFTA
EU-12 EU-15 / EEA/ EFTA
EU-12 00-07 04-07
Switzerland 206,310 26.5 27.5 41.5 3.3 39.9 17.8
Luxembourg 127,533 16.4 255.1 71.5 4.7 46.6 14.7
Germany 86,334 11.1 1.0 28.2 9.8 -15.7 -3.3
Netherlands 58,115 7.5 3.5 33.0 3.9 74.7 72.1
Austria 48,142 6.2 5.2 31.2 4.7 230.6 48.1
Belgium 38,699 5.0 3.7 30.2 8.2 53.5 20.2
Monaco 25,160 3.2 762.4 23.7 0.0 -5.8 15.7
Finland 22,360 2.9 4.2 31.7 7.7 67.4
Czech Republic 20,747 2.7 2.2 11.1 7.1 65,2
Ireland 17,000 2.2 4.0 41.7 4.4 580.0 0.0
Norway 15,919 2.0 3.4 57.6 3.5 1085.0 20.4
Denmark 15,333 2.0 2.8 40.2 3.9 264.2 68.5
Liechtenstein 15,043 1.9 359.5 67.4 2.3 54.4 9.0
UK 14,700 1.9 0.2 32.0 5.3 25.6 20.1
Hungary 14,089 1.8 1.3 8.9 7.5 0.6
Italy 11,116 1.4 0.2 25.1 6.8 1.5
France 10,653 1.4 0.2 28.6 9.5 37.4 4.7
Sweden 6,388 0.8 0.7 34.5 7.1 55.6 3.0
Spain 6,000 0.8 0.1 22.3 8.5 35.2 39.1
Greece 5,600 0.7 0.5 19.1 8.9 30.2
Portugal 4,000 0.5 0.4 14.7 7.7 300.0 100.0
Andorra 2,342 0.3 28.6 38.8 0.0 24.6 -6.9
Romania 1,250 0.2 0.1 4.5 7.3
Slovenia 1,100 0.1 0.6 15.4 6.0 116.9
Estonia 1,000 0.1 0.8 9.7 5.9
Latvia 1,000 0.1 0.4 7.0 6.8
Slovakia 795 0.1 0.1 8.3 13.4 110.3
Poland 750 0.1 0.02 7.1 13.8 112.5
Lithuania 700 0.1 0.2 7.1 5.6
Bulgaria 300 0.0 0.05 3.3 9.0
Subtotal 736,747 41,731 94.6 5.4 ø 3.6* ø 0.6 ø 35.7 ø 8.2 ø 5.5 ø 8.2
Overall 778,478 100 ø 2.4* ø 26.5 ø 6.4 Numbers according to Eurostat statistical yearbook, 2008
*Mean values not including Monaco, Andorra and Liechtenstein
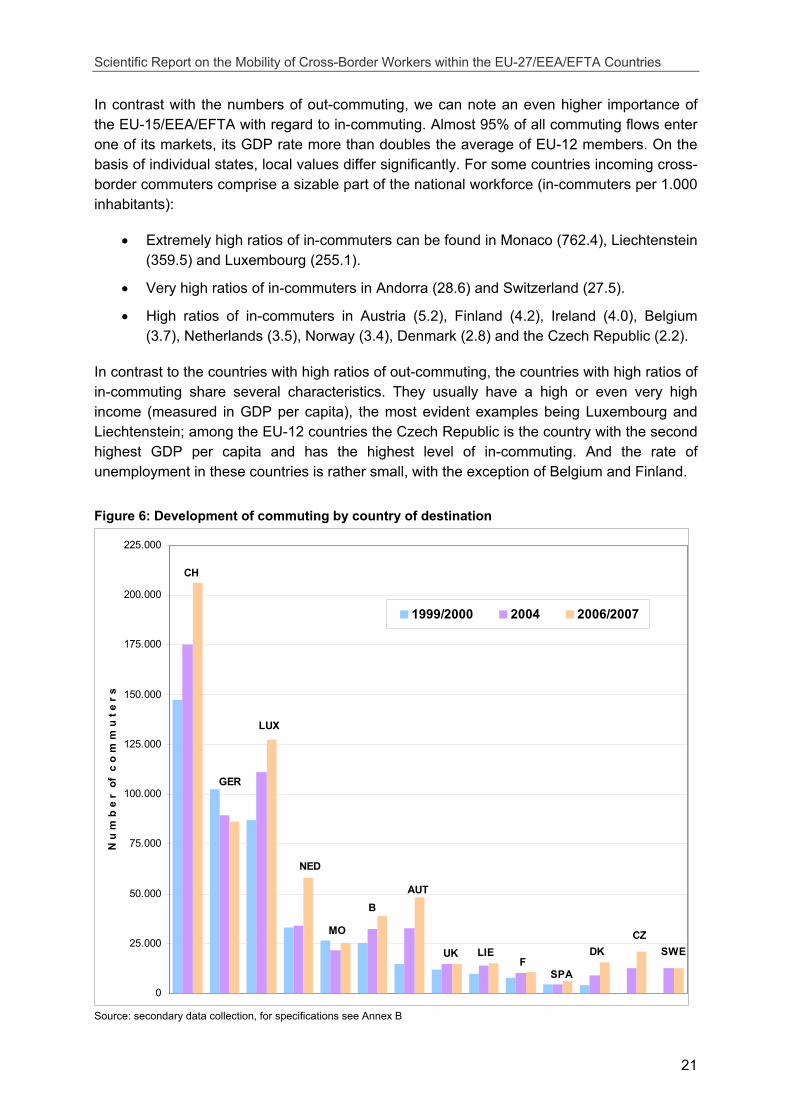
Scientific Report on the Mobility of Cross-Border Workers within the EU-27/EEA/EFTA Countries
21
In contrast with the numbers of out-commuting, we can note an even higher importance of the EU-15/EEA/EFTA with regard to in-commuting. Almost 95% of all commuting flows enter one of its markets, its GDP rate more than doubles the average of EU-12 members. On the basis of individual states, local values differ significantly. For some countries incoming cross-border commuters comprise a sizable part of the national workforce (in-commuters per 1.000 inhabitants):
• Extremely high ratios of in-commuters can be found in Monaco (762.4), Liechtenstein (359.5) and Luxembourg (255.1).
• Very high ratios of in-commuters in Andorra (28.6) and Switzerland (27.5).
• High ratios of in-commuters in Austria (5.2), Finland (4.2), Ireland (4.0), Belgium (3.7), Netherlands (3.5), Norway (3.4), Denmark (2.8) and the Czech Republic (2.2).
In contrast to the countries with high ratios of out-commuting, the countries with high ratios of in-commuting share several characteristics. They usually have a high or even very high income (measured in GDP per capita), the most evident examples being Luxembourg and Liechtenstein; among the EU-12 countries the Czech Republic is the country with the second highest GDP per capita and has the highest level of in-commuting. And the rate of unemployment in these countries is rather small, with the exception of Belgium and Finland.
Figure 6: Development of commuting by country of destination
SWECZ
DK
SPAF
LIEUK
AUTB
MO
NED
LUX
GER
CH
0
25.000
50.000
75.000
100.000
125.000
150.000
175.000
200.000
225.000
N u
m b
e r
of
c o
m m
u t
e r
s
1999/2000 2004 2006/2007
Source: secondary data collection, for specifications see Annex B
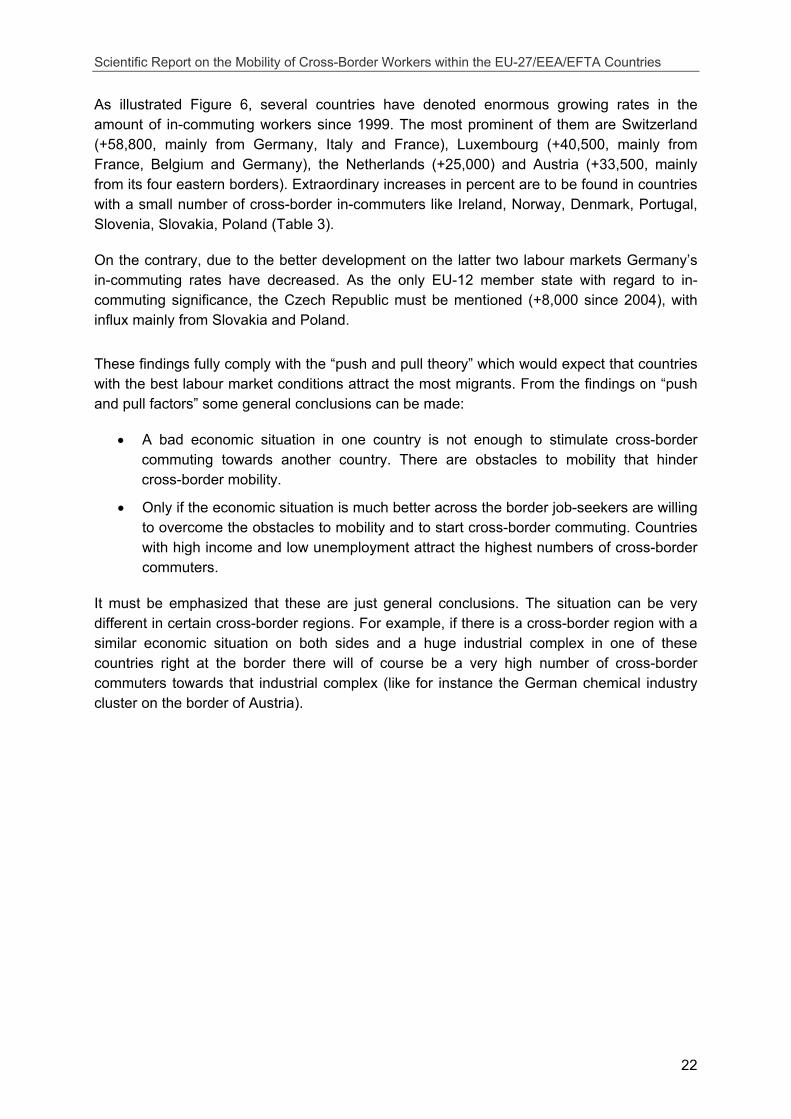
Scientific Report on the Mobility of Cross-Border Workers within the EU-27/EEA/EFTA Countries
22
As illustrated Figure 6, several countries have denoted enormous growing rates in the amount of in-commuting workers since 1999. The most prominent of them are Switzerland (+58,800, mainly from Germany, Italy and France), Luxembourg (+40,500, mainly from France, Belgium and Germany), the Netherlands (+25,000) and Austria (+33,500, mainly from its four eastern borders). Extraordinary increases in percent are to be found in countries with a small number of cross-border in-commuters like Ireland, Norway, Denmark, Portugal, Slovenia, Slovakia, Poland (Table 3).
On the contrary, due to the better development on the latter two labour markets Germany’s in-commuting rates have decreased. As the only EU-12 member state with regard to in-commuting significance, the Czech Republic must be mentioned (+8,000 since 2004), with influx mainly from Slovakia and Poland.
These findings fully comply with the “push and pull theory” which would expect that countries with the best labour market conditions attract the most migrants. From the findings on “push and pull factors” some general conclusions can be made:
• A bad economic situation in one country is not enough to stimulate cross-border commuting towards another country. There are obstacles to mobility that hinder cross-border mobility.
• Only if the economic situation is much better across the border job-seekers are willing to overcome the obstacles to mobility and to start cross-border commuting. Countries with high income and low unemployment attract the highest numbers of cross-border commuters.
It must be emphasized that these are just general conclusions. The situation can be very different in certain cross-border regions. For example, if there is a cross-border region with a similar economic situation on both sides and a huge industrial complex in one of these countries right at the border there will of course be a very high number of cross-border commuters towards that industrial complex (like for instance the German chemical industry cluster on the border of Austria).

Scientific Report on the Mobility of Cross-Border Workers within the EU-27/EEA/EFTA Countries
23
4.1.1.3 Level of commuting
The following section gives an overview of the commuting balance by countries (i.e. the number of in-commuters minus number of out-commuters). The balance of commuters is depicted in absolute numbers in Figure 7, the ratio of net commuters converted into a coloured gradation. Contrastingly, the level of commuting has to be considered for each of the surveyed national border regions (Table 4). For this purpose the number of commuters was put in relation to the number of employees in each border region, both for in- and out-commuters. The resulting percentage gives information about the share of commuting in the regional labour markets and a common level to compare local values for countries of origin and countries of destination.
The populous countries generally have more out-commuters than in-commuters while small countries are often augmenting their workforce by high numbers of in-commuters. In most EU-12 countries cross-border commuting still is insignificant for the national labour market. The highest density of commuting streams, however, is still concentrated in the Central-Western-European area (along the Brunet’s “blue banana”, except for UK). The six states of Switzerland, Germany, France and the Benelux countries are responsible for nearly two thirds of all studied commuting flows and the numbers continue to rise. Additionally, some important developments in the eastern direction have been discovered in the area of Austria and its neighbouring countries and in the Scandinavian area. For the eastern, western and southern outer scopes of the studied area cross-border commuting still plays a marginal role.
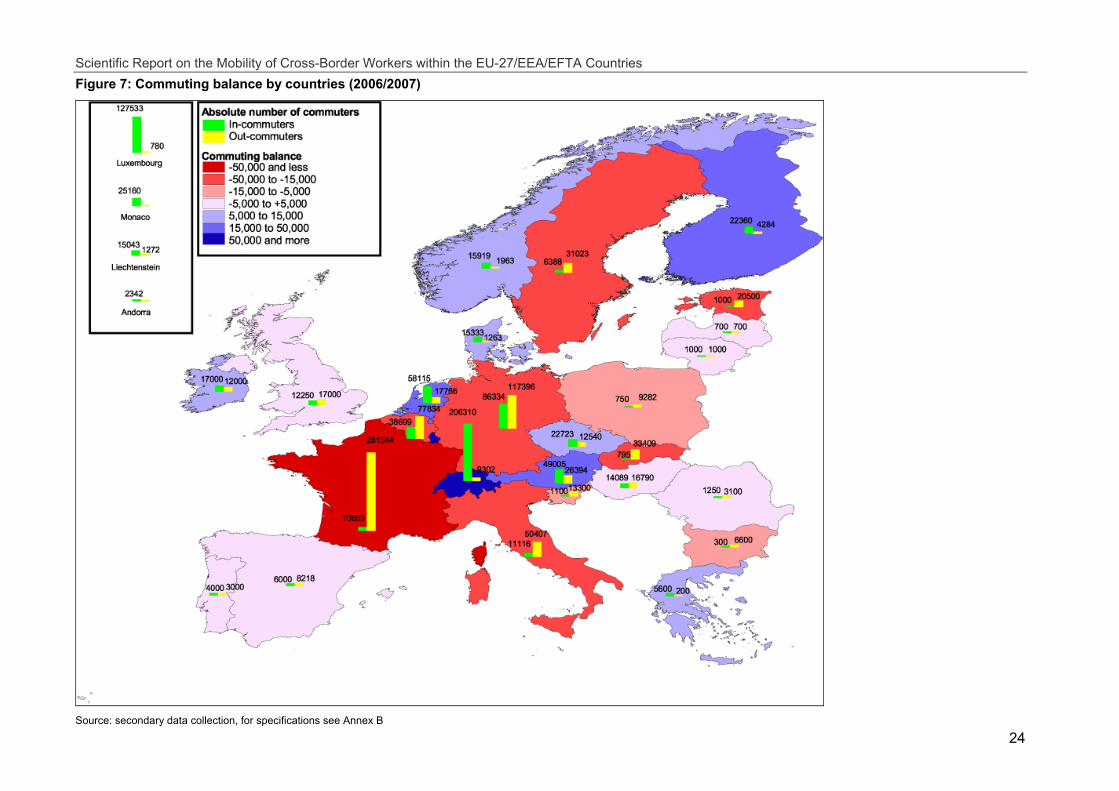
Scientific Report on the Mobility of Cross-Border Workers within the EU-27/EEA/EFTA Countries
24
Figure 7: Commuting balance by countries (2006/2007)
Source: secondary data collection, for specifications see Annex B
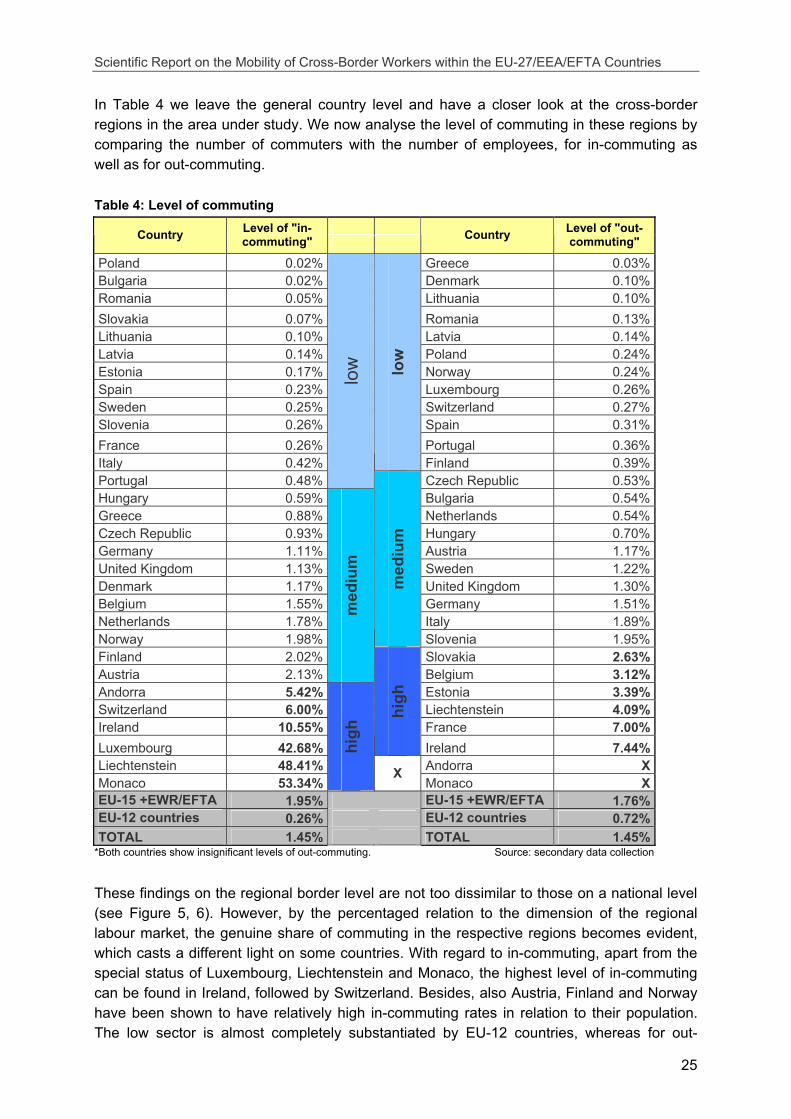
Scientific Report on the Mobility of Cross-Border Workers within the EU-27/EEA/EFTA Countries
25
In Table 4 we leave the general country level and have a closer look at the cross-border regions in the area under study. We now analyse the level of commuting in these regions by comparing the number of commuters with the number of employees, for in-commuting as well as for out-commuting.
Table 4: Level of commuting
Country Level of "in-commuting"
Country Level of "out-commuting"
Poland 0.02% Greece 0.03% Bulgaria 0.02% Denmark 0.10% Romania 0.05% Lithuania 0.10% Slovakia 0.07% Romania 0.13% Lithuania 0.10% Latvia 0.14% Latvia 0.14% Poland 0.24% Estonia 0.17% Norway 0.24% Spain 0.23% Luxembourg 0.26% Sweden 0.25% Switzerland 0.27% Slovenia 0.26% Spain 0.31% France 0.26% Portugal 0.36% Italy 0.42%
low
Finland 0.39% Portugal 0.48%
low
Czech Republic 0.53% Hungary 0.59% Bulgaria 0.54% Greece 0.88% Netherlands 0.54% Czech Republic 0.93% Hungary 0.70% Germany 1.11% Austria 1.17% United Kingdom 1.13% Sweden 1.22% Denmark 1.17% United Kingdom 1.30% Belgium 1.55% Germany 1.51% Netherlands 1.78% Italy 1.89% Norway 1.98%
med
ium
Slovenia 1.95% Finland 2.02% Slovakia 2.63% Austria 2.13%
med
ium
Belgium 3.12% Andorra 5.42% Estonia 3.39% Switzerland 6.00% Liechtenstein 4.09% Ireland 10.55% France 7.00% Luxembourg 42.68%
high
Ireland 7.44% Liechtenstein 48.41% Andorra X Monaco 53.34%
high
X Monaco X
EU-15 +EWR/EFTA 1.95% EU-15 +EWR/EFTA 1.76% EU-12 countries 0.26% EU-12 countries 0.72% TOTAL 1.45% TOTAL 1.45%
*Both countries show insignificant levels of out-commuting. Source: secondary data collection
These findings on the regional border level are not too dissimilar to those on a national level (see Figure 5, 6). However, by the percentaged relation to the dimension of the regional labour market, the genuine share of commuting in the respective regions becomes evident, which casts a different light on some countries. With regard to in-commuting, apart from the special status of Luxembourg, Liechtenstein and Monaco, the highest level of in-commuting can be found in Ireland, followed by Switzerland. Besides, also Austria, Finland and Norway have been shown to have relatively high in-commuting rates in relation to their population. The low sector is almost completely substantiated by EU-12 countries, whereas for out-
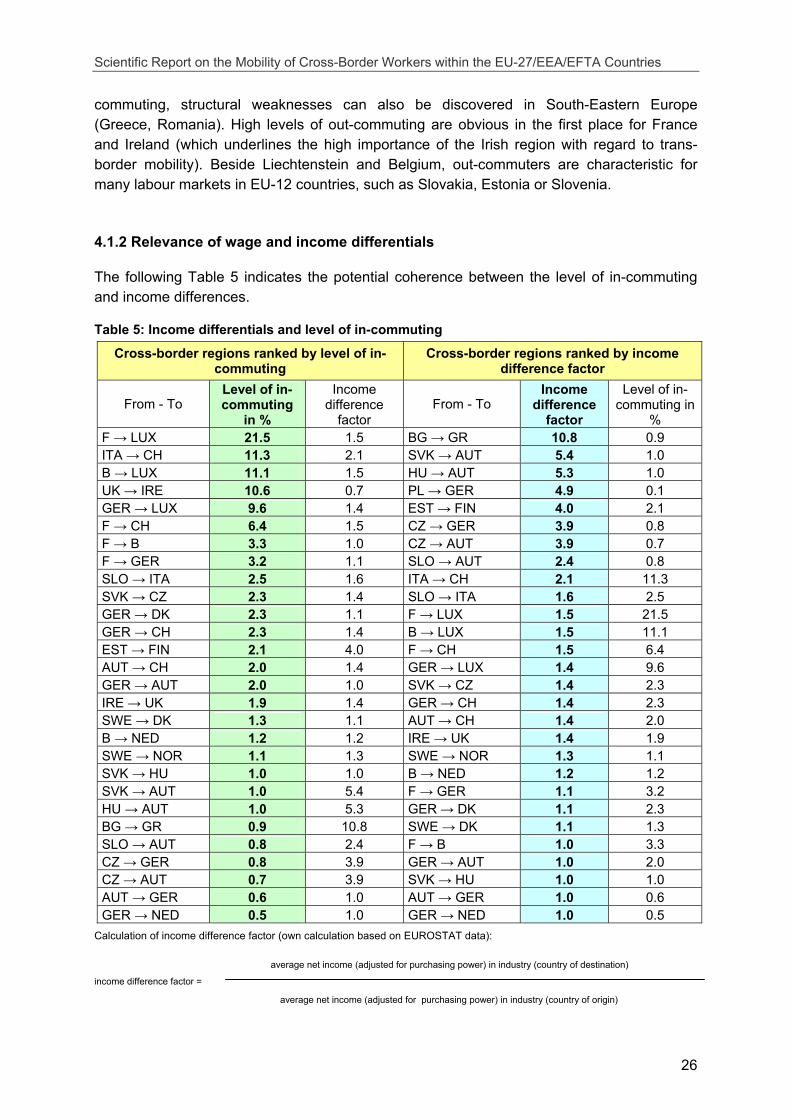
Scientific Report on the Mobility of Cross-Border Workers within the EU-27/EEA/EFTA Countries
26
commuting, structural weaknesses can also be discovered in South-Eastern Europe (Greece, Romania). High levels of out-commuting are obvious in the first place for France and Ireland (which underlines the high importance of the Irish region with regard to trans-border mobility). Beside Liechtenstein and Belgium, out-commuters are characteristic for many labour markets in EU-12 countries, such as Slovakia, Estonia or Slovenia.
4.1.2 Relevance of wage and income differentials
The following Table 5 indicates the potential coherence between the level of in-commuting and income differences.
Table 5: Income differentials and level of in-commuting
Cross-border regions ranked by level of in-commuting
Cross-border regions ranked by income difference factor
From - To Level of in-commuting
in %
Income difference
factor From - To
Income difference
factor
Level of in-commuting in
% F → LUX 21.5 1.5 BG → GR 10.8 0.9 ITA → CH 11.3 2.1 SVK → AUT 5.4 1.0 B → LUX 11.1 1.5 HU → AUT 5.3 1.0 UK → IRE 10.6 0.7 PL → GER 4.9 0.1 GER → LUX 9.6 1.4 EST → FIN 4.0 2.1 F → CH 6.4 1.5 CZ → GER 3.9 0.8 F → B 3.3 1.0 CZ → AUT 3.9 0.7 F → GER 3.2 1.1 SLO → AUT 2.4 0.8 SLO → ITA 2.5 1.6 ITA → CH 2.1 11.3 SVK → CZ 2.3 1.4 SLO → ITA 1.6 2.5 GER → DK 2.3 1.1 F → LUX 1.5 21.5 GER → CH 2.3 1.4 B → LUX 1.5 11.1 EST → FIN 2.1 4.0 F → CH 1.5 6.4 AUT → CH 2.0 1.4 GER → LUX 1.4 9.6 GER → AUT 2.0 1.0 SVK → CZ 1.4 2.3 IRE → UK 1.9 1.4 GER → CH 1.4 2.3 SWE → DK 1.3 1.1 AUT → CH 1.4 2.0 B → NED 1.2 1.2 IRE → UK 1.4 1.9 SWE → NOR 1.1 1.3 SWE → NOR 1.3 1.1 SVK → HU 1.0 1.0 B → NED 1.2 1.2 SVK → AUT 1.0 5.4 F → GER 1.1 3.2 HU → AUT 1.0 5.3 GER → DK 1.1 2.3 BG → GR 0.9 10.8 SWE → DK 1.1 1.3 SLO → AUT 0.8 2.4 F → B 1.0 3.3 CZ → GER 0.8 3.9 GER → AUT 1.0 2.0 CZ → AUT 0.7 3.9 SVK → HU 1.0 1.0 AUT → GER 0.6 1.0 AUT → GER 1.0 0.6 GER → NED 0.5 1.0 GER → NED 1.0 0.5
Calculation of income difference factor (own calculation based on EUROSTAT data):
average net income (adjusted for purchasing power) in industry (country of destination)
income difference factor =
average net income (adjusted for purchasing power) in industry (country of origin)
Scientific Report on the Mobility of Cross-Border Workers within the EU-27/EEA/EFTA Countries
27
In general high levels of commuting is attended by a significant income difference (factors of a minimum of 1 or more than 1) e.g. by commuting from France to Luxembourg, from Italy to Switzerland, from Belgium to Luxembourg, from Germany to Luxembourg or from France to Switzerland. That means that cross-border workers can expect a higher income in general in the country of destination. However the macroeconomic examination of income differences by commuting from the UK (Northern Ireland) to Ireland (with a high level of commuting and an adverse income difference factor of 0.7) or commuting from Slovakia to Austria, from Hungary to Austria, from Bulgaria to Greece or from Poland to Germany (with a low level of commuting and high income difference factors between 4.9 to 10.8) thwart this statistical interpretation. Thus it is assumed that income differences between two countries are a necessary condition for cross-border commuting in general, but essentially this is not a sufficient explanation to depict cross-border mobility phenomena and trends.
Better employment opportunities, the availability and type of jobs, labour market restrictions (e.g. for EU-12 countries), social systems, geographical and social barriers and not least individual opportunity and risk assessment etc. compose special conditions which strongly influence cross-border labour mobility and dynamics between two countries in particular within cross-border regions.
Therefore the following chapter deals with a quality analysis of cross-border mobility patterns and will expose the complexity and diversity of the subject.
4.2 Qualitative analysis of cross-border commuting
The analyses carried out in the course of this chapter are based upon qualitative statements made by labour market experts and therefore do not depict absolute ratios with regard to commuting numbers. However, this empirical method ensures the highest possible coverage of validity, given a comprehensive study like the one in hand, and hereby facilitates an analytical level of comparison. What is more, the respondents’ expertise (each of them representing a larger entity of commuters in answering) at least allows conclusions on representative numbers.
4.2.1 Most important branches of cross-border commuting
The present chapter illustrates specific branches being relevant for commuting activities in several border regions based upon assessments of local labour market experts (n=363). Appraisements were given using a 5-level scale, whereas “5“ corresponds to the highest and “1” to the lowest value.
The outcome of this is, that results in terms of generated indices show just relative correlations, in no particular case in a direct proportion of 1:1 to absolute numbers of commuters. By contrast detailed and regularly statistics in Germany and Switzerland facilitate analysis of exactly relations of branches to concrete commuting flows, therefore these data is illustrated in an appropriate way within this chapter. The breakdown of branches follows the official NACE classification. The table below (Table 6) shows an
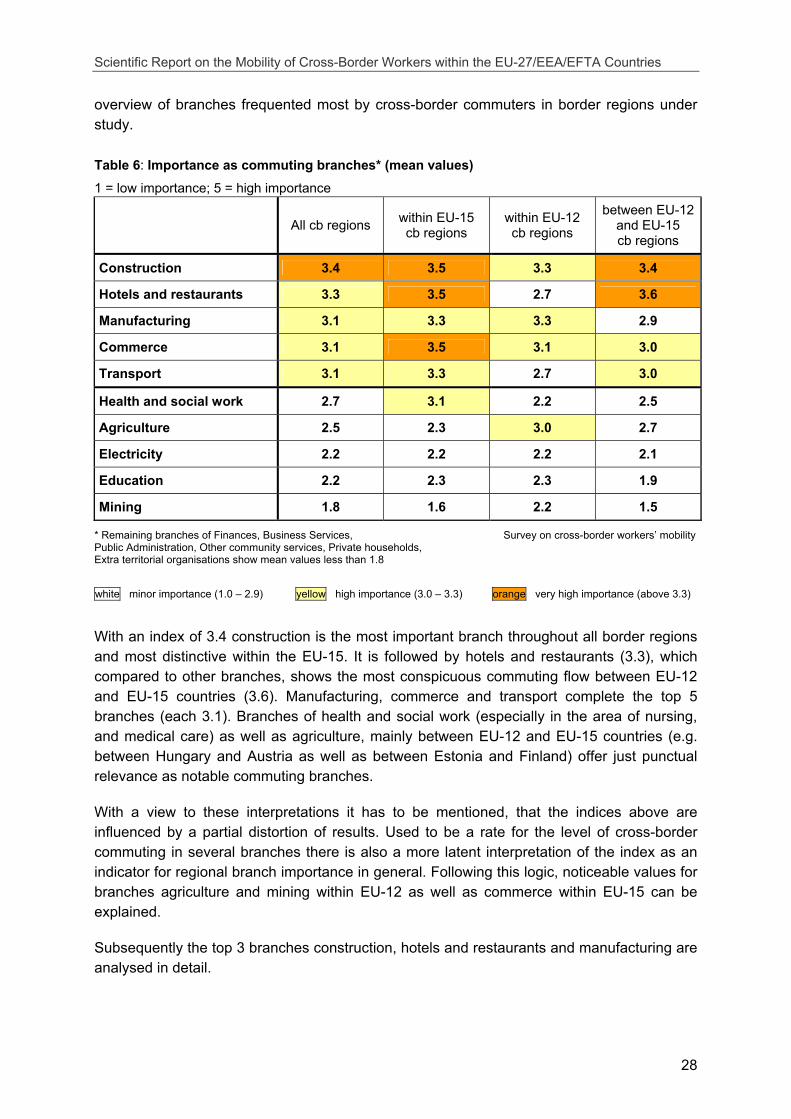
Scientific Report on the Mobility of Cross-Border Workers within the EU-27/EEA/EFTA Countries
28
overview of branches frequented most by cross-border commuters in border regions under study.
Table 6: Importance as commuting branches* (mean values) 1 = low importance; 5 = high importance
All cb regions within EU-15
cb regions within EU-12 cb regions
between EU-12 and EU-15 cb regions
Construction 3.4 3.5 3.3 3.4
Hotels and restaurants 3.3 3.5 2.7 3.6
Manufacturing 3.1 3.3 3.3 2.9
Commerce 3.1 3.5 3.1 3.0
Transport 3.1 3.3 2.7 3.0
Health and social work 2.7 3.1 2.2 2.5
Agriculture 2.5 2.3 3.0 2.7
Electricity 2.2 2.2 2.2 2.1
Education 2.2 2.3 2.3 1.9
Mining 1.8 1.6 2.2 1.5
* Remaining branches of Finances, Business Services, Survey on cross-border workers’ mobility Public Administration, Other community services, Private households, Extra territorial organisations show mean values less than 1.8
white minor importance (1.0 – 2.9) yellow high importance (3.0 – 3.3) orange very high importance (above 3.3)
With an index of 3.4 construction is the most important branch throughout all border regions and most distinctive within the EU-15. It is followed by hotels and restaurants (3.3), which compared to other branches, shows the most conspicuous commuting flow between EU-12 and EU-15 countries (3.6). Manufacturing, commerce and transport complete the top 5 branches (each 3.1). Branches of health and social work (especially in the area of nursing, and medical care) as well as agriculture, mainly between EU-12 and EU-15 countries (e.g. between Hungary and Austria as well as between Estonia and Finland) offer just punctual relevance as notable commuting branches.
With a view to these interpretations it has to be mentioned, that the indices above are influenced by a partial distortion of results. Used to be a rate for the level of cross-border commuting in several branches there is also a more latent interpretation of the index as an indicator for regional branch importance in general. Following this logic, noticeable values for branches agriculture and mining within EU-12 as well as commerce within EU-15 can be explained.
Subsequently the top 3 branches construction, hotels and restaurants and manufacturing are analysed in detail.
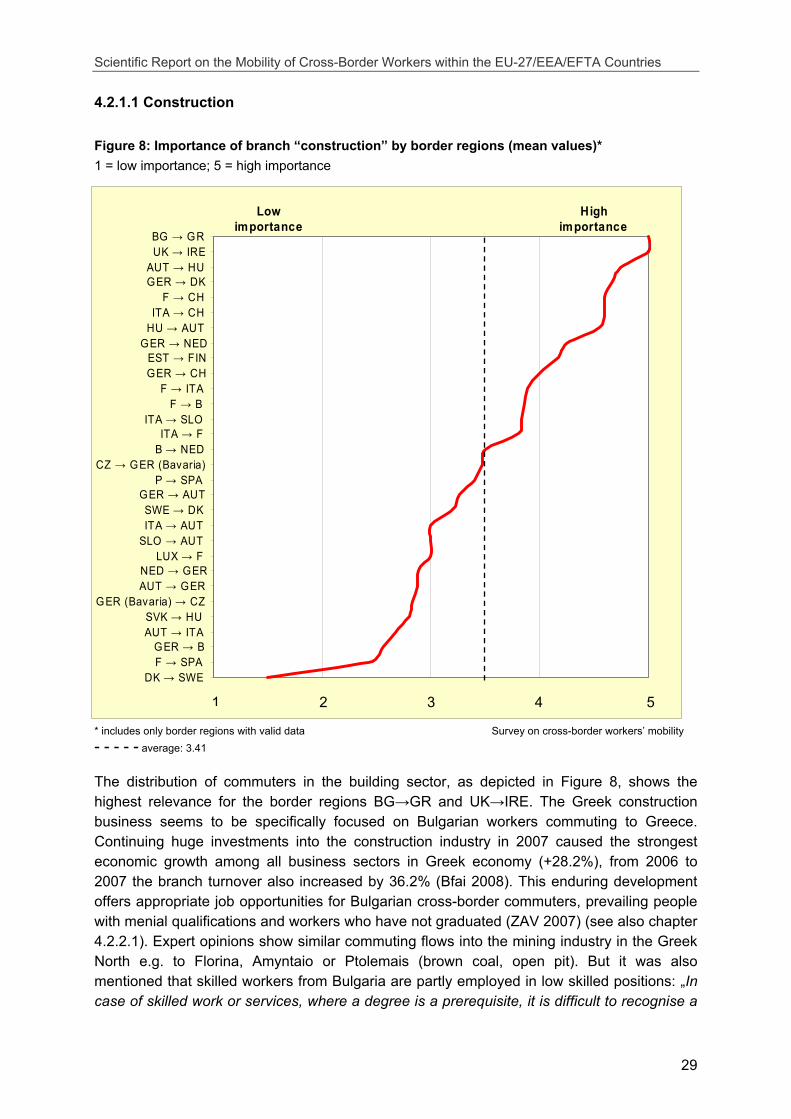
Scientific Report on the Mobility of Cross-Border Workers within the EU-27/EEA/EFTA Countries
29
BG → GRUK → IRE
AUT → HUGER → DK
F → CHITA → CH
HU → AUTGER → NED
EST → FINGER → CH
F → ITAF → B
ITA → SLOITA → F
B → NEDCZ → GER (Bavaria)
P → SPAGER → AUTSWE → DKITA → AUT
SLO → AUTLUX → F
NED → GERAUT → GER
GER (Bavaria) → CZSVK → HUAUT → ITA
GER → B F → SPA
DK → SWE
Low importance
High importance
4.2.1.1 Construction
Figure 8: Importance of branch “construction” by border regions (mean values)* 1 = low importance; 5 = high importance
* includes only border regions with valid data Survey on cross-border workers’ mobility - - - - - average: 3.41 The distribution of commuters in the building sector, as depicted in Figure 8, shows the highest relevance for the border regions BG→GR and UK→IRE. The Greek construction business seems to be specifically focused on Bulgarian workers commuting to Greece. Continuing huge investments into the construction industry in 2007 caused the strongest economic growth among all business sectors in Greek economy (+28.2%), from 2006 to 2007 the branch turnover also increased by 36.2% (Bfai 2008). This enduring development offers appropriate job opportunities for Bulgarian cross-border commuters, prevailing people with menial qualifications and workers who have not graduated (ZAV 2007) (see also chapter 4.2.2.1). Expert opinions show similar commuting flows into the mining industry in the Greek North e.g. to Florina, Amyntaio or Ptolemais (brown coal, open pit). But it was also mentioned that skilled workers from Bulgaria are partly employed in low skilled positions: „In case of skilled work or services, where a degree is a prerequisite, it is difficult to recognise a
1 2 3 4 5
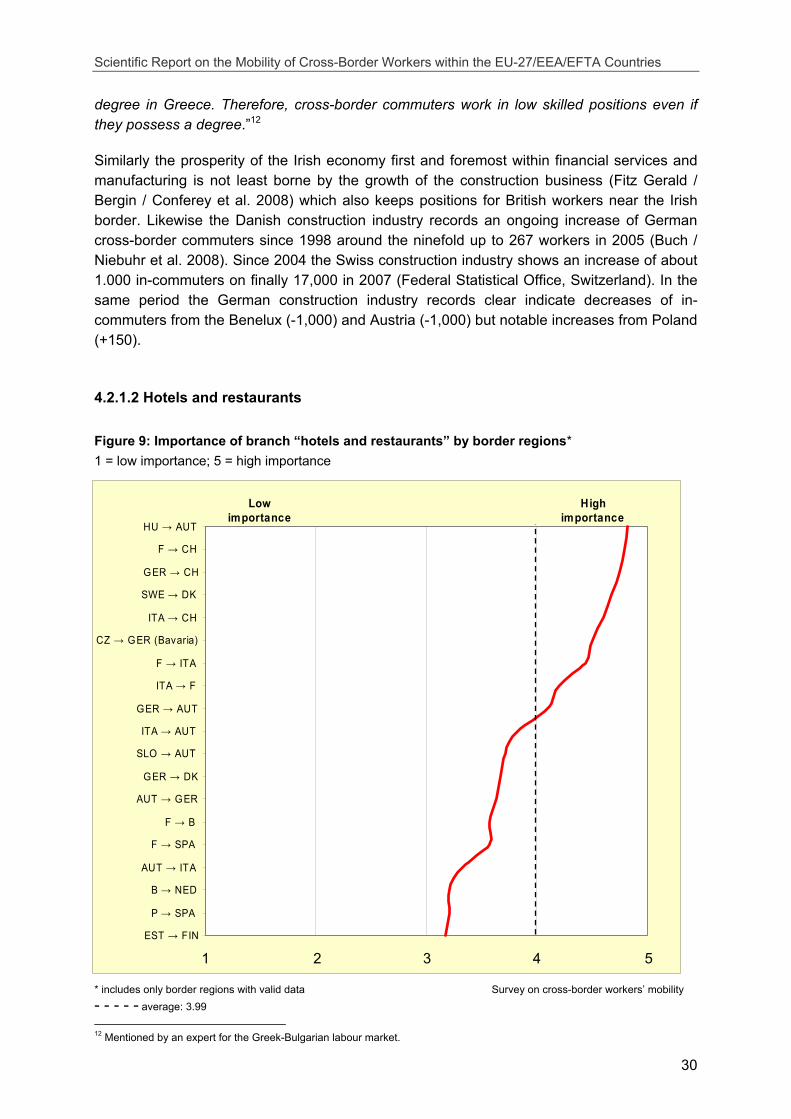
Scientific Report on the Mobility of Cross-Border Workers within the EU-27/EEA/EFTA Countries
30
HU → AUT
F → CH
GER → CH
SWE → DK
ITA → CH
CZ → GER (Bavaria)
F → ITA
ITA → F
GER → AUT
ITA → AUT
SLO → AUT
GER → DK
AUT → GER
F → B
F → SPA
AUT → ITA
B → NED
P → SPA
EST → FIN
Low importance
High importance
degree in Greece. Therefore, cross-border commuters work in low skilled positions even if they possess a degree.”12
Similarly the prosperity of the Irish economy first and foremost within financial services and manufacturing is not least borne by the growth of the construction business (Fitz Gerald / Bergin / Conferey et al. 2008) which also keeps positions for British workers near the Irish border. Likewise the Danish construction industry records an ongoing increase of German cross-border commuters since 1998 around the ninefold up to 267 workers in 2005 (Buch / Niebuhr et al. 2008). Since 2004 the Swiss construction industry shows an increase of about 1.000 in-commuters on finally 17,000 in 2007 (Federal Statistical Office, Switzerland). In the same period the German construction industry records clear indicate decreases of in-commuters from the Benelux (-1,000) and Austria (-1,000) but notable increases from Poland (+150).
4.2.1.2 Hotels and restaurants
Figure 9: Importance of branch “hotels and restaurants” by border regions* 1 = low importance; 5 = high importance
* includes only border regions with valid data Survey on cross-border workers’ mobility - - - - - average: 3.99 12 Mentioned by an expert for the Greek-Bulgarian labour market.
1 2 3 4 5
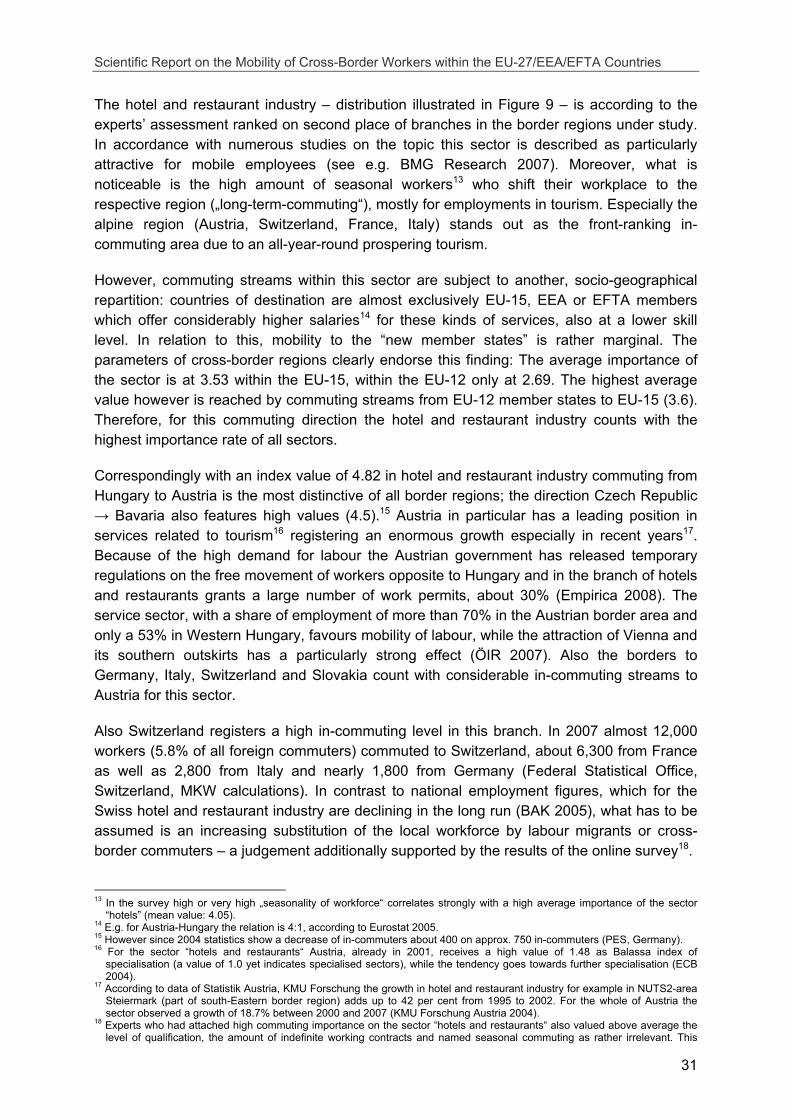
Scientific Report on the Mobility of Cross-Border Workers within the EU-27/EEA/EFTA Countries
31
The hotel and restaurant industry – distribution illustrated in Figure 9 – is according to the experts’ assessment ranked on second place of branches in the border regions under study. In accordance with numerous studies on the topic this sector is described as particularly attractive for mobile employees (see e.g. BMG Research 2007). Moreover, what is noticeable is the high amount of seasonal workers13 who shift their workplace to the respective region („long-term-commuting“), mostly for employments in tourism. Especially the alpine region (Austria, Switzerland, France, Italy) stands out as the front-ranking in-commuting area due to an all-year-round prospering tourism.
However, commuting streams within this sector are subject to another, socio-geographical repartition: countries of destination are almost exclusively EU-15, EEA or EFTA members which offer considerably higher salaries14 for these kinds of services, also at a lower skill level. In relation to this, mobility to the “new member states” is rather marginal. The parameters of cross-border regions clearly endorse this finding: The average importance of the sector is at 3.53 within the EU-15, within the EU-12 only at 2.69. The highest average value however is reached by commuting streams from EU-12 member states to EU-15 (3.6). Therefore, for this commuting direction the hotel and restaurant industry counts with the highest importance rate of all sectors.
Correspondingly with an index value of 4.82 in hotel and restaurant industry commuting from Hungary to Austria is the most distinctive of all border regions; the direction Czech Republic → Bavaria also features high values (4.5).15 Austria in particular has a leading position in services related to tourism16 registering an enormous growth especially in recent years17. Because of the high demand for labour the Austrian government has released temporary regulations on the free movement of workers opposite to Hungary and in the branch of hotels and restaurants grants a large number of work permits, about 30% (Empirica 2008). The service sector, with a share of employment of more than 70% in the Austrian border area and only a 53% in Western Hungary, favours mobility of labour, while the attraction of Vienna and its southern outskirts has a particularly strong effect (ÖIR 2007). Also the borders to Germany, Italy, Switzerland and Slovakia count with considerable in-commuting streams to Austria for this sector.
Also Switzerland registers a high in-commuting level in this branch. In 2007 almost 12,000 workers (5.8% of all foreign commuters) commuted to Switzerland, about 6,300 from France as well as 2,800 from Italy and nearly 1,800 from Germany (Federal Statistical Office, Switzerland, MKW calculations). In contrast to national employment figures, which for the Swiss hotel and restaurant industry are declining in the long run (BAK 2005), what has to be assumed is an increasing substitution of the local workforce by labour migrants or cross-border commuters – a judgement additionally supported by the results of the online survey18.
13 In the survey high or very high „seasonality of workforce“ correlates strongly with a high average importance of the sector
“hotels” (mean value: 4.05). 14 E.g. for Austria-Hungary the relation is 4:1, according to Eurostat 2005. 15 However since 2004 statistics show a decrease of in-commuters about 400 on approx. 750 in-commuters (PES, Germany). 16 For the sector “hotels and restaurants“ Austria, already in 2001, receives a high value of 1.48 as Balassa index of
specialisation (a value of 1.0 yet indicates specialised sectors), while the tendency goes towards further specialisation (ECB 2004).
17 According to data of Statistik Austria, KMU Forschung the growth in hotel and restaurant industry for example in NUTS2-area Steiermark (part of south-Eastern border region) adds up to 42 per cent from 1995 to 2002. For the whole of Austria the sector observed a growth of 18.7% between 2000 and 2007 (KMU Forschung Austria 2004).
18 Experts who had attached high commuting importance on the sector “hotels and restaurants“ also valued above average the level of qualification, the amount of indefinite working contracts and named seasonal commuting as rather irrelevant. This
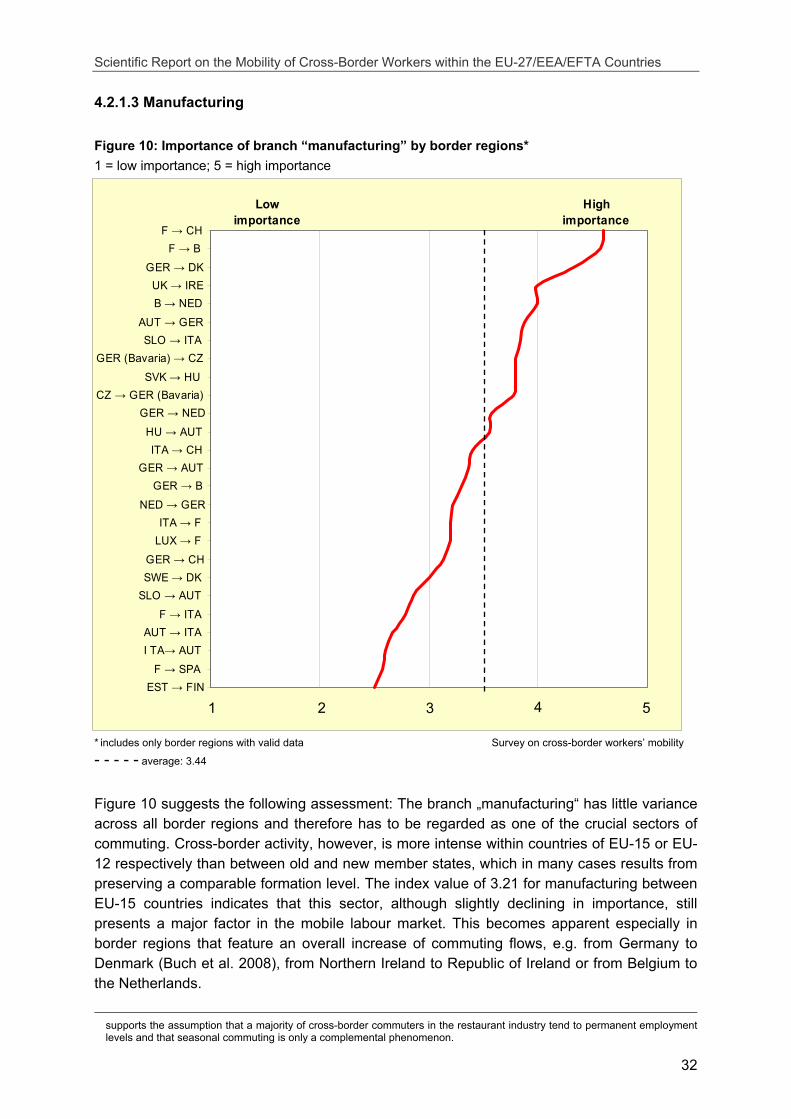
Scientific Report on the Mobility of Cross-Border Workers within the EU-27/EEA/EFTA Countries
32
4.2.1.3 Manufacturing
Figure 10: Importance of branch “manufacturing” by border regions* 1 = low importance; 5 = high importance
F → CHF → B
GER → DKUK → IREB → NED
AUT → GERSLO → ITA
GER (Bavaria) → CZSVK → HU
CZ → GER (Bavaria)GER → NED
HU → AUTITA → CH
GER → AUTGER → B
NED → GERITA → F
LUX → FGER → CHSWE → DK
SLO → AUTF → ITA
AUT → ITAI TA→ AUT
F → SPAEST → FIN
Low importance
High importance
* includes only border regions with valid data Survey on cross-border workers’ mobility
- - - - - average: 3.44
Figure 10 suggests the following assessment: The branch „manufacturing“ has little variance across all border regions and therefore has to be regarded as one of the crucial sectors of commuting. Cross-border activity, however, is more intense within countries of EU-15 or EU-12 respectively than between old and new member states, which in many cases results from preserving a comparable formation level. The index value of 3.21 for manufacturing between EU-15 countries indicates that this sector, although slightly declining in importance, still presents a major factor in the mobile labour market. This becomes apparent especially in border regions that feature an overall increase of commuting flows, e.g. from Germany to Denmark (Buch et al. 2008), from Northern Ireland to Republic of Ireland or from Belgium to the Netherlands.
supports the assumption that a majority of cross-border commuters in the restaurant industry tend to permanent employment levels and that seasonal commuting is only a complemental phenomenon.
1 2 3 4 5
Scientific Report on the Mobility of Cross-Border Workers within the EU-27/EEA/EFTA Countries
33
Yet, the highest single values are assigned to French commuters who work in Switzerland (4.60) or Belgium (4.57). France for this sector offer the largest number of out-commuters, both to Switzerland and to the Belgian border region, where the amount of French commuters in industrial work is 44%, more than twice the average national proportion (EURES Channel 2006). For Switzerland, holding the highest net surplus of commuters (see chapter 4.1.1.3), manufacturing constitutes the most important branch with almost 65.000 (32%) of total commuters (Swiss Federal Statistical Office 2008). The crucial factor is often an enormous wage differential: the average monthly earning of a skilled worker in the production sector mounts up to a good 4,000 € in Western Switzerland. Additionally, this sector’s attractiveness often arises from highly specialised companies which tend to recruit more and more highly skilled craftsmen from the neighbouring countries, while at the national Swiss level numbers of industrial firms and of industrial employees are receding.
On the contrary, regarding the new member states exclusively, the index value of 3.28 for manufacturing points out this sector’s continuous importance in the national economies of accessing countries19. Here, employment mainly grows in middle and lower skilled, manual based jobs.
Some lower commuting quotas are found between old and new EU-member states, which is to be explained partly by high qualification levels for this branch within EU-15, partly by political restrictions (allocation of quotas for foreign workers) on certain sectors. For several of these border regions however, manufacturing constitutes the most important commuting sector, e.g. for SLO→ITA or GER↔CZ20.
We can thus confirm the assertion that the manufacturing sector is one of the key areas of EU cross-border commuting, but particularly concentrated in regions with a comparable economic level.
4.2.1.4 Other branches
The sector commerce, sales and retail trade is – similar to construction or manufacturing – of high importance across all border regions, still without achieving outstanding significance. A slightly higher local value can be attributed to EU-15 countries (index: 3.5).
The branch of transport with an average index value of 3.1 completes the top-5 economic sectors of EU cross-border commuting. Its relevance though underlies again a regional distribution: EU-15 members feature a high overall relevance (3.5) and still a considerable importance as in-commuting regions for EU-12 members, whereas its significance within the EU-12 is quite low (2.7). Denmark for this sector (with a Balassa index of 1.29 in 2001) takes an outstanding position as in-commuting market (importance of 4.83 for Swedish, 4.33 for German commuters). Experts mention a large demand on the Danish job market contrasting with the relatively high unemployment rate in this sector in neighbouring countries. According to the German institute for foreign economics (bfai), in relation to the economic boom in
19 Examples are CZ→PL (index value 4.5) or BG→GR (4.3). Because of partially low numbers of mentions some of these
border regions don’t appear in the Figure. 20 The southern border region of Germany is very attractive for Czech industrial commuters, while in the northern part a weaker
economic structure brings forward the unusual Eastward moving direction from Bavaria to Czech Republic (ISF 2004).
Scientific Report on the Mobility of Cross-Border Workers within the EU-27/EEA/EFTA Countries
34
Denmark since 2004, the sector of transport and communication counts for the highest rates of growth (4.2% in 2007). Moreover, higher incomes, a well developed infrastructure and an enduring demand for a foreign workforce conditional upon demographic changes promote in-commuting streams.
The sector health and social work (with an average importance of 2.7) is adversely affected by difficulties in accepting foreign formations and diplomas as regards cross-border commuting. Nevertheless it obtains punctual importance, which is striking only within the EU-15 including Switzerland. Examples are the commuting regions F/GER/ITA→CH (index values: 4.8 / 4.5 / 4.0) and SWE/GER→DK (4.3 / 4.0). Especially Switzerland which possesses a highly developed health system which constitutes a constantly growing labour market, the more so attributed to demographic ageing. The amount of in-commuters reached an 8% of the working population in 2007 (16,437 persons; Federal Statistical Office, Switzerland). High-grade equipment and the latest medical technology are key features for this incremental sector (with an estimated sectoral growth of 4 to 6% yearly, in 2006 strikingly 20% which equals 40,000 employees according to bfai). A clear trend can be seen in the large number of out-commuting French and Germans to Switzerland in this sector. In the 4th Quarter of 2007 there were about 10,000 French and 3,300 Germans commuting to Switzerland in this branch (Federal Statistical Office Switzerland, MKW calculations).
In Denmark, the service sector also makes up a high amount in GDP origin (26.8%). The health sector here documents enormous increment rates, both by the expansion of private hospitals (augmentation of about 60% for treatment earnings in 2007) as well as by investments in the public health sector (scheduled new investment 8.3 billions of Euro until 2017, bfai).
An inverse balance is obtained for the agricultural sector, which shall conclude the examination of commuting branches. The current results of the online survey suggest a higher relevance of commuting within EU-12 countries (index value of 3.0 compared to only 2.3 within EU-15). These findings indicate in first instance the high structural importance of the primary sector in the EU-12 member states. Furthermore they underline its outstanding relevance as an area of employment for out-commuters from those countries21. An ideal example for this is highlighted in the case of Hungary, one of the EU’s most important producers of grain (16 million tons total revenue). The Hungarian cross-border regions however are not only characterised as attracting in-commuting streams – also for Austrian workers –, they register a high quota of out-commuters to the Austrian agricultural sector too22. As the level of qualification can be estimated to be rather low for this branch23 the obstacle of accepting foreign formations ceases to exist; even more so because in an remarkable number of cases we find fixed-term employment or seasonal working24. Also the amount of illegal employment is assessed to be particularly high, which implicates that real
21 According to assessments in the Austrian border countries of Czech Republic, Slovakia and Hungary the agricultural sector
constitutes one of the most interesting branches for commuting, with a 20% respondents’ acceptance (PLG 2007). 22 In the Austrian border region Burgenland 654 registered commuters exercised activities in agriculture in 2007, in
Niederösterreich a good 1000 (with an upward trend), of which Hungarians are estimated to be the most important national group.
23 The rating “high importance“ of the agricultural sector correlates with a rather low level of qualifications (mean value 2.62, for “very high importance“ even 2.26) in the survey.
24 2.0 was the mean value for “seasonality“ at a very high importance of agriculture, which indicates a very high amount of seasonal working.
Scientific Report on the Mobility of Cross-Border Workers within the EU-27/EEA/EFTA Countries
35
numbers of commuters in this sector for several border regions must be appraised far higher (e.g. BG→GR).
4.2.2 Structure of cross-border workers
Having analysed commuting streams with regard to their distribution to economic sectors, the following chapters now primarily aim at examining the characteristics of commuters by socio-demographic variables such as age, sex, level of qualification, employment status or type of commuting.
Following the branch analysis of the preceding chapter, commuters are also assigned to economic sectors according to their respective occupational activity. Furthermore, cross-border commuting shall be examined more closely in respect of its temporal orientation. A special focus will be put on potential regional and activity-related diversities with regard to the temporal cycles in which borders are being crossed.
4.2.2.1 Social structure of cross-border workers
Social parameters like age and sex are distinguishing marks that so far for the vast majority of border regions – with the exception of Switzerland25 – have not been surveyed systematically and continuously for the specific group of cross-border commuters. This can be traced back on one hand to the fact that commensurate monitorings are still missing. On the other hand, for the majority of examined border regions such statistical investigations are disproportional on the grounds of (still) low numbers of commuters. Although the aforementioned variables were also gathered within the scope of the field research, exact valuations can hardly be made due to the variance of both dimensions in connection with other factors such as the economic sector or the exercised activity.
For this reasons, in the subsequent paragraphs only gross tendencies will be pointed out. Special evaluations will be carried out in each case for Switzerland, with more than 26.9 per cent featuring more than ¼ of all in-commuters within the geographic limits of the study.
With regard to the distribution between the sexes a light prevalence of male commuters is to be ascertained, illustrated by a mean value of 2.41. This slight overweight, however, is becoming more dominant within EU-12 member states (e.g. RO→BG, SVK→HU, PL→LIT) and between EU-12 and EU-15 countries (CZ→GER, EST→FIN, SLO→AUT). This can be traced back to a strong concentration on manual and technical skills for out-commuters with EU-12 provenience, predominantly male centres of activity (see also in Figure 13, page 45). Contrariwise, only the border regions of Sweden show a widely balanced proportion of male and female workers, which can be explained by a stronger orientation in the service sector among commuters in Scandinavian countries (see Figure 13 likewise).
Taking a closer look at the Swiss results (Table 7), a correlation of sexes and branch distribution becomes palpably evident.
25 Up to 2005, respective data was also available for Denmark and Germany.
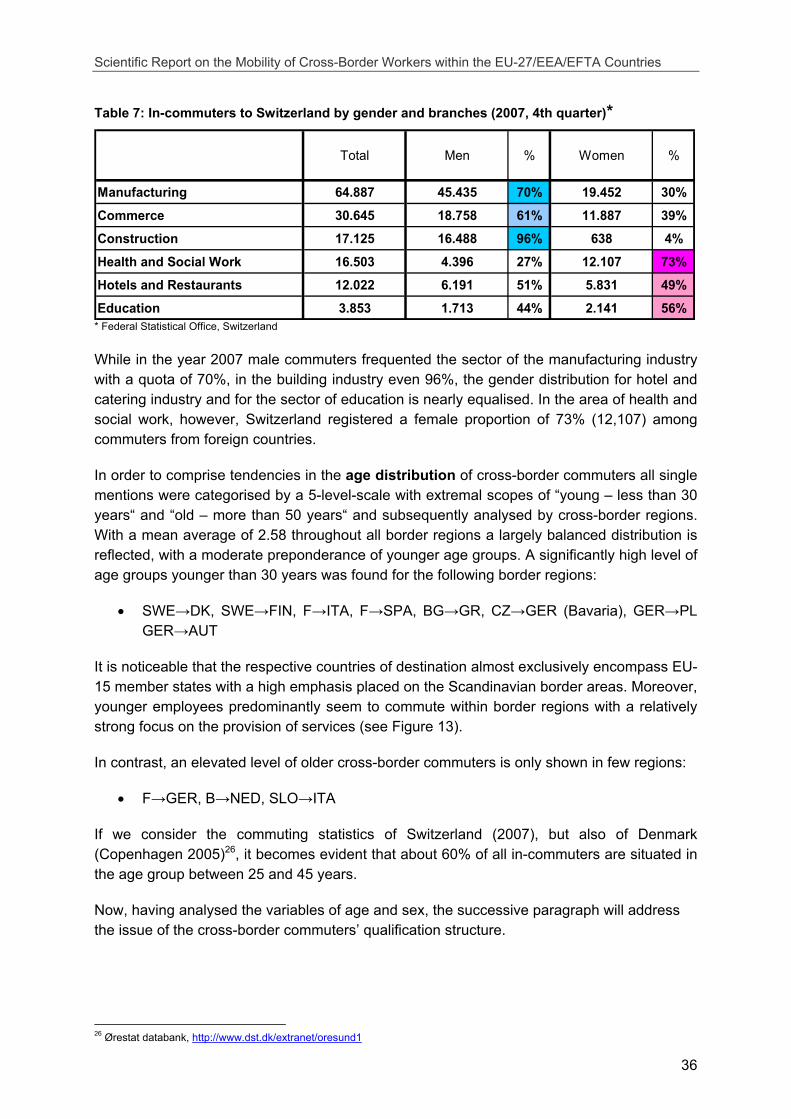
Scientific Report on the Mobility of Cross-Border Workers within the EU-27/EEA/EFTA Countries
36
Table 7: In-commuters to Switzerland by gender and branches (2007, 4th quarter)*
Total Men % Women %
Manufacturing 64.887 45.435 70% 19.452 30%
Commerce 30.645 18.758 61% 11.887 39%
Construction 17.125 16.488 96% 638 4%
Health and Social Work 16.503 4.396 27% 12.107 73%
Hotels and Restaurants 12.022 6.191 51% 5.831 49%
Education 3.853 1.713 44% 2.141 56% * Federal Statistical Office, Switzerland
While in the year 2007 male commuters frequented the sector of the manufacturing industry with a quota of 70%, in the building industry even 96%, the gender distribution for hotel and catering industry and for the sector of education is nearly equalised. In the area of health and social work, however, Switzerland registered a female proportion of 73% (12,107) among commuters from foreign countries.
In order to comprise tendencies in the age distribution of cross-border commuters all single mentions were categorised by a 5-level-scale with extremal scopes of “young – less than 30 years“ and “old – more than 50 years“ and subsequently analysed by cross-border regions. With a mean average of 2.58 throughout all border regions a largely balanced distribution is reflected, with a moderate preponderance of younger age groups. A significantly high level of age groups younger than 30 years was found for the following border regions:
• SWE→DK, SWE→FIN, F→ITA, F→SPA, BG→GR, CZ→GER (Bavaria), GER→PL GER→AUT
It is noticeable that the respective countries of destination almost exclusively encompass EU-15 member states with a high emphasis placed on the Scandinavian border areas. Moreover, younger employees predominantly seem to commute within border regions with a relatively strong focus on the provision of services (see Figure 13).
In contrast, an elevated level of older cross-border commuters is only shown in few regions:
• F→GER, B→NED, SLO→ITA
If we consider the commuting statistics of Switzerland (2007), but also of Denmark (Copenhagen 2005)26, it becomes evident that about 60% of all in-commuters are situated in the age group between 25 and 45 years.
Now, having analysed the variables of age and sex, the successive paragraph will address the issue of the cross-border commuters’ qualification structure.
26 Ørestat databank, http://www.dst.dk/extranet/oresund1

Scientific Report on the Mobility of Cross-Border Workers within the EU-27/EEA/EFTA Countries
37
BG → GR
P → SPA
SVK → HU
SLO → ITA
F → B
F → SPA
NED → B
F → ITA
EST → FIN
HU → AUT
AUT → GER
GER → AUT
GER → CH
NED → GER
GER → B
GER → DK
GER → PL
FIN → SWE
Low skilled High skilled
Figure 11: Qualification of cross-border workers by border regions* (mean values) 1 = low skilled; 5 = high skilled
* includes only border regions with valid data Survey on cross-border workers’ mobility
- - - - - average: 2.9
As clearly demonstrated in Figure 11, border-crossing commuting flows of highly qualified labour is almost exclusively limited to the area of EU-15 countries. In this context, Germany takes up an outstanding position, both as a country of destination, but foremost as country of origin. A broadly established higher education and a firm dual system of vocational training opens up multi-purpose perspectives as to profession and earnings, also this is true of the neighbouring countries Switzerland, Austria, Belgium, Denmark, recently also in Poland. That is why Germany for this segment achieves above-average commuting rates. In the fields of lower-skilled employment the exchange is taking place predominantly between EU-12 states (SVK→HU) or from EU-12 to EU-15 states (BG→GR, SLO→ITA). Furthermore it is demonstrative that the level of qualification strongly correlates with economically dominant branches of cross-border commuting according to each border region. For the domains of agriculture (46%), as well as for mining (40%) and construction (36%) rather low to medium skill levels are to be denoted. At the same time those sectors achieve
1 2 3 4 5
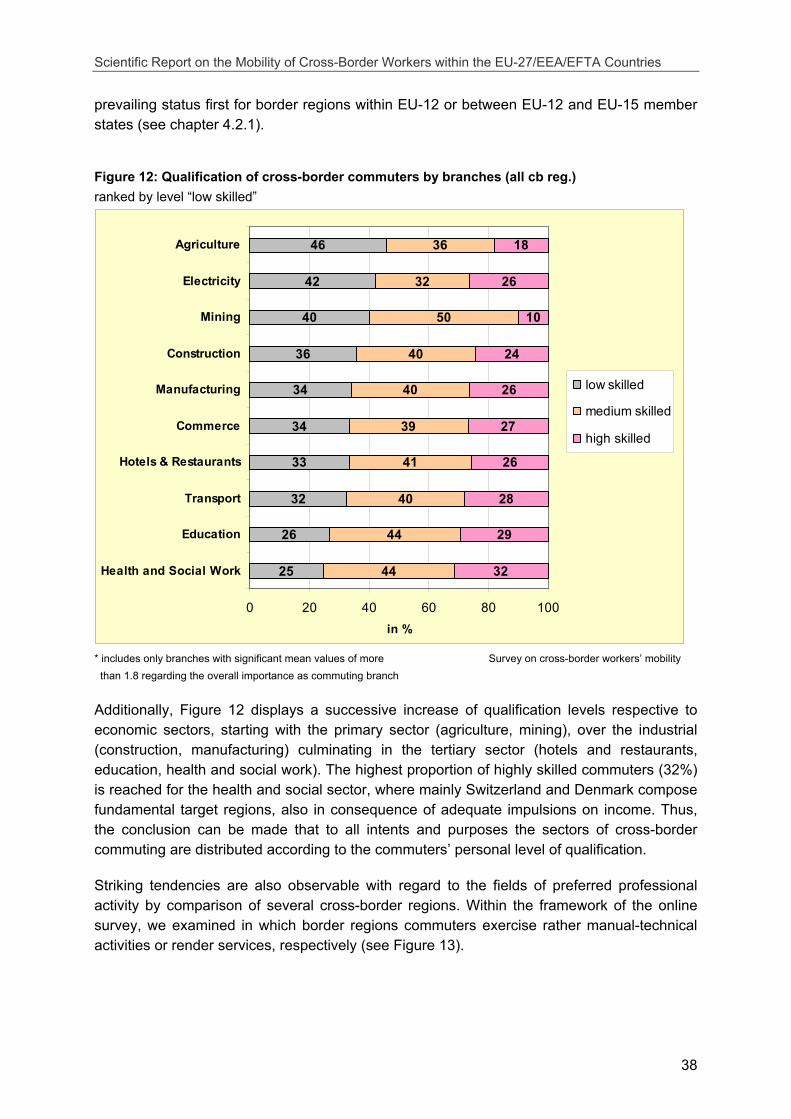
Scientific Report on the Mobility of Cross-Border Workers within the EU-27/EEA/EFTA Countries
38
prevailing status first for border regions within EU-12 or between EU-12 and EU-15 member states (see chapter 4.2.1).
Figure 12: Qualification of cross-border commuters by branches (all cb reg.) ranked by level “low skilled”
25
26
32
33
34
34
36
40
42
46
44
44
40
41
39
40
40
50
32
36
32
29
28
26
27
26
24
10
26
18
0 20 40 60 80 100
Health and Social Work
Education
Transport
Hotels & Restaurants
Commerce
Manufacturing
Construction
Mining
Electricity
Agriculture
in %
low skilled
medium skilled
high skilled
* includes only branches with significant mean values of more Survey on cross-border workers’ mobility than 1.8 regarding the overall importance as commuting branch
Additionally, Figure 12 displays a successive increase of qualification levels respective to economic sectors, starting with the primary sector (agriculture, mining), over the industrial (construction, manufacturing) culminating in the tertiary sector (hotels and restaurants, education, health and social work). The highest proportion of highly skilled commuters (32%) is reached for the health and social sector, where mainly Switzerland and Denmark compose fundamental target regions, also in consequence of adequate impulsions on income. Thus, the conclusion can be made that to all intents and purposes the sectors of cross-border commuting are distributed according to the commuters’ personal level of qualification.
Striking tendencies are also observable with regard to the fields of preferred professional activity by comparison of several cross-border regions. Within the framework of the online survey, we examined in which border regions commuters exercise rather manual-technical activities or render services, respectively (see Figure 13).
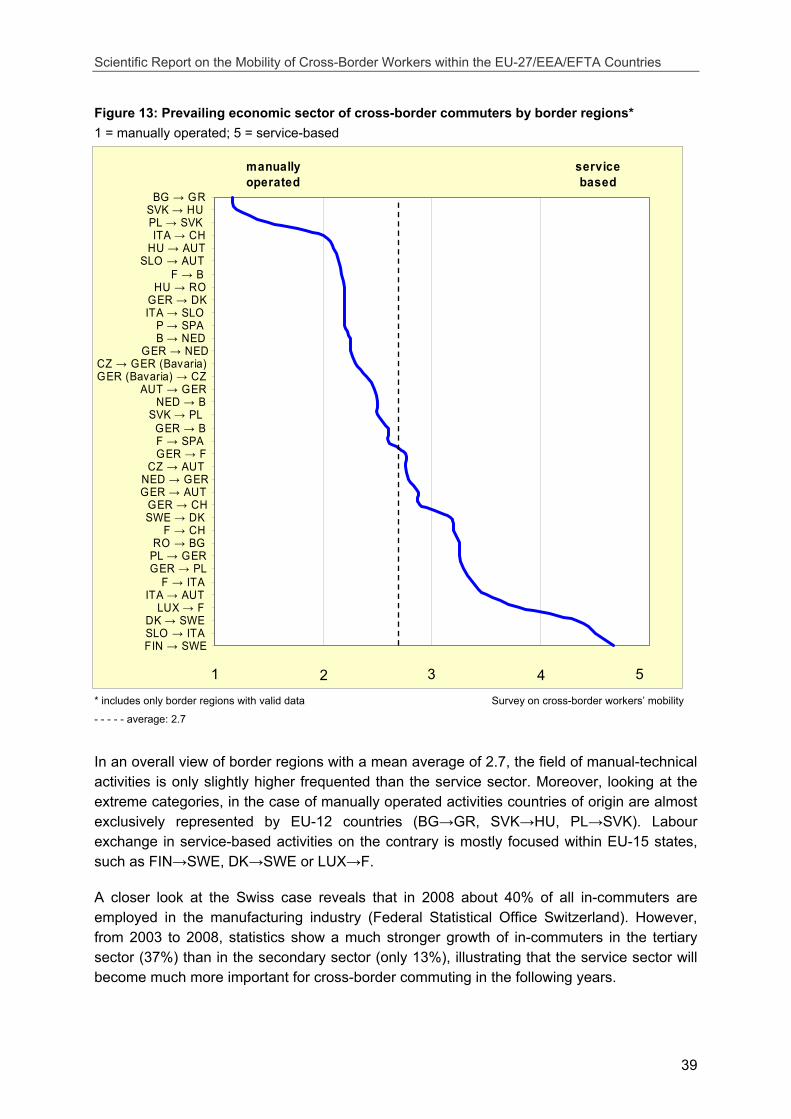
Scientific Report on the Mobility of Cross-Border Workers within the EU-27/EEA/EFTA Countries
39
Figure 13: Prevailing economic sector of cross-border commuters by border regions* 1 = manually operated; 5 = service-based
BG → GRSVK → HUPL → SVKITA → CH
HU → AUTSLO → AUT
F → BHU → RO
GER → DKITA → SLO
P → SPAB → NED
GER → NEDCZ → GER (Bavaria)GER (Bavaria) → CZ
AUT → GERNED → B
SVK → PLGER → BF → SPAGER → F
CZ → AUTNED → GERGER → AUT
GER → CHSWE → DK
F → CHRO → BG
PL → GERGER → PL
F → ITAITA → AUT
LUX → FDK → SWESLO → ITAFIN → SWE
manually operated
service based
* includes only border regions with valid data Survey on cross-border workers’ mobility
- - - - - average: 2.7
In an overall view of border regions with a mean average of 2.7, the field of manual-technical activities is only slightly higher frequented than the service sector. Moreover, looking at the extreme categories, in the case of manually operated activities countries of origin are almost exclusively represented by EU-12 countries (BG→GR, SVK→HU, PL→SVK). Labour exchange in service-based activities on the contrary is mostly focused within EU-15 states, such as FIN→SWE, DK→SWE or LUX→F.
A closer look at the Swiss case reveals that in 2008 about 40% of all in-commuters are employed in the manufacturing industry (Federal Statistical Office Switzerland). However, from 2003 to 2008, statistics show a much stronger growth of in-commuters in the tertiary sector (37%) than in the secondary sector (only 13%), illustrating that the service sector will become much more important for cross-border commuting in the following years.
321 4 5
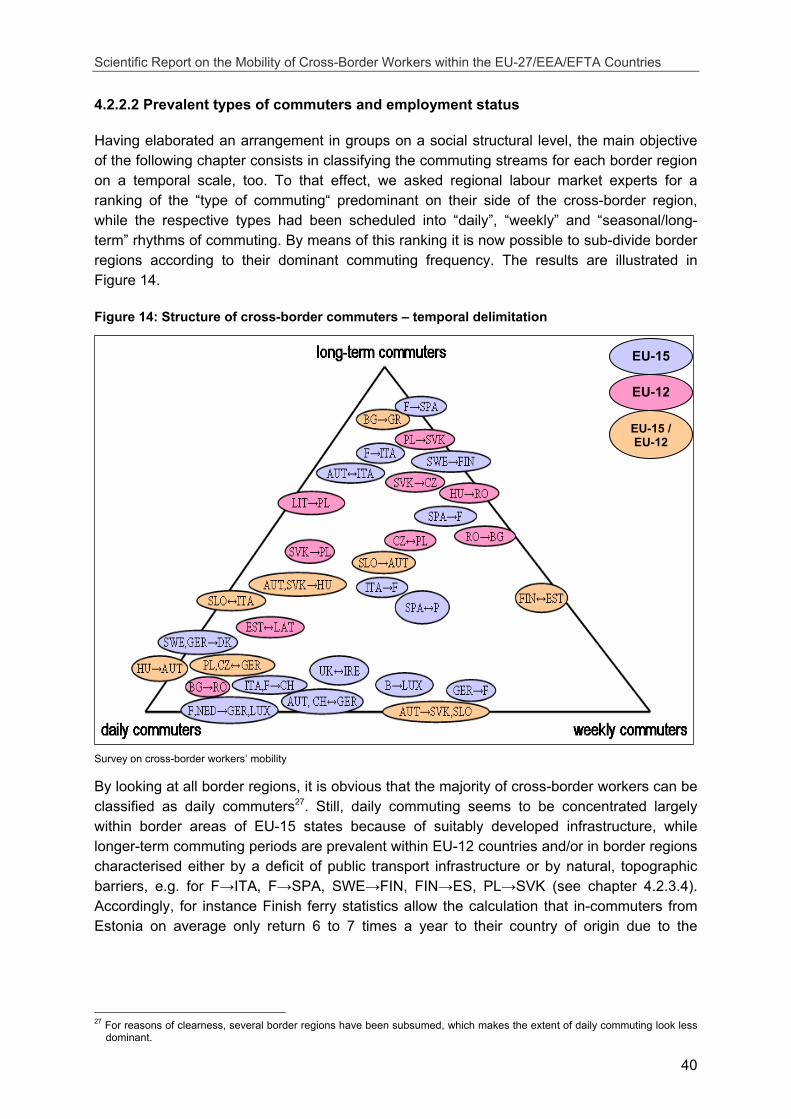
Scientific Report on the Mobility of Cross-Border Workers within the EU-27/EEA/EFTA Countries
40
4.2.2.2 Prevalent types of commuters and employment status
Having elaborated an arrangement in groups on a social structural level, the main objective of the following chapter consists in classifying the commuting streams for each border region on a temporal scale, too. To that effect, we asked regional labour market experts for a ranking of the “type of commuting“ predominant on their side of the cross-border region, while the respective types had been scheduled into “daily”, “weekly” and “seasonal/long-term” rhythms of commuting. By means of this ranking it is now possible to sub-divide border regions according to their dominant commuting frequency. The results are illustrated in Figure 14.
Figure 14: Structure of cross-border commuters – temporal delimitation
Survey on cross-border workers’ mobility
By looking at all border regions, it is obvious that the majority of cross-border workers can be classified as daily commuters27. Still, daily commuting seems to be concentrated largely within border areas of EU-15 states because of suitably developed infrastructure, while longer-term commuting periods are prevalent within EU-12 countries and/or in border regions characterised either by a deficit of public transport infrastructure or by natural, topographic barriers, e.g. for F→ITA, F→SPA, SWE→FIN, FIN→ES, PL→SVK (see chapter 4.2.3.4). Accordingly, for instance Finish ferry statistics allow the calculation that in-commuters from Estonia on average only return 6 to 7 times a year to their country of origin due to the
27 For reasons of clearness, several border regions have been subsumed, which makes the extent of daily commuting look less
dominant.
EU-15
EU-12
EU-15 / EU-12
Scientific Report on the Mobility of Cross-Border Workers within the EU-27/EEA/EFTA Countries
41
longsome lines of communication28. Thus, often several working weeks are completed between the border crossing journeys.
However, it is somehow surprising that in this overall distribution of all examined border regions weekly commuting rhythms lag behind “long-term commuting” periods (denomination according to Constantin 2004) quite clearly as regards their significance. For this appraisal, several reasons can be supposed.
First it becomes evident that effective commuting periods often transcend the maximum of one week given by definition of the European Union (see also definitions in chapter 3.1) and that phenomena of “long-term commuting“ with unconformable cycles, sometimes of several weeks are emerging. On the one hand there is the “traditional commuting, travelling home regularly, perhaps on weekends or for a full week once every month or two…” but there are also arrangements “in which the employee travels between home and the host country on no fixed schedule ... like ‘rotators’ go to work in the Middle East for 14 or 28 days in the oil fields, and then have an equal amount of time off to spend in their home countries” (Frase 2007).29
Although the mode of long-term commuting is especially prevalent in regions whose economic structure is mainly influenced by seasonally operating sectors such as agriculture, construction or tourism (e.g. BG→GR, F↔SPA, AUT↔ITA), this term does on no account exclusively represent classic-seasonal arrangements. In fact, another cause for its growing significance seems to lie in the reduction of commuting frequencies, mainly within the EU-12 and between EU-15 and EU-12 member states. Natural barriers and comparatively high costs for public transport, highway tolls and fuel could be conducive, together with a lower level of income, to decrease absolute numbers of border crossings.
A further reason can be explained by the fact that an increasing number of working activities are subject to flexible arrangements. Thereby, relatively regular daily or weekly working journeys are becoming replaced by stage-like units of performance/effort, often for several weeks. Examples are temporary work, limitation and short-term employment, but also flexible working hours in high skilled job areas which are closely linked to another labour transition reflected at a cross-border level as “long-distance commuting” (see chapter 5).
The findings compiled in Figure 15 largely support this view. The amount of temporary limited, short-term employments is relatively higher for regions in which commuting takes place within broader temporal corridors (e.g. BG→GR, SPA↔P, F↔ITA, F↔SPA).
On the contrary, turning to rather permanent constellations of engagement, these can predominantly be discovered within the EU-15. Consequently, one can assume that such cases can primarily be identified as pay-scale classified, regular employment contracts with rather fixed, “routine” working hours, which enable daily or weekly commuting both temporally and in terms of income.
28 With a number of 136,000 trips per year and a number of 20,000 commuters counted by Statistics Finland in their border
interview survey, a number of 6.8 commuting trips per year is generated, which equals an average period of stay of 7.65 weeks.
29 http://www.shrm.org/hrmagazine/articles/0307/0307agenda_global.asp
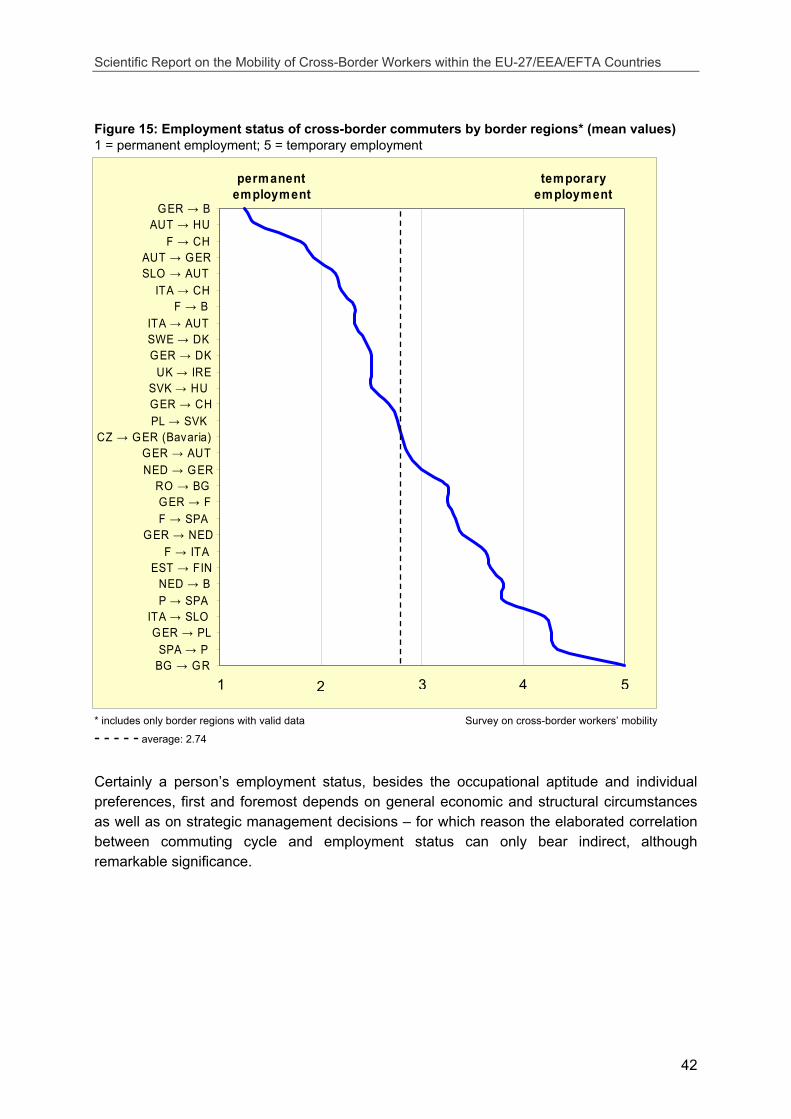
Scientific Report on the Mobility of Cross-Border Workers within the EU-27/EEA/EFTA Countries
42
Figure 15: Employment status of cross-border commuters by border regions* (mean values) 1 = permanent employment; 5 = temporary employment
GER → BAUT → HU
F → CHAUT → GERSLO → AUT
ITA → CHF → B
ITA → AUTSWE → DKGER → DK
UK → IRESVK → HUGER → CHPL → SVK
CZ → GER (Bavaria)GER → AUTNED → GER
RO → BGGER → FF → SPA
GER → NEDF → ITA
EST → FINNED → BP → SPA
ITA → SLOGER → PL
SPA → PBG → GR
permanent employment
temporary employment
* includes only border regions with valid data Survey on cross-border workers’ mobility
- - - - - average: 2.74
Certainly a person’s employment status, besides the occupational aptitude and individual preferences, first and foremost depends on general economic and structural circumstances as well as on strategic management decisions – for which reason the elaborated correlation between commuting cycle and employment status can only bear indirect, although remarkable significance.
1 2 3 4 5
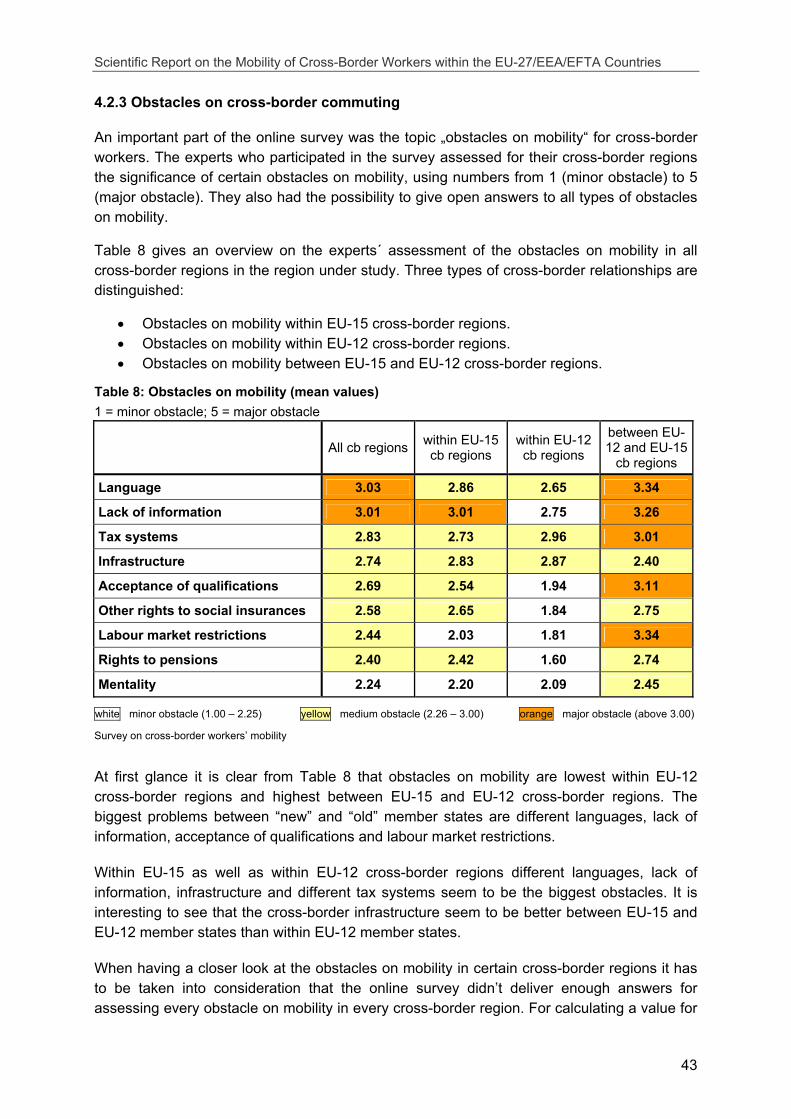
Scientific Report on the Mobility of Cross-Border Workers within the EU-27/EEA/EFTA Countries
43
4.2.3 Obstacles on cross-border commuting
An important part of the online survey was the topic „obstacles on mobility“ for cross-border workers. The experts who participated in the survey assessed for their cross-border regions the significance of certain obstacles on mobility, using numbers from 1 (minor obstacle) to 5 (major obstacle). They also had the possibility to give open answers to all types of obstacles on mobility.
Table 8 gives an overview on the experts´ assessment of the obstacles on mobility in all cross-border regions in the region under study. Three types of cross-border relationships are distinguished:
• Obstacles on mobility within EU-15 cross-border regions. • Obstacles on mobility within EU-12 cross-border regions. • Obstacles on mobility between EU-15 and EU-12 cross-border regions.
Table 8: Obstacles on mobility (mean values) 1 = minor obstacle; 5 = major obstacle
All cb regions within EU-15
cb regions within EU-12 cb regions
between EU-12 and EU-15
cb regions
Language 3.03 2.86 2.65 3.34
Lack of information 3.01 3.01 2.75 3.26
Tax systems 2.83 2.73 2.96 3.01
Infrastructure 2.74 2.83 2.87 2.40
Acceptance of qualifications 2.69 2.54 1.94 3.11
Other rights to social insurances 2.58 2.65 1.84 2.75
Labour market restrictions 2.44 2.03 1.81 3.34
Rights to pensions 2.40 2.42 1.60 2.74
Mentality 2.24 2.20 2.09 2.45
white minor obstacle (1.00 – 2.25) yellow medium obstacle (2.26 – 3.00) orange major obstacle (above 3.00)
Survey on cross-border workers’ mobility
At first glance it is clear from Table 8 that obstacles on mobility are lowest within EU-12 cross-border regions and highest between EU-15 and EU-12 cross-border regions. The biggest problems between “new” and “old” member states are different languages, lack of information, acceptance of qualifications and labour market restrictions.
Within EU-15 as well as within EU-12 cross-border regions different languages, lack of information, infrastructure and different tax systems seem to be the biggest obstacles. It is interesting to see that the cross-border infrastructure seem to be better between EU-15 and EU-12 member states than within EU-12 member states.
When having a closer look at the obstacles on mobility in certain cross-border regions it has to be taken into consideration that the online survey didn’t deliver enough answers for assessing every obstacle on mobility in every cross-border region. For calculating a value for
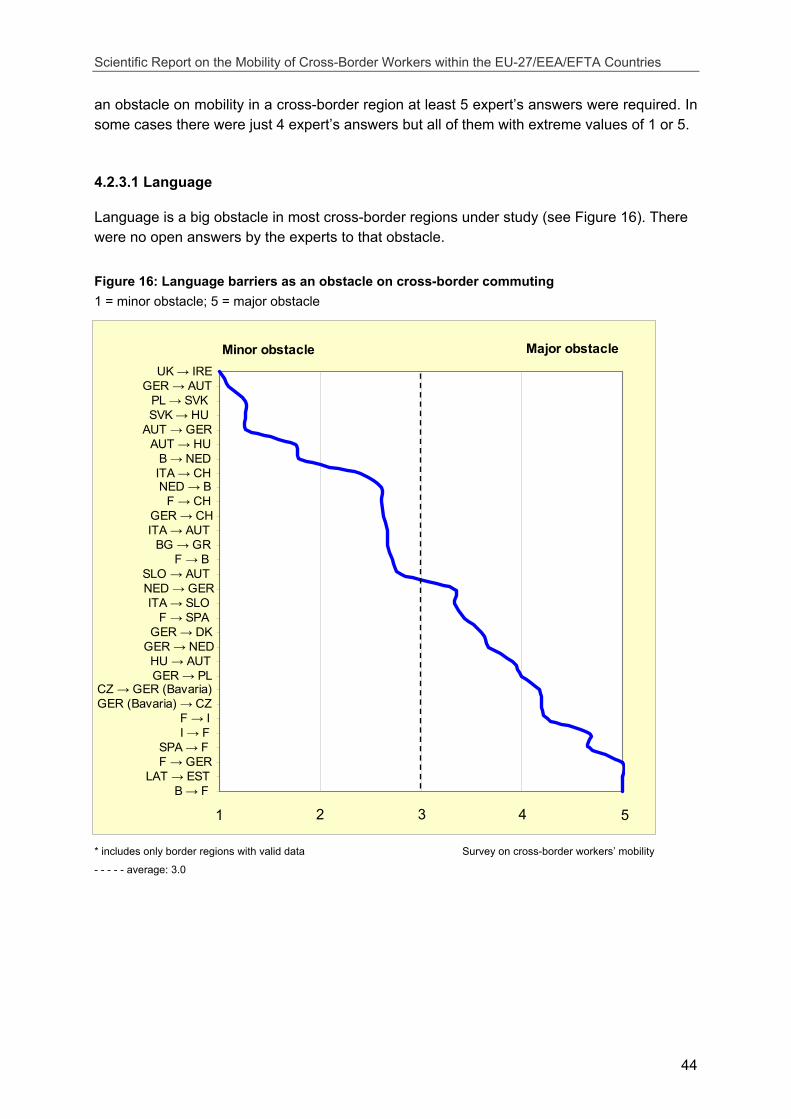
Scientific Report on the Mobility of Cross-Border Workers within the EU-27/EEA/EFTA Countries
44
UK → IREGER → AUT
PL → SVKSVK → HU
AUT → GERAUT → HU
B → NEDITA → CHNED → B
F → CHGER → CHITA → AUT
BG → GRF → B
SLO → AUTNED → GERITA → SLO
F → SPAGER → DK
GER → NEDHU → AUTGER → PL
CZ → GER (Bavaria)GER (Bavaria) → CZ
F → II → F
SPA → FF → GER
LAT → ESTB → F
Minor obstacle Major obstacle
an obstacle on mobility in a cross-border region at least 5 expert’s answers were required. In some cases there were just 4 expert’s answers but all of them with extreme values of 1 or 5.
4.2.3.1 Language
Language is a big obstacle in most cross-border regions under study (see Figure 16). There were no open answers by the experts to that obstacle.
Figure 16: Language barriers as an obstacle on cross-border commuting 1 = minor obstacle; 5 = major obstacle
* includes only border regions with valid data Survey on cross-border workers’ mobility
- - - - - average: 3.0
1 2 3 4 5
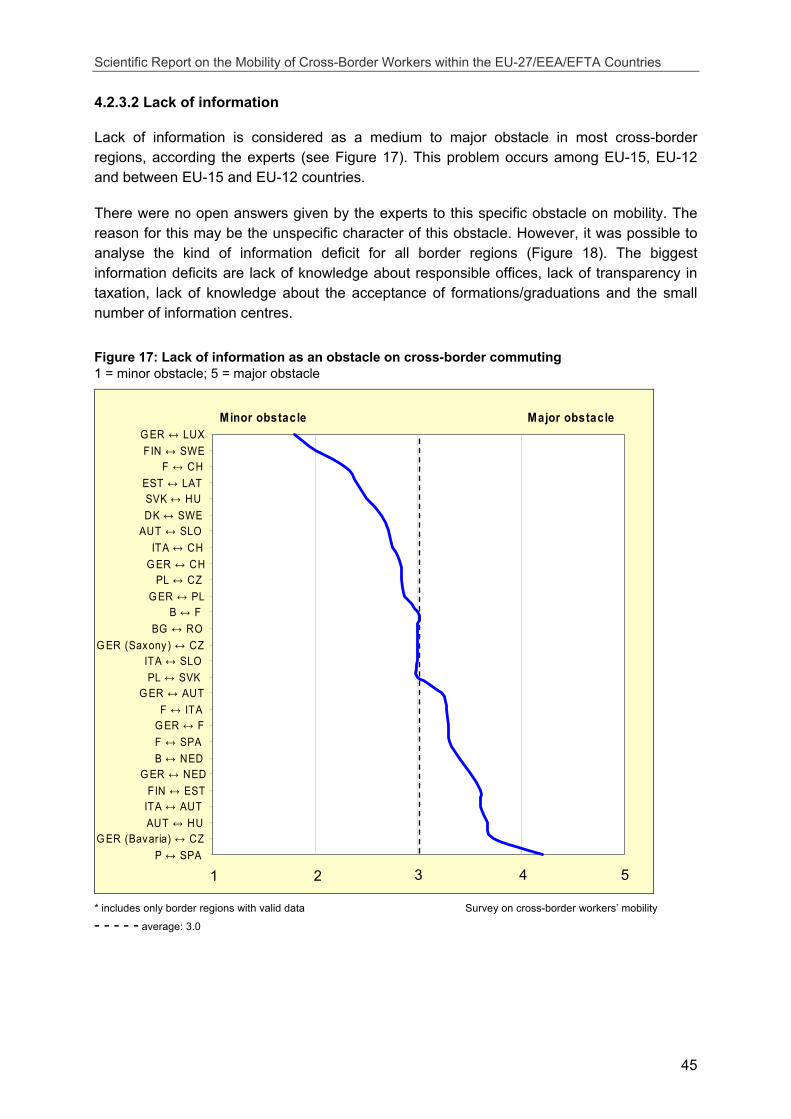
Scientific Report on the Mobility of Cross-Border Workers within the EU-27/EEA/EFTA Countries
45
4.2.3.2 Lack of information
Lack of information is considered as a medium to major obstacle in most cross-border regions, according the experts (see Figure 17). This problem occurs among EU-15, EU-12 and between EU-15 and EU-12 countries.
There were no open answers given by the experts to this specific obstacle on mobility. The reason for this may be the unspecific character of this obstacle. However, it was possible to analyse the kind of information deficit for all border regions (Figure 18). The biggest information deficits are lack of knowledge about responsible offices, lack of transparency in taxation, lack of knowledge about the acceptance of formations/graduations and the small number of information centres.
Figure 17: Lack of information as an obstacle on cross-border commuting 1 = minor obstacle; 5 = major obstacle
G ER ↔ LUXFIN ↔ SWE
F ↔ CHEST ↔ LATSVK ↔ HUDK ↔ SWE
AUT ↔ SLOITA ↔ CH
G ER ↔ CHPL ↔ CZ
G ER ↔ PLB ↔ F
BG ↔ ROG ER (Saxony) ↔ CZ
ITA ↔ SLOPL ↔ SVK
G ER ↔ AUTF ↔ ITA
G ER ↔ FF ↔ SPAB ↔ NED
G ER ↔ NEDFIN ↔ EST
ITA ↔ AUTAUT ↔ HU
G ER (Bavaria) ↔ CZP ↔ SPA
Minor obstacle Major obstacle
* includes only border regions with valid data Survey on cross-border workers’ mobility
- - - - - average: 3.0
1 2 3 4 5
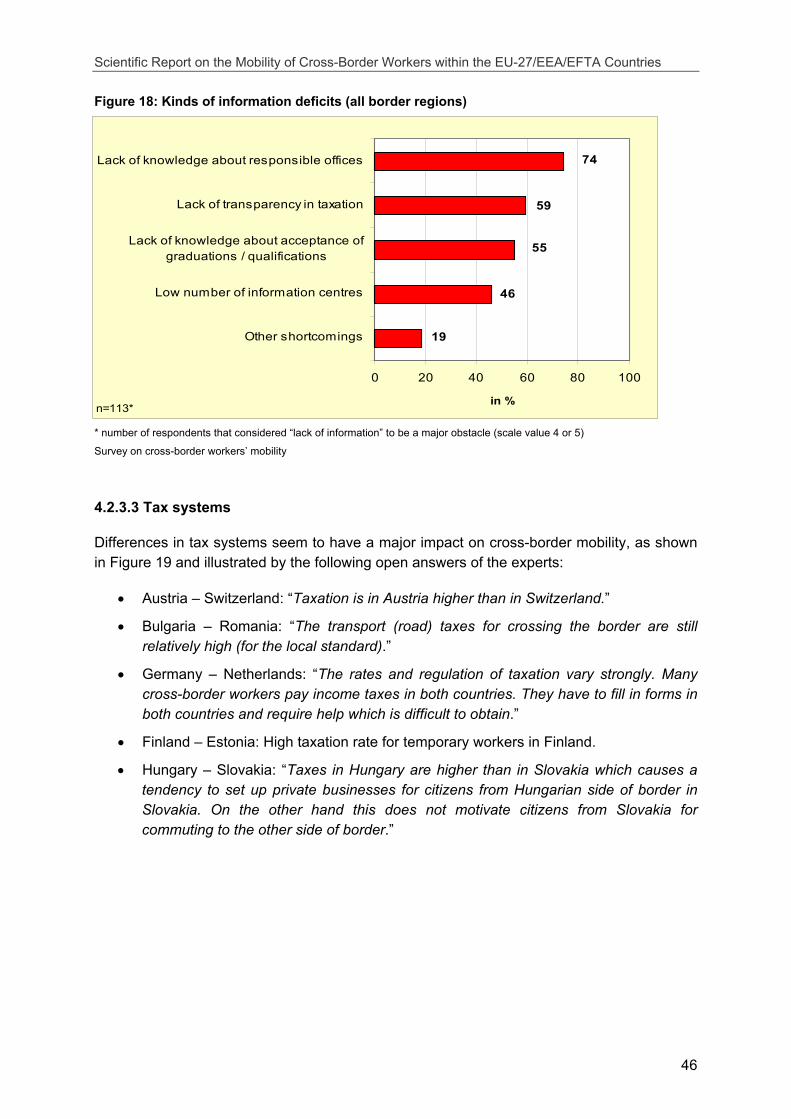
Scientific Report on the Mobility of Cross-Border Workers within the EU-27/EEA/EFTA Countries
46
59
55
46
19
74
0 20 40 60 80 100
Other shortcomings
Low number of information centres
Lack of knowledge about acceptance ofgraduations / qualifications
Lack of transparency in taxation
Lack of knowledge about responsible offices
in %n=113*
Figure 18: Kinds of information deficits (all border regions)
* number of respondents that considered “lack of information” to be a major obstacle (scale value 4 or 5)
Survey on cross-border workers’ mobility
4.2.3.3 Tax systems
Differences in tax systems seem to have a major impact on cross-border mobility, as shown in Figure 19 and illustrated by the following open answers of the experts:
• Austria – Switzerland: “Taxation is in Austria higher than in Switzerland.”
• Bulgaria – Romania: “The transport (road) taxes for crossing the border are still relatively high (for the local standard).”
• Germany – Netherlands: “The rates and regulation of taxation vary strongly. Many cross-border workers pay income taxes in both countries. They have to fill in forms in both countries and require help which is difficult to obtain.”
• Finland – Estonia: High taxation rate for temporary workers in Finland.
• Hungary – Slovakia: “Taxes in Hungary are higher than in Slovakia which causes a tendency to set up private businesses for citizens from Hungarian side of border in Slovakia. On the other hand this does not motivate citizens from Slovakia for commuting to the other side of border.”
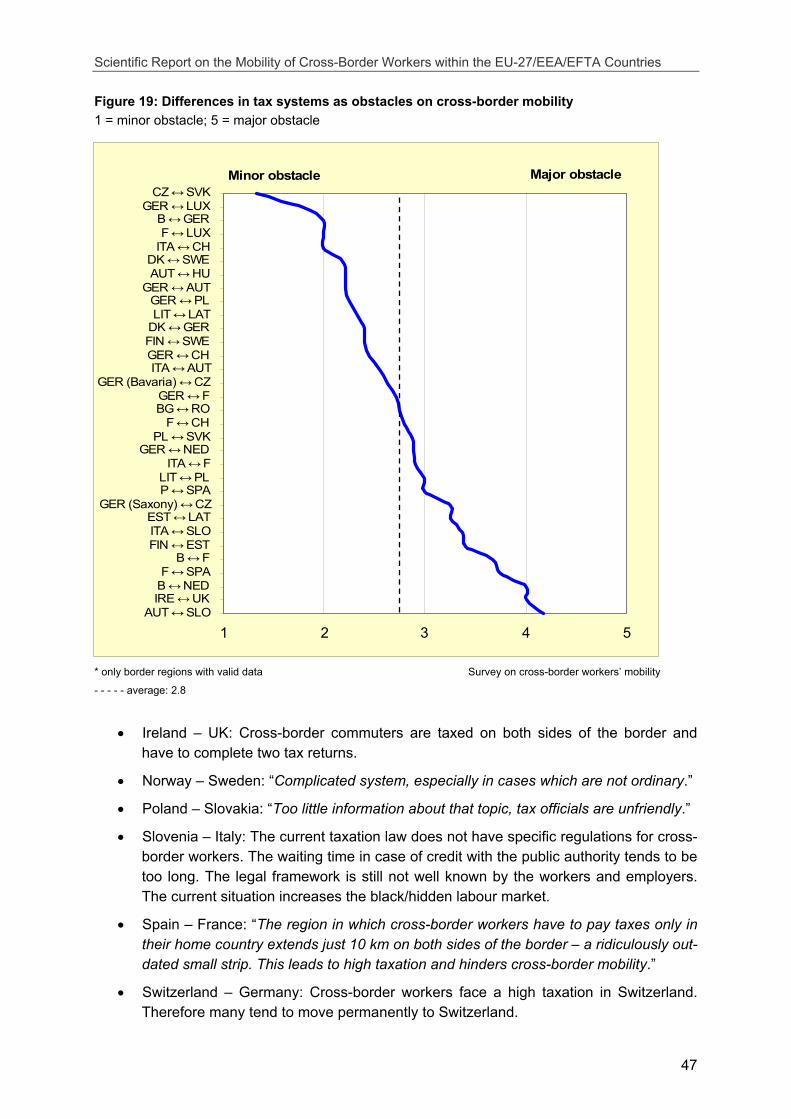
Scientific Report on the Mobility of Cross-Border Workers within the EU-27/EEA/EFTA Countries
47
CZ ↔ SVKGER ↔ LUX
B ↔ GERF ↔ LUX
ITA ↔ CHDK ↔ SWEAUT ↔ HU
GER ↔ AUTGER ↔ PLLIT ↔ LAT
DK ↔ GERFIN ↔ SWEGER ↔ CHITA ↔ AUT
GER (Bavaria) ↔ CZGER ↔ FBG ↔ RO
F ↔ CHPL ↔ SVK
GER ↔ NEDITA ↔ F
LIT ↔ PLP ↔ SPA
GER (Saxony) ↔ CZEST ↔ LATITA ↔ SLOFIN ↔ EST
B ↔ FF ↔ SPA
B ↔ NEDIRE ↔ UK
AUT ↔ SLO
Minor obstacle Major obstacle
Figure 19: Differences in tax systems as obstacles on cross-border mobility 1 = minor obstacle; 5 = major obstacle
* only border regions with valid data Survey on cross-border workers’ mobility
- - - - - average: 2.8
• Ireland – UK: Cross-border commuters are taxed on both sides of the border and have to complete two tax returns.
• Norway – Sweden: “Complicated system, especially in cases which are not ordinary.”
• Poland – Slovakia: “Too little information about that topic, tax officials are unfriendly.”
• Slovenia – Italy: The current taxation law does not have specific regulations for cross-border workers. The waiting time in case of credit with the public authority tends to be too long. The legal framework is still not well known by the workers and employers. The current situation increases the black/hidden labour market.
• Spain – France: “The region in which cross-border workers have to pay taxes only in their home country extends just 10 km on both sides of the border – a ridiculously out-dated small strip. This leads to high taxation and hinders cross-border mobility.”
• Switzerland – Germany: Cross-border workers face a high taxation in Switzerland. Therefore many tend to move permanently to Switzerland.
1 2 3 4 5
Scientific Report on the Mobility of Cross-Border Workers within the EU-27/EEA/EFTA Countries
48
4.2.3.4 Cross-border infrastructure, transport systems and geographic barriers
Figure 20 shows the significance of the obstacle “cross-border infrastructure, transport systems and geographic barriers” for certain cross-border regions. Major problems occur mainly between countries with huge geographical barriers like mountain chains and Tundra (Finland–Sweden, France–Italy, Italy–Austria, Poland–Czech Republic, Poland–Slovakia, France–Spain).
Most open answers given by experts were about this obstacle on mobility. According to these answers the infrastructural problems are very similar in most cross-border regions:
• Austria – Hungary: no public transport in East-West direction. In the southern part few public transport and fast roads.
• Austria – Slovenia: Travel costs too high in comparison to the salaries.
• Belgium – Netherlands: public transport inadequate. With growing travel costs jobseekers are less willing to travel.
• Finland – Sweden: Transport by ferry takes too long for daily commuting. The ferry between Vaasa and Umeå doesn’t operate every day.
• Germany – Luxembourg: public transport inadequate, long travel times by car.
• Germany – Netherlands: public transport inadequate. Most jobs for cross-border workers are in industrial parks away from the cities with no public transport.
• Germany - Austria: few border crossings because of rivers and mountains. Public transport inadequate. No connection of the motorway A 94 to Austria.
• Germany - Czech Republic: few border crossings because of mountains. Public transport systems as well as roads inadequate.
• Germany - France: too few bridges across the river Rhein. Train connections inadequate.
• Germany - Poland: too few bridges across the river Neiße (before WW II there were 50, now there are only 5). Public transport inadequate.
• Ireland – UK: Public and private transport inadequate, especially in rural areas, no rail link.
• Italy – Austria: Only three main traffic routes because of the mountains. Train connection between Bozen and Innsbruck too long. Driving long mountain roads takes much time and is dangerous.
• Italy – France : Public transport inadequate.
• Italy – Switzerland: Public transport inadequate. In winter difficult access across passes.
• Latvia – Estonia : Public and private transport inadequate.
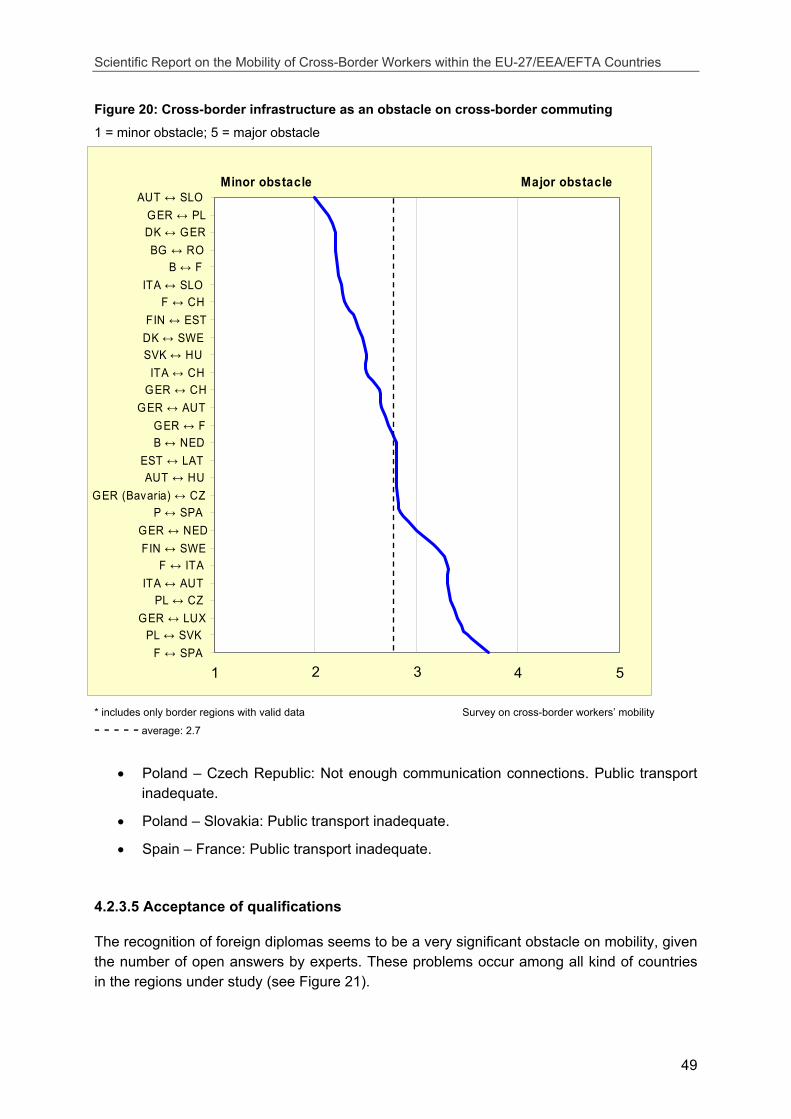
Scientific Report on the Mobility of Cross-Border Workers within the EU-27/EEA/EFTA Countries
49
AUT ↔ SLOGER ↔ PLDK ↔ GERBG ↔ RO
B ↔ FITA ↔ SLO
F ↔ CHFIN ↔ EST
DK ↔ SWESVK ↔ HU
ITA ↔ CHGER ↔ CH
GER ↔ AUTGER ↔ FB ↔ NED
EST ↔ LATAUT ↔ HU
GER (Bavaria) ↔ CZP ↔ SPA
GER ↔ NEDFIN ↔ SWE
F ↔ ITAITA ↔ AUT
PL ↔ CZGER ↔ LUX
PL ↔ SVKF ↔ SPA
Minor obstacle Major obstacle
Figure 20: Cross-border infrastructure as an obstacle on cross-border commuting
1 = minor obstacle; 5 = major obstacle
* includes only border regions with valid data Survey on cross-border workers’ mobility
- - - - - average: 2.7
• Poland – Czech Republic: Not enough communication connections. Public transport inadequate.
• Poland – Slovakia: Public transport inadequate.
• Spain – France: Public transport inadequate.
4.2.3.5 Acceptance of qualifications
The recognition of foreign diplomas seems to be a very significant obstacle on mobility, given the number of open answers by experts. These problems occur among all kind of countries in the regions under study (see Figure 21).
1 2 3 4 5
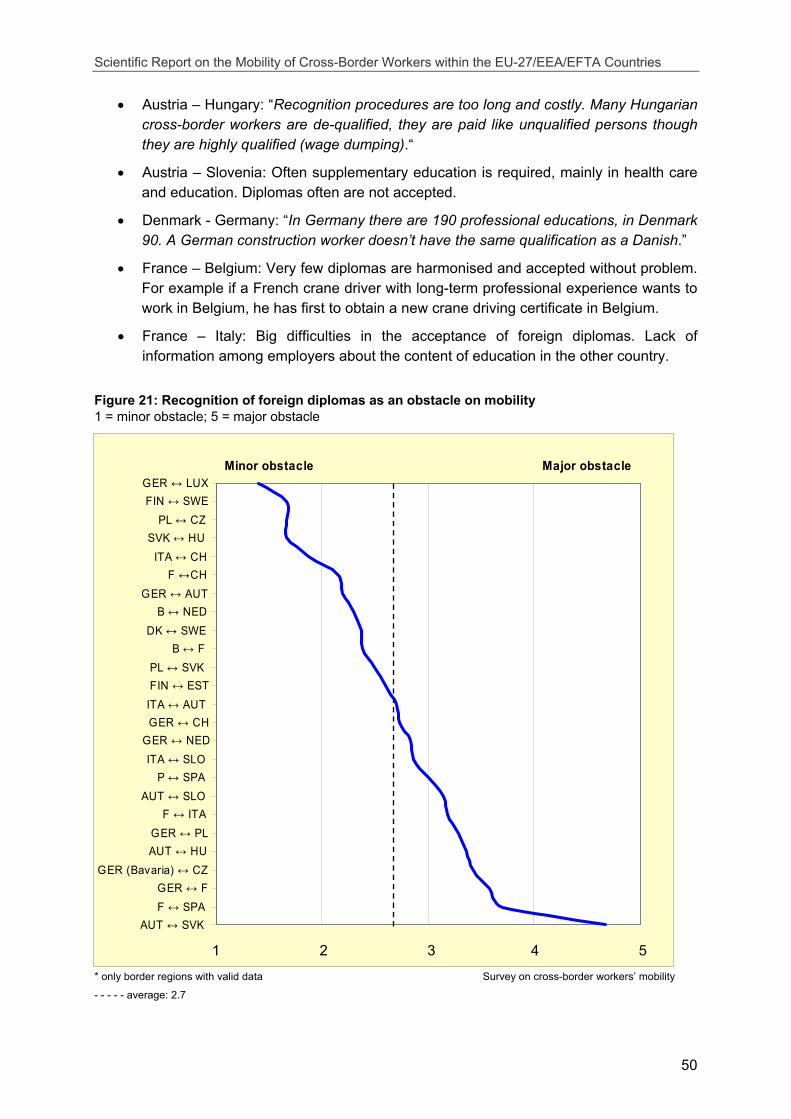
Scientific Report on the Mobility of Cross-Border Workers within the EU-27/EEA/EFTA Countries
50
GER ↔ LUXFIN ↔ SWE
PL ↔ CZSVK ↔ HU
ITA ↔ CHF ↔CH
GER ↔ AUTB ↔ NED
DK ↔ SWEB ↔ F
PL ↔ SVKFIN ↔ EST
ITA ↔ AUTGER ↔ CH
GER ↔ NEDITA ↔ SLO
P ↔ SPAAUT ↔ SLO
F ↔ ITAGER ↔ PLAUT ↔ HU
GER (Bavaria) ↔ CZGER ↔ FF ↔ SPA
AUT ↔ SVK
Minor obstacle Major obstacle
• Austria – Hungary: “Recognition procedures are too long and costly. Many Hungarian cross-border workers are de-qualified, they are paid like unqualified persons though they are highly qualified (wage dumping).“
• Austria – Slovenia: Often supplementary education is required, mainly in health care and education. Diplomas often are not accepted.
• Denmark - Germany: “In Germany there are 190 professional educations, in Denmark 90. A German construction worker doesn’t have the same qualification as a Danish.”
• France – Belgium: Very few diplomas are harmonised and accepted without problem. For example if a French crane driver with long-term professional experience wants to work in Belgium, he has first to obtain a new crane driving certificate in Belgium.
• France – Italy: Big difficulties in the acceptance of foreign diplomas. Lack of information among employers about the content of education in the other country.
Figure 21: Recognition of foreign diplomas as an obstacle on mobility 1 = minor obstacle; 5 = major obstacle
* only border regions with valid data Survey on cross-border workers’ mobility
- - - - - average: 2.7
1 2 3 4 5
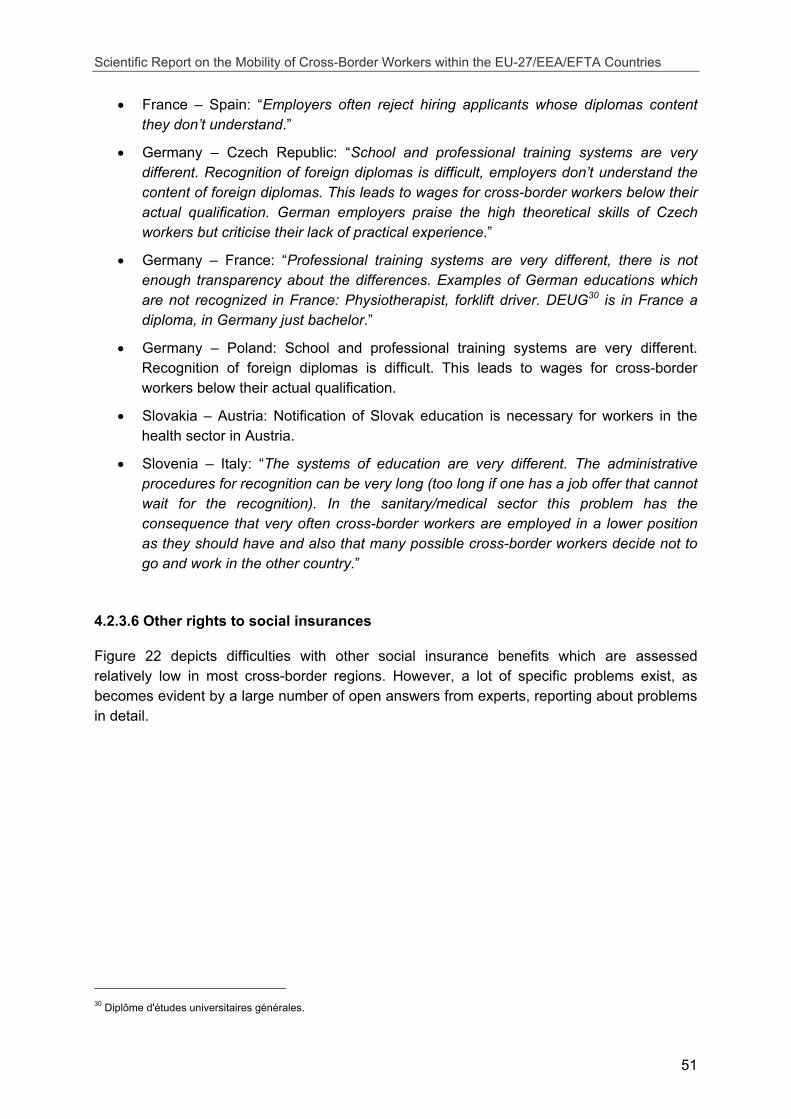
Scientific Report on the Mobility of Cross-Border Workers within the EU-27/EEA/EFTA Countries
51
• France – Spain: “Employers often reject hiring applicants whose diplomas content they don’t understand.”
• Germany – Czech Republic: “School and professional training systems are very different. Recognition of foreign diplomas is difficult, employers don’t understand the content of foreign diplomas. This leads to wages for cross-border workers below their actual qualification. German employers praise the high theoretical skills of Czech workers but criticise their lack of practical experience.”
• Germany – France: “Professional training systems are very different, there is not enough transparency about the differences. Examples of German educations which are not recognized in France: Physiotherapist, forklift driver. DEUG30 is in France a diploma, in Germany just bachelor.”
• Germany – Poland: School and professional training systems are very different. Recognition of foreign diplomas is difficult. This leads to wages for cross-border workers below their actual qualification.
• Slovakia – Austria: Notification of Slovak education is necessary for workers in the health sector in Austria.
• Slovenia – Italy: “The systems of education are very different. The administrative procedures for recognition can be very long (too long if one has a job offer that cannot wait for the recognition). In the sanitary/medical sector this problem has the consequence that very often cross-border workers are employed in a lower position as they should have and also that many possible cross-border workers decide not to go and work in the other country.”
4.2.3.6 Other rights to social insurances
Figure 22 depicts difficulties with other social insurance benefits which are assessed relatively low in most cross-border regions. However, a lot of specific problems exist, as becomes evident by a large number of open answers from experts, reporting about problems in detail.
30 Diplôme d'études universitaires générales.
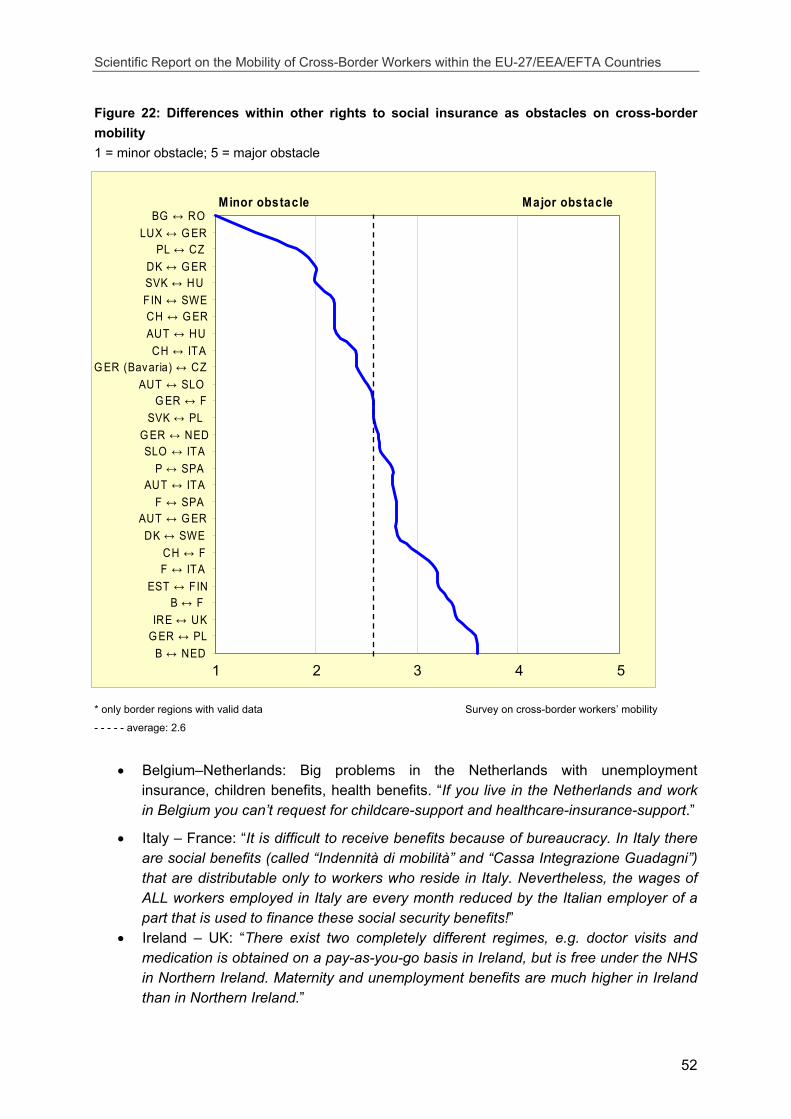
Scientific Report on the Mobility of Cross-Border Workers within the EU-27/EEA/EFTA Countries
52
BG ↔ ROLUX ↔ G ER
PL ↔ CZDK ↔ G ERSVK ↔ HUFIN ↔ SWECH ↔ G ERAUT ↔ HUCH ↔ ITA
G ER (Bavaria) ↔ CZAUT ↔ SLO
G ER ↔ FSVK ↔ PL
G ER ↔ NEDSLO ↔ ITA
P ↔ SPAAUT ↔ ITA
F ↔ SPAAUT ↔ G ERDK ↔ SWE
CH ↔ FF ↔ ITA
EST ↔ F INB ↔ F
IRE ↔ UKG ER ↔ PL
B ↔ NED
Minor obstacle Major obstacle
Figure 22: Differences within other rights to social insurance as obstacles on cross-border mobility 1 = minor obstacle; 5 = major obstacle
* only border regions with valid data Survey on cross-border workers’ mobility
- - - - - average: 2.6
• Belgium–Netherlands: Big problems in the Netherlands with unemployment insurance, children benefits, health benefits. “If you live in the Netherlands and work in Belgium you can’t request for childcare-support and healthcare-insurance-support.”
• Italy – France: “It is difficult to receive benefits because of bureaucracy. In Italy there are social benefits (called “Indennità di mobilità” and “Cassa Integrazione Guadagni”) that are distributable only to workers who reside in Italy. Nevertheless, the wages of ALL workers employed in Italy are every month reduced by the Italian employer of a part that is used to finance these social security benefits!”
• Ireland – UK: “There exist two completely different regimes, e.g. doctor visits and medication is obtained on a pay-as-you-go basis in Ireland, but is free under the NHS in Northern Ireland. Maternity and unemployment benefits are much higher in Ireland than in Northern Ireland.”
1 2 3 4 5
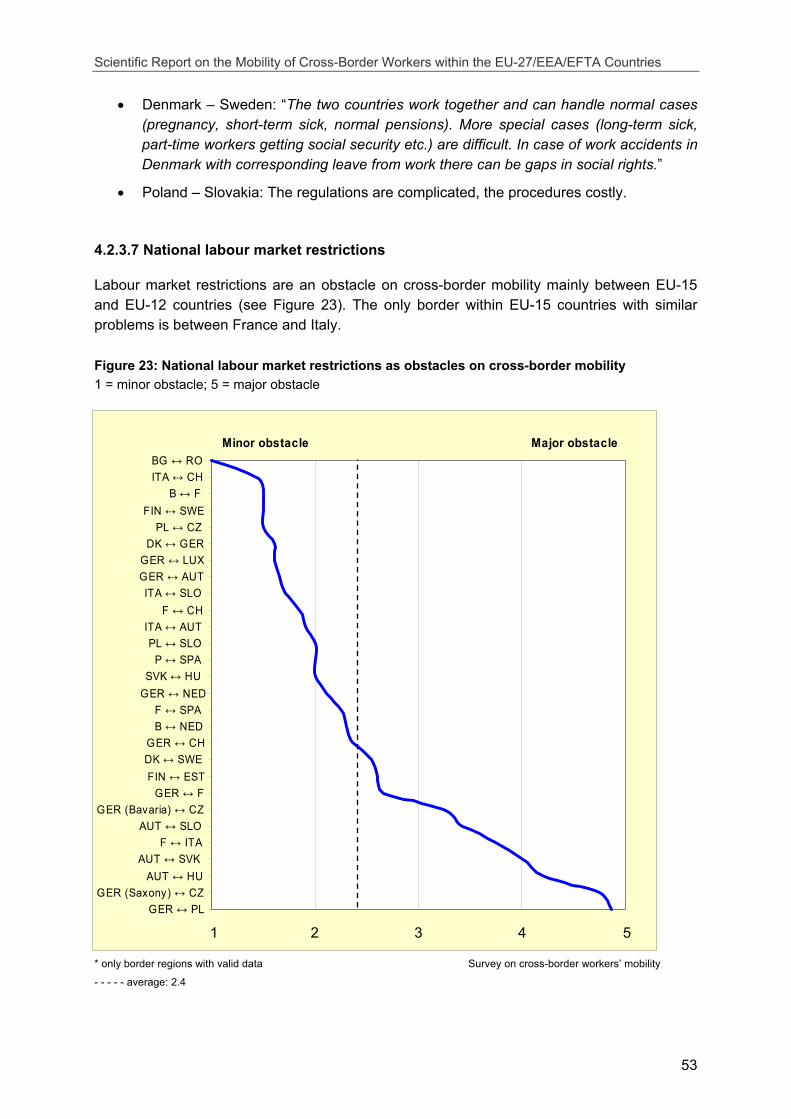
Scientific Report on the Mobility of Cross-Border Workers within the EU-27/EEA/EFTA Countries
53
BG ↔ ROITA ↔ CH
B ↔ FFIN ↔ SWE
PL ↔ CZDK ↔ GER
GER ↔ LUXGER ↔ AUTITA ↔ SLO
F ↔ CHITA ↔ AUTPL ↔ SLO
P ↔ SPASVK ↔ HU
GER ↔ NEDF ↔ SPAB ↔ NED
GER ↔ CHDK ↔ SWEFIN ↔ EST
GER ↔ FGER (Bavaria) ↔ CZ
AUT ↔ SLOF ↔ ITA
AUT ↔ SVKAUT ↔ HU
GER (Saxony) ↔ CZGER ↔ PL
Minor obstacle Major obstacle
• Denmark – Sweden: “The two countries work together and can handle normal cases (pregnancy, short-term sick, normal pensions). More special cases (long-term sick, part-time workers getting social security etc.) are difficult. In case of work accidents in Denmark with corresponding leave from work there can be gaps in social rights.”
• Poland – Slovakia: The regulations are complicated, the procedures costly.
4.2.3.7 National labour market restrictions
Labour market restrictions are an obstacle on cross-border mobility mainly between EU-15 and EU-12 countries (see Figure 23). The only border within EU-15 countries with similar problems is between France and Italy.
Figure 23: National labour market restrictions as obstacles on cross-border mobility 1 = minor obstacle; 5 = major obstacle
* only border regions with valid data Survey on cross-border workers’ mobility
- - - - - average: 2.4
1 2 3 4 5
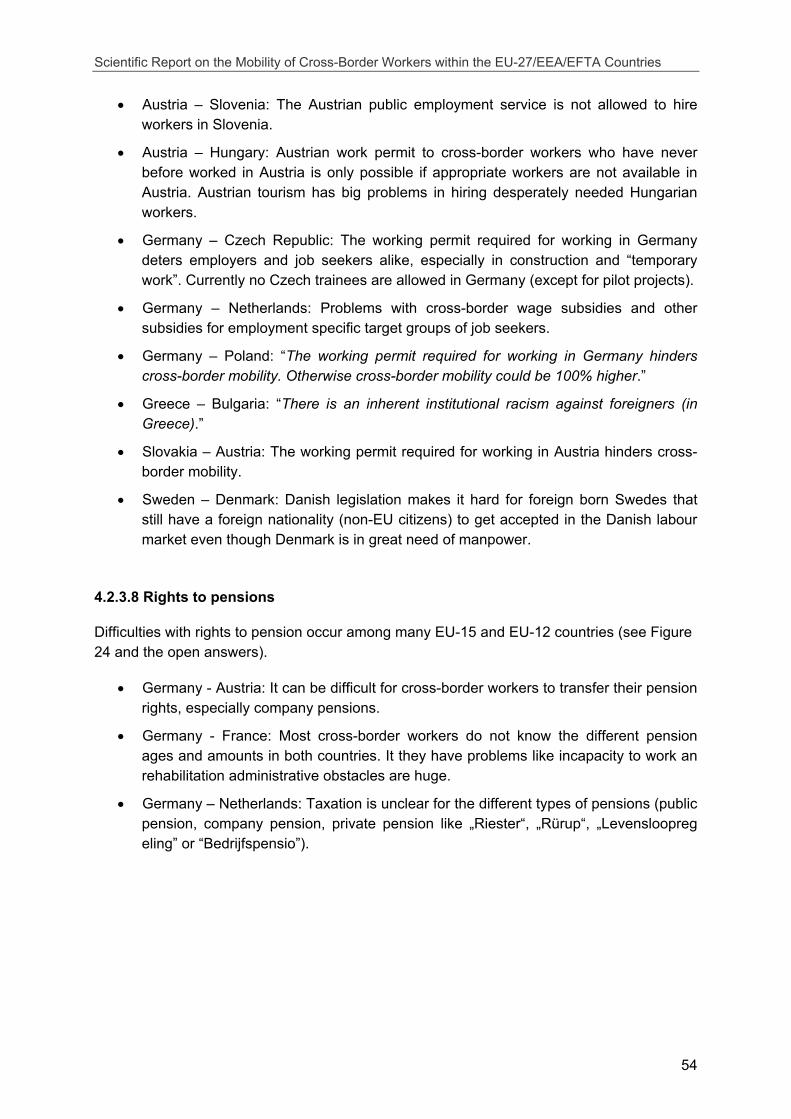
Scientific Report on the Mobility of Cross-Border Workers within the EU-27/EEA/EFTA Countries
54
• Austria – Slovenia: The Austrian public employment service is not allowed to hire workers in Slovenia.
• Austria – Hungary: Austrian work permit to cross-border workers who have never before worked in Austria is only possible if appropriate workers are not available in Austria. Austrian tourism has big problems in hiring desperately needed Hungarian workers.
• Germany – Czech Republic: The working permit required for working in Germany deters employers and job seekers alike, especially in construction and “temporary work”. Currently no Czech trainees are allowed in Germany (except for pilot projects).
• Germany – Netherlands: Problems with cross-border wage subsidies and other subsidies for employment specific target groups of job seekers.
• Germany – Poland: “The working permit required for working in Germany hinders cross-border mobility. Otherwise cross-border mobility could be 100% higher.”
• Greece – Bulgaria: “There is an inherent institutional racism against foreigners (in Greece).”
• Slovakia – Austria: The working permit required for working in Austria hinders cross-border mobility.
• Sweden – Denmark: Danish legislation makes it hard for foreign born Swedes that still have a foreign nationality (non-EU citizens) to get accepted in the Danish labour market even though Denmark is in great need of manpower.
4.2.3.8 Rights to pensions
Difficulties with rights to pension occur among many EU-15 and EU-12 countries (see Figure 24 and the open answers).
• Germany - Austria: It can be difficult for cross-border workers to transfer their pension rights, especially company pensions.
• Germany - France: Most cross-border workers do not know the different pension ages and amounts in both countries. It they have problems like incapacity to work an rehabilitation administrative obstacles are huge.
• Germany – Netherlands: Taxation is unclear for the different types of pensions (public pension, company pension, private pension like „Riester“, „Rürup“, „Levensloopreg eling” or “Bedrijfspensio”).
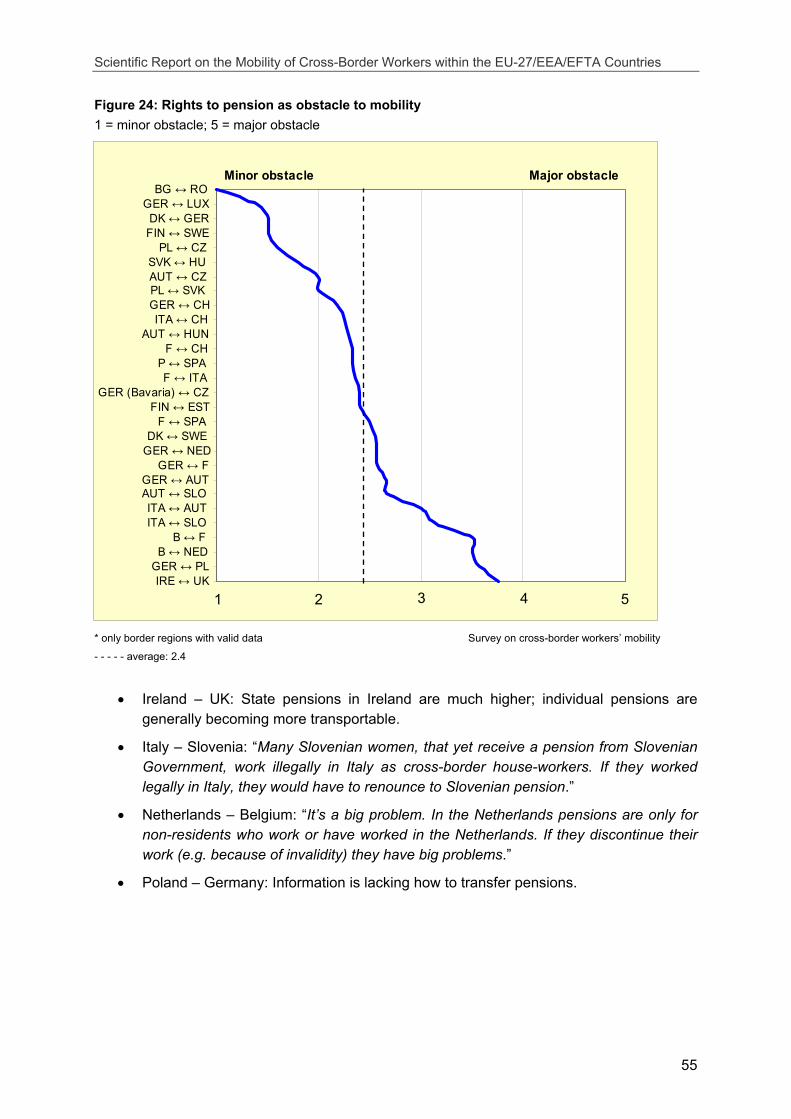
Scientific Report on the Mobility of Cross-Border Workers within the EU-27/EEA/EFTA Countries
55
BG ↔ ROGER ↔ LUX
DK ↔ GERFIN ↔ SWE
PL ↔ CZSVK ↔ HUAUT ↔ CZPL ↔ SVKGER ↔ CHITA ↔ CH
AUT ↔ HUNF ↔ CH
P ↔ SPAF ↔ ITA
GER (Bavaria) ↔ CZFIN ↔ EST
F ↔ SPADK ↔ SWE
GER ↔ NEDGER ↔ F
GER ↔ AUTAUT ↔ SLOITA ↔ AUTITA ↔ SLO
B ↔ FB ↔ NED
GER ↔ PLIRE ↔ UK
Minor obstacle Major obstacle
Figure 24: Rights to pension as obstacle to mobility 1 = minor obstacle; 5 = major obstacle
* only border regions with valid data Survey on cross-border workers’ mobility
- - - - - average: 2.4
• Ireland – UK: State pensions in Ireland are much higher; individual pensions are generally becoming more transportable.
• Italy – Slovenia: “Many Slovenian women, that yet receive a pension from Slovenian Government, work illegally in Italy as cross-border house-workers. If they worked legally in Italy, they would have to renounce to Slovenian pension.”
• Netherlands – Belgium: “It’s a big problem. In the Netherlands pensions are only for non-residents who work or have worked in the Netherlands. If they discontinue their work (e.g. because of invalidity) they have big problems.”
• Poland – Germany: Information is lacking how to transfer pensions.
1 2 3 4 5
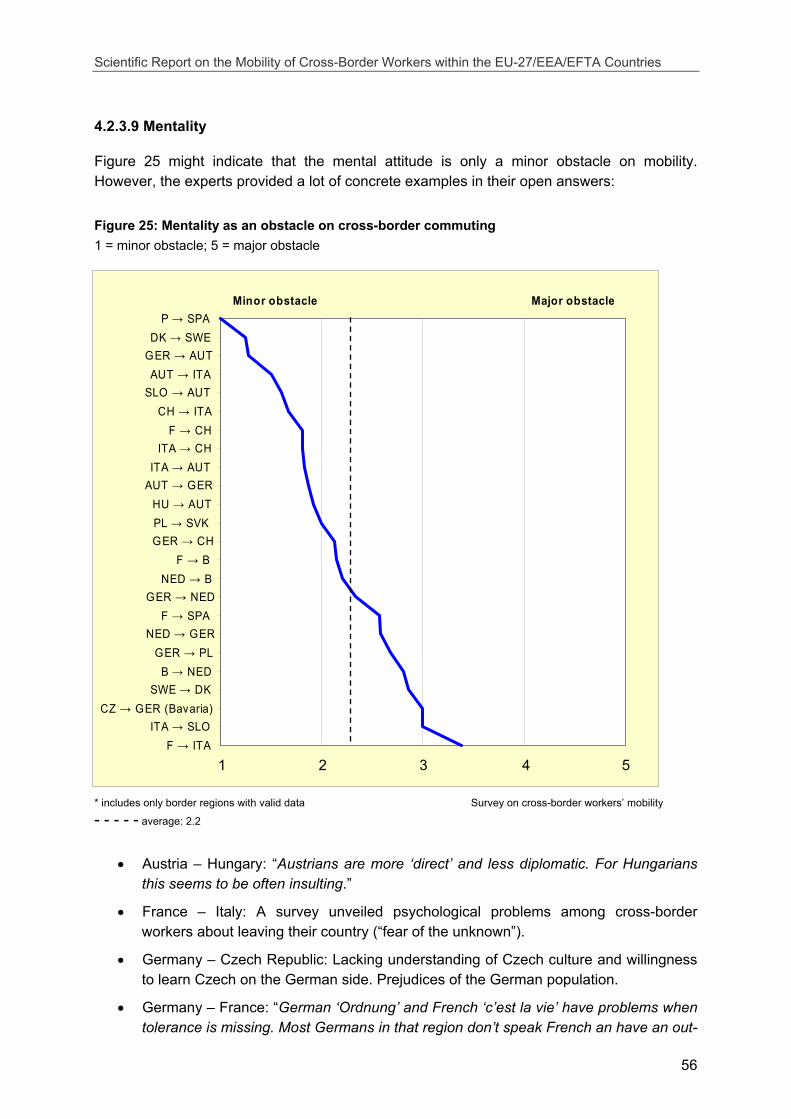
Scientific Report on the Mobility of Cross-Border Workers within the EU-27/EEA/EFTA Countries
56
P → SPADK → SWE
GER → AUTAUT → ITA
SLO → AUTCH → ITA
F → CHITA → CH
ITA → AUTAUT → GER
HU → AUTPL → SVKGER → CH
F → BNED → B
GER → NEDF → SPA
NED → GERGER → PL
B → NEDSWE → DK
CZ → GER (Bavaria)ITA → SLO
F → ITA
Minor obstacle Major obstacle
4.2.3.9 Mentality
Figure 25 might indicate that the mental attitude is only a minor obstacle on mobility. However, the experts provided a lot of concrete examples in their open answers:
Figure 25: Mentality as an obstacle on cross-border commuting 1 = minor obstacle; 5 = major obstacle
* includes only border regions with valid data Survey on cross-border workers’ mobility
- - - - - average: 2.2
• Austria – Hungary: “Austrians are more ‘direct’ and less diplomatic. For Hungarians this seems to be often insulting.”
• France – Italy: A survey unveiled psychological problems among cross-border workers about leaving their country (“fear of the unknown”).
• Germany – Czech Republic: Lacking understanding of Czech culture and willingness to learn Czech on the German side. Prejudices of the German population.
• Germany – France: “German ‘Ordnung’ and French ‘c’est la vie’ have problems when tolerance is missing. Most Germans in that region don’t speak French an have an out-
1 2 3 4 5
Scientific Report on the Mobility of Cross-Border Workers within the EU-27/EEA/EFTA Countries
57
dated picture of the French. Why should they leave their region as long as it’s well developed?”
• Germany – Netherlands: Mental problems – intensified by lack of language skills – mainly on the German side. Different work organisation, hierarchies, association with colleagues etc.
• Ireland – UK: “This is perhaps the biggest obstacle to mobility, for, the two communities have by and large ‘lived apart’ for many decades.”
• Slovenia – Italy: “Slovenia always ‘exported’ labour (mainly low educated), that's why it is hard to imagine that it could also ‘import’ work. Rights of mobile workers as well as cross-border workers are still not known enough.”
• Spain – France: “On the French side there was an approach towards the Spanish culture in recent years, but in Catalunya cultural ties with France are weakening. Young people don’t speak French, French culture is regarded as foreign, French people are mainly noticed when they come to Spain for cheap shopping.”
4.2.4 Influence of the housing market on cross-border commuting
Beside potential earnings and the attractiveness of jobs the housing market plays an important role regarding workers’ mobility too (Muellbauer / Cameron 1998).
Focusing on cross-border mobility the housing and renting market, with a middle index of 3.19 (see Figure 26) seems to have a very strong influence in most border regions (EC 2006b). The figure shows cumulated values for both commuting directions, so that the whole cross-border area is observed in this issue.
Having regard to areas of “high agreement”, it is noticeable that commuting seems to be affected most by housing market developments in border regions where a daily commuting is prevalent, especially in border regions with German or French participation as well as between Denmark and Sweden.
In Germany both, real estate prices and rents have been declining for years and/or stagnating at best, which would explain the preference and growth of “out-commuting” compared to a permanent change of residence (Walter/Just 2006). Merely areas of economic concentrations like Frankfurt or Hamburg show rising real estate and renting prices since 2007 (GdW 2008).
In the border area of DK↔SWE the renting market exerts the strongest influence on cross-border commuting. Due to lower real estate prices, rents and living costs in Sweden numerous Danes still move from Copenhagen to Sweden (e.g. to Scania) and commute back into their jobs in Denmark as “in-commuting nationals”.31 Even presently sinking rents in the area around Copenhagen are not able to thwart this trend.
Concerning the Danish case similar results are shown by a comparative study from 2007, which examined the influence of housing development on geographical mobility of workers in
31 http://www.oresundsbron.com/documents/document.php?obj=6473&&printmode=1

Scientific Report on the Mobility of Cross-Border Workers within the EU-27/EEA/EFTA Countries
58
AUT ↔ SLOGER (Saxony) ↔ CZ
GER ↔ AUTDK ↔ GERAUT ↔ HUGER ↔ PL
SLO ↔ ITAF ↔ SPA
GER (Bavaria) ↔ CZFIN ↔ SWE
ITA ↔ CHITA ↔ AUTFIN ↔ EST
SPA ↔ PITA ↔ F
BG ↔ ROB ↔ NED
PL ↔ SVKGER ↔ NED
IRE ↔ UKGER ↔ CH
B ↔ FF ↔ CH
F ↔ LUXDK ↔ SWE
GER ↔ LUXGER ↔ F
disagree completely
agree completely
Denmark, France and Spain (Ahn / Blazques 2007). However, in case of France only a slight influence of the housing market is established.
Although most statistics usually focus on regional workers’ mobility, it is obvious that the housing market has a strong influence on cross-border commuting, by reason of considerable differences in the cross-national real estate and renting situation.
Figure 26: “The housing market (rents, real estate prices) within my borderregion has a significant influence on cross-border commuting.” 1 = disagree completely; 5 = agree completely
* includes only border regions with valid data Survey on cross-border workers’ mobility
- - - - - average: 3.19
1 2 3 4 5
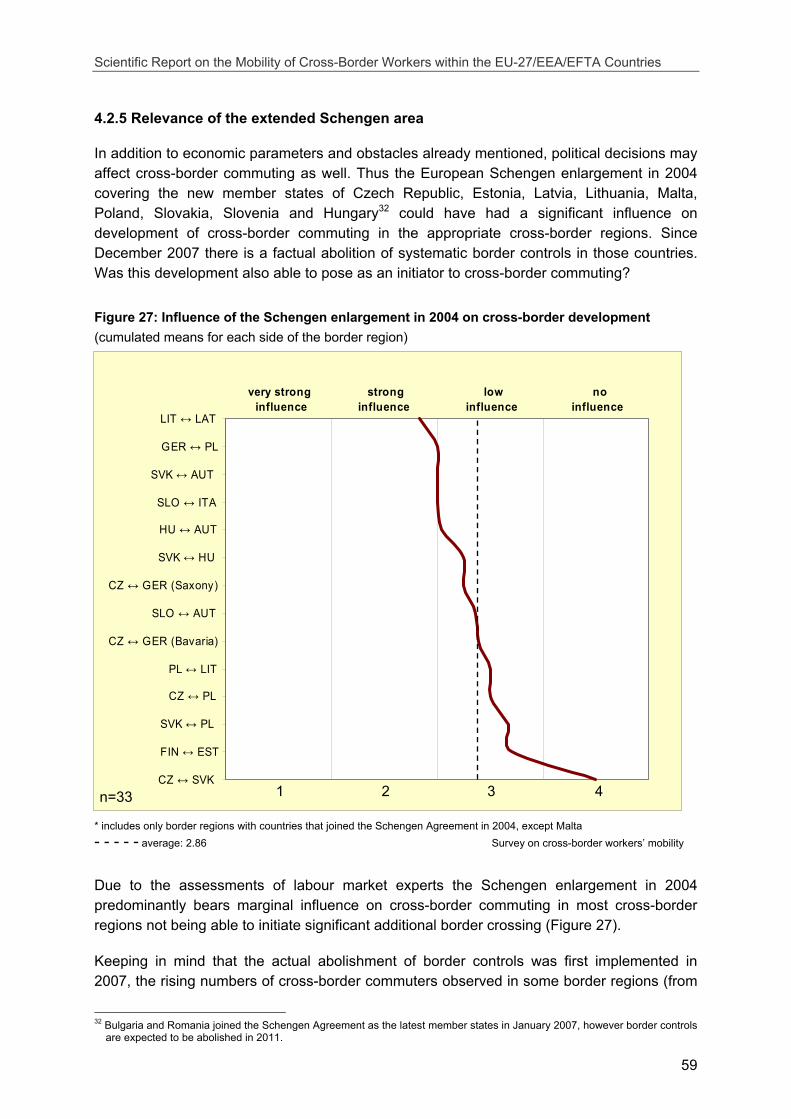
Scientific Report on the Mobility of Cross-Border Workers within the EU-27/EEA/EFTA Countries
59
LIT ↔ LAT
GER ↔ PL
SVK ↔ AUT
SLO ↔ ITA
HU ↔ AUT
SVK ↔ HU
CZ ↔ GER (Saxony)
SLO ↔ AUT
CZ ↔ GER (Bavaria)
PL ↔ LIT
CZ ↔ PL
SVK ↔ PL
FIN ↔ EST
CZ ↔ SVK
very strong influence
strong influence
low influence
no influence
n=33
4.2.5 Relevance of the extended Schengen area
In addition to economic parameters and obstacles already mentioned, political decisions may affect cross-border commuting as well. Thus the European Schengen enlargement in 2004 covering the new member states of Czech Republic, Estonia, Latvia, Lithuania, Malta, Poland, Slovakia, Slovenia and Hungary32 could have had a significant influence on development of cross-border commuting in the appropriate cross-border regions. Since December 2007 there is a factual abolition of systematic border controls in those countries. Was this development also able to pose as an initiator to cross-border commuting?
Figure 27: Influence of the Schengen enlargement in 2004 on cross-border development (cumulated means for each side of the border region)
* includes only border regions with countries that joined the Schengen Agreement in 2004, except Malta - - - - - average: 2.86 Survey on cross-border workers’ mobility
Due to the assessments of labour market experts the Schengen enlargement in 2004 predominantly bears marginal influence on cross-border commuting in most cross-border regions not being able to initiate significant additional border crossing (Figure 27).
Keeping in mind that the actual abolishment of border controls was first implemented in 2007, the rising numbers of cross-border commuters observed in some border regions (from
32 Bulgaria and Romania joined the Schengen Agreement as the latest member states in January 2007, however border controls
are expected to be abolished in 2011.
1 2 3 4
Scientific Report on the Mobility of Cross-Border Workers within the EU-27/EEA/EFTA Countries
60
2004 to 2007) like SVK→AUT (36.3%), HU→AUT (23.8%) and PL→GER (72.3%)33, can not be primarily attributed to the Schengen enlargement in 2004.
In fact this increase in commuting numbers is limited on the direction of EU-12 to EU-15 countries (mainly Austria) and basically influenced by other prior factors like income differences (see chapter 4.1.2) or job potentials.
Obviously, the abolishment of border controls results in an ease of already existing cross-border passenger traffic, but primarily it promotes the movement of goods by shortened waiting periods, bureaucratic deregulations and less delays.
Switzerland, estimated to dispose systematical identity checks at its borders in December 2008, advances a similar view, arguing that cross-border commuting will be influenced by the Schengen accession only to a slight extent. While the Schengen-Visa for foreign citizens with a valid residence permit is repealed, the entrainment of corresponding documents still remains compulsory. Furthermore sporadic spot checks will take place along the border, still keeping an eye on cross-border passenger traffic.34
Summing up, Schengen enlargement in 2004 was able to facilitate the present passenger traffic in the appropriate border areas but less able to boost cross-border commuting in terms of an significant increase of commuting numbers.
4.2.6 Illegal employment and fake self-employment in cross-border regions
The following chapter aims at pointing out potentials of illegal employment identified for cross-border mobility streams within the regions under study. As illegal employment or informal work the present study grasps all such employment that exists without orderly declarations or without payment of public duties (e.g. social insurance contributions, health insurance coverage). As pan-European comparative studies document, the black market predominates in the sectors of household-related services, private services and construction industry and that illegally employed workers or the rendition of related services or goods in many cases derive from Eastern and South-Eastern Europe (Special Eurobarometer 248, 2007). But related phenomena are also wide-spread in the hotel and catering industry, namely in Southern Europe.
Additionally this chapter will pick up the debate on free movement of workforce partially still restricted, as at least indirect interdependencies seem to exist with the emergence of illegal occupation. In this context the ambition is to demonstrate possible connexions, but not to expatiate upon the political discussion about labour market restrictions and transition periods.
In order to prevent misinterpretations it needs to be said that the following Figure 28 merely depicts tendencies of illegal employment in the respective border regions, but does not give testimony of effective occurrences of illegal employments, relative to legally employed commuters.
33 see also cross-border regions profiles 34 Baslerstab, October 2008: Schengen - Abkommen, Viele neue Regeln – und doch ändert sich im Alltag wenig, p.3.
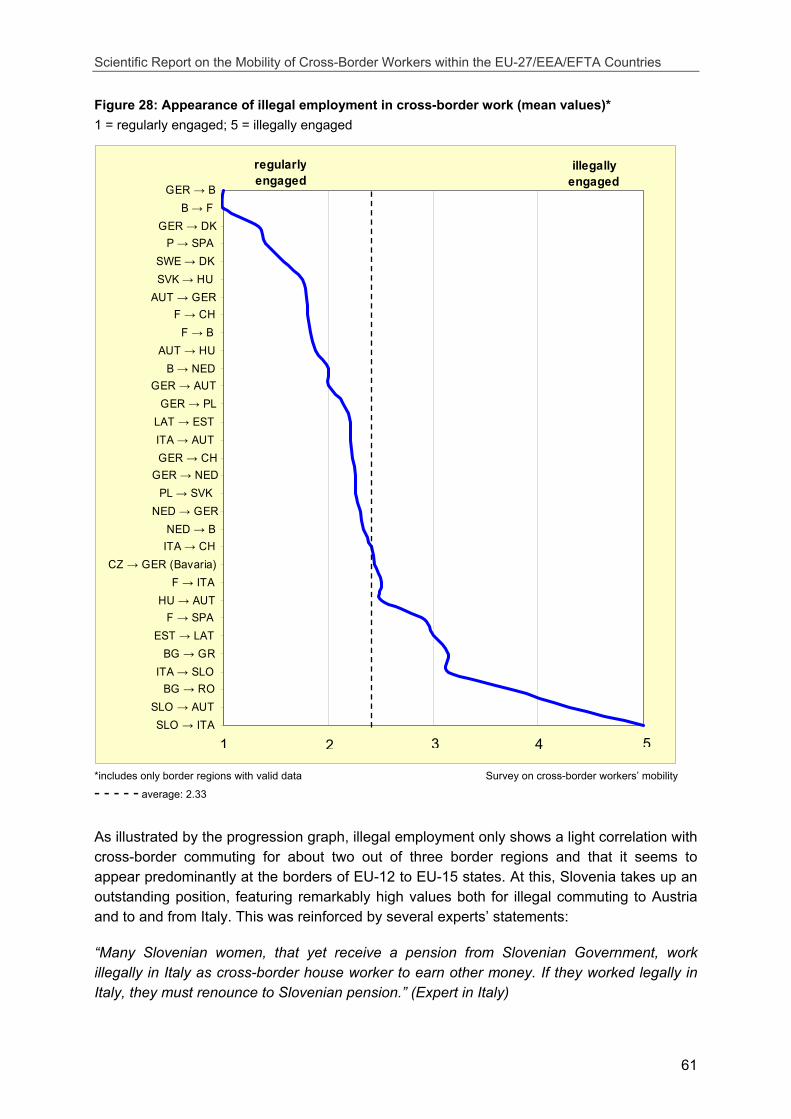
Scientific Report on the Mobility of Cross-Border Workers within the EU-27/EEA/EFTA Countries
61
GER → BB → F
GER → DKP → SPA
SWE → DKSVK → HU
AUT → GERF → CH
F → BAUT → HU
B → NEDGER → AUT
GER → PLLAT → ESTITA → AUTGER → CH
GER → NEDPL → SVK
NED → GERNED → B
ITA → CHCZ → GER (Bavaria)
F → ITAHU → AUT
F → SPAEST → LAT
BG → GRITA → SLO
BG → ROSLO → AUTSLO → ITA
regularlyengaged
illegally engaged
Figure 28: Appearance of illegal employment in cross-border work (mean values)* 1 = regularly engaged; 5 = illegally engaged
*includes only border regions with valid data Survey on cross-border workers’ mobility
- - - - - average: 2.33
As illustrated by the progression graph, illegal employment only shows a light correlation with cross-border commuting for about two out of three border regions and that it seems to appear predominantly at the borders of EU-12 to EU-15 states. At this, Slovenia takes up an outstanding position, featuring remarkably high values both for illegal commuting to Austria and to and from Italy. This was reinforced by several experts’ statements:
“Many Slovenian women, that yet receive a pension from Slovenian Government, work illegally in Italy as cross-border house worker to earn other money. If they worked legally in Italy, they must renounce to Slovenian pension.” (Expert in Italy)
2 3 5 41
Scientific Report on the Mobility of Cross-Border Workers within the EU-27/EEA/EFTA Countries
62
„There are still many workers, who work abroad on the black market every day. In the past years we noticed that this number decreased slightly.” (Expert in Italy)
Austria is a particularly important destination of both illegal migrants and commuters from Slovenia and Hungary, which is in part also consecutive to a still suspended free movement of workers by the Austrian authorities. According to the latest reports, experts appreciate that the number of clandestine workers from foreign countries will rise successively in the upcoming years provided that the officials don’t take countermeasures (Jandl / Hollomey et al., estimated to be published in 2009). It is estimated, for instance, that the Austrian building industry employed about 12,000 workers on illegal conditions in 2007, while the trend continues upwards. For the following years, an ascent in the number of illegally employed labour is expected mainly in the private sector, for domestic cleaning and care services35.
In Greece particularly the estimated number of unreported cases in the clandestine sector is high. With regard to the portion of clandestine work in the GDP composition compared in 22 OECD member states, Greece shows the highest values with 25%, closely followed by Italy (22%) (Schneider / IAW (2008). For the whole Greek territory, according to information by the Hellenic Ministry of Foreign Affairs in 2006 46,959 Bulgarians were occupied illegally in the country. Following the appraisements of Hellenic Police Authorities, though, an overall amount of 140,000 to 180.000 citizens from Bulgaria are working (legally and illegally) in Greece (including seasonal workers), which would equal a potential of illegal employment of a good 100,000 persons. It can be assumed that a prevailing amount falls upon the border area.
Regarding the statements of the consulted labour market experts a differentiated view of Bulgarian commuters becomes evident. Two trends already affirmed in other contexts are also reflected in the following quotation: first the attendance of rather lower valued fields of activity and secondly the seasonal cycles of Bulgarian commuting (see chapters 4.2.2.1, 4.2.2.2). Additionally, it is cited that periods of seasonal engagement are often interspersed with phases of illegal forms of work:
“The positive effect is, that they cover less popular job positions. As a negative development it has been observed that after seasonal employment they do not return to their home country but they remain seeking even illegal employment.” (Expert, Greece)
In the border areas Germany–Poland and Germany–Czech Republic illegal working or disguised self-employment respectively don’t seem to take up a major role with regard to cross-border mobility. Thus, basically justified objections that restrictions on the free movement of workers could be circumvented by evasions into faked self-employment do in no way apply for the Czech-Bavarian border region. The specifically high amount of legal Czech commuters to Germany, on average of all EURES cross-border partnerships is cited as evidence for that (Feasibility study Bavaria-Czech Republic 2005, 48).
Subsequently the aspect of free movement of labour will be addressed, constituting – together with the issue of illegal employment – a key subject of cross-border mobility.
35 http://www.oesterreichnews.de/problemfall-schwarzarbeit-in-oesterreich/130
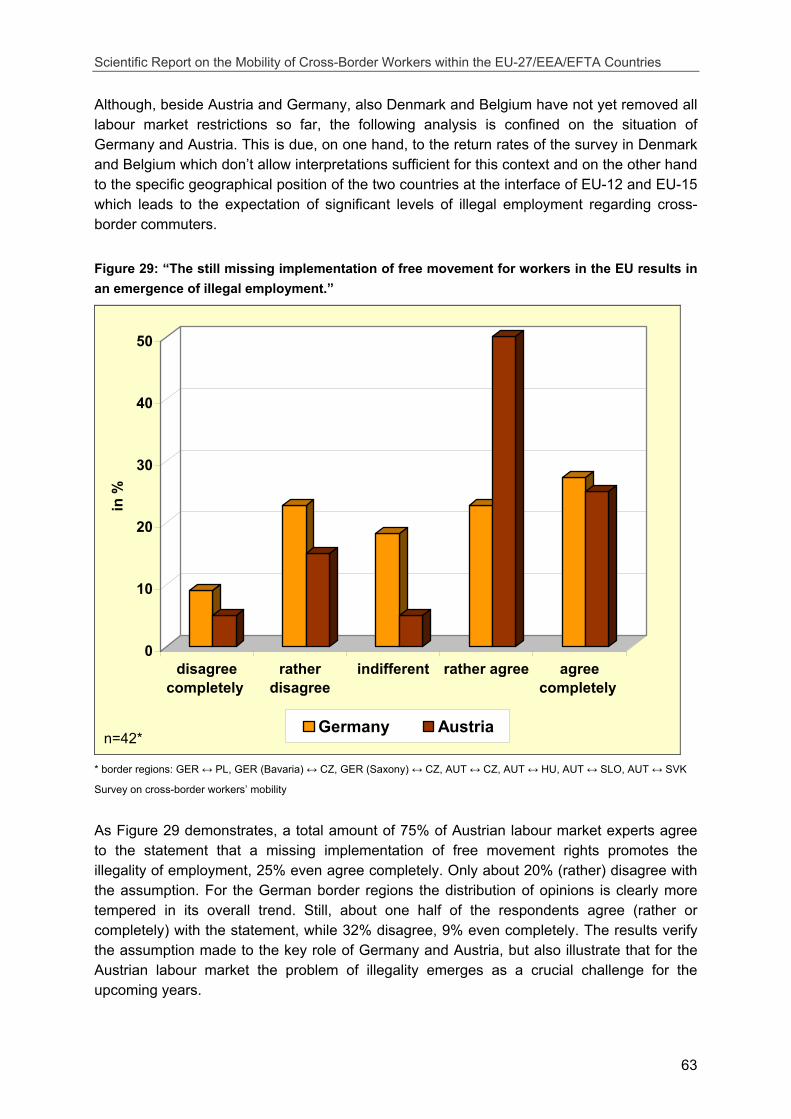
Scientific Report on the Mobility of Cross-Border Workers within the EU-27/EEA/EFTA Countries
63
Although, beside Austria and Germany, also Denmark and Belgium have not yet removed all labour market restrictions so far, the following analysis is confined on the situation of Germany and Austria. This is due, on one hand, to the return rates of the survey in Denmark and Belgium which don’t allow interpretations sufficient for this context and on the other hand to the specific geographical position of the two countries at the interface of EU-12 and EU-15 which leads to the expectation of significant levels of illegal employment regarding cross-border commuters.
Figure 29: “The still missing implementation of free movement for workers in the EU results in an emergence of illegal employment.”
0
10
20
30
40
50
in %
disagreecompletely
ratherdisagree
indifferent rather agree agreecompletely
Germany Austria
* border regions: GER ↔ PL, GER (Bavaria) ↔ CZ, GER (Saxony) ↔ CZ, AUT ↔ CZ, AUT ↔ HU, AUT ↔ SLO, AUT ↔ SVK
Survey on cross-border workers’ mobility
As Figure 29 demonstrates, a total amount of 75% of Austrian labour market experts agree to the statement that a missing implementation of free movement rights promotes the illegality of employment, 25% even agree completely. Only about 20% (rather) disagree with the assumption. For the German border regions the distribution of opinions is clearly more tempered in its overall trend. Still, about one half of the respondents agree (rather or completely) with the statement, while 32% disagree, 9% even completely. The results verify the assumption made to the key role of Germany and Austria, but also illustrate that for the Austrian labour market the problem of illegality emerges as a crucial challenge for the upcoming years.
n=42*

Scientific Report on the Mobility of Cross-Border Workers within the EU-27/EEA/EFTA Countries
64
Latest projections support the view that illegal employment has been decreasing continuously in Germany since 2003 and that the trend is proceeding also for 2008 (Schneider, F. / IAW 2008)36. Possibly, this development also has a hand in a generally more positive appreciation in Germany as regards the informal sector.
A separated analysis by groups of respondents led to the suggestion that first and foremost trade unions would not only support the view explored by this hypothesis, but were even inclined to further emote it. But as resulted from the data analysis, workers’ representatives positioned themselves rather indifferently in view of this problem. However, given the actual percentages across all respondents, this finding even enforces the relevance of illegal employment as a phenomenon of the cross-border market. Furthermore, a current study by the European Commission confirms the very assumption that the vast foreclosure of the German and Austrian labour market for workers from Eastern Europe promotes the emergence of illegal employment. For this reason the Commission pleads an early abolition of transition periods (European Commission 2008).
The consequence of this for Austria is ambivalent, though. On the one hand, it is beyond dispute that illegal engagement seems inevitable to a certain extent as an effect of the suspended free movement of workers. This, however, would entail its immediate implementation in order to retrench illegality. On the other hand worries are serious on the Austrian part – due to its location with four EU-12 countries adjacent – that a total invalidation of restrictions could initiate an inrush of migrants and commuters on the domestic labour market, destabilising its structure37. So far, this argument has provided the basis to justify transition periods, but becomes discuss-worthy in the light of the current Commission report.
The subsequent chapter will account for further labour market consequences of cross-border working mobility, such as potential displacement effects.
4.2.7 Labour displacement or complement of domestic workforce
Apart from the quantitative development of commuter streams, which increase in most border areas continuously, besides the question arises whether in-commuters are predominantly noticed as complementary working resources or rather as competitors in sense of a displacement of the domestic workforce. This aspect was analysed on the basis of the following statement (Figure 30).
36 Amongst others, this is ascribed to facilitations in setting off household-services from tax liability, reductions of unemployment insurance contributions and a sinking unemployment rate. 37 Wiener Zeitung, November 18th, 2008
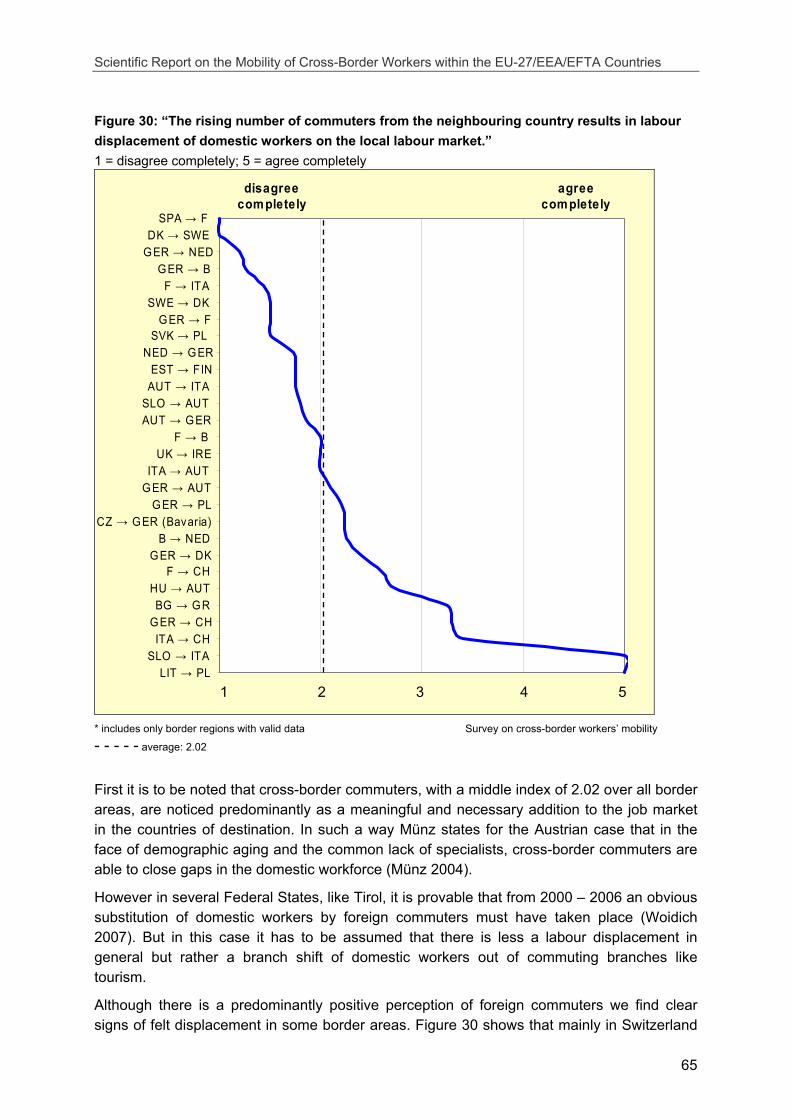
Scientific Report on the Mobility of Cross-Border Workers within the EU-27/EEA/EFTA Countries
65
Figure 30: “The rising number of commuters from the neighbouring country results in labour displacement of domestic workers on the local labour market.” 1 = disagree completely; 5 = agree completely
SPA → FDK → SWE
GER → NEDGER → B
F → ITASWE → DK
GER → FSVK → PL
NED → GEREST → FIN
AUT → ITASLO → AUTAUT → GER
F → BUK → IRE
ITA → AUTGER → AUT
GER → PLCZ → GER (Bavaria)
B → NEDGER → DK
F → CHHU → AUTBG → GR
GER → CHITA → CH
SLO → ITALIT → PL
disagree completely
agree completely
* includes only border regions with valid data Survey on cross-border workers’ mobility
- - - - - average: 2.02
First it is to be noted that cross-border commuters, with a middle index of 2.02 over all border areas, are noticed predominantly as a meaningful and necessary addition to the job market in the countries of destination. In such a way Münz states for the Austrian case that in the face of demographic aging and the common lack of specialists, cross-border commuters are able to close gaps in the domestic workforce (Münz 2004).
However in several Federal States, like Tirol, it is provable that from 2000 – 2006 an obvious substitution of domestic workers by foreign commuters must have taken place (Woidich 2007). But in this case it has to be assumed that there is less a labour displacement in general but rather a branch shift of domestic workers out of commuting branches like tourism.
Although there is a predominantly positive perception of foreign commuters we find clear signs of felt displacement in some border areas. Figure 30 shows that mainly in Switzerland
1 2 3 4 5
Scientific Report on the Mobility of Cross-Border Workers within the EU-27/EEA/EFTA Countries
66
(covering 27% of all in-commuters), workers of the neighbouring countries (ITA→CH, GER→CH, F→CH) are conspicuously considered as competitors to domestic workers. High values are observed for commuters from Italy (3.4) as well as from Germany (3.3).
A possible explanation lies in the fact that Switzerland, in relation to other countries, gets frequented strongly by highly skilled workers, occupying well remunerated, attractive job positions within the Swiss economy. In contrast cross-border commuters in other border regions (mainly out of the EU-12 states) often occupy economic niches and peripheral business areas, which are of little interest for domestic workers.
Having a closer look at Figure 30 a further conclusion reveals. It is remarkable that within the range „agree completely“, apart from Switzerland, commuter streams of SLO→ITA, BG→GR HU→AUT show an obvious correlation of the displacement of domestic workers noticed by labour market experts and the level of illegal employment estimated in these cross-border regions (Figure 30) exists.
Therefore moonlighting seems to cause not only fiscal losses in the countries of destination but also a reduction of regularly offered job opportunities on the local labour markets. By that reason commuter streams mentioned above are more strongly than in other regions regarded as „disruptive factors” to the local labour market equilibrium.
4.2.8 Globalisation, economic restructuring and cross-border labour markets - the example “Czech Republic and Bavarian border region”
In the early transition years (1992 until 1996) many of the labour intensive production activities on the western side of the border were shifted to the eastern side. For example, in the production of china (porcelain), the number of persons employed in this branch on the Bavarian side of the border more than halved in this period from about 10,000 to under 4,00038. Since 1996 this trend continued but slowed down considerably. In an analogous way employment on the Czech side of the border increased, not only in absolute terms but also in relation to the overall employment trend in the Czech Republic. Interestingly, wages of Czech workers with the lowest skill degree increased between 1996 and 2002 faster than in the overall Czech average in this skill category. For all other skill groups in the border regions the spatial wage gap remained negative and – in absolute terms – increased with the skill level. On the other hand, on the Bavarian side of the border to the Czech Republic the general employment trend was negative in the whole period 1992 to 2002. However, the economic specialisation and up-grading trend was reflected in higher skill and also wage levels compared to the period before the transition process started. This clearly shows that in the first phase of the transition process often labour intensive activities – requiring a relatively low skill level – are likely to be shifted to the low-wage country, here the Czech side of the border. After most part of the restructuring had been completed, employment picked also up on the Bavarian side of the border, particularly in the upswing years 2006 and 2007.
The existence of competitive economic structures on both sides of the border should be a good breeding ground for commuters in both directions.
38 According to the statistic of PES Germany (Bundesagantur für Arbeit)
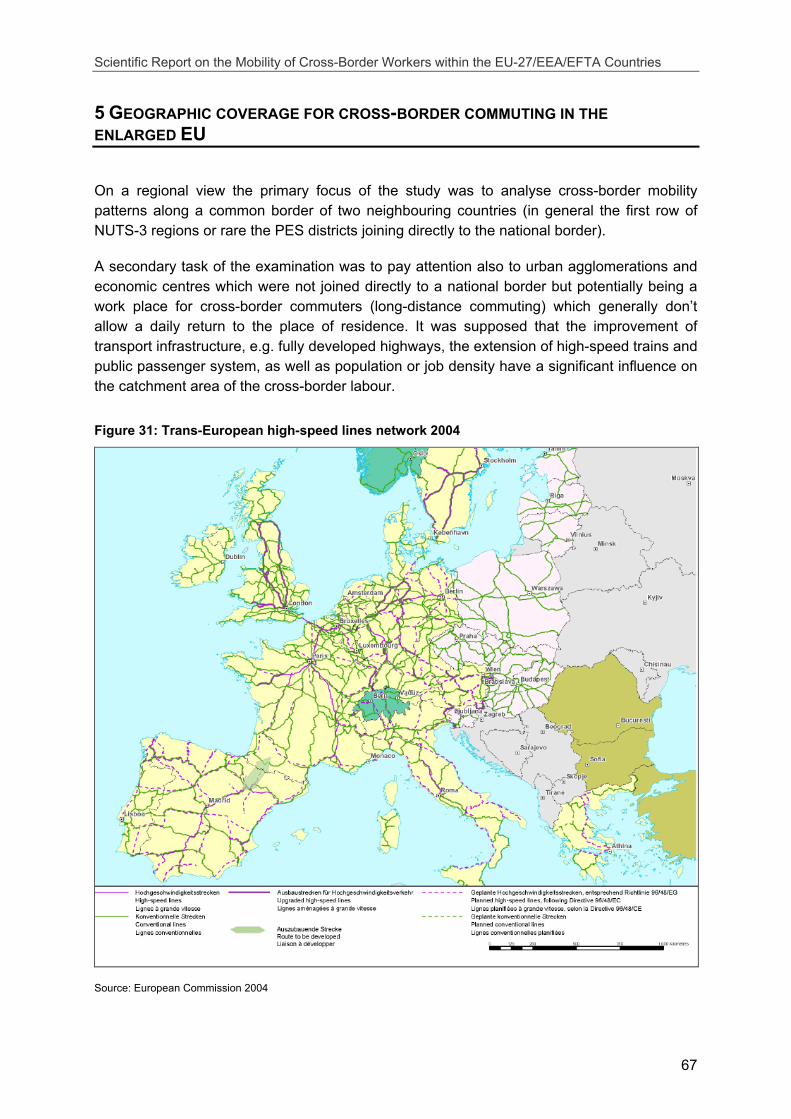
Scientific Report on the Mobility of Cross-Border Workers within the EU-27/EEA/EFTA Countries
67
5 GEOGRAPHIC COVERAGE FOR CROSS-BORDER COMMUTING IN THE ENLARGED EU
On a regional view the primary focus of the study was to analyse cross-border mobility patterns along a common border of two neighbouring countries (in general the first row of NUTS-3 regions or rare the PES districts joining directly to the national border).
A secondary task of the examination was to pay attention also to urban agglomerations and economic centres which were not joined directly to a national border but potentially being a work place for cross-border commuters (long-distance commuting) which generally don’t allow a daily return to the place of residence. It was supposed that the improvement of transport infrastructure, e.g. fully developed highways, the extension of high-speed trains and public passenger system, as well as population or job density have a significant influence on the catchment area of the cross-border labour.
Figure 31: Trans-European high-speed lines network 2004
Source: European Commission 2004
Scientific Report on the Mobility of Cross-Border Workers within the EU-27/EEA/EFTA Countries
68
As can be seen in Figure 31 the highest density of high-speed railways39 in 2007 exists in the countries of France (1,893 km), Spain (1,552 km), Germany (1,300 km), Italy (562 km), UK (115 km) and Belgium (120 km). There are no high-speed railways in the new EU member states yet.
At the moment there are just a few transnational high-speed connections which are adequate for daily commuting (e.g. EUROSTAR, ICE, TGV, Thalys) especially between France, UK, Germany and the Benelux countries. In these countries there is also a high developed trans-national motorway density which promotes additionally daily commuting.
“Euro-commuters” France – United Kingdom A current trend that adds up to the number of French commuters is realized by English workers acquiring lodging in France and commuting back to the UK to work. South-East England is already the second most densely populated region in Europe. Furthermore considering the lower costs (housing prices 30% cheaper than in the UK, living expenses, high quality of French health care), British official sides already promote relocations in France. French estate agents count with monthly increasing rates up to 17% in the number of sales to English customers. Moreover, current transformations in the working environment, especially in this highly developed area, brings forward the new tendency towards “long-distance commuting”. Cheap flights and train journeys, flexible working hours (e.g. home offices) and an increase in communication technology (e.g. high-speed broadband and video conferencing) enables workers to reduce commuting rates, attend the local office only once a week and to commute even from remote areas (such as Southern France to London). Certainly, absolute numbers of those so called “euro-commuters” are even harder to measure. Euro-commuting is going to keep growing as business becomes much more European and companies shift headquarters and move people around for senior positions. Although the high speed train connection (Eurostar) only takes from 1.09h (Lille–London) to 2.15h (Paris–London) to cross the Channel. But at current rates, getting to London on Eurostar's passenger train can cost as much as £125 one way, ferry connections (90 minutes) from £89 with private car, which makes daily commuting costly. So it can be assumed that this opportunity can promote journeys for business activities or for long-distance commuting40, but because of high ticket prices does not explicitly initiate cross-border job commuting on a larger scale.
A report of the British Centre of Future Studies (CFS) in 2006 predicts that in the 2020 up to 1.5 million Britons will work abroad. This will result in the rise of international commuting where Britons owning overseas properties will increasingly use them as their main base travelling to their UK office on an infrequent basis, and instead working from their overseas home or from their companies’ international offices.
Additionally this development will be promoted by a rising number of companies which will increase the annual leave allocation giving people more ‘soft’ holidays and less ‘hard’ holidays41, the continuing breakdown of traditional family structures and a rising independence both in professional and private life.
39 Length of lines or of sections of lines on which trains can go faster than 250 km/h at some point during the journey (European
Commission 2007) 40 According numbers published by Eurostar group, the connection covers 66% of the London-Paris rail/air market in 2004 and
up to 9 million passengers a year. 41 “In order to redress the work-life balance, by 2016, some companies will introduce ‘hard’ and ‘soft’ annual leave which will
mean an increase in the amount of total annual leave (combination of hard and soft - less hard more soft) on the proviso that a specified amount of work is carried out during some of those holidays.” (CFS 2006)
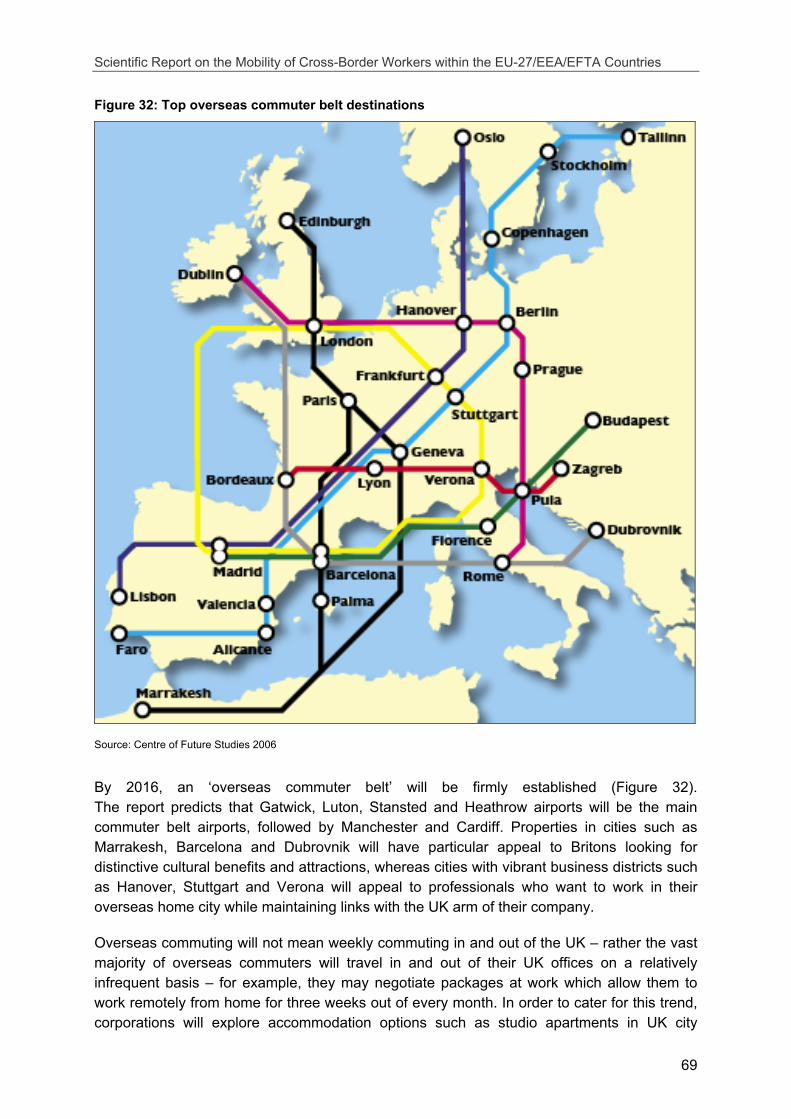
Scientific Report on the Mobility of Cross-Border Workers within the EU-27/EEA/EFTA Countries
69
Figure 32: Top overseas commuter belt destinations
Source: Centre of Future Studies 2006
By 2016, an ‘overseas commuter belt’ will be firmly established (Figure 32). The report predicts that Gatwick, Luton, Stansted and Heathrow airports will be the main commuter belt airports, followed by Manchester and Cardiff. Properties in cities such as Marrakesh, Barcelona and Dubrovnik will have particular appeal to Britons looking for distinctive cultural benefits and attractions, whereas cities with vibrant business districts such as Hanover, Stuttgart and Verona will appeal to professionals who want to work in their overseas home city while maintaining links with the UK arm of their company.
Overseas commuting will not mean weekly commuting in and out of the UK – rather the vast majority of overseas commuters will travel in and out of their UK offices on a relatively infrequent basis – for example, they may negotiate packages at work which allow them to work remotely from home for three weeks out of every month. In order to cater for this trend, corporations will explore accommodation options such as studio apartments in UK city

Scientific Report on the Mobility of Cross-Border Workers within the EU-27/EEA/EFTA Countries
70
centres where employees can base themselves during their UK visits. It is expected that travel companies will work directly with large companies offering bulk overseas commuter flight packages for staff. Travel companies may also consider branching out into UK studio property acquisition in order to create comprehensive ‘overseas commuter’ packages to corporations (CFS 2006).
Finally one can distinguish between two main long-distance commuting flows. It can be characterized as follows:
- “work and job related commuting flows” and
- “life and leisure related commuting flows”
“Work and job related commuting flows” from the place of residence to the place of work in a metropolitan area will be initiated by
- a high availability of skilled jobs (skill-level correlates with mobility rates)
- a high level of wages (sufficient condition for job mobility)
- a high number of international enterprises/institutions (intra-corporate job changes including international institutions or universities)
“Life and leisure related commuting flows” from a metropolitan area to the place of residence abroad will be initiated by
- a high life and leisure quality at the place of residence abroad (e.g. climate, nature)
- a lower level of housing prices and rents in the place of residence abroad
- social and demographic changes (breakdown of traditional family structures, raising number of single and independent professionals)
Within this study it was not possible to rank the importance of the criteria on base of a profound empirical evidence. However, the findings of this and other corresponding studies (e.g. EC 2006b) indicate that the described criteria are one of the most significant drivers stimulating long-distance commuting between European metropolitan areas. With an increasing European integration (e.g. the improvement of the Trans European Networks (TEN) and the broad extension of modern communication technologies and the reducing of its costs, the Schengen enlargement and the European Educational Area) this type of commuting will become more and more attractive and will offer new opportunities for EU-citizens and the labour market.
Scientific Report on the Mobility of Cross-Border Workers within the EU-27/EEA/EFTA Countries
71
6 MOBILITY POTENTIALS IN CROSS-BORDER REGIONS
Up to this point, the present study undertook various descriptive analyses, many of them already bearing interpretative approaches, but referring exclusively to one sort of data (survey results to one specific topic) from which the analysis was derived. But, as reflected in the introduction (see under chapter 1.1 and 1.2), the study strives to comprise cross-border commuting as a core phenomenon of labour mobility, which also includes coherently explaining its root causes. In the course of the evaluation, several factors were investigated that each have a potential influence on commuting – such as labour market restrictions, income perspectives or access to information. In this summarising chapter those isolated factors will be put into interrelation.
In order to deduce a comprehensive explanatory model for the intensity of commuting an integrated factor analysis was created, which will be presented in the following. The analysis aims at stating a correlation between commuting intensity (depicted by level of commuting) and possible influence factors. Regarding the latter, we mainly rely on the obstacles on mobility, extended by ”hard“ economic indicators.
As a first step, the obstacle index was worked out. For this purpose, in every border region for each of the 9 obstacles on mobility42 the mean average was calculated. As numerative basis, the classification used in the online survey and depicted in chapter 4.2.3, from 1 (low importance) to 5 (high importance) was adopted. The mean averages for each obstacle were now condensed for each border region, again by drawing the arithmetic mean, to one single indicator43 with values from 1 to 5, the obstacle index. The index was generated both for entire cross-border regions (region A↔B) and for each commuting direction (A→B and B→A).
This index now depicts the accessibility of cross-border labour markets, taking into account the comprehensive structure of mobility factors in its mental/social, legal and infrastructural dimension. It must be pointed out that a higher index indicates lower mobility and vice versa, so that correlations with that indicator are postulated to be negative. Still, basic economic factors such as income and working place perspectives, that certainly influence the tendency to commute, remain unreflected by this index. Consequently, they were integrated into this calculation by the addition of two basic economic indicators: unemployment rate and GDP rate per capita. While the first factor depicts labour market accessibility (push- and pull-effects, job opportunities), the latter comprises both potential earnings for commuters as well as further development perspectives (the system’s general prosperity). Those economic factors were proportionately integrated into the index calculation: For each border region the difference in unemployment rate (between region of destination and region of origin) and the difference in GDP per capita (between region of origin and region of destination; as relations
42 Because of frequent misunderstandings the tenth item “income differences“ was excluded from this calculation, the factor of
income was included otherwise in the account. The remaining nine items for obstacles on mobility are: mentality, language, transport infrastructure, tax regulations, rights to pension, other rights to social insurance, legal restrictions on the labour market, acceptance of formations/graduations and the lack of information.
43 Border regions with a low number of mentions were excluded from this calculation. Thus, a minimum of three mentions for individual obstacles and of five obstacle means for the index of mobility was applied. Exceptional cases with significant values were also registered with only four obstacle means.
Scientific Report on the Mobility of Cross-Border Workers within the EU-27/EEA/EFTA Countries
72
are inverse) were added to the index of mobility44. The resulting index of mobility, which again designates high cross-border mobility with low ratios and vice versa45, integrates social, legal, infrastructural and economic factors and is therefore a comprehensive and balanced indicator for the accessibility of cross-border labour markets.
It is to be expected, consequently, that this cumulated index gives information about the number of commuters in the respective border region(s). To control this hypothesis, significant correlations are assumed between the index and the level of commuting, the percentage of commuters relative to the employed people in the border region (already generated under 4.1.1.3, Table 4). The correlation was drawn first on the level of entire cross-border regions and in a second step on a directed level, i.e. for each commuting direction with valid numbers. The results are compiled in Table 9 and in Annex A.
First, the index of mobility was calculated for entire cross-border regions and in a second step on the level of single cross-border directions (see Table 9). We find the values for this index varying around a mean average of 2.45 with a maximum of 4.65 for Slovakia→Austria and a minimum of −2.32 for Germany↔Luxembourg. It is expected that low values on this index correlate with high levels of commuting an vice versa. This assumption was verified by a correlation value of −0.60 (−0.42 on the level of entire border regions), indicating a significant cohesion between the two factors. The correlation is not stringent in all cases46, as distortions may occur by the comparison of different dimensions and different sources of data (e.g. survey results and economic indicators). It can be shown, however, that the index is a better indicator for mobility than considering only the gathered obstacles: the correlation between obstacles and level of commuting only attains a value of −0.21 (−0.27 for border regions). Consequently, this combined methodology seems to be a reliable explanatory mode for cross-border mobility.
44 The differences were weighted in the following way: difference of percental unemployment rate / 10 and difference of GDP
level per capita in k € / 10. Economic indicators were divided by ten in order to attribute local values comparable to the values of the index: As values for the obstacle index are situated in a relatively close range around the mean value of 2.7 (mean square deviation of 0.56 and variance of 0.32), variations already at a decimal level bring significant results. The differences of economic indicators however were at a one-digit level (medians for unemployment 3.3 and for GDP 4.8), so that the division by ten would reclassify them correctly, without misapplying their significance. The complete formula for the index of mobility is exemplified in the following:
For the commuting direction Estonia→Finland an obstacle index of 2.94 was established. The unemployment rates for the border regions are 7.5 (EST) and 6.2 (FIN) and the GDP levels in k are 18.5 and 31.8 respectively. The index of mobility is derived by:
48.133.113.094.21010
=−−=−
+−
+FINGDPESGDPunempl.ESunempl.FINindexobstacle
In this case, an obstacle index slightly above average (mainly due to infrastructural obstacles) is reduced by a large difference in economic (GDP) levels, which operates as major factor. The result of 1.48, a particularly low value, indicates a relatively high mobility potential.
45 Index values do not possess absolute maxima and minima, but normally vary between 1 and 4 with a mean average of 2.45. In special cases (namely involving prospering regions like Luxembourg) also negative values can be achieved (lowest value: GER→LUX = −2.32).
46 For instance for UK→ Ireland a very high level of commuting is obtained despite of a relatively high index value, which reflects
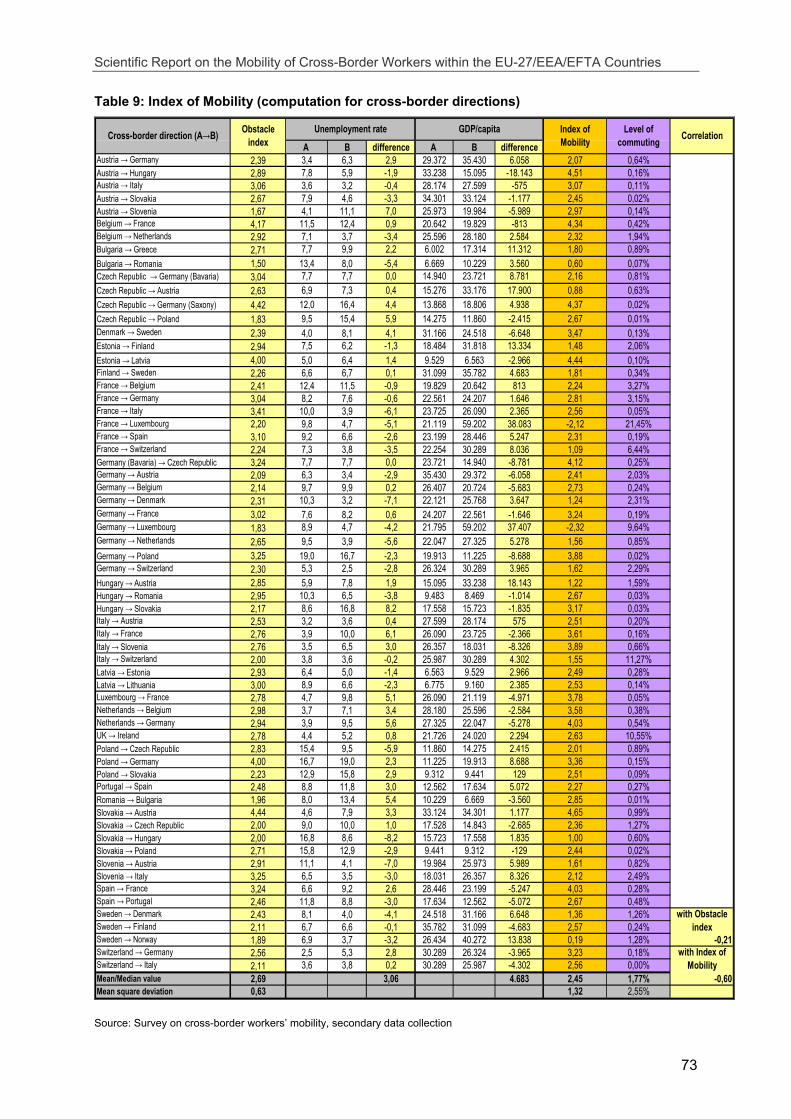
Scientific Report on the Mobility of Cross-Border Workers within the EU-27/EEA/EFTA Countries
73
Table 9: Index of Mobility (computation for cross-border directions)
A B difference A B differenceAustria → Germany 2,39 3,4 6,3 2,9 29.372 35.430 6.058 2,07 0,64%Austria → Hungary 2,89 7,8 5,9 -1,9 33.238 15.095 -18.143 4,51 0,16%Austria → Italy 3,06 3,6 3,2 -0,4 28.174 27.599 -575 3,07 0,11%Austria → Slovakia 2,67 7,9 4,6 -3,3 34.301 33.124 -1.177 2,45 0,02%Austria → Slovenia 1,67 4,1 11,1 7,0 25.973 19.984 -5.989 2,97 0,14%Belgium → France 4,17 11,5 12,4 0,9 20.642 19.829 -813 4,34 0,42%Belgium → Netherlands 2,92 7,1 3,7 -3,4 25.596 28.180 2.584 2,32 1,94%Bulgaria → Greece 2,71 7,7 9,9 2,2 6.002 17.314 11.312 1,80 0,89%Bulgaria → Romania 1,50 13,4 8,0 -5,4 6.669 10.229 3.560 0,60 0,07%Czech Republic → Germany (Bavaria) 3,04 7,7 7,7 0,0 14.940 23.721 8.781 2,16 0,81%Czech Republic → Austria 2,63 6,9 7,3 0,4 15.276 33.176 17.900 0,88 0,63%Czech Republic → Germany (Saxony) 4,42 12,0 16,4 4,4 13.868 18.806 4.938 4,37 0,02%Czech Republic → Poland 1,83 9,5 15,4 5,9 14.275 11.860 -2.415 2,67 0,01%Denmark → Sweden 2,39 4,0 8,1 4,1 31.166 24.518 -6.648 3,47 0,13%Estonia → Finland 2,94 7,5 6,2 -1,3 18.484 31.818 13.334 1,48 2,06%Estonia → Latvia 4,00 5,0 6,4 1,4 9.529 6.563 -2.966 4,44 0,10%Finland → Sweden 2,26 6,6 6,7 0,1 31.099 35.782 4.683 1,81 0,34%France → Belgium 2,41 12,4 11,5 -0,9 19.829 20.642 813 2,24 3,27%France → Germany 3,04 8,2 7,6 -0,6 22.561 24.207 1.646 2,81 3,15%France → Italy 3,41 10,0 3,9 -6,1 23.725 26.090 2.365 2,56 0,05%France → Luxembourg 2,20 9,8 4,7 -5,1 21.119 59.202 38.083 -2,12 21,45%France → Spain 3,10 9,2 6,6 -2,6 23.199 28.446 5.247 2,31 0,19%France → Switzerland 2,24 7,3 3,8 -3,5 22.254 30.289 8.036 1,09 6,44%Germany (Bavaria) → Czech Republic 3,24 7,7 7,7 0,0 23.721 14.940 -8.781 4,12 0,25%Germany → Austria 2,09 6,3 3,4 -2,9 35.430 29.372 -6.058 2,41 2,03%Germany → Belgium 2,14 9,7 9,9 0,2 26.407 20.724 -5.683 2,73 0,24%Germany → Denmark 2,31 10,3 3,2 -7,1 22.121 25.768 3.647 1,24 2,31%Germany → France 3,02 7,6 8,2 0,6 24.207 22.561 -1.646 3,24 0,19%Germany → Luxembourg 1,83 8,9 4,7 -4,2 21.795 59.202 37.407 -2,32 9,64%Germany → Netherlands 2,65 9,5 3,9 -5,6 22.047 27.325 5.278 1,56 0,85%Germany → Poland 3,25 19,0 16,7 -2,3 19.913 11.225 -8.688 3,88 0,02%Germany → Switzerland 2,30 5,3 2,5 -2,8 26.324 30.289 3.965 1,62 2,29%Hungary → Austria 2,85 5,9 7,8 1,9 15.095 33.238 18.143 1,22 1,59%Hungary → Romania 2,95 10,3 6,5 -3,8 9.483 8.469 -1.014 2,67 0,03%Hungary → Slovakia 2,17 8,6 16,8 8,2 17.558 15.723 -1.835 3,17 0,03%Italy → Austria 2,53 3,2 3,6 0,4 27.599 28.174 575 2,51 0,20%Italy → France 2,76 3,9 10,0 6,1 26.090 23.725 -2.366 3,61 0,16%Italy → Slovenia 2,76 3,5 6,5 3,0 26.357 18.031 -8.326 3,89 0,66%Italy → Switzerland 2,00 3,8 3,6 -0,2 25.987 30.289 4.302 1,55 11,27%Latvia → Estonia 2,93 6,4 5,0 -1,4 6.563 9.529 2.966 2,49 0,28%Latvia → Lithuania 3,00 8,9 6,6 -2,3 6.775 9.160 2.385 2,53 0,14%Luxembourg → France 2,78 4,7 9,8 5,1 26.090 21.119 -4.971 3,78 0,05%Netherlands → Belgium 2,98 3,7 7,1 3,4 28.180 25.596 -2.584 3,58 0,38%Netherlands → Germany 2,94 3,9 9,5 5,6 27.325 22.047 -5.278 4,03 0,54%UK → Ireland 2,78 4,4 5,2 0,8 21.726 24.020 2.294 2,63 10,55%Poland → Czech Republic 2,83 15,4 9,5 -5,9 11.860 14.275 2.415 2,01 0,89%Poland → Germany 4,00 16,7 19,0 2,3 11.225 19.913 8.688 3,36 0,15%Poland → Slovakia 2,23 12,9 15,8 2,9 9.312 9.441 129 2,51 0,09%Portugal → Spain 2,48 8,8 11,8 3,0 12.562 17.634 5.072 2,27 0,27%Romania → Bulgaria 1,96 8,0 13,4 5,4 10.229 6.669 -3.560 2,85 0,01%Slovakia → Austria 4,44 4,6 7,9 3,3 33.124 34.301 1.177 4,65 0,99%Slovakia → Czech Republic 2,00 9,0 10,0 1,0 17.528 14.843 -2.685 2,36 1,27%Slovakia → Hungary 2,00 16,8 8,6 -8,2 15.723 17.558 1.835 1,00 0,60%Slovakia → Poland 2,71 15,8 12,9 -2,9 9.441 9.312 -129 2,44 0,02%Slovenia → Austria 2,91 11,1 4,1 -7,0 19.984 25.973 5.989 1,61 0,82%Slovenia → Italy 3,25 6,5 3,5 -3,0 18.031 26.357 8.326 2,12 2,49%Spain → France 3,24 6,6 9,2 2,6 28.446 23.199 -5.247 4,03 0,28%Spain → Portugal 2,46 11,8 8,8 -3,0 17.634 12.562 -5.072 2,67 0,48%Sweden → Denmark 2,43 8,1 4,0 -4,1 24.518 31.166 6.648 1,36 1,26%Sweden → Finland 2,11 6,7 6,6 -0,1 35.782 31.099 -4.683 2,57 0,24%Sweden → Norway 1,89 6,9 3,7 -3,2 26.434 40.272 13.838 0,19 1,28% -0,21Switzerland → Germany 2,56 2,5 5,3 2,8 30.289 26.324 -3.965 3,23 0,18%Switzerland → Italy 2,11 3,6 3,8 0,2 30.289 25.987 -4.302 2,56 0,00%Mean/Median value 2,69 3,06 4.683 2,45 1,77% -0,60Mean square deviation 0,63 1,32 2,55%
with Obstacle index
with Index of Mobility
CorrelationGDP/capita Level of commuting
Index of MobilityCross-border direction (A→B) Obstacle
indexUnemployment rate
Source: Survey on cross-border workers’ mobility, secondary data collection
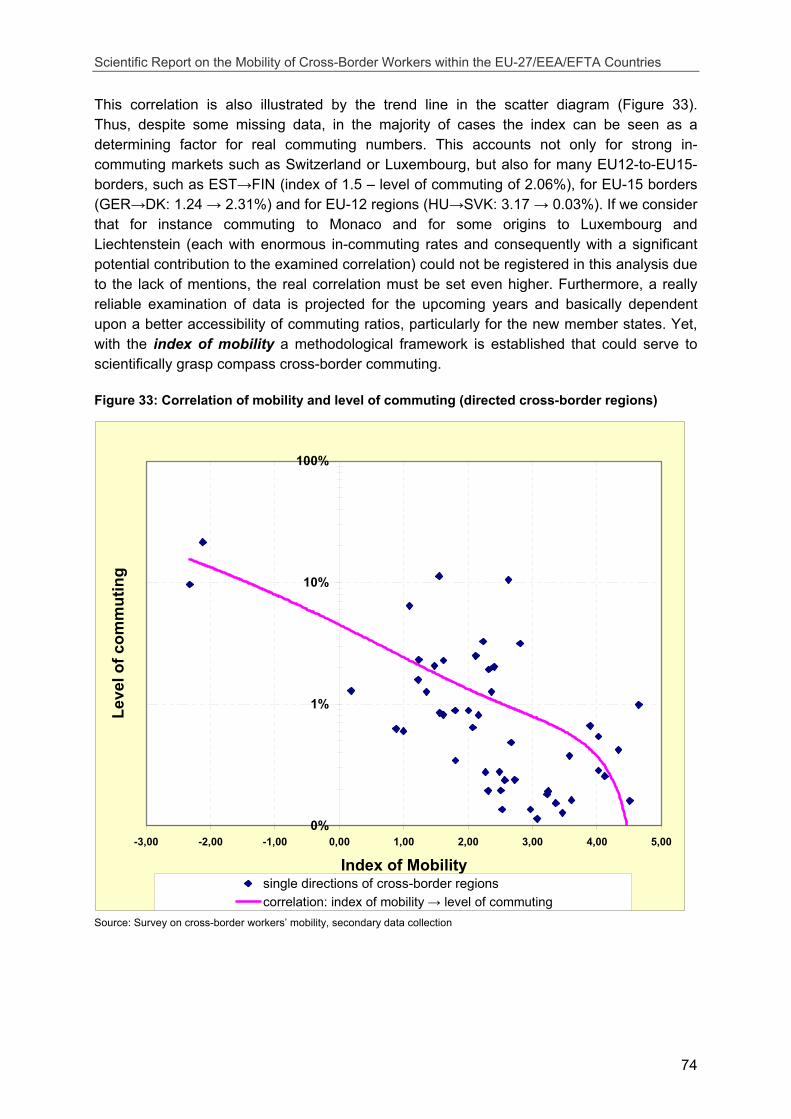
Scientific Report on the Mobility of Cross-Border Workers within the EU-27/EEA/EFTA Countries
74
This correlation is also illustrated by the trend line in the scatter diagram (Figure 33). Thus, despite some missing data, in the majority of cases the index can be seen as a determining factor for real commuting numbers. This accounts not only for strong in-commuting markets such as Switzerland or Luxembourg, but also for many EU12-to-EU15-borders, such as EST→FIN (index of 1.5 – level of commuting of 2.06%), for EU-15 borders (GER→DK: 1.24 → 2.31%) and for EU-12 regions (HU→SVK: 3.17 → 0.03%). If we consider that for instance commuting to Monaco and for some origins to Luxembourg and Liechtenstein (each with enormous in-commuting rates and consequently with a significant potential contribution to the examined correlation) could not be registered in this analysis due to the lack of mentions, the real correlation must be set even higher. Furthermore, a really reliable examination of data is projected for the upcoming years and basically dependent upon a better accessibility of commuting ratios, particularly for the new member states. Yet, with the index of mobility a methodological framework is established that could serve to scientifically grasp compass cross-border commuting.
Figure 33: Correlation of mobility and level of commuting (directed cross-border regions)
0%
1%
10%
100%
-3,00 -2,00 -1,00 0,00 1,00 2,00 3,00 4,00 5,00
Index of Mobility
Leve
l of c
omm
utin
g
single directions of cross-border regionscorrelation: index of mobility → level of commuting
Source: Survey on cross-border workers’ mobility, secondary data collection
Scientific Report on the Mobility of Cross-Border Workers within the EU-27/EEA/EFTA Countries
75
On the basis of this instrument cross-border mobility can be further analysed as regards its developmental potentials in the following years. Therefore, all cross-border regions with valid data were reclassified into different types according to their index of mobility and level of commuting. The results depicted in Table 10 contain two analytical explanations.
First, it becomes obvious that border regions are distributed in an unbalanced way across the hypothetically nine different types of mobility potentials. A condensation of cross-border regions is found in the upper right and lower left cells of the table, i.e. where a low index of mobility coincides with a high level of commuting and restricted mobility (high index) with a low number of actual commuters. On the contrary, types in the lower right and upper left areas are only sparsely covered. This finding again confirms the assumption of the index of mobility as a predictor for the intensity of commuting. Border regions with low index values (i.e. a good indication for labour mobility) tend to high commuting ratios, while a low level of commuting is achieved mostly by a medium to high index value.
Following this classification, predictions can be made about the future development respecting cross-border commuting. It is to be expected that cross-border regions with a favourable constellation of indicators (i.e. a low index of mobility) will denote (further) increases in the number of cross-border commuters. However, for regions with currently low commuting ratios, higher index values are seen as an indicator for further development prospects, as positive developments on the labour market or the reduction of obstacles on mobility. Such regions are supposed to show higher mobility potentials than regions where low or medium index values suggest that developments have already been outbidden.
In order to reappraise this assumption, a comparison was drawn with the indicator of “future development” assessed by labour market experts in the online survey (see Figure 34 likewise). Different mean values according to each border region are labelled by different colours47. On the whole, results match the previsions. Most of the regions with favourable mobility conditions are supposed to grow in commuting numbers, in particular for areas in the middle of an upward trend, such as SWE→DK, commuting streams to Switzerland (from Italy, France and Germany) and from Germany and Hungary to Austria (see Table 10).
47 In case of low numbers of mentions according to “future development”, trends of future cross-border commuting were judged
from the available data (numbers of commuters, percental change, open answers) of the respective border regions.
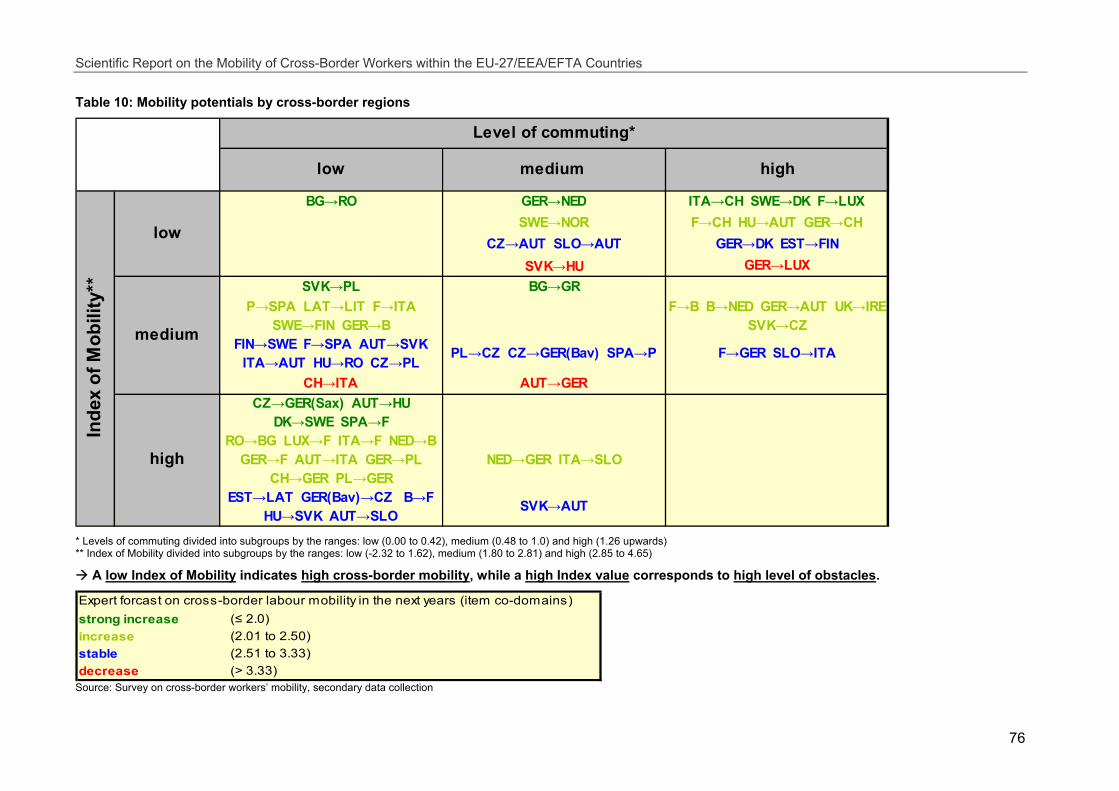
Scientific Report on the Mobility of Cross-Border Workers within the EU-27/EEA/EFTA Countries
76
Table 10: Mobility potentials by cross-border regions
low medium high
BG→RO GER→NED ITA→CH SWE→DK F→LUX SWE→NOR F→CH HU→AUT GER→CH
CZ→AUT SLO→AUT GER→DK EST→FINSVK→HU GER→LUX
SVK→PL BG→GR P→SPA LAT→LIT F→ITA
SWE→FIN GER→BF→B B→NED GER→AUT UK→IRE
SVK→CZFIN→SWE F→SPA AUT→SVK
ITA→AUT HU→RO CZ→PL PL→CZ CZ→GER(Bav) SPA→P F→GER SLO→ITA
CH→ITA AUT→GER CZ→GER(Sax) AUT→HU
DK→SWE SPA→F RO→BG LUX→F ITA→F NED→B
GER→F AUT→ITA GER→PL CH→GER PL→GER
NED→GER ITA→SLO
EST→LAT GER(Bav)→CZ B→F HU→SVK AUT→SLO
SVK→AUT
Level of commuting*
Inde
x of
Mob
ility
**
low
medium
high
* Levels of commuting divided into subgroups by the ranges: low (0.00 to 0.42), medium (0.48 to 1.0) and high (1.26 upwards) ** Index of Mobility divided into subgroups by the ranges: low (-2.32 to 1.62), medium (1.80 to 2.81) and high (2.85 to 4.65)
A low Index of Mobility indicates high cross-border mobility, while a high Index value corresponds to high level of obstacles.
Expert forcast on cross-border labour mobility in the next years (item co-domains)strong increase (≤ 2.0)increase (2.01 to 2.50)stable (2.51 to 3.33)decrease (> 3.33)
Source: Survey on cross-border workers’ mobility, secondary data collection
Scientific Report on the Mobility of Cross-Border Workers within the EU-27/EEA/EFTA Countries
77
For some well frequented border regions however, it seems that mobility potentials are exhausted and that the numbers will rather stagnate or decrease, e.g. GER→LUX or EST→FIN.
Further condensation of good development prospects is found for the lower left side of the table, where most potential is presumed. The regions encompass areas where future development is attributed to the prospected cutback of labour market restrictions, e.g. for CZ→GER(Saxony) or PL→GER, or good labour market indicators (DK→SWE, SPA→F, CH→GER), among them a remarkable number of EU-12 in-commuting markets48 (SVK→PL, AUT→HU, GER→PL or LAT→LIT).
Furthermore, it is peculiar that tendencies towards a decline of commuting are increasing with better indications on current labour market mobility (middle or even low index of mobility). As becomes evident from the data, this applies especially for the border regions AUT→GER, CH→ITA or SVK→HU, where the economic growth favours the potential country of origin and thus hinder pull factors of target regions to make an impact. Accordingly, assessed stagnation rather correlates with a medium index of mobility. Commuting developments may stagnate in the light of high or considerable growth in the past (e.g. SLO→ITA, F→GER, CZ→GER(Bavaria)) or at a relatively low level (e.g. HU→RO, FIN→SWE).
As becomes obvious, current trends and future developments have to be contrasted with the evolution that has led to the effectively scaled numbers. In order to predict development potentials, however, the index of mobility related with levels of commuting is able to provide a good approximation.
48 The special case of Bulgaria’s good assessment as regards future out-commuting in spite of rather unfavourable indicators
(low/middle values in mobility index and commuting) reflects a particularly bad economic situation, an enormous commuting potential and indicates effective commuting numbers higher than the accessible data.
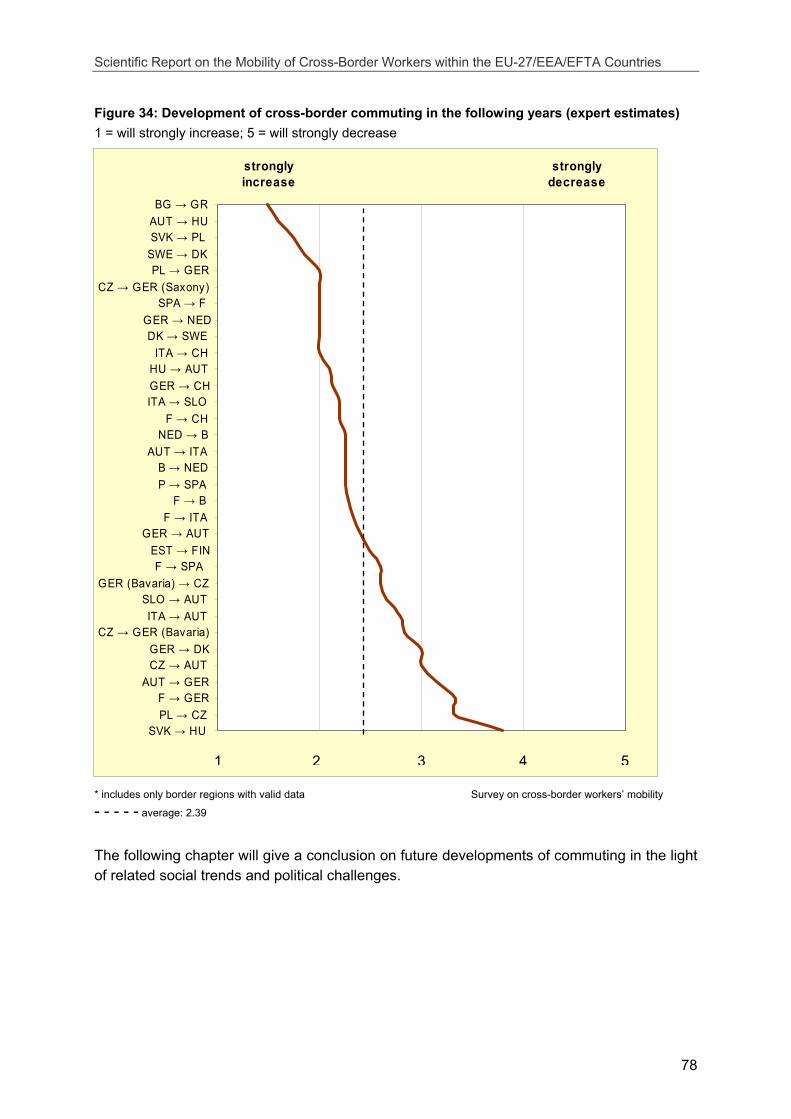
Scientific Report on the Mobility of Cross-Border Workers within the EU-27/EEA/EFTA Countries
78
BG → GRAUT → HUSVK → PL
SWE → DKPL → GER
CZ → GER (Saxony)SPA → F
GER → NEDDK → SWE
ITA → CHHU → AUTGER → CHITA → SLO
F → CHNED → B
AUT → ITAB → NEDP → SPA
F → BF → ITA
GER → AUTEST → FINF → SPA
GER (Bavaria) → CZSLO → AUTITA → AUT
CZ → GER (Bavaria)GER → DKCZ → AUT
AUT → GERF → GERPL → CZ
SVK → HU
strongly increase
strongly decrease
Figure 34: Development of cross-border commuting in the following years (expert estimates) 1 = will strongly increase; 5 = will strongly decrease
* includes only border regions with valid data Survey on cross-border workers’ mobility
- - - - - average: 2.39
The following chapter will give a conclusion on future developments of commuting in the light of related social trends and political challenges.
1 2 3 4 5
Scientific Report on the Mobility of Cross-Border Workers within the EU-27/EEA/EFTA Countries
79
7 FUTURE TRENDS AND CHALLENGES
Cross-border infrastructure and transport systems
Outstanding examples show, that cross-border infrastructure projects can have a direct influence on labour market mobility. After the opening of Øresund Bridge in 2000 which combines a two-track rail and four-lane road bridge, the number of commuters from Sweden to Denmark rapidly increased from 3,000 to over 13,000 people (and according to the latest information already to over 20,000). For many Swedes from the southern region of Scania with the city of Malmö it became extremely attractive to commute for a job in the neighbouring region of greater Copenhagen, additionally supported by higher wages in Denmark. Because of lower housing prices and the availability of building ground (lower population density) on the Swedish side it became also very rewarding for many Danish to settle in Southern Scania and to commute back to their kept place of work in the Copenhagen region as “in-commuting nationals”. In addition to new opportunities for the labour market the Øresund bridge opened lots of new ways for business and education related commuting.
Potentially, the building of the bridge across Fehmarn Belt can stimulate similar impulses for the Danish-German cross-border region, although this strait doesn’t connect two directly adjoining economic centres. The construction of the bridge is supposed to start in 2012 and shall be finished in 2016.
The Eurostar, a British high-speed train service which connects London and the region of Kent in United Kingdom with Paris and Lille in France and Brussels in Belgium within very short travel times, since 2007 offers new opportunities for both daily commuting and long-distance commuting. Measured on travel times it became a very competitive way in relation to business related flight travelling. However, it has to be mentioned that fees are still expensive, possibly because of a low level of competition on high-speed train services.
Relevant studies agree that long-distance commuting will become a European mega trend caused by social and demographic changes, intra-corporate and individual flexibility (CFS 2006). It can be assumed that more competition, alternatives and flexibility of international traffic services and efficient high speed transport systems will bear a high potential for the European economy, the labour market and finally the EU citizens.
As good as innovations are in trans-national transport infrastructure in Western Europe, funded partially by public private partnerships or even by private investors, as poor are such transport connections between EU-12 and EU-15 member states and above all within the new member states, with predominantly underdeveloped border regions which don’t provide an incentive to commute. Some of the few “bright spots”, however, arise between economically important agglomerations situated near to the border, for example in Vienna-Bratislava-Western Hungary, Eastern Bavaria-Western Bohemia, Berlin-Szczecin or Trieste-Ljubljana-Graz. Certainly, expanding the existing cross-border infrastructure and above all further connecting it to centres in Eastern Europe, e.g. in Balkan countries or the Baltic area, will be the prerequisite of opening up new cross-border synergies across Europe.
Scientific Report on the Mobility of Cross-Border Workers within the EU-27/EEA/EFTA Countries
80
Commuting and social acceleration
As became evident when studying cycles of commuting and geographic coverage of commuting streams (see chapters 4.2.2.2 and 5), current social trends that take place in the working environment are also affecting mobility behaviour. High speed travelling connections, accelerated rhythms of production, innovation and communication and a general contraction of cycles of working and relearning have an important share in the emerging of “remote” or project-oriented working and the transformation to flexible working hours. At the same time, however, large geographical barriers like sea lanes and mountain formations still fundamentally determine mobility patterns for large shares of the population, especially for those who cannot afford daily ferry passages or flights and who, simultaneously, are still working at fixed hour rhythms.
This synchrony of intensely accelerated and rather stable living conditions – essentially described by Rosa (2005), detected in working environments by Garhammer (1999, 2002), Voß (2001) or Michelson/Hearn (2006) – becomes ostensible precisely in commuting trends. In this way, “long-distance commuting” is a mode of working where space loses significance and time becomes decisive for actions. This “modern” way of flexible work-life relation, also characterised by the blurring of work and leisure time, high mobility and the dissolution of traditional social structures, is detected in the present study for highly developed areas and metropolises, such as London, Paris, Brussels or Barcelona. On the contrary, “long-term commuting”, mainly found in less developed areas of Slovakia, Romania or Bulgaria, corresponds to rather “traditional” modes of work-life relations, where geographical conditions remain determinant and working rhythms are maintained.
Hence, it is indispensable to broaden the definition of cross-border commuting, in order to comprise the entire spectrum. A periodical returning to the main place of residence is essential to satisfy the criterion of commuting, while the duration of working periods has to be extended from one week to several weeks or even months.
It will be interesting to see to what extent (infra)structural adjustments will confine such differences in the future. In any case, they will continue to manifest in commuting patterns.
Structure of cross-border workers - branches, sex and level of qualification
Branches most occupied by cross-border commuters are “construction industry”, “hotels & restaurants” and “manufacturing”. Compared to statistics of the year 2000, Switzerland (27% of all in-commuters) shows a strong increase of “in-commuters” in the tertiary sector, first and foremost in branches “hotels and restaurants” (+35%) and “health and social work” (+50%) in 2007. In Germany (11% of all in-commuters) most branches observe decreasing numbers of in-commuters, except business related services. A general trend indicates the tertiary sector being frequented stronger by in-commuters in most cross-border regions in the next years. This follows also the common intra-national trend.
Cross-border workers are predominantly men (e.g. construction and industries), except in the branches of health & social care and education where women show a clear predominance. In the hotel and catering service is an almost balanced level of sexes.
Having a look at the qualification level, skilled workers mainly commute within EU-15, low skilled mainly out of EU-12 states. Qualification level mainly corresponds to branches and employment status, high skilled commuters are employed on a permanent basis, low skilled workers mostly occupy temporary jobs in peripheral business areas.
Scientific Report on the Mobility of Cross-Border Workers within the EU-27/EEA/EFTA Countries
81
To depict a trend, in service-oriented fields relatively high skilled, younger and female commuters are overrepresented, while male, older and lower qualified workers tend to commute in manual oriented sectors.
Some cross-border regions feature tendencies in mismatching of qualifications and job positions (e.g. high-skilled Bulgarian workers in low-skilled jobs in Greece). This development forces the risk of displacement of low skilled domestic workers.
Obstacles on cross-border labour market mobility
As demonstrated in chapter 4.2.3, language barriers and lack of information – the latter partially related to the first – bear most problems for cross-border worker’s mobility. However, it became evident that both the group of EU-12 and of EU-15 seem to have developed larger internal integration of their social insurance and labour market systems and therefore produce less barriers to mobile workers than the relation between EU-12 and EU-15 countries. With regard to EU-15 it is caused by long lasting processes of harmonisation (by EU regulations and bilateral agreements), with regard to EU-12 due to the similarity of post-socialist structures that systems seem to intertwine better. Thus, the member states joined after 2004 are characterised by rather theory-focused systems of education, the public structures of post-socialist countries and a linguistic incoherence with dominance of the Slavic language area, while some EU-15 member states (above all the adjacent Germany and Austria) feature dual systems of vocational training, a continental social welfare system and share practices of communication based on Germanic languages. Frictions that necessarily appear at the interface of those systems are even increased by the political will to protect national labour markets.
Consequently, most obstacles on cross-border mobility won’t simply disappear over time. However, there are developments that will help to lower the extent of some obstacles. The EU is constantly working to ease acceptance of qualifications, to harmonise social rights, to improve cross-border infrastructure by EU funds (e.g. INTERREG, trans-European networks), a cross-border labour market cooperation including social dialogue (e.g. EURES network and social partners). Labour market restrictions will disappear in 2011 at the latest for EU-8 member states.
There is a chance that these developments will slowly diminish existing obstacles on mobility, thus creating new potential for cross-border labour markets. However, the EU’s frame of actions is limited (sovereign rights in taxation and education). For the future, further integration and the breakdown of obstacles on mobility will be largely dependent on the member states’ will and the implementation of common principles in their own national administrative practice.
Drivers on cross-border mobility
Both the quantitative and the qualitative data used in this study clearly show that the likelihood for a high number of cross-border commuters from region A to region B depends much more on indicators signalling a positive labour and income situation in region B than on indicators showing a negative labour and income situation in region A. These findings are in line with the "push / pull theory" according to which particularly countries with the relatively best labour market conditions attract the most cross-border commuters ("pull"-effect).
Thus, from the findings of the "push / pull factors" some general conclusions can be made:
Scientific Report on the Mobility of Cross-Border Workers within the EU-27/EEA/EFTA Countries
82
A bad economic situation in one country is not enough to stimulate cross-border commuting towards another country. There are obstacles that hinder cross-border mobility (examples for relatively low outgoing cross-border commuters are Lithuania, Latvia and Poland). Only if the economic situation is much better across the border job-seekers are willing to overcome the obstacles to mobility and to start cross-border commuting. Countries with high income and low unemployment attract the relatively highest numbers of cross-border commuters. Examples are Monaco, Liechtenstein, Luxembourg, Andorra and Switzerland, but to a somewhat less pronounced way also Austria, Finland, Ireland, Belgium, the Netherlands, Norway, Denmark and the Czech Republic.
As another notable driver the housing market is a strong factor on cross-border commuting in border regions with a dominance of daily commuting, above all in the area of Sweden→Denmark and the German border regions.
Potential earnings influence cross-border commuting as well. In this regard the range of income differences between neighbouring countries obviously correlates with the appropriate level of commuting but nevertheless represents just one aspect of a set of drivers to cross-border mobility.
In consideration of drivers on cross-border mobility the Schengen enlargement in 2004 was less able to boost cross-border commuting significantly in the appropriate border regions but rather facilitated the existing commuter streams as well as first and foremost the cross-border movement of goods.
A further essential trend is the development of a common European Education Area, implementing mobility as a basic concept within first mobility experiences through studies or internships abroad (programmes like ERASMUS, SOKRATES, LEONARDO).
Commuting trends in the new member states EU-12 countries
In comparison to countries of EU-15/EEA/EFTA, constituting target regions for nearly 95% of the cross-border commuters under study, trans-border mobility is very low between the so-called “new member states”. Exceptions are made by commuting streams from Slovakia to Hungary (10,500), Poland to Czech Republic (7,700) and from Slovakia to Czech Republic (almost 12,000). This can be ascribed, on the one hand, to the structural weakness of border regions of formerly centralised, post-socialist countries, on the other hand to significantly lower wage differences between those countries. In countries like Poland or the Baltic states migration or “long-term/distance commuting“ to countries like UK or Ireland seems to have a much higher impact on mobility than cross-border commuting to the adjacent neighbouring country.
This trend might even intensify with the implementation of the free movement of labour, in 2011 at the latest. Revealing in this context is the Slovak-Hungarian border region, where – according to local labour market experts – the ratio of Slovakian commuters is expected to decrease, also due to the remarkable economic growth in Slovakia.
Mobility in border regions between “old“ and “new“ member states is notably higher, for instance from Estonia to Finland (20,000), Hungary to Austria (16,000) or Slovenia to Italy (10,000). It is fostered on the one hand, mainly by income differences, but hampered by labour market restrictions. Exceptions are the German border regions to Poland and Czech Republic, where commuting streams are very low because of a weak economic structure in the target region and an unemployment rate above the national average. According to the

Scientific Report on the Mobility of Cross-Border Workers within the EU-27/EEA/EFTA Countries
83
empirical findings in the present study, however, the region counts with an articulate mobility potential, also from Germany to Poland or Czech Republic respectively.
Labour displacement in cross-border commuting
In most border regions cross-border commuters are predominantly noticed as complementary working resources to the local labour force. The chief cause is that cross-border commuters mainly occupy peripheral activities and economic niches, which are of little interest for domestic workers. On the contrary “in-commuters” to Switzerland often occupy well remunerated, attractive job positions (above all high skilled German workers e.g. managers or physicians) in core branches with a considerable added value. Although these developments result in a significant level of resentments and felt labour displacement in the Swiss middle class, actual labour displacement remains rather small. Instead a process of „new immigration“ into elite positions is to be observed attributing substantial positive effects on productivity and economical growth to foreign migrants and commuters (Müller-Jentsch et. al. 2008).
Free movement of labour in 2011 and Illegal employment
Labour permits pose as a major obstacle on cross-border mobility between EU-15 and EU-12 states (Austria and Germany). In the case of Austria, labour market restrictions also push the emergence of illegal employment. A significant level of illegal employment is evident for cross-border workers coming from Slovenia to Italy and Bulgaria to Greece. However, in other regions like the Bavarian-Czech cross-border evidence of significant flows of illegal workers couldn’t be found.
Labour market experts do not expect overwhelming commuting streams in cross-border regions referring to the abolition of transition periods. An immediate abolition of transition periods would reduce the number of “clandestine workers”.
Globalisation and the missing coherence of regional and labour market policy
Postulating a cross-border labour market policy as an answer to the demands of globalisation (inter-regional division of labour, strengthening of the entire region with regard to international competition) might be a too ambitious goal. Trans-national labour market policy is much too reactive, cross-border cooperation is still at a much too informal level.
Even if there was a policy of labour exemplary for this spirit, it would stand alone, not being flanked by a coherent supra-regional economic policy with regard to cross-border structures and locations. This would be necessary, however, to approach this objective. In employment services, for instance, national requirements still are still assigned highest priority. With regard to trade unions, cross-border cooperation is only rudimentarily existent and trans-border collaboration of employer associations is happening, if anything, only on an informal level. The same thing applies for a coherent, trans-border city and regional planning. If an inter-regional division of labour has developed anywhere at all on a cross-border level, it is only where economic high-order centres in border areas have exerted pull effects on peripheral areas. Such processes are also rarely formed where we detect high wage differentials; in the majority of cases border areas are rather weakly developed and therefore simply “overleaped” in an inter-regional commutation.
Scientific Report on the Mobility of Cross-Border Workers within the EU-27/EEA/EFTA Countries
84
LIST OF LITERATURE
Ahn / Blázquez (2007): Residential Mobility and Labor Market Transitions in Spain, France and Denmark: Relative Effects of Housing Tenure and Other Variables. Fundación de Estudios de Economia Aplicada. Madrid.
Austrian Institute for SME Research (2004): EU-Erweiterung – Monitoring der Marktentwicklung in der Steiermark, Slowenien und Westungarn. Endbericht. Wien.
BAK Basel Economics (2005): EURES-Transfrontalier Oberrhein/Rhin Supérieur. Regionalprofil Oberrhein. Wirtschaft, Beschäftigung, Bevölkerung und Infrastruktur in der Grenzregion. Basel.
Bfai (German office for foreign trade, Service Unit of the ministry of Economics and Technology) (2008): Branche kompakt – Bauwirtschaft – Griechenland.
BMG Research (2007): The economic impact of migrant workers in the West Midlands. Full report. Coventry.
Buch / Niebuhr et al. (2008): Grenzpendeln in der deutsch-dänischen Grenzregion. Entwicklung und Struktur 1998 – 2005, IAB regional
Centre for Future Studies (2006): Social Demographics in 2016. Kent.
Constantin (2004): Migration or Commuting? The Case of Romanian Workers in Italy: Niches for Labour Commuting to the EU, www.eumap.org.
European Commisson, DG for Employment, Social Affairs and Equal Opportunities (2007): Community Action Programme in the Sphere of Employment and Social Solidarity – Progress, p. 4.
EIR Warwick University Institute for Employment Research (2007):The economic impact of migrant workers in the West Midlands. Warwick.
EIR Warwick University Institute for Employment Research (2008): Migrant Workers in the South East Regional Economy. Warwick.
Eliasson / Lindgren et al. (2003): Geographical labour mobility: Migration or commuting?. Reg. Studies 37. p. 827 et sqq.
European Central Bank, MPC task force (2004) : Sectoral specialisation in the EU. A macroeconomic perspective. Frankfurt am Main.
European Central Bank (2006): Cross-border labour mobility within an enlarged EU. Occasional Paper Series No. 52. Frankfurt am Main.
EURES Channel Hainaut, Pas-de-Calais, West-Vlaanderen, Kent (2006): Etude sur les flux frontaliers franco-belges. Studie over de Frans-Belgische grensstromen.
European Commission (2006a): Labour migration patterns in Europe: recent trends, future challenges. Brussels.
European Commission (2006b): Employment in Europe, chapter 5: Geographic Mobility within the EU. Brussels.
European Commission (2007): The impact of free movement of workers in the context of EU enlargement. Brussels.
Scientific Report on the Mobility of Cross-Border Workers within the EU-27/EEA/EFTA Countries
85
European Commission (2008): The impact of free movement of workers in the context of EU enlargement - Report on the first phase (1 January 2007 – 31 December 2008) of the Transitional Arrangements set out in the 2005 Accession Treaty and as requested according to the Transitional Arrangement set out in the 2003 Accession Treaty.
Empirica Wirtschafts- und Gesellschaftsforschungsinstitut GmbH (2008): Machbarkeitsstudie für die Schaffung einer EURES Grenzpartnerschaft zur Abdeckung der Grenzregion Österreich-Ungarn. Sopron and Munich.
Fitzgerald / Bergin et al. (2008): Medium – Term review 2008 – 2015. Economic and Social Research Institute (ESRI). p. 9 et sqq.
Frase (2007): International Commuters - Are your overseas assignments creating risky ‘stealth-pats’? In: Human Ressource Magazin, March 2007 Vol. 52, No. 3.
Garhammer (1999) : Wie Europäer ihre Zeit nutzen. Zeitstrukturen und Zeitkulturen im Zeichen der Globalisierung. Berlin.
Garhammer (2002): Changing job careers and work environments in the EU and their effects on time-pressure and the work-family interface. Lecture script. Toronto.
GdW (2008): Wohnungswirtschaftliche Daten und Trends 2008/2009. Zahlen und Analysen aus der Jahresstatistik des GdW. Berlin.
Glorius (2007): Transnationale Perspektiven – eine Studie zur Migration zwischen Polen und Deutschland. Halle.
IAB Nord / Buch et al. (2008): Grenzpendeln in der deutsch-dänischen Grenzregion. Entwicklung und Struktur 1998-2005, IAB regional, Vol. 04/2008.
ifo Institut für Wirtschaftsforschung Munich (2001): Auswirkungen der EU-Osterweiterung auf Wirtschaft und Arbeitsmarkt in Bayern. Munich.
ifo Institut Dresden (2001): EU-Osterweiterung und deutsche Grenzregionen. Dresden.
ISF Institut für Sozialwissenschaftliche Forschung (2004): Risiken und Chancen der EU-Osterweiterung für die ArbeitnehmerInnen am Beispiel der ostbayerisch/tschechischen Grenzregion. Munich.
Jandl / Hollomey et al. (will be published in 2009): Migration and Irregular Work in Austria. A Case Study of the Structure and Dynamics of Irregular Foreign Employment in Europe at the Beginning of the 21st Century. Amsterdam University Press.
Lee (1972): Eine Theorie der Wanderung. In: Széll (Ed.): "Regionale Mobilität". Munich.
Linstone / Harold et al. (1975):The Delphi Method: Techniques and Applications. Michigan.
Massey / Arango et al. (1998): Worlds in Motion. Understanding International Migration at the End of the Millennium. New York: Oxford University Press.
Michelson / Hearn (2006): Rethinking Work: Time, Space and Discourse. Cambridge.
MKW GmbH (2001): Scientific Report on Mobility of Cross-border Workers within the EEA. Munich.
Moritz (2008): Spatial Effects of Open Borders on the Czech Labour Market. IAB-Discussion Paper.
Muellbauer / Cameron (1998): The Housing Market and Regional Commuting and Migration Choices. Scottish Journal of Political Economy and CEPR Discussion Paper 1945.
Scientific Report on the Mobility of Cross-Border Workers within the EU-27/EEA/EFTA Countries
86
Müller-Jentsch (Hrsg.) et. al. (2008): Die Neue Zuwanderung: Die Schweiz zwischen Brain Gain und Überfremdungsangst. Avenir Suisse. Verlag neue Zürcher Zeitung.
Münz (2004): East-West Migration After European Union Enlargement. Austrian Press and Information Service. Washington, D.C.
Münz / Fassmann (2004): Migrants in Europe and their Economic Position: Evidence from the European Labour Force Survey and from Other Sources. Hamburg.
OECD (2004): Trends in International Migration. Paris.
PLG Paul Lazarsfeld Gesellschaft für Sozialforschung (2007): Labour Market Monitoring II. INTERREG III/A Austria-Czech Republic, Austria-Slovakia, Austria-Hungary. Wien.
PricewaterhouseCoopers (2001): Study of Obstacles to Mobility. Armagh.
ÖIR-Informationsdienste GmbH (2007): Länderinformation: Grenzregion Österreich-Ungarn.
Rosa (2005): Beschleunigung. Die Veränderung der Zeitstrukturen in der Moderne. Frankfurt a.M.
Schneider / IAW (2008): Prognose zur Entwicklung der Schattenwirtschaft.
Special Eurobarometer 284 (2007): Undeclared Work in the European Union. Brussels.
Tashakkori / Teddlie (1998): Mixed methodology: combining qualitative and quantitative approaches. SAGE, Thousand Oaks.
Voß (2001): Neue Verhältnisse? – Zur wachsenden Bedeutung der Lebensführung von Arbeitskräften für die Betriebe. In: Lutz (Ed.): Entwicklungsperspektiven von Arbeit. Special area of research, University of Munich. Berlin.
Walter / Just (2006): Der deutsche Wohnungsmarkt - Anbieter und Nachfrager heute und morgen. Deutsche Bank Research.
Woidich / Klopsch et al. (2005): Machbarkeitsstudie für die Schaffung einer EURES Grenzpartnerschaft zur Abdeckung der Grenzregion Bayern-Tschechien. München.
Woidich (2007): Tu felix Austria? Migration von Deutschland nach Österreich im Trend. München.
ZAV Bundesagentur für Arbeit, Zentrale Auslands- und Fachvermittlung (2007): Mobil in Europa Ausbildung – Studium – Beruf, Griechenland. Bonn.