SCIENTIFIC APPROACH is the value of... · Web viewMeta value (or brand equity) could be described...
102
WHAT IS THE VALUE OF A BRAND? - a case study of four Swedish multinational corporations ”An orange… is an orange… is an orange. Unless of course that orange happens to be a Sunkist, a name 80% of consumers know and trust”. Russel L. Hanlyn, CEO, Sunkist 1
Transcript of SCIENTIFIC APPROACH is the value of... · Web viewMeta value (or brand equity) could be described...

WHAT IS THE VALUE OF A BRAND? - a case study of four Swedish multinational corporations
”An orange… is an orange… is an orange. Unless of course that orange happens to be a Sunkist, a name 80% of consumers know and trust”.
Russel L. Hanlyn, CEO, Sunkist
1

WHAT IS THE VALUE OF A BRAND? - a case study of four Swedish multinational corporations
Executive Summary
Branding is centuries old, but the subject has received considerable attention primarily in recent years. Today, the multitude of different products and services available on the market poses a problem for the firm. Without a differentiated offering, a firm’s offer is likely to drown in the crowded marketplace of today. Hence, the key to success spells differentiation! Because most firms can successfully build satisfactory products, the new competition is not between what companies produce in their factories but between what companies add to the physical product. A brand is a useful tool to create differentiation. One interesting, but indeed challenging area of brands, is the measurement of the hidden intangible added value of a brand. This thesis takes on the challenge and provides an up-to-date treatment of the subject brand equity measurements. The thesis is based on a case study of brand equity measurements carried out at four Swedish multinational companies, Astra, Electrolux, Ericsson and Volvo during the autumn of 1998. The thesis also includes a comprehensive presentation of literature covering the subject brands in general and brand equity in particular.
The literature study includes fourteen different methods for measuring brand equity. Each method is different from the others and they all have different starting points. Some measures are primarily developed for the financial market and tries to put a monetary valuation on the brand while others are based on the firm’s needs and also include qualitative variables. The results of our findings shows that most brand equity measurement methods presented in the academic literature are theoretically attractive but not necessarily practically useful. To present a theoretical method is one thing, to implement it and make it operational in a company is another!
The case study reveals that the similarity of brand equity measurement methods used by the four different companies is striking. All four companies use survey research as the prime method for collecting data. Respondents on the local market are approached and encouraged to express their view on a number of brand equity variables considered important by the companies. Of course, different companies have identified different brand equity variables considered as a prerequisite for competitive advantage and success. All four companies also measure the brand equity over time and include competitors’ brands for easy comparison. None of the companies included in the study have tried to put a monetary valuation on the brand.
We believe that different brand equity measurement methods can be used by a company as long as the method is easy to understand, can be repeated and identifies the brand’s current value in the market.
0
2

WHAT IS THE VALUE OF A BRAND? - a case study of four Swedish multinational corporations
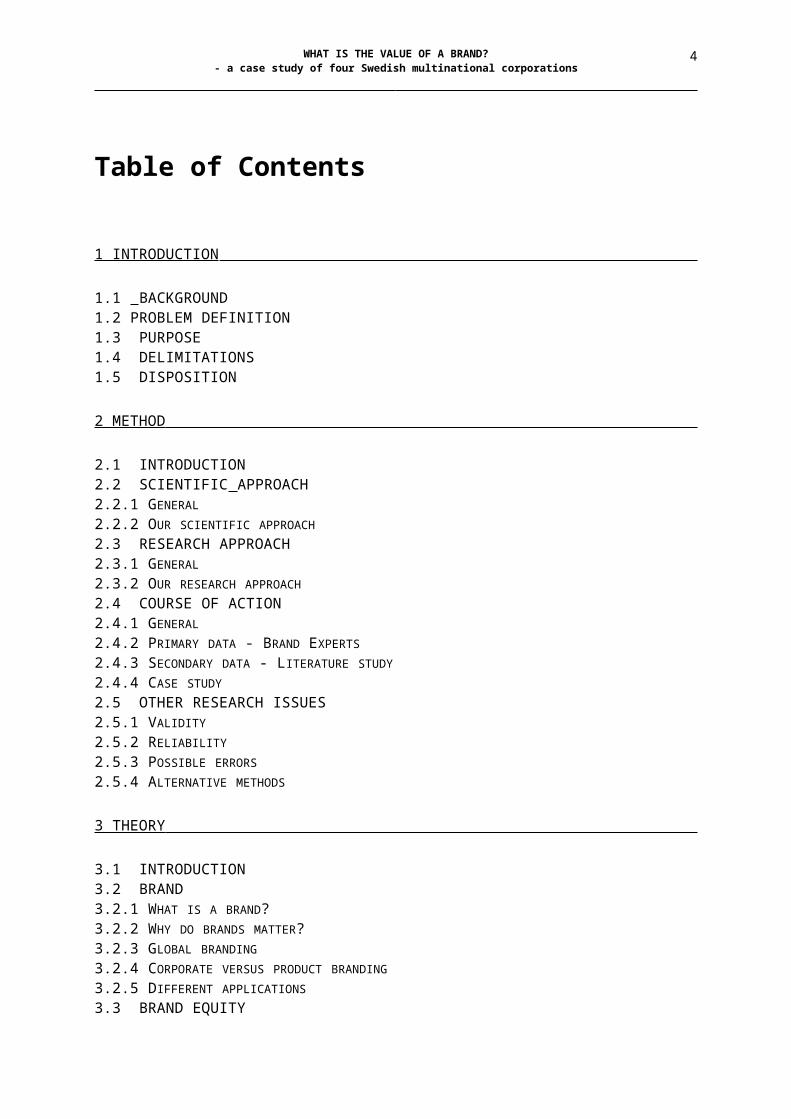
Table of Contents
1 INTRODUCTION
1.1 BACKGROUND1.2 PROBLEM DEFINITION1.3 PURPOSE1.4 DELIMITATIONS1.5 DISPOSITION
2 METHOD
2.1 INTRODUCTION2.2 SCIENTIFIC APPROACH2.2.1 GENERAL2.2.2 OUR SCIENTIFIC APPROACH2.3 RESEARCH APPROACH2.3.1 GENERAL2.3.2 OUR RESEARCH APPROACH2.4 COURSE OF ACTION2.4.1 GENERAL2.4.2 PRIMARY DATA - BRAND EXPERTS2.4.3 SECONDARY DATA - LITERATURE STUDY2.4.4 CASE STUDY2.5 OTHER RESEARCH ISSUES2.5.1 VALIDITY2.5.2 RELIABILITY2.5.3 POSSIBLE ERRORS2.5.4 ALTERNATIVE METHODS
3 THEORY
3.1 INTRODUCTION3.2 BRAND3.2.1 WHAT IS A BRAND?3.2.2 WHY DO BRANDS MATTER?3.2.3 GLOBAL BRANDING3.2.4 CORPORATE VERSUS PRODUCT BRANDING3.2.5 DIFFERENT APPLICATIONS3.3 BRAND EQUITY3.3.1 BRAND EQUITY3.3.2 WHAT IS THE DIFFERENCE BETWEEN BRAND EQUITY AND BRAND VALUE?3.3.3 BENEFITS FROM BRAND EQUITY3.4 MEASURING BRAND EQUITY3.4.1 INTRODUCTION3.4.2 REASONS FOR MEASURING BRAND EQUITY3.4.3 SEPARATE BRAND EQUITY MEASURES
3
WHAT IS THE VALUE OF A BRAND? - a case study of four Swedish multinational corporations
3.4.4 COMBINED BRAND EQUITY MEASURES3.4.5 SUMMARY BRAND MEASUREMENT THEORY
4 EMPIRICAL DATA
4.1 INTRODUCTION4.2 ASTRA4.2.1 GENERAL4.2.2 BRAND MANAGEMENT AT ASTRA4.2.3 ASTRA DRACO4.2.4 BRAND MEASUREMENT AT ASTRA DRACO4.2.5 ASTRA DRACO LÄKEMEDEL AB4.2.6 BRAND MEASUREMENT AT ASTRA DRACO LÄKEMEDEL AB4.2.7 SUMMARY4.3 ELECTROLUX4.3.1 GENERAL4.3.2 BRAND MANAGEMENT AT ELECTROLUX4.3.3 BRAND MEASUREMENT AT ELECTROLUX4.3.4 SUMMARY4.4 ERICSSON4.4.1 GENERAL4.4.2 ERICSSON B2B4.4.3 BRAND MANAGEMENT AT ERICSSON4.4.4 BRAND MEASUREMENT AT ERICSSON4.4.5 SUMMARY4.5 VOLVO4.5.1 GENERAL4.5.2 BRAND MANAGEMENT AT VOLVO4.5.3 BRAND MEASUREMENT AT VOLVO4.5.4 SUMMARY
5 ANALYSIS
5.1 INTRODUCTION5.2 THEORY ANALYSIS5.3 EMPIRICAL ANALYSIS5.3.1 GENERAL5.3.2 BRAND MEASUREMENT5.3.3 BUSINESS BLINDSPOTS
6 CONCLUSIONS AND RECOMMENDATIONS
6.1 INTRODUCTION6.2 CONCLUSIONS6.3 RECOMMENDATIONS
7 SUGGESTIONS FOR FURTHER STUDIES
4

Chapter OneIntroduction
1 INTRODUCTION
1.1 BACKGROUND
What is the value of a brand? Wouldn’t you like to know how much Coca-Cola, Sony or American Express is worth? Not the bricks and mortar of the companies but the brand. We are. Therefore the subject of this thesis is measurement of brand equity.
Our interest in brands is not unique. Branding is a hot topic of today. Companies recognize that one of the most valuable assets of a company is the brand. To facilitate branding decisions, investments in brands and development of brands over time, companies increasingly implement a brand management function in the organization. In this thesis, we approach brand management in four Swedish companies to try to find out how they manage their brands and how they measure brand equity.
Here already it should be noted that value is a broad term. Although our colleagues in finance (or so called yuppies) immediately relates value to something expressed in dollars or pounds we will try to be a little bit more sophisticated and also include more qualitative measures in the term value. Our broad view of value is supported by many marketers. For example, Kotler (1997, p.10) defines value as; “the customer estimate of the product’s overall capacity to satisfy his or hers need”. No implicit connection between value and a monetary measure can be found.
1.2 PROBLEM DEFINITION
One of many interesting issues within the area of brands is how to place a value of a brand. Almost everyone recognize that a brand has a value. Our interest is to find out how this brand value or brand equity can be reached. The problem definition of this thesis reads:
How should a company measure the value of its brand? What brand equity variables should be considered and how should the variables be measured?
It should be noted that we use the terms brand value and brand equity interchangeably in this introduction chapter. Hereinafter, we will take a simplified approach and only use the term brand equity. (A discussion covering the difference between brand equity and brand value can be found in item 3.3.2).

1.3 PURPOSE
The purpose of this thesis is to find out how a brand’s equity can be measured, in theory and in practice. To reach our purpose, we will study both available branding literature as well as existing brand measurement methods in four Swedish multinational companies.
1.4 DELIMITATIONS
Branding is a hot topic today, covering many interesting sub areas like brand building, brand extension, brand measurement and brand management. Not all areas will be covered in this thesis but we will target brand measurement.
1.5 DISPOSITION
This thesis is divided into seven chapters.
Chapter 1 introduces the background, problem definition, purpose and delimitation of the thesis.
Chapter 2 provides the method of the thesis. Issues such as scientific approach and research approach are covered and our position with regards to these areas are outlined.
Chapter 3 sets the stage for the thesis by providing a review of the brand literature with focus on brand and brand equity. The goal of the chapter is to provide a sense for brands in general and different brand equity measurement tools in particular. A vast amount of literature by different branding experts is reviewed to guarantee variety and avoid subjective interpretations.
Chapter 4 examines the empirical data collected in Astra, Electrolux, Ericsson and Volvo. The chapter addresses the way the different companies manage and measure its brand.
Chapter 5 presents our analysis. Theoretical data as well as empirical data is analyzed and some possible business blindspots in the companies examined are spotted.
Chapter 6 outlines our conclusions and recommendations.
Chapter 7 presents our suggestions for further studies.

Chapter TwoMethod
2 METHOD
2.1 INTRODUCTION
In this chapter a description of the method we have used for this thesis is developed. This includes a discussion covering scientific approach, research approach, course of action and other research issues such as validity and reliability.
2.2 SCIENTIFIC APPROACH
2.2.1 General
Two different fundamental scientific approaches within social science exists: positivism and hermeneutics. Positivism is very much influenced by the natural science and one of its starting-points is the reliance on observations and empirical data. The concept positive is related to something precise, secure and real. Fundamental assumptions in positive science are (Lundahl and Skärvad 1992, p. 40f):
· Only observable issues should be of scientific concern. Any result of a scientific study should be possible to verify with empirical data.
· One approach only. All scientific research could and should be carried out using one method only, ”the uniform scientific method”.
· Science should explain, i.e. seek causal connections.· General causal connections is an important goal.· Facts and values should be separated.
Hermeneutics is the alternative scientific approach and is characterized as more heterogeneous than the positive science. The goal of hermeneutics is not to explain but to understand. And to be able to understand a phenomenon, it is necessary with some form of interpretation. However, it is clear that different people perceive, and thus experience, the same phenomenon very differently. Human beings are not passive recorders of experiences that happen to them; rather, people actively shape and construct their experiences. We are selective in what we attend to and what we, in turn, perceive. The observer and his or hers perspective becomes crucial factors affecting the perception. Many factors influence our senses: feelings, needs, prior experience and expectations. Thus, it is not possible to conduct research on a truly objective basis.

2.2.2 Our scientific approach
The method used for this thesis is based on a hermeneutics scientific approach. We want to understand a specific phenomenon; measurement of brand equity. Our ambition is not to try to find any causal connections, in line with positivism, explaining brand equity. We leave that issue to the professors of Harvard and MIT.
We find a hermeneutic approach appropriate because, according to us, total objectivity is not possible (whether it be in research or in ”real” life). However, we believe that an objective estimate is achievable if the perspective, the assumptions and the starting-point of the research is explicitly accounted for. Nevertheless, the difficulties in writing a fairly objective thesis should not be underestimated. To openly account for the values and conditions directing any research work is difficult, because of the need to recognise the values underlying the research and the need to understand how these values affect the research work. To be conscious of both your own and other’s values, open as well as hidden, is often difficult if not impossible. Nevertheless, it is our ambition to present the perspective and assumptions underlying our research approach in this method chapter.
2.3 RESEARCH APPROACH
2.3.1 General
Research can be divided into several different types based on initial position. Lundahl and Skärvad (1992, p.77) classifies research based on its origin in: sources and methods for data collection, mode of procedure, purpose, scope, time and type of data. Further, the purpose of research is subdivided in: exploratory, descriptive, explanatory, diagnostic and evaluative. Also Lekvall and Wahlbin (1993, p.128) classifies the purpose of the research in different categories, but only use four variables:
Exploratory research provides a basic understanding and knowledge of a problem. Exploratory research is often used to define scope for future investigations or as a way to generate ideas for a future mode of action. The research type is appropriate when prior knowledge in an area is minimal and the scope, required information and possible mode of action is uncertain. Hypotheses are typically vague or do not exist at all and the methods used are flexible, unstructured and qualitative.
Descriptive research seeks data within well specified areas or problems. The purpose is to describe a phenomenon and not to explain it. The research type provides a snapshot of some aspect of the environment, hypotheses exist but may be tentative and speculative.
Explanatory research tries to answer the question why? Hypotheses testing is often used and the researcher seeks casual connections. An explanatory research is often concentrated to a few variables and hypotheses are specific due to the demanding requirements of proof.
Forecast research tries to forecast future progress of a phenomenon. Knowledge of existing casual connections is often a prerequisite.
Furthermore, research can be of a qualitative or of a quantitative kind (Lundahl and Skärvad, 1992, p.82). Qualitative research are research where facts can not be meaningfully quantified, in other words, these can not be expressed in figures. The opposite is true for quantitative investigations. Holme and Solvang (1997, p.76ff) argues that there is never a single, correct method for carrying out research. However, present circumstances and type of problem provide some guidance into which method, quantitative, qualitative or both, is most appropriate.

Finally, data or information can be divided into primary data and secondary data (Lundahl and Skärvad, 1992, p.78). Primary data is collected by the researcher (often interviews) while secondary data is collected by an other person (often articles, books and statistics). The main difference between the two is that secondary data are information not gathered for the immediate study at hand but for some other purpose. Primary data, on the other hand, are originated by the researcher explicitly for the purpose of the study.
2.3.2 Our research approach
Our research is descriptive, qualitative and based on both primary and secondary data.
There exists a vast amount of literature related to the subject brand, typically from the US. However, much of the literature focusing on brand equity lack consensus on how brands should be valued and measured. Further, we have not found any previous academic studies covering brand measurements in Swedish companies. Thus, there are no given answers to which relevant variables that need to be considered in our study although we will not stumble in complete darkness.
Our research is based on a case study of four multinational Swedish companies and the purpose is to describe existing brand measurements, a subject with little prior knowledge and vague hypotheses. Consequently, our research could be characterized as descriptive. The study also rests heavily on qualitative data, collected from both primary and secondary sources. Our research approach is illustrated in figure 2-1 below:
Characteristics ofdata and analysis
In depth studyCase study
Broad studySurvey study
Developmentover time
Qualitativedata
Quantitativedata
This report
Research approach
Figure 2-1. This report in context of different types of research.Reference: Lekvall and Wahlbin (1993, p.140) (modified).
2.4 COURSE OF ACTION
2.4.1 General
Our course of action is summarized in figure 2-2 below. The study entailed the following course of action:
· Contact was established with a brand manager at Ericsson and existing problems in the area of brands were pin-pointed. We decided to focus on one specific problem area: brand measurements. Brand managers at Astra, Volvo and Electrolux were contacted and a decision was made to run a joint study including all four companies.
· A fair amount of literature were studied to get a good understanding of the subject brand as well as the companies included in the case study. Primary data were collected from brand experts to get a nuanced picture of branding and a suitable research approach were discussed.
· The foundation of a theory chapter was outlined based on both primary and secondary data.

· A case study was conducted covering brand measurements in Astra, Electrolux, Ericsson and Volvo.
· Primary and secondary data were carefully analyzed and a chapter covering the results of our study was outlined.
· Analysis, conclusions and recommendations were made based on the results of our study.
CONTACT WITH KEY PERSONS
COLLECTION OF PRIMARY AND SECONDARY DATA
THEORY
CASE STUDY
RESULTS
RECOMEND-ATIONS
Figure 2-2. Our course of action.
2.4.2 Primary data - Brand Experts
Primary data were collected from brand experts at the University of Lund as well as Handelshögskolan Stockholm. The brand experts were primarily asked to express their view on existing methods of brand measurements. Also, a suitable research approach was discussed.
Of course, primary data were also collected from the four multinational companies included in our case study. However, this primary data are covered in item 2.4.4.1, interview, and item 2.4.4, case study.
2.4.3 Secondary data - Literature study
We have studied literature in several different areas. Focus has been on books and articles covering the different dimensions of a brand and brand equity but we have also read different books covering methods and research approaches. Appropriate literature was found after database searches at both the University of Stockholm and Handelshögskolan. Typical search strings have been brand, brand equity, brand measurement, brand value, brand management and others. Further, we have read annual reports and other specific literature related to the companies included in our case study.
· The literature study of branding gave us an in-depth knowledge of our problem area and a solid ground to base our theory chapter on (chapter 3).
· The methodology literature gave us a guideline for the research regarding topics such as scientific approach, research approach and the enlightenment of possible errors etc. It has also given us ideas on different techniques to collect data. This chapter rests heavily upon this type of literature.
· The company specific literature and the internal documents of Astra, Electrolux, Ericsson and Volvo gave us a better understanding of the companies and their business. This information is used in the chapter covering empirical data of this report (chapter 4).

An important factor influencing the quality of the theory chapter is the diversity of sources being used. As already mentioned, the information in this report is collected from a large number of sources, often referring to the same issue: newspapers, company specific reports, journals, reports, annual reports and books. We believe that the diversity of sources used guarantees a less rigid picture.
2.4.4 Case study
A case study is often focused on detailed and in-depth descriptions and analyses of a single phenomenon or case. The case is often analyzed in several dimensions. According to Lekvall and Wahlbin (1993, p.143f), the use of case studies is appropriate for both exploratory research and descriptive research. Consequently, a case study would be a suitable approach for our research. Lundahl and Skärvad (1992, p.152) recommends the use of the four step procedure listed below when conducting a case study. All of these four steps are included in our thesis.
1. Collection of data making a description of the studied phenomenon possible. Data collection is based on the nature of the problem as well as theoretical and practical understanding. Collection of both primary data and secondary data is made in our research. The material is presented in chapter 3 (theory) and chapter 4 (empirical data) of our thesis.
2. A description of the studied phenomenon. The different dimensions of brands and brand measurements are presented in chapter 3 (theory) of our thesis.
3. Analyze of the studied phenomenon, having the studied actors subjective logic as a starting-point. This step is covered in chapter 5 (analysis) where we present the result of our research.
4. Search for a common pattern in the studied phenomenon. This last step is dealt with in chapter 6 where we present our conclusions and recommendations.
This thesis is about measurement of brand equity. We have chosen to study only one part of the broad subject brand, and to do it in detail. However, the same subject is studied in four different organizations to get a diverse picture. Diversity is guaranteed due to the variation in product offerings and target customers among the four companies included in our case study. The product offerings range from highly sophisticated equipment to simple products and the target customers range from business customers to ”traditional” consumers. The diversity among the four companies included in the case study is illustrated in figure 2-3 below.
PRO
DU
CT
OFF
ER
ING Complex
MediumComplex
Non-complex
TARGET CUSTOMER
Business/IndustryIntermediaryConsumer
Volvo AstraDraco
Ericsson
Electrolux
Astra Draco Läkemedel AB
Figure 2-3. Companies included in our case study.
It should be noted that our selection of companies guarantees some form of diversity but we do not talk about a random sample. The companies included in our case study are all arbitrary chosen. Does this have any implications? Yes, it affects the issue of generalization. If statistics were our main

interest, sampling would have been of prime importance because statistics is the science of generalization from a randomly chosen sample to the population (Aczel, 1996, p.176). According to the statistic freaks, you can not generalize if the sample is not truly random. However, we are not statistic freaks and we do believe that some form of generalization is possible even without a random sample. (I.e. this report should be interesting for more companies than the ones included in our case study).
We have chosen the terms ”complex”, ”medium complex” and ”non complex” to describe the different product offerings in figure 2-3 above. This classification is done from the customer’s perspective, i.e. a customer probably takes more variables into consideration when purchasing a new car compared to the purchase of pain killers. The car purchase is more complex.
The four companies included in our case study share many characteristics. Two obvious similarities shared by all four companies are: size and country of origin. Our motives for choosing only big Swedish companies are several. First, only big companies can afford to have a special person or department focusing on the brand. Because appointed brand managers can be found in the companies in our sample, fruitful interviews are ”guaranteed”. Second, because brand management of the companies in our selection is located in Sweden, ”easy” access is guaranteed. Third, branding is not only a hot topic but also a delicate one. Swedish companies often feel more comfortable to join a study only including other Swedish companies.
It should be noted that we have deliberately included more companies targeting consumers than companies targeting industrial or business customers. The reason is that the majority of the brand literature agree that consumer products have a key role in building strong brands. Consequently, it should be of special interest to study companies offering consumer products.
All companies included in our case study operates in a host of countries covering every continent from Europe to Asia, Australia, America and Africa. Companies who are internationalized have been called international, transnational, world, multinational and global companies. What is the difference and what should we call the companies included in our study? To an extent the issue is one of semantics. We have chosen the term Multinational corporation (MNC). Albaum et.al. (1998, p.4) describes the multinational corporation as a company operating in a number of countries and adjusting its products and practices in each (to some extent - our remark). MNC is the abbreviation used throughout this thesis.
Finally, we have to comment on the always present discussion on products versus services. At a first glance, it might appear that only traditional product companies are included in our case study while no service companies could be found. However, this is not the case. All four companies included in our case study stresses the importance of a holistic view and remember that services are one important component of the complete offer. Norman and Ramirez (1995, p.5) argues that it is virtually impossible to separate products from services because services are essential for the total value of the (product) offer. One should not limit oneself by thinking in terms of products or services, but rather ”offers” - a combination of both.
2.4.4.1 Interview
Our case study rests heavily on interviews. In order to make the interview a useful tool in our research certain requirements are necessary. The answers provided by the respondents will constitute the data necessary for an analysis, results and conclusions. Therefore, it is a prerequisite that the respondents answers are reliable and valid. It should also be possible to critically evaluate the results of the interview. One basic demand of an interview is that the data should accurately reflect the source. According to Lantz (1993, p.13), there are three demands of a professional interview:

· The method used must give reliable results (reliability).· The results of the interview must be valid (validity).· It should be possible to critically evaluate the conclusions.
Reliability and validity is covered under item 2.5 and conclusions are given in chapter 6. However, it should already here be noted that we have done our utmost to ensure reliable and valid results. We have tried to ask questions relevant to the purpose of the report and we have asked the same basic questions to all four companies included in the case study (interview questionnaire is included as appendix 1). Furthermore, two interviewers were present in four of five company interviews to reduce the risk of misinterpretation.
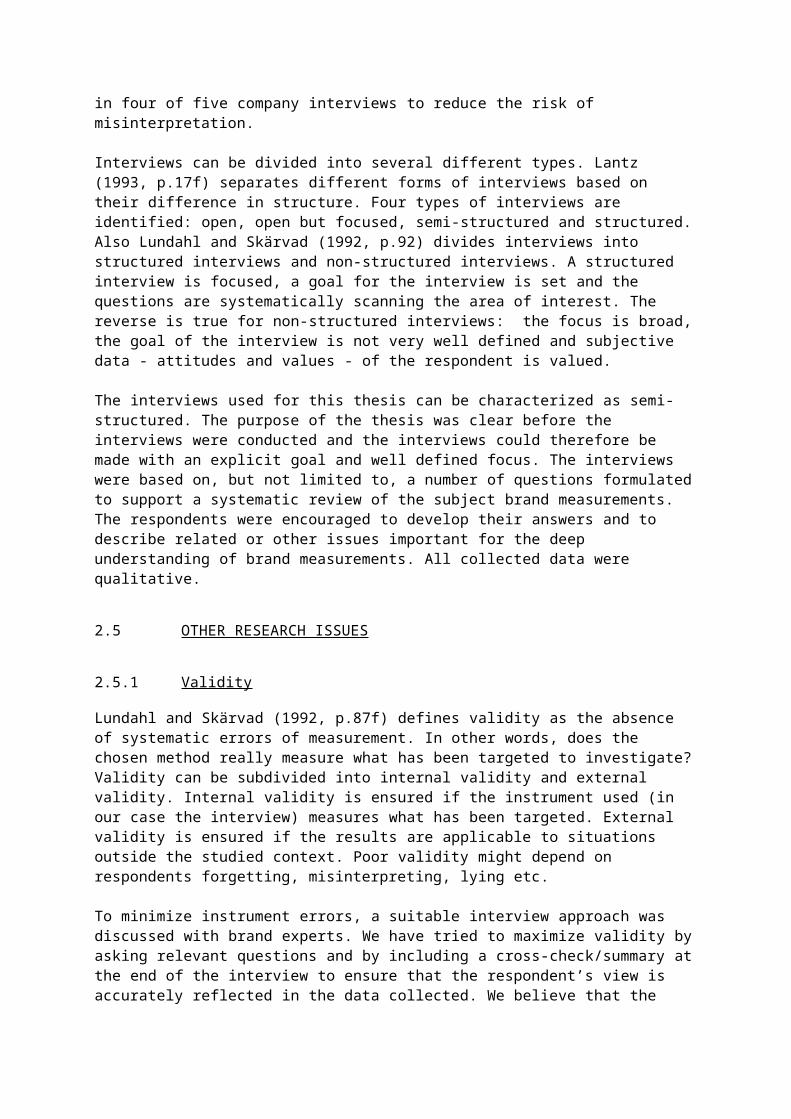
Interviews can be divided into several different types. Lantz (1993, p.17f) separates different forms of interviews based on their difference in structure. Four types of interviews are identified: open, open but focused, semi-structured and structured. Also Lundahl and Skärvad (1992, p.92) divides interviews into structured interviews and non-structured interviews. A structured interview is focused, a goal for the interview is set and the questions are systematically scanning the area of interest. The reverse is true for non-structured interviews: the focus is broad, the goal of the interview is not very well defined and subjective data - attitudes and values - of the respondent is valued.
The interviews used for this thesis can be characterized as semi-structured. The purpose of the thesis was clear before the interviews were conducted and the interviews could therefore be made with an explicit goal and well defined focus. The interviews were based on, but not limited to, a number of questions formulated to support a systematic review of the subject brand measurements. The respondents were encouraged to develop their answers and to describe related or other issues important for the deep understanding of brand measurements. All collected data were qualitative.
2.5 OTHER RESEARCH ISSUES
2.5.1 Validity
Lundahl and Skärvad (1992, p.87f) defines validity as the absence of systematic errors of measurement. In other words, does the chosen method really measure what has been targeted to investigate? Validity can be subdivided into internal validity and external validity. Internal validity is ensured if the instrument used (in our case the interview) measures what has been targeted. External validity is ensured if the results are applicable to situations outside the studied context. Poor validity might depend on respondents forgetting, misinterpreting, lying etc.
To minimize instrument errors, a suitable interview approach was discussed with brand experts. We have tried to maximize validity by asking relevant questions and by including a cross-check/summary at the end of the interview to ensure that the respondent’s view is accurately reflected in the data collected. We believe that the validity of this thesis is good because an interview is a method relatively easy to control.
2.5.2 Reliability
Lundahl and Skärvad (1992, p.89f) defines reliability as the absence of random errors of measurement. A survey with high reliability is characterized by the fact that the measurement is neither influenced by the researcher nor the actual circumstances of the research.
To avoid poor reliability we have tried to keep the interview situation similar for the different interviews in terms of formality, time, behavior etc. Also, the same basic questions were asked in all interviews. The fact that all respondents have a deep knowledge in branding issues ensures that the

questions are easily understood and interpreted in the same way by all respondents. All interviews conducted in our research were more like a conversation but with focus on a specific area. No leading questions were used.
2.5.3 Possible errors
Lekvall and Wahlbin (1993, p.215f) mention a few possible errors in research based on interviews: the respondent, the instrument and the interviewer. As mentioned in item 2.5.1, the respondent can cause errors due to misinterpretation, stress, fatigue etc. The instrument can cause errors if the questions asked are unclear, leading, sensitive etc. And, finally, the interviewer can cause errors because of his or hers behavior, age, sex, interpretation etc.
Our way of minimizing these possible errors has already been mentioned under item 2.5.1 and 2.5.2 above.
2.5.4 Alternative methods
Alternative methods to reach our purpose exists. Examples are survey-study, desk study of the problem, focus groups etc. Pros and cons exist for every method, however we believe in-depth interviews are suitable for our purpose. One could argue that a study covering more than four companies could have contributed to a higher reliability but we believe our sample is acceptable. We have tried to reach a sound balance between available resources (time and money) and quality. Including four companies targeting different types of customers and offering different types of products guarantees some sort of diversity.

Chapter ThreeTheory
3 THEORY
3.1 INTRODUCTION
This chapter sets the stage for the thesis by providing the big picture in terms of what brand, brand equity and measurement of brand equity is all about. The chapter will provide an overview of literature in the field of brands in general and brand equity in particular. There exists a myriad of literature related to the subject brand. Because of delimitation in time and money it is neither feasible to read all of it nor to present it in a thesis. However, we have tried to include some of the most interesting findings recognized by most branding experts.
3.2 BRAND
3.2.1 What is a brand?
Branding has been around for centuries as a means to distinguish the goods of one producer from those of another. Marks have been found on early Chinese porcelain, on pottery from ancient Greece and on old goods from India. The word ”brand” is derived from the phrase ”to burn” because owners of cattle marked the animals to identify them, beginning in the nineteenth century’s North America.
Although brands have long had a role in commerce, it was not until the twentieth century that branding became central to competition. According to Aaker (1991, p.7), a distinguishing characteristic of modern marketing has been its focus upon creation of differentiated brands. The idea has been to move beyond commodities to branded products to reduce the primacy of price upon the purchase decision. The American Marketing Association defines a brand as:
”A brand is a name, term, sign, symbol, or design, or a combination of them, intended to identify the goods and services of one seller or group of sellers and to differentiate them from those of competition” (Keller 1998, p.2).
Branding is a fascinating topic that has received much attention in the popular press. This attention is legitimate because, as Aaker (1991, p.14) remarks, for many businesses the brand name and what it represents are its most important asset - the basis of competitive advantage and of future earnings streams. However, a brand does not have foundations built on concrete and steel and it can not be found in a company’s balance sheet. A brand is an intangible asset. Still, marketers and finance people increasingly regard brands as the most valuable asset because strong brands - no matter how non-tangible their attributes may be - are capable of securing future earnings and thus are assets of value. Clearly, it is easier to imitate the production process and distribution of Coca-Cola than to imitate the brand, goodwill and image of the company. Lasting impressions in the minds of consumers from years of product experience may not be so easily reproduced. The brand is the thing!

As defined by the American Marketing Association, a brand is more than a name. If a company treats a brand only as a name, it misses the point of branding. The challenge is to develop a deep set of meanings for the brand. Marketing guru Philip Kotler (1997, p.443) states that a brand can convey up to six levels of meaning:
1. Attributes: A brand first brings to mind certain attributes. Thus, the Volvo brand suggests durable, high prestige, safe cars.
2. Benefits: A brand is more than a set of attributes. Customers are not buying attributes; they are buying benefits. Attributes need to be translated into functional and/or emotional benefits. The attribute ”durable” in item one above could translate into the functional benefit, ”I won’t have to buy a new car every few years”.
3. Values: The brand also says something about the producer’s shared values. For example, Ericsson stands for professionalism, respect and perseverance.
4. Culture: The brand may represent a certain culture. Electrolux represents Swedish culture: organized, high quality, achievement etc.
5. Personality: The brand can project a certain personality. Sometimes the brand might take on the personality of an actual well-known person. I.e. if the CEO of Astra, Håkan Mogren, is frequently seen in the press commenting on the brand Losec, Håkan Mogren might very well become the personality of Losec.
6. User: The brand suggests the kind of consumer who buys or uses the product. We would be surprised to see a 20-year student driving a Volvo S80. We would expect instead a 50-year-old top executive behind the wheel.
Also Keller (1998, p.10) stresses the different meanings of a brand. According to Keller it is necessary to teach customers who the product is (by giving it a name), what the product does and why customers should care.
3.2.2 Why do brands matter?
The brand is one key component of the broad concept marketing. Marketing emerges when people decide to satisfy needs and wants through exchange (Kotler 1997, p.11). Brands facilitate this exchange and branding is necessary from the standpoint of both seller and buyer (Keller 1998, p.7ff). A brand provides value to the manufacturer or seller by creating perceived differences among products and developing loyal customers which can translate to financial profits for the firm. A brand provides value to the consumer by simplifying the purchase task, reducing perceived risk and acting as a symbolic device. Brands also play an important psychological role; brands help people to communicate to others who they are or would like to be. Recent research actually suggest that a brand can act as a relationship partner helping people to resolve or address important personal issues (Gifford 1997, 9f) . In summary, a brand permits consumers to buy those products that satisfy their needs well and to avoid those that do not. Brands clearly provide important benefits to both consumers and sellers.
As mentioned above, marketing emerges when individuals obtain what they need and want through exchanging products and services of value with others. However, the problem for today’s firms is the multitude of different products and services available on the market. The risk is that the firm’s product offering will turn out to be a gray spot on a gray ocean of similar offerings if the firm’s offering is not differentiated. This is also valid for high-tech products, success is no longer driven by offering the latest and greatest products alone. Because most firms can successfully build satisfactory products, competition within many markets takes place at the product augmentation level. Thus, the new competition is not between what companies produce in their factories but between what companies add to the physical product core. A brand is, besides packaging, services, education, guarantees and other variables, a useful tool to create meaningful differences between products in the mind of the customer. Figure 3-1 below, illustrates an example of the total offer. It is important for the firm to

realize that the complete offer constitutes of the outer profile in the figure and that the brand is one key component.
CORE PRODUCT
Information Brand
Packaging
AssortmentsDeliveryprecision
EducationWarranties
Services
Figure 3-1. The total offer.Reference: Lekvall, Wahlbin 1993, p.36 (our translation).
3.2.3 Global branding
All four companies included in our case study are multinational, therefore a brief discussion covering global branding is appropriate.
Business people in multinational companies increasingly have to interact, manage, negotiate and compromise with people from different cultures. It is important for firms to understand that cultural diversity has an impact on international business and branding decisions. Hoecklin stresses that the essence of culture is not what is visible on the surface but rather the shared ways groups of people understand and interpret the world. While there are many products, services and holidays becoming common to world markets, i.e. McDonald’s, Coca-Cola, Christmas etc., that does not mean that these things have the same meaning in different cultures. Dining at McDonald’s is a show of status in Moscow, whereas in New York all it means is a fast meal for a fast buck (Hoecklin, 1995, p.2). Marketers that are looking at a global marketplace are increasingly considering not simply what products and brands are to be found where, but what they mean to people in each culture (ibid., p.95).
Hoecklin states that the ways in which many internationally operating firms seem to be balancing the need to build brand strength effectively and at the same time increasing geographical coverage have to do with managing the meaning of brands across cultures. The focus seems to be more and more on ensuring that the intended meaning of the brand coincides with the perceived meaning of the message (ibid, p.99), see figure 3-2 below.

Perceivedmeaning
Intended meaning
Sameacrosscultures
Same across cultures
Differentacrosscultures
Different across cultures
Miscommunication Effective communication
MiscommunicationEffective communication
Figure 3-2. The intended meaning of the brand should coincide with the perceived meaning of the message.
Reference: Hoecklin 1995, p.100
The generally accepted brand strategy is to find ways to balance local adaptation and global standardization. According to Keller (1998, p.566), a hierarchy of brand associations must be defined in a global context that defines which associations are to be held by consumers in all countries and which are to be held only in certain countries. Decisions have to be made as to how these associations should be created in different markets to account for different consumer perceptions, tastes and environments. Thus, marketers must be attuned to similarities and differences across markets. Also Aaker (1991, p.268) stresses the importance of finding a balance in globalization. Aaker suggest that one common misconception is that globalization is an all or nothing proposition. In fact, it may be optimal to globalize some of the elements of the brand - the name, the symbol, the slogan etc. - but it need not involve all elements. The trick will be to globalize those elements for which there is a resulting payoff in cost or impact, and allow the other elements of the brand to be customized to local markets.
In general, nonverbal brand elements such as logos, symbols and characters are more likely to directly transfer effectively geographically, than verbal brand elements that may need to be translated into another language according to Keller (1998, p.573). However, even nonverbal elements can encounter translation problems. For example, certain colors have strong cultural meaning. Green symbolize death in Malaysia while the same is true for white in Japan.
Finally, Aaker (1991, p.265ff) remarks that there are a set of advantages and disadvantages to a global brand. Global brands provide scale economies in the development of advertising, packaging, promotion etc. Also, global brands can exploit media overlap and exposure to customers who travel. However, local brands can be developed locally and tailored to the local market. Further, local brands reduce risk from ”buy local” sentiments.
3.2.4 Corporate versus product branding
Major corporations must decide how much emphasis they will put on product brands and how much visibility they will give to the corporate name. For a long time, corporations remained hidden for security reasons. In the event of problems with one of the brands, the corporation would not be hurt. However, a trend now exists in favor of corporate branding according to Kapferer (1992, p.171ff). The author argues that customers have become more and more demanding and need to be reassured by knowing who stands behind a brand. Whenever there is some perceived element of risk in a purchase situation, the corporate reputation confers some security. This suggests that the greater the degree of industrialization, the greater emphasis should be placed on the corporate brand. In practice however, the appropriate decision concerning the relative weight to give corporate and product names need a case-by-case analysis according to Kapferer.
3.2.5 Different applications
Marketers have traditionally classified products on the basis of varying product characteristics: durability, tangibility and use (Kotler 1997, p.433). Each product type requires specific brand management consideration. After reading the brand literature it is very easy to believe that branding is used for consumer goods only. However, virtually anything can be branded. Aaker (1991, p.ix) states that the power of brand names is not restricted to consumer markets. Brand equity may even be more important in industrial goods markets because brand-name awareness is often pivotal in being considered by an industrial buyer. After analysis, many industrial purchase alternatives tend to be toss-ups and the decisive factor then can turn upon what a brand means to a buyer. The universality of branding can be recognized by looking at some different product applications valid for the companies included in our case study: consumer goods, industrial goods and high-tech products.
3.2.5.1 Consumer goods
All branding literature recognize the importance of brands in consumer buying decisions (e.g. Keller 1998, p.7ff). Keller provide an overview of the different advantages brands play to a consumer:
· Identification of source of product.· Assignment of responsibility to product maker.· Risk reducer.· Search cost reducer.· Promise, bond, or pact with the maker of the product.· Symbolic device.· Signal of quality.
Grapentine and Teas (1996, p.26ff) suggest that a brand play an important role in every purchase decision stage of a consumer. In the information search stage a brand reduce the information acquisition effort. When a consumer is establishing the consideration, the brand can be used by the consumer as an indicator of future satisfactory product performance, assuming successful usage experience. In the purchase decision stage, a brand can be used as a decision simplification or a risk reducer. And finally, in the post-purchase stage, a brand can for example communicate prestige.
3.2.5.2 Industrial goods
Industrial goods are typically bought by an organization for business or commercial use. Industrial goods usually involve business-to-business marketing practices. Keller (1998, p.603) argues that because of the breadth and complexity of the product mix of companies selling industrial goods they are more likely to emphasize corporate or family brands. It is especially important that these corporate or family brands convey credibility and possess favorable global associations because corporate credibility is often a primary risk-reduction factor adopted by industrial buyers.

3.2.5.3 High-tech products
The main distinguishing feature of high-tech products is the fact that the products themselves change so rapidly over time due to technological innovations and R&D1 breakthroughs. The short product life cycles for high-tech products have several significant branding implications according to Keller (1998, p.610). It puts a premium on creating a corporate or family brand with strong credibility associations. Because of the often complex nature of high-tech products and the continual introduction of new products, consumer perceptions of the expertise and trustworthiness of the firm are particularly important. Lacking ability to judge the quality of high-tech products, consumers may use brand reputations as a means to reduce risk.
3.3 BRAND EQUITY
3.3.1 Brand equity
The term equity is ”borrowed” from the world of finance and stands for a sort of capital which is equivalent to assets minus liabilities. The number of definitions of brand equity almost equals the number of authors of books and journals covering the subject. However, there exist a common agreement in the literature of the basic properties of brand equity as shown below:
”Brand equity relates to the fact that different outcomes result from the marketing of a product or service because of its brand name or some other brand element, as compared to outcomes if that same product or service did not have that brand identification” (Keller 1998, p.42).
”Brand equity is a set of brand assets and liabilities linked to a brand, its name and symbol, that add to or subtract from the value provided by a product or service to a firm and/or to that firm’s customers” (Aaker 1991, p.15).
”Brand equity is the added value with which a given brand endows a product ” (Farquhar 1990, p.RC-7).
Linn introduce a synonymous to brand equity, namely meta value (Linn 1998 p. 28ff). The author conclude that the meta value is what remains if we remove the value of the physical product. Meta value (or brand equity) could be described as the hidden immaterial intangible added value that makes the difference between the cost of the product and the price asked for it. Meta value is essential because a profitable business deal requires that the seller sells a product for a price higher than it costs to produce or acquire. The intangible added value may be a not so unessential part of the product value. If you are not convinced, compare the price of a bottle of Absolut Vodka to an unbranded bottle of purified ethyl alcohol.
3.3.2 What is the difference between brand equity and brand value?
Approaching the subject brand as a novice can turn out to be quite frustrating, especially when one’s interest is focused on the value of a brand. Some authors use the term brand equity while others use the term brand value. A third approach among authors is to use the terms brand equity and brand value interchangeably. The 100 dollar question then is, what is the difference, if any, between brand equity and brand value?We are in agreement with Keller when he states that the bad news of the concept brand equity is that the concept has been defined in a number of different ways for a number of different purposes resulting in some confusion and even frustration with the term (Keller 1998, p.42). Markus Irmscher 1 Research and Development

states that one of the biggest problems in the brand equity discussion and therefore in modeling a brand equity concept is that the term brand equity is used as a tangible and as an intangible figure at the same time (Irmsher 1993, p.105). Irmsher further states that the brand equity concept is understood as a controlling tool for brands which integrates both the financial and marketing perspective. Finance is interested in measuring the financial efficiency of a brand. Marketing is interested in evaluating the marketing productivity. The brand equity concept must therefore incorporate yardsticks which are satisfactory to both finance and marketing. Brand equity is the marketing yardstick while brand value is the finance yardstick.
Because there is not a consensus on neither the definition of brand equity nor brand value we will take a simplified approach in this paper and only use the term brand equity.
3.3.3 Benefits from brand equity
There is an overwhelming agreement in the literature that a company can benefit from brand equity in numerous ways. Keller (1998, p.53) lists several different benefits to the firm of having brands with a high level of awareness and a positive brand image, we have chosen to summarize a few of these:
· Greater loyalty.· Less vulnerability to competitive marketing actions.· Larger margins.· More inelastic consumer response to price increases.· Increased marketing communication effectiveness.· Increased brand extensions opportunities.
Also brand guru Aaker (1991, p.17) stresses the important benefits of brand equity. Aaker suggests that brand equity is based on five major assets: loyalty, awareness, quality, associations and other assets. Several benefits to the firm emerges from each one of these five major assets. Some of these benefits are listed below (please note the conformity with the brand equity benefits listed by Keller).
· Efficiency and effectiveness of marketing programs.· Brand loyalty.· Prices/Margins.· Brand extensions.· Trade leverage.· Competitive advantage.
Benefits from brand equity is not limited to consumer goods. A research (Thomas1993, p.82) covering major UK firms handling industrial and commercial goods showed that business customers place great emphasis on the brand name when buying goods and services. More than twenty percent of the respondents in the research strongly agreed to following statements on a strong brand name:
· Significantly helps in attracting new business and customers.· Provides reassurance and confidence on the purchaser.· Provides important competitive advantage.· Enables supplier to charge higher prices than the competition.· Results in high levels of customer loyalty.· Makes it easier to sell other products.

3.4 MEASURING BRAND EQUITY
3.4.1 Introduction
As remarked above in item 3.3.1, there is no unique definition of a brand nor any unique definition of brand equity. Therefore, it is naturally little agreement on the right way to measure brand equity. Despite this fact we will in this section try to summarize some of the most interesting methods for measuring brand equity as outlined by different experts on the subject.
We will divide different types of brand equity measures into two broad approaches: separate brand equity measures (item 3.4.3) and combined brand equity measures (item 3.4.4). This division is none but our own and are not used in any branding literature. However, we believe that a division facilitates the understanding of the different measures. We will begin to describe separate brand equity measures because several of these measures are typically used in the combined brand equity measures.
3.4.2 Reasons for measuring brand equity
This thesis is covering brand and brand equity in general and measurement of brand equity in particular. But why should a firm be interested in measuring brand equity at all? We can assure you that there exists a myriad of reasons to measure brand equity and we will bring the most common reasons for measuring brand equity augmented by different branding experts to your attention.
Branding guru Aaker (1991, p.21f) suggests several reasons. First, since brands are bought and sold, a value must be assessed by both buyer and sellers. Second, investments in brands in order to enhance brand equity need to be justified, as there are always competing uses of funds. A bottom-line justification is that the investment will enhance the value of the brand, thus a calculus of the brand value becomes important. Third, the valuation question provides additional insight into the brand-equity concept. Irmscher (1993, p.103) means that the financial interest in brands - especially by stock markets - have raised the need for accurate and reliable methods which measures the financial value of brands. For example, Swedish commissionaries have recently started funds based on strong brands since they believe that companies having strong brands are more profitable in general than others (Dagens Industri 98.12.23). These methods must be able to evaluate the prices of brands in the phase of mergers and acquisitions. Also Lin (1993, p.69) agrees that there is an increasingly strong need for evaluating a brand’s equity because of the pressure of merger and acquisitions.
However, mergers and acquisitions is a special case. We believe that Keller (1998, p.307) provides the most illustrative and useful reason behind measurements of brand equity from a firm’s perspective: marketers can develop measurement procedures to access how well they are doing. In other words, it is important for marketers to understand the sources of brand equity, how they affect sales and how all of this information changes over time. Keller (ibid, p.372) stresses that because any one measure typically only captures one particular aspect of brand equity, multiple measures should be employed to account for the multidimensional nature of brand equity. Multiple measures increase the diagnostic power of marketing research and the likelihood that managers will better understand what is happening to their brands and, perhaps more importantly, why.
3.4.3 Separate brand equity measures
This item includes ten different separate brand equity measures listed below. This comprehensive theory presentation might feel somewhat heavy, but we believe it is necessary for the understanding of different aspects of brand measurement.
· Free associations.· Projective techniques.· Brand personality.· Awareness. · Comparative methods.· Conjoint analysis.· Residual approach.· Cost method.· Market method.· Income approach.
3.4.3.1 Free associations
Free associations means, according to Keller (1998, p.311f), that consumers are asked what comes to mind when they think of the brand. The primary purpose is to identify the range of brand associations in consumers’ minds but may also provide some rough indication of the relative strength of different associations. Associations mentioned first by consumers is relatively strong and likely to impact customer decisions. Associations later on the list, on the other hand, may be weaker and thus more likely to be overlooked during consumer decision making. Free associations help marketers to assemble a brand profile and determine the core aspects of the brand’s image.
The main disadvantage with the method is the coding and interpreting of data, it is easy to bias results. Different researchers examining the same results may draw very different conclusions. Moreover, samples involved are often small and may not generalize to broader populations. For MNCs, the issue is also where the samples should be made, for example results valid for South-African consumers may not be applicable to consumers in France.
3.4.3.2 Projective techniques
In certain situations, consumers may feel that it would be socially unacceptable or undesirable to express their true feelings. As a result, they may find it easier to fall back on standard answers that they believe would be acceptable or even expected. For example, it may be difficult for consumers to admit that a certain brand has prestige and enhances their self-image. Projective techniques are, according to Keller (1998, p.313ff), diagnostic tools to uncover the true opinions and feelings of consumers when they are unwilling or otherwise unable to express themselves on these matters. Examples of projective techniques are completion, interpretation and comparison tasks. Consumers might be asked to compare brands to people, countries, animals, occupations, cars, magazines etc.
The drawbacks of projective techniques are the same as for free associations mentioned above. We believe that people perceive the same things differently. For example, some people might think of a lion as a positive thing while perhaps others might think of a lion as something cruel and brutal.

3.4.3.3 Brand personality
Keller (1998, p.320ff) states that brand personality is the human characteristics or traits that can be attributed to a brand. Brand personality can be measured in different ways, probably the simplest way to uncover the brand’s personality is to ask consumers:
”If the brand were to come alive as a person, what would it be like, what would it do, where would it live, what would it wear and who would it talk to if it went to a party”?
Jennifer Aaker’s (1997, p.347ff) research reveal that brand personality is different from human personality. Brand personality is different because brands tap a dimension that individuals desire but do not necessarily have. Aaker’s research suggest that the names best representing the five dimensions of brand personality are: Sincerity, Excitement, Competence, Sophistication and Ruggedness. These factors are, in turn, represented by different traits as shown in figure 3-3 below. Primarily positively traits can be found because brands typically are linked to positive associations according to Aaker (we are doubtful - think of the brand Exxon after the Exxon Valdez catastrophe in Alaska in 1989). Why then, is brand personality interesting from the firms perspective? Because brand personality tends to serve as a symbolic or self-expressive function for individuals. Previous research by Malhotra 1988 and Sirgy 1982 (Aaker 1997, p.348) has suggested that the greater the congruity between the human characteristics that describe an individual’s actual or ideal self and those that describe a brand, the greater the preference for the brand.
The drawback of a brand personality measure is, as we see it, that it is a qualitative measure. As mentioned above, there may be a question of interpretation. Finally, a word of caution. The study of Aaker was performed in the States, included U.S. customers only. We have not found any proof that the brand personality dimensions are cross-cultural.
Brand Personality
Sincerity Excitment Competence Sophistication Ruggedness
Down-to-earthHonest
WholesomeCheerful
DaringSpirited
ImaginativeUp-to-date
ReliableIntelligentSuccessful
Upper classCharming
OutdoorsyTough
Figure 3-3. A brand personality frameworkReference: Aaker 1997, p.352

3.4.3.4 Awareness
Keller (1998, p.49 and 325ff) defines brand awareness as:
”Brand awareness is related to the strength of the brand node or trace in memory, as reflected by customers’ ability to identify the brand under different conditions”.
Brand awareness consists of brand recognition (reflecting the ability of consumers to confirm prior exposure to the brand) and brand recall (reflecting the ability of consumers to retrieve the brand when given some type of probe or cue). Thus, brand recall is a more demanding memory task than brand recognition. Choosing the appropriate measure depends on the relative importance of brand awareness for consumer behavior in the product category. For example, if consumer decisions are made at the point of purchase where the brand name, logo, etc. will be physically present and visible, then brand recognition will be important. If, on the other hand, consumer decisions are mostly made away from the point of purchase where the brand elements are not physically present brand recall will be more important.
Also Aaker (1991, p.61f) suggests that there are different levels of brand awareness. Aaker presents the awareness pyramid, see figure 3-4 below. The pyramid consists of four levels; unaware of brand, brand recognition, brand recall and top of mind. Brand recognition and brand recall are described above. The unaware level illustrates the situation when a consumer does not even know the existence of a brand. The first-named brand in a unaided recall task has achieved top-of-mind awareness and it is ahead of the other brands in a person’s mind. Having a brand with high brand awareness provides a strong competitive advantage. In many purchase situations it means that no other brand will even be considered.
Topof Mind
Brand Recall
Brand Recognition
Unaware of Brand
Figure 3-4. The awareness pyramid. Reference: Aaker 1991, p.62
The disadvantage of awareness measures is the always present issue of consumers making up responses or guessing. Spurious awareness may send misleading signals as to the proper strategic direction for a brand. The advantage with a brand recognition measure is that visual recognition can be used and a brand recall measure can provide some insight into brand positioning in consumers’ minds.
We believe that awareness is not enough. A consumer might be well aware of a brand but still not buy it. Thus, an awareness measure should be complemented with a measure capturing actual consumption. (Even though consumers may be equally aware of a brand, those who are heavy consumers are more valuable to a brand than those who are light consumers).

3.4.3.5 Comparative methods
Keller (1998, p.344ff) states that comparative methods involve experiments that examine consumer attitudes and behavior toward a brand to more directly estimate the benefits arising from having a high level of awareness and strong, unique brand associations. The classic example of a comparative method is ”blind testing” where consumers examine or use a product with or without brand identification. Comparative methods are useful to determine price premiums and price margins. For example, Intel routinely surveys computer shoppers to find out how much of a discount they would require before switching to a PC that did not have an Intel microprocessor in it.
Crimmins (1992, p.16) suggest a very simple way of measuring the value added by a product name. The amount of value added by a brand name is the ratio of its price to its competitor’s price when both products are equally desirable to consumers, minus one. To illustrate, Crimmins gives an example: if my brand and a competitor’s are equally desirable when mine costs $1.10 and my competitor’s costs $1.00, then the amount of value added by my brand name relative to his is:
($1.10/$1.00)-1 = 10%
The disadvantage with comparative methods is that it may be difficult to determine whether consumer response is specific for the firm’s particular brand or valid for any brand in the product category. One way to determine this is to conduct similar tests with competitive brands. Another disadvantage is that conjoint analysis may be difficult to use when the products of interest are complex and advanced with a lot of features. If our firm’s products are equipped with a lot of features while our competitor’s products are stripped (or vice versa), it is very difficult to make a fair comparison. We believe that there is a risk of comparing apples to pears and not apples to apples.
3.4.3.6 Conjoint analysis
Conjoint analysis is a survey-based technique that enables marketers to profile the consumer buying decision process with respect to product and brands (Keller 1998, p.349ff). By asking consumers to make choices among a number of different product profiles, firms can determine the tradeoffs consumers are making between various brand attributes like package, brand name, price etc. and thus the importance that consumers are attaching to those attributes.
The critique of conjoint analysis is that product profiles may be presented to consumers that violate their expectations based on what they already know about brands. Consumers should not evaluate unrealistic product profiles or scenarios.
3.4.3.7 Residual approach
The residual approach tries to ”net out” physical product effects to determine brand equity. The residual approach attempt to place an overall value for the brand in abstract utility terms (Keller 1998, p.354ff). Park and Srinivasan (1994) suggest a complicated survey based method which measures brand equity as the difference between an individual consumer’s overall brand preference and his or her brand preference on the basis of objectively measured product attributes. Objective product attributes are set by experts in the product category (for example objective product attributes of toothpaste are decided by dentists).
The disadvantage of the residual approach is that it is most appropriate for brands characterized with a predominance of product-related attribute associations because it is unable to distinguish between different types of non product-related attribute associations. Also, we believe it is almost impossible to subtract out preferences for objective characteristics of the physical product from overall

preferences - who decides what ”objective” characteristics are? As already mentioned in the method chapter of this thesis, we do not believe in total objectivity.
3.4.3.8 Cost method
The cost method maintains that brand equity is the amount of money that would be required to reproduce or replace the brand (Keller 1998, p.359). The method suffers from two difficulties, according to Lin (1993, p.70). First, it does not take into account the potential of future cash flow. Second, assessing costs of replacing an existing brand with another identical is complicated if not impossible. How could we use the cost approach to calculate the value of Coca-Cola?
Kapferer (1992, p.278ff) divides the cost method in two approaches: valuation according to historic costs and valuation according to replacement cost. Just like Keller and Lin, Kapferer highlights several difficulties associated with the cost method as outlined below.
Valuation according to historic costs can be done if adding all the costs over a set of period - development costs, marketing costs, advertising and general communication costs, etc. These costs can be determined objectively and will have been included in past income statements. However, different approaches concerning exactly which costs and for which time period costs should be included will make this method not totally objective. Kapferer states that this method of looking at historic costs presents a set of practical difficulties.
· Over what period should costs be taken into account? Numerous brands are very old and are today weak. The outcome of this method would then be misguiding.
· Which costs should be taken into account? How much and for how long does for instance advertising affect the brand?
· Which discounting rate should be used?· In creating a brand, a large part does not involve cash outlay. These include stringent quality
controls, accumulated know-how, personnel involvement etc.
Valuation according to replacement cost. To overcome the difficulties arising from the historical costs approach, Kapferer suggests measuring the replacement cost for a brand. With its total profile in mind - awareness, percentage of trial and repurchases, absolute and relative market share, distribution network, image and leadership - what has to be spent, and over which period, to create an equivalent brand? However, Kapferer recognize that this approach also encompasses a host of problems. Some brands simply can not be recreated since they were born in an era when advertising investment was negligible, and was nurtured over the years by reputation. Furthermore, in order to gain entrance, a competing brand must be ejected and the author sees no reason why today’s well-known brands should allow themselves to be thrown out. Finally, if looking at the high failure rate of new product launches, there is a great uncertainty surrounding the benefits of the huge sums which need to be invested over a long period.
We doubt that the outcome of these methods, the value of the brand based on historic costs or replacement costs, have any major value. To know what it did cost or should cost for the company to create the brand they have today is one thing. To know how the brand is valued by customers today and what gains the company can have from this value in the future, is another.
3.4.3.9 Market method
According to the market method, brand equity can be thought of as the amount an active market would allow such that the brand would be exchanged between a buyer and seller. The main problem with this method is the lack of open market transactions for brand assets (Keller 1998, p.359). Also Lin and Kapferer recognize some potential problems. Lin (1993, p.70) states that the market valuation

will be difficult to use because it requires that a proper market or a similar brand transaction exists, that the terms of other transactions are available so that critical comparisons can be made and, finally, that the time of the previous transaction is recent so that conditions have not changed. Kapferer (1992, p.283) identifies similar problems with the market method. First, a market for brands does not effectively exist since acquisitions and brand sales are relatively few and far between. The purchase price also do not reflect the price of the brand, but is the considered value of the purchaser’s use of it. Second, the published price is not always the real price since non-cash and deferred advantages are kept a secret.
3.4.3.10 Income approach
Some authors argue that one way to determine brand equity is to discount future cash flow from the future earnings stream for the brand. Keller (1998, p.360) suggest three different income approaches (also supported by Kapferer as shown below):
1. Capitalizing royalty earnings from a brand name (when these can be defined).2. Capitalizing the premium profits that are earned by a branded product.3. Capitalizing the actual profitability of a brand after allowing for the costs of maintaining it and the
effects of taxation.
The first approach, the royalties method, deals with the concern of how much royalty the firm would receive if they transferred the rights to use the brand under license. The figure obtained could be used to calculate the discounted cashflow over several years. However, the royalty figure does not solely include the use of the brand. Normally the brand owner also undertakes to supply a package of basic materials, know-how, and services which allow the licensee to maintain the brand’s appropriate quality level (Kapferer 1992, p.286).
The second approach, capitalizing the premium profit, is already covered in item 3.4.3.5, comparative methods.
The third approach, capitalizing the actual profitability, determines the marginal income connected to the brand. A comparison is made between the branded product and an unbranded similar product. The marginal income for the branded product has three sources: a higher demand (QB), a possibly higher price (PB), and a lower production and distribution cost (CB). From these must be subtracted the cost of marketing the brand (MKTG), and also the cost of R&D and taxes on excess income (ibid, p. 284).
RB-R = QB(PB-CB)-Q(P-C)-MKTG-R&D-TAX
R: Revenue unbranded product C: Cost unbranded productRB: Revenue branded product CB: Cost branded productQ: Quantity unbranded product MKTG: Marketing cost of the brandQB: Quantity branded product TAX: Taxes on excess incomeP: Price unbranded product R&D: R&D cost of the brandPB: Price branded product
A practical problem with this formula is the availability of the factors necessary. An approach suggested by Kapferer to simplify the equation above is the premium pricing method. The method consists of taking the difference between the brand price and the price of an unbranded product. In the equation shown above, the approach assumes that costs are identical (CB=C) for the branded and the unbranded product and that there is an equal volume of sales from the unbranded product compared to the branded product (QB=Q) (ibid, p.285).
The problem with the premium pricing method approach lies in its hypothetical nature, there is no guarantee of a generic product with which to compare. Further, this valuation method assumes that all

brands pursue a price premium strategy, which is an incorrect assumption when regarding firms that pursue an aggressive price policy and derive their benefits largely from added volume and increased productivity, for instance Swatch (ibid, p. 285).
When have decided the brand’s net revenue as discussed in the three approaches above, another problem arises. That is, how should one calculate the brand’s future value? Kapferer (1992, p.292f) states that one possible solution to the problem is to use a method often applied by financial analysts. It uses the brand profile to establish a business plan for predicting future cash flows. The brand profile is made of a set of factors; market leadership, the established status of the brand, brand extensions possibilities, potential to become international, legal protection etc. Financial analysts use the brand profile as a means of diagnosing and estimating how realistic the predicted cash flows are. In practice, a discounted cash-flow approach is used. This is the classic approach to the financial evaluation of any investment. The analysts establish the year-by-year revenue attributable to the brand over a period of arbitrary years. The discounting rate is the weighted average capital cost. The present value of a brand is calculated in the formula:
N
t=1
RBt
(1+r)t+ residual value
(1+r)NValue of the brand =
RBt: anticipated revenue in year t, attributable to the brand. r: discounting rate.
t: starting period.N: N periods.
Residual value beyond year N = RB N
ror
RBN
r-g
g: rate of revenue growth.RBN: anticipated revenue in year N, attributable to the brand.
Also the way to use discounted cash flow suffers from several disadvantages. Skeptics of this methodology, Murphy 1990 and Ward 1990 (ibid, p.293), point to its three sources of fallibility: anticipation of cash flow, choice of period and discounting rate. Irmscher (1993, p.109) pin-point another problem area: if a company owns several brands it might be difficult to estimate the generated cash flows from each brand because the success of each brand can be affected by another.

3.4.4 Combined brand equity measures
This item includes four different combined brand equity measures listed below.
· Young & Rubicam’s brand asset valuator.· Total Research’s Equitrend.· The Brand Equity Ten.· Interbrand model.
3.4.4.1 Young & Rubicam’s brand asset valuator
Young & Rubicam´s (Y&R - one of the world’s largest advertising agencies) brand asset valuator measures brand equity across products using a 64 item questionnaire that includes four sets of measures. Almost 45,000 adult consumers in 27 countries are being interviewed. Y&R have the hypothesis that brands are built sequentially along the four dimensions listed below (Keller 1998, p.625ff).
1. Differentiation - Measures how distinctive the brand is in the marketplace.2. Relevance - Measures whether a brands attributes has relevance for the respondents.3. Esteem - Measures whether a brand is held in high regard and considered best in its class.4. Knowledge - A measure of understanding as to what a brand stands for.
According to Y&R, the two first dimensions’ differentiation and relevance combined represents the brand strength, which Y&R identifies as an important leading indicator of future performance and potential. Furthermore, the two last dimensions esteem and knowledge combined represents the brand’s stature, an indication of a brand’s current presence.
Y&R has integrated the two fundamental dimensions of brand strength and brand stature into a visual analytic device which they call the Power Grid. See figure 3-5 below. (D=Differentiation, R=Relevance, E=Esteem, K=Knowledge).
BRAND STATURE
BRA
ND
STR
EN
GT
H
High
High
Low
Low
D R E K D R E K
D R E K D R E K
Figure 3-5. The Y&R Power Grid: Stature versus strength Reference: Aaker (1996, p.309)

Differentiation and Relevance
A brand that is in the upper left quadrant in the Power Grid has succeeded to establish a unique and distinct differentiating factor in the minds of the customers. The Relevance dimension deals with to what extent the differentiating factor is relevant. Brands ranked high in both differentiation and relevance have great strength. However, it should be noted that the brand strength two variables differentiation and relevance is not half each of the strength. The proportion varies depending on which branch the brand is represented in.
Esteem and Knowledge
Esteem can be evaluated in two dimensions. The first is the physical dimension, i.e. for instance food brands such as Heinz and Marabou are strongly influenced by how the customer perceives the products. The second dimension is more influenced by emotions. The customer have a “gut feeling” about the brand. Products that are harder to evaluate for the customer, such as high-tech products have brands that are evaluated based more on feelings than actual physical attributes. Knowledge is connected to recognition, but more importantly also the acknowledgement of the brand. High knowledge about a brand works like a receipt for the company that their brand is respected, unless of course the knowledge is connected to something negative.
Brands that are high on both dimensions (the upper right quadrant) have the greatest equity to protect and exploit. The bottom left quadrant is generally made up of brands that are just getting started; however a brand that stays too long in this quadrant is not likely to be successful in the long run. According to the Y&R hypothesis, the brands in the upper left quadrant are either strong niche brands or brands with significant opportunity to grow by increasing their stature. The lower right quadrant in contrast, is largely populated by brands that are tired but still retain some esteem and knowledge (Aaker, 1996, p. 309).
3.4.4.2 Total Research’s Equitrend
This method (Aaker 1996, p.309ff) is based on a smaller set of questions than the Y&R brand asset valuator. Equitrend is based on measures of three brand equity assets listed below:
1. Salience - The percentage of respondents who have an opinion of the brand.2. Perceived quality - The respondents opinion in product quality.3. User satisfaction - Is the average quality rating a brand receives among consumers who use the
brand most often.
About 2000 randomly chosen U.S. consumers (ages 15 or older) are interviewed each year in the annual Equitrend survey by Total Research (an U.S. marketing company). To determine the score for each of the three brand equity assets, the respondents are asked to rate brands on a scale of 0 to 10, with 10 representing “outstanding/extraordinary quality“, 5 representing “quite acceptable quality”, and 0 representing “unacceptable/poor quality”. No definitions of quality are provided, leaving it up to the customer to decide how he or she judges quality in each case. The scores for the three equity assets are averaged across consumers and the brands score will be revealed and presented in the Equitrend top 100 brand list (Keller1998, p.25f).
We see the Equitrend method as narrow, only including consumer interviews. Several studies have shown that there often is a gap between what a respondent say and actually do. Perhaps other variables, for example market share and actual sales could be appropriate as a complement to the Equitrend method.

3.4.4.3 The Brand Equity Ten
The Brand Equity Ten, presented by Aaker (1996, p.xxff), is a survey based method consisting of a set of ten variables divided into five categories. The measures are based on the equity framework. See figure 3-6 below.
BRANDEQUITY
Brand Loyalty
BrandAwareness
PerceivedQuality
BrandAssociations
OtherProprietaryBrand Assets
Reduced MarketingCostsTrade LeverageAttracting NewCustomers* Create Awareness* ReassuranceTime to Respond toCompetitive Threats
Anchor to WhichOther AssociationsCan Be Attached
Familiarity - Liking
Signal of Commitment
Brand to Be Considered
Reason-to-Buy
Differentiate/Position
Price
Channel Member Interest
Extension
Help Process
Differentiate/Position
Reason-to-Buy
Create Positive Attitude/
Extenstions
CompetitiveAdvantage
Provides Value toCustomer by EnhancingCustomer’s:
*Interpretation/Processing of Information
* Confidence in the Purchase Decision
* Use satisfaction
Provides Value to Firmby Enhancinng:
* Efficiency and Effectiveness of Marketing Programs
* Brand Loyalty
* Prices/Margins
* Brand Extensions
* Trade Leverage
* Competitive Advantage
Figure 3-6. The equity framework Reference: Aaker (1991, p.270)
The equity framework’s first four categories, brand loyalty, brand awareness, perceived quality and brand associations gives an overview of how brand equity creates value for the customer as well as the firm. The fifth category, other proprietary assets, is included for covering assets such as channel relationships and patents that are attached to the brand.
Loyalty measures1. Price Premium - How much more a customer is willing to pay for a specific brand.2. Satisfaction/Loyalty - How willing customers are to stick to a brand.
Perceived quality/ Leadership measures1. Perceived quality - The respondents opinion in product quality.2. Leadership/ Popularity - Do customers perceive the brand as a leading/popular brand?
Associations/ Differentiation measures5. Perceived value - Is there a reason to buy this brand over others?6. Brand personality - Does the brand have a personality? Is the brand interesting?7. Organizational associations - Is the brand made by a trustworthy organization?
Awareness measures8. Brand awareness - Is the brand in the mind of the customer?

Market behavior measures9. Market share - Provides a reflection of the brand’s standing with customers.10. Market price and distribution coverage - Price of brand compared to competitors and effects of
change in distribution.
The first four categories (variables 1-8) represent customer perceptions of the brand along the four dimensions of brand equity whereas the fifth includes two sets of market behavior measures that represent information obtained from market based information rather than directly from customers (Aaker, 1996, p.319).
The Brand Equity Ten will not necessarily represent an optimum set of measures in all contexts. Modifications to fit the context and task at hand will be necessary. For example, the food and drink business may require different measures than the high-tech business (ibid, p.317). Two types of research should guide the selection of a final set. The first type should be quantitative. The measures should be applied to a set of brands over time; statistical models can then be used to determine which measures drive objective variables of interest. The strength of the relationship between the brand equity measures and these objective variables will then provide a basis for prioritizing the list of candidate measures. (For example Aaker and Jacobson (1994, p.191ff) uncovered a positive correlation between perceived quality, one key component of brand equity according to most brand experts, and stock return. The product quality measures used in the research came from a survey study of US households evaluating perceived product quality of major firms like Compaq, Hilton Hotels, Pepsi and Volvo. The study suggests that changes in brand equity affect stock return). The second research approach is to develop extensive case studies that describe large positive and negative changes in the price premium measure. Aaker believes that price premium might be the single most important brand equity measure. Each case study should attempt to determine the causes of the change in the value of the brand. Convincing case studies can suggests variables that influence brand equity and can provide credibility to both the measures and to the whole process (Aaker 1996, p.31)
We see two major drawbacks concerning The Brand Equity Ten approach. Aaker states that the first eight variables require a customer survey that can be expensive, inconvenient, time consuming and hard to implement and interpret. Furthermore, even though each measure has potentially diagnostic value, the use of so many measures is unwieldy.
Another drawback with this method since it assumes that the company should initially chose a set of variables that have to be examined. However, we believe that the company most likely will chose a set a variables they believe their brand has. There is no saying that the customers would have chosen these same variables.

3.4.4.4 Interbrand model
Interbrand (a U.S. brand valuation firm) assumes that the value of a brand, like the value of any other economic asset, is the present worth of the benefits of future ownership (Keller 1998, p.361ff and Lin 1993, p.71f). The Interbrand method is a two-step procedure for calculating brand value: (1) identify the brand earnings and cash flow, (2) capitalizing the earnings by applying a multiple of historic earnings as a discount rate to future cash flow.
Brand strength is evaluated by Interbrand on the basis of seven factors:
1. Leadership. The brand’s ability to influence its market and be a dominant force with a strong market share. The attributes to be evaluated are: market share, awareness, positioning and competitor profile.
2. Stability. The ability of the brand to survive over a long period of time based on consumer loyalty and past history. The attributes to be evaluated are: longevity, coherence, consistency, brand identity and risks.
3. Market. The brand’s trading environment in terms of growth prospects, volatility and barriers to entry. The attributes to be evaluated are: nature of the market (e.g. volatility), size of market, market dynamics and barriers to entry.
4. Geographic spread. The ability of the brand to cross geographic and cultural borders. Brands that are international are inherently more valuable than national or regional brands. The attributes to be evaluated are: geographical spread, international positioning, relative market share, prestige and ambition.
5. Trend. The ongoing direction and ability of the brand to remain contemporary and relevant to consumers. The attributes to evaluate are: long term market share performance, projected brand performance, sensibility of brand plans and competitive actions.
6. Support. The amount of marketing and communication activity. Those brands that have received consistent investments and support must be regarded as more valuable than those that have not. Attributes to evaluate are: consistency of message, consistency of spend, above versus below line and brand franchise.
7. Protection. The brand’s legal titles. Protection may be a registered trademark. Attributes to evaluate are: trademark registration and disputes.
The brand strength is a composite of these seven weighted factors and is expressed as a percentage. An example is shown in table 3-1 showing two fictional brands, A and B.
Strength factors Maximum Brand A Brand Bscore
Leadership 25 14 18Stability 15 13 14Market 5 4 5Internationality 15 7 14Trend 20 12 13Support 15 10 12Protection 5 4 4
Total 100 64 80
Table 3-1. Interbrand, seven weighted factors (fictional).Reference: Lin 1993, p.71

The brand strength score is in turn converted to an earnings multiplier as shown in figure 3-7. The multiple range will vary from one product category to another and also vary over time. According to Kapferer (1992, p.295), P/E ratio2 of companies with the closest comparable brands are used to decide the maximum multiple (the minimum multiple is always zero). Interbrand notes that the relationship between brand strength and brand value follows a normal distribution and is represented by a classic S-curve as a result of three factors:
· As a brand’s strength increases from zero (an unknown or new brand) to a position as a number three or four brand in a market the brand value increases gradually.
· As a brand moves into the number one or two position in its market there is an exponential effect on its brand value.
· Once a brand is established as a powerful world brand its value no longer increases at the same exponential rate.
BRAND STRENGTH
0 100
MULTIPLE
YA
YB
8064
Figure 3-7. Multiple applied (fictional)Reference: Lin 1993, p.72 (modified)
The earnings multiple in turn will be multiplied with the brand related earnings to calculate the value of the brand as shown below with our fictive brands A and B. Brand earnings are normally calculated as a three-year weighted average of historical profits attributable to the brand. The weighted average takes into account the most and the least representative years.
Brand A value: Brand earnings * YABrand B value: Brand earnings * YB
Our criticisms of the Interbrand model are two-fold. Firstly, brand earnings are based on a weighted average of historical profits, and do not take future profit potential into account. Secondly, the range of the earning multiple is based on a lot of assumptions. These assumptions must, indeed, be carefully analyzed because the multiple is critical when the brand value is calculated. A small variation in the chosen multiple may lead to huge differences in brand value.
3.4.5 Summary brand measurement theory
We believe that most brand equity measurement methods presented in the academic literature are theoretically attractive but not necessarily practically useful. To present a theoretical method is one thing, to implement it and make it operational in a company is another.
2 P/E = Price/Earnings. The stock market often judge a firm’s financial performance by its P/E ratio. A high ratio signals shareholders confidence and optimism in increased future benefits.

Chapter Four Empirical Data
4 EMPIRICAL DATA
4.1 INTRODUCTION
This thesis is about brands in general and the measurement of brand equity in particular. Closely related to measurement of brand equity is brand management in general. It is difficult to understand brand measurement without also understanding brand management. Therefore, this chapter covers both brand management and brand measurement in the four companies included in our case study. The chapter is subdivided into four major items, each covering one of the companies: Astra, Electrolux, Ericsson and Volvo.
The empirical data presented in this chapter will, together with previous theory chapter, form the foundation of our analysis in the following chapter as well as our conclusions and recommendations in chapter six.
4.2 ASTRA
4.2.1 General
We have chosen to look at Astra with two different perspectives - complex products to intermediary customers which is represented by the R&D company Astra Draco (drugs that require prescription). The second perspective is non-complex products to consumers which is represented by Astra Draco Läkemedel AB (drugs that do not require prescription).
The empirical data covering Astra is the result of two interviews. The first interview was made with Johan Haglund, Director Market Research & Strategy at Astra Draco, December 10, 1998. The interview was made at Astra Draco in Lund. The second interview was made with Inga-Lill Forslund Larsson, Market manager Nordic Astra Draco Läkemedel AB for non-prescription pharmaceuticals. The interview was made over telephone December 22, 1998.
Astra is an international pharmaceutical company and was founded in 1913. The company started its export in 1934 and the first two export markets were Finland and Latvia. Production is mainly located in Sweden but production subsidiaries exists world wide. R&D activities are conducted by five research units in Sweden and the U.K. Marketing is conducted through marketing companies in approximately 45 countries but also through agents and licensees.

Net sales in 1997 amounted to almost 45 000 million SEK. The number of employees amounts to approximately 22 000, of whom 67% are working outside Sweden (Astra annual report 1997).
4.2.2 Brand management at Astra
Astra has a large number of different brands in its product portfolio. The company strongly believes in individual, product or solo branding. A unique brand is used for every single drug in the company’s product portfolio. The product branding strategy can be traced back to extensive co-operations between the Astra headquarters and external consultants specialized in communication. The idea is to overcome the ”noise” in the media channels of today. Astra recognizes that consumers are showered every day with different messages from a great number of suppliers and the human brain will therefore be selective in the way it collects information. Because of this, Astra believes that the company should primarily communicate the product brand name, for example ”Losec” or ”Pulmicort”. The corporate name, Astra, is of secondary importance. The focus on the product brand name is evident in the whole medicine branch and has clearly affected the customers. For example, ”Bricanyl”, a drug used by allergy sufferers, was introduced in 1970. In 1985, 15 years after the product launch, only 25% of the doctors asked knew that the product was developed and manufactured by Astra even though the drug was frequently prescribed by the same doctors!
The brand situation is somewhat special for a company acting in the medicine branch compared to companies acting in almost any other branch because drugs are surrounded by strict rules in every country. Typically, it is not enough to legally protect your brand but it must also pass the medical authority of every country to ensure that the brand is distinct and could not be mistaken for any other drug available on the market. Consequently, these circumstances affect the way a brand is managed in a medicine company. Brand management at Astra makes a lot of effort in finding the right brand name before the product is launched. The different R&D companies of Astra; Astra Arcus, Astra Draco, Astra Charnwood, Astra Hässle and Astra Pain Control are each responsible for the development of different brands before the launch of the product. After the product is launched, the R&D companies together with the different market companies form so called reference groups and run joint studies on how the brands are perceived and used in the local market.
Astra does not recognize any core brand values common to all products offered to the market. Instead, the company analyze the specific disease area at hand and decides the brand values important for that particular area. The only common brand value factor applicable to all disease areas could probably be efficiency; the drug must show effective results. However, it is important that the values associated with the brand are recognized as being advantageous by the customer. The statements below illustrate, to some extent, the Astra view of a brand (Johan Haglund, Director Market Research & Strategy at Astra Draco):
”The brand name should be unique”.
”The brand should, as much as possible, be separated from the name of the medical substance in the drug”. (Low priced copies often base their brand name on the medical substance - our remark).
”The general practitioner responsible for prescription should remember the brand and the brand name should be easy to write”.
4.2.3 Astra Draco
Our first case study was conducted at Astra Draco, a R&D company handling primarily drugs that require prescriptions in most countries. Our choice of company was deliberate because we wanted

to find out how a company having an ”intermediary” as a target customer manage and measure its brand. We use the term intermediary as an appellation of doctors or so called general practitioners. From a medicine company’s view, the doctor’s role is quite special. The doctor is considered as the customer even though he or she does not use the drug nor pays for it. Consequently, the brand should affect the intermediary - not the actual end user (the patient).
President and CEO
Corporate Support
Finance &Control
Marketing Research &Development
Manufacturing& Logistics
Astra Tech
Astra Arcus
Astra Charnwood
Astra Draco
Astra Hässle
Astra PainControl
R&D Support
Figure 4-1. Astra Organization 1998. Reference: Astra Annual Report 1997, p.64f (modified).
It is of utmost importance to influence key persons when building a medical brand. The strategy is to affect opinion leaders such as medical professors. The opinion leaders will, in turn, affect medical specialists who typically decide the appropriate drugs for general practitioners to use in the treatment of patients. It should be noted that Astra does not try to influence the end consumer (the patient), the focus is only on medical professionals regarding drugs requiring a prescription. The ”influence pyramid” is shown in figure 4-2 below.
OPINIONLEADERS
MEDICAL SPECIALISTS
GENERAL PRACTITIONERS
Influence
Influence
END CUSTOMER (PATIENT)
PRESCRIPTION
ASTRA BRAND
Figure 4-2. Influence in the medical branch.
4.2.4 Brand measurement at Astra Draco
Brand measurement at Astra could be described as a two step process.

First, the focus is set on the brand name before the product is actually launched in the market. Considering the three Astra statements mentioned earlier, the task of giving a product a brand name is somewhat complicated. Astra Draco brand management have the aim to give a brand name to the product that will reflect the use of the medicine or have some other logical connection that will facilitate for the doctors to think of the brand when treating the patient. The brand name given should be easy to remember, easy to write and also accepted by different cultures. Doctors typically write the subscriptions manually and often, according to Astra, prescribe the medicine that comes top-of-mind. This initial brand measuring task is performed by using surveys covering doctors and medical specialists. A list of names are presented to the respondent, which can talk freely about the associations and perceptions the names gives. The aim is to determine which brand name will give the respondent proper associations and which brand name they most easily remember. The most successful brand name identified in the surveys will be the name preferred.
Secondly, once Astra Draco have decided a brand name, the next step is taken in the brand measuring process, and now the local companies take over the brand measurement task. The aim of the local company is typically to measure brand awareness of the company’s products in the local market. The surveys include various brands manufactured by Astra as well as competing brands. The surveys only measure the product brand names and do not include the company name Astra. They cover medical professionals and are conducted by a local external survey institute. Telephone interviews are the normal procedure, but personal interviews are also used to some extent. The questionnaire used is jointly created by Astra and the local survey institute and the questions used are typically “open”, i.e. respondents can talk freely about a given subject.
4.2.5 Astra Draco Läkemedel AB
Our second case study concerns Astra Draco Läkemedel, a marketing company handling primarily drugs that do not require a prescription. Consequently the target market of the company is the every day consumer. Non-prescription drugs are indeed interesting to examine from a brand perspective. For example, the pain killer Alvedon’s active substance is paracetamol, a substance that is a commodity in the branch. From a medical point of view, there are no differences whatsoever between the different products in this area. That is, Panodil, Curadon, Alvedon and other paracetomol based pain killers are identical. Despite this fact, there are certain brands that enjoys higher market shares and are priced higher. Could the brand make the difference?
The Astra Draco Läkemedel AB organization can be found in the “Marketing box” illustrated in figure 4-1.
4.2.6 Brand measurement at Astra Draco Läkemedel AB
Astra Draco Läkemedel AB measures brands that are used on the market for non-prescriptive drugs. These drugs are sold to the every day consumer. Astra only use survey research when measuring their brands. Different variables of brand equity are measured but awareness and consumer perception are considered as the most important factors to include. Especially top of mind awareness is considered as an important factor. Even though some variables are considered more important than others, weighting is not used when the result is compiled. The surveys are bought from an external survey institute and are typically conducted once a year and competing brands are always included. This will facilitate the monitoring of own brand strength over time versus competing brands. The respondents are randomly chosen consumers.
Astra Draco Läkemedel AB also conducted a survey on the corporate brand name Astra in the Nordic countries in the spring of 1998. The aim was to identify how well the brand Astra has been established in the mind of consumers. The survey conducted on the corporate brand name revealed

that the brand Astra had the highest awareness level compared to the competitors. However, since Astra is currently discussing a merger with Zeneca, the corporate brand will change and some of the goodwill it generates could be lost. It should be noted that measurement of the corporate brand is not done on a regular basis. First and foremost, only individual product brands are measured. The corporate brand Astra is of secondary importance for non-prescriptive drugs. A perspective also shared by Astra brand managers handling prescriptive drugs as described above.
4.2.7 Summary
Astra solely pursues a product branding strategy, a unique brand is used for every single drug in the product portfolio. The corporate brand name, Astra, is of secondary importance. The product brand name is of utmost importance in the medicine branch. The brand name should not only be legally protected but also provide a distinct difference from other drugs available.
Once a brand name has been established, the local companies takes over the brand measurement task. Typically, brand awareness is the variable examined. The surveys only include product brand names and usually do not include the corporate brand name Astra.
4.3 ELECTROLUX
The information in this item rests heavily on an interview with Electrolux director of brand marketing, Fredrik Janson, December 4, 1998. The interview took place at the Electrolux head office at Lilla Essingen, Stockholm.
4.3.1 General
The origins of Electrolux can be traced back to the introduction of the vacuum cleaner and a marketing genius named Axel Wenner-Gren. In 1912, Axel Wenner-Gren presented the world’s first household vacuum cleaner and Electrolux started its quest to be the world’s leading producer of household appliances. Today, operations in Electrolux are geographically widespread, with 95% of sales and 90% of employees outside Sweden.
Electrolux extensive product portfolio consists of refrigerators, freezers, cookers, washing machines (white goods), chain saws and lawn movers etc. The company is the European market leader in white goods while holding the number three position in the U.S. Major brands included in the Electrolux group are AEG, Zanussi, Volta, LUX, Husqvarna, Kelvinator and others.
Net sales in 1997 amounted to 113 000 million SEK. The company had approximately 106 000 employees by the turn of the year 1996/1997 and operates companies in 65 countries (Electrolux annual report 1997).
The Electrolux organization valid from May 1997 consists of six business sectors as shown in figure 4-3. Brand managers exists in three of the business sectors: Europe, North America and New markets. The different business sectors cooperate in different branding issues. The cooperation between brand managers in the Europe and New markets sectors is especially apparent. Our case study was conducted at New markets business sector, a unit covering Asia, Latin America, Africa and the Middle East.

President and CEO
Staffs
White goodsEurope
White goodsand outdoor prod.North America
New markets,ComponentsDirect sales
Professionalappliances
Outdoorproducts
Floor-care, Leisure and com-plementary prod.
Figure 4-3. Electrolux group organizationReference: Electrolux annual report 1997, p.56 (modified)
4.3.2 Brand management at Electrolux
Branding was recognized early as an important issue at Electrolux, primarily because the company was competing in the consumer segments of the market. According to Electrolux, branding starts with the actual segmenting of the market. A company has to investigate who buys the product, why he or she buys the product and what the consumer expect to accomplish with the product. Also the context is important - how, when, where. The many acquisitions around the globe have given the Electrolux group a large number of different brands. The acquisitions also resulted in solo branding with each separate product line in the product portfolio having its unique name and symbol. The advantage with this approach was that a possible failure of one product did not necessarily damage the corporate brand. However, today Electrolux recognizes that the advantages of solo branding probably are outweighed by the advantages in a strong corporate brand. The marketplace has become more competitive and more brands are competing in a crowded market resulting in a dramatic inflation of advertising costs and difficulties for a single brand to survive. Due to this, Electrolux plans to gradually move from a solo branding approach to a family branding approach. Consequently, the company will move from product branding to more actively promote the corporate brand as illustrated by figure 4-4 below.
Corporatebranding
Fewer brands
More brands
Productbranding
Hallmark branding BrandExtensions
Family branding Solo branding
Figure 4-4. Approaches to branding.Reference: Electrolux Overhead (modified).

(Hallmark branding is described by Electrolux as a practice where only the corporate brand name is used. For example ABB and General Electric put the corporate brand on every building, car and letter head. A brand extension is when a company uses an established brand name to introduce a new product). Electrolux stresses the fact that the move from solo branding to family branding is a two step process, probably lasting several years. For example, today the brand ”Kelvinator” is used in the U.S. This will gradually change to ”Kelvinator by Electrolux” in the first step. The second step is a combination of a parent brand and an offspring brand and the end result in our example will read ”Electrolux Kelvinator”. See figure 4-5 below.
Also, the company’s ambition is to build brands so that different key values will be associated with the parent brand compared to the offspring brand. In general, the parent brand should be associated with ”basic values” while the offspring brand should be associated with ”differentiation values”. Electrolux is currently trying to identify the key brand values. Until today, the company has trusted seven values used for building a ”power brand”: quality, leader, trustworthy, area of excellence, familiar, relevance and differentiation. The different brand roles are illustrated in figure 4-5.
Kelvinator
Kelvinatorby Electrolux
ElectroluxKelvinator
Parent brand• Familiarity•Quality•Leadership•Trustworthy•Area of Excellence
Offspring brand• Relevance•Differentiation
Figure 4-5. Family branding and brand roles for family brands.Reference: Electrolux Overhead (modified).
4.3.3 Brand measurement at Electrolux
Electrolux has almost 300 brands in its product portfolio and different combinations of selected brands are represented in each country. Electrolux has not implemented any specific aim or method for measuring the brand equity, however the company only uses survey research when measuring its brands. The brands used in different markets are measured locally by the subsidiaries, who also determines the brand equity variables that are the most important to measure. The variables used in the surveys are established internally and are typically the same in every survey. Though variables are locally determined, the two variables awareness and image are typically included in the surveys. Awareness is measured in different levels; “top of mind”, “total unaided” and “total awareness”, but local divergence may occur.
· Top of mind - The first brand that comes to mind for the respondent.· Total unaided - Reflecting the abilities of consumers to retrieve the brand without any cue given.· Total awareness - What the respondent knows and thinks of the brand.
The questionnaire used in the survey is created by the local subsidiary and is basically not changed between surveys. However, different questionnaires are used in different countries. A local customer survey institute is engaged for the collection of data. Two different approaches are used, telephone interviews and door-to-door interviews. The local competitors are included in the survey

for easy comparisons of the relative brand strength. The respondents are to some extent selected, i.e. they are randomly chosen within a specific segment.
The brand surveys are performed regularly on a yearly basis. A survey takes approximately 1 ½ months to be accomplished. The relative short time is due to the fact that the surveys are performed identically each time by the subsidiaries. Another advantage with using the same approach is that the development of own brands and brands of competitors can be monitored over time. To make comparisons over time facilitates the evaluation of the success or failure of own and competitor’s brand strategies. Each brand variable score is presented separately along with the competitor’s score for easy comparison. Electrolux does not weigh the variables according to relevance and they are not combined into a single brand equity index.
Since each market has its specific set of brands and because various approaches, questions and variables are considered in the different subsidiaries when measuring brand equity, it is not possible to make comparisons between different countries. However, Electrolux stresses that close contacts with other markets brand management can provide the local management with useful information.
Brand management at Electrolux has the ambition to develop a “brand score card” that will be implemented in all the markets and used for all the brands. The brand score card is a set of variables that all the brands should be measured upon. The reason for implementing the score card is due to the insight that Electrolux do not have the resources to maintain close to 300 brands in over 100 countries. Brands that do not provide sufficient value will not be retained in the long run. The use of a single method, namely the brand score card, for all the markets and brands will help brand management to evaluate which brands to maintain and which to abandon.
4.3.4 Summary
The many acquisitions worldwide have given Electrolux a large number of different brands to maintain in the company’s product portfolio. The acquisitions also resulted in product branding, an approach now recognized by Electrolux as less efficient compared to corporate branding. Because of this, Electrolux will move from solo branding to family branding and thus promote the corporate brand more aggressively.
To measure 300 different brands which are spread over 100 countries is a delicate task. Electrolux has chosen to let the local subsidiaries measure the company’s brands that are held in the specific market. No doubt are the subsidiaries the most appropriate for this task since they have the best knowledge about the local market. Electrolux has not implemented any specific aim or method for measuring brands which leads to different measurement methods for different subsidiaries. However, once the survey approach has been determined, the subsidiaries will most often use the method consistently. Local brand management can then monitor the development of the brands in the market. The results of the brand surveys have, until recently, been of interest primarily for the local subsidiary which has used the information for correction of market activities etc. to gain brand strength. However, since Electrolux has come to the insight that the company should concentrate its resources on fewer brands, the surveys done locally have increased in importance because they provide insight in which brand to maintain and which to abandon.
4.4 ERICSSON
The information in this item is the result of an interview with Ericsson brand manager Anna-Karin Klinteskog, December 2, 1998. The interview was made at the Ericsson office at Telefonplan, Stockholm.

4.4.1 General
Ericsson was founded by Lars Magnus Ericsson in 1876. The first Ericsson desk telephone with handset, designed in 1892 started the company’s dramatic expansion. As part of Ericsson’s swift expansion, the company began to operate public telephone networks in various parts of the world, including Mexico, Poland, Italy, Brazil and Argentina. (Today, the company is only acting as a supplier). In 1926, when Lars Magnus Ericsson died, Ericsson was already a truly international company with 80% of sales outside Sweden.
Ericsson is an international leader in telecommunications, supplying stationary and mobile telecommunication systems for public and private networks as well as mobile phones and terminals. Ericsson relies more on international sales compared to the major competitors Alcatel, Lucent, Motorola, Nokia, Siemens and others. More than 94% of the company’s revenues was generated from markets outside Sweden in 1997 (Ericsson annual report 1997).
Net sales in 1997 amounted to 167 740 million SEK. The company has more than 100 000 employees and is active in more than 125 countries (Ericsson annual report 1997).
4.4.2 Ericsson B2B
The new Ericsson organization (valid from October 1998) is of matrix design. Essentially, the Ericsson matrix combines two forms of departmentalization - geographical markets and target customers. The new organization could be characterized as customer oriented. Our case study was conducted at Ericsson Public Networks, a so called business unit focusing on network operators like Telia and British Telecom and offering equipment for fixed public and private networks. The new Ericsson organization is illustrated in figure 4-6 below, BU is a business unit and those are supported by product units (PU) while market units (MU) are the different local companies around the globe.
Customer
New organization
BU
Business segment Market areas
Defense Cables Components
C E T
Asia & OceaniaNetwork Operators
Europe, Mid. East & AfricaEnterprise Solutions
Latin AmericaConsumer Products
North America
PU MU
Figure 4-6. Ericsson organization.Reference: www.ericsson.se
We deliberately focused on Ericsson Public Networks because our interest was to study brand measurements in a MNC targeting business or industry customers, so called business-to-business, B2B or Biz-to-Biz practicing. Norrbom (1996, p.4ff) characterize B2B-Marketing as an area where the buyer is an organization and the buyer use the product in his own production or use the product for sale to another organization. Specific characteristics of B2B-marketing are, among others:
· Few buyers.· Large purchases.

· Close relationships between supplier and customer.· Professional purchases.· Buyers not always price sensitive, other factors might be considered more important.
4.4.3 Brand management at Ericsson
Branding is considered as a key marketing tool at Ericsson, because a strong brand does not only attract new and existing customers, it also attracts first class partners. Today, Ericsson has fruitful co-operations with world class companies such as IBM, Texas Instruments and Hewlett-Packard. In part, these partnerships are possible because of the strong Ericsson brand.
Branding as a concept was discovered as an important issue at Ericsson Public Networks in the mid 1980s. The eighties was characterized by the liberalization of many telephone markets. Historically, most telephone markets worldwide were monopolized with one government owned telephone network operator having 100% of the market (compare to former Swedish Televerket). Competitors were effectively prevented from entering the telecommunication market. However, the liberalization wave in the 1980s with governments promoting competition led to the entering of many new players at the telecommunication scene. This development had implications for the management of the Ericsson brand. Before, traditional operators were primarily focused on the product and strong relationships with the customers were a prerequisite for the supplier’s success. Also the number of operators were limited. Now, the second and third operators of a country (for example Tele2 and Europolitan of Sweden) are primarily led by businessmen interested in the financial bottom line result. Products and functions are only interesting as a way of securing future profits. Because of this boom of new operators, the Ericsson brand has become even more important. Today, it is not enough for suppliers to trust old relationships and advanced products - aggressive promotion of the company brand has become a must!
Mats Rönne, corporate brand manager at Ericsson states (Dagens Nyheter 1998.06.02):
”The brand is the product and the supplier”.
It was soon evident that the Ericsson brand had to be strengthen. In the mid 1980s, even the product name AXE3 had, somewhat surprisingly, a higher awareness score than the company name Ericsson. Furthermore, AXE and Ericsson were well known within the telecommunications sector but was unknown to the public. The high awareness score within the telecommunication sector was primarily due to the company’s geographical spread, superior products and the good customer relations established – not because of the brand.
The Ericsson brand platform was developed five years ago. The brand platform describes in a structured way the expectations and demands of the market and what it takes for Ericsson to fulfill those demands. The brand platform was developed in a three step process. This involved (Ericsson SnapShot 2/98):
1. Identification of the values that the customer associates with the brand.2. Identification of the values that gives Ericsson the edge on their competitors.3. Identification of the values that are consistent with Ericsson’s business strategy.
The six key brand values identified by Ericsson are (Ericsson Kontakten special, oktober 1998): simplicity, reliability, co-operation, innovation, ambition and independent. The key brand values are, in turn, communicated to the customers by the use of four different communication carriers: products, communication, culture and distribution as illustrated by figure 4-
3 AXE is the product name of a public switch sold to 125 countries worldwide.

7 below. The brand platform is in the middle of the communication carriers and should influence all aspects of the four carriers. For example, simplicity, one of the key brand values, does not only mean that Ericsson products should be easy to operate but also that simplicity should be reflected in the remaining three communication carriers. It should be easy and convenient to find the Ericsson products and services (distribution), the Ericsson corporate culture should be characterized by simplicity and finally all employees of Ericsson must communicate simplicity in their wheeling and dealing with sources outside the corporate walls.
Products Communication
Culture Distribution
BrandPlatform
Figure 4-7. The communication carriers.
4.4.4 Brand measurement at Ericsson
To measure how the Ericsson brand is perceived by the customers brand management engage an external customer survey institute, for instance SIFO4. The variables that are examined to determine Ericsson’s brand position are typically the differentiating values as presented below in figure 4-8. Other variables that are measured are brand awareness, customer loyalty and customer satisfaction. Also, brand management have the aim to measure to what extent Ericsson’s key brand values have been established in the minds of their customers. The surveys typically involve competitor’s brands to establish how Ericsson is perceived in relation to other companies competing in the same markets and offering similar products.
Ericsson have identified a ranking of potential brand values. Figure 4-8 below illustrates what values that are considered as differentiating values and what values that are considered as threshold values by the customers. The threshold values are the basic values that the brand must hold, otherwise it will not even be considered in the customer’s purchase process. The differentiating values are those values that Ericsson believe should differentiate the brand from its competitors.
THRESHOLD VALUES
DIFFERENTIATING VALUES
INTEGRITYFULFILLMENTCO-OPERATIONFUNCTIONALITY
CREATIVITY
UP-TO-DATE
DEPENDABILITY
COMMITMENT
Figure 4-8. Ranking of potential brand values.
4 Former known as “The Swedish Institute For Opinion surveys” (our translation).

Reference: Ericsson Overhead
The questionnaire used in the surveys are created by the engaged survey institute and telephone interviews are the normal procedure used by the institute to contact the respondents. The questions are typically covering how the respondent rates different companies in the market in a given set of matters. A scale may be used asking the customer to rate a given variable from, for example, very unsatisfied to unsatisfied, satisfied or very satisfied. Ericsson has not implemented any specific aim or single method when measuring the brand position over time. The questions are changed in every survey and the variables examined may be changed to some extent as well. The respondents are a selected target group, typically customers involved in the operators purchase and evaluation process concerning new telecommunication equipment. The number of respondents and their origin may vary from study to study. One of the latest studies involved respondents in Ericsson’s key-markets in 29 countries (Ericsson Kontakten nr 8 1998). This survey concluded that the Ericsson brand is perceived as market leader by the operators in Europe and Latin America while in the brand is rather unknown in the U.S. In Asia, Ericsson captured the number two position, close to the perceived market leader Motorola.
The brand surveys do not follow any specific time-plan and could be done on a 9,12 or even 24 month basis. The estimated time for finishing a brand survey ranges from 6 to 9 months depending on how many variables and markets that are about to be examined. Brand management in Ericsson is aiming to reduce the time for the surveys. This due to the fact that the data presented could be as much as 6 months old when finally compiled and therefore could be somewhat deceptive.
4.4.5 Summary
Branding is considered as a key marketing tool by Ericsson because a strong brand is a prerequisite for attracting new customers and existing customers as well as first class partners. Six key brand values are identified by Ericsson, forming the company’s brand platform: simplicity, reliability, co-operation, innovation, ambition and independent.
Ericsson does not practice a specific or single survey and therefore the results from different surveys will vary and are not easy to compare between different countries and over time. The different variables included in a survey are presented along with its competitors when possible for easy comparisons. The variables are not weighted and the results are not combined into a single brand equity index. The survey results are presented for various management levels in the company. Unfortunately, not all brand information lead to appropriate management actions. Some managers have a tendency to view brand measurements as a ”nice to know” information.
4.5 VOLVO
The information included in this item is the result of an interview with Leif Ahlberg, Vice President Brand Management at Volvo, performed December 11, 1998. The interview was made at the Volvo head office at Hisingen in Gothenburg.
4.5.1 General
Volvo was incorporated in 1915 as a subsidiary of SKF5, the Swedish ball bearing manufacturer. The Volvo group, which was founded by Assar Gabrielsson and Gustaf Larson in 1927, today has more than 70 000 employees. The Volvo group is truly international with a worldwide marketing organization and production in 30 countries. Net sales in 1997 amounted to 183 000 million SEK
5 Svenska Kullager Fabriken, The Swedish ball bearing factory

where business area cars strongly contributed to the growth, having more than 50% of sales (Volvo annual report 1997).
Volvo is an international transport equipment group supplying cars, trucks, buses, construction equipment, aero-, marine- and industrial engines. Volvo is a well-known company, strongly identified with safety and quality. However, the company is a relative small player and the competition within the transport equipment industry is severe and the market is under strong price pressure. Therefore, Volvo has to grow and the company is currently increasing its presence in markets such as Eastern Europe and Latin America. Volvo is positioned as a ”top of the line” product and the company is not interested in low priced volume sales. A Volvo should be considered as ”best in class”.
The Volvo group consists of 6 business areas; Cars, Trucks, Buses, Construction equipment, Marine and industrial engines and Aero. Our case study was conducted at the corporate level. The corporate brand management function is responsible for, among others, the Volvo brand management policy as well as the Volvo core value policy. Our interest was primarily to study brand measurements in the consumer segment (read business area cars and to some extent business area marine engines) but the interview was performed at corporate level. However, brand policies outlined by corporate brand management must be adhered to by the different business areas. Therefore, our case study is valid also for consumer products.
4.5.2 Brand management at Volvo
Volvo early recognized the importance of a strong brand. Much because of this early insight, Volvo is today one of the world’s best known brand names. According to the company, its success lies in the ability to ensure that the Volvo brand remains distinct, trustworthy and differentiated.
”The overriding aim of the Volvo Brand Management Policy is simply to make absolutely sure that the Volvo brand, based on its core values, retains its distinctive and differentiating position in the hearts and minds of its target audiences”. (Volvo, The Volvo Brand Management Policy, p.20).
The Volvo brand is based on a basic platform - the Volvo core values - Quality, Safety and Environment. The Volvo core values have been nurtured over decades. For example, already from the very beginning back in 1927, quality and safety were recognized by Volvo as the basic principles guiding a successful car manufacturer:
”An automobile is made by and for people. The basic principle for all manufacturing is and must remain: safety….On this point, we are proud to be conservative. And even in the future this will remain our guiding light”.(Assar Gabrielsson and Gustaf Larson, the founding fathers of Volvo).
The three core values are considered as the foundation of Volvo’s competitive advantage, ensuring that Volvo stands out from the competition. The core values express what the Volvo organization believes in and a holistic view is emphasized - the mutual values and the Volvo brand is something that every employee must understand and communicate to the outside world. All three core values are emphasized in the company’s brand strategy:
”Based on customer-perceived quality and achievements, Volvo will distinctly, decisively and consistently- sustain and develop its brand position as a recognized leader in safety and…- be ranked as a leader in terms of environmental care among the world’s top producers of automotive and transport products, equipment and systems”. (Volvo, The Volvo Brand Management Policy, p.20)

The three core values guides brand management in all business areas of Volvo but each business area also use other brand values in tune with the Volvo brand, so called extended brand values. Extended values are necessary because of the breadth of the company’s product portfolio, resulting in very different target customers for different business areas. The extended values are developed in harmony with the three basic core values and the goal is to provide both credibility and a valued offer as illustrated in figure 4-9 below:
CORPORATEPOSITIONING
PRODUCTPOSITIONING
Brand Positioning Corporate Image Building PROVIDE CREDIBILITY
Product Image Building PROVIDE VALUE OFFER
COREVALUES
Extended valuesExtended
values
Extended values
Figure 4-9. The core and extended values.Reference: Volvo, The Volvo Brand Management Policy, p.19.
4.5.3 Brand measurement at Volvo
Corporate brand management at Volvo measure the three core values that work as a guideline for the whole company and should be reflected by the brand regardless of whether the product is a car, truck, bus, engine or anything else produced by the company. The surveys are conducted by the local companies in different countries and the three core values are measured as well as other variables that are of interest. The surveys’ results considering safety, quality and environment are reported to corporate brand management which will compile the results from each market to an overall total score valid for the whole company. The latest study that measured the company’s three mutual values covered 21 countries and 500-600 randomly chosen respondents in each country.
Different surveys are performed for each business area. For example, if Volvo PV (cars) makes a survey the respondents are asked to rank car producers given the three core variables. If Volvo trucks conduct a survey, the respondents are asked to rank truck producers on the same three variables and so on for each business area. The questions that consider the core values are of open type, that is the respondents are encouraged to rank brands according to each core value without any predetermined alternatives of supplier given. If Volvo is not ranked among the five suppliers first mentioned by the respondents, the score for the Volvo brand is considered as zero. When given open questions every survey automatically includes competitors, a factor brand management at Volvo monitors carefully.
The score of the three core values are presented individually and compared to the score of the competitors. Since the variables and the questions are the same each time, it is easy to make comparisons over time. Volvo does not weigh the variables according to relevance and they are not combined into a single brand equity index. The survey results are presented to various management levels in the company.
Brand management has not done any attempt to set a monetary value of the brand nor to include the brand in the balance sheet. According to Volvo, a monetary value of the brand in the balance sheet is of no interest because of two reasons. First, any figure given in the balance sheet should be detailed and have an objective value. The value of a brand could probably never be objectively established. Secondly, the balance sheet only show a snapshot of reality at a certain moment in time, not necessarily valid tomorrow or the day after tomorrow. However, the value of a brand rest heavily on the revenues it will generate in the future.
4.5.4 Summary
Volvo early recognized the importance of a strong brand. Probably much because of this early insight Volvo is today one of the world’s best known brands. The Volvo brand is based on three core values, Quality, Safety and Environment. The three core values guides brand management in all business areas of Volvo. Volvo stresses the fact that the brand’s strength lies in what you (your company) are, not in what you say you are. Brand strength is something you earn!
Brand measurement at Volvo is coordinated at corporate level. However, corporate brand management does not conduct surveys themselves since the core values are measured by local Volvo companies in different countries. The local companies report the score to corporate brand management which will compile and analyze the results. The variables are not weighted and the results are not combined into a single brand equity score. The outcome of the surveys is presented for various management levels in the company.

Chapter Five Analysis
5 ANALYSIS
5.1 INTRODUCTION
This chapter will examine the theory presented in chapter three as well as the empirical data covered in chapter four. The chapter includes an analysis of both measurement of brand equity in theory as well as measurement of brand equity in practice. The goal of the chapter is to highlight pros and cons of different brand equity measurement methods. Also some possible business blindspots in Astra, Electrolux, Ericsson and Volvo are spotted.
5.2 THEORY ANALYSIS
In this section we will analyze the different theoretical methods for measuring brand equity presented in chapter three. The theoretical methods will, in turn, be compared to the practical use of brand equity measurement methods performed by the companies examined. The problem definition below will form the foundation of the analysis.
How should a company measure the value of its brand? What brand equity variables should be considered and how should the variables be measured?
Brand equity is an abstract value that the different measurement methods try to concretize. To facilitate for the reader what value that is sought-after we again present the definitions of brand equity.
”Brand equity relates to the fact that different outcomes result from the marketing of a product or service because of its brand name or some other brand element, as compared to outcomes if that same product or service did not have that brand identification” (Keller 1998, p.42).
”Brand equity is a set of brand assets and liabilities linked to a brand, its name and symbol, that add to or subtract from the value provided by a product or service to a firm and/or to that firm’s customers” (Aaker 1991, p.15).
”Brand equity is the added value with which a given brand endows a product ” (Farquhar 1990, p.RC-7).
We have presented a variety of methods on how brand equity could be measured and valued. In chapter three we divided the different types of brand equity measures into two major approaches; separate brand equity measures (item 3.4.3) and combined equity measures (item 3.4.4) to facilitate understanding of the theory. However, other divisions of the different measurement methods can be made. To facilitate comparisons and highlight pros and cons we have chosen to illustrate the different measurement methods in diagrams shown below in figure 5-1. It should be noted that the different

dimensions in the diagrams are arbitrary chosen but all make up important factors for a company to consider when performing brand equity measurements.
The left diagram show whether the measurement method is based on qualitative or quantitative data and whether the measurement method is fast or slow to perform. The diagram shows that the majority of the theoretical measurement methods are time consuming. Furthermore, the measurement methods are evenly distributed among the qualitative and quantitative dimensions. The Income Approach and Interbrand Model are based on variables that have easy accessible information, not based on time consuming surveys. Therefore the left diagram suggests that they also are the fastest to perform.
The diagram on the right illustrates that the measurement methods that are based on surveys also are the most expensive to perform. The diagram also shows that a majority of the measurement methods only include one variable.
FAST PRACTICABLE
SLOW PRACTICABLE
QUALITATIVEMEASURE
QUANTITATIVEMEASURE
EXPENSIVETO PERFORM
LESS EXPENSIVETO PERFORM
MANY VARIABLES MEASURED
FEW VARIABLES MEASURED
Free AssociationsProjective Techniques
Brand PersonalityAwareness
Comparative Methods
Conjoint Analysis Residual Approach
Cost MethodMarket Method
Income Approach
Y&REquitrend
Brand Equity Ten
Interbrand Model
Brand PersonalityFree Associations
Projective TechniquesAwareness
Comparative MethodsConjoint Analysis
Residual Approach
Cost MethodMarket Method
Income Approach
Y&REquitrendBrand Equity Ten
Interbrand Model
Figure 5-1. Theoretical Brand equity measurement methods.
Upon analyzing the measurement methods further it is also possible to identify three different perspectives depending on the intentions for measuring brand equity. One can find three different perspectives, the purchaser’s, the accountant’s, and the brand management’s perspective. The reason for doing this division is due to the fact that the answer to our problem definition stated above depends on which perspectives and for what reason one is measuring brand equity. For example, a fair value of a brand valid for perhaps an accountant may neither be valid for a purchaser nor a brand manager.
If having a purchaser perspective you are about to buy a company along with its brand or brands. The purchaser is interested in what the brand could capitalize in future cash flows and consequently use an income approach (item 3.4.3.10) to establish what a fair price would be of the brand today. The purchaser perspective has the advantage of concentrating on future value which is, in fact, the value that is of main interest when measuring brand equity. However, the outcome of this valuation approach will fluctuate heavily depending on who makes the evaluation. The reason for this is that different purchasers have different future strategies for the brand such as introducing it to new markets, on new products or with a new image. An example of the large fluctuations when measuring brands with a purchaser perspective is the selling of the British brand “Lanvin”. One bidder company valued the brand to £40 million, while another estimated the value to £1 billion, and a third valued it to £2.4 billion (Kapferer, 92 p.268). One can argue that the price given when a brand is sold is actually the true value of it. However, the great fluctuations in price undermine the validity of this approach.

If having an accountants perspective you seek, as well as the purchaser, a monetary value of the brand. However, an accountant wants a value that can be objectively reassured and therefore most likely value the brand according to historic or replacement costs (item 3.4.3.8) or market value (item 3.4.3.9). The accountants perspective, looking at figures that more or less could be objectively established is a fair method for measuring brand equity in one sense. That is, the figures used can be verified. However, we believe that this brand equity has little to do with the true value of a brand. The brand value lies in the eyes of the consumers and their willingness to pay for it and not in an accumulated post in the company’s balance sheet.
Finally, having a brand manager perspective when measuring brand equity require identification of customers’ perceptions of the brand and how the brand is valued compared to competing brands. This approach typically does not involve quantitative monetary values, but rather qualitative values that will indicate how well the brand is doing against the competition. The brand managers in the companies examined in this report typically use a set of separate brand equity variables which will indicate how the brand is perceived relative to the competitors by the customers. The outcome does not provide us with a monetary value of the brand. However, a strong brand will give the company a leading edge in competition and the opportunity to gain extensive future profits. But, having the strongest of brands does not provide the company extensive profits automatically. The earnings from the brand depends on how well the company will exploit and use that brand strength in the future.
As stated above, we divided the brand equity methods presented in chapter 3 into two major approaches, separate and combined methods. We believe along with Aaker (1996, p.7) and Keller (1998, p.372) that brand equity is a set of assets, not just one asset. This means that using a separate method only measuring one variable, for example Awareness (item 3.4.3.4) and Brand personality (item 3.4.3.3) probably would not provide a fair value of the brand. One could argue that the separate methods trying to establish the price premium a customer is willing to pay for a branded product, such as Comparative methods (item 3.4.3.5), Conjoint analysis (item 3.4.3.6) and the Residual approach (item 3.4.3.7) in fact capture the monetary value that is added by a brand. In theory that is. In practice, these methods are extremely difficult to execute and the outcome bears the stamp of great uncertainty. And, even if giving a rough figure of the price premium that is connected to a brand, these methods do not explain why the customers are ready to pay a price premium.
The combined brand equity methods presented in item 3.4.4 all use a set of different variables in which different brands are ranked upon. All of these methods, except the Interbrand model, let respondents rank the brands according to the variables presented. The Interbrand model (item 3.3.4.4) rank the brands based on information that could be somewhat objectively established, such as geographical spread, leadership and protection. The Interbrand model is the only method that implies that the variables should be weighted according to relevance.
We have two major objections concerning the combined equity measures. First, we believe that different branches are influenced by different variables. We hold it unlikely that the variables examined in one branch and market are valid in all branches and all markets. For example, the variable differentiation may be the key to success in the hi-fi branch but might be of little or no interest when consumers buy a carpet. Second, we believe that the variables used should be weighted according to relevance in every specific branch and specific market. For example, the variable esteem might trigger the success of brands in the U.S. car market whereas it might have little relevance in the Tibetan rice market. We see an overall weakness with both the separate and combined methods. The methods all state what should be measured but most of the methods does not provide information about how it should be measured. That is, how can the user of the method really know that he captures the information needed, for example when doing a survey?
5.3 EMPIRICAL ANALYSIS
5.3.1 General
Clearly, all companies included in our case study have understood the importance of a strong brand. They all recognize that the intangible company brand might be (and probably is) more important than all tangible assets of a company. Furthermore, all four companies recognize the importance of differentiation and that the brand generally is the most important differentiation factor. Without a differentiated offering, a company is likely to drown in the crowded market place of today. Of course, differentiation can be achieved through new product features and innovations but real functional innovation is scarce today. Intense competition reduces the scope for significant advances in product technology. Therefore, a strong brand becomes more and more important in every branch, from high-tech business to shoe lazes.
In spite of the fact that all companies realize the importance of a strong brand, it is questionable how much brand information top management really absorb and if changes in market signals concerning brand equity is really acted upon. Quite naturally, the different companies in our study are all on different development stages. Some have a more developed brand management and brand strategy than others. However, it is important to avoid that branding is treated as just another glossy buzz word. Of course, one has to be realistic. The CEO of every company is overburdened with work and all areas of a company require his or hers attention: finance, marketing, sales, R&D and others. However, the CEO should not be personally involved in every brand decision. A person at vice president level responsible for brand management is a good start for securing one of the most important assets of a company: the brand!
As already mentioned more and more companies offers similar technical solutions and product features. Therefore, the core of the company becomes more important and consequently the core values of the company. The core values reflects the soul of the company and are those attributes and benefits that come to characterize all offerings of a company and with which consumers often have the strongest associations. A company’s core values are the platform from which the company’s brand is based upon. Somewhat surprisingly, not all companies included in our study have a brand platform based on core values from which the brand is built.
Astra does not recognize any core brand values.
Electrolux is currently identifying four key brand values.
Ericsson emphasize professionalism, respect and perseverance as corporate values. Also, six key brand values are identified: simplicity, reliability, cooperation, innovation, ambition and independent.
Volvo strongly emphasize three corporate core values: quality, safety and environment. The Volvo brand is founded on the three core values plus so called extended values developed by each business area. As seen above, the core values building the company brand ranges from zero to six in the studied companies. Because the core values of a company will constantly be challenged it is important that a company does not have too few values. It is the core values that differentiate a company from its competitors and if the competitors copy the core values it will be difficult to stand out from the competition.
It is evident that all four companies are affected by their history and origins and this has affected the companies brand policies of today. For example, the Electrolux historical expansion through acquisitions have led to a broad product portfolio including a vast amount of different brands. And the

founders of Volvo, Assar Gabrielsson and Gustaf Larsson, focused on safety already in 1927. Today, safety is still emphasized as one of the core values building the Volvo brand.
5.3.2 Brand Measurement
To begin with, all four companies included in our case study measure brand equity. Both similarities and differences can be found in the companies measurement methods. Somewhat surprisingly, many common denominators can be found between the companies even though they act in different branches, offer different products and services, have different target customers and act in different markets (to some extent). All four companies use survey studies as the prime method for measuring brand equity. Telephone or personal interview conducted by an external research institute is the common approach used. The brand equity variables measured are typically qualitative such as awareness, loyalty, customer satisfaction etc. The theoretical model best describing this method is probably ”the brand equity ten” by Aaker, see item 3.4.4.3. However, no company measure all the ten brand equity variables presented by Aaker. The studied companies strip the model and only measure the few variables that fits the individual company’s specific context and are recognized as important. No brand equity variables are weighted and all variables are thus considered as equally important.
Some criticism can be made: a survey study is expensive, slow, sometimes inaccurate and also very difficult to perform if you have a company acting in a multitude of markets covering every continent of the world. We believe that especially the time factor is crucial. A survey study takes time and information is a perishable like bread and diary products, it turns old very fast and old information is of none or minor interest. Would you like to have yesterday’s bread? There is a risk that the brand equity information may be several months old when finally presented and sudden trends and changes in the market will be almost impossible to spot. We are also critical to the way all four companies treat the brand equity variables. Every single brand equity variable is considered equally important. According to us, this is probably not the case. We believe each different brand equity variable affect the company’s success to a different degree. Indirectly, this is also realized by all four companies. All companies interviewed talk about hygienic brand factors, i.e. brand factors considered as a prerequisite to survive. If your company does not have them you will not be in the race. For example, Astra talk about efficiency (a drug must show efficient results), Electrolux mention familiarity, trustworthy and others, Ericsson recognize commitment and dependability and finally Volvo realize that quality is a hygienic factor for competing in the top segment of the car market. Consequently, we believe that the hygienic brand equity factors common to all suppliers in a branch should be weighted less than brand equity factors that differentiate a company from the competition. Remember, differentiation is the key to success, hygienic factors are only a prerequisite for survival! For example, a hygienic factor in the air-transport branch is safety. However, it would make no sense if a company promoted “we never crash” since every passenger takes safe flights for granted. We think it would be more appropriate to promote differentiating factors such as punctual take-off, superior comfort and many destinations.
In our theory analysis, we presented two diagrams comparing different theoretical brand equity measurement methods in various dimensions. Below, the brand equity surveys used by the four companies included in our case study can be found in the same type of diagrams, see figure 5-2. As illustrated by the diagrams, all four companies use rather slow and expensive measurement methods (survey) mixing qualitative and quantitative data and including quite a lot of brand equity variables. The similarity between the companies in the different dimensions of the diagrams is striking.
FAST PRACTICABLE
SLOW PRACTICABLE
QUALITATIVEMEASURE
QUANTITATIVEMEASURE
EXPENSIVETO PERFORM
LESS EXPENSIVETO PERFORM
MANY VARIABLES MEASURED
FEW VARIABLES MEASURED
Astra Electrolux
EricssonVolvo
Astra Electrolux
EricssonVolvo
Figure 5-2. Brand equity measurement methods of four MNCs.
Also the survey measures of the different companies show both similarities and differences. All four companies measure periodically over time, include competitor’s brands in the surveys and use an ”anonymous” consultant when contacting the respondents. We believe these actions are a prerequisite for a fruitful survey study. By measuring brand equity periodically, a company can monitor the brand’s development over time. By including competitors, a company can monitor the brand’s relative strength. Also, using an external consultant such as a survey institute will probably reduce the risk of influenced answers. However, also differences between the companies exists. Ericsson does not randomly chose respondents while Electrolux and Volvo use true random samples. Astra use both random and non random sample. Astra and Ericsson also use different questionnaires while Electrolux and Volvo pretty much stick to the same questionnaire. We prefer the approach by Electrolux and Volvo. It must be rather difficult to compare over time if different questions are used in every survey. Also, why favor the consultants pay check more than necessary by developing new questionnaires each six months? Further, every statistician recognize the importance of a random sample. Arbitrary chosen respondents makes it more likely that the sample will not be representative of the population of interest (the target market) and the company may thus draw wrong conclusions from the survey study at hand.
Finally, no company included in our case study has tried to put a monetary value on the corporate brand nor any product brand. Much because putting an accurate monetary value on a brand has been as challenging and difficult as finding the Holy Grail.
The four different companies brand measurement approaches are illustrated in table 5-1.

Brand equity measure issues Astra Draco Astra Draco Electrolux Ericsson VolvoLäkemedel AB
Brand platform exists - - X X XNo. of core values building the brand 0 0 4 6 3Survey research X X X X X
Personal interviews X X X X XAdaptation to the local market X
XX X - -
Adaptation to different products X X X X X
Measure competitor's brands X X X X XUse different questionnaires X X X X -Use same quesionnaires - - X - X
Measure over time X X X X XMeasure corporate brand name - X - X XMeasure individual product brand name X X X - -
Random sample practice - X X - XNon-random sample practice X - - X -Weighted brand equity variables - - - - -
Non-weighted brand equity variables X X X X XMeasure monetary value of the corporate brand - - - - -Use of external consultants for brand measurements X X X X X
Table 5-1. Overview of brand equity measure issues.
5.3.3 Business blindspots
Business blindspots is a term often used in business intelligence. According to Gilad (1996, p.2), business blindspots are denial, failure or refusal to see reality. Every company harbors blindspots and the question is not whether your company will lose touch with the competitive arena but when it will lose touch. Gilad mention unchallenged assumptions, corporate myths and corporate taboos as the three most devastating blindspots.
· Unchallenged assumptions are incorrect assumptions about the competitive arena, typically about competitors, consumers, technology etc. that are taken for granted and allowed to go unchecked for long periods of time.
· Corporate myths are assumptions that companies hold about themselves, their relative strengths, the way they do things or the industry’s rules of the game.
· Corporate taboos are incorrect assumptions that have become untouchable, these typically enjoy strong support from top management.
Do the companies included in our case study harbor any blindspots relevant for the subject brand management and brand equity measurements? We do not know, but we would like to draw some areas of interest tracked during our case study to your attention.
Astra strongly emphasize the importance of a unique product name and a lot of efforts are made to find the most appropriate. The corporate brand name, Astra, is of only secondary importance and is not promoted to any higher degree. This approach is quite contrary compared to the strategies suggested by the branding literature. The literature emphasize the importance to promote the corporate brand because it typically acts as a risk reducer. To reduce the perceived risk in the medicine branch should be of utmost interest for a supplier of drugs. We believe that a strong corporate brand could ensure that the drug does perform up to expectations. Probably especially important when a new drug is introduced. Furthermore, Astra mention that due to the noise of the media channels of today a company cannot communicate to many messages. Despite this, their strategy is to promote a wide range of product brands. Would it not be easier to promote the

corporate brand name? However, neglect of the corporate brand seem to be mutual for the whole medicine branch - a collective unchallenged assumption?
Electrolux stresses that decentralization is necessary for effective brand measurements, the reason being that different markets hosts different combinations of Electrolux products. Therefore, no general brand equity measuring approach can be used. We believe that the strong decentralization of brand responsibility brings several disadvantages. Comparison of the Electrolux brands between different countries is impossible and also relative comparisons to major competitors are made difficult. We do not agree that a broad product portfolio and extensive geographical spreading implicitly mean that central coordination and common brand measurement methods are ruled out. Is the devotion to decentralization and tailor made brand measurement methods hiding an unchallenged assumption?
Ericsson Public Networks undoubtedly have highly sophisticated products in the product portfolio targeting mainly large business or industry customers. Therefore, a non-random sample only including the (relatively few) target customers visible on the market makes sense when the company’s brand equity is measured. Or does it? Maybe an unchallenged assumption can be spotted here. If the target market only includes large or medium sized business customers today, does that mean that only these customers’ perception of the brand are interesting to measure? Take an AXE sale for example. The AXE is sold by Ericsson to an operator. At a first glance, the operator seem to be Ericsson’s end customer. But is this true? An alternative reasoning is to consider the operator’s subscribers as the true end customers of Ericsson. No subscribers signing up on the operator means no AXE sell for Ericsson.
We believe that the right approach to measure brand equity (and to make an accurate sample) is conditioned by a company’s believe in a ”push” or ”pull” marketing method. A push policy is one whereby the product is pushed through the distribution channel to the end user. A pull policy uses marketing to establish a demand and the end user pull the product through the distribution channel by demanding it (the product is presold). Intel is a good example of a high tech company that has used a pull policy with great success. Although a processor is a highly sophisticated product, not sold directly from Intel to the end user, Intel has actually created a demand for it’s product. No responsible person today buys a PC that has not got the sign ”Intel inside®”. If Ericsson Public Networks believe that they can create a demand from the actual end user, it would make sense to measure the Ericsson brand equity using true random samples of the population. If Ericsson believe that a pull method is not feasible, arbitrary samples are probably acceptable to use when brand equity is measured. In summary, brand equity measures using true random samples may be feasible also in B2B practice. We stress the importance to get rid of any corporate blinders, to work open-minded. Gilad (1996, p.219) say:
” There is no such thing as ‘this is the way you do things in our industry’. At times, it takes executives, with no industrial experience to show the industry players with a lot of industry experience that conventional wisdom is conventional, but not necessarily wisdom”.
Volvo, emphasize the measurement of the three core values of the company: quality, safety and environment. The company’s aim is to be ranked as number one on these brand equity variables. The question is if also the target customer in the top segment of the car market share Volvo’s interest in these three specific variables. For example BMW is the ultimate driving machine and Mercedes is strongly associated with German engineering and prestige and the market shares of the two German companies relative to Volvo suggests that maybe other values are considered more important by the market. Is safety a corporate taboo at Volvo? Let’s hope not.

Chapter Six Conclusions and Recommendations
6 CONCLUSIONS AND RECOMMENDATIONS
6.1 INTRODUCTION
This chapter summarize our conclusions and recommendations. First we will examine why, when, what, how and where a company should measure brand equity. We will then proceed to present some recommendations for companies to consider when brand equity is measured.
6.2 CONCLUSIONS
Brand equity measurement and brand equity, what it is and what it isn’t.
We believe that brand equity measurement should, if performed right, lead to a better understanding of both own brand equity as well as competing brands’ equity in the branch. We have come to the conclusion that all of the companies examined use a brand equity measurement approach that guarantees that they will collect such data.
· Brand equity measurement is not an exact science and does not involve right or wrong answers.· To put a true and fair monetary valuation on the brand is probably difficult, if not impossible.· Brand equity in the eyes of the customer is most important.· Brand importance may differ between branches as well as markets.
Why should a company measure brand equity?
Measuring brand equity is a delicate task. It occupies the time of skillful personnel in the company and the task often includes time consuming and expensive surveys. Could it not be better to just say “yes, our brand most certainly have some kind of brand equity, and so be it”. It would save a lot of time and money for sure. What benefits could a company possible gain from knowing its brand’s equity? How can this knowledge possible lead to ensuring future profits for the company? The answer lies in the fact that customers in general prefer a branded product compared to a unbranded product and they are willing to pay more for products that has a better brand in their opinion. And, by knowing what values the customer perceives when thinking of the brand and to what extent, the company can act so that these values are maintained, protected or even changed according to what would be most appropriate for the company. By measuring brand equity over time and including competitors brands the company can evaluate its brand strategies and to what extent it has succeeded compared to its competitors. This information will help the company to tune future strategies.

When in time should brand equity be of focus?
There are a wide range of methods and they all have their own approach trying to establish brand equity. We have come to the conclusion that a major reason for this diversity is that brand equity can be measured using three perspectives: The accountants perspective, the brand management perspective and the purchaser perspective (see item 5.2).
We have come to the conclusion that the main difference between these three perspectives is based on one factor; time. A brand that is measured along these three perspectives will have three different values depending on when in time one is trying to capture the brand equity.
Figure 6-1. Brand Equity Dimensions
A valuation having an accountant’s perspective will give us brand equity based on historic costs that can be found in the company’s balance sheet. However, this value might be of little interest for the company because of its historical orientation. Consequently, none of the companies examined have tried to establish brand equity using this approach. Measuring with a purchaser perspective will give us a market price of the brand. Unless the company is about to sell its brand, it is useless for them to measure brand equity using this perspective. Finally, brand measurement when having the brand management’s perspective will provide the company with a brand equity that is based on customer preferences at present time. All the companies examined measure its brand having a brand management perspective and we agree that this is the most proper perspective for a company to have.
What variables should be measured?
The methods presented in chapter three as well as the companies examined in chapter four suggests different methods for measuring brand equity using different variables. The theory chapter presents methods suggesting that brand equity is based on certain variables. The empirical chapter presents four different company’s brand management which all claim that their brand is based on certain variables. None of the theoretical methods nor the companies examined are including the same brand equity variables. What variables should be measured then? We conclude the following. If a fair brand equity is to be reached, brand measurement in different branches should use different variables. It is highly unlikely that a specific set of variables is representative in every branch and for all products in every market.
Furthermore, a company’s brand management should identify the brand’s threshold variables and the brands differentiating variables. We believe that the differentiating variables of a brand are the most important to maintain and defend for the company. If competing brands are gaining strength in the company brand’s differentiating variables it is time to act! Therefore, these variables should be in focus when performing the measurement.
Time
History Present Future
Accountantperspective
Brand managementperspective
Purchaserperspective

How should the measurement be performed?
All of the methods that measure brand equity having a brand management perspective are based on customer surveys. All of the companies base their brand equity measurement on customer surveys. Clearly, a customer survey is probably the most useful tool when measuring brand equity. However, we discuss an alternative approach in suggestions for further studies (Chapter seven).
Where should a multinational company measure its brand equity?
The companies examined are multinational and are represented on a global market. Above we stated that adaptation should be made of the variables for different branches. Is the same true for different markets? Most likely. If the aim is to establish a fair value of the global brand, we believe an adaptation has to be made here as well.
6.3 RECOMMENDATIONS
The following recommendation is not specific for any of the companies included in this thesis. It is a suggestion for a general approach when measuring brand equity. It should be noted that the authors have not performed this brand equity approach in reality. It is our theory on how a brand equity could be reached as well as providing the company the most useful information about their brand status.
First recommendation: Identification of brand equity variables.
Each company should identify what variables connected to a brand that is most important from a customer perspective in that branch. However, it should be noted that we believe the company should use a narrow definition of the branch, i.e. Porsche is not in the car branch competing with Volvo, SAAB or Audi. Porsche is in the exclusive sports car branch competing with Ferrari and Lamborghini. This task could reveal several blindspots and increase the understanding of the branch where the brand is represented in.
Second recommendation: Identification of each brand equity variables relative importance in the branch.
We believe that different variables have a relative importance in every branch. A fair way to establish brand equity would therefor be to weigh the variables according to relevance.
Third recommendation: Identification of threshold and differentiating brand equity variables.
This task is recognized by most of the companies that we have examined. We believe that promoting a differentiating value is far better than promoting a threshold value, but first these have to be identified.

Chapter seven Suggestions for further studies
7 SUGGESTIONS FOR FURTHER STUDIES
This chapter ends our thesis and provides a number of suggestions for further studies.
The majority of brand equity measurements require survey studies and the disadvantage lies very much in its time consumption. Therefore it would be interesting to find some sort of ”fast” brand equity measure, something to be used as a complement to the survey studies. We provide an alternative approach here consisting of three steps:
1. Identify strong and weak brands in the branch of interest.2. Search for ”objective data” like turnover, market share, cash flow, financial stability etc. and try to
reveal what variables correlate with the strong versus the weak brands.3. ”Objective” data that correlate with any specific qualitative brand survey data could possibly be
used as a complement to surveys, indicating brand equity.
We have looked at three randomly chosen Swedish corporate brands which are placed in Young & Rubicam’s Power Grid valid for Sweden year 1997 (see figure 7-1). We compared their brand score with their financial measures collected from Dun & Braadstreet’s CD-Svar direkt. The CD holds financial data for all the companies in Sweden and the companies financial performance is also compared to the general performance of the specific branch. It should be noted that we have chosen to examine corporate brands exclusively, since the information from Dun & Braadstreet are divided upon companies, not brands. The brand names can not be exposed in this thesis since this information is classified by Young & Rubicam. However, it is not the specific brands that are of interest, but the correlation between strong corporate brands and financial performance. The results below may indicate that interesting correlation can be found. It should be noted that since we only are including three brands, the statistical sample is too small to draw conclusions from and that is why this approach is placed under suggestion for further studies.
Brands placed in the bottom left of the Power Grid have not given any response in the brand asset valuator surveys. Their financial performance could clearly not spring from brand equity and are therefore excluded since their presence only could be deceptive. However, we have included three brands, A, B and C that are situated in the three remaining boxes in the Power Grid. A detailed description of the Power Grid can be found in item 3.4.4.1.

BRAND STATURE
BRA
ND
ST
REN
GT
H
High
High
Low
Low
D R E K D R E K
D R E K D R E K
A B
C
Figure 7-1. The Y&R Power Grid and three brands. Reference: Aaker (1996, p.309) (modified) and Young & Rubicam.
Table 7-1 below show some of the three companies financial measures. The branch average figures are bracketed. Brand A is considered as a successful niche brand in the Power Grid and all the financial measures clearly indicate healthy business. Brand B is in the ”market leading” position in the Power Grid. Also this brand show positive financial measures. Finally, brand C is situated in the ”tired” brand position in the Power Grid. The financial measures also indicates poor performance, with the exception of solidity. In summary, a highly unscientific conclusion is that strong niche brands and strong market leader brands show excellent financial measures. On the contrary, a tired or weak brand show weak financial performance. Could profit and cash liquidity be used as a ”fast” measure of brand equity?
A B C961212
Profit % 22.4 (4.7) 20.1 (5.3) 1.3 (3.3)Cash liquidity % 212 (136.9) 417.4 (144) 54 (108)Solidity % 58 (27.5) 51 (29.8) 39.5 (32.9)
Table 7-1. Financial measures for three brands.
We have three additional suggestions for further studies:
· Is there a connection between a brand equity over time and the financial performance of the company over the same time?
· We strongly believe that brands have different importance in different branches. It would be interesting to examine brands relative importance in different branches and how it affects measurement of brand equity. Should a detergent be measured the same way as a car?
· Another area of interest could be to find out if it is possible to derive a global brand equity score. The possibility should not be ruled out, for example Volvo has made a brave attempt. Adaptation of brand equity variables to different geographical markets could be combined into a single brand equity score using weighting. Important variables and geographical markets are weighted heavier than the less important dittos.

Reference List PRIMARY DATA
Ahlberg Leif, Volvo, Vice President Brand Management, Interview 98.12.11
Forslund Larsson Inga-Lill, Market Manager, Astra Draco Läkemedel AB, Telephone interview 98.12.22
Haglund Johan, Director Market Research & Strategy, Astra Draco, Interview 98.12.10
Håkansson Per, M.Sc, Handelshögskolan Stockholm, Interview 98.12.01
Janson Fredrik, Director Brand Marketing, Electrolux, Interview 98.12.04
Klinteskog, Anna-Karin, Brand Manager, Ericsson Telecom AB, Interview 98.12.02
Urde Mats, Ph.D, Lunds Universitet, Telephone interview 98.12.07
Varenius Katarina, Brand Analyst, Young & Rubicam, interview 99.01.18
SECONDARY DATA
Books
Aaker David A, Building Strong Brands, The Free Press 1996
Aaker David A, Managing Brand Equity, The Free Press 1991
Aczel Amir D, Complete Business Statistics, Third Edition, Irwin 1996
Albaum Gerald, Strandskov Jesper, Duerr Edwin, International marketing and export management, Addison-Wesley 1998
Gilad Benjamin, Business Blindspots, Infonortics Ltd, 1996
Hoecklin Lisa, Managing Cultural Differences, Addison-Wesley 1995
Holme I M, Solvang B K, Forskningsmetodik – om kvalitativa och kvantitativa metoder, Studentlitteratur 1995
Håkansson Per, Wahlund Richard, Varumärken - från teori till praktik, Graphic Systems i Stockholm AB 1996
Kapferer Jean-Noel, Strategic Brand Management, The Free Press 1992
Keller Kevin Lane, Strategic Brand Management: Building, Measuring and Managing Brand Equity, Prentice Hall 1998
Kotler Philip, Marketing Management, Ninth Edition, Prentice Hall 1997

Lantz Annika, Intervjumetodik, Studentlitteratur 1993
Lekvall Per, Wahlbin Clas, Information för marknadsföringsbeslut, IHM Förlag 1993
Linn Carl Eric, brand dynamics, Institute for Brand Leadership 1998
Lundahl Ulf, Skärvad Per-Hugo, Utredningsmetodik för samhällsvetare och ekonomer, Studentlitteratur 1992
Normann Richard, Ramirez Rafael, Den nya affärslogiken, Liber-Hermods 1995
Journals
Aaker David and Jacobson Robert, The Financial Information Content of Perceived Quality, Journal of Marketing Research, May 1994
Aaker Jennifer, Dimensions of Brand Personality, Journal of Marketing Research, August 1997
Crimmins James C, Better measurement and management of brand value, Journal of Advertising Research, July/August 1992
Farquhar Peter H, Managing Brand Equity, Journal of Advertising Research, Aug/Sep 1990
Grapentine Terry H, Teas R Kenneth, Demystifying brand equity, Marketing Research, Summer 1996, Vol. 8 No. 2
Gifford Dun Jr, Brand Management Moving Beyond Loyalty, Harvard Business Review March-April 1997
Irmscher Markus, Modelling the brand equity concept, Marketing and Research Today, May 1993
Lin Lynn Y.S., Brand equity, profitability, price elasticity and repeat rate, Marketing and Research Today, May 1993
Park, Chun Su, Srinivasan V, A Survey-Based Method for Measuring and Understanding Brand Equity and Its Extendibility, Journal of Marketing Research, May 1994
Thomas Roger, The valuation of brands, Marketing and Research Today, May 1993
Other
Dun & Braadstreet, CD-Svar Direkt
Norrbom Carl, B2B-Marketing, Stockholms Universitet 19961Young & Rubicam, Power Grid 1997

Newspapers
Dagens Industri, Starka varumärken i ny fond, 1998.12.23
Dagens Nyheter, Varumärken - Inre värdet avgörande, 1998.06.02
Company internal documents
Astra Annual Report 1997
Electrolux Annual Report 1997
Ericsson Annual Report 1997
Ericsson, Corporate Branding, EN/LZT 108 2284 R1
Ericsson Kontakten nr 8 1998
Ericsson Kontakten special, oktober 1998
Ericsson SnapShot 2/98
Volvo Annual Report 1997
Volvo, The Volvo Brand Management Policy, October 1998
Volvo, The Volvo Core Value Policies, October 1998
Internet
www.astra.com
www.electrolux.se
www.ericsson.com
www.volvo.com

List of figures
Figure 2-1. This report in context of different types of research..........................................................................Figure 2-2. Our course of action........................................................................................................................Figure 2-3. Companies included in our case study..............................................................................................Figure 3-1. The total offer..................................................................................................................................Figure 3-2. The intended meaning of the brand should coincide with the............................................................perceived meaning of the message......................................................................................................................Figure 3-3. A brand personality framework........................................................................................................Figure 3-4. The awareness pyramid....................................................................................................................Figure 3-5. The Y&R Power Grid: Stature versus strength.................................................................................Figure 3-6. The equity framework.......................................................................................................................Figure 3-7. Multiple applied (fictional)..............................................................................................................Figure 4-1. Astra Organization 1998..................................................................................................................Figure 4-2. Influence in the medical branch.......................................................................................................Figure 4-3. Electrolux group organization..........................................................................................................Figure 4-4. Approaches to branding...................................................................................................................Figure 4-5. Family branding and brand roles for family brands..........................................................................Figure 4-6. Ericsson organization......................................................................................................................Figure 4-7. The communication carriers.............................................................................................................Figure 4-9. The core and extended values...........................................................................................................Figure 5-1. Theoretical Brand equity measurement methods...............................................................................Figure 5-2. Brand equity measurement methods of four MNCs...........................................................................Figure 6-1. Brand Equity Dimensions.................................................................................................................Figure 7-1. The Y&R Power Grid and three brands............................................................................................
List of tables
Table 3-1. Interbrand, seven weighted factors (fictional)....................................................................................Table 5-1. Overview of brand equity measure issues...........................................................................................Table 7-1. Financial measures for three brands..................................................................................................


![An Immaterial Pseudo-3D Display with 3D Interactionholl/pubs/DiVerdi-2007-3DTV.pdf · the patented FogScreen, an “immaterial” indoor 2D projection screen [2,3,4], which enables](https://static.fdocuments.us/doc/165x107/5f9e7042042ae71fc21d1b40/an-immaterial-pseudo-3d-display-with-3d-interaction-hollpubsdiverdi-2007-3dtvpdf.jpg)