Scientific Institute of Public Health Unit of Epidemiology REVES 20051 HEALTH EXPECTANCIES IN...
18
REVES 2005 1 Scientific Institute of Public Health Unit of Epidemiology HEALTH EXPECTANCIES IN BELGIUM HEALTH EXPECTANCIES IN BELGIUM RESULTS FROM THE 2001 CENSUS RESULTS FROM THE 2001 CENSUS H. Van Oyen (ISP) S. Demarest (ISP) PJ. Miersman (ISP) P. Deboosere (VUB) V. Lorant (UCL)
-
Upload
august-malone -
Category
Documents
-
view
216 -
download
0
Transcript of Scientific Institute of Public Health Unit of Epidemiology REVES 20051 HEALTH EXPECTANCIES IN...

REVES 2005 1
Scientific Institute of Public Health
Unit of Epidemiology
HEALTH EXPECTANCIES IN BELGIUMHEALTH EXPECTANCIES IN BELGIUM
RESULTS FROM THE 2001 CENSUSRESULTS FROM THE 2001 CENSUS
H. Van Oyen (ISP)S. Demarest (ISP)PJ. Miersman (ISP)P. Deboosere (VUB)V. Lorant (UCL)

REVES 2005 2
OBJECTIVE
Describe the health status of Belgian
population by gender and region
self perceived health
longstanding morbidity
disability by severity

REVES 2005 3
DATA
Mortality: 2001Life table: last closed interval 100-105 yrs
Health:census 2001Postal
N = 9 333 428, aged 5 yrs+
Response rate : 98%
REVES 2005 4
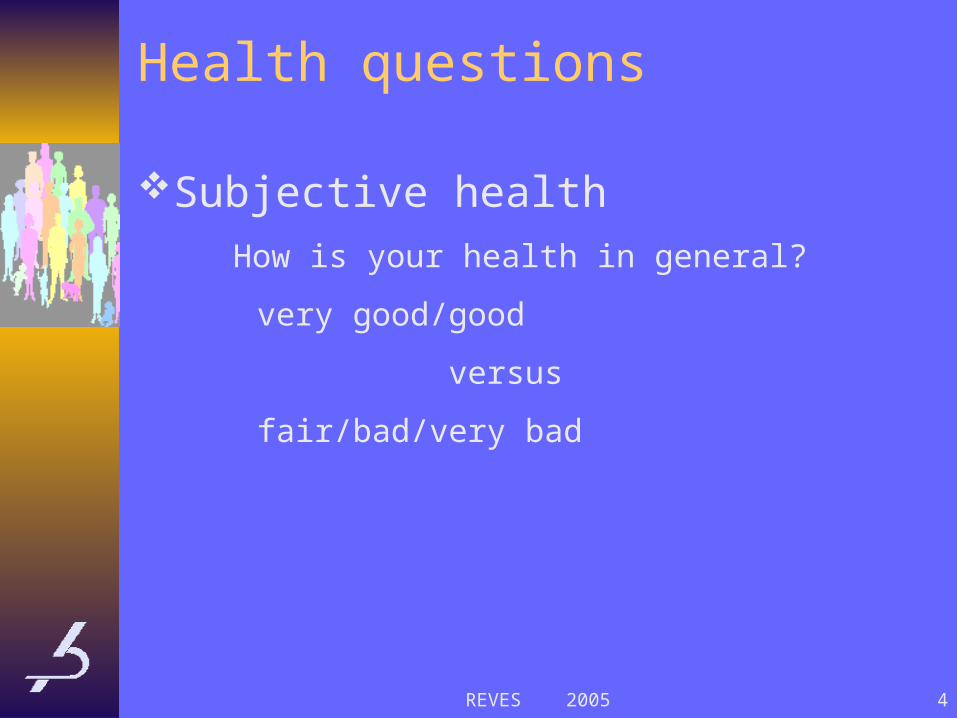
Health questions
Subjective healthHow is your health in general?
very good/good
versus
fair/bad/very bad
REVES 2005 5
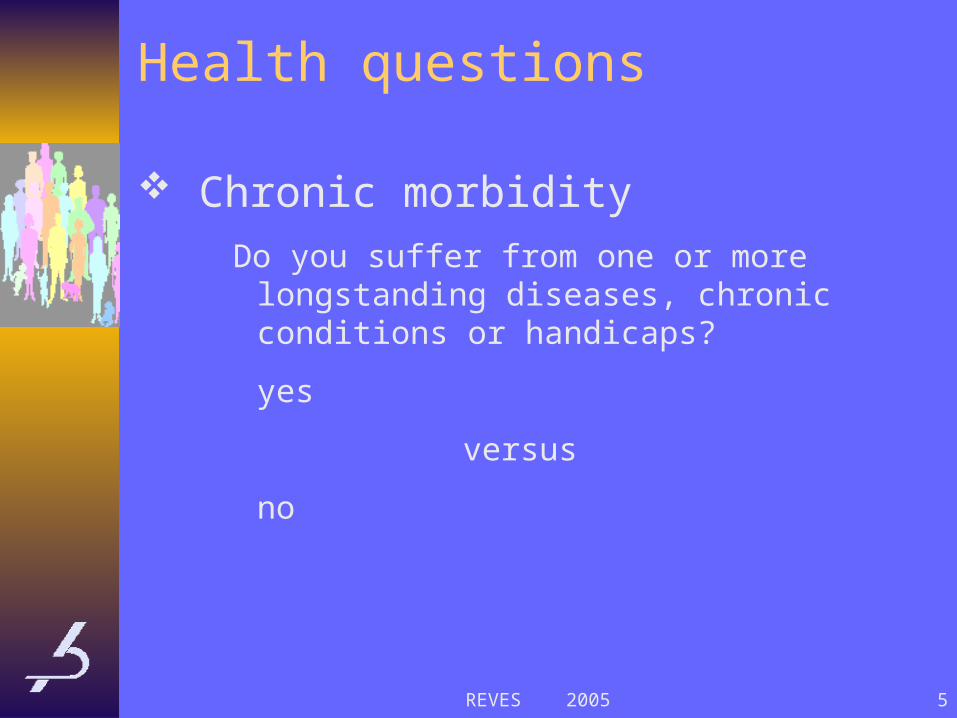
Health questions
Chronic morbidityDo you suffer from one or more
longstanding diseases, chronic conditions or handicaps?
yes
versus
no

REVES 2005 6
Health questionsDisability
Are you restricted in your daily activities due to this (these) illness(es), chronic condition(s) or handicaps?
continously severe disability
every now and then moderate disability
seldom or not
REVES 2005 7
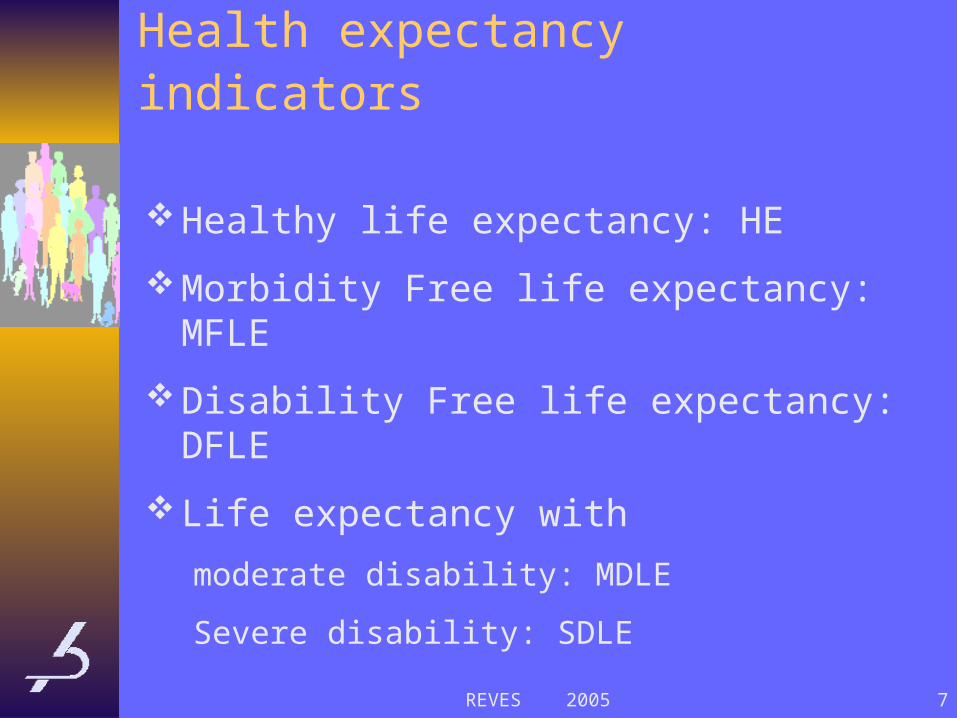
Health expectancy indicators
Healthy life expectancy: HE
Morbidity Free life expectancy: MFLE
Disability Free life expectancy: DFLE
Life expectancy with
moderate disability: MDLE
Severe disability: SDLE
REVES 2005 8
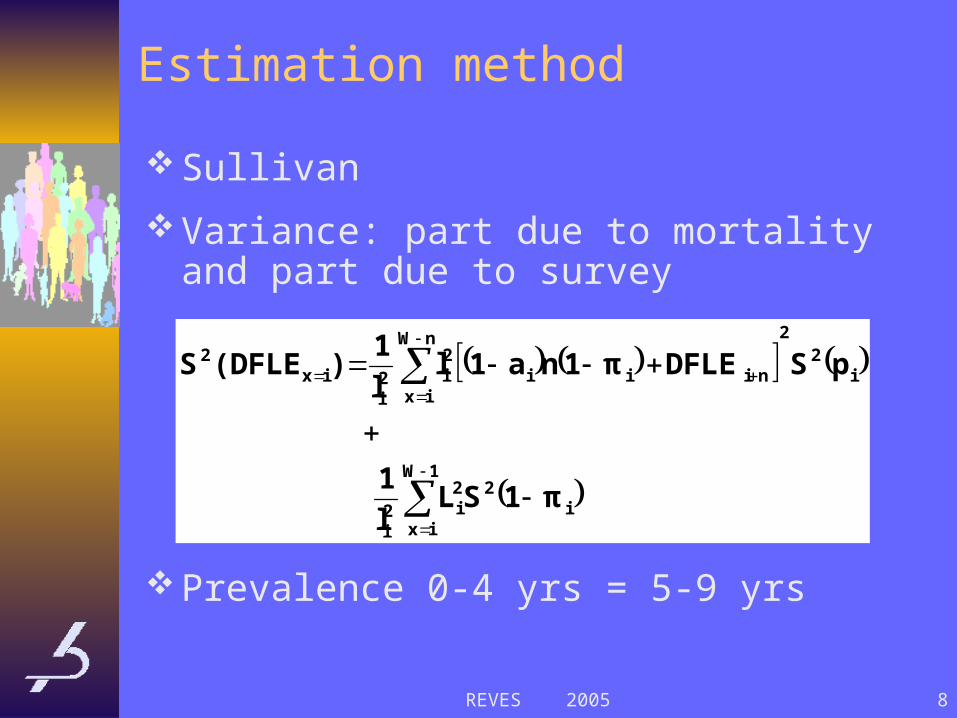
Estimation method
Sullivan
Variance: part due to mortality and part due to survey
Prevalence 0-4 yrs = 5-9 yrs
1W
ixi
22i2
i
i2
2nW
ixniii
2i2
iix
2
π1SLl1
pSDFLEπ1na1ll1
)(DFLES
REVES 2005 9
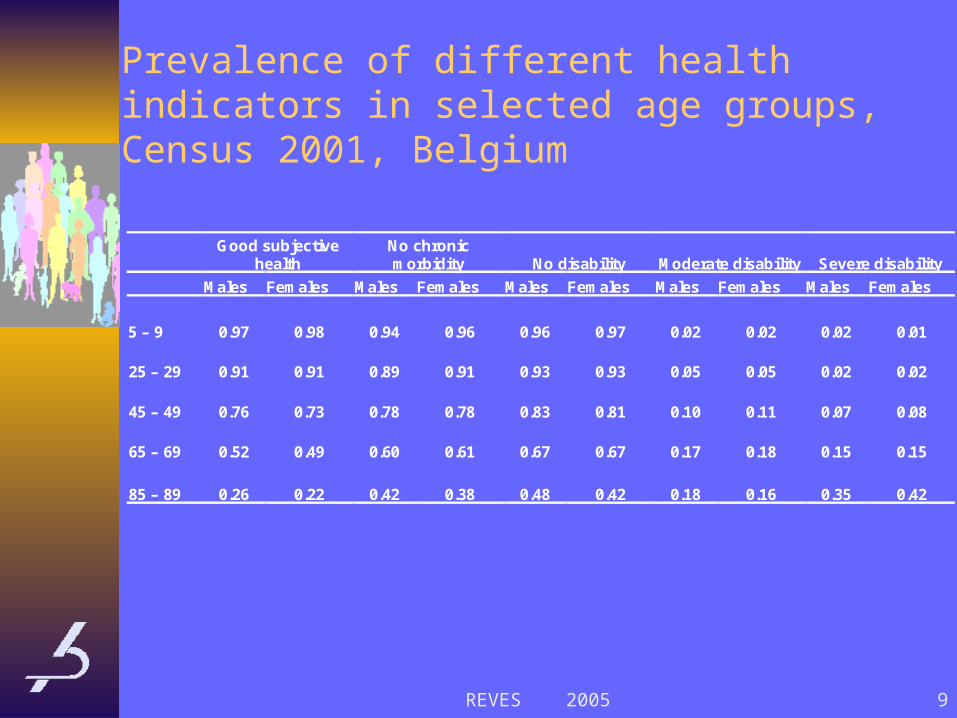
Prevalence of different health indicators in selected age groups, Census 2001, Belgium
Good subjective
health No chronic morbidity No disability Moderate disability Severe disability
Males Females Males Females Males Females Males Females Males Females
5 – 9 0.97 0.98 0.94 0.96 0.96 0.97 0.02 0.02 0.02 0.01 25 – 29 0.91 0.91 0.89 0.91 0.93 0.93 0.05 0.05 0.02 0.02 45 – 49 0.76 0.73 0.78 0.78 0.83 0.81 0.10 0.11 0.07 0.08 65 – 69 0.52 0.49 0.60 0.61 0.67 0.67 0.17 0.18 0.15 0.15 85 – 89 0.26 0.22 0.42 0.38 0.48 0.42 0.18 0.16 0.35 0.42

REVES 2005 10
Healthy life expectancy, Census 2001, Belgium
Life expectancy
Healthy Life expectancy
% of remaining life in good subjective
health
At age 0
Males 75.42 (75.30 - 75.54) 58.00 (57.93 - 58.08) 76.91
Females 81.67 (81.56 - 81.78) 59.46 (59.40 - 59.52) 72.81
At age 5
Males 70.88 (70.77 - 70.99) 53.51 (53.45 - 53.57) 75.49
Females 77.08 (76.98 - 77.18) 54.88 (54.83 - 54.93) 71.2
At age 65
Males 16.24 (16.17 - 16.31) 6.57 (6.54 - 6.60) 40.45
Females 20.23 (20.16 - 20.30) 7.05 (7.02 - 7.07) 34.83

REVES 2005 11
Morbidity free life expectancy, Census 2001, Belgium
Life expectancy
Life expectancy without chronic morbidity
and 95% CI
% of remaining life without
chronic morbidity At age 0
Males 75.42 59.70 (59.61 - 59.78) 79.15 Females 81.67 63.38 (63.31 - 63.45) 77.61 At age 5 Males 70.88 55.34 (55.26 - 55.41) 78.07 Females 77.08 58.90 (58.84 - 58.97) 76.42 At age 65 Males 16.24 8.55 (8.51 - 8.59) 52.64 Females 20.23 10.12 (10.08 - 10.16) 50.02
REVES 2005 12
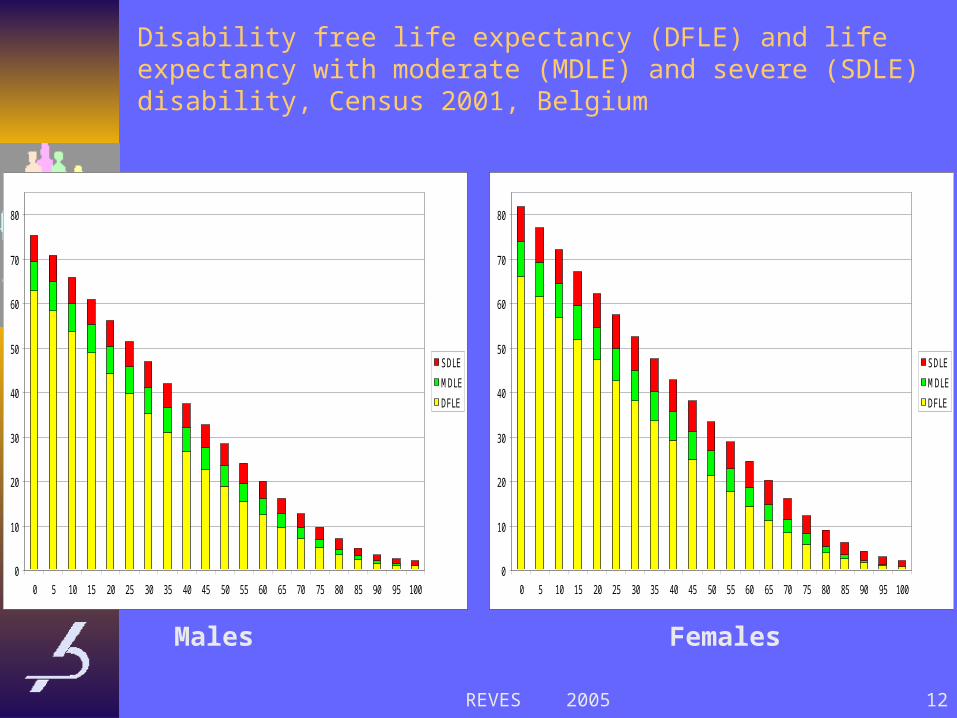
Disability free life expectancy (DFLE) and life expectancy with moderate (MDLE) and severe (SDLE) disability, Census 2001, Belgium
0
10
20
30
40
50
60
70
80
0 5 10 15 20 25 30 35 40 45 50 55 60 65 70 75 80 85 90 95 100
SDLE
MDLE
DFLE
0
10
20
30
40
50
60
70
80
0 5 10 15 20 25 30 35 40 45 50 55 60 65 70 75 80 85 90 95 100
SDLE
MDLE
DFLE
Males Females
REVES 2005 13
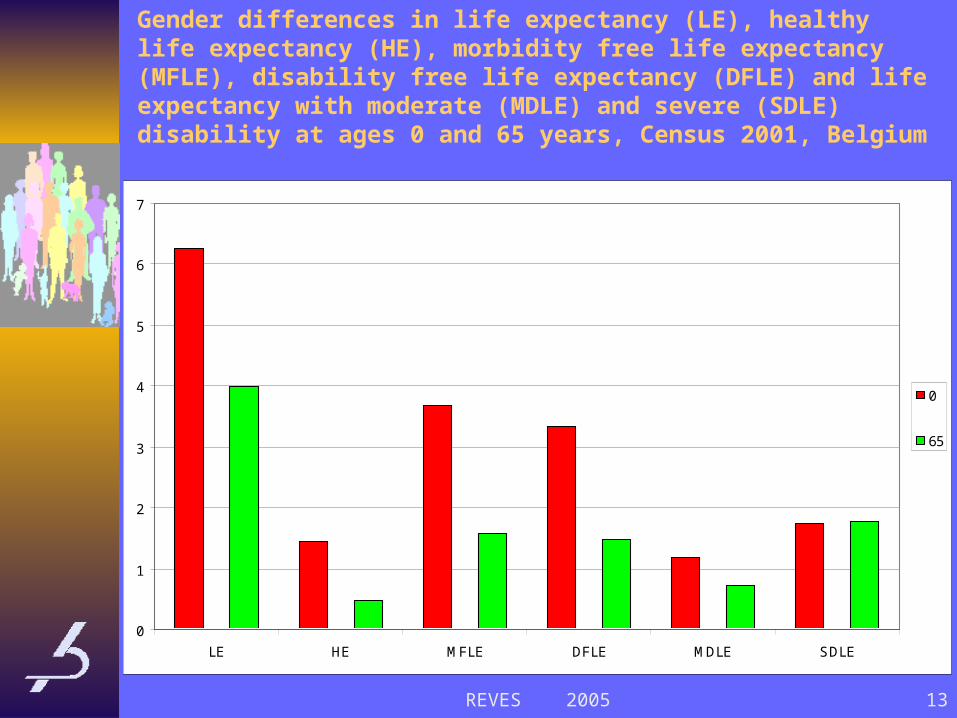
Gender differences in life expectancy (LE), healthy life expectancy (HE), morbidity free life expectancy (MFLE), disability free life expectancy (DFLE) and life expectancy with moderate (MDLE) and severe (SDLE) disability at ages 0 and 65 years, Census 2001, Belgium
0
1
2
3
4
5
6
7
LE HE MFLE DFLE MDLE SDLE
0
65
REVES 2005 14
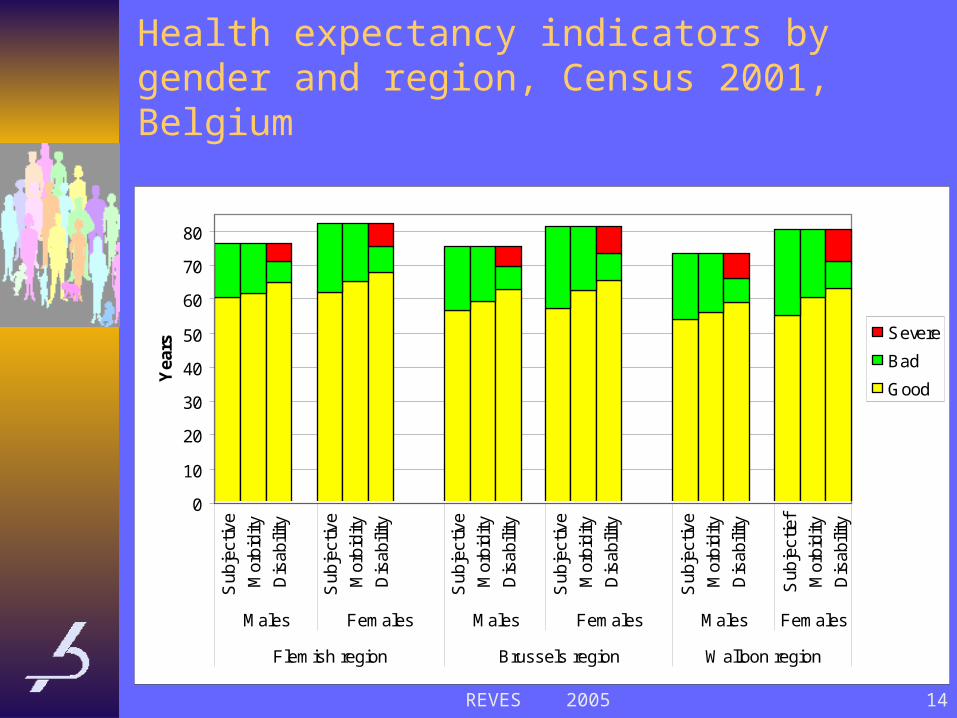
Health expectancy indicators by gender and region, Census 2001, Belgium
0
10
20
30
40
50
60
70
80S
ubje
ctiv
e
Mor
bidi
ty
Dis
abili
ty
Sub
ject
ive
Mor
bidi
ty
Dis
abili
ty
Sub
ject
ive
Mor
bidi
ty
Dis
abili
ty
Sub
ject
ive
Mor
bidi
ty
Dis
abili
ty
Sub
ject
ive
Mor
bidi
ty
Dis
abili
ty
Sub
ject
ief
Mor
bidi
ty
Dis
abili
ty
Males Females Males Females Males Females
Flemish region Brussels region Walloon region
Yea
rs
Severe
Bad
Good
REVES 2005 15
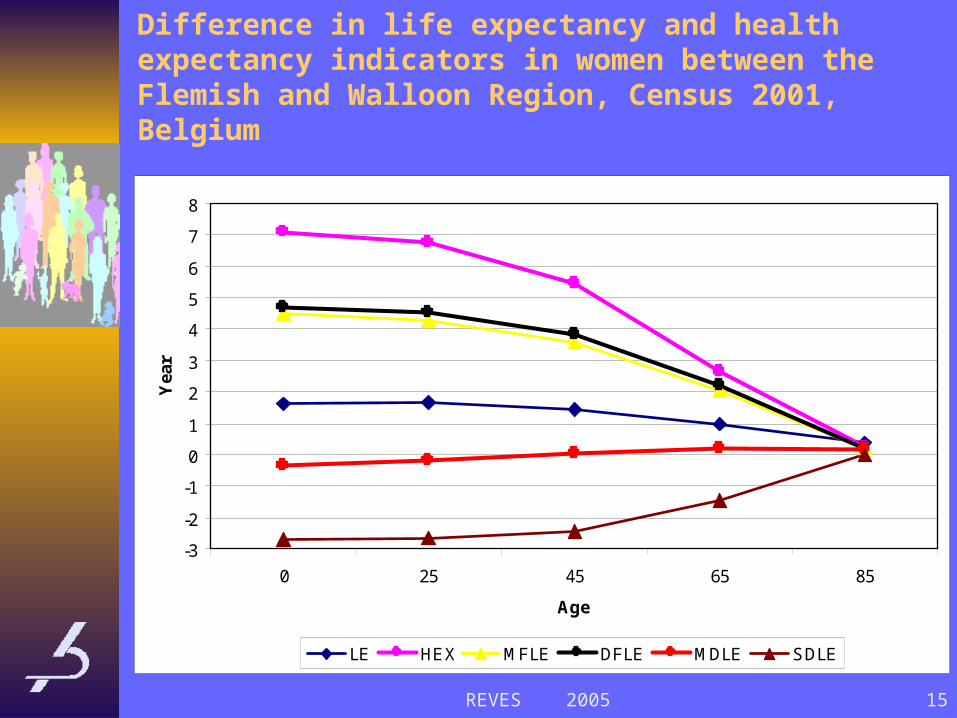
Difference in life expectancy and health expectancy indicators in women between the Flemish and Walloon Region, Census 2001, Belgium
-3
-2
-1
0
1
2
3
4
5
6
7
8
0 25 45 65 85
Age
Yea
r
LE HEX MFLE DFLE MDLE SDLE
REVES 2005 16
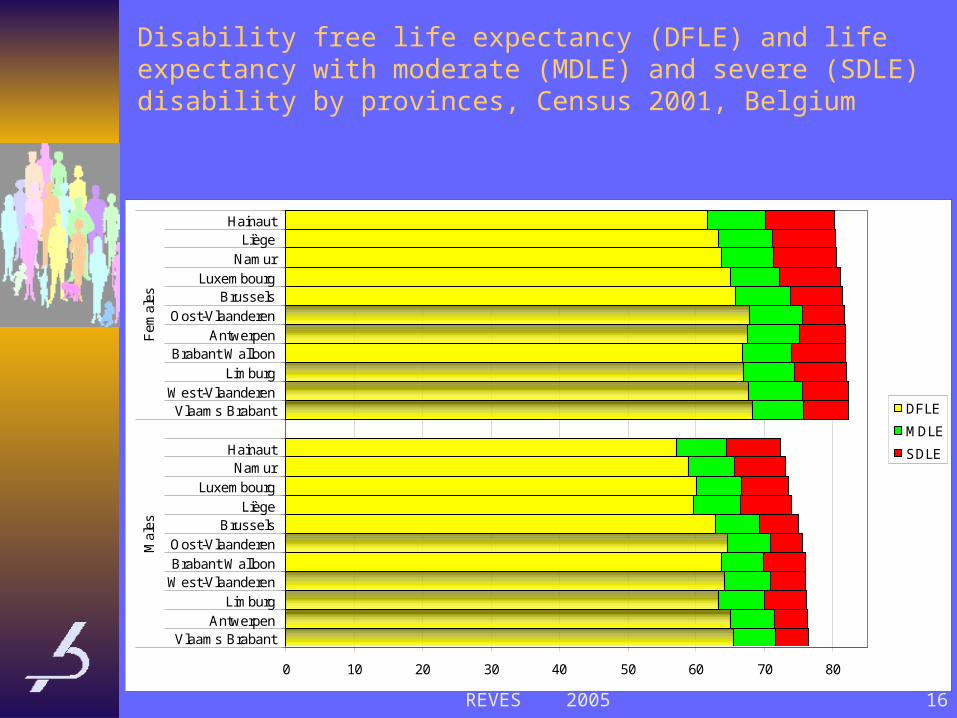
Disability free life expectancy (DFLE) and life expectancy with moderate (MDLE) and severe (SDLE) disability by provinces, Census 2001, Belgium
0 10 20 30 40 50 60 70 80
Vlaams BrabantAntwerpen
LimburgWest-Vlaanderen Brabant WalloonOost-Vlaanderen
BrusselsLiège
LuxembourgNamur
Hainaut
Vlaams BrabantWest-Vlaanderen
Limburg Brabant Walloon
AntwerpenOost-Vlaanderen
BrusselsLuxembourg
NamurLiège
Hainaut
Mal
esF
emal
es
DFLE
MDLE
SDLE

REVES 2005 17
CONCLUSIONRegional differences
Shorter life
Less years of life in good health
More years of life in ill health
Gender differencesShorter life
Less years of life in good health
Less years of life in ill health

REVES 2005 18
Evolution of Life expectancy (LE), Disability free life expectancy (DFLE) and life expectancy with disability (DLE) and moderate (MDLE) and severe (SDLE) disability 1997-2001, Belgium
-0.8
-0.6
-0.4
-0.2
0
0.2
0.4
0.6
0.8
1
1.2
Males
Females
LE DFLE
DLE MDLE
SDLE