Scientex 3Q15 BriefingSlides Final 150629 › web › img › investor › Q2_FY2015_2.pdf ·...
19
Powered by Twin Engines Corporate Presentation 9M15 Corporate Update & Financial Results IR Adviser (Company No.: 7867-P)
Transcript of Scientex 3Q15 BriefingSlides Final 150629 › web › img › investor › Q2_FY2015_2.pdf ·...

Po
were
d b
y T
win
En
gin
es
Corporate Presentation9M15 Corporate Update & Financial Results
IR Adviser
(Company No.: 7867-P)
2
Po
were
d b
y T
win
En
gin
es
CONTENTS
• Operations Review & Growth Plans
• 9M15 Financial Review
• Investment Merits

Po
were
d b
y T
win
En
gin
es
OPERATIONS REVIEW
& GROWTH PLANS

4
Operations Review Growth Strategies Financial Highlights Investment Merits Appendix
2.8
3.2
4.1
4.3
4.6
12
.0
FY13 FY14 1Q15 2Q15 3Q15 FY17
7.3
8.9
9.0
9.3
10
.2
12
.3
FY13 FY14 1Q15 2Q15 3Q15 FY17
Operations Review: Manufacturing
Consumer packaging expansion plans progressing smoothly… on track to reach
approximately 25K MT sales tonnage per month by beginning FY2017
Operations Review
Average monthly sales tonnage
(MT ‘000)
Products:
• Base film
• Functional films
Prod. Output: 48,000 MT p.a.Location: Rawang
PE FilmPE Film
Prod. Output: 6,000 MT p.a.Location: Rawang
BOPP
Film
BOPP
Film
Output: 6,000 MT p.a.Location: Shah Alam & Indonesia
AdhesiveAdhesive
Consumer PackagingConsumer Packaging
Prod. Output: 120,000 MT p.a.Location: Pulau Indah, Klang
Stretch
Film
Stretch
Film
Prod. Output: 18,000 MT p.a.Location: Melaka
PP
Strapping
Band
PP
Strapping
Band
Prod. Output: 10,000 MT p.a.Location: Vietnam
RaffiaRaffia
Industrial PackagingIndustrial Packaging
10.1 12.1 13.1 13.6 25.0
Industrial Packaging
14.8
Consumer Packaging

5
Operations Review Growth Strategies Financial Highlights Investment Merits Appendix
Industrial
60.1%
Consumer
39.9%
3Q15 Manufacturing Revenue
RM318.8 mil
Operations Review: Manufacturing
Revenue growth driven by consumer packaging segment on larger capacity and
clientele… industrial film revenue slightly lower due to weaker crude oil prices
Operations Review
� Industrial Packaging
� 3Q15 revenue declined 6.4% yoy to RM191.6 mil due to
lower selling prices in line with lower crude oil prices
� Overall sales tonnage rose about 12% from FY2014 average
on higher export demand for stretch film
� Consumer Packaging
� 3Q15 revenue rose 13.0% yoy to RM127.1 mil mainly due to
enlarged PE film production capacity and larger clientele
� PE film production capacity expanded from 24,000 MT p.a.
to 48,000 MT p.a. in end-2014
� Commenced production of 9-layer barrier film in end-2014
Industrial
60.3%
Consumer
39.7%
9M15 Manufacturing Revenue
RM966.1 mil
-6.4%
yoy
+13.0%
yoy
-0.7%
yoy
+24.5%
yoy

6
Operations Review Growth Strategies Financial Highlights Investment Merits Appendix
Growth Plans: Manufacturing
On track to become the largest blown film manufacturer in Malaysia by 2016…
embarking on vertical expansion in consumer packaging
Growth Strategies
30,000MT
Per Annum
24,000 MT PE
6,000 MT BOPP
120,000MT
Per Annum
48,000 MT PE
60,000 MT BOPP
12,000 MT CPP
Completed
in end-2014
2014 2016
Consumer packaging expansion plan
To be completed
in end-2015/2016
� New 10-color printing machine to be installed in July
2015
� To increase sales of more value-added production
� Construction of new CPP film plant to be completed in
July 2015
� On track for commercial run by end-2015 with
total capacity of 12,000 MT p.a
� To complement PE and BOPP businesses and
leverage on existing clientele in Malaysia and
South East Asia
� Commenced BOPP plant construction in February 2015
� Commercial run targeted to commence in mid-
2016
� BOPP production to be increased to 60,000 MT
p.a. from 6,000 MT p.a. currently
� Further expansion of PE film from 48,000 MT p.a. to
60,000 MT p.a. targeted for completion in mid-2016
CPP plant in Melaka, slated for
completion in July 2015
Site progress of BOPP plant in
Pulau Indah
7
Operations Review Growth Strategies Financial Highlights Investment Merits Appendix
Operations Review: Property
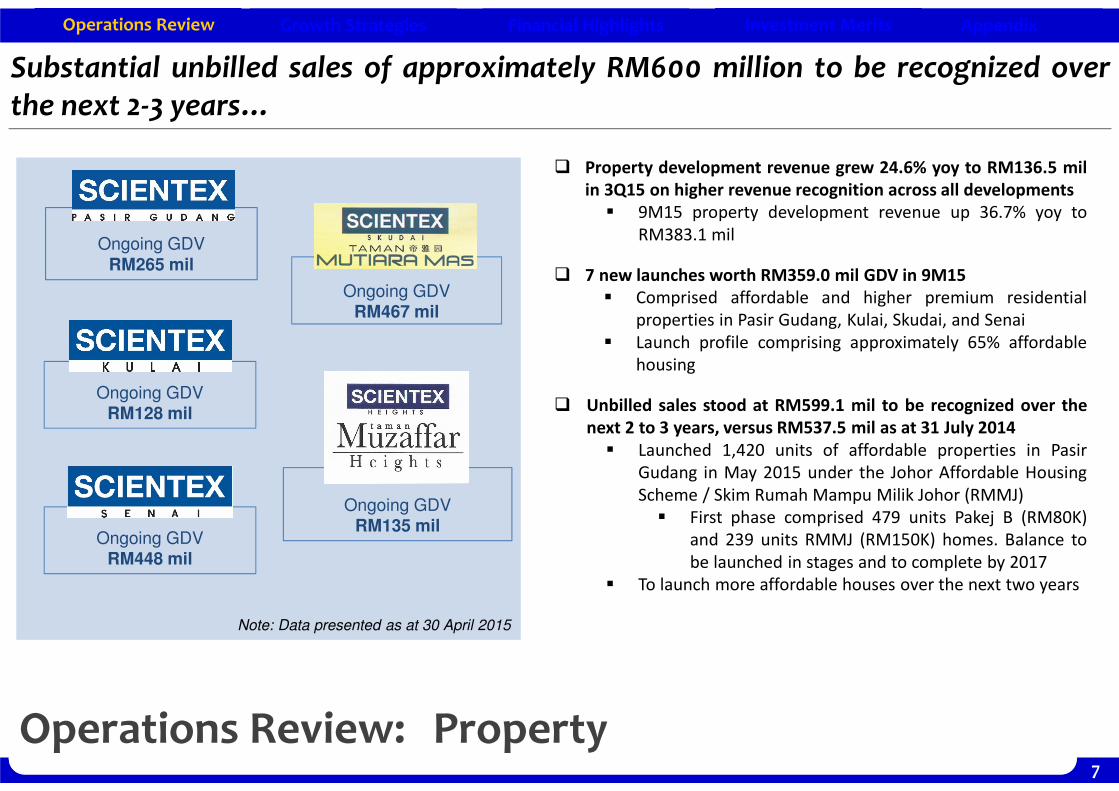
Substantial unbilled sales of approximately RM600 million to be recognized over
the next 2-3 years…
Operations Review
Ongoing GDV
RM265 mil
Ongoing GDVRM467 mil
� Property development revenue grew 24.6% yoy to RM136.5 mil
in 3Q15 on higher revenue recognition across all developments
� 9M15 property development revenue up 36.7% yoy to
RM383.1 mil
� 7 new launches worth RM359.0 mil GDV in 9M15
� Comprised affordable and higher premium residential
properties in Pasir Gudang, Kulai, Skudai, and Senai
� Launch profile comprising approximately 65% affordable
housing
� Unbilled sales stood at RM599.1 mil to be recognized over the
next 2 to 3 years, versus RM537.5 mil as at 31 July 2014
� Launched 1,420 units of affordable properties in Pasir
Gudang in May 2015 under the Johor Affordable Housing
Scheme / Skim Rumah Mampu Milik Johor (RMMJ)
� First phase comprised 479 units Pakej B (RM80K)
and 239 units RMMJ (RM150K) homes. Balance to
be launched in stages and to complete by 2017
� To launch more affordable houses over the next two years
Note: Data presented as at 30 April 2015
Ongoing GDVRM128 mil
Ongoing GDVRM135 mil
Ongoing GDVRM448 mil

8
Operations Review Growth Strategies Financial Highlights Investment Merits Appendix
Recent Developments: Property
Recently proposed acquisition of 326-acre land in Skudai… Group’s ongoing and
undeveloped landbank increases to 1,200 acres to last for 10 years
Operations Review
New lands
� On 29 June 2015, entered into agreements with Bukit
Gambir Company Sdn Bhd and Jayaplus Bakti Sdn Bhd to
acquire 326 acres of land in Pulai for RM218.97 million
� Located 33 km from Johor Bahru City Centre, 25 km from
MY-SG Second Link Customs Checkpoint, and 5 km from
proposed Pulai Jaya Interchange Exit to the Second Link
� To contribute towards long term development profile
and boosts ongoing and undeveloped landbank to
approx. 1200 acres from 870 acres currently
� To benefit from established branding of existing 150 acre
Taman Mutiara Mas development, good road connectivity
and proximity to various mature townships such as Taman
Pulai Indah and Bandar Baru Kangkar Pulai
� To be financed by approximately 80% bank borrowings
and 20% cash
� Proposed acquisition subject to approvals by shareholders
at upcoming Extraordinary General Meeting and other
relevant authorities

Po
were
d b
y T
win
En
gin
es
9M15 FINANCIAL REVIEW

10
Operations Review Growth Strategies Financial Highlights Investment Merits Appendix
20
.6
20
.2
19
.7
23
.4
24
.9
25
.6
29
.5
27
.1
26
.0
33
.9
36
.3
48
.8
30
.3
36
.1
43
.0
5.2 9
.7 3.1
Quarterly PATMI (RM ‘mil)
Forex differences
Charting commendable growth from both core segments… margins recovering
from 2Q15 from forex losses as USD loans pared down significantly
3Q15 Income Statement Summary
Financial Highlights2
13
.8
21
4.5
22
6.8
22
6.0
24
1.6
27
1.1
34
5.1
37
1.2
36
4.8
38
3.5
42
6.8
41
5.4
43
1.1
46
2.9
45
5.3
Quarterly Revenue (RM ‘mil)
26
.3
25
.8
25
.5
29
.5
31
.3
33
.2
38
.2
40
.2
32
.9
44
.4
48
.1
56
.0
40
.2
47
.3
56
.5
5.2 9
.7 3.1
Quarterly PBT (RM ‘mil)Forex differences
3Q15 3Q14 Change RM'mil 9M15 9M14 Change Remarks
455.3 426.8 6.7% Revenue 1,349.2 1,175.1 14.8%Driven by higher property development and
consumer packaging sa les
69.4 58.9 17.8% EBITDA 180.3 162.9 10.7%
15.2% 13.8% 1.4 pt EBITDA margin 13.4% 13.9% (0.5 pt)
56.5 48.1 17.5% PBT 144.0 130.3 10.5%
12.4% 11.3% 1.1 pt PBT margin 10.7% 11.1% (0.4 pt)
43.0 36.3 18.2% PATMI 109.3 99.6 9.7%
9.4% 8.5% 0.9 pt Net margin 8.1% 8.5% (0.4 pt)
19.02 16.43 15.8% Basic EPS (sen) 48.69 45.04 8.1%
Profi t increased largely in l ine wi th higher topl ine
Margins s l ightly dampened due to forex losses
incurred in 1H15; vastly improved in 3Q15 compared
to 2Q15 as USD loans were pared down s ignifi cantly
In l ine with above

11
Operations Review Growth Strategies Financial Highlights Investment Merits Appendix
41.9%
58.1%
9M15 Group EBITDA*: RM198.3 mil
Property segment leading growth in 9M15… manufacturing segment profitability
benefitting from higher contribution from consumer packaging sales
Revenue & EBITDA Segmentation
Financial Highlights
71.6%
28.4%
9M15 Group Revenue: RM1,349.2 mil
Manufacturing Property
76.2%
23.8%
9M14 Group Revenue: RM1,175.1 mil
Manufacturing Property
+36.7%
yoy
+8.0%
yoy
47.9%52.1%
9M14 Group EBITDA*: RM163.4 mil
35.4%
yoy5.6%
yoy
*EBITDA presented excludes gains/losses from foreign exchange

12
Operations Review Growth Strategies Financial Highlights Investment Merits Appendix
483 635 763587 583
153
284430
308 383
2012 2013 2014 9M14 9M15
RM’mil
Manufacturing Revenue (by Segment)
Industrial Packaging Consumer Packaging
Financial Review: Manufacturing
Manufacturing growth mainly driven by expanded consumer packaging division…
Financial Highlights
58
77
10
7
78
83
9.1% 8.4% 9.0% 8.8% 8.6%
2012 2013 2014 9M14 9M15
RM’milEBITDA & EBITDA Margin
EBITDA EBITDA Margin
63
7
91
9
1,1
92
89
5
96
6
11.0% 11.1%9.8% 10.0% 9.9%
2012 2013 2014 9M14 9M15
RM’mil
Manufacturing Revenue & Gross Margin
Revenue Gross Margin
9M15 EBITDA growth in
line with expanded sales,
margin remains stable
9M15 EBITDA growth in
line with expanded sales,
margin remains stable
9M15 manufacturing
revenue primarily driven
by consumer packaging
growth; GP margin
remains stable
9M15 manufacturing
revenue primarily driven
by consumer packaging
growth; GP margin
remains stable
Industrial packaging revenue declined
slightly (-0.7%) due to lower crude oil
prices, but overall sales tonnage higher
on steady growth in industrial demand
Industrial packaging revenue declined
slightly (-0.7%) due to lower crude oil
prices, but overall sales tonnage higher
on steady growth in industrial demand
Higher consumer packaging revenue
+24.5% with expanded PE film capacity
and clientele
Higher consumer packaging revenue
+24.5% with expanded PE film capacity
and clientele

13
Operations Review Growth Strategies Financial Highlights Investment Merits Appendix
15
0
21
9
24
5
31
0
39
8
28
0 38
337.8%42.6% 44.2% 47.0% 44.1% 44.4%
41.0%
2010 2011 2012 2013 2014 9M14 9M15
RM’milRevenue & Gross Margin
Revenue Gross Margin
34
63
73
10
0
12
2
85
11
5
22.8%
28.8% 29.8%32.3% 30.7% 30.4% 30.1%
2010 2011 2012 2013 2014 9M14 9M15
RM’milEBITDA & EBITDA Margin
EBITDA EBITDA Margin
Financial Review: Property Development
Financial Highlights
Property segment continues commendable performance on sturdy demand for
affordable properties in Johor… also enhanced by well-priced premium properties
Steady demand for affordable housing,
particularly in Pasir Gudang and Senai, as well as
well-priced higher-premium properties in Skudai
Steady demand for affordable housing,
particularly in Pasir Gudang and Senai, as well as
well-priced higher-premium properties in Skudai

14
Operations Review Growth Strategies Financial Highlights Investment Merits Appendix
Net gearing at comfortable level even as capacity expansions are ongoing…larger
asset base reflecting recent landbanking and expanded manufacturing operations
1 Based on share capital of 225.9 mil shares after deducting treasury shares of 4.1 mil shares
Financial Highlights
Balance Sheet (Highlights)
As at As at
30.4.2015 31.7.2014
Property, Plant & Equipment 568,252 552,100 In l ine wi th consumer packaging expans ion
Investment Property & Other Investments 11,508 9,571
Land Held & Property Development Costs 394,972 365,019 Due to increased property development activi ties
Investment in Jointly Control led Enti ty &
Associated Company39,536 37,465
Inventories 85,945 108,998
Trade & Other Receivables 325,235 243,459 In l ine with increase in revenue
Cash & Bank Ba lances 63,491 83,766
TOTAL ASSETS 1,488,939 1,400,378
Trade & Other Payables 255,643 254,441
Borrowings (ST + LT) 282,665 340,420
Tax & Deferred Tax 36,146 35,059
Shareholders ’ Equi ty 851,566 712,718 Due to higher reta ined earnings and share premium account
Minority Interest 43,697 22,705Due to equity parti cipation of Futamura Chemica l Co., Ltd into Scientex
Great Wal l Sdn Bhd
Net Tangible Assets / Sha re (RM) 1 3.77 3.22
Net Gearing 0.26x 0.36x On paring down of borrowings due to s trong cashflow
Balance Sheet (RM ‘000) Remarks
15
Operations Review Growth Strategies Financial Highlights Investment Merits Appendix
USD
DrUSD
Cr
USD
Dr
USD
Cr
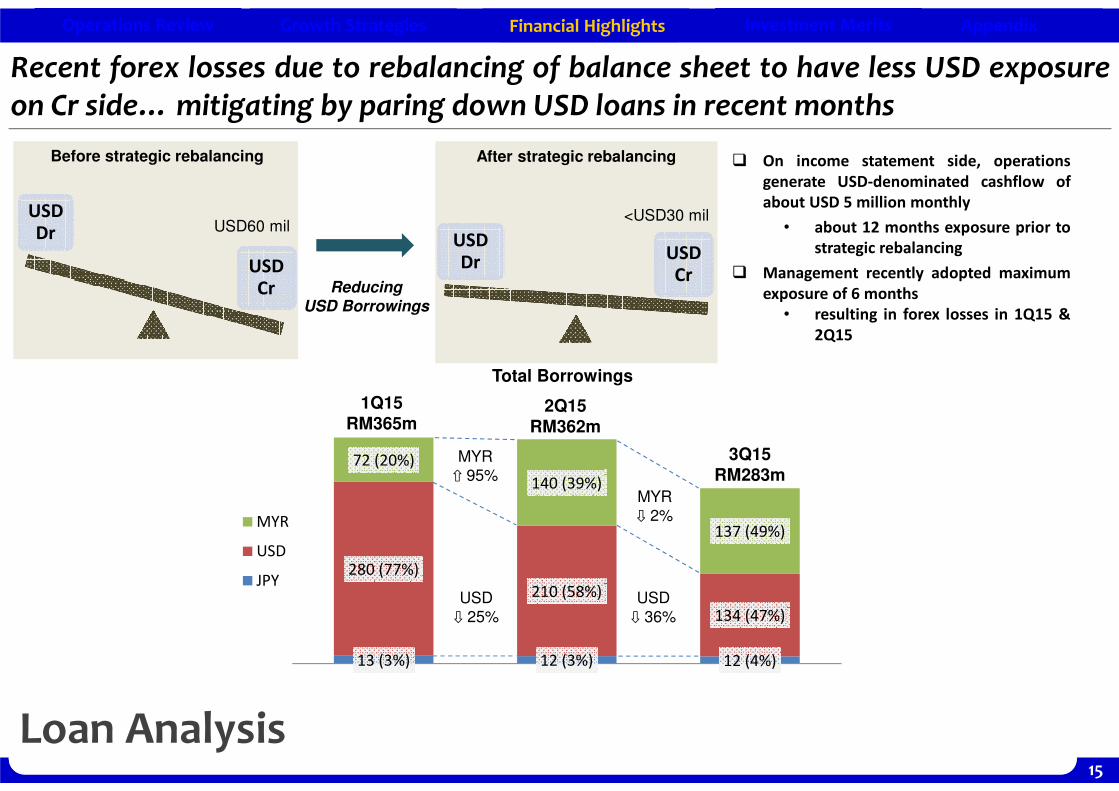
Recent forex losses due to rebalancing of balance sheet to have less USD exposure
on Cr side…mitigating by paring down USD loans in recent months
Financial Highlights
Loan Analysis
� On income statement side, operations
generate USD-denominated cashflow of
about USD 5 million monthly
• about 12 months exposure prior to
strategic rebalancing
� Management recently adopted maximum
exposure of 6 months
• resulting in forex losses in 1Q15 &
2Q15
Before strategic rebalancing
USD60 mil
After strategic rebalancing
<USD30 mil
Reducing
USD Borrowings
13 (3%) 12 (3%) 12 (4%)
280 (77%)
210 (58%)
134 (47%)
72 (20%)
140 (39%)
137 (49%)MYR
USD
JPY
MYR
⇩ 2%
USD
⇩ 36%
USD
⇩ 25%
MYR
⇧ 95%
1Q15
RM365m2Q15
RM362m
3Q15
RM283m
Total Borrowings

Po
were
d b
y T
win
En
gin
es
INVESTMENT MERITS

17
Operations Review Growth Strategies Financial Highlights Investment Merits Appendix
Investment Merits
A high-growth proposition all-round... attractive proxy to the burgeoning packaging sector
and Southern Malaysia property market
Investment Merits
MANUFACTURING
• Top 3 stretch film producer in the world
• Consumer packaging segment facilitates
entry into burgeoning F&B and FMCG sectors
• Further integration and expansion initiatives
position Group to cater to larger regional
clientele and enhance competitiveness
PROPERTY DEVELOPMENT
• Reputable developer in the southern states
of Johor and Melaka
• Current projects of RM1.4 bil
• Pipeline GDV of RM4.0 bil on existing
landbank to sustain another 8 years
• Future projects displaying higher GDV/acre
• Strong fundamentals with strong upside to profit and margin expansion
• Dividend policy of minimum 30% payout
� 31.7% dividend payout in FY2014
• Valuations to be compressed with foreseeable earnings boost
• Trading at trailing 12-month PE of 9.8x and EV/EBITDA of 7.4x (as at 26 June 2015)

18
Operations Review Growth Strategies Financial Highlights Investment Merits Appendix2
.7
2.7
2.7
4.5
8.1
14
.2
4.2
17
.2
10
.8
19
.4
25
.8
30
.1
35
.4
47
.1
20
.3
22
.1
49.2% 48.0%
74.0%
26.6%
36.6%
49.8%
28.7%36.1%
28.8%32.1% 33.4% 35.9%
52.1%
31.7%
18.6%
2001 2002 2003 2004 2005 2006 2007 2008 2009 2010 2011 2012 2013 2014 9M15
RM’mil Dividend History
Net Dividend Payout Special Dividend Payout Ratio
Group has dividend policy of minimum 30% net profit payout…
Dividend History
� FY2014 Dividends (Total dividend of 21 sen):
• Paid interim dividend of 8 sen per share on 8 August 2014
• Paid final dividend of 13 sen per share on 6 February 2015
� FY2015 Dividends :
• Declared first interim dividend of 9 sen per share (Ex-date: 15 July 2015, payable: 7 August 2015)
Dividend Policy:
Minimum 30% of Net Profit(effective FY2011)
Investment Merits
FY14 Dividend Payout
RM47.1Million
FY14 Dividend Payout
RM47.1Million
Share Dividend
5.9
Po
were
d b
y T
win
En
gin
es
Thank You
Contacts:
Ms. Jocelyn Ng [email protected] T: 03-5519 1325
Ms. Julia Pong [email protected] T: 03-2711 1391
Question and Answer Session