
Science units Grade 12 advanced · 2011-10-18 · Science units Grade 12 advanced Contents 12AB.1...
198
Science units Grade 12 advanced Contents 12AB.1 Biological energetics 391 12AC.1 The periodic table 455 12AP.1 Gravity and circular motion 507 12AB.2 Transport systems 401 12AC.2 Rates of reaction 465 12AP.2 The nature of matter 515 12AB.3 Control, coordination and homeostasis 413 12AC.3 Acids and K values 471 12AP.3 Thermodynamics 525 12AB.4 Human immune system 427 12AC.4 Energy and entropy 477 12AP.4 Oscillations 533 12AB.5 Genetic inheritance 435 12AC.5 Organic reaction mechanisms 483 12AP.5 Electrostatic charge and force 543 12AB.6 Ecological relationships 441 12AC.6 Aromatic organic chemistry 489 12AP.6 Quantum and nuclear physics 557 12AB.7 Biotechnology 449 12AC.7 Making and using chemicals 495 12AP.7 Astrophysics and cosmology 569 12AC.8 Macromolecules 501
Transcript of Science units Grade 12 advanced · 2011-10-18 · Science units Grade 12 advanced Contents 12AB.1...
Science units Grade 12 advanced
Contents
12AB.1 Biological energetics 391 12AC.1 The periodic table 455 12AP.1 Gravity and circular motion 507
12AB.2 Transport systems 401 12AC.2 Rates of reaction 465 12AP.2 The nature of matter 515
12AB.3 Control, coordination and homeostasis
413 12AC.3 Acids and K values 471 12AP.3 Thermodynamics 525
12AB.4 Human immune system 427 12AC.4 Energy and entropy 477 12AP.4 Oscillations 533
12AB.5 Genetic inheritance 435 12AC.5 Organic reaction mechanisms
483 12AP.5 Electrostatic charge and force
543
12AB.6 Ecological relationships 441 12AC.6 Aromatic organic chemistry 489 12AP.6 Quantum and nuclear physics
557
12AB.7 Biotechnology 449 12AC.7 Making and using chemicals 495 12AP.7 Astrophysics and cosmology 569
12AC.8 Macromolecules 501
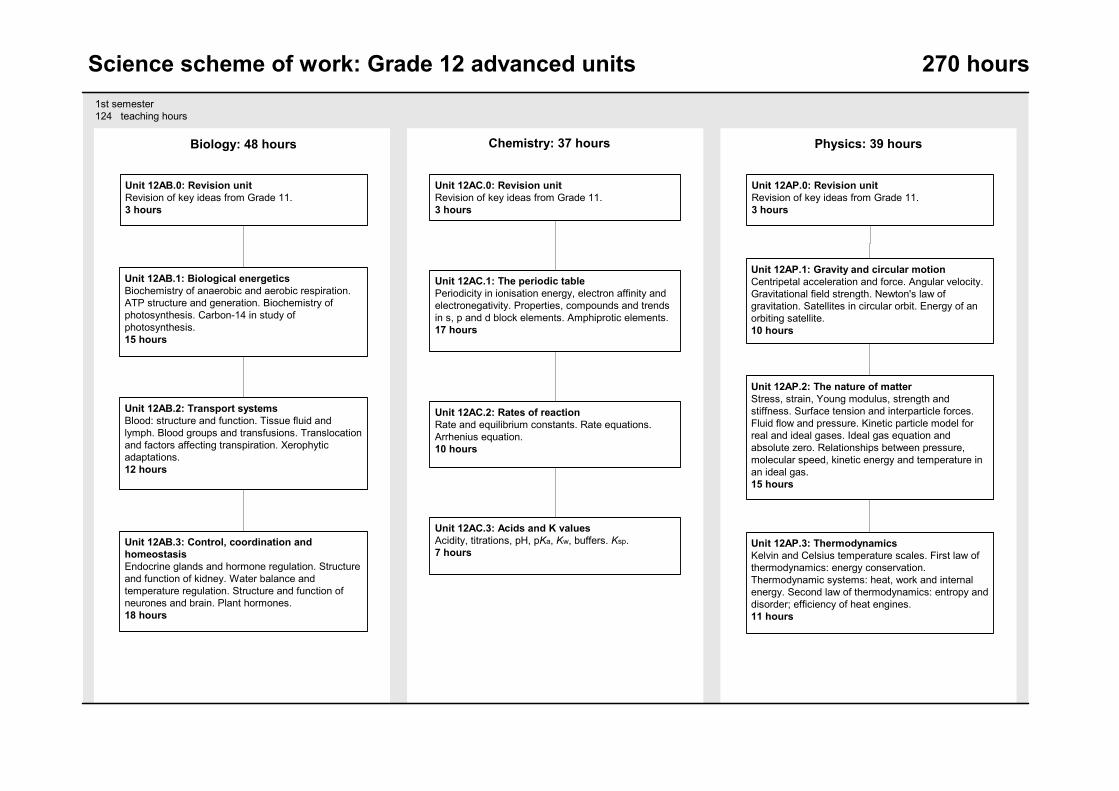
Science scheme of work: Grade 12 advanced units 270 hours1st semester124 teaching hours
Unit 12AB.0: Revision unitRevision of key ideas from Grade 11.3 hours
Biology: 48 hours Chemistry: 37 hours Physics: 39 hours
Unit 12AB.1: Biological energeticsBiochemistry of anaerobic and aerobic respiration.ATP structure and generation. Biochemistry ofphotosynthesis. Carbon-14 in study ofphotosynthesis.15 hours
Unit 12AB.2: Transport systemsBlood: structure and function. Tissue fluid andlymph. Blood groups and transfusions. Translocationand factors affecting transpiration. Xerophyticadaptations.12 hours
Unit 12AC.0: Revision unitRevision of key ideas from Grade 11.3 hours
Unit 12AC.1: The periodic tablePeriodicity in ionisation energy, electron affinity andelectronegativity. Properties, compounds and trendsin s, p and d block elements. Amphiprotic elements.17 hours
Unit 12AC.2: Rates of reactionRate and equilibrium constants. Rate equations.Arrhenius equation.10 hours
Unit 12AB.3: Control, coordination andhomeostasisEndocrine glands and hormone regulation. Structureand function of kidney. Water balance andtemperature regulation. Structure and function ofneurones and brain. Plant hormones.18 hours
Unit 12AP.0: Revision unitRevision of key ideas from Grade 11.3 hours
Unit 12AP.1: Gravity and circular motionCentripetal acceleration and force. Angular velocity.Gravitational field strength. Newton's law ofgravitation. Satellites in circular orbit. Energy of anorbiting satellite.10 hours
Unit 12AP.2: The nature of matterStress, strain, Young modulus, strength andstiffness. Surface tension and interparticle forces.Fluid flow and pressure. Kinetic particle model forreal and ideal gases. Ideal gas equation andabsolute zero. Relationships between pressure,molecular speed, kinetic energy and temperature inan ideal gas.15 hours
Unit 12AP.3: ThermodynamicsKelvin and Celsius temperature scales. First law ofthermodynamics: energy conservation.Thermodynamic systems: heat, work and internalenergy. Second law of thermodynamics: entropy anddisorder; efficiency of heat engines.11 hours
Unit 12AC.3: Acids and K valuesAcidity, titrations, pH, pKa, Kw, buffers. Ksp.7 hours

Science scheme of work: Grade 12 advanced units 270 hours2nd semester146 teaching hours
Unit 12AB.4: Human immune systemStem cells and monoclonal antibodies. Immunesystem and allergies. Active and passive immunityand vaccination. Antibiotics and bacterial resistance.Cholera, influenza, malaria and TB. Gene therapy.12 hours
Biology: 42 hours Chemistry: 53 hours Physics: 51 hours
Unit 12AB.5: Genetic inheritanceDihybrid crosses. Co-dominance and multiplealleles. Chi-squared test. Human Genome Project.Genetic fingerprinting, screening and counselling.9 hours
Unit 12AB.6: Ecological relationshipsAdaptations of animals to their environment.Population growth dynamics. Ecological succession.Biological control. Conservation and preservationissues.13 hours
Unit 12AC.4: Energy and entropyBorn-Haber cycles. Second law of thermodynamics.Standard entropy and free energy changes.16 hours
Unit 12AC.5: Organic reaction mechanismsShape of aliphatic organic compounds and electronicstructure. Electrophilic and nucleophilic reactionmechanisms.11 hours
Unit 12AC.6: Aromatic organic chemistryNomenclature, structure and bonding of aromaticcompounds. Arene chemistry. Mechanism ofelectrophilic substitution and factors affecting it.Nitroarenes, amines and azo-compounds.11 hours
Unit 12AB.7: BiotechnologyGenetically engineered human insulin. Biosensorsand blood glucose. Monoclonal antibodies.Immobilised enzymes.8 hours
Unit 12AP.4: OscillationsFree oscillations. Simple harmonic motion:equations and graphs for displacement, velocity,acceleration, potential and kinetic energy. Dampedand forced oscillations. Resonance.9 hours
Unit 12AP.5: Electrostatic charge and forceUniform electric field. Coulomb's law for pointcharges. Electric potential, field strength andpotential gradient. Electrical and gravitational fields.Capacitors: charge and energy; combination inseries and in parallel.13 hours
Unit 12AP.6: Quantum and nuclear physicsEmission and absorption spectra. Photoelectriceffect. Quantisation of electron orbital energy.Quantisation of electric charge. Wave-particleduality of electrons. Equivalence of mass andenergy. Schrödinger model of hydrogen atom.14 hours
Unit 12AP.7: Astrophysics and cosmologyThe visible Universe: stars and galaxies; scale andstructure. Very distant objects: look-back time;redshift; universal expansion; the Big Bang;spacetime. Formation and evolution of stars andplanets.15 hours
Unit 12AC.7: Making and using chemicalsEconomics of the alkali industry. Industrial processesversus environment. Exploitation of Qatar's naturalgas.7 hours
Unit 12AC.8: MacromoleculesStructure and function of amino acids, proteins,nucleotides and nucleic acids. Relationships betweenphysical properties of polymers and their structures.Polymer additives, plasticisers, foams.8 hours

391 | Qatar science scheme of work | Grade 12 advanced | Unit 12AB.1 | Biology 1 © Education Institute 2005
GRADE 12A: Biology 1
Biological energetics
About this unit This unit is the first of seven units on biology for Grade 12 advanced.
The unit is designed to guide your planning and teaching of biology lessons. It provides a link between the standards for science and your lesson plans.
The teaching and learning activities should help you to plan the content and pace of lessons. Adapt the ideas to meet your students’ needs. For consolidation activities, look at the scheme of work for Grades 10A and 11A.
You can also supplement the activities with appropriate tasks and exercises from your school’s textbooks and other resources.
Introduce the unit to students by summarising what they will learn and how this builds on earlier work. Review the unit at the end, drawing out the main learning points, links to other work and real world applications.
Previous learning To meet the expectations of this unit, students should already be able to describe the structural features of mitochondria and how these relate to the chemical processes of respiration. They should know that ATP is the immediate energy source in cellular processes and be able to relate this to respiration. They should be able to outline the reaction steps in the glycolysis, Krebs cycle and oxidative phosphorylation stages of respiration. They should be able to describe the structural features of chloroplasts and know how these relate to the chemical processes of photosynthesis. They should know that ATP is the immediate energy source in cellular processes and be able to relate this to photosynthesis. They should be able to outline the reaction steps in the light-dependent and light-independent stages of photosynthesis. They should be able to relate the structure of a plant leaf to its function in photosynthesis and understand the factors limiting the rate of photosynthesis.
Expectations By the end of the unit, students understand the basic biochemistry of anaerobic respiration and compare this with aerobic respiration. They know the structure of ATP and ADP, the reactions in the three stages of aerobic respiration and the role of NAD and ATP. They understand why aerobic and anaerobic respiration yield different amounts of energy in the form of ATP. They understand respiratory quotient and relate this to energy values of respiratory substrates. They know the reactions in the two stages of photosynthesis and the importance of the Calvin cycle. They know about cyclic and non-cyclic photophosphorylation and the use of ATP in the light-independent stage of photosynthesis. They know how carbon-14 has been used to investigate photosynthesis. They understand the absorption spectrum of chlorophyll and know that the pigments of chlorophyll can be separated by chromatography.
Students who progress further have a more detailed knowledge and deeper understanding of the biochemistry involved in the processes studied. They know that there is more than one form of chlorophyll and that different forms of chlorophyll have different absorption spectra. They understand the principles of chromatography.
Resources The main resources needed for this unit are: • overhead projector (OHP), whiteboard • yeast culture, thermostatically controlled water baths • video clip of a sprint race • models of ATP, ADP and glucose • photomicrographs of mitochondria • sets of prepared cards (e.g. for glycolysis, Krebs cycle) • Internet access • model waterwheel or OHT diagram • calorimeter • cabbage, centrifuge, buffer solution, dichlorophenolindophenol • chromatography paper and/or thin-layer plates • hand spectrometer and strong light source
Key vocabulary and technical terms Students should understand, use and spell correctly: • anaerobic respiration, aerobic respiration • glycolysis, the Krebs cycle, oxidative phosphorylation • pyruvate, lactic acid, fermentation, oxygen debt • NAD, FAD, ATP, chemiosmosis • respiratory quotient • light-dependent reactions, light-independent reactions • cyclic photophosphorylation, non-cyclic photophosphorylation • photolysis, NADP • carbon-14 • absorption spectrum, action spectrum • photosystems 1 and 2 • thylakoid membranes • chlorophyll pigments
UNIT 12AB.1 15 hours

392 | Qatar science scheme of work | Grade 12 advanced | Unit 12AB.1 | Biology 1 © Education Institute 2005
Objectives for the unit
15 hours SUPPORTING STANDARDS CORE STANDARDS
Grade 12 standards EXTENSION STANDARDS
11A.5.1 Describe the structure of mitochondria … and relate [this] to the biochemical … reactions of respiration …
12A.5.1 Explain how the biochemistry, products and energy release of anaerobic respiration differ from those of aerobic respiration and how anaerobic respiration builds up an oxygen debt.
11A.6.1 Describe the role of ATP as the universal energy currency in all living organisms and relate this to respiration …
12A.5.2 Explain the structure and function of ADP and ATP and the synthesis of ATP in the electron transport chain on the membranes of the mitochondria.
12A.5.3 Outline glycolysis as the phosphorylation of glucose and the subsequent splitting of hexose phosphate (6C) into two triose phosphate molecules, which are further oxidised with a small yield of ATP and reduced NAD.
11A.6.2 Describe the reaction steps in the three stages of aerobic respiration (glycolysis, Krebs cycle and oxidative phosphorylation), including the roles of oxygen and ATP. 12A.5.4 Explain that when oxygen is available, pyruvate is converted into acetyl coenzyme
A (2C), which then combines with oxaloacetate (4C) to form citrate (6C).
12A.5.5 Explain the Krebs cycle as a series of decarboxylation and dehydrogenation reactions in the matrix of the mitochondria that reconvert citrate to oxaloacetate; explain the role of NAD.
12A.5.6 Explain the role of oxygen in the process of oxidative phosphorylation.
12A.5.7 Explain respiratory quotient and the relative energy values of carbohydrates, proteins and lipids as respiratory substrates.
11A.5.1 Describe the structure of … chloroplasts and link [this] to the biochemical and photochemical reactions of … photosynthesis.
11A.6.1 Describe the role of ATP as the universal energy currency in all living organisms and relate this to … photosynthesis.
12A.6.1 Explain that energy is transferred by the photoactivation of chlorophyll resulting in the splitting of water molecules and the transfer of energy to ATP and NADPH; that this involves cyclic and non-cyclic photophosphorylation; that this generates hydrogen for the light-independent stage of the process; that gaseous oxygen is produced.
11A.6.3 Describe the reaction steps in the light-dependent and light-independent stages of photosynthesis, including the role of ATP.
12A.6.2 Explain that the Calvin cycle involves the light-independent fixation of carbon dioxide by combination with RuBP (5C) to form two molecules of GP (3C), that ATP and NADP are required for the reduction of GP to carbohydrate, and that RuDP is regenerated.
12A.6.3 Describe how carbon-14 has been used to establish the biochemistry of photosynthesis.
1 hour
Comparing anaerobic with aerobic respiration
1 hour
ATP: its structure, function and synthesis
1 hour
Glycolysis
2 hours
The ‘link reaction’ and the Krebs cycle
2 hours
Oxidative phosphorylation
2 hours
Respiratory quotients
1 hour
Biochemistry of the light-dependent reaction
2 hours
Biochemistry of the light-independent reaction
3 hours
Light and pigments
12A.6.4 Know that chlorophyll reflects green light and absorbs in the red and blue areas of the spectrum, and that the pigments of chlorophyll can be separated by chromatography.
Unit 12AB.1

393 | Qatar science scheme of work | Grade 12 advanced | Unit 12AB.1 | Biology 1 © Education Institute 2005
Activities
Objectives Possible teaching activities Notes School resources
Introduce this topic by quizzing students on their knowledge of respiration by recalling earlier work, such as that from Unit 11AB.1. Ask students such questions as: • What is respiration? • How does the body release the energy in food? And why does the process yield energy? • Why does the body need energy?
Make sure students appreciate that food contains potential energy and the cell systematically breaks down complex organic molecules that are rich in energy to simpler substances that have less energy. Some of the energy released from food can be used to do work while the rest is released as heat.
Ask students to write the word and formula equations for aerobic respiration in animals and plants (recall from Standard 9.8.1). Help them, if necessary, to reproduce the correct equations. Now ask them to explain what the process involves in the cell. Where does it occur? What happens to the sugar, glucose? Try to establish that the glucose is completely oxidised to carbon dioxide and water; compare the process with combustion. Ask them if they think the same combustion process happens inside our cells? Establish that body temperature does not support rapid combustion with oxygen but rather a slower enzyme-regulated process in which the enzymes lower the activation energy (recall from Unit 10AB.3). Glucose is broken down gradually, in a series of steps, with each step catalysed by a different enzyme. Show using an OHT that a large amount of energy is released and one molecule of glucose yields in excess of 30 molecules of ATP.
Use this column to note your own school’s resources, e.g. textbooks, worksheets.
Now compare the process of anaerobic respiration by asking students if they know whether respiration can occur in the absence of oxygen. Prompt them with questions about what happens to the body when you run very fast, and about fermentation. Show them the word and formula equations for anaerobic respiration in animals and plants: lactic acid fermentation and alcohol fermentation, respectively. Explain that most of the potential energy remains in the organic molecules present at the end of the process (lactic acid in animals, alcohol in plants) – the glucose molecule is incompletely oxidised and yields only two molecules of ATP in anaerobic respiration. Also point out that the cell’s supply of the coenzyme NAD would run out (and anaerobic respiration stop) unless there was a stage to regenerate it from NADH as, for example, in the production of lactic acid by reduction of pyruvate.
1 hour
Comparing anaerobic with aerobic respiration Explain how the biochemistry, products and energy release of anaerobic respiration differ from those of aerobic respiration and how anaerobic respiration builds up an oxygen debt.
Ask students to work in pairs to investigate the effect of temperature on the rate of fermentation in yeast as follows. Use a yeast culture and thermostatically controlled water baths at 20 °C, 35 °C and 50 °C. Invert fermentation tubes full of yeast culture carefully into test-tubes containing10 cm3 of yeast culture into each water bath. Record the length of the carbon dioxide bubble within each fermentation tube at intervals of 10 minutes. Does the rate of fermentation change? Most enzyme-controlled processes double in rate for each 10 °C rise in temperature. Do the results confirm this general rule or not?
Visit a bakery to see how fermentation is used in one of the earliest examples of biotechnology.
Enquiry skills 12A.1.3, 2A.1.4, 2A.3.1–2A.3.3.
Visit opportunity: Visit a bakery.
Unit 12AB.1
394 | Qatar science scheme of work | Grade 12 advanced | Unit 12AB.1 | Biology 1 © Education Institute 2005
Objectives Possible teaching activities Notes School resources
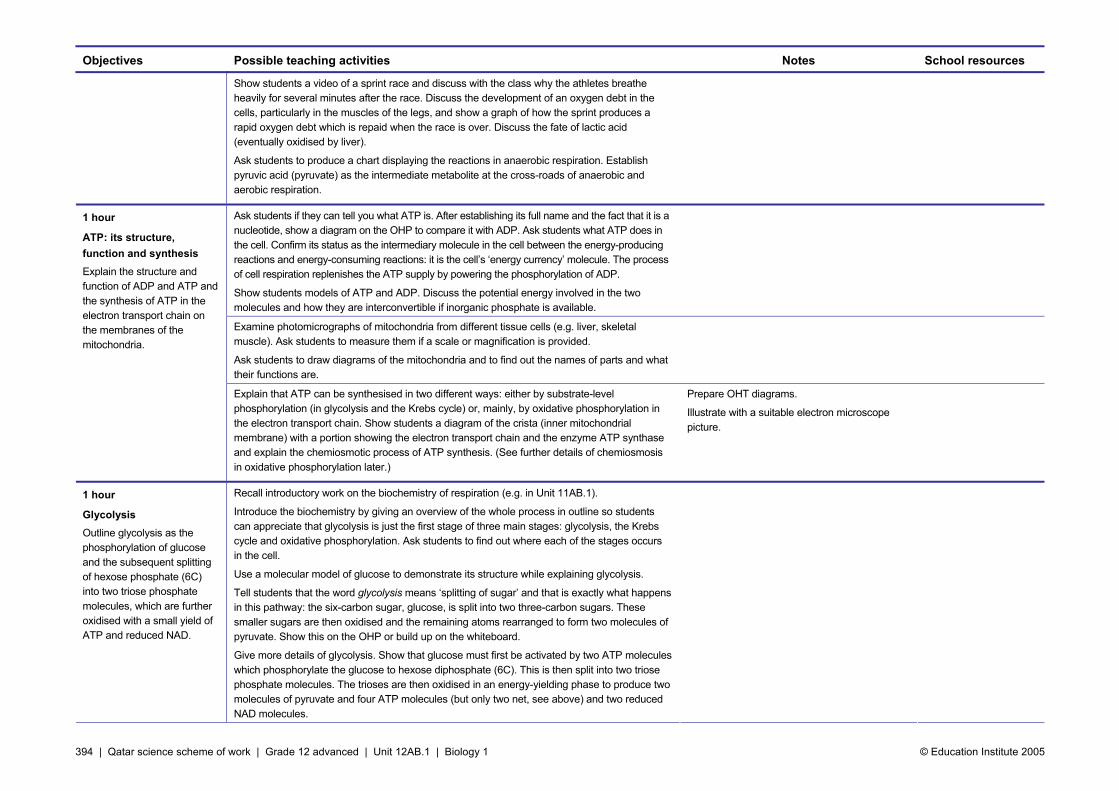
Show students a video of a sprint race and discuss with the class why the athletes breathe heavily for several minutes after the race. Discuss the development of an oxygen debt in the cells, particularly in the muscles of the legs, and show a graph of how the sprint produces a rapid oxygen debt which is repaid when the race is over. Discuss the fate of lactic acid (eventually oxidised by liver).
Ask students to produce a chart displaying the reactions in anaerobic respiration. Establish pyruvic acid (pyruvate) as the intermediate metabolite at the cross-roads of anaerobic and aerobic respiration.
Ask students if they can tell you what ATP is. After establishing its full name and the fact that it is a nucleotide, show a diagram on the OHP to compare it with ADP. Ask students what ATP does in the cell. Confirm its status as the intermediary molecule in the cell between the energy-producing reactions and energy-consuming reactions: it is the cell’s ‘energy currency’ molecule. The process of cell respiration replenishes the ATP supply by powering the phosphorylation of ADP.
Show students models of ATP and ADP. Discuss the potential energy involved in the two molecules and how they are interconvertible if inorganic phosphate is available.
Examine photomicrographs of mitochondria from different tissue cells (e.g. liver, skeletal muscle). Ask students to measure them if a scale or magnification is provided.
Ask students to draw diagrams of the mitochondria and to find out the names of parts and what their functions are.
1 hour
ATP: its structure, function and synthesis Explain the structure and function of ADP and ATP and the synthesis of ATP in the electron transport chain on the membranes of the mitochondria.
Explain that ATP can be synthesised in two different ways: either by substrate-level phosphorylation (in glycolysis and the Krebs cycle) or, mainly, by oxidative phosphorylation in the electron transport chain. Show students a diagram of the crista (inner mitochondrial membrane) with a portion showing the electron transport chain and the enzyme ATP synthase and explain the chemiosmotic process of ATP synthesis. (See further details of chemiosmosis in oxidative phosphorylation later.)
Prepare OHT diagrams.
Illustrate with a suitable electron microscope picture.
1 hour
Glycolysis Outline glycolysis as the phosphorylation of glucose and the subsequent splitting of hexose phosphate (6C) into two triose phosphate molecules, which are further oxidised with a small yield of ATP and reduced NAD.
Recall introductory work on the biochemistry of respiration (e.g. in Unit 11AB.1).
Introduce the biochemistry by giving an overview of the whole process in outline so students can appreciate that glycolysis is just the first stage of three main stages: glycolysis, the Krebs cycle and oxidative phosphorylation. Ask students to find out where each of the stages occurs in the cell.
Use a molecular model of glucose to demonstrate its structure while explaining glycolysis.
Tell students that the word glycolysis means ‘splitting of sugar’ and that is exactly what happens in this pathway: the six-carbon sugar, glucose, is split into two three-carbon sugars. These smaller sugars are then oxidised and the remaining atoms rearranged to form two molecules of pyruvate. Show this on the OHP or build up on the whiteboard.
Give more details of glycolysis. Show that glucose must first be activated by two ATP molecules which phosphorylate the glucose to hexose diphosphate (6C). This is then split into two triose phosphate molecules. The trioses are then oxidised in an energy-yielding phase to produce two molecules of pyruvate and four ATP molecules (but only two net, see above) and two reduced NAD molecules.

395 | Qatar science scheme of work | Grade 12 advanced | Unit 12AB.1 | Biology 1 © Education Institute 2005
Objectives Possible teaching activities Notes School resources
Ask students to carry out a card-sort activity that requires them to put the intermediates of the glycolytic pathway (e.g. glucose, glucose phosphate, ADP + Pi, NAD, ATP, hexose diphosphate) in the correct order. Divide the class into two teams and challenge students to see who can produce the quickest solution. The first team to finish may not win if they have taken less care with accuracy.
Prepare sets of cards for students to sort.
2 hours
The ‘link reaction’ and the Krebs cycle Explain that when oxygen is available, pyruvate is converted into acetyl coenzyme A (2C), which then combines with oxaloacetate (4C) to form citrate (6C).
Explain the Krebs cycle as a series of decarboxylation and dehydrogenation reactions in the matrix of the mitochondria that reconvert citrate to oxaloacetate; explain the role of NAD.
Tell students that when oxygen is present, the pyruvate enters the mitochondria for the aerobic stages of respiration: the Krebs cycle and oxidative phosphorylation. The pyruvate still contains most of the energy from the glucose.
Show students a summary diagram of the Krebs cycle, including the ‘link reaction’ from pyruvate to acetyl coenzyme A. Give them a copy. Ask them to study what is happening and then ask one student to explain the link reaction (this is the junction between glycolysis and the Krebs cycle). Make sure students know that this is the first step in aerobic respiration where CO2 is released. The pyruvate is also oxidised (NAD+ is reduced to NADH) to an acetyl group and combined with a coenzyme, coenzyme A, to activate the remaining molecule to acetyl coenzyme A. The acetyl coenzyme A then feeds its two-carbon molecule into the Krebs cycle by adding to the four-carbon compound oxaloacetate to form the six-carbon citrate.
Ask students to find out about coenzymes using the Internet.
Ask students, in turn, to tell the rest of the class something about the reactions in the Krebs cycle (e.g. eight steps; take place in mitochondrial matrix; each involving a specific enzyme; reactions include a sequence of decarboxylations and dehydrogenations; oxidation of the organic acids in the cycle results from production of reduced coenzymes: NADH and FADH; production of ATP by substrate phosphorylation; oxaloacetate is regenerated, which can then accept another two-carbon acetyl coenzyme A for another turn of the cycle).
Ask students to summarise the total numbers of CO2, NADH and FADH molecules produced in one turn of the Krebs cycle, including the link reaction, starting from pyruvate (three CO2, four NADH and one FADH from each pyruvate molecule).
Ask students what has been the fate of each pyruvate? (They have been oxidised to release three CO2 and reduced coenzymes, as above.)
Ask students to carry out a card-sort activity that requires them to put the intermediates of the Krebs cycle in the correct order. Divide the class into two teams and challenge students to see who can produce the quickest solution. The first team to finish may not win if they have taken less care with accuracy.
Encourage students to find out about Hans Krebs and why a series of reactions is named after him.
Prepare OHT diagram and copies for students.
ICT opportunity: Use of the Internet.
Prepare sets of cards for students to sort.
ICT opportunity: Use of the Internet.

396 | Qatar science scheme of work | Grade 12 advanced | Unit 12AB.1 | Biology 1 © Education Institute 2005
Objectives Possible teaching activities Notes School resources
2 hours
Oxidative phosphorylation Explain the role of oxygen in the process of oxidative phosphorylation.
Ask students where the energy that was in the pyruvate molecule has gone (most is still in the reduced coenzymes).
Ask students how much energy in the form of ATP molecules has been produced from the original glucose molecule (four by substrate-level phosphorylation: two from glycolysis and two from the Krebs cycle).
Tell students that the final stage of aerobic respiration is oxidative phosphorylation which, coupled to the electron transport chain, powers the production of most of the ATP molecules produced in respiration.
This is a difficult concept for students to understand; using the following waterfall analogy may help. Show students, on the OHP or board, a diagram of a series of waterfalls with water flowing. Now add the ‘inflowing molecules’ (NADH) and show by arrows the downward flow of molecules to the next level (FADH) and then further arrows down to other molecules in turn, such as cytochromes b, then c and then a, and finally, at the very bottom, oxygen.
The above analogy can illustrate the gradual release of energy that the real electron transport chain achieves by being arranged sequentially in the inner mitochondrial membrane at successively lower energy levels.
Ask students how the mitochondrion couples this (electron transport) process to ATP synthesis. The answer is a mechanism called chemiosmosis.
Show students a diagram of the crista (inner mitochondrial membrane) with a portion showing the electron transport chain and the membrane protein, the enzyme ATP synthase, and explain the chemiosmotic process of ATP synthesis. (Explain how an ion gradient of H+ is created by the electron chain pumping H+ into the intermembrane space. The H+ then diffuses down the proton gradient through the membrane protein channels, which are protein complexes called ATP synthases, and this ‘fall’ of H+ drives the phosphorylation of ADP to ATP.)
Ask students what the relationship is between the reduced coenzymes NADH and FADH and the number of ATP molecules produced (each NADH that enters the electron transport chain generates a maximum of three ATP molecules and each FADH, with less energy, produces a maximum of two ATP molecules).
Ask students to use their textbook or the Internet to find information on energy production and then to work out the total energy production (as ATP molecules) from one glucose molecule. Ask them to draw up a summary table to show where all the energy-containing molecules (NADH, FADH, ATP) are produced. Compare aerobic and anaerobic ATP yields.
They should arrive at a figure of around 36 ATP molecules produced during aerobic respiration. (The ‘mitochondrial shunt’ or ‘shuttle’ has to be taken into account, in which the two NADH molecules from glycolysis enter the mitochondria but, because of some losses, these produce an average of four ATP molecules and not the expected six ATP from oxidative phosphorylation.)
A figure of just two ATP molecules produced during anaerobic respiration shows that aerobic respiration yields 18 times more ATP than fermentation.
Ask students to produce a wall chart of the biochemistry of respiration.
Prepare a suitable OHT diagram, or use a model.
Prepare an OHT diagram.
ICT opportunity: Use of the Internet.
Enquiry skill 12A.3.4
397 | Qatar science scheme of work | Grade 12 advanced | Unit 12AB.1 | Biology 1 © Education Institute 2005
Objectives Possible teaching activities Notes School resources
2 hours
Respiratory quotients Explain respiratory quotient and the relative energy values of carbohydrates, proteins and lipids as respiratory substrates.
Ask students whether glucose is the sole substrate in respiration. Their answers should indicate that lipids and even proteins can act as substrates as well as other carbohydrates.
Ask students to find out the energy value of different respiratory substrates from their textbook or from the library or Internet.
Demonstrate how the energy value of a substrate is determined by burning a known mass of the substance in pure oxygen in a calorimeter. Knowledge of the calorimeter’s water equivalent will be required to carry out the calculation. Record the temperature at the start and when it reaches its maximum, and use these to calculate the substrate’s energy content. Use different substrates and compare the values. The values obtained may be significantly less than given in the official tables. Ask students to explain. The loss of heat to the surroundings is the main reason for the difference.
Ask students to write down the simple equation for the aerobic respiration of glucose: C6H12O6 + 6O2 ⇒ 6CO2 + 6H2O + energy
Ask them to work out the ratio of O2 taken in to the volume of CO2 released; a ratio of 1:1 is produced by 6CO2 given out compared with 6O2 taken in. However, different substrates will give different ratios of the volumes of oxygen used and carbon dioxide given off. Measuring this ratio produces the respiratory quotient (RQ) and this indicates what substrate is being used in respiration. Ask students what the RQ of glucose is (6/6 = 1.0).
The aerobic respiration of the fatty acid oleic acid produces the following equation:
C18H34O2 + 25.5O2 ⇒ 18CO2 + 17H2O + energy
Ask students to work out its RQ (18/25.5 = 0.7).
Ask students what happens to the RQ when the respiration is anaerobic. C6H12O6 ⇒ 2C2H5OH + 2CO2 + energy
(RQ = 2/0 = infinity, although in reality some respiration is likely to be aerobic so a small volume of O2 will be taken up so the RQ will be above 2.)
ICT opportunity: Use of the Internet.
Use a simple calorimeter with a supply of oxygen
Enquiry skills 12A.1.1, 12A.3.1, 12A.3.3
1 hour
Biochemistry of the light dependent reaction Explain that energy is transferred by the photoactivation of chlorophyll resulting in the splitting of water molecules and the transfer of energy to ATP and NADPH; that this involves cyclic and non-cyclic photophosphorylation; that this generates hydrogen for the light-independent stage of the process; that gaseous oxygen is produced.
Ask students to use the Internet to find out about the work of Robert Hill at Cambridge on chloroplasts and C.B. van Niel at Stanford University on photosynthesis in bacteria.
Describe the discovery by Robert Hill that isolated chloroplasts can evolve oxygen if provided with light, water and a suitable hydrogen acceptor. Ask students what conclusions can be drawn from this ‘Hill reaction’.
The possible conclusions are: • oxygen production requires light; • oxygen comes from water and not from carbon dioxide; • chloroplasts can produce oxygen without other cell components; • a hydrogen acceptor molecule is needed.
Ask students what happens to water in this light-dependent reaction.
The answer is that chloroplasts split water molecules using light energy (photolysis) and so the simple equation for photosynthesis that suggests carbon dioxide as the source of oxygen needs to be rewritten.
ICT opportunity: Use of the Internet.
Enquiry skill 12A.2.1
398 | Qatar science scheme of work | Grade 12 advanced | Unit 12AB.1 | Biology 1 © Education Institute 2005
Objectives Possible teaching activities Notes School resources
To describe the reaction steps, use an OHT or whiteboard to illustrate: • how the absorption of light affects the photosynthetic pigments, especially chlorophyll; • that, in the thylakoid membranes of the chloroplast, electrons from the two chlorophyll
photosystems are each raised to a higher energy level.
During the light reactions there are two possible routes for electron flow: a cyclic route and a non-cyclic route, which both result in photophosphorylation.
Ask students to produce a flow chart of the processes of: • cyclic photophosphorylation; • non-cyclic photophosphorylation.
Cyclic photophosphorylation
Explain that this is the simpler pathway and involves only photosystem 1 and produces only ATP.
The electrons from the photoactivated chlorophyll molecule from photosystem 1 are passed along the electron transport chain in the thylakoid membrane, during which energy is released and used to synthesise ATP from ADP and inorganic phosphate (very similar to chemiosmosis in mitochondria explained earlier in this unit). This process is known as cyclic photophosphorylation since the same electrons that left the chlorophyll return to it again.
Non-cyclic photophosphorylation
Explain that this electron pathway involves the cooperation of both photosystems (in the familiar ‘Z scheme’) and results in the production of both ATP and NADPH, as well as the release of O2.
The electrons from the photoactivated chlorophyll molecule from photosystem 1 are captured by an electron acceptor and used to reduce NADP. Electrons from the photoactivated chlorophyll molecule from photosystem 2 are used to stabilise photosystem 1 and produce ATP by passing along the same electron path as described in the non-cyclic path above.
The photosystem 2 chlorophyll’s lost electrons are replaced by those from the splitting of water (photolysis), resulting in the release of oxygen gas and hydrogen ions. The electrons that have passed along the electron transport chain are used, together with the hydrogen ions, to reduce NADP to NADPH.
Demonstrate the Hill reaction by the following procedure (or ask small groups of students to carry out the procedure). Extract chloroplasts from cabbage leaves and isolate them. Then add them to the blue dye DCPIP (dichlorophenol-indophenol), expose the mixture to light and note the change of colour from blue to colourless. This occurs because the blue dye is readily reduced to a colourless compound by reducing agents.
You will need dark green leaves (e.g. cabbage leaves), chilled sucrose/phosphate buffer at pH 6.5, and a bench centrifuge.
Enquiry skills 12A.1.3, 12A.4.1
399 | Qatar science scheme of work | Grade 12 advanced | Unit 12AB.1 | Biology 1 © Education Institute 2005
Objectives Possible teaching activities Notes School resources
Use the OHP or board to outline the light-independent reactions that take place in the stroma of the chloroplasts. Carbon dioxide from the atmosphere is fixed using ATP and reduced NADP from the light-dependent reaction. Carbon dioxide is reduced to carbohydrate.
Ask students to investigate on the Internet how Melvin Calvin helped contribute to our understanding of photosynthesis.
Teach students about the experimental investigations carried out by Calvin as follows. • Use the OHP to show students Calvin’s ‘lollipop’ apparatus, which he used to feed single-
celled algae carbon-14 labelled carbon dioxide for progressively longer light periods. • Use the OHP to show students Calvin’s two-dimensional chromatography technique
separating the carbon-14 labelled products and developed to display a radiochromatogram. • Ask students to work in pairs to arrange a set of cards in the correct sequence displaying the
events of the Calvin cycle. Each card should have only a single reaction described or a single chemical intermediate or even enzyme named (e.g. ribulose bisphosphate carboxylase – the commonest enzyme in the world). Begin by using a simple set of cards showing just the number of carbon atoms in each compound rather than names of compounds. Then add more detailed cards for more advanced students as required.
ICT opportunity: Use of the Internet.
Prepare suitable OHTs.
Write out sets of suitable cards: a simple set and a more complex set.
2 hours
Biochemistry of the light independent reaction Explain that the Calvin cycle involves the light-independent fixation of carbon dioxide by combination with RuBP (5C) to form two molecules of GP (3C), that ATP and NADP are required for the reduction of GP to carbohydrate, and that RuDP is regenerated.
Describe how carbon-14 has been used to establish the biochemistry of photosynthesis.
• Create a set of OHT cutout shapes of the events of the Calvin cycle, as described above, and build the cycle up sequentially on the OHP, with a logical progression and explanation.
• Provide students with a template of the Calvin cycle with blank boxes to be filled with the names of the intermediates. Either ask students to complete the exercise from their own research or use the template in conjunction with the card activity above.
Ask students to identify the way that the light-dependent reaction helps the light-independent reaction (through ATP and reduced NADP).
Prepare OHT cutout shapes of Calvin cycle components.
Prepare a Calvin cycle template.
3 hours
Light and pigments Know that chlorophyll reflects green light and absorbs in the red and blue areas of the spectrum, and that the pigments of chlorophyll can be separated by chromatography.
Ask students to work in pairs to extract the pigments from leaves and carry out a leaf pigment separation and identification by a chromatographic technique. This could be either • paper chromatography
or • thin-layer chromatography.
Demonstrate the absorption of light by plant pigments by shining a light through a solution of the pigments and observing the transmitted light using a spectrometer (red and blue spectral regions may appear black but the green region will be seen clearly because this is not absorbed but reflected).
Show students an OHT of an absorption spectrum of the plant pigments and ask them to explain its shape.
Show students an action spectrum of photosynthesis and ask them to explain its shape.
Demonstrate fluorescence. Shine a strong light onto a tube of extracted pigment and turn all the lights out; the chlorophyll solution will fluoresce deep red in the darkened room.
Students will need chromatography paper or previously made up thin-layer plates of silica gel on microscope slides.
You will need a hand-held spectrometer.
Prepare OHTs of an absorption spectrum and an action spectrum for photosynthesis.
Use a projector lamp as the strong light source.
400 | Qatar science scheme of work | Grade 12 advanced | Unit 12AB.1 | Biology 1 © Education Institute 2005
Assessment
Examples of assessment tasks and questions Notes School resources
Explain what the term oxygen debt means and how such a debt is produced.
a. Explain the process of glycolysis and lactic acid production.
b. What is the fate of lactic acid when aerobic conditions return?
Calculate the number of reduced NAD and FAD molecules produced by each glucose molecule entering the respiratory pathway when oxygen is available.
Explain how ATP is produced by electron transport and oxidative phosphorylation.
Explain the processes of:
a. cyclic photophosphorylation;
b. non-cyclic photophosphorylation.
Assessment Set up activities that allow students to demonstrate what they have learned in this unit. The activities can be provided informally or formally during and at the end of the unit, or for homework. They can be selected from the teaching activities or can be new experiences. Choose tasks and questions from the examples to incorporate in the activities.
a. Complete the spaces in the diagram of the Calvin cycle.
b. Explain how the reactions of the light-dependent stage help the reactions of the light-independent stage of photosynthesis.
Provide a suitable diagram of the Calvin cycle to be completed by students.
Unit 12AB.1
401 | Qatar science scheme of work | Grade 12 advanced | Unit 12AB.2 | Biology 2 © Education Institute 2005
GRADE 12A: Biology 2
Transport systems
About this unit This unit is the second of seven units on biology for Grade 12 advanced.
The unit is designed to guide your planning and teaching of biology lessons. It provides a link between the standards for science and your lesson plans.
The teaching and learning activities should help you to plan the content and pace of lessons. Adapt the ideas to meet your students’ needs. For consolidation activities, look at the scheme of work for Grades 10A and 11A.
You can also supplement the activities with appropriate tasks and exercises from your school’s textbooks and other resources.
Introduce the unit to students by summarising what they will learn and how this builds on earlier work. Review the unit at the end, drawing out the main learning points, links to other work and real world applications.
Previous learning To meet the expectations of this unit, students should already be able to explain why multicellular animals need a transport system for respiratory gases, water, food and waste, and describe the structure and function of the human circulatory system. They should understand the need for a transport system in multicellular plants. They should recall the structure, function and distribution of phloem and xylem in dicotyledonous plants, and be able to describe translocation and transpiration.
Expectations By the end of the unit, students know the structure and functions of red and white blood cells and the role of blood, fluid tissue and lymph in transport. They understand the roles of the constituents of blood in the transport of oxygen and carbon dioxide. They know the human blood groups and their significance. They know that organic materials are transported in plant phloem by translocation and that there are several hypotheses to explain the mechanism. They understand the factors affecting the rate of transpiration and the adaptations of xerophytic plants for water conservation
Students who progress further have a more detailed knowledge and understanding of oxygen transport by reference to such additional aspects as foetal haemoglobin and muscle myoglobin. They understand the Rhesus blood group and the complications associated with Rhesus factor in pregnancy. They also have a more detailed understanding of xerophytic plants.
Resources The main resources needed for this unit are: • microscopes, eyepiece graticule, stage micrometer • microscope slides of blood and leaves • animal blood • haemocytometer • video camera and monitor, digital camera • overhead projector (OHP) • prepared OHTs and sets of cards on blood and body fluids • template shapes of red blood cells • potometers, leafy shoots, electric fan, polythene bag • autoradiographs of plants • Internet access
Key vocabulary and technical terms Students should understand, use and spell correctly: • phagocyte, monocyte, neutrophil, lymphocyte • haemoglobin, carbonic anhydrase • dissociation curves, Bohr effect • blood groups, transfusions, antigens, antibodies • stomatal pores, guard cells • xerophytes, xerophytic features • translocation, mass flow, pressure flow • chemiosmotic • autoradiography • crassulacean acid metabolism • electro-osmotic • transcellular
UNIT 12AB.2 12 hours
402 | Qatar science scheme of work | Grade 12 advanced | Unit 12AB.2 | Biology 2 © Education Institute 2005
Objectives for the unit
12 hours SUPPORTING STANDARDS CORE STANDARDS
Grade 12 standards EXTENSION STANDARDS
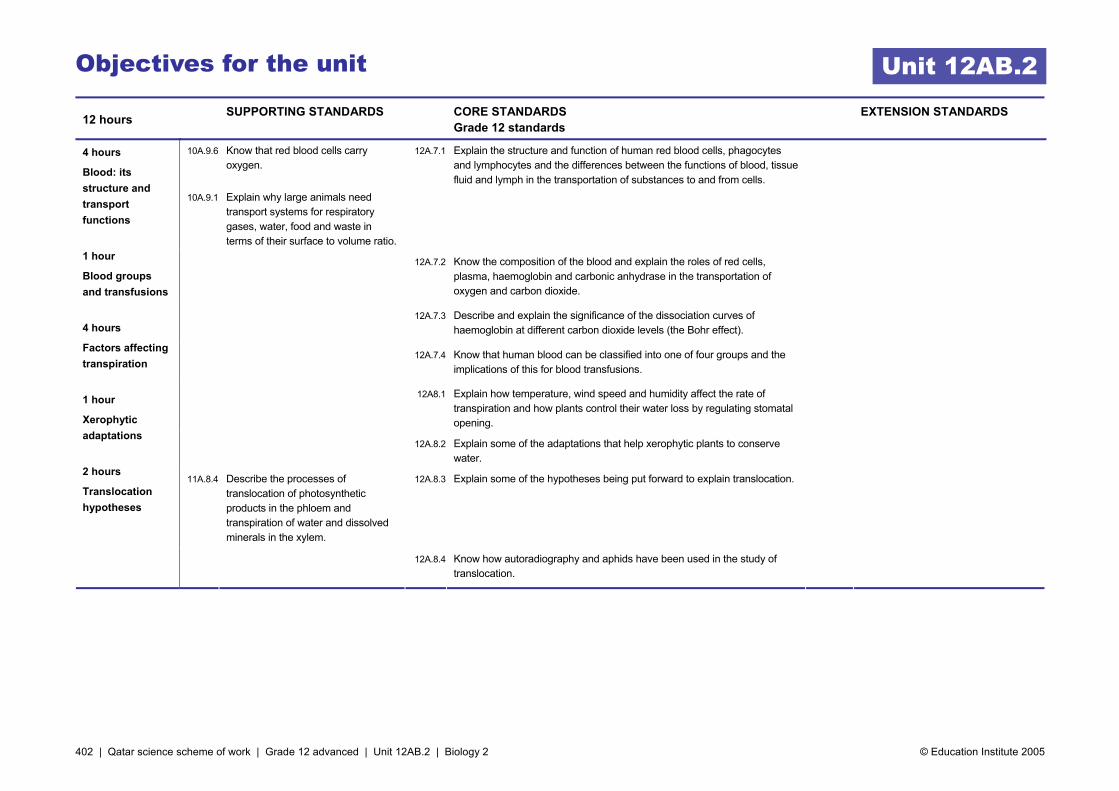
10A.9.6 Know that red blood cells carry oxygen.
10A.9.1 Explain why large animals need transport systems for respiratory gases, water, food and waste in terms of their surface to volume ratio.
12A.7.1 Explain the structure and function of human red blood cells, phagocytes and lymphocytes and the differences between the functions of blood, tissue fluid and lymph in the transportation of substances to and from cells.
12A.7.2 Know the composition of the blood and explain the roles of red cells, plasma, haemoglobin and carbonic anhydrase in the transportation of oxygen and carbon dioxide.
12A.7.3 Describe and explain the significance of the dissociation curves of haemoglobin at different carbon dioxide levels (the Bohr effect).
12A.7.4 Know that human blood can be classified into one of four groups and the implications of this for blood transfusions.
12A8.1 Explain how temperature, wind speed and humidity affect the rate of transpiration and how plants control their water loss by regulating stomatal opening.
12A.8.2 Explain some of the adaptations that help xerophytic plants to conserve water.
11A.8.4 Describe the processes of translocation of photosynthetic products in the phloem and transpiration of water and dissolved minerals in the xylem.
12A.8.3 Explain some of the hypotheses being put forward to explain translocation.
4 hours
Blood: its structure and transport functions
1 hour
Blood groups and transfusions
4 hours
Factors affecting transpiration
1 hour
Xerophytic adaptations
2 hours
Translocation hypotheses
12A.8.4 Know how autoradiography and aphids have been used in the study of
translocation.
Unit 12AB.2

403 | Qatar science scheme of work | Grade 12 advanced | Unit 12AB.2 | Biology 2 © Education Institute 2005
Activities
Objectives Possible teaching activities Notes School resources
Ask students, individually, to examine human blood smears under the microscope at high magnification and to produce diagrams of samples of cells observed.
Use the video camera attachment to the microscope to display blood cells on a monitor. Ask students to identify the types of cells: red blood cells, phagocytes (neutrophils and monocytes/ macrophages) and lymphocytes by reference to appearance and relative size.
Ask students to measure the sizes of the blood cells using microscopes fitted with an eyepiece graticule.
Provide sets of cards with the names of the blood cells on one set and their functions on another set. Ask students to match the cards.
Give students a table like the one below and ask them to complete it.
Red blood cells
Phagocytes (neutrophils and monocytes/macrophages)
Lymphocytes
Structure
Function
Site of production
Show students large diagrams, using the OHP or interactive whiteboard, of each of the blood cells and discuss their structures and functions in turn.
Provide sets of cards with the names of the body fluids (blood plasma, tissue fluid and lymph) on one set and their functions on another set. Ask students to match the cards.
Show students a diagram of a capillary bed also including a lymphatic and ask them to explain how tissue fluid is formed and removed by reference to blood hydrostatic pressure and osmotic pressure. Also explain how lymph is produced. Ask students to compare the composition of the blood plasma, tissue fluid and lymph.
Ask a nurse to visit the class to talk about blood tests.
Students will need microscopes and blood smears on slides.
You need to set up a video camera attachment to the microscope.
You will need a microscope with eyepiece graticule. You may also need a stage micrometer if the microscope is not already calibrated.
Prepare cards of blood cells and their functions.
Prepare cards of fluids and their functions.
Arrange for a visit by a nurse.
Use this column to note your own school’s resources, e.g. textbooks, worksheets.
4 hours
Blood: its structure and transport functions Explain the structure and function of human red blood cells, phagocytes and lymphocytes and the differences between the functions of blood, tissue fluid and lymph in the transportation of substances to and from cells.
Know the composition of the blood and explain the roles of red cells, plasma, haemoglobin and carbonic anhydrase in the transportation of oxygen and carbon dioxide.
Describe and explain the significance of the dissociation curves of haemoglobin at different carbon dioxide levels (the Bohr effect).
Ask students to produce a flow chart or a table illustrating all the components of blood, including brief details of the structure, numbers and functions of each of the blood cells.
Ask students to construct a pie chart of the composition of human blood.
Use a centrifuge to separate the components of animal blood and examine the result.
Ask students to describe how the red blood cell is adapted for the transport of oxygen. (Small size and short diffusion distance; biconcave disc shape increases surface area to volume ratio; no nucleus, mitochondria or endoplasmic reticulum means more haemoglobin; haemoglobin combines readily with oxygen and releases oxygen readily according to the diffusion gradient in the lungs or tissues, respectively.)
Use a laboratory centrifuge to spin the blood to find the relative proportion of cells and plasma
Enquiry skill 12A.4.1
Unit 12AB.2

404 | Qatar science scheme of work | Grade 12 advanced | Unit 12AB.2 | Biology 2 © Education Institute 2005
Objectives Possible teaching activities Notes School resources
Ask students ‘What additional property enables the red cell to be adapted to transporting carbon dioxide?’ (The presence of the enzyme carbonic anhydrase to produce hydrogencarbonate ions, HCO–, and the presence of haemoglobin to mop up H+ from solution to maintain the pH of the blood.)
Recall the protein structure of haemoglobin from Unit 10FB.1.
Show a computer animation or an OHT diagram of the haemoglobin molecule.
Ask students to write the equation for the combination of haemoglobin with oxygen and explain why each haemoglobin combines with four oxygen molecules.
Ask students to write the equation for the combination of carbon dioxide and water with the enzyme carbonic anhydrase to show the production of hydrogencarbonate ions, HCO–, and hydrogen ions, H+, in a red blood cell.
Ask students to explain the ways that carbon dioxide is transported. (Around 85% as hydrogencarbonate ions, HCO–, carried in the plasma after diffusing out of the red blood cells, 10% combined with haemoglobin as carbamino-haemoglobin, and 5% dissolved in the plasma.)
Ask students to produce a large diagram of a red blood cell in the capillary next to some respiring cells and show all the reactions associated with the transport of carbon dioxide.
Give students a copy of a dissociation curve for haemoglobin at one carbon dioxide concentration. Use an OHT of the diagram to explain its sigmoid shape by reference to: • haemoglobin’s high affinity for oxygen at the high partial pressures of oxygen encountered in
the lungs; • haemoglobin’s equally important property of releasing oxygen as the partial pressure of
oxygen falls in the tissues.
Explain that the area to the right and beneath the graph represents the proportion of oxyhaemoglobin compared with free haemoglobin and oxygen to the left of the graph. Explain that the steepness of the graph at lower partial pressure of oxygen corresponds with small changes in the tissues, which therefore promotes the release of significant supplies of oxygen where it is needed.
Ask students to find out using their textbook, the library or the Internet how the dissociation curve is affected by the body’s carbon dioxide level. Discuss their answers; use an OHT overlay on the original dissociation curve showing the new curve displaced to the right. Clarify the discussion by explaining the Bohr effect. Ensure they all understand the adaptive nature of this response to increased carbon dioxide in causing the shift of the curve to the right and therefore releasing more oxygen at a particular oxygen partial pressure.
Give students a copy of a dissociation curve for haemoglobin at one carbon dioxide concentration. Ask them to write an explanation of the shape of the curve. Ask them to add two more curves to show what happens at carbon dioxide levels above and below the original graph and then ask them to explain the curves’ positions and what circumstances in the body may have produced such curves.
Give students an incomplete account of the Bohr effect and ask them to add the most appropriate words in the spaces.
Source a typical oxygen dissociation curve from a suitable textbook, and produce an OHT.
ICT opportunity: Use of the Internet.
Source a copy of a dissociation curve for haemoglobin
Write an account explaining the Bohr effect with blank spaces for students to fill in.
405 | Qatar science scheme of work | Grade 12 advanced | Unit 12AB.2 | Biology 2 © Education Institute 2005
Objectives Possible teaching activities Notes School resources
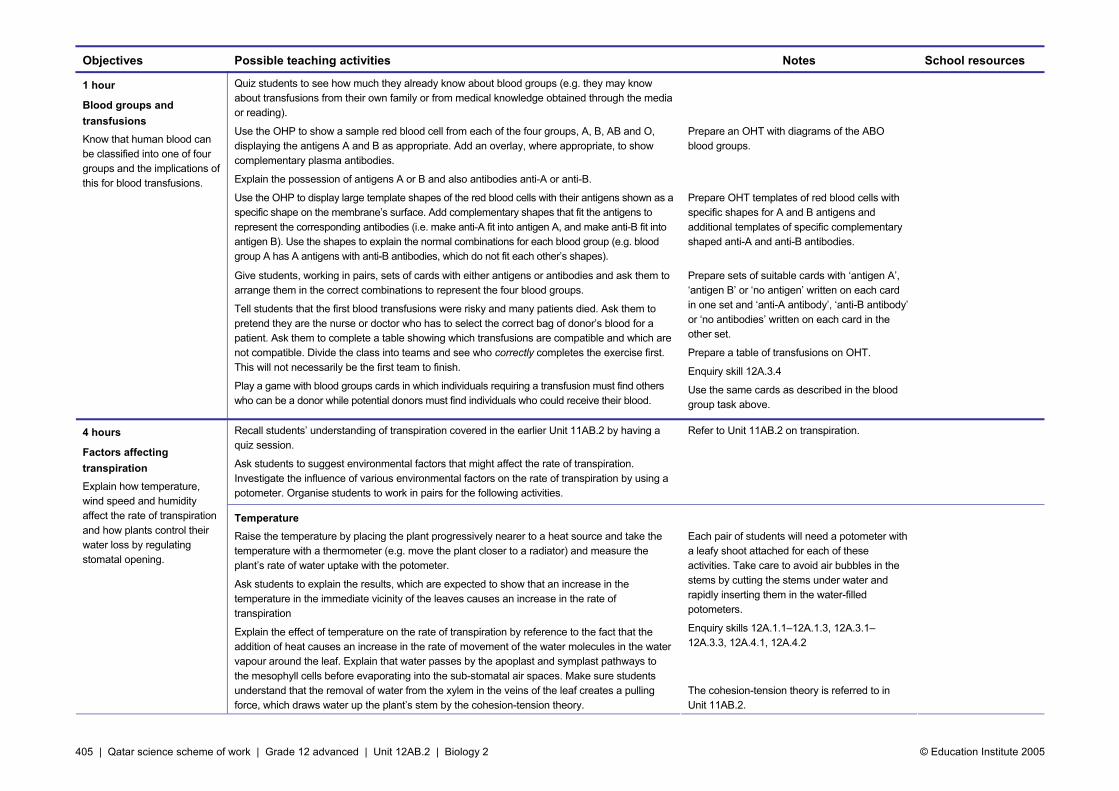
Quiz students to see how much they already know about blood groups (e.g. they may know about transfusions from their own family or from medical knowledge obtained through the media or reading).
Use the OHP to show a sample red blood cell from each of the four groups, A, B, AB and O, displaying the antigens A and B as appropriate. Add an overlay, where appropriate, to show complementary plasma antibodies.
Explain the possession of antigens A or B and also antibodies anti-A or anti-B.
Use the OHP to display large template shapes of the red blood cells with their antigens shown as a specific shape on the membrane’s surface. Add complementary shapes that fit the antigens to represent the corresponding antibodies (i.e. make anti-A fit into antigen A, and make anti-B fit into antigen B). Use the shapes to explain the normal combinations for each blood group (e.g. blood group A has A antigens with anti-B antibodies, which do not fit each other’s shapes).
Prepare an OHT with diagrams of the ABO blood groups.
Prepare OHT templates of red blood cells with specific shapes for A and B antigens and additional templates of specific complementary shaped anti-A and anti-B antibodies.
1 hour
Blood groups and transfusions Know that human blood can be classified into one of four groups and the implications of this for blood transfusions.
Give students, working in pairs, sets of cards with either antigens or antibodies and ask them to arrange them in the correct combinations to represent the four blood groups.
Tell students that the first blood transfusions were risky and many patients died. Ask them to pretend they are the nurse or doctor who has to select the correct bag of donor’s blood for a patient. Ask them to complete a table showing which transfusions are compatible and which are not compatible. Divide the class into teams and see who correctly completes the exercise first. This will not necessarily be the first team to finish.
Play a game with blood groups cards in which individuals requiring a transfusion must find others who can be a donor while potential donors must find individuals who could receive their blood.
Prepare sets of suitable cards with ‘antigen A’, ‘antigen B’ or ‘no antigen’ written on each card in one set and ‘anti-A antibody’, ‘anti-B antibody’ or ‘no antibodies’ written on each card in the other set.
Prepare a table of transfusions on OHT.
Enquiry skill 12A.3.4
Use the same cards as described in the blood group task above.
Recall students’ understanding of transpiration covered in the earlier Unit 11AB.2 by having a quiz session.
Ask students to suggest environmental factors that might affect the rate of transpiration. Investigate the influence of various environmental factors on the rate of transpiration by using a potometer. Organise students to work in pairs for the following activities.
Refer to Unit 11AB.2 on transpiration.
4 hours
Factors affecting transpiration Explain how temperature, wind speed and humidity affect the rate of transpiration and how plants control their water loss by regulating stomatal opening.
Temperature Raise the temperature by placing the plant progressively nearer to a heat source and take the temperature with a thermometer (e.g. move the plant closer to a radiator) and measure the plant’s rate of water uptake with the potometer.
Ask students to explain the results, which are expected to show that an increase in the temperature in the immediate vicinity of the leaves causes an increase in the rate of transpiration
Explain the effect of temperature on the rate of transpiration by reference to the fact that the addition of heat causes an increase in the rate of movement of the water molecules in the water vapour around the leaf. Explain that water passes by the apoplast and symplast pathways to the mesophyll cells before evaporating into the sub-stomatal air spaces. Make sure students understand that the removal of water from the xylem in the veins of the leaf creates a pulling force, which draws water up the plant’s stem by the cohesion-tension theory.
Each pair of students will need a potometer with a leafy shoot attached for each of these activities. Take care to avoid air bubbles in the stems by cutting the stems under water and rapidly inserting them in the water-filled potometers.
Enquiry skills 12A.1.1–12A.1.3, 12A.3.1–12A.3.3, 12A.4.1, 12A.4.2
The cohesion-tension theory is referred to in Unit 11AB.2.
406 | Qatar science scheme of work | Grade 12 advanced | Unit 12AB.2 | Biology 2 © Education Institute 2005
Objectives Possible teaching activities Notes School resources
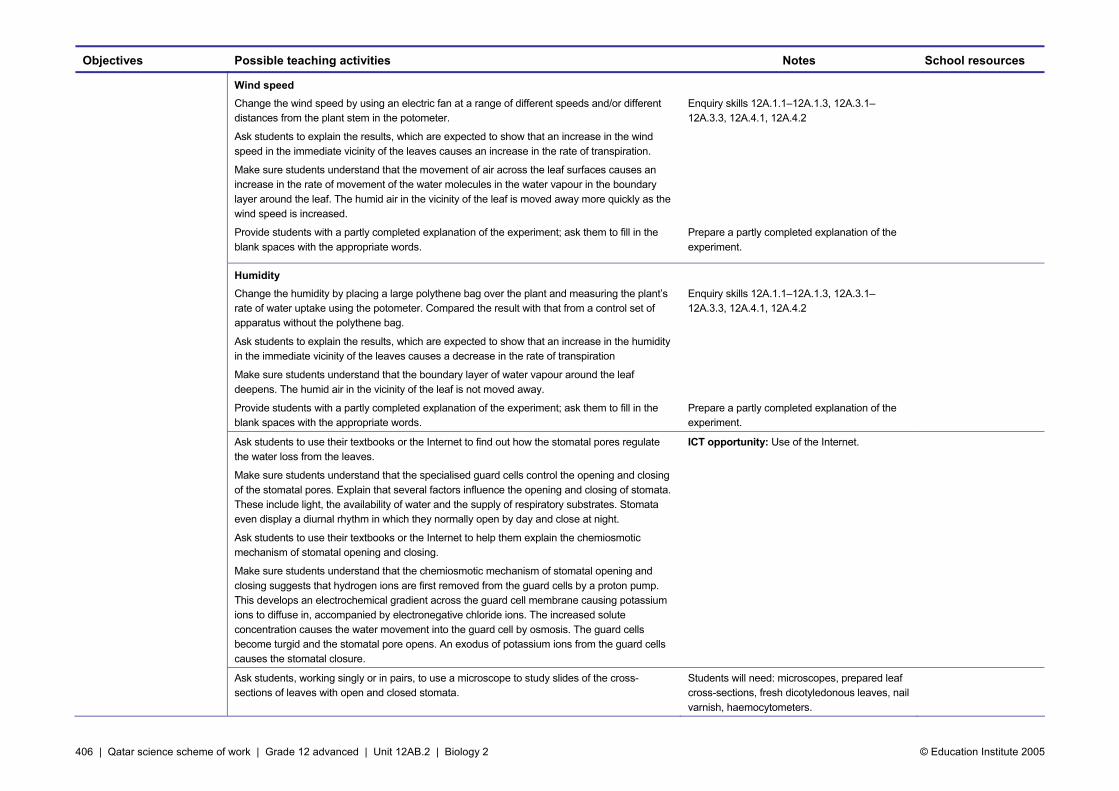
Wind speed Change the wind speed by using an electric fan at a range of different speeds and/or different distances from the plant stem in the potometer.
Ask students to explain the results, which are expected to show that an increase in the wind speed in the immediate vicinity of the leaves causes an increase in the rate of transpiration.
Make sure students understand that the movement of air across the leaf surfaces causes an increase in the rate of movement of the water molecules in the water vapour in the boundary layer around the leaf. The humid air in the vicinity of the leaf is moved away more quickly as the wind speed is increased.
Provide students with a partly completed explanation of the experiment; ask them to fill in the blank spaces with the appropriate words.
Enquiry skills 12A.1.1–12A.1.3, 12A.3.1–12A.3.3, 12A.4.1, 12A.4.2
Prepare a partly completed explanation of the experiment.
Humidity Change the humidity by placing a large polythene bag over the plant and measuring the plant’s rate of water uptake using the potometer. Compared the result with that from a control set of apparatus without the polythene bag.
Ask students to explain the results, which are expected to show that an increase in the humidity in the immediate vicinity of the leaves causes a decrease in the rate of transpiration
Make sure students understand that the boundary layer of water vapour around the leaf deepens. The humid air in the vicinity of the leaf is not moved away.
Provide students with a partly completed explanation of the experiment; ask them to fill in the blank spaces with the appropriate words.
Enquiry skills 12A.1.1–12A.1.3, 12A.3.1–12A.3.3, 12A.4.1, 12A.4.2
Prepare a partly completed explanation of the experiment.
Ask students to use their textbooks or the Internet to find out how the stomatal pores regulate the water loss from the leaves.
Make sure students understand that the specialised guard cells control the opening and closing of the stomatal pores. Explain that several factors influence the opening and closing of stomata. These include light, the availability of water and the supply of respiratory substrates. Stomata even display a diurnal rhythm in which they normally open by day and close at night.
Ask students to use their textbooks or the Internet to help them explain the chemiosmotic mechanism of stomatal opening and closing.
Make sure students understand that the chemiosmotic mechanism of stomatal opening and closing suggests that hydrogen ions are first removed from the guard cells by a proton pump. This develops an electrochemical gradient across the guard cell membrane causing potassium ions to diffuse in, accompanied by electronegative chloride ions. The increased solute concentration causes the water movement into the guard cell by osmosis. The guard cells become turgid and the stomatal pore opens. An exodus of potassium ions from the guard cells causes the stomatal closure.
ICT opportunity: Use of the Internet.
Ask students, working singly or in pairs, to use a microscope to study slides of the cross-sections of leaves with open and closed stomata.
Students will need: microscopes, prepared leaf cross-sections, fresh dicotyledonous leaves, nail varnish, haemocytometers.
407 | Qatar science scheme of work | Grade 12 advanced | Unit 12AB.2 | Biology 2 © Education Institute 2005
Objectives Possible teaching activities Notes School resources
Ask students, working singly or in pairs, to use a microscope to examine leaf impressions of stomata in the epidermis of leaves. Paint a small area (e.g. 5 mm2) of the underside of a dicotyledonous leaf with a thin layer of nail varnish. Allow the varnish to dry and carefully remove it with forceps. Turn it over on the surface of a slide and examine it under the microscope. Compare different species and surfaces.
Ask students, working singly or in pairs, to count the number of stomata by mounting such a leaf impression on a haemocytometer grid and examine under high power of the microscope. Focusing simultaneously on the grid and impression, the number of stomata can be counted for a measured area.
Enquiry skills12A.3.1–12A.3.3, 12A.4.1
Explain that xerophytes are plants adapted for arid conditions, such as those found in Qatar.
Ask students to find out about the adaptations displayed by xerophytes, using their textbooks or the Internet.
Ask students to make a photographic record of the xerophytic adaptations of the plants of Qatar by visiting a suitable location (e.g. a park or garden).
Provide samples of common plants of Qatar, perhaps growing in plant pots, to allow students to investigate leaf and stem structure in the laboratory.
Give students opportunities to study plants from different environments (e.g. desert or seashore) and ask them to compare the leaf structures.
Adaptations of the leaves and stems of xerophytes are the most readily observed features.
ICT opportunity: Use of the Internet.
A digital camera would be most useful for this activity.
Visit opportunity: Visit a park or garden.
Grow plants or obtain them locally.
Make specimen plants available or arrange a site visit.
1 hour
Xerophytic adaptations Explain some of the adaptations that help xerophytic plants to conserve water.
Ask students questions to encourage them to explain their observations about the xerophytes in each case. For example, why do some xerophytes have: • small thick leaves or rolled leaves? (Water loss limited by reducing exposed surface area to
volume.) • leaves reduced to spines? (Water loss limited from reduced surface area of leaves.) • a thick cuticle? (The wax is impermeable to water so reduces transpiration.) • stomata concentrated on lower leaf surface and recessed into depressions? (Water loss
limited by being away from direct sunlight and diffusion gradients of water vapour are maintained to limit transpiration.)
• leaves that are shed in driest months (some desert plants)? (Transpiration significantly reduced during the time when water is unavailable.)
• leaves covered in hairs? (Water loss limited by the maintenance of the water vapour concentrations in the vicinity of the leaf surface, air movement is reduced so the rate of transpiration is reduced.)
• fleshy stems? (Water stored in the rainy season can enable survival in the dry season. These modified stems are the photosynthetic organs of cacti; the leaves are spines).
Ask students to use the Internet to find out about the adaptations of the succulent plants of the Crassulaceae family. These plants, together with a few others, including pineapples, assimilate their carbon dioxide through a different metabolic pathway: the ‘crassulacean acid metabolism’ (they are known as CAM plants). These plants open their stomata at night and close them in the day when transpiration would normally be at its height.
ICT opportunity: Use the Internet.

408 | Qatar science scheme of work | Grade 12 advanced | Unit 12AB.2 | Biology 2 © Education Institute 2005
Objectives Possible teaching activities Notes School resources
Recall the structure of the phloem by giving students a quiz. Alternatively, give students a task sheet containing a phloem diagram with incomplete labels and sentences, and ask them to fill in the missing words.
Ask students to outline the main features of translocation.
Explain that the phloem transports the organic products of photosynthesis, mainly sucrose, by a process called translocation. In contrast to the xylem’s one-way transport, the phloem sap travels in two directions. Introduce students to the evidence for phloem translocation using the suggestions below.
Recall unit11AB.2. Prepare a suitable phloem diagram and task sheet.
2 hours
Translocation hypotheses Explain some of the hypotheses being put forward to explain translocation.
Know how autoradiography and aphids have been used in the study of translocation.
Evidence for phloem translocation Ask students to use the Internet to find out how autoradiography has been used in the study of translocation.
Explain how the radioactive isotope carbon-14 (14C) has been used to investigate the pathway of organic compounds from photosynthesis. Plants were exposed to 14C-labelled CO2 and some time later the plant organs (e.g. stem) were frozen, dehydrated and cut into thin sections. The sections were placed on a photographic film and developed. The position of any radioactively labelled substances would show up on the developed film.
Provide students with a set of autoradiographs displaying the results of exposing plants to 14C-labelled CO2 and allowing them to photosynthesise for different time periods. Ask students to work in pairs and discuss possible interpretations.
Ask students to use the Internet to find out how aphids have been used in the study of translocation.
Make sure students understand that aphids (e.g. greenfly) feed on plants by inserting their specialised mouthparts, called stylets, into the plant and probing until the tip of this structure penetrates a phloem sieve-tube member. Phloem sap flows into the aphid, force-feeding it as it swells to more than twice its size. While it is feeding the aphid can be anaesthetised and severed from its stylet so that the stylet continues to exude phloem sap for some hours, acting as a miniature tap.
Ask students what the composition of phloem sap is.
The phloem sap can be analysed to show its composition. The use of radioactive materials can also be combined with the aphid investigation to find out the rate of translocation of this material.
Debate the ethics of using aphids in research on translocation.
ICT opportunity: Use of the Internet.
Source some photographs of autoradiographs from library or Internet.
ICT opportunity: Use of the Internet.

409 | Qatar science scheme of work | Grade 12 advanced | Unit 12AB.2 | Biology 2 © Education Institute 2005
Objectives Possible teaching activities Notes School resources
Explanations of translocation Ask students to use the Internet to find out what is meant by a source and a sink in translocation.
Make sure students understand that phloem sieve tubes carry sucrose from a sugar source (usually a leaf) to a sugar sink, an organ that either consumes sugar or stores it (e.g. growing roots, shoot tips and fruits).
Ask students whether a particular organ can be both a source and a sink. Explain that, depending on the time of year, a storage organ, such as a tuber, bulb or tap root may act as either a source or a sink. Similarly, in spring a leaf can act as a sink during bud break (in woody perennials) or as a source (in herbaceous perennials).
Ask students to use the Internet to find out what the competing explanations of translocation are and discuss the strength of the evidence for and against the claims.
Make sure students understand that it is believed that the process of translocation occurs by a pressure flow or mass flow mechanism. This idea was first proposed by Ernst Munch in 1930. Exactly how this operates is subject to dispute.
Make sure students understand that phloem sap transport has been measured at up to 1 m h–1 which is much too fast to be accounted for by either diffusion or cytoplasmic streaming alone. It has been calculated that the rate is about 10 000 times faster than it would be if substances were moving by diffusion rather than mass flow.
Ask students to draw up a table comparing the different mechanisms of translocation.
ICT opportunity: Use of the Internet
ICT opportunity: Use of the Internet.
Ask students how loading and unloading of sucrose take place in the phloem. Make sure they understand that companion cells and phloem sieve elements work together. Sucrose is loaded into a companion cell by active transport at the source. This is usually a photosynthesising leaf. Some companion cells act as transfer cells. Energy as ATP is used to pump hydrogen ions out of the companion cells before the hydrogen ions move back into the cell together with a sucrose molecule (co-transport) through the cell membrane, using a cell membrane carrier. This active process moves sucrose into the companion cell against the concentration gradient. The sucrose then moves through the plasmodesmata into the phloem sieve elements.
Make sure students understand that phloem loading results in a lowering of the water potential as the solute concentration is raised. Water flows into the phloem from the neighbouring xylem and other cells with a consequent rise in the pressure developed within the sieve tube. Sucrose is unloaded at the sink tissues that require sucrose, probably by diffusion. The removal of sucrose results in a lowering of the water potential outside the sieve tubes as the solute concentration is raised. Water flows out of the phloem and into the neighbouring xylem.
Show students a diagram of Munch’s mass flow theory and ask them to explain the mass flow of sucrose.
Ask students to use the Internet to find out the limitations of the mass flow hypothesis and discover what alternative ideas have been put forward.
Prepare an OHT diagram of Munch’s mass flow theory.
ICT opportunity: Use of the Internet.

410 | Qatar science scheme of work | Grade 12 advanced | Unit 12AB.2 | Biology 2 © Education Institute 2005
Objectives Possible teaching activities Notes School resources
In discussion with the class: • Point out that one as yet unanswered criticism of mass flow is that it cannot account for the
observation that sugars and amino acids move at different rates in the phloem. • Say that a modified pressure flow or mass flow mechanism will probably be confirmed with
more research discoveries. • Present students with an alternative theory – the electro-osmosis hypothesis, proposed in
1958 by Spanner. This is a modified mass flow theory involving the proposal that potassium ions are actively transported by companion cells across the sieve plate. This in turn draws the polarised water molecules across the plate. However, no consistent evidence for the existence of a potential difference across sieve plates has been demonstrated.
• Make sure students understand the transcellular strand hypothesis suggested by Thaine in 1962. This proposed the presence of cytoplasmic strands passing through the sieve plates carrying out a form of cytoplasmic streaming. The active transport of solutes takes place within these strands. No consistent proof for the widespread presence of such strands has been demonstrated.
Ask students to summarise their thoughts on translocation after reading all the evidence for the possible mechanisms. Discuss these with the class.
411 | Qatar science scheme of work | Grade 12 advanced | Unit 12AB.2 | Biology 2 © Education Institute 2005
Assessment
Examples of assessment tasks and questions Notes School resources
Study the diagram of a capillary bed also including a lymphatic. Explain how tissue fluid is formed and removed by reference to blood hydrostatic pressure and osmotic pressure. Also explain how lymph is produced. Compare the composition of the blood plasma, tissue fluid and lymph.
Provide students with a diagram of a capillary bed also including a lymphatic.
Construct a pie chart to illustrate the composition of human blood.
a. Explain the graph of the dissociation curve for haemoglobin.
b. Add a second curve to illustrate the dissociation that occurs at a higher carbon dioxide concentration. Explain the shape you have drawn.
Provide students with a diagram of a dissociation curve for haemoglobin.
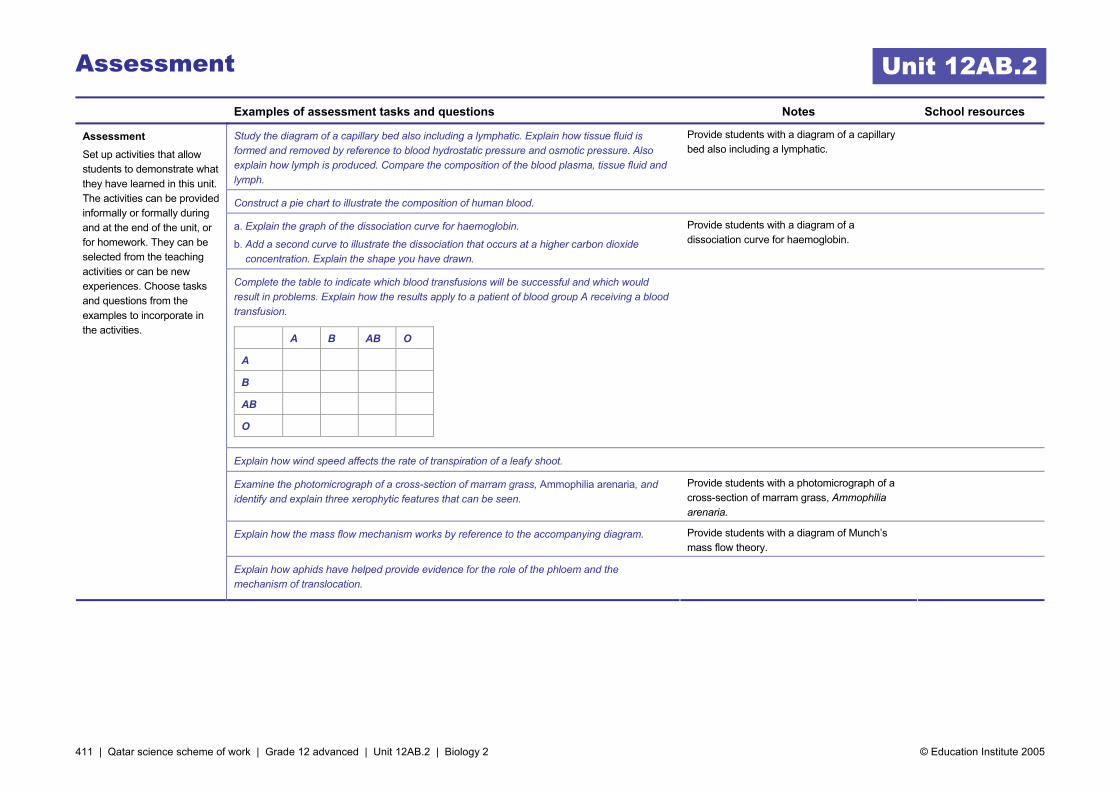
Complete the table to indicate which blood transfusions will be successful and which would result in problems. Explain how the results apply to a patient of blood group A receiving a blood transfusion.
A B AB O
A
B
AB
O
Explain how wind speed affects the rate of transpiration of a leafy shoot.
Examine the photomicrograph of a cross-section of marram grass, Ammophilia arenaria, and identify and explain three xerophytic features that can be seen.
Provide students with a photomicrograph of a cross-section of marram grass, Ammophilia arenaria.
Explain how the mass flow mechanism works by reference to the accompanying diagram. Provide students with a diagram of Munch’s mass flow theory.
Assessment Set up activities that allow students to demonstrate what they have learned in this unit. The activities can be provided informally or formally during and at the end of the unit, or for homework. They can be selected from the teaching activities or can be new experiences. Choose tasks and questions from the examples to incorporate in the activities.
Explain how aphids have helped provide evidence for the role of the phloem and the mechanism of translocation.
Unit 12AB.2

412 | Qatar science scheme of work | Grade 12 advanced | Unit 12AB.2 | Biology 2 © Education Institute 2005
413 | Qatar science scheme of work | Grade 12 advanced | Unit 12AB.3 | Biology 3 © Education Institute 2005
GRADE 12A: Biology 3
Control, coordination and homeostasis
About this unit This unit is the third of eight units on biology for Grade 12 advanced.
The unit is designed to guide your planning and teaching of biology lessons. It provides a link between the standards for science and your lesson plans.
The teaching and learning activities should help you to plan the content and pace of lessons. Adapt the ideas to meet your students’ needs. For consolidation activities, look at the scheme of work for Grade 11A.
You can also supplement the activities with appropriate tasks and exercises from your school’s textbooks and other resources.
Introduce the unit to students by summarising what they will learn and how this builds on earlier work. Review the unit at the end, drawing out the main learning points, links to other work and real world applications.
Previous learning To meet the expectations of this unit, students should already understand and be able to describe thermoregulation in humans and the roles of TRH and TSH. They should be able to describe the similarities and differences between nervous and hormonal control systems in mammals. They should be able to explain the importance of homeostasis in mammals and describe the process in terms of receptors, effectors and negative feedback.
Expectations By the end of the unit, students know the structure of the mammalian kidney and its role in dealing with water and metabolic waste. They understand how the body controls water balance and the function of ADH. They know about thermoreceptors in the hypothalamus and understand body thermoregulation. They know the causes and effects of heatstroke. They know the structure and function of neurones and how nerve impulses are transmitted. They know the main structures and functions of the brain. They know the main endocrine glands of the human body and their functions. They understand how human blood glucose levels are controlled. They know the roles of plant auxins, gibberellins and abscisic acid.
Resources The main resources needed for this unit are: • overhead projector (OHP) and various prepared transparencies (OHTs) • microscopes and slides of neurones and pancreas • models of brain, kidney and skin • kidneys from butcher • video clips of nerve impulse action and temperature regulation • tendon hammer • sets of various prepared cards (e.g. on temperature regulation, synapse
events) • seeds of sunflowers and oats • temperature sensors, datalogger • Internet access
Key vocabulary and technical terms Students should understand, use and spell correctly: • homeostasis • osmoregulation, filtration, tubular reabsorption, tubular secretion • themoregulation, heatstroke • sensory, motor and intermediate neurones • simple and conditioned reflexes • action potential, resting potential, depolarisation, hyperpolarisation • saltatory conduction, synapse, neurotransmitters, summation • cerebrum, cerebellum, medulla oblongata, hypothalamus. • autonomic nervous system • glucose regulation, insulin, glucagon, diabetes mellitus • auxin, gibberellin, abscisic acid • oat coleoptile • synergist, antagonist
UNIT 12AB.3 18 hours

414 | Qatar science scheme of work | Grade 12 advanced | Unit 12AB.3 | Biology 3 © Education Institute 2005
Objectives for the unit
18 hours SUPPORTING STANDARDS CORE STANDARDS
Grade 12 standards EXTENSION STANDARDS
12A.9.1 Describe the gross external and internal structure of the kidney and the detailed structure of the nephron and associated blood vessels.
12A.9.2 Using water potential terminology, explain the functioning of the kidney in osmoregulation and in controlling metabolic wastes.
12A.9.3 Explain the role of the pituitary gland, ADH and aldosterone in osmoregulation.
11A.9.3 Describe thermoregulation in humans and the roles of TRH and TSH.
12A.9.4 Explain the role of thermoreceptors in the hypothalamus in thermoregulation and describe some physiological and behavioural responses of mammals to hot and cold conditions.
12A.9.5 Describe the symptoms of heatstroke and explain why it occurs and how it can be avoided.
12A.9.6 Describe, compare and contrast the structure and function of sensory, motor and intermediate neurones and know where they are found.
12A.9.7 Explain the function and importance of a reflex arc and differentiate between a simple reflex and a conditioned reflex.
12A.9.8 Explain: the nature of a nerve impulse and the way it is transmitted; resting potential; membrane depolarisation and action potential; refractory period; the passage of sodium and potassium ions.
12A.9.9 Explain the operation of sensory receptors as energy transducers.
12A.9.10 Describe the roles of synapses in the nervous system in determining the direction of nerve impulse transmission and in allowing interconnections of nervepathways.
11A.9.5 Describe the similarities and differences between nervous and hormonal control systems in mammals.
12A.9.11 Describe the main structures of the human brain – cerebral hemispheres, cerebellum, medulla oblongata – and their functions. Know that the hypothalamus is the link between the nervous and the endocrine control systems.
12A.9.12 Know the names, locations and functions of the main endocrine glands of humans.
12A.9.13 Explain how insulin and glucagon control the blood glucose level and how failure of the system results in diabetes.
3 hours
The kidney, osmoregulation and waste control
2 hours
Thermoregulation and heatstroke
4 hours
Neurones, the nerve impulse and synapses
2 hours
Sensory receptors, simple and conditioned reflexes
2 hours
The human brain
2 hours
Endocrine glands and blood sugar regulation
3 hours
The role of plant hormones
11A.9.2 Explain the importance of homeostasis in mammals and describe the process in terms of receptors, effectors and negative feedback.
12A.10.1 Describe how auxins affect plant growth by cell extension, how abscisic acid prepares plants to withstand stress and how gibberellins cause effects such as internode extension, premature flowering and break dormancy.
Unit 12AB.3

415 | Qatar science scheme of work | Grade 12 advanced | Unit 12AB.3 | Biology 3 © Education Institute 2005
Activities
Objectives Possible teaching activities Notes School resources
Reinforce previous knowledge on homeostasis with a quiz to focus on the kidney’s role in the body.
Tell students to find out what role the kidney undertakes in homeostasis. They can find out from their textbook, library resources or the Internet.
Introduce the anatomy of the kidney by showing students a model kidney.
Provide students with a kidney diagram showing its gross anatomy and ask them to label: cortex, medulla, pyramid, pelvis, ureter, renal artery, renal vein. Show an OHT copy for confirmation.
Provide each pair of students with a real kidney obtained from the butcher. Ask them to examine it and then carefully dissect it by cutting a longitudinal section. Tell them to draw a diagram of the kidney and label the parts (e.g. cortex, medulla, pelvis).
Provide students with a kidney nephron diagram showing details of its structure. Ask them to label the diagram. Show an OHT and label such features as the Bowman’s capsule, glomerulus, afferent arteriole and efferent arteriole blood vessels, proximal convoluted tubule, loop of Henle, peritubular capillary network, distal convoluted tubule and collecting duct.
Allow students to examine microscope slides of the kidney nephrons to identify the various components.
Recall Standard 11A.9.2 on homeostasis.
ICT opportunity: Use of the Internet.
In this section you will need: a model kidney; an OHT kidney diagram and copies for labeling; animal kidneys from the butcher for dissection; an OHT diagram of a kidney and a nephron and copies for labeling; microscopes and slides of kidney nephrons.
Use OHT diagrams throughout the unit to illustrate your explanations.
Use this column to note your own school’s resources, e.g. textbooks, worksheets.
3 hours
The kidney, osmoregulation and waste control Describe the gross external and internal structure of the kidney and the detailed structure of the nephron and associated blood vessels.
Using water potential terminology, explain the functioning of the kidney in osmoregulation and in controlling metabolic wastes.
Explain the role of the pituitary gland, ADH and aldosterone in osmoregulation.
Ask students to make a presentation to the class to explain how the kidney osmoregulates and also how it gets rid of metabolic waste products.
ICT opportunity: Use of the Internet.
Explain the three main stages of kidney functioning to students: • glomerular filtration; • tubular reabsorption; • tubular secretion.
Examine each in turn.
Glomerular filtration Provide students with a series of statements about glomerular filtration that are deliberately in the wrong sequence. Get students to arrange them in the correct order. For example: • Small molecules and ions are filtered out into filtrate, • Special cells on inside of the capsule, called podocytes • including nutrients such as glucose as well as waste such as urea. • allow filtering of blood at a rapid rate, • the wider afferent arteriole and narrower efferent arteriole • to prevent loss of plasma proteins from blood. • produces high blood pressure • The basement membrane acts, • create a high blood pressure in the glomerulus.
Students should understand that this stage enables the body to recover those molecules and ions it cannot afford to lose.
Unit 12AB.3

416 | Qatar science scheme of work | Grade 12 advanced | Unit 12AB.3 | Biology 3 © Education Institute 2005
Objectives Possible teaching activities Notes School resources
Tubular reabsorption Provide students with a series of statements about tubular reabsorption that are deliberately in the wrong sequence. Get the students to arrange them in the correct order.
For example: • The water potential of the fluid surrounding the tubule falls as the solute concentration
rises • This stage allows the body to recover those molecules and ions it cannot afford to lose • Most of the water lost by filtration is reabsorbed here. • Selective reabsorption occurs • down the water potential gradient from the tubule • Sodium ions, Na+, are absorbed actively • In additional, the nutrients, such as glucose, amino acids and vitamins, are reabsorbed
here • Water molecules are absorbed • Waste products remain in the tubule fluid and are not reabsorbed. • first in the proximal convoluted tubule, which causes chloride ions to be reabsorbed for
maintaining electroneutrality.
Emphasise that the water molecules are reabsorbed passively by osmotic gradients created by the active uptake and reabsorption of sodium ions.
Tubular secretion Provide students with a series of statements about tubular secretion that are deliberately in the wrong sequence. Get the students to arrange them in the correct order.
For example: • Nitrogenous waste products, such as ammonia, urea, uric acid and creatinine, are • Drugs that have been through the body are • Hydrogen ions are • secreted from the blood to the tubular fluid. • secreted to help maintain the blood pH. • actively secreted from the blood in the distal convoluted tubule.
Students should understand that the peritubular capillaries secrete certain substances into the tubule fluid from the blood.

417 | Qatar science scheme of work | Grade 12 advanced | Unit 12AB.3 | Biology 3 © Education Institute 2005
Objectives Possible teaching activities Notes School resources
Give students a worksheet on osmoregulation to complete by filling in blank spaces. For example: ‘The majority of the water reabsorption takes place in the _________ convoluted tubule;
the regulation of the remaining water takes place in the loop of Henle and the _________ duct. Tubular fluid leaving the proximal convoluted tubule is _________ to the body fluids. The kidney has the ability to produce a strongly _________ urine. The loop of Henle descends through an increasing _________ gradient created by two solutes: salt (NaCl) and _________. The ascending limb of the loop loses Na+ and Cl– ions: _________ at its base but _________ from the upper portion of the loop. Urea _________ out of the _________ duct in the lower _________ region, adding to the osmolality and _________ the water _________ of the tissue fluid at the inner medulla. Water is lost from the descending loop of the tubule down the water _________ gradient. Fluid entering the _________ convoluted tubule is still _________ to the body fluids, since both _________ and _________ have been reabsorbed. It is when the fluid flows down through the _________ duct that the remaining _________ can be reabsorbed. As the fluid passes down the collecting duct through the _________ it encounters the same increasing _________ gradient as the descending loop. Water _________ out of the collecting duct and into the renal medulla fluid, leaving the remaining tubular fluid becoming progressively _________ to the blood plasma.’
Use a flow chart to develop students’ understanding of how ADH regulates the water balance of the body. Explain that water reabsorption is regulated by the combined activities of the hypothalamus, the pituitary gland, the antidiuretic hormone (ADH) and aldosterone.
Make sure students understand the process of negative feedback regulation by ADH and aldosterone. After explaining the process, ask a few students to explain it again to the rest of the class.
Make a set of cards showing the stages of the process of regulation by ADH and aldosterone. Mix up the cards and get students to rearrange them in the correct order. Alternatively, make the ‘cards’ from pieces of OHT and invite a student to complete the exercise on the OHP in front of the class.
Show students a table comparing the composition of plasma and urine. Invite students to compare the values of the components (e.g. water, protein, glucose, urea, uric acid, ammonia, sodium ions, potassium ions, phosphate ions) and use the data to explain how the kidney contributes to homeostasis.
Provide students with a diagram of the body and ask them to identify the location of the pituitary gland and other endocrine glands.
Provide a suitable diagram with the endocrine positions to be identified.

418 | Qatar science scheme of work | Grade 12 advanced | Unit 12AB.3 | Biology 3 © Education Institute 2005
Objectives Possible teaching activities Notes School resources
2 hours
Thermoregulation and heatstroke Explain the role of thermoreceptors in the hypothalamus in thermoregulation and describe some physiological and behavioural responses of mammals to hot and cold conditions.
Describe the symptoms of heatstroke and explain why it occurs and how it can be avoided.
Devise experiments to investigate heat exchange in the human body, simulating the body as a simple tin can. You can do these as a demonstration or ask students to carry them out in pairs or groups. For example: • Fill a white can and a black can with cool water. Take their temperatures. Shine a strong
light onto the cans. Take the temperature again and at regular intervals. Discuss the observations with students.
• Fill a white can and a black can with warm water. Take their temperatures. Take the temperature again and at regular intervals. Discuss the observations with students
• Repeat the first experiment but add an ‘umbrella’/canopy (to simulate shade), either white or black, between the light source and the cans.
• Simulate the effects of tight and loose clothing by wrapping cloth tightly round one can and loosely round another identical can. Shine a bright light on each can and observe any temperature changes. Discuss the observations with students.
Discuss the four physical processes by which an organism exchanges heat with its environment: • conduction; • convection; • radiation; • evaporation.
Remind students of their work in physics on the mechanisms of heat transfer if appropriate. This is a good cross-curricular activity.
These experiments could be used as project material to help students devise their own experiments (e.g. using different coloured ‘clothing’ on a can).
ICT opportunity: These heat exchange experiments (and others) could be conducted using temperature sensors and a datalogger to feed information into a computer for real-time on-line display and analysis.
Provide a large diagram of a section of the skin and ask students to label features such as epidermis, dermis, capillaries, arteriole, vein, sweat pore, sweat duct, heat receptor, cold receptor, hair, hair follicle, sebaceous gland, erector muscle. Use the diagram to help explain how the processes of heat exchange (conduction, convection, radiation and evaporation) are affected by the skin’s responses to: • over-heating; • over-cooling.
Provide details of the ingenious experiment conducted by Benzinger on the role of the hypothalamus in temperature regulation. (Simultaneous measurements were made of the skin, the hypothalamus and the amount of heat lost. The subject lay in a large calorimeter at a temperature higher than body temperature and was asked to take iced drinks at regular intervals. The result showed that there was a perfect correlation between the temperature of the hypothalamus and the decrease in the rate of sweating.)
Ask students to use their textbook to write an account of how the hypothalamus is involved in thermoregulation.
Prepare a suitable diagram and show students a model of the skin.
Provide pairs of students with a set of cards, each with the name of one of the structures or the stages of the control process for thermoregulation. Include the following: hypothalamus, thermoreceptors, heat gain centre, heat loss centre, increased sympathetic output, decreased sympathetic output, vasoconstriction, vasodilation. Ask students to organise the cards into a logical sequence on the desk to explain the actions of the hypothalamus in response to the body either over-heating or over-cooling.
Prepare a similar set of thermoregulation control statements on OHT ‘cards’ and use them to demonstrate and consolidate the results from the class.
Prepare suitable sets of cards.
419 | Qatar science scheme of work | Grade 12 advanced | Unit 12AB.3 | Biology 3 © Education Institute 2005
Objectives Possible teaching activities Notes School resources
Consolidate the students’ understanding of thermoregulation by asking them to explain the following phenomena. • A swim on a hot day will cool the body. (The conduction of heat by water is up to 100
times that by air.) • Wearing many layers of clothing is more likely to maintain body temperature than a
single layer of the same thickness. (More air is trapped close to the skin and insulates the body.)
• Loose-fitting garments are more comfortable than fitted garments outside in a warm climate like Qatar’s. (Air is a poor conductor of heat, so the air between the clothes and the body prevents the body heating up as quickly from the heat of the Sun as it would without the air present.)
• Hot humid climates are uncomfortable working conditions. (The high humidity reduces the evaporation of sweat and so cooling is less efficient.)
• Moving into the shade where there is a light breeze and taking a cold drink cools the body. (Radiant heat energy is reduced, convection is increased by the breeze and heat is conducted from the body to water in the intestinal tract – these all act to cool the body.)
• Getting out of the sea on a cold day a swimmer shivers uncontrollably. (The involuntary contractions of muscle fibres generate heat quickly after the body’s hypothalamus has stimulated the voluntary nervous system to make the muscles contract in response to cooling of the blood.)
• A dog pants in warm conditions. (Dogs have no sweat glands on their hairy skin. Sweat glands are confined to pads on paws. Panting cools the dog by evaporation).
• Although elephants are very large, they are able to keep cool. (Large ears act like radiators when the elephant is over-heated; behaviour includes bathing in a river and finding shade.)
• Camels survive for days without water and are active in the full heat of the sun. (The camel‘s tissues are extremely tolerant of dehydration. However, the camel also saves water by not sweating, at least until its body temperature reaches 40 °C. The camel’s body then loses an abnormal amount of heat at night, falling to around 34 °C. The following day the camel’s temperature climbs but doesn’t reach the upper lethal point because it starts from such a low point.)
• Mammals such as seals, whales and polar bears survive in very cold conditions. (Their bodies have adaptations to the cold, including extra insulation with adipose tissue and/or a thick fur coat with hairs raised.)
Get students to record observations of domestic animals and keep a diary of how their behaviour changes in response to the weather conditions during a day and from day to day.
Watch and discuss a video illustrating responses of mammals to hot and cold conditions.
Give students the task of using the Internet to find out the symptoms of heatstroke and also establish why heatstroke occurs if someone stays out in the sun too long.
Explain that the body can regulate its temperature between the upper and lower critical temperatures by physical mechanisms. However, above the upper critical temperature the body’s physical cooling mechanisms fail to keep the body’s temperature constant. The
ICT opportunity: Use of the Internet.

420 | Qatar science scheme of work | Grade 12 advanced | Unit 12AB.3 | Biology 3 © Education Institute 2005
Objectives Possible teaching activities Notes School resources
body‘s metabolic rate rises in response to the increased body temperature and, as a consequence, generates more heat. This results in a further rise in the metabolic rate, and so the body has entered an extremely dangerous cycle fuelled by positive feedback. This is where the change causes more change in the same direction. Prolonged exposure to excessively high environmental temperatures can result in the condition known as heatstroke.
Discuss with the students why people acclimatised to living in high environmental temperatures frequently have a higher upper critical temperature.
Identify the symptoms affecting the brain, such as mental confusion, headaches, delirium, convulsions and unconsciousness, leading to death. In addition, body temperature is raised and the skin is hot and dry as a result of the sweating mechanism failing.
Get students to produce a flow chart recording the stages in the development of heatstroke and the symptoms of this medical emergency.
Organise students into small groups to make a tourist guide to avoiding heatstroke.
Enquiry skill 12A.3.4
Show students large unlabelled diagrams of sensory, motor and intermediate neurones. Get them to label, describe, compare and contrast the structure and function of these neurones, using their textbook where necessary.
Organise students into pairs to produce posters with drawings of different neurones, using library resources or the Internet.
Demonstrate neurone structure by using the microscope with a video camera attached.
Give students prepared microscope slides of neurones to examine.
Provide a diagram of a cross-section of the spinal cord and get students to add the appropriate neurones for a reflex action (e.g. withdrawal reflex when touching a hot object with the hand).
Prepare suitable diagrams.
ICT opportunity: Use of the Internet.
Students will need microscopes and prepared neurone slides.
4 hours
Neurones, the nerve impulse and synapses Describe, compare and contrast the structure and function of sensory, motor and intermediate neurones and know where they are found.
Explain the function and importance of a reflex arc and differentiate between a simple reflex and a conditioned reflex.
Explain: the nature of a nerve impulse and the way it is transmitted; resting potential; membrane depolarisation and action potential; refractory period; the passage of sodium and potassium ions.
Explain the operation of sensory receptors as energy transducers.
Describe the roles of synapses in the nervous system in determining the direction of nerve impulse transmission and in allowing interconnections of nerve pathways.
Get students to find an appropriate passage in their textbook to read and then discuss to differentiate between a simple spinal reflex and a conditioned reflex.
Get students to find, read and then discuss an appropriate passage in their textbook about classical conditioning, as first demonstrated by the Russian physiologist Pavlov, who studied the production of saliva by dogs in response to food.
Explain the nature of a nerve impulse and the way it is transmitted. Include details of resting potential, membrane depolarisation and action potential, refractory period, and the passage of sodium and potassium ions.
Invite students, in turn, to describe one stage of a nerve impulse / action potential.
Ask all students to produce a flow chart of the generation and transmission of a nerve impulse.
Watch and discuss a video on the transmission of nerve impulses.
Provide pairs of students with a set of cards containing a series of statements about the nature of a nerve impulse and the way it is transmitted, including: resting potential; membrane depolarisation and action potential; refractory period; the passage of sodium and potassium ions. Challenge students to arrange the cards in the correct order. This could be carried out as a competition for the quickest correct answer.
Show an OHT of a nerve axon with the position of Na+ and K+ marked and use it to illustrate stages of the explanation.
Show an OHT of action potential to illustrate stages of the nerve impulse.
Prepare suitable sets of cards.
421 | Qatar science scheme of work | Grade 12 advanced | Unit 12AB.3 | Biology 3 © Education Institute 2005
Objectives Possible teaching activities Notes School resources
Ask students to use their textbook find out about nerve impulses so that they can explain: • how the addition of myelin accelerates the transmission speed of the nerve impulse
(explain saltatory conduction); • how the diameter of the axon affects speed of transmission of the nerve impulse.
Let students research the Internet to find out about and explain the operation of sensory receptors as energy transducers. (Specialised receptors are capable of transducing stimulus energy existing as electromagnetic (light), mechanical (sound, touch, pressure, gravity), thermal (temperature change) and chemical (smell, taste) energy.)
ICT opportunity: Use of the Internet.
Ask students to make a chart of the sensory receptors in humans, including their location and the senses they detect.
Let students investigate the interaction of different senses (e.g. taste, smell, sight and sound). Working in small groups, get students to take it in turns to close their eyes and be given different food samples to taste and guess what they are eating. Alternatively, get students to pinch their nose and try to guess the particular flavour of a crisp they are given to taste.
Prepare a selection of mashed or evenly textured food samples. Provide samples of crisps of different flavours
Ask students to use their textbook to find out the roles of synapses in the nervous system in determining the direction of nerve impulse transmission and in allowing interconnections of nerve pathways.
Ensure students understand the role of synapses as follows: • Their primary role is to transmit information between neurones. • They pass impulses in one direction. Chemical neurotransmitter substance can only be
released from one side of the synapse. This fact ensures that synapses act as one-way ‘gates’ in the nervous system, allowing impulses to pass in only one direction.
• They act as junctions for a number of different neurones. Several synapses firing simultaneously may release sufficient neurotransmitter to stimulate the next neurone: this is spatial summation. Two or more impulses arriving in quick succession, called temporal summation, causes facilitation and stimulates the post-synaptic neurone.
• Synapses can inhibit postsynaptic neurones. Inhibitory synapses release neurotransmitter substances which cause hyperpolarisation of the membrane, making it more difficult for an action potential to be generated. (Summation, as described above, from more excitatory synapses may overcome the effect of the inhibition.)
Ask students to draw a diagram of a synapse and explain the mechanism of synaptic transmission in an excitatory synapse.
Present students with a set of cards containing the steps of the mechanism of transmission of a synapse in a random order so that, working in pairs, they can arrange them in the correct sequence.
Arrange students in pairs or small groups to investigate the knee-jerk reflex. This simple reflex demonstrates the response of the leg muscle to stretching the muscle spindle by tapping the tendon lightly at a specific location.
Get students to use their textbook to draw a diagram of the nervous pathways responsible for the knee-jerk reflex and explain the passage of the impulse from stimulus to response.
Prepare a set of suitable cards.
Safety: Use a small tendon hammer and tap the tendon lightly
422 | Qatar science scheme of work | Grade 12 advanced | Unit 12AB.3 | Biology 3 © Education Institute 2005
Objectives Possible teaching activities Notes School resources
2 hours
The human brain Describe the main structures of the human brain – cerebral hemispheres, cerebellum, medulla oblongata – and their functions. Know that the hypothalamus is the link between the nervous and the endocrine control systems.
Show students a model of the brain and the location of the main structures
Provide a diagram of the brain and ask students to label the location of the main structures – cerebral hemispheres, cerebellum, medulla oblongata, hypothalamus.
Now get them to make a chart of the brain structures and their functions.
Present students with a set of cards containing details of the structures and functions of the main parts of the human brain in a random order. Ask students, in pairs, to match them so the correct functions are with each structure.
Get students write an account of the structure and function of the cerebral hemispheres, using the Internet, their textbook or library resources.
Make sure, in a later class discussion, that students have included and appreciate the following: • The significance of the large size of the human cerebrum in relation to that of other
animals, and of the folds, or convolutions, that further increase its surface area. • The human cerebral cortex is composed of grey matter – the cell bodies of the neurones
– and accounts for over 80% of the total brain mass. • The functions of the cerebrum are associated with the cerebral cortex: the outermost
3–5 mm layer. • Complex mental activities involved in intelligence, learning, thinking, sense of
responsibility, reasoning and memory are associated with the cerebrum. • Sensory perception from many receptors in various locations of the body is fed to
specific locations in the cerebral cortex. • The cerebral cortex is bilaterally symmetrical and is joined by the corpus callosum. • The surface of the cerebral cortex contains both sensory and motor areas involved in
processing information. • Since the nerve fibres cross over in the medulla, the information to and from one side of
the body is coordinated by the opposite side of the cerebral cortex. This means that the motor area of the right hemisphere of the cortex controls voluntary muscle movement on the left side of the body, and vice versa.
• The size of the areas of the cortex representing different parts of the body is proportional to the extent of sensory innervation or complexity of movement. The hand, foot, tongue and lips are represented by large cortical areas.
• Association areas in the cortex are, however, located in different hemispheres (e.g. speech, language and calculation are centred in the left hemisphere, while the right hemisphere controls artistic ability and spatial perception).
You will need a model of the brain, and an OHT of a suitable brain diagram, plus copies for students.
Prepare suitable sets of cards.
ICT opportunity: Use of the Internet.
423 | Qatar science scheme of work | Grade 12 advanced | Unit 12AB.3 | Biology 3 © Education Institute 2005
Objectives Possible teaching activities Notes School resources
Ask students to produce a map of the location of the major regions of the cerebral cortex and their functions.
Tell them to write an account of the structure and function of the cerebellum. Make sure that in their account that they have included the following: • The cerebellum is part of the hindbrain, it is highly convoluted and it forms an outgrowth
behind and beneath the cerebrum. • The primary function of the cerebellum is coordination of voluntary muscular movement,
posture and balance. If one part of the body is moved, the cerebellum will coordinate other parts to ensure smooth action and balance.
• The cerebellum appears to be involved in learning tasks, such as riding a bike or playing a musical instrument.
Set students the task of using their textbook or library resources to write an account of the structure and function of the medulla oblongata.
Check in discussion later that they have included the following: • The medulla oblongata controls breathing, heart rate and blood pressure. • Different groups of neurones are involved in the medulla for each of these functions. • Control of these functions is effected by impulses through the autonomic nervous system
to the diaphragm, intercostal muscles, heart, and small arteries and arterioles. • The medulla contains sensory receptors for excess carbon dioxide.
Set students the task of using their textbook or library resources to write an account of the function of the hypothalamus.
Confirm that the following points have been addressed: • The hypothalamus is situated immediately above the pituitary gland. • The hypothalamus is linked directly to the posterior lobe of the pituitary by nerve fibres
and to the anterior lobe by a complex of blood vessels. • Through these connections, the hypothalamus controls the output of hormones from
both pituitary lobes. • The hypothalamus is the link between the nervous and the endocrine control systems. • In addition, the hypothalamus is involved in the control of: the autonomic nervous
system, appetite, thirst and water balance, body temperature, emotional reactions (e.g. pleasure, rage and fear), sexual behaviour (including mating and child rearing), biological clocks (e.g. sleeping and waking), body temperature and secretion of some hormones.

424 | Qatar science scheme of work | Grade 12 advanced | Unit 12AB.3 | Biology 3 © Education Institute 2005
Objectives Possible teaching activities Notes School resources
2 hours
Endocrine glands and blood sugar regulation Know the names, locations and functions of the main endocrine glands of humans.
Explain how insulin and glucagon control the blood glucose level and how failure of the system results in diabetes.
Provide each student with a large outline of the body and ask them to mark the locations of the main endocrine glands and the hormones they produce.
Make sets of cards with the names of glands, the names of hormones and the functions of hormones. Mix them up and ask students, working in pairs, to match them correctly.
Let students examine microscope slides of the pancreas displaying the islets of Langerhans. Use the microscope and video camera attachment to demonstrate the slides’ details to students.
Tell students to use information from their textbook to explain how insulin and glucagon control the blood glucose level.
Show students a prepared OHT scheme of the control process and discuss.
Ensure students appreciate that the conversion of glucose to glycogen inside cells is a way of storing carbohydrate without affecting the osmotic equilibrium. Also clarify that the glucose stored in the liver can later be taken out of the liver when blood sugar falls. However, the glucose stored as glycogen in the skeletal muscles is not affected by glucagons.
Ask students to construct a flow chart diagram to illustrate the control of blood sugar levels.
Tell students to use information from their textbook or the library to explain what happens in diabetes mellitus.
If someone in the class or school is diabetic, ask them (in confidence) if they would be willing to describe how the condition is controlled. Alternatively, ask someone who is diabetic to visit and talk to the class.
Prepare suitable sets of cards.
Students will need microscopes and prepared pancreas slides.
Prepare a suitable OHT.
3 hours
The role of plant hormones Describe how auxins affect plant growth by cell extension, how abscisic acid prepares plants to withstand stress and how gibberellins cause effects such as internode extension, premature flowering and break dormancy.
Explain to students how auxins affect plant growth by cell extension. Consolidate their knowledge of auxins by inviting individuals to explain the action of auxin to the rest of the class.
Use sunflower seedlings, about 10 cm tall, in investigations with exogenously applied auxin. Sunflowers are useful because they germinate and grow very quickly – from seed to 10 cm seedling within 10 days. Let students work in pairs and devise their own experiments along the following lines. Selected plants could either be left intact or have their stem tips removed before adding auxin (IAA) in lanolin to one side of the stem or all round. They should measure the degree of bending and growth of the stem and compare treated plants with intact control plants. They should also replicate the treatments. Discuss the results in class later.
Grow oat seedlings and get students, in pairs, to use the coleoptiles to repeat the classic experiment by Went. Decapitate several coleoptiles, place them for an hour on an agar gel. Cut a small piece of the gel. Decapitate a fresh coleoptile. Place a small cube of the gel on the tip eccentrically. Decapitate a second coleoptile and leave it untreated as a control.
Show an OHT of the experimental results from Boysen-Jensen’s and Went’s classic phototropism experiments. Discuss the observations with students.
Invite individual students to explain to the class Boysen-Jensen’s and Went’s classic phototropism experiments showing the effect of unilateral light on the distribution of auxin in a coleoptile. Ensure students appreciate that the growth response is caused by the stimulation of growth on the side furthest from the light by the redistributed auxin.
Grow sunflower seedlings for 7–10 days in advance.
Warm (40 °C) lanolin spreads more easily.
Enquiry skills 12A.1.2, 12A.1.3, 12A.1.5, 12A.3.1–12A.3.3
Grow oat seedlings for 4–7 days in advance.
Enquiry skills 12A.1.2, 12A.1.3, 12A.3.1–12A.3.3
Source details of Boysen-Jensen’s and Went’s classic phototropism experiments and prepare an OHT.
425 | Qatar science scheme of work | Grade 12 advanced | Unit 12AB.3 | Biology 3 © Education Institute 2005
Objectives Possible teaching activities Notes School resources
Show students a graph of the effect of auxin concentration on the growth responses of roots and shoots and discuss it with them. Make sure students understand that relatively low auxin concentrations stimulate root growth and higher concentrations are required to stimulate shoot growth; the concentrations that stimulate shoot growth inhibit root growth.
Students can use their textbook, library resources or the Internet to find out about the commercial applications of auxins. They should discover references to: helping fruit set, promoting the rooting of cuttings as rooting hormones, and acting as selective weedkillers.
Get students to use their textbook, library resources or the Internet to find out how gibberellins cause effects such as internode extension, premature flowering and break dormancy. Discuss their findings in class.
Establish that: • gibberellin needs auxin to cause effects on stem elongation; • auxin and gibberellin work synergistically to produce a greater effect together; • dwarf varieties (e.g. peas) can grow to normal height if treated with gibberellins; • a surge of gibberellin causes the plant to switch to reproductive growth and causes rapid
elongation of stems in bolting (the growth of a floral stalk); • fruit development is promoted when both auxin and gibberellin work together; • seeds often contain high concentrations of gibberellins and, when seeds imbibe water,
gibberellins are released from the seed embryo to break dormancy and promote germination;
• gibberellin also functions to break dormancy in the resumption of growth by apical buds in spring;
• in both seed dormancy and bud dormancy, gibberellin acts antagonistically to another hormone, abscisic acid, which generally inhibits plant growth.
Tell students to use information from their textbook and the library to describe how abscisic acid affects plant growth. Discuss their findings in class. Ensure that the following points about abscisic acid are covered in students’ descriptions or during the class discussion: • it tends to slow down growth and to promote the dormant state (i.e. it is often
antagonistic to auxin action); • it acts as a growth inhibitor and helps prepare the plant for winter by suspending both
primary and secondary growth, and is also associated with maintaining dormancy of seeds;
• it enables plants to cope with adverse conditions, acting as a ‘stress’ hormone (e.g. abscisic acid accumulates in leaves when they wilt and causes stomata to close, reducing transpiration and further wilting).
For extension work, suggest to students that they investigate the effect of ethylene, another plant hormone. Ethylene is unique as a hormone because it is gaseous. It is associated with fruit ripening and also ageing or senescence, including leaf abscission (with auxin).
Source a graph of the effect of auxin concentration on the growth responses of roots and shoots.
ICT opportunity: Use of the Internet.
Plant hormone or growth regulator effects are not clearly understood and many of the effects are due to several growth regulators interacting. Growth regulators act both as synergists and antagonists in plants.
426 | Qatar science scheme of work | Grade 12 advanced | Unit 12AB.3 | Biology 3 © Education Institute 2005
Assessment
Examples of assessment tasks and questions Notes School resources
Study the accompanying table, which shows and compares the composition of urine and plasma. Identify, with your reasons, at least three functions of the kidney that are indicated by the data in the table.
Provide a table comparing the composition of urine with plasma.
a. Explain how the skin helps to regulate the body temperature during vigorous physical activity.
b. Explain how the skin is controlled in the responses described in (a) above.
Draw a diagram of the nervous pathways responsible for the knee-jerk reflex and to explain the passage of the impulse from stimulus to response.
Explain how human blood sugar is regulated.
Describe the passage of a nerve impulse across a synapse.
Assessment Set up activities that allow students to demonstrate what they have learned in this unit. The activities can be provided informally or formally during and at the end of the unit, or for homework. They can be selected from the teaching activities or can be new experiences. Choose tasks and questions from the examples to incorporate in the activities.
Explain why and how a plant shows a phototropic response to a unidirectional light source.
Unit 12AB.3
427 | Qatar science scheme of work | Grade 12 advanced | Unit 12AB.4 | Biology 4 © Education Institute 2005
GRADE 12A: Biology 4
Human immune system
About this unit This unit is the fourth of seven units on biology for Grade 12 advanced.
The unit is designed to guide your planning and teaching of biology lessons. It provides a link between the standards for science and your lesson plans.
The teaching and learning activities should help you to plan the content and pace of lessons. Adapt the ideas to meet your students’ needs. For consolidation activities, look at the scheme of work for Grade 11A.
You can also supplement the activities with appropriate tasks and exercises from your school’s textbooks and other resources.
Introduce the unit to students by summarising what they will learn and how this builds on earlier work. Review the unit at the end, drawing out the main learning points, links to other work and real world applications.
Previous learning To meet the expectations of this unit, students should already understand and know that the body produces antibodies against antigens, and understand the causes and transmission of HIV/AIDS, its global significance and problems of control.
Expectations By the end of the unit, students understand the production of antibodies by the body and their mechanism of action against antigens. They distinguish between active and passive immunity and relate this to vaccination. They know the significance of stem cells and monoclonal antibodies. They know the role of the immune system in an allergic response. They understand the action of antibiotics and why resistance develops. They know the causes of cholera, influenza, malaria and TB, and explain their transmission, control and significance. They outline the mechanism of gene therapy.
Students who progress further understand the action of the HIV virus in more detail and its effect on the body’s immune system, including why AIDS develops. They will be able to follow future biotechnological developments in the use of stem cells, monoclonal antibodies and gene therapy in the diagnosis, treatment and cure of human diseases such as cancer.
Resources The main resources needed for this unit are: • overhead projector (OHP) • push-fit beads • sterile nutrient agar plates, cultures of bacteria (e.g. E. coli) • antibiotic discs • set of cards containing details of diseases • Internet access
Key vocabulary and technical terms Students should understand, use and spell correctly: • antibodies, antigens, antigen–antibody complex • competent B lymphocytes, competent T lymphocytes • cytotoxic cells, memory cells • pluripotent stem cells • monoclonal antibodies, hybridoma, ‘magic bullets’ • allergies, active immunity, passive immunity • vaccination, antibiotics • cholera, influenza, malaria, tuberculosis (TB) • gene therapy, cystic fibrosis (CF), severe combined immunodeficiency
syndrome (SCID)
UNIT 12AB.4 12 hours

428 | Qatar science scheme of work | Grade 12 advanced | Unit 12AB.4 | Biology 4 © Education Institute 2005
Objectives for the unit
12 hours SUPPORTING STANDARDS CORE STANDARDS Grade 12 standards
EXTENSION STANDARDS
11A.12.2 Explain the action of antibodies against antigens in the human immune system.
12A.11.1 Explain the production and action of human antibodies against antigens and distinguish between the actions of B lymphocytes and T lymphocytes.
12A.11.2 Explain the function of memory cells in long-term immunity.
12A.11.3 Relate the molecular structure of antibodies to their function.
12A.11.4 Explain the importance to health care of the pluripotency of stem cells and the culturing of monoclonal antibodies.
12A.11.5 Describe the role of the immune system in allergies such as hay fever.
12A.11.6 Distinguish between the actions of active and passive immunity and explain the role of vaccination in combating disease.
12A.11.7 Explain the role of antibiotics in health care and understand how pathogenic bacteria can become resistant to a particular antibiotic that was once effective.
11A.12.1 Explain the causes and transmission mechanisms of HIV/AIDS, how its spread may be controlled and the significance of the pandemic.
12A.11.8 Explain the causes, transmission, control and global significance of cholera, influenza, malaria and tuberculosis (TB).
2 hours
Specific immunity: B lymphocytes and T lymphocytes
2 hours
Stem cells and monoclonal antibodies
1 hour
Allergies
2 hours
Active and passive immunity
2 hours
Antibiotics and bacterial resistance
2 hours
Cholera, influenza, malaria and tuberculosis (TB)
1 hour
Gene therapy
12A.11.9 Explain gene therapy, with reference to examples such as cystic fibrosis, and understand the possible benefits and hazards of such treatments.
Unit 12AB.4
429 | Qatar science scheme of work | Grade 12 advanced | Unit 12AB.4 | Biology 4 © Education Institute 2005
Activities
Objectives Possible teaching activities Notes School resources
Reinforce previous knowledge by giving students a quiz about the body’s immune system.
Draw one OHT diagram to show the stages that B lymphocytes progress through in response to contact with a specific antigen. Explain the sequence of stages to students. Then ask students to write a report to explain the action of B lymphocytes in the body.
Ensure students appreciate that only competent B lymphocytes progress to produce a clone and plasma cells. Plasma cells produce the specific antibodies to the antigen. This response is referred to as antibody-mediated immunity (or humoral immunity).
Draw another OHT diagram to show the stages that T lymphocytes progress through in response to contact with a specific antigen. Explain the stages to students. Then ask students to write a report to explain the action of T lymphocytes in the body.
Ensure students appreciate that competent T lymphocytes also produce a clone and, through T helper cells, assist the B lymphocytes in the production of plasma cells. Other T lymphocytes, including cytotoxic T cells, leave the lymph nodes to directly attack pathogens and body cells that have been invaded by viruses, for example, and destroy the infected cell. This response is therefore referred to as cell-mediated immunity.
Produce OHTs of the responses of B lymphocytes and T lymphocytes.
Use this column to note your own school’s resources, e.g. textbooks, worksheets.
2 hours
Specific immunity: B lymphocytes and T lymphocytes Explain the production and action of human antibodies against antigens and distinguish between the actions of B lymphocytes and T lymphocytes.
Explain the function of memory cells in long-term immunity.
Relate the molecular structure of antibodies to their function.
Ask students to explain the role of lymphocytes in the processes of antibody-mediated immunity and cell-mediated immunity using information from their textbooks, the library, or the Internet.
ICT opportunity: Use of the Internet.
Ask students, individually, to produce a poster displaying the action of lymphocytes in immunity.
Ask students, individually, to produce a table comparing the activity of B and T lymphocytes.
Make a list of statements about immunity and then ask students to indicate whether the statement applies to either B or T lymphocytes or to both.
Enquiry skill 12A.3.4
Ask students to explain why people normally only suffer once from some diseases (e.g. measles or mumps), yet they may suffer from many colds and several bouts of influenza in their lifetime. Let them find the answer from their textbooks, the library or the Internet.
Get students to write, individually, a short article for a science magazine explaining the function of memory cells.
Ask students to use the Internet to locate scientists who have done research on memory cells and find out about their contribution to our understanding.
ICT opportunity: Use of the Internet.
Show students an OHT diagram of an antibody and explain the structure of the components that form the molecule.
Show students a diagram of a 3D model antibody downloaded from the Internet.
Produce a sheet with the antibody components separated and a list of the labels (heavy chains, light chains, constant region, variable chain, disulfide bonds, binding sites). Get students to cut out the components and stick them together to make an antibody and colour the parts appropriately. Tell students to write a report on the structure of the antibody molecule.
Enquiry skill 12A.3.4
Unit 12AB.4
430 | Qatar science scheme of work | Grade 12 advanced | Unit 12AB.4 | Biology 4 © Education Institute 2005
Objectives Possible teaching activities Notes School resources
Produce a sheet with a number of different antibody molecules (possibly four different-shaped antigens and six of each type of antigen). Also, on the same sheet, show three copies of one specific antigen that will fit one of the antibodies only. Get students to cut out the shapes of the antibodies and antigens and use them to produce the antigen–antibody complex. Ensure students understand why antibodies are Y-shaped. They can then stick them on another sheet in the finished positions and colour them. Then tell students to write an explanation of their antibody reaction
Ask students to build their own antibody molecule using push-fit beads of different colours.
Recall the ABO blood group system and get students to explain which blood transfusions would be successful and which would not be successful.
Ask students to use their textbooks, the library or the Internet to find out (and then write an explanation of) why transplanted organs are often rejected by their recipients.
Enquiry skills 12A.3.4
Provide push-fit beads of different colours.
ICT opportunity: Use of the Internet.
Some time before studying this topic, get students to collect newspaper cuttings about stem cells. Discuss the contents of the cuttings.
Discuss the ethics of stem cell research with students. For example, it is a possibility that individuals could soon produce clones of themselves. Reference to Aldous Huxley’s Brave New World and eugenics could lead to a lively debate.
Enquiry skill 12A.2.2
Ask students to produce a flow chart to show the potential of pluripotent stem cells in producing different body tissues. This may involve an Internet search.
Ask students to produce a magazine article about stem cells.
ICT opportunity: Use of the Internet.
Ask students to produce an article about the work of Georges Köhler and César Milstein on monoclonal antibodies.
Ask students to use the Internet to find out about the potential of monoclonal antibodies in the diagnosis and in the treatment of diseases such as cancer. Discuss their findings in class. Get students to write a report or prepare a PowerPoint presentation on the role and future potential of monoclonal antibodies.
Ask students why monoclonal antibodies have been called ‘magic bullets’.
ICT opportunity: Use of the Internet and PowerPoint.
Enquiry skill 12A.3.4
2 hours
Stem cells and monoclonal antibodies Explain the importance to health care of the pluripotency of stem cells and the culturing of monoclonal antibodies.
Ask students to produce a poster displaying the production of hybridomas and the action of monoclonal antibodies.
1 hour
Allergies Describe the role of the immune system in allergies such as hay fever.
Conduct a class survey to find out how many students have allergies, what symptoms they display and how they are treated.
Use large labelled diagrams on the board or OHP to explain the sequence of events that results in the symptoms of an allergy such as hay fever.
Ask students to produce a flow chart to explain the sequence of events that results in the symptoms of an allergy such as hay fever.
431 | Qatar science scheme of work | Grade 12 advanced | Unit 12AB.4 | Biology 4 © Education Institute 2005
Objectives Possible teaching activities Notes School resources As a revision exercise (see above) ask the students to explain why: • they normally only suffer once from a particular disease such as measles or mumps? • they may suffer from many colds or from several bouts of influenza in their lifetime ?
Ask students to find out from their textbooks or the library why breastfeeding newborn babies is an advantage to the baby’s survival in the first few weeks of life.
Ask students to find out from their textbooks, the library or the Internet why Edward Jenner is such an important historical figure in immunity. Discuss his discovery of vaccination.
ICT opportunity: Use of the Internet.
Enquiry skills 12A.2.1, 12A.2.5
2 hours
Active and passive immunity Distinguish between the actions of active and passive immunity and explain the role of vaccination in combating disease. Conduct a class survey to find out whether any students have suffered from any specific
infectious diseases, and also which students have been vaccinated. Collate the data to produce a class profile on immunity.
Get students to find out which bacterial and viral diseases we can be immunised against by vaccination. Then draw up a table to display, in columns, the disease, the bacteria or virus name, the type of vaccine used (one from: killed pathogens, attenuated strain (of pathogens), or chemically modified toxins (toxoids)). New vaccines are also now being produced from genetically engineered microbes and monoclonal antibodies.
Discuss why some people are not in favour of vaccinating their children.
Provide students with a graph showing the level of antibody in the blood after repeated injections with the same antigen. Ask them to explain the graph.
Ask students to find out from their textbooks, the library or the Internet how it was possible for the World Health Organisation (WHO) to declare, in 1977, the eradication of smallpox.
Act out a scenario in which a (pretend) venomous snake (e.g. a king cobra) comes into the room and bites somebody. What can students do to save the person? (If not treated with anti-venom serum, they would die in less than two hours!) Get students to explain the sequence of events in the process of saving the patient.
Discuss why passive immunity is so called, and why it confers only short-lived immunity. Ensure students appreciate that passive immunity involves using ‘borrowed’ antibodies, which, being proteins not produced by the individual, will be attacked as antigens by the body’s own antibodies.
The question of infectious diseases must be handled sensitively if such matters are confidential.
Enquiry skill 12A.2.2
ICT opportunity: Use of the Internet.
Enquiry skill 12A.3.4

432 | Qatar science scheme of work | Grade 12 advanced | Unit 12AB.4 | Biology 4 © Education Institute 2005
Objectives Possible teaching activities Notes School resources
2 hours
Antibiotics and bacterial resistance Explain the role of antibiotics in health care and understand how pathogenic bacteria can become resistant to a particular antibiotic that was once effective.
Ask students, in pairs, to investigate the effect of different antibiotics on the growth of a specific bacteria using the following procedure. Heat a prepared tube of sterile nutrient agar until it melts and allow it to cool to hand hot. Inoculate the agar with a loop of E. coli and then pour it into a sterile Petri plate. Allow the agar to solidify and then position small discs of filter paper impregnated with antibiotic on the surface of the agar. Seal the dishes with two pieces of tape and incubate at 30 °C. Observe after 24 h to see if there are zones of inhibition of growth. Discuss the results as a class activity. See if the bacteria are unaffected by certain antibiotics and show different responses to other antibiotics.
Get students work in pairs, and ask each one to write a letter to a friend explaining one of: • why an antibiotic once active against an illness-causing bacteria is no longer effective; • why the friend must take the complete course of prescribed antibiotics for an infection.
Let them discuss their completed letters with their partners.
Ask students to make a list of common antibiotics and the bacteria and illnesses they are effective against.
Ask students to find out from the library why antibiotics are ineffective against viruses.
Invite a hospital spokesperson to visit the class to discuss the problem of resistant bacteria in the health service. Tell students to write a report on this visit.
Safety: Ensure safe cultures of bacteria are sourced from educational suppliers. Make sure students operate the aseptic technique at all times. Enquiry skill 12A.1.3
Enquiry skill 12A.3.4
2 hours
Cholera, influenza, malaria and tuberculosis (TB) Explain the causes, transmission, control and global significance of cholera, influenza, malaria and tuberculosis (TB).
Arrange students into pairs and tell them to research two diseases each from cholera, influenza, malaria and tuberculosis (TB). Tell them each to write a report on their chosen disease, explaining its causes, transmission, control and global significance, and then to spend 10 minutes peer-teaching one another. They should give their partner a copy of their report.
Get students to simulate the design of an experiment to test a new drug to protect against malaria.
Ask each student to produce a poster or information leaflet on one of the four illnesses: cholera, influenza, malaria and tuberculosis (TB).
Ask students to make a table comparing causes, transmission, control and global significance of the four illnesses.
Provide pairs of students with a set of cards providing facts about cholera, influenza, malaria and tuberculosis (TB). Randomly shuffle the cards and then invite students to arrange the cards with the correct illness. This activity could be timed.
Provide WHO data about malaria and get students to use the data to draw maps of the incidence of the disease.
Provide students with WHO annual statistics on the incidence of cholera. Ask them to work as a class to identify areas of the world with the greatest incidences and to try to account for peaks and troughs.
Get students to write a leaflet for travellers giving advice on the avoidance of malaria.
ICT opportunity: Use of the Internet.
Enquiry skill 12A.1.3
Enquiry skill 12A.3.4
Provide each pair of students with a set of cards providing facts about cholera, influenza, malaria and tuberculosis (TB).
Enquiry skills 12A.1.8, 12A.3.2
Enquiry skill 12A.1.4
Enquiry skill 12A.3.4

433 | Qatar science scheme of work | Grade 12 advanced | Unit 12AB.4 | Biology 4 © Education Institute 2005
Objectives Possible teaching activities Notes School resources
1 hour
Gene therapy Explain gene therapy, with reference to examples such as cystic fibrosis, and understand the possible benefits and hazards of such treatments
In advance of studying this topic, collect newspaper and magazine articles about gene therapy.
Discuss the process of gene therapy using the collected newspaper articles. Explain the process using large labelled diagrams on the OHP.
Arrange students into pairs, and tell each member of the pair to use the Internet to research a different example of gene therapy (e.g. cystic fibrosis (CF) and the much rarer severe combined immune deficiency (SCID)). Tell them each to write a report explaining the possible benefits and hazards of such treatments, and then to spend 10 minutes peer-teaching one another. They should give their partner a copy of their report.
Ask students to draw a flow chart of the process of gene therapy for CF using viruses to insert genes and using liposomes to insert genes. Ask each student to write a letter to an imaginary friend who suffers from CF to explain how the process works, and its possible benefits and hazards.
Ask each student to produce a poster displaying gene therapy.
ICT opportunity: Use of Internet. Enquiry skills 12A.3.4
Enquiry skills 12A.3.4
Enquiry skills 12A.3.4

434 | Qatar science scheme of work | Grade 12 advanced | Unit 12AB.4 | Biology 4 © Education Institute 2005
Assessment
Examples of assessment tasks and questions Notes School resources
Explain and compare the action of a B cell and a T cytotoxic cell on its respective target.
Explain how long-term immunity is produced naturally by the body.
Explain how a vaccination against an infectious disease confers immunity on an individual.
Explain the difference between passive and active immunity.
Explain why monoclonal antibodies have been called ‘magic bullets’.
Assessment Set up activities that allow students to demonstrate what they have learned in this unit. The activities can be provided informally or formally during and at the end of the unit, or for homework. They can be selected from the teaching activities or can be new experiences. Choose tasks and questions from the examples to incorporate in the activities.
Explain how the use of antibiotics has led to the phenomenon of bacterial resistance.
Unit 12AB.4

435 | Qatar science scheme of work | Grade 12 advanced | Unit 12AB.5 | Biology 5 © Education Institute 2005
GRADE 12A: Biology 5
Genetic inheritance
About this unit This unit is the fifth of seven units on biology for Grade 12 advanced.
The unit is designed to guide your planning and teaching of biology lessons. It provides a link between the standards for science and your lesson plans.
The teaching and learning activities should help you to plan the content and pace of lessons. Adapt the ideas to meet your students’ needs. For consolidation activities, look at the scheme of work for Grades 10A and 11A.
You can also supplement the activities with appropriate tasks and exercises from your school’s textbooks and other resources.
Introduce the unit to students by summarising what they will learn and how this builds on earlier work. Review the unit at the end, drawing out the main learning points, links to other work and real world applications.
Previous learning To meet the expectations of this unit, students should already understand that changes in DNA bases cause variation. They should know some causes of mutation. They should understand that a mutation causes a change in DNA and that this can reduce the efficiency of, or block, an enzyme. They should know the difference between genes and alleles and that they are sections of DNA. They should understand how genetic variation occurs through the segregation of alleles and chromosome cross-overs. They should understand how sex is determined in humans and the mechanism of sex linkage. They should understand the difference between dominant and recessive alleles and be able to calculate genotype and phenotype frequencies in monohybrid crosses.
Expectations By the end of the unit, students calculate the frequency of different progeny from a cross with incomplete dominant alleles, from back crosses and from dihybrid crosses. They understand co-dominance and the inheritance of phenotypic traits through multiple alleles. They use the chi-squared test to determine the significance of results of genetic crosses. They know about the Human Genome Project, genetic fingerprinting and genetic screening and counselling.
Students who progress further are able to follow and understand the principles of the technological advances and applications of the Human Genome Project, genetic fingerprinting and genetic screening and counselling.
Resources The main resources needed for this unit are: • overhead projector (OHP) or whiteboard • corn (Zea mays) cobs • coloured beads • chi-squared statistical tables • DNA autoradiograph from a genetic fingerprint • Internet access
Key vocabulary and technical terms Students should understand, use and spell correctly: • incomplete dominance, co-dominance • dihybrid cross, Punnett square • chi-squared test • Human Genome Project • genetic fingerprinting, polymerase chain reaction (PCR) • genetic screening, amniocentesis, chorionic villus sampling • genetic counselling
UNIT 12AB.5 9 hours

436 | Qatar science scheme of work | Grade 12 advanced | Unit 12AB.5 | Biology 5 © Education Institute 2005
Objectives for the unit
9 hours SUPPORTING STANDARDS CORE STANDARDS
Grade 12 standards EXTENSION STANDARDS
11A.14.3 Explain the terms gene, allele, phenotype, genotype, dominant, recessive and co-dominant.
11A.14.4 Use genetic diagrams to solve genetic problems involving monohybrid crosses.
11A.14.5 Explain how variation occurs through segregation of alleles during gamete formation and through the crossing over of chromosome segments during meiosis
12A.12.1 Calculate the ratios of the genotypes and phenotypes in the progeny of incomplete dominant monohybrid crosses, dihybrid crosses (9:3:3:1 ratio) and back crosses.
11A.14.6 Know how X and Y chromosomes determine sex in humans and the inheritance pattern of sex-linked characteristics.
12A.12.2 Explain co-dominance and the inheritance of phenotypic traits such as blood grouping through multiple alleles.
12A.12.3 Use the chi-squared test to determine the significance of observed and expected frequencies of different progeny in genetic crosses.
12A.12.4 Know the purpose of the Human Genome Project.
12A.12.5 Explain the basis of genetic fingerprinting and understand its advantages and potential dangers.
2 hours
Calculating ratios of phenotypes and genotypes
1 hour
Co-dominance and multiple alleles
1 hour
Using the chi-squared test
1 hour
The Human Genome Project
2 hours
Genetic fingerprinting
2 hours
Genetic screening
12A.12.6 Explain the basis of genetic screening for alleles of disadvantaging inherited conditions; understand the advantages and potential dangers of such screening and the need for genetic counselling.
Unit 12AB.5
437 | Qatar science scheme of work | Grade 12 advanced | Unit 12AB.5 | Biology 5 © Education Institute 2005
Activities
Objectives Possible teaching activities Notes School resources
Reinforce previous knowledge by giving students a quiz on genes, chromosomes, monohybrid crosses, genetic variation and sex-linked characteristics (from Unit 11AB.5).
Tell students to use the library to read about, and make notes on, the work of Mendel and his recording of experiments conducted on the garden pea. These experiments included monohybrid crosses, dihybrid crosses and back crosses.
Use large diagrams on the board or OHP to display examples of the phenotypes of pea plants involved in a variety of crosses.
Enquiry skill 12A.2.1
Use this column to note your own school’s resources, e.g. textbooks, worksheets.
Introduce an example of incomplete dominance (which Mendel did not meet). Show students large diagrams on the board or OHP to illustrate the typical cross between red and white snapdragon (Antirrhinum ) flowers. The F1 offspring are all pink. Ask students to explain this observation. Ask them to predict what will happen in the F2 when the F1 plants are selfed.
Confirm that when the pink plants are selfed, then a ratio of 1 red : 2 pink : 1 white is produced in the F2. Ask students to explain the results using a Punnett square. Make sure students appreciate that the alleles remain discrete and that they do not blend together.
Get students to predict the outcome of a back cross on the pink plants.
Enquiry skill 12A.3.3
Provide students with an example of a dihybrid cross. Use large diagrams on the board or OHP showing the phenotypes of the parents and offspring for both F1 and F2.
For example, use one of Mendel’s crosses in which he crossed plants with tall purple flowers with plants with short white flowers, and produced all F1 tall purple flowers. These were selfed and he finally obtained the following F2 plants: 96 tall purple, 31 tall white, 34 short purple and 11 short white flowers. Get students to explain the results using a Punnett square and work out the dihybrid ratio of 9:3:3:1.
Provide students with a number of cobs of maize (Zea mays). Maize kernels display a number of easily recognisable characteristics, such as colour and shape. Ask to students to examine the kernels and make deductions about the genotypes of the parent plants.
Use a computer simulation to investigate genetic crosses.
Get students to predict the outcomes of dihybrid crosses and compare their predictions with collected data
Enquiry skill 12A.3.3
ICT opportunity: Use of computer simulation.
Enquiry skill 12A.1.2
2 hours
Calculating ratios of phenotypes and genotypes Calculate the ratios of the genotypes and phenotypes in the progeny of incomplete dominant monohybrid crosses, dihybrid crosses (9:3:3:1 ratio) and back crosses.
Simulate a dihybrid cross. Provide four bags, each containing the same number of a different colour of bead (e.g. 50 red beads in one bag, 50 blue in the second, 50 green in the third and 50 blue in the fourth). Arrange students in pairs and get each student to take two bags of the beads, pour them into one bag and mix thoroughly. Tell students to decide which colour will be the ‘dominant’ and which the ‘recessive’ allele. Each student then takes two beads out of their bag and puts them together to represent the first of the dihybrid’s F2 progeny. This should be repeated at least 16 times and the ‘genotypes’ of the progeny identified. Ask students to compare their ratios with those of other pairs of students and discuss the results together.
Unit 12AB.5
438 | Qatar science scheme of work | Grade 12 advanced | Unit 12AB.5 | Biology 5 © Education Institute 2005
Objectives Possible teaching activities Notes School resources
Distinguish co-dominance from incomplete dominance by asking students to find out, using the library, what the difference is between these genetic features.
Ensure students understand that, in co-dominance, both of the alleles are expressed in the phenotype, whereas, in incomplete dominance, the phenotype has an expression of a feature some way between the phenotypes of the two parental varieties.
A human example of co-dominance is in blood grouping. The three blood groups M, N and MN display the genotypes MM, NN, and MN, respectively. Note that MN is not intermediate between the M and N phenotypes, since both these factors are expressed on the membrane of a red blood cell.
1 hour
Co-dominance and multiple alleles Explain co-dominance and the inheritance of phenotypic traits such as blood grouping through multiple alleles.
Explain multiple alleles by using the other example of human blood groups: the ABO system. Use the OHP or whiteboard to set up the examples and ask students to show the possible outcomes of parents with different blood groups producing children. Get a student to come to the front of the class and explain their answer, by adding the details such as a Punnett square.
For example, ask them to explain how parents, one of blood group A and one of blood group B, can produce children with blood group A, B, AB or O.
1 hour
Using the chi-squared test Use the chi-squared test to determine the significance of observed and expected frequencies of different progeny in genetic crosses.
Explain the purpose of the chi-squared test to students. It is a basic statistical test of experimental data that is used to indicate whether the observed data is significantly different from the expected values. If a difference has been established, then the probability of this occurring by chance can be determined from statistical tables.
Work through an example with students, using data from phenotypes resulting from a dihybrid cross. Show them how to interpret the equation to calculate the chi-squared value.
Provide students with a worksheet containing results from a dihybrid cross displaying the numbers of the progeny. Ask them to work out the chi-squared value to see if the difference between the observed and expected data is significant. They will need access to chi-squared tables.
Using other examples, get students to calculate the probability of obtaining the progeny of genetic crosses by chance.
Prepare worksheets on the appropriate dihybrid crosses.
Students will need access to chi-squared tables.
Enquiry skills 12A.3.3
1 hour
The Human Genome Project Know the purpose of the Human Genome Project.
Get students to visit the Human Genome Project website to gather information and to find out the purpose of this ambitious research project.
The project is producing evidence of the sequence of the bases of the DNA in the entire human genome. Ask students how this knowledge will help people. Ensure they understand the huge potential benefits, for example: • health care – identification and mapping of the genes responsible for genetic diseases will
help in the diagnosis, treatment and prevention of those conditions; • science – knowledge of the genome will give insight into the control of gene expression,
cellular growth and differentiation; • evolutionary biology – enabling clarification of genetic relationships between species.
Show students a video of the Human Genome Project.
Get students to write an article for a magazine about the Human Genome Project.
ICT opportunity: Use of the Internet.
439 | Qatar science scheme of work | Grade 12 advanced | Unit 12AB.5 | Biology 5 © Education Institute 2005
Objectives Possible teaching activities Notes School resources
2 hours
Genetic fingerprinting Explain the basis of genetic fingerprinting and understand its advantages and potential dangers.
Before beginning this topic, get students to collect newspaper and magazine articles (e.g. New Scientist) on genetic fingerprinting. Get them to use these and the Internet to find out about the development of genetic fingerprinting by Alec Jeffreys and colleagues at the University of Leicester, and to explain the principles of the procedure of genetic fingerprinting. Ask them to produce a poster showing the main stages of genetic fingerprinting and its applications. Examples of applications include: • settling paternity disputes; • settling disputes in hospitals where newborn babies have been accidentally switched; • revolutionising forensic work (using DNA extracted from cells in traces of blood, saliva, hair
roots or, in rape cases, semen); • animal identification (e.g. establishing the variation of the whale population).
Ask students to find out about the dangers or shortcomings of genetic fingerprinting, for example:• discovering that a child may not be the natural child of a parent may create problems for
family relationships; • relatives show many similarities in their genetic fingerprints, so if more than one family
member is a suspect of a crime, it may be difficult to be certain who is the culprit; • the use of the polymerase chain reaction (PCR) to amplify the amount of DNA for forensic
work means the technique is now extremely sensitive to contamination; anyone who has shed dandruff or sneezed at the scene of a crime may become a suspect!
Show students autoradiographs of genetic fingerprints of individuals from a murder case and ask them to select the possible suspect.
Get students to write an article for a magazine about genetic fingerprints.
ICT opportunity: Newspaper and magazine articles can be obtained from the Internet.
Enquiry skills 12A.2.1
2 hours
Genetic screening Explain the basis of genetic screening for alleles of disadvantaging inherited conditions; understand the advantages and potential dangers of such screening and the need for genetic counselling.
Ask students what they understand by the term genetic screening. Explain that everyone probably carries several genetic defects, and detecting the mutant genes in an individual is known as genetic screening.
Ask students to find out from the library the situations in which genetic screening is particularly relevant. These include: prenatal diagnosis, carrier diagnosis (e.g. CF, sickle cell), and predictive diagnosis (e.g. Huntington’s disease).
Ask students to investigate and compare the advantages and dangers of prenatal diagnosis by amniocentesis and chorionic villus sampling.
Debate the ethics of genetic screening with students. Should the mother be able to choose to abort her foetus? Which genetic disorders should result in a foetus being aborted? Where do you draw the line? Will we be able to breed genetic abnormalities out of the human race in the future?
Ask students what they understand to be the role of a genetic counsellor.
Ask students to find out whether their local hospital has a genetic counselling department and why only certain people may need to visit a genetic counsellor.
Discuss the nature of a conversation that a counsellor might have with a husband and wife, one of whom thinks they are carrying an allele for a disadvantaging condition.
Enquiry skills 12A.2.2

440 | Qatar science scheme of work | Grade 12 advanced | Unit 12AB.5 | Biology 5 © Education Institute 2005
Assessment
Examples of assessment tasks and questions Notes School resources
Examine the kernels of cobs of maize (Zea mays). Make deductions about the genotypes of the parent plants. Justify and support your deductions by drawing diagrams to show the parental cross and a Punnett square to show the offspring.
Provide suitable cobs of maize for this question.
Distinguish co-dominance from incomplete dominance by using examples.
Examine the worksheet containing results from a dihybrid cross and displaying the numbers of the progeny. Work out the chi-squared value to see if the difference between the observed and expected data is significant.
Provide a suitable worksheet and chi-squared tables.
Write an article for a magazine about the Human Genome Project.
Explain the principles of the procedure of genetic fingerprinting.
Assessment Set up activities that allow students to demonstrate what they have learned in this unit. The activities can be provided informally or formally during and at the end of the unit, or for homework. They can be selected from the teaching activities or can be new experiences. Choose tasks and questions from the examples to incorporate in the activities.
Explain the advantages and dangers of genetic screening by prenatal diagnosis by amniocentesis and chorionic villus sampling.
Unit 12AB.5
441 | Qatar science scheme of work | Grade 12 advanced | Unit 12AB.6 | Biology 6 © Education Institute 2005
GRADE 12A: Biology 6
Ecological relationships
About this unit This unit is the sixth of seven units on biology for Grade 12 advanced.
The unit is designed to guide your planning and teaching of biology lessons. It provides a link between the standards for science and your lesson plans.
The teaching and learning activities should help you to plan the content and pace of lessons. Adapt the ideas to meet your students’ needs. For consolidation activities, look at the scheme of work for Grade 11A.
You can also supplement the activities with appropriate tasks and exercises from your school’s textbooks and other resources.
Introduce the unit to students by summarising what they will learn and how this builds on earlier work. Review the unit at the end, drawing out the main learning points, links to other work and real world applications.
Previous learning To meet the expectations of this unit, students should already understand that ecosystems are dynamic and subject to change, and that human activities can have an impact on the environment.
Expectations By the end of the unit, students know how some organisms are structurally and physiologically adapted to their environment and distinguish between acclimatisation and adaptation. They understand the carrying capacity of a habitat and can use population curves. They understand ecological colonisation and succession. They know examples of biological control of unwanted organisms. They distinguish between environmental preservation and conservation and understand the conflicts between nature conservation and production.
Students who progress further will be able to follow and take part in future debates on environmental issues such as nature conservation and food production.
Resources The main resources needed for this unit are: • overhead projector(OHP) or whiteboard • various sets of cards on the environment • datalogger/computer with sensors • haemocytometer • colorimeter • fermenter, yeast culture • microscopes, video camera, still camera, monitor • video that illustrates biological control • Internet access
Key vocabulary and technical terms Students should understand, use and spell correctly: • environmental resistance, biotic factors, abiotic factors • biotic potential, carrying capacity • ecological succession, primary colonisation, climax community • pioneer species, xerophyte, hydrophyte, mesophyte • sere, xerosere, hydrosere, zonation • biological control • environmental preservation, environmental conservation
UNIT 12AB.6 13 hours

442 | Qatar science scheme of work | Grade 12 advanced | Unit 12AB.6 | Biology 6 © Education Institute 2005
Objectives for the unit
13 hours SUPPORTING STANDARDS CORE STANDARDS
Grade 12 standards EXTENSION STANDARDS
12A.13.1 Explain examples of structural and physiological adaptations of animals to their environment.
12A.13.2 Distinguish between the permanent adaptation of an organism to its normal environment and the temporary acclimatisation of a visitor.
11A.16.1 Explain examples of a predator–prey relationship and the possible effects on the population size of both the predator and the prey.
11A.16.2 Explain examples of inter- and intra-specific competition for food and space and the effects on the distribution and size of the populations of organisms.
12A.14.1 Explain and give examples to illustrate the carrying capacity of an environment.
11A.16.3 Explain how disease affects the size of population of organisms and the significance of limiting factors in determining the ultimate size of a population.
11A.16.4 Explain how the diversity and numbers of organisms and the environmental factors in an ecosystem form a dynamic relationship that is open to disruption.
12A.14.2 Know how to construct and interpret population curves for different organisms; identify the stages in population growth and decline.
11A.16.5 Explain examples of short- and long-term human impact on a variety of environments.
12A.14.3 Describe the progression of the development of an ecological community from primary colonisation to climax community.
12A.15.1 Explain examples of biological control of population growth in natural and commercial settings.
12A.15.2 Assess the advantages and disadvantages of biological pest control.
12A.16.1 Explain the similarities and differences between environmental preservation and conservation; understand that conservation is a dynamic process involving management and reclamation.
3 hours
Animal adaptations and acclimatisation
2 hours
Dynamics of population growth
2 hours
Ecological succession
2 hours
Biological control
2 hours
Comparing preservation and conservation
2 hours
Food production and conservation
12A.16.2 Explain how a wish to use an environment for food production can conflict with a wish for its conservation.
Unit 12AB.6

443 | Qatar science scheme of work | Grade 12 advanced | Unit 12AB.6 | Biology 6 © Education Institute 2005
Activities
Objectives Possible teaching activities Notes School resources
Get students to do some card-matching activities. First provide a set of cards (set A) naming specific environments (e.g. ocean, polar, mountain, temperate, tropical savannah, desert, steppe), and another set of cards (set B) describing the characteristics of the environments (e.g. large expanse of grassland, large numbers of deciduous trees). Arrange students in pairs, mix up the cards and ask students to organise the cards into their matched groups.
Next introduce a set of cards naming specific animals (set C), and another set of cards (set D) describing the adaptations of the animals (e.g. has layer of thick blubber, has extremely well-developed sense of smell / hearing / eyesight). Arrange students in pairs, mix up the cards and ask students to organise the cards into their matched groups.
Alternatively, use these sets of cards for a class interactive activity. For example, issue each of students several cards from set D and then ask another student to select an unseen card from set C. Ask the class to indicate who has got the specific animal adaptations on any of their cards.
Get students to work as a team to produce a booklet on the animals of Qatar.
Give students lettered / numbered lists of animals, environments and adaptations in three columns and ask them to match the animal to the most appropriate components in the other columns.
Prepare sets of appropriate cards.
Enquiry skill 12A.1.4
Prepare suitable lists.
Use this column to note your own school’s resources, e.g. textbooks, worksheets.
Give each student the name of a different animal, or ask them to name a species of their own choice, and then ask them to use the library or the Internet to find out how that animal is adapted to its environment.
Ask them each to write a short report on their animal and then make a brief presentation to the other students.
Alternatively, ask each student to make a poster on the animal’s adaptations to its environment. Then hold a class poster conference in which students view each other’s work and ask each other questions.
ICT opportunity: Use of the Internet.
Enquiry skills 12A.1.6, 12A.1.8
Take students on a field trip to a local ecosystem for study. For example, go to a local pond, a rocky shore or an area of desert, and make observations of the plants and animals found there. Ask students to make notes about how the organisms are adapted to the specific environment.
Ensure students take appropriate measures to limit disturbance to wildlife and habitats when engaged in field work.
Ask students to make a photographic record of the xerophytic adaptations of plants.
Visit opportunity: Visit a local ecosystem.
Enquiry skills 12A.1.4, 12A.1.7
ICT opportunity: Use of a digital camera.
3 hours
Animal adaptations and acclimatisation Explain examples of structural and physiological adaptations of animals to their environment.
Distinguish between the permanent adaptation of an organism to its normal environment and the temporary acclimatisation of a visitor.
Distinguish between the permanent adaptation of an organism to its normal environment and the temporary acclimatisation of a visitor. Use the example of people who live permanently at altitude, such as the natives of Peru, compared with temporary visitors to the Andes. Show students graphs of the red blood cell counts of the two categories of people: those living permanently at altitude compared with visitors before, during and after their visit. Ask students to interpret the graphs using their textbook or the library.
Ask students to find out from the library or the Internet the difficulties experienced by athletes at the Olympic Games and the football World Cup when they were held in Mexico.
ICT opportunity: Use of the Internet. Enquiry skill 12A.1.8
Unit 12AB.6
444 | Qatar science scheme of work | Grade 12 advanced | Unit 12AB.6 | Biology 6 © Education Institute 2005
Objectives Possible teaching activities Notes School resources
Reinforce previous knowledge of populations by quizzing students on inter- and intra-specific competition, disease and predator–prey relationships.
Get students to use computer models to explore population growth and decline. For example, show how a change in an environmental factor, such as the introduction of a new predator, changes the carrying capacity of the population.
ICT opportunity: Use of computer models.
Introduce the rapid growth rates of micro-organisms. Ask students to work out the potential numbers of micro-organisms produced from a bacteria with a doubling time of 20 minutes over a period of 6, 12, 18 and 24 hours. Discuss the figures with the class.
Provide students with a table of data for producing a growth curve for bacteria. Get them to plot a graph and to examine and explain shape obtained. Use this example to ask students to explain what the limits to growth are, and what an organism’s carrying capacity is.
Ensure students appreciate that an organism growing in a limited environment experiences environmental resistance due to one or more limiting factors during growth. This means that biotic potential is not realised because of environmental changes (resistance), and the organism reaches its carrying capacity for a particular set of environmental factors.
Provide a suitable table of data.
Either carry out the following activity as a demonstration or get students to work in pairs and carry out these investigations, record the data and analyse it, and write a report.
Determine the growth pattern of a population of yeast cells by inoculating a liquid media, a broth, in a laboratory fermenter, and follow the progress of growth. Use a datalogger and sensors to monitor the temperature, pH and oxygen level during the growth period. Remove unit samples at regular intervals. Several different methods can be used to follow the growth, including: • use a haemocytometer – the haemocytometer was originally used for counting blood cells,
but can be equally useful in counting yeast, bacteria or algae cells in liquid medium; • use a colorimeter – a colorimeter can be used in a photometric method for estimating density
by recording the optical density of the sample.
Demonstrate the use of the haemocytometer as a counting chamber for yeast cells by using a video camera attached to the microscope and displayed on a monitor.
You will need: fermenter, nutrient broth, yeast culture, datalogger, sensors, haemocytometer, colorimeter, video camera attached to a microscope and monitor.
ICT opportunity: Use of datalogger and sensors.
Details of the procedures can be found in P. Freeland, Micro-organisms in Action, Hodder & Stoughton, 1991 (ISBN 0-340-53268-8).
Get students to draw a diagram of the biotic factors (e.g. high reproductive rate, adequate food supply) and abiotic factors (e.g. light, temperature, oxygen supply) that influence a population’s carrying capacity.
Ask students to suggest an example in the wild where the organism itself causes a reduction in its carrying capacity. Discuss their answers in class. One example is the African elephant, which has to be culled occasionally in game parks when its numbers exceed the carrying capacity, which causes the elephants to overgraze and destroy many of their food trees.
Show students a graph of the change in the human population over time (or get them to construct their own graph from census data) and some graphs showing how carrying capacity varies; debate which model may apply to the human population.
Enquiry skill 12A.1.8
2 hours
Dynamics of population growth Explain and give examples to illustrate the carrying capacity of an environment.
Know how to construct and interpret population curves for different organisms; identify the stages in population growth and decline.
Show students a growth curve of bacteria, yeast or a unicellular algae on an OHT. Ask them to explain the growth stages: the lag phase, the exponential or logarithmic phase, the stationary or plateau phase and the final decline or death phase.

445 | Qatar science scheme of work | Grade 12 advanced | Unit 12AB.6 | Biology 6 © Education Institute 2005
Objectives Possible teaching activities Notes School resources
Discuss with students whether ecosystems are stable systems or whether they are changing dynamic systems.
Introduce the concept of succession. Ensure students appreciate that populations of plants and animals change over time through a succession of changes, or seres, to reach a relatively stable climax community.
Take students to a suitable site displaying succession to carry out a field work investigation. For example, visit an area that shows succession from open water to reed swamp to marsh land and finally to dry land. Use a transect to follow the hydrosere from water to land.
Alternatively, take students to follow a xerosere from the sand dunes at the shore back to woodland, if possible.
A rocky shore tends to show zonation of seaweeds in the inter-tidal region rather than succession. However, small-scale succession can be seen by comparing different sites at different stages of development. In particular, when pieces of rock flake off, or boulders fall from cliffs or become overturned by stormy seas, these sites can be colonised by a succession of organisms and are suitable for study. Alternatively, a small area of rock can be scraped clear to investigate succession.
Visit opportunity: Visit a local site displaying succession.
Get students to use the library or the Internet to find information that helps them to draw a diagram of a primary succession. Ensure they include references to the following: pioneer species, xerophytes, hydrophytes, xerosere, hydrosere, mesophytes, climax community.
Ask students to explain the process of primary succession: • for a xerosere; • for a hydrosere.
ICT opportunity: Use of the Internet.
Enquiry skill 12A.1.8
2 hours
Ecological succession Describe the progression of the development of an ecological community from primary colonisation to climax community.
Ask students to trace the development of a biological community through a photographic record.
ICT opportunity: Use of a digital camera.
Enquiry skill 12A.3.4
Discuss biological control with students. What is it? What is its aim?
Ensure students appreciate that it involves humans exploiting a natural predator–prey relationship that exists between other species. A beneficial organism (the predator) is deployed against an undesirable one (the pest). The aim is not to eradicate the pest, but to reduce it to a level where it has little detrimental effect.
Show students a video that illustrates biological control.
2 hours
Biological control Explain examples of biological control of population growth in natural and commercial settings.
Assess the advantages and disadvantages of biological pest control.
Ask students to use the library or the Internet to find examples of biological control in the natural environment and in the greenhouse. Examples they discover might include the following: • In the natural environment. There are two pests that lay their eggs on cattle dung in Australia:
the bush fly and the buffalo fly. In addition, the dung carries the eggs of worms that parasitise the cattle. The indigenous dung beetles cannot deal with the soft cattle dung. The introduction of an African species of dung beetle, which buries the dung within 48 hours, has resulted in the control of the population of these pests.
• In the greenhouse environment. Greenhouse whitefly are controlled by introducing a parasitic wasp into the greenhouse.
ICT opportunity: Use of the Internet.

446 | Qatar science scheme of work | Grade 12 advanced | Unit 12AB.6 | Biology 6 © Education Institute 2005
Objectives Possible teaching activities Notes School resources
Get students to match lists of examples of organisms involved in biological control. For example, have one list of the target organisms (the pests) and another list of the control agents (the predators). Additional lists could include harmful effects of the pest and method of action for the controlling agent.
Carry out case studies of biological control, for example: • The cane toad. Ask students to use the library or the Internet to find out about the cane toad,
which was introduced to Australia to control a sugar cane pest. The cane toad, a very large amphibian, is now a cause of concern itself as it is eating its way through the local unique fauna. In addition, its skin is poisonous, so it is a danger to pets and potential predators.
• The rabbit. Ask students to use the library or the Internet to find out about the control of the rabbit population in the UK. The controlling agent, a virus called myxomatosis, devastated the rabbit population, which had reached pest levels.
Carry out a role-play exercise in which one student acts as an advocate for biological pest control and another student acts as a protester against it.
ICT opportunity: Use of the Internet.
Enquiry skill 12A.3.4
2 hours
Comparing preservation and conservation Explain the similarities and differences between environmental preservation and conservation; understand that conservation is a dynamic process involving management and reclamation.
Get students to make two lists – conservation and preservation – and ask them to write underneath the similarities and differences between these processes.
Alternatively, provide a list of statements referring to either conservation or preservation, or to both, and get students to sort them into the appropriate categories.
Get students to contact environmental groups in Qatar and determine their policies regarding conservation and preservation.
Ask students to find out about National Parks and how they are managed.
Carry out a simulation exercise. Divide the class into two and hold a debate. Get one side to present the case for a development and get the other side to present the case opposing it. For example: • the proposed development of a new marina on an important wildlife site; • a proposed new highway development through an important nature reserve.
Get students, in pairs, to use the library or the Internet to examine and compare old and new maps of an area of Qatar to see how land use has changed. Ask them what conclusions can be drawn about the areas of nature reserves or wildlife sites over the last 30 years, for example.
Get students to find out which plant and animal species are in danger of extinction in the world and what measures, if any, are being taken to halt their decline.
Provide a suitable list.
Enquiry skill 12A.2.3
ICT opportunity: Use of the Internet.
Enquiry skill 12A.2.3

447 | Qatar science scheme of work | Grade 12 advanced | Unit 12AB.6 | Biology 6 © Education Institute 2005
Objectives Possible teaching activities Notes School resources
2 hours
Food production and conservation Explain how a wish to use an environment for food production can conflict with a wish for its conservation.
Debate the issue of growing genetically modified (GM) crops. Divide the class into two and ask one group to present the case for GM crops and the other group to present the case against, citing the argument for conservation. Get them to use the library or Internet to find their information.
Ask students, individually, to review the evidence that science has provided the knowledge needed to breed plants and animals that could feed the world, and to consider why people starve.
Debate the issue of the deforestation that takes place to allow farmers to grow food crops. Divide the class into two groups and ask one group to support the policy and the other group to argue against the policy. Get them to use the library or Internet to find their information.
Make sure students refer to the forest community as being essential to conserve the biodiversity of the planet and its genetic potential, and to the fact that it is an important potential source of new drugs, medicines and unknown, undiscovered chemicals.
Debate the desirability of restricting fishing to conserve fish stocks. For example, use the case study of the cod. The NW Atlantic cod stocks were over-fished off the coast of Newfoundland by off-shore trawlers until the cod had virtually disappeared by 1992.They show little signs of any recovery and the fishermen are out of work. Conversely, the Norwegian government controlled fishing in the North Sea and the cod stocks are now recovering slowly. Introducing fishing quotas is not the best answer either. Many EU nations have fish quotas, but the fishermen just catch more fish than allowed in their quota, retain the higher value fish and throw back the rest (around a third of their catch) dead.
ICT opportunity: Use of the Internet.
Enquiry skill 12A.2.3
448 | Qatar science scheme of work | Grade 12 advanced | Unit 12AB.6 | Biology 6 © Education Institute 2005
Assessment
Examples of assessment tasks and questions Notes School resources
a. Draw a population curve from the data provided for the growth of the micro-organism.
b. Explain the four phases of growth identified.
Provide data for the growth of a micro-organism.
Explain, with examples, the relationship between an organism’s biotic potential, the environment’s carrying capacity and the process of environmental resistance.
Describe the progression of the development of an ecological community from primary colonisation to climax community.
Explain, with examples, the advantages and disadvantages of biological pest control.
Explain the similarities and differences between environmental preservation and conservation.
Assessment Set up activities that allow students to demonstrate what they have learned in this unit. The activities can be provided informally or formally during and at the end of the unit, or for homework. They can be selected from the teaching activities or can be new experiences. Choose tasks and questions from the examples to incorporate in the activities.
Explain the structural and physiological adaptations displayed by a named animal to its environment.
Unit 12AB.6

449 | Qatar science scheme of work | Grade 12 advanced | Unit 12AB.7 | Biology 7 © Education Institute 2005
GRADE 12A: Biology 7
Biotechnology
About this unit This unit is the seventh of seven units on biology for Grade 12 advanced.
The unit is designed to guide your planning and teaching of biology lessons. It provides a link between the standards for science and your lesson plans.
The teaching and learning activities should help you to plan the content and pace of lessons. Adapt the ideas to meet your students’ needs. For consolidation activities, look at the scheme of work for Grade11A.
You can also supplement the activities with appropriate tasks and exercises from your school’s textbooks and other resources.
Introduce the unit to students by summarising what they will learn and how this builds on earlier work. Review the unit at the end, drawing out the main learning points, links to other work and real world applications.
Previous learning To meet the expectations of this unit, students should already understand and know how human blood glucose levels are controlled. They should understand how micro-organisms and cells can be cultured. They should understand the basic principles of genetic engineering. They should know the significance of stem cells and monoclonal antibodies.
Expectations By the end of the unit, students understand how biosensors are used to monitor blood glucose levels in diabetes and how diabetes can be treated with genetically produced insulin. They know some applications of monoclonal antibodies and immobilised enzymes.
Students who progress further will be able to follow future developments in the applications of biotechnology. In particular, they will be able to understand future developments in the applications of genetically engineered organisms, biosensors, monoclonal antibodies and immobilised enzymes.
Resources The main resources needed for this unit are: • overhead projector (OHP), whiteboard • video on human insulin manufacture • glucose, glucose test strips • lactase, catalase • Internet access
Key vocabulary and technical terms Students should understand, use and spell correctly: • biosensor, sensory agent, glucose oxidase • monoclonal antibodies, human chorionic gonadotrophin (HCG) • immobilised enzyme, catalase • sodium alginate, carboxymethylcellulose
UNIT 12AB.7 8 hours

450 | Qatar science scheme of work | Grade 12 advanced | Unit 12AB.7 | Biology 7 © Education Institute 2005
Objectives for the unit
8 hours SUPPORTING STANDARDS CORE STANDARDS
Grade 12 standards EXTENSION STANDARDS
11A.17.2 Know methods for the laboratory and bulk culture of micro-organisms and cell lines.
11A.17.3 Explain the principles of gene cloning and the roles of restriction enzymes, recombinant DNA, plasmids and bacteriophages.
12A.17.1 Explain how genetically engineered human insulin was developed and is now manufactured for use by diabetics.
12A.9.13 Explain how insulin and glucagon control the blood glucose level and how failure of the system results in diabetes.
12A.17.2 Explain what is meant by a biosensor. Know about the use of glucose oxidase as a bio-recognition substance in biosensors used for monitoring the blood glucose levels of diabetics.
12A.11.3 Relate the molecular structure of antibodies to their function.
12A.11.4 Explain the importance to health care of the pluripotency of stem cells and the culturing of monoclonal antibodies.
12A.17.3 Explain some biomedical uses of monoclonal antibodies in procedures such as pregnancy testing.
2 hours
Genetic engineering and insulin
2 hours
Biosensors and diabetics
2 hours
Monoclonal antibodies in biomedicine
2 hours
Enzyme immobilisation action
12A.17.4 Explain the technique of enzyme immobilisation, understand the advantages and disadvantages of the use of immobilised enzymes and describe some commercial applications.
Unit 12AB.7
451 | Qatar science scheme of work | Grade 12 advanced | Unit 12AB.7 | Biology 7 © Education Institute 2005
Activities
Objectives Possible teaching activities Notes School resources
Reinforce previous knowledge by giving students a quiz on the principles of genetic engineering and also on the control of human blood glucose levels.
Ask students to use the library or the Internet to find out about, and write a report on, how genetically engineered human insulin was developed and is now manufactured for use by diabetics.
Get students to identify the advantages of genetically engineered human insulin compared with the traditional sources (traditional sources were animals and cadavers, where the problems of supply, purity, immune response and disease, such as CJD, were risk factors).
Get students to draw a flow chart to depict the commercial production of human insulin.
ICT opportunity: Use of the Internet.
Enquiry skill 12A.3.4
Use this column to note your own school’s resources, e.g. textbooks, worksheets.
Show students a video on how genetically engineered human insulin was developed and is now manufactured for use by diabetics.
Ask students to find out the number of diabetics in Qatar and the amount of insulin they require in a year. The Qatar National Health Authority may be able to supply this information.
2 hours
Genetic engineering and insulin Explain how genetically engineered human insulin was developed and is now manufactured for use by diabetics.
Get students to produce a poster displaying the production of human insulin using genetically engineered E. coli.
Enquiry skill 12A.3.4
Introduce the principle of a biosensor. Provide the class with three beakers of liquid: one containing pure water, the others with a 1% and 2% solution of glucose, respectively, and ask students how they could tell which ones had glucose in solution. Testing with Benedict’s solution may be suggested. Demonstrate the use of the dip-stick / test strip for glucose. Discuss the colour changes. See if students suggest the possibility of the involvement of an enzyme.
Ask students to find out how the glucose test strip works by using the library or the Internet.
Provide test strips for determination of glucose in blood and urine for diabetics.
ICT opportunity: Use of the Internet.
Ask students to share the information they found from the previous activity. Make sure they appreciate that there are more complex biosensors that are capable of providing a continuous read out of the quantitative levels of glucose. Ask students to find more details about these biosensors. In particular, get them to find out the key components of a biosensor: • artificial membrane (allows substrate through); • sensory agent (the immobilised enzyme glucose oxidase); • transducer (produces an electrical signal); • amplifier (increases size of signal); • display readout.
Ask students to write and illustrate an account explaining the principle of how this biosensor works. They could produce a poster to accomplish this task.
2 hours
Biosensors and diabetics Explain what is meant by a biosensor. Know about the use of glucose oxidase as a bio-recognition substance in biosensors used for monitoring the blood glucose levels of diabetics.
Invite a health professional (nurse or doctor) and/or a diabetic patient to come and talk to students and answer questions about biosensors in the treatment of diabetes.
Opportunity for a health professional or diabetic patient visitor.
Unit 12AB.7

452 | Qatar science scheme of work | Grade 12 advanced | Unit 12AB.7 | Biology 7 © Education Institute 2005
Objectives Possible teaching activities Notes School resources
Ask students to find out who makes biosensors. Organise members of the class to contact different organisations, or visit their websites, and ask for information about the operation of biosensors.
Encourage students to find out about the other applications of biosensors, and to produce a table showing the different applications and what they use as the sensory agent and substrates.
Alternatively, get students to match lists of biosensors and what they use as the sensory agent and substrates.
ICT opportunity: Use of the Internet.
Reinforce previous knowledge on the production, action and structure of antibodies, the antibody–antigen complex formation and the culturing of monoclonal antibodies by giving students a quiz.
Get students to use the Internet to determine the role of monoclonal antibodies in diagnostic procedures such as pregnancy testing.
Ask students to produce a flow chart of the role of monoclonal antibodies in pregnancy testing. Make sure they include the detection of human chorionic gonadotrophin (HCG) by the antibodies as the basis of the positive test.
ICT opportunity: Use of the Internet.
Enquiry skill 12A.3.4
2 hours
Monoclonal antibodies in biomedicine Explain some biomedical uses of monoclonal antibodies in procedures such as pregnancy testing.
Get students to use the Internet to investigate the wide application of monoclonal antibodies today and possible future uses. Uses in medical diagnosis and treatment include: • the diagnosis of cancer by identifying ‘tumour markers’; • the possibility of treatment using monoclonal antibodies as ‘magic bullets’ carrying drugs to
specific cells; • blood typing; • detection of the rabies virus; • the possible production of a new vaccine against malaria; • kits to detect the presence of drugs in the urine of athletes.
ICT opportunity: Use of the Internet.
2 hours
Enzyme immobilisation action Explain the technique of enzyme immobilisation, understand the advantages and disadvantages of the use of immobilised enzymes and describe some commercial applications.
Give students a worksheet describing a practical investigation involving the immobilised enzyme lactase and ask them to carry out the work in pairs. The enzyme is immobilised by entrapment in beads made of sodium alginate. The beads are packed into a column inside a syringe barrel, and milk containing lactose is trickled through the column. Glucose and galactose leave the column. Glucose is detected with a glucose test strip.
Give students a worksheet describing a practical investigation into the effect of the bead diameter on the activity of the immobilised enzyme catalase and ask them to carry out the work in pairs. The size of the sodium alginate beads can be simply adjusted by changing the flow rate of the alginate / enzyme mixture into the calcium chloride solution. The rate of the reaction by which the substrate hydrogen peroxide is broken down by catalase to release oxygen is determined by the volume of oxygen collected over water.
These enzyme investigations could be adapted and used for student projects.
Prepare suitable worksheets for students.
Details of the lactase experiment, along with information about other publications, can be found on the National Centre for Biotechnology Education website: www.ncbe.reading.ac.uk
Details of the catalase experiment can be found in M. Roberts, T. King and M. Reiss, Practical Biology for Advanced Level, Nelson, 1994 (ISBN 0-17-448225-6). Enquiry skills 12A.1.1–12A.1.3

453 | Qatar science scheme of work | Grade 12 advanced | Unit 12AB.7 | Biology 7 © Education Institute 2005
Objectives Possible teaching activities Notes School resources
Ask students to explain the technique of enzyme immobilisation. Make sure they identify the three principal methods of immobilisation: • adsorption or physical binding (e.g. to glass beads); • entrapment (e.g. within a gelatinous polymer matrix of sodium alginate); • covalent bonding to carboxymethylcellulose.
Encourage students to use the library or the Internet to find out about (and make lists of) the advantages and disadvantages of the use of immobilised enzymes.
Get students to match lists of enzymes with the reactions catalysed and the commercial applications of the enzymes.
Allocate an enzyme to each student and ask them to find out more details of its commercial application. Tell each student to write a brief report on their enzyme and to present it to the class.
ICT opportunity: Use of the Internet.
Prepare suitable lists of enzymes, the reactions catalysed and the commercial applications.

454 | Qatar science scheme of work | Grade 12 advanced | Unit 12AB.7 | Biology 7 © Education Institute 2005
Assessment
Examples of assessment tasks and questions Notes School resources
Draw a flow chart to depict the commercial production of human insulin.
Explain the advantages of using genetically engineered human insulin compared with using the more traditional sources of insulin.
a. Explain what is meant by a biosensor. b. Explain the use of biosensors for diabetics.
a. Explain the use of monoclonal antibodies in pregnancy testing.
b. Give five other examples of the use of monoclonal antibodies in the medical field.
Assessment Set up activities that allow students to demonstrate what they have learned in this unit. The activities can be provided informally or formally during and at the end of the unit, or for homework. They can be selected from the teaching activities or can be new experiences. Choose tasks and questions from the examples to incorporate in the activities.
Provide a list of the reasons why immobilised enzymes are an advantage to a commercial producer when compared with free enzymes in solutions.
Unit 12AB.7
455 | Qatar science scheme of work | Grade 12 advanced | Unit 12AC.1 | Chemistry 1 © Education Institute 2005
GRADE 12A: Chemistry 1
The periodic table
About this unit This unit is the first of eight units on chemistry for Grade 12 advanced.
The unit is designed to guide your planning and teaching of chemistry lessons. It provides a link between the standards for science and your lesson plans.
The teaching and learning activities should help you to plan the content and pace of lessons. Adapt the ideas to meet your students’ needs. For consolidation activities, look at the scheme of work for Grade 11A.
You can also supplement the activities with appropriate tasks and exercises from your school’s textbooks and other resources.
Introduce the unit to students by summarising what they will learn and how this builds on earlier work. Review the unit at the end, drawing out the main learning points, links to other work and real world applications.
Previous learning To meet the expectations of this unit, students should already be able to recognise periodicity in the properties of elements and their compounds, with particular reference to elements of groups I, II, VII and VIII and the first transition series. They should know a variety of processes by which useful substances are made from raw materials, including useful metals. They should know the properties of the common compounds of silicon and the characteristic properties of the first-row transition elements. They should know that transition metals are important redox reagents because they exhibit multiple oxidation states.
Expectations By the end of the unit, students recognise the periodic variation in ionisation energies, electron affinity and electronegativity, and predict properties of elements from their position in the periodic table. They know the trends in the general properties of the s-, p- and d-block elements and the specific properties and structures of some of their compounds.
Students who progress further recognise and understand the periodic variation in ionisation energies, electron affinity and electronegativity, and predict a vide variety properties of elements from their position in the periodic table. They know and understand the trends in the general properties of the s-, p- and d-block elements and many specific properties and structures of a wide range of their compounds.
Resources The main resources needed for this unit are: • data and hint cards (for details see notes section in the activities) • cards listing element symbols and electronegativity values • group I and II elements, pneumatic trough, pH paper • video clips of caesium and rubidium reacting with water • group I and II nitrates, carbonates and hydroxides • class sets of equipment to heat solids and collect the gas evolved by
bubbling through limewater • aqueous solutions of halogens, aqueous solutions of potassium (or
sodium) halides, cyclohexane • HCl, HBr, HI, gas jars • solutions of potassium chloride, potassium bromide, potassium iodide, silver
nitrate solution, aqueous ammonia solution, halide solutions labelled A–E • aqueous aluminium sulfate, dilute hydrochloric acid, dilute sodium hydroxide • Internet access • strips of aluminium, copper(II) chloride , mercury(II) chloride • class sets of equipment to carry out electrolysis, aluminium strips, sulfuric
acid, alizarin red (or other suitable dye) • spreadsheet package • molecular models of diamond and silicon • tin, lead, nitric acid, hydrochloric acid (dilute and concentrated),
concentrated sodium hydroxide solution, potassium iodide • ammonium vanadate(V), zinc granules, acidified potassium manganate(VII),
iron(II) ammonium sulfate, potassium iodide, sodium thiosulfate, sodium sulfite• mode-building kit • nickel(II) chloride, concentrated hydrochloric acid, sodium hydroxide
solution, Na2H2edta Key vocabulary and technical terms Students should understand, use and spell correctly: • ionisation energy, electron affinity, electronegativity • thermal stability • amphiprotic, anodise • orbitals, redox, oxidising agents, reducing agents • ligand, complex, ligand exchange, coordinate bond, coordination number
UNIT 12AC.1 17 hours
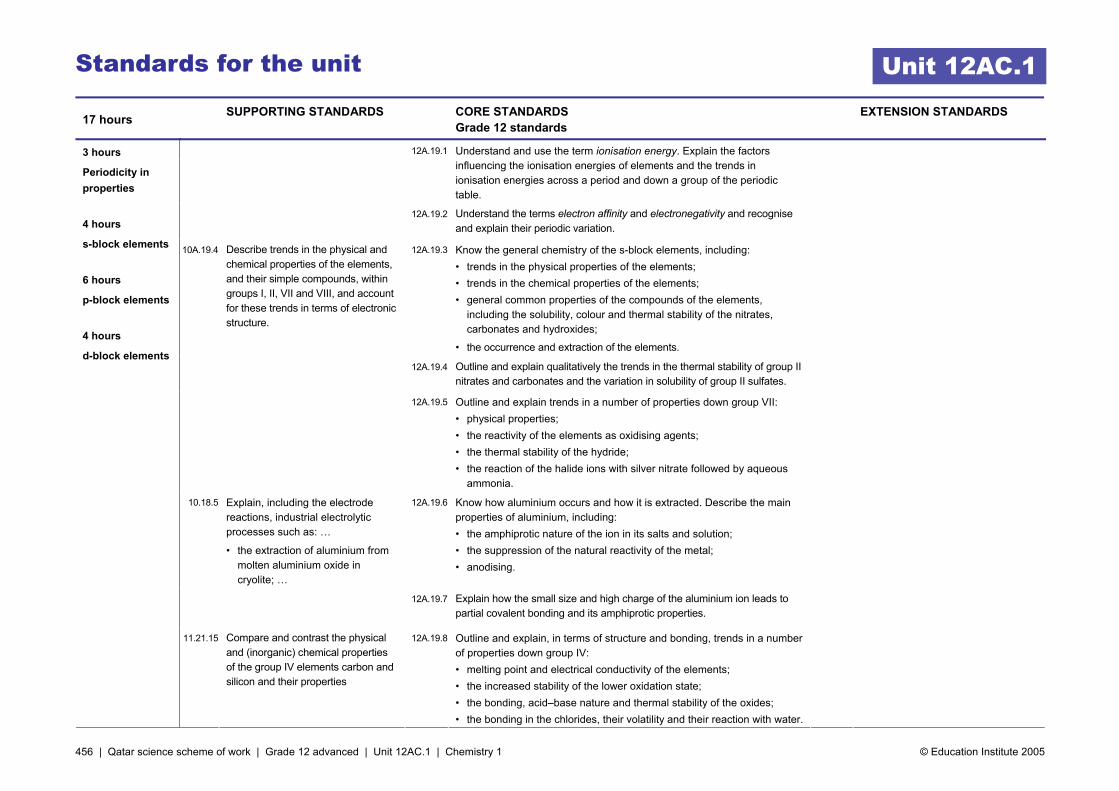
456 | Qatar science scheme of work | Grade 12 advanced | Unit 12AC.1 | Chemistry 1 © Education Institute 2005
Standards for the unit
17 hours SUPPORTING STANDARDS CORE STANDARDS
Grade 12 standards EXTENSION STANDARDS
12A.19.1 Understand and use the term ionisation energy. Explain the factors influencing the ionisation energies of elements and the trends in ionisation energies across a period and down a group of the periodic table.
12A.19.2 Understand the terms electron affinity and electronegativity and recognise and explain their periodic variation.
10A.19.4 Describe trends in the physical and chemical properties of the elements, and their simple compounds, within groups I, II, VII and VIII, and account for these trends in terms of electronic structure.
12A.19.3 Know the general chemistry of the s-block elements, including: • trends in the physical properties of the elements; • trends in the chemical properties of the elements; • general common properties of the compounds of the elements,
including the solubility, colour and thermal stability of the nitrates, carbonates and hydroxides;
• the occurrence and extraction of the elements.
12A.19.4 Outline and explain qualitatively the trends in the thermal stability of group II nitrates and carbonates and the variation in solubility of group II sulfates.
12A.19.5 Outline and explain trends in a number of properties down group VII: • physical properties; • the reactivity of the elements as oxidising agents; • the thermal stability of the hydride; • the reaction of the halide ions with silver nitrate followed by aqueous
ammonia.
10.18.5 Explain, including the electrode reactions, industrial electrolytic processes such as: …
• the extraction of aluminium from molten aluminium oxide in cryolite; …
12A.19.6 Know how aluminium occurs and how it is extracted. Describe the main properties of aluminium, including: • the amphiprotic nature of the ion in its salts and solution; • the suppression of the natural reactivity of the metal; • anodising.
12A.19.7 Explain how the small size and high charge of the aluminium ion leads to partial covalent bonding and its amphiprotic properties.
3 hours
Periodicity in properties
4 hours
s-block elements
6 hours
p-block elements
4 hours
d-block elements
11.21.15 Compare and contrast the physical and (inorganic) chemical properties of the group IV elements carbon and silicon and their properties
12A.19.8 Outline and explain, in terms of structure and bonding, trends in a number of properties down group IV: • melting point and electrical conductivity of the elements; • the increased stability of the lower oxidation state; • the bonding, acid–base nature and thermal stability of the oxides; • the bonding in the chlorides, their volatility and their reaction with water.
Unit 12AC.1
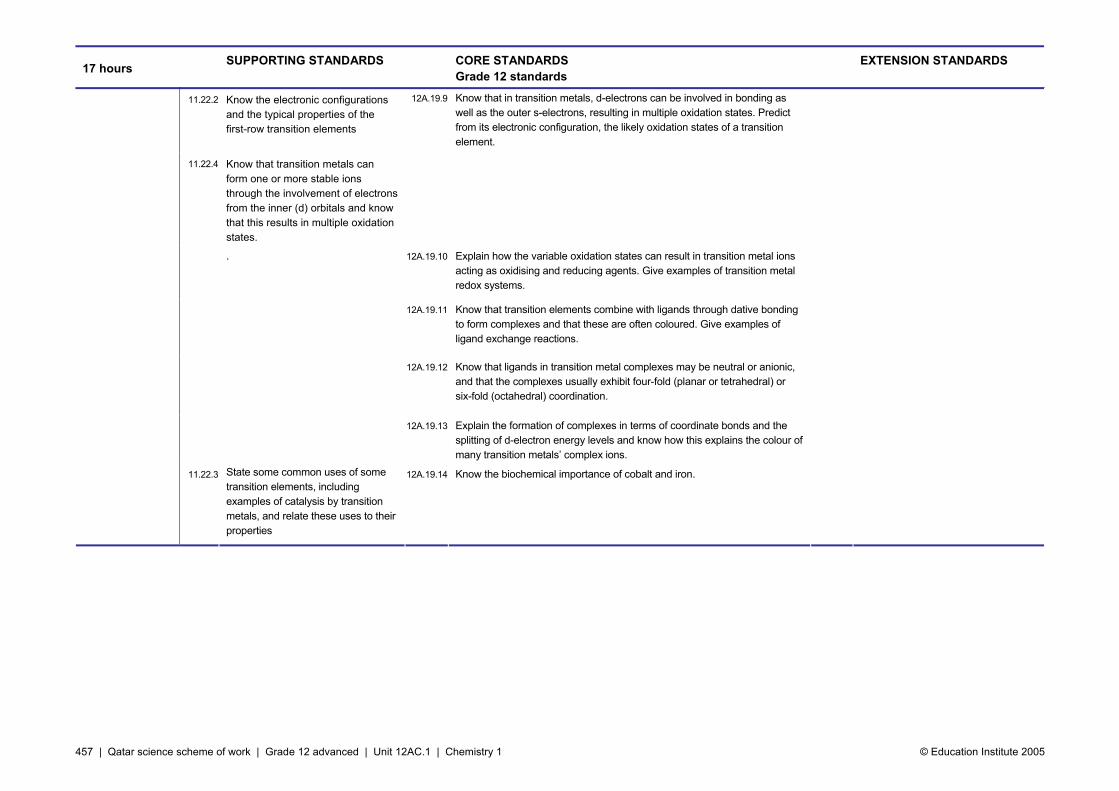
457 | Qatar science scheme of work | Grade 12 advanced | Unit 12AC.1 | Chemistry 1 © Education Institute 2005
17 hours SUPPORTING STANDARDS CORE STANDARDS
Grade 12 standards EXTENSION STANDARDS
11.22.2 Know the electronic configurations and the typical properties of the first-row transition elements
11.22.4 Know that transition metals can form one or more stable ions through the involvement of electrons from the inner (d) orbitals and know that this results in multiple oxidation states.
12A.19.9 Know that in transition metals, d-electrons can be involved in bonding as well as the outer s-electrons, resulting in multiple oxidation states. Predict from its electronic configuration, the likely oxidation states of a transition element.
. 12A.19.10 Explain how the variable oxidation states can result in transition metal ions acting as oxidising and reducing agents. Give examples of transition metal redox systems.
12A.19.11 Know that transition elements combine with ligands through dative bonding to form complexes and that these are often coloured. Give examples of ligand exchange reactions.
12A.19.12 Know that ligands in transition metal complexes may be neutral or anionic, and that the complexes usually exhibit four-fold (planar or tetrahedral) or six-fold (octahedral) coordination.
12A.19.13 Explain the formation of complexes in terms of coordinate bonds and the splitting of d-electron energy levels and know how this explains the colour of many transition metals’ complex ions.
11.22.3 State some common uses of some transition elements, including examples of catalysis by transition metals, and relate these uses to their properties
12A.19.14 Know the biochemical importance of cobalt and iron.
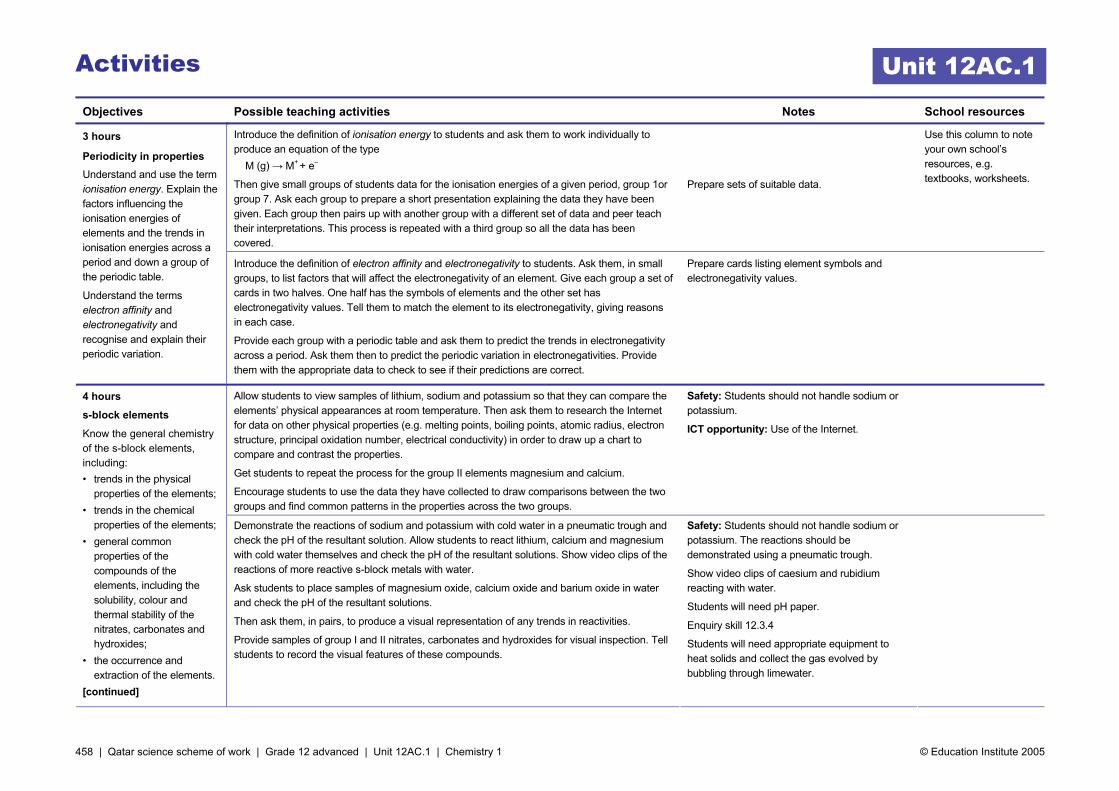
458 | Qatar science scheme of work | Grade 12 advanced | Unit 12AC.1 | Chemistry 1 © Education Institute 2005
Activities
Objectives Possible teaching activities Notes School resources
Introduce the definition of ionisation energy to students and ask them to work individually to produce an equation of the type M (g) → M+ + e–
Then give small groups of students data for the ionisation energies of a given period, group 1or group 7. Ask each group to prepare a short presentation explaining the data they have been given. Each group then pairs up with another group with a different set of data and peer teach their interpretations. This process is repeated with a third group so all the data has been covered.
Prepare sets of suitable data.
Use this column to note your own school’s resources, e.g. textbooks, worksheets.
3 hours
Periodicity in properties Understand and use the term ionisation energy. Explain the factors influencing the ionisation energies of elements and the trends in ionisation energies across a period and down a group of the periodic table.
Understand the terms electron affinity and electronegativity and recognise and explain their periodic variation.
Introduce the definition of electron affinity and electronegativity to students. Ask them, in small groups, to list factors that will affect the electronegativity of an element. Give each group a set of cards in two halves. One half has the symbols of elements and the other set has electronegativity values. Tell them to match the element to its electronegativity, giving reasons in each case.
Provide each group with a periodic table and ask them to predict the trends in electronegativity across a period. Ask them then to predict the periodic variation in electronegativities. Provide them with the appropriate data to check to see if their predictions are correct.
Prepare cards listing element symbols and electronegativity values.
Allow students to view samples of lithium, sodium and potassium so that they can compare the elements’ physical appearances at room temperature. Then ask them to research the Internet for data on other physical properties (e.g. melting points, boiling points, atomic radius, electron structure, principal oxidation number, electrical conductivity) in order to draw up a chart to compare and contrast the properties.
Get students to repeat the process for the group II elements magnesium and calcium.
Encourage students to use the data they have collected to draw comparisons between the two groups and find common patterns in the properties across the two groups.
Safety: Students should not handle sodium or potassium.
ICT opportunity: Use of the Internet.
4 hours
s-block elements
Know the general chemistry of the s-block elements, including: • trends in the physical
properties of the elements; • trends in the chemical
properties of the elements; • general common
properties of the compounds of the elements, including the solubility, colour and thermal stability of the nitrates, carbonates and hydroxides;
• the occurrence and extraction of the elements.
[continued]
Demonstrate the reactions of sodium and potassium with cold water in a pneumatic trough and check the pH of the resultant solution. Allow students to react lithium, calcium and magnesium with cold water themselves and check the pH of the resultant solutions. Show video clips of the reactions of more reactive s-block metals with water.
Ask students to place samples of magnesium oxide, calcium oxide and barium oxide in water and check the pH of the resultant solutions.
Then ask them, in pairs, to produce a visual representation of any trends in reactivities.
Provide samples of group I and II nitrates, carbonates and hydroxides for visual inspection. Tell students to record the visual features of these compounds.
Safety: Students should not handle sodium or potassium. The reactions should be demonstrated using a pneumatic trough.
Show video clips of caesium and rubidium reacting with water.
Students will need pH paper.
Enquiry skill 12.3.4
Students will need appropriate equipment to heat solids and collect the gas evolved by bubbling through limewater.
Unit 12AC.1
459 | Qatar science scheme of work | Grade 12 advanced | Unit 12AC.1 | Chemistry 1 © Education Institute 2005
Objectives Possible teaching activities Notes School resources
Ask students to heat samples of magnesium carbonate, calcium carbonate and barium carbonate, passing any gas evolved through limewater to test for carbon dioxide. From their observations they will be able to construct equations for the reactions and determine any trends in the thermal stability of the metal carbonates.
Enquiry skill 12.4.1 [continued]
Outline and explain qualitatively the trends in the thermal stability of group II nitrates and carbonates and the variation in solubility of group II sulfates.
Ask students to design a simple experiment to determine the relative solubilities of group I and II nitrates, carbonates and hydroxides then carry out their experiment. From this they can draw out trends in solubilities.
Give students data for the solubility of the group II sulfates at a given temperature. Ask them to work in small groups to try to interpret why the solubility decreases on going down the group. You may like to produce ‘hint cards’ (e.g. one card might read ‘In order for a substance to dissolve, what are the energy changes involved?’) On completion of the task, ask groups to feed back their ideas to the whole group for class discussion.
Prepare hint cards.
Enquiry skills 12.1.1–12.1.4
Having established a trend of increasing thermal stability of the carbonates on going down group II, ask students to work in small groups to discuss the findings and to explain why they occur. You may like to produce a series of ‘hint cards’ to help students who are struggling (e.g. one card might read ‘What is the charge density on a group II metal ion? What effect will this have on a negative ion near it?’).
Once students have understood what is happening, ask them to predict (with reasons) what they think is the relative stability of group II nitrates. On completion of the task, ask groups to feed back their ideas to the whole group for class discussion.
Prepare hint cards.
Give each student at random, the name of one of the group I or II elements. Then tell them to team up with anyone else in the class who has the same element and together use the Internet to research the occurrence and extraction of the element. Tell them to produce a summary sheet of notes for the rest of the class.
ICT opportunity: Use of the Internet.
Enquiry skill 12.3.4
Allow students to view samples of chlorine, bromine and iodine so that they can compare the elements’ physical appearances at room temperature. Then ask them to research the Internet for data on other physical properties (e.g. melting points, boiling points, atomic radius, electron structure, principal oxidation number, electrical conductivity) in order to draw up a chart to compare and contrast the properties.
Safety: Chlorine must be kept in a sealed gas jar and bromine in a sealed container. Both should be kept in a fume cupboard and only handled by a teacher.
ICT opportunity: Use of the Internet.
6 hours
p-block elements Outline and explain trends in a number of properties down group VII: • physical properties; • the reactivity of the
elements as oxidising agents;
• the thermal stability of the hydride;
• the reaction of the halide ions with silver nitrate followed by aqueous ammonia.
[continued]
Show students the colours that form when aqueous solutions of chlorine, bromine and iodine are added to cyclohexane.
Provide students with aqueous solutions of chlorine, bromine and iodine, and solutions of potassium halides. Ask students to produce all the combinations of solutions of halogen elements with solutions of halide salts and record their observations. In order to improve clarity, students may wish to add a few drops of cyclohexane to each mixture and record any colour changes to the organic layer. Tell students to use their observations to deduce a balanced formula equation for each reaction occurring. They can then work in small discussion groups to produce ion equations for each reaction. Explain why these are redox reactions and encourage students to deduce an order for the relative oxidising power of the halogens.
Enquiry skills 12.3.1, 12.3.3

460 | Qatar science scheme of work | Grade 12 advanced | Unit 12AC.1 | Chemistry 1 © Education Institute 2005
Objectives Possible teaching activities Notes School resources
Demonstrate what happens on heating hydrogen halides: no decomposition of HCl on heating; brown fumes on heating HBr; copious violet fumes on plunging a heated glass rod into a gas jar of HI. Ask students to research the bond lengths and bond enthalpies of the hydrogen halides and plot these against atomic number. Then tell them to interpret the data and relate it to the observations of the practical demonstration.
Safety: Carry out the demonstration in a fume cupboard.
Allow students to add silver nitrate solution to aqueous solutions of potassium chloride, potassium bromide and potassium iodide, and tell them to record the colours of the precipitates formed. Then tell them to add aqueous ammonia solution to each precipitate and record their observations. Students should be able to produce balanced equations for each reaction and write a method to test for the presence of chloride, bromide and iodide, respectively. Give the class unknown samples of halide solutions labelled A–E and ask them to use the tests they have just developed to determine which halide ion (if any) is present in each solution.
Use a revision quiz to remind students about the occurrence and extraction of aluminium from molten aluminium oxide in cryolite.
Prepare a suitable revision quiz.
Encourage students to find out the meaning of amphiprotic. Ask them, individually, to measure the pH of an aqueous solution of aluminium sulfate. Then tell them to add alkali a drop at a time until a precipitate forms and then redissolves. They can then reverse the process by adding dilute acid a drop at a time. Provide students with a series of cards, each of which has a reactant, a product or arrows drawn on it. Tell students, in pairs, to arrange the cards to represent the reactions that have occurred. Once they have done this, they will be able to identify how the aluminium salt in solution has behaved in an amphiprotic way. A class discussion can lead to an understanding of how the high charge density on the small aluminium ion leads to these reactions occurring.
Students will need an aqueous solution of aluminium sulfate, dilute sodium hydroxide and dilute hydrochloric acid.
Enquiry skill 12.4.1
Allow students to research the Internet for the uses for aluminium. Provide them with the standard electrode potentials for aluminium and iron in order to pose the dilemma that aluminium reacts easily, yet for the uses it is put, to aluminium needs to have minimal corrosion. Ask students to observe and record what happens to strips of aluminium when they are: (a) immersed in dilute sodium hydroxide solution; (b) immersed in dilute hydrochloric acid; (c) left exposed to the air. Then tell students to treat aluminium strips with copper(II) chloride solution and repeat the practical above. If you wish, you could, as a demonstration, treat aluminium strips with mercury(II) chloride and repeat the practical. Both these treatments will allow students to see the difference in reactivity of clean aluminium compared with oxidised aluminium.
ICT opportunity: Use of the Internet.
Safety: Mercury(II) chloride is highly toxic by ingestion and skin absorption, so it must only be used by a teacher.
[continued]
Know how aluminium occurs and how it is extracted. Describe the main properties of aluminium, including: • the amphiprotic nature of
the ion in its salts and solution;
• the suppression of the natural reactivity of the metal;
• anodising.
Explain how the small size and high charge of the aluminium ion leads to partial covalent bonding and its amphiprotic properties.
Outline and explain, in terms of structure and bonding, trends in a number of properties down group IV: • melting point and electrical
conductivity of the elements;
• the increased stability of the lower oxidation state;
• the bonding, acid–base nature and thermal stability of the oxides;
• the bonding in the chlorides, their volatility and their reaction with water.
Ask small groups of students to anodise aluminium (in the fume cupboard). The electrolyte used can be 1 mol dm–3 sulfuric acid. After electrolysis, tell students to test the conductivity of the anode and cathode. They could also try dyeing the anode and cathode with a solution of alizarin red, or some other suitable dye. Encourage them to discuss the advantages and applications of anodised aluminium.
Students will need equipment to carry out electrolysis, aluminium strips, sulfuric acid and alizarin red (or other suitable dye).
Enquiry skill 12.4.1
461 | Qatar science scheme of work | Grade 12 advanced | Unit 12AC.1 | Chemistry 1 © Education Institute 2005
Objectives Possible teaching activities Notes School resources
Ask students to investigate the trend from non-metallic to metallic on going down group IV of the periodic table. Ask them to research and plot graphs of the melting points, boiling points and electrical conductivity of the group IV elements. Let them download images of the structures of these elements and give them models of the giant structures of diamond and silicon to examine. Then ask them to work in small groups to explain how the properties they have researched are accounted for in terms of structure and bonding, and to present their ideas orally to the rest of the class.
ICT opportunity: Use of the Internet and suitable spreadsheet software to enter data in order to plot graphs of melting points, boiling points and electrical conductivity.
Give students a list of typical compounds of the group IV elements. This allows them to see the relative increase in frequency of the +2 oxidation state (as opposed to +4) on going down the group. Provide students with data relating to 1st, 2nd, 3rd and 4th ionisation energies for the group IV elements. Divide the class in half. Ask one half to draw a bar chart of 1st + 2nd IE values for each element and the other half to draw a bar chart of the 1st + 2nd + 3rd + 4th IE values for each element. This can lead to a whole class discussion on how the relative increase in the total energy needed to form Pb+4 compared with Sn+4 is so much greater than the relative increase in the total energy needed to form Pb+2 compared with Sn+2
To help students understand why carbon normally forms four covalent bonds, give them bond enthalpy data for Pb–Cl and C–Cl bonds and ask them to decide, on their own, what needs to happen to outer electrons in order for four bonds to be formed. Ask them to use the data you have provided to explain why it is energetically favourable for this to occur in carbon compounds but much less likely in lead compounds.
Students will need data relating to ionisation energies and bond enthalpy data.
Provide students with data referring to the melting points, boiling points and solubility in water for carbon dioxide, silicon(IV) oxide and lead(II) oxide. Then let them download 3D animations (Java applets) of the structures of these compounds and use these to explain the differences in properties. Encourage them to research the reactions of group IV oxides with acids and bases in order to establish that they become more basic in character on going down the group.
Ask students to prepare tin(IV) oxide and lead(IV) oxide by the action of concentrated nitric acid on each metal. Then tell them to heat the oxides they have synthesised and observe their reactions with dilute hydrochloric acid, concentrated hydrochloric acid, concentrated sodium hydroxide and acidified potassium iodide. Ask them to write equations for what is occurring.
Ask students to research the thermal stability of the oxides and interpret any trends in terms of structure.
ICT opportunity: Use of the Internet and Java applets.
Safety: Concentrated acids and alkalis are corrosive. The vapours are harmful to lungs, eyes and skin. Concentrated nitric acid is an oxidising agent. Students must wear eye protection, gloves and protective clothing, and carry out the activities in a fume cupboard.
Students will need: tin, lead, nitric acid, hydrochloric acid (dilute and concentrated), concentrated sodium hydroxide solution, potassium iodide.
Enquiry skills 12.4.1, 12.4.2
All group IV elements form chlorides of the formula type XCl4. Encourage students to build models of these compounds in order to explain their low boiling points. Tell them to look up the reactions of the chlorides with water and work in small discussion groups to explain why CCl4
does not react with water, yet SiCl4 is readily hydrolysed. They also need to consider why PbCl2 does not react with water. Ask them to make a poster display of their findings.
Students will need model-building kits.
ICT opportunity: Use of the Internet.
Enquiry skill 12.3.4
462 | Qatar science scheme of work | Grade 12 advanced | Unit 12AC.1 | Chemistry 1 © Education Institute 2005
Objectives Possible teaching activities Notes School resources
Revisit the work done in Grade 11 relating to the fact that transition metals can form one or more stable ions through the involvement of electrons from the inner (d) orbitals and that this results in multiple oxidation states. Ask students to write out the electronic configurations for each of the first row transition metals. Taking into account the s3d and 4s electrons, ask them to predict which ions they think would occur most readily and to check the literature to support this.
Provide students with standard electrode potential values for the reactions to follow. Ask them to reduce a solution of ammonium vanadate(V) to vanadium(II) using zinc granules, then oxidise the vanadium(II) to vanadium(V) using acidified potassium manganate(VII), then work out, using the electrode potential values. what reactions have occurred..
Depending on time available and abilities of students, ask students to predict what they will observe when: • VO2
+ reacts with Fe2+, VO2+ reacts with I- (followed by the addition of thiosulfate);
• VO2+ reacts with SO2 then has vanadium(II) added.
Then let them carry out these reactions, compare them with their predictions and complete half equations for the reactions occurring.
Students will need: data relating to standard electrode potentials, ammonium vanadate(V), zinc granules, acidified potassium manganate(VII), iron(II) ammonium sulfate, potassium iodide, sodium thiosulfate, sodium sulfite.
Enquiry skill 12.3.4
Give students a series of diagrams and models of transition metal complexes. Ask them to make a list of the features that constitute a complex. You may wish to guide them in their observations (e.g. ‘What do they all have in common?’, ‘What overall charge does the complex carry?’, ‘What type of bonding is present?’, ‘What shape has the complex adopted?’).
Develop the terminology needed for this topic through class discussion of these ideas.
Give students solid nickel(II) chloride and get them to make up an aqueous solution, add a few drops of concentrated hydrochloric acid, dilute with water, add sodium hydroxide solution and then add Na2H2edta. Tell them to record any colour change and write balanced equations for the reactions at each stage. Students might also investigate the formation of complexes between a number of transition metal ions and the ligands ammonia and edta4–.
Their findings will help them develop an understanding of ligand exchange.
Students will need diagrams and models of a wide range of complexes.
Students will need nickel(II) chloride, concentrated hydrochloric acid, sodium hydroxide solution, Na2H2edta.
Enquiry skills 12.4.1, 12.4.2
Divide the class into two and ask one half of students (working individually) to prepare a 5-minute lesson to explain the formation of complexes in terms of coordinate bonds and the splitting of d-electron energy levels. Ask the other half of the class (also working individually) to prepare a 5-minute lesson to explain how this brings about the colour of many transition metals’ complex ions. Tell all students to prepare some consolidation exercises on the topic (e.g. crosswords, card-matching activities). When they have completed this, ask students to pair up with someone in the opposite half of the class. Then tell each student to present their lesson, possibly using PowerPoint or other presentation software, and ask their ‘pupil’ to complete the consolidation exercise. The roles are then reversed.
ICT opportunity: Use of PowerPoint or similar package.
Enquiry skill 12.3.4.
4 hours
d-block elements Know that in transition metals, d-electrons can be involved in bonding as well as the outer s-electrons, resulting in multiple oxidation states. Predict from its electronic configuration, the likely oxidation states of a transition element.
Explain how the variable oxidation states can result in transition metal ions acting as oxidising and reducing agents. Give examples of transition metal redox systems.
Know that transition elements combine with ligands through dative bonding to form complexes and that these are often coloured. Give examples of ligand exchange reactions.
Know that ligands in transition metal complexes may be neutral or anionic, and that the complexes usually exhibit four-fold (planar or tetrahedral) or six-fold (octahedral) coordination.
Explain the formation of complexes in terms of coordinate bonds and the splitting of d-electron energy levels and know how this explains the colour of many transition metals’ complex ions.
Know the biochemical importance of cobalt and iron.
Ask students to prepare a poster presentation for the class on the biochemical importance of cobalt and iron.
ICT opportunity: Use of the Internet.
Enquiry skill 12.3.4

463 | Qatar science scheme of work | Grade 12 advanced | Unit 12AC.1 | Chemistry 1 © Education Institute 2005
Assessment
Examples of assessment tasks and questions Notes School resources
The halogens form a well-defined group of elements.
Explain how the following support this statement:
a. electron structure;
b. redox behaviour;
c. physical properties of the elements;
d. thermal stability of the hydride.
Explain, giving examples why the elements in group IV become more metallic on going down the group.
Complexes formed by edta4– involve pairs of electrons on nitrogen and oxygen atoms in the same way as complexes formed by NH3 and H2O. Explain why stability constants of edta complexes in aqueous solution are generally so much larger than those of corresponding complexes with NH3 and H2O.
From G. Burton, 2000, Salters Advanced Chemistry, Chemical Ideas, 2nd edn, Heinemann, p.273
Assessment Set up activities that allow students to demonstrate what they have learned in this unit. The activities can be provided informally or formally during and at the end of the unit, or for homework. They can be selected from the teaching activities or can be new experiences. Choose tasks and questions from the examples to incorporate in the activities.
Describe and account for the trends in thermal stabilities of the group II carbonates.
Unit 12AC.1

464 | Qatar science scheme of work | Grade 12 advanced | Unit 12AC.1 | Chemistry 1 © Education Institute 2005
465 | Qatar science scheme of work | Grade 12 advanced | Unit 12AC.2 | Chemistry 2 © Education Institute 2005
GRADE 12A: Chemistry 2
Rates of reaction
About this unit This unit is the second of eight units on chemistry for Grade 12 advanced.
The unit is designed to guide your planning and teaching of chemistry lessons. It provides a link between the standards for science and your lesson plans.
The teaching and learning activities should help you to plan the content and pace of lessons. Adapt the ideas to meet your students’ needs. For consolidation activities, look at the scheme of work for Grade 10A.
You can also supplement the activities with appropriate tasks and exercises from your school’s textbooks and other resources.
Introduce the unit to students by summarising what they will learn and how this builds on earlier work. Review the unit at the end, drawing out the main learning points, links to other work and real world applications.
Previous learning To meet the expectations of this unit, students should already know the factors that affect reaction rate and explain them in terms of the particle model. They should understand the concept of dynamic equilibrium.
Expectations By the end of the unit, students explain reaction rates in terms of particle collisions and energy, and distinguish between first- and second-order reactions. They calculate the half-life of first-order reactions and understand the relationship between rate constant and temperature. They deduce mathematical expressions for equilibrium constants and use them in gas and solution reactions.
Students who progress further explain reaction rates in terms of particle collisions and energy, and distinguish between first- and second-order reactions with a mathematical appreciation of what is occurring. They calculate the half-life of first-order reactions and understand mathematically the relationship between rate constant and temperature. They deduce mathematical expressions for complex equilibrium constants and use them in gas and solution reactions.
Resources The main resources needed for this unit are: • numerical and graphical data (see ‘Notes’ column for details) • potassium chromate(VI) solution 0.1 mol dm–3, dilute sulfuric acid
1.0 mol dm–3, sodium hydroxide solution 2.0 mol dm–3, potassium thyocyanate solution 0.5 mol dm–3, iron(III) chloride solution 0.5 mol dm–3, solid ammonium chloride
• burettes, potassium iodide solution 1.00 mol dm–3, potassium peroxodisulfate(VI) solution 0.0400 mol dm–3, sodium thiosulfate solution 0.0100 mol dm–3, freshly prepared starch solution, stopclocks
• water baths pre-set to a range of temperatures, sodium thiosulfate solution, hydrochloric acid, conical flasks, accurate thermometers, waterproof crosses on card
• Internet access
Key vocabulary and technical terms Students should understand, use and spell correctly: • rate of reaction, rate expression, rate constant, order of reaction, half-life • Arrhenius equation, activation energy, Boltzmann distribution • equilibrium, equilibrium constant, concentration, partial pressure, position
of equilibrium
UNIT 12AC.2 10 hours

466 | Qatar science scheme of work | Grade 12 advanced | Unit 12AC.2 | Chemistry 2 © Education Institute 2005
Standards for the unit
10 hours SUPPORTING STANDARDS CORE STANDARDS
Grade 12 standards EXTENSION STANDARDS
10A.23.2 Know and measure the effect on reaction rates of concentration, temperature and particle size, and explain the effect in terms of a kinetic particle model.
12A.20.1 Recognise that different reactions proceed at different rates and explain reaction rate in terms of particle collisions and particle energy.
10A.23.1 Know that reaction rates vary considerably and be able to produce, and analyse graphically, data from rate experiments.
10A.23.5 Know that many reactions occur in multiple steps and that only one determines the reaction rate.
12A.20.2 Derive and use rate expressions of the form rate = k[A]m[B]n from data and draw and analyse graphical representations for zero, first- and second-order reactions in a specified reactant.
10A.23.6 Explain a bimolecular reaction in terms of particle collisions and recognise that the chance of a reaction depends on particle concentration and particle energy.
12A.20.3 Calculate the half-life of first-order reactions and show an understanding of why it is concentration independent.
12A.20.4 Describe qualitatively the relationship between the rate constant and temperature.
12A.20.5 Use the Arrhenius equation to determine the energy of activation given values of the rate constant for different temperatures.
12A.20.6 Understand the Boltzmann distribution and demonstrate its importance in reaction kinetics, with particular reference to activation energy.
10A.23.7 Understand, in terms of rates of the forward and reverse reactions, what is meant by a reversible reaction and dynamic equilibrium.
12A.20.7 Deduce expressions for forward and backward rate constants for a simple bimolecular reaction and hence deduce expressions for equilibrium constants in terms of concentrations (Kc) and partial pressures (Kp).
12A.20.8 Calculate the values of equilibrium constants in terms of concentrations or partial pressures from appropriate data, and calculate the quantities present at equilibrium, given appropriate data.
5 hours
Order of reaction
3 hours
Reaction rate and temperature
2 hours
Equilibrium constants
12A.20.9 Understand and use the term position of equilibrium as applied to a reversible reaction and know that the size of an equilibrium constant is an indication of the extent to which a reaction nears completion.
Unit 12AC.2

467 | Qatar science scheme of work | Grade 12 advanced | Unit 12AC.2 | Chemistry 2 © Education Institute 2005
Activities
Objectives Possible teaching activities Notes School resources
Ask students to list as many everyday chemical reactions as they can and then place them in order of rate of reaction (e.g. dynamite exploding, iron bar rusting). Ask them to consider work done in Grade 10 on reaction rates and use these ideas to relate the reaction rate to rate of particle collision and particle energy.
Use this column to note your own school’s resources, e.g. textbooks, worksheets.
Provide students with numerical and graphical data for reactions that are zero, first and second order with respect to particular reactants. Ask them, in small groups, to classify the data into zero, first and second order and use group discussion to decide what the characteristics of each are. Go through the theory of rate equations and then ask students to derive the rate equations for each of the examples they have been provided with. Ask students to use a reaction (e.g. the iodine clock reaction for the reaction of iodide ions (I
–) with peroxodisulfate(VI) (S2O8
2–) ions) to
design an investigation. Tell them to record how the rate of reaction varies as the concentration of each reactant in is varied. From this they will be able to determine the rate equation and derive the rate constant (including units).
Provide a range of data here.
Reagents needed: potassium iodide solution 1.00 mol dm–3, potassium peroxodisulfate(VI) solution 0.0400 mol dm–3, sodium thiosulfate solution 0.0100 mol dm–3, freshly prepared starch solution.
Enquiry skills 12A.1.1, 12A.1.3–12A.1.5, 12A.3.1–12A.3.3
Class sets of equipment
5 hours
Order of reaction Recognise that different reactions proceed at different rates and explain reaction rate in terms of particle collisions and particle energy.
Derive and use rate expressions of the form rate = k[A]m[B]n from data and draw and analyse graphical representations for zero, first- and second-order reactions in a specified reactant.
Calculate the half-life of first-order reactions and show an understanding of why it is concentration independent.
Provide numerical and graphical data of concentration versus time for first-order reactions. Ask every student in the class to calculate a value for t1/2 and share these with the class. This will clearly demonstrate that this value does not vary with changing concentration.
Provide suitable numerical and graphical data.
Ask students, in pairs, to carry out the reaction of sodium thiosulfate with dilute hydrochloric acid (stopping the reaction when a cross on a piece of paper under the reaction flask becomes obscured from view). Tell them that they need to keep the concentrations the same and vary the temperature at which the reaction occurs. Tell them to calculate k for each reaction and then plot lnk versus 1/T (T is in K). The gradient (–EA/RT) will allow EA, the activation enthalpy, to be calculated.
Students will need: water baths pre-set to a range of temperatures, sodium thiosulfate solution 0.5 mol dm–3, hydrochloric acid 1 mol dm–3, conical flasks, accurate thermometers, waterproof crosses on card.
Enquiry skills 12A.3.1–12A.3.3, 12A.4.1, 12A.4.2
3 hours
Rate of reaction and temperature Describe qualitatively the relationship between the rate constant and temperature.
Use the Arrhenius equation to determine the energy of activation given values of the rate constant for different temperatures.
Understand the Boltzmann distribution and demonstrate its importance in reaction kinetics, with particular reference to activation energy.
Ask students to research the Boltzmann distribution on the Internet and to discuss, in small groups, the importance of this to reaction kinetics. Then tell them to use what they have discovered about the Boltzmann distribution to relate their findings about reaction rate and temperature to particle energy and activation energy.
ICT opportunity: Use of the Internet.
Unit 12AC.2

468 | Qatar science scheme of work | Grade 12 advanced | Unit 12AC.2 | Chemistry 2 © Education Institute 2005
Objectives Possible teaching activities Notes School resources
Instruct students on how to derive the equilibrium constant in terms of concentration (Kc) for the reaction aA + bB → cC +dD
Give them a series of balanced equations and ask them to derive equations for Kc. Provide students with some numerical data for reactions at equilibrium and ask them to calculate values (and units) for the different Kc values.
Provide appropriate numerical data.
Enquiry skill 12A.1.8
Introduce students to the idea that the concentration of a gas in a gaseous mixture is proportional to its partial pressure. Allow them to practise calculating partial pressures. Ask them to consider how expressions for Kc are derived and use these ideas to develop the idea of Kp. Take them through one example of how to derive and determine the value for Kp under given conditions. Give students balanced equations for gaseous reactions and ask them to derive expressions for Kp. Provide them with a variety of data that allow them to develop their understanding of how to use data to derive partial pressures and numerical values for Kp. Ask students to form small groups and take it in turns to explain how they completed each example. It may be appropriate to differentiate the examples given to each group.
Provide suitable examples of gaseous reactions and data to use to calculate Kp.
2 hours
Equilibrium constants
Deduce expressions for forward and backward rate constants for a simple bimolecular reaction and hence deduce expressions for equilibrium constants in terms of concentrations (Kc) and partial pressures (Kp).
Calculate the values of equilibrium constants in terms of concentrations or partial pressures from appropriate data, and calculate the quantities present at equilibrium, given appropriate data.
Understand and use the term position of equilibrium as applied to a reversible reaction and know that the size of an equilibrium constant is an indication of the extent to which a reaction nears completion.
Ask students to carry out the following reversible reactions to demonstrate to them the idea of position of equilibrium. (i) Fe3+ +SCN– [FeSCN]2+
Using test-tube reactions allows students to observe how the addition of each reactant and the product shifts the position of equilibrium (ii) 2CrO4
2– +2H+ Cr2O72– +H2O
Using test-tube reactions allows students observe how the addition of acid and alkali shifts the position of equilibrium.
Provide students with actual values of Kc values for given reactions at different temperatures. Ask them to work in small groups to decide what this means in terms of the extent to which the reaction has progressed (i.e the larger the value of Kc the greater the extent of the reaction).
Reagents needed: potassium chromate(VI) solution 0.1 mol dm–3, dilute sulfuric acid 1.0 mol dm–3, sodium hydroxide solution 2.0 mol dm–3, potassium thyocyanate solution 0.5 mol dm–3, iron(III) chloride solution 0.5 mol dm–3, solid ammonium chloride
Enquiry skills 12A.4.1, 12A.4.2

469 | Qatar science scheme of work | Grade 12 advanced | Unit 12AC.2 | Chemistry 2 © Education Institute 2005
Assessment
Examples of assessment tasks and questions Notes School resources
The results of practical work used to study the reaction below are given in the table (all results are for a temperature of 973 K):
2H2(g) + 2NO(g) → 2H20(g) + N2(g)
[H2] / 10–2 mol dm–3 [NO] / 10–2 mol dm–3 rate /10–6 mol dm–3 s–1
2.0 2.50 4.8
2.0 1.25 1.2
2.0 5.00 19.2
1.0 1.25 0.6
4.0 2.50 9.6
a. What is the order of reaction with respect to:
i. hydrogen;
ii nitrogen monoxide?
b. Write a rate expression for the reaction.
c. Calculate the rate constant for this reaction at 973 K.
From G. Burton, 2000, Salters Advanced Chemistry, Chemical Ideas, 2nd edn, Heinemann, p.239
Prepare a presentation for a group of Grade 11 students to explain why the rate of a chemical reaction increases with temperature.
Assessment Set up activities that allow students to demonstrate what they have learned in this unit. The activities can be provided informally or formally during and at the end of the unit, or for homework. They can be selected from the teaching activities or can be new experiences. Choose tasks and questions from the examples to incorporate in the activities.
Design an investigation to determine the equilibrium constant for the reaction between ethyl ethanoate and water at 298 K. (Note: The reaction is very slow and mixtures will need 48 hours to equilibrate. 2 mol dm–3 hydrochloric acid may be used as a catalyst for the reaction.)
Unit 12AC.2

470 | Qatar science scheme of work | Grade 12 advanced | Unit 12AC.2 | Chemistry 2 © Education Institute 2005

471 | Qatar science scheme of work | Grade 12 advanced | Unit 12AC.3 | Chemistry 3 © Education Institute 2005
GRADE 12A: Chemistry 3
Acids and K values
About this unit This unit is the third of eight units on chemistry for Grade 12 advanced.
The unit is designed to guide your planning and teaching of chemistry lessons. It provides a link between the standards for science and your lesson plans.
The teaching and learning activities should help you to plan the content and pace of lessons. Adapt the ideas to meet your students’ needs. For consolidation activities, look at the scheme of work for Grade 10.
You can also supplement the activities with appropriate tasks and exercises from your school’s textbooks and other resources.
Introduce the unit to students by summarising what they will learn and how this builds on earlier work. Review the unit at the end, drawing out the main learning points, links to other work and real world applications.
Previous learning To meet the expectations of this unit, students should already be able to distinguish between strong and weak acids and alkalis, perform neutralisation titrations, make salts and know the mechanism by which the pH of buffer solutions remains stable.
Expectations By the end of the unit, students address mathematically problems related to acid–base reactions, buffer solutions and solutions of sparingly soluble salts.
Students who progress further address mathematically problems related to acid–base reactions, buffer solutions and solutions of sparingly soluble salts with a full mathematical appreciation of even complex examples.
Resources The main resources needed for this unit are: • strong acids at different concentrations • range of weak acids and salts (e.g. ethanoic acid and sodium ethanoate) • titration graphs (pH versus volume) • range of data (see ‘Notes’ column for details) • Internet access
Key vocabulary and technical terms Students should understand, use and spell correctly: • strong and weak acids, pH, Ka, pKa, Kw, indicator, buffer • solubility product Ksp
UNIT 12AC.3 7 hours

472 | Qatar science scheme of work | Grade 12 advanced | Unit 12AC.3 | Chemistry 3 © Education Institute 2005
Standards for the unit
7 hours SUPPORTING STANDARDS CORE STANDARDS
Grade 12 standards EXTENSION STANDARDS
10A.21.7 Understand and use the Brønsted–Lowry theory of acids and bases.
12A.20.10 Show an understanding of the Brønsted–Lowry theory of acidity. Derive and explain the terms pH, Ka, pKa and Kw, and use these concepts in calculations such as the calculation of the pH of solutions of weak acids and bases.
10A.21.3 Explain the changes in pH during neutralisation and justify the choice of indicator.
12A.20.11 Know that indicators are weak acids and explain the choice of suitable indicators in acid–base titrations, in terms of the dissociation constant of the indicator.
10A.21.5 Know the mechanism by which the pH of buffer solutions remains stable, give examples and state their composition.
12A.20.12 Understand how buffer solutions control pH (including the role of HCO3– in
controlling blood pH) and calculate the pH of buffer solutions, given appropriate data.
2 hours
pH
2 hours
Indicators
2 hours
Buffers
1 hour
Solubility products
12A.20.13 Apply quantitatively the concept of dynamic equilibrium to the solubility of ionic compounds by calculating the solubility product Ksp from concentrations, and vice versa, and demonstrate an understanding of the common ion effect.
Unit 12AC.3

473 | Qatar science scheme of work | Grade 12 advanced | Unit 12AC.3 | Chemistry 3 © Education Institute 2005
Activities
Objectives Possible teaching activities Notes School resources
Revise the notion that acids are proton donors. Ask students to research the definitions of pH, Ka, pKa and Kw and present their findings to the rest of the group.
Then ask them to carry out calculations to determine the pH for a range of strong acids of given concentration using pH = –log [H+(aq)].They can then actually measure the pH of those solutions.
Supply reference data on the pH of a range of strong acids.
Students will need a range of strong acids at different concentrations.
Enquiry skills 12A.3.1, 12A.3.3
Use this column to note your own school’s resources, e.g. textbooks, worksheets.
Guide students in through the assumptions made in order to derive the term Ka for a weak acid. Then get them to work through a range of calculations using this term. Let them mark each other’s work and give each other feedback. Then ask them to consider the use of pKa and do worked examples interconverting Ka and pKa.
pH
2 hours Show an understanding of the Brønsted–Lowry theory of acidity. Derive and explain the terms pH, Ka, pKa and Kw, and use these concepts in calculations such as the calculation of the pH of solutions of weak acids and bases. Raise the case of water for students to consider and introduce data that will allow them to
calculate the pH of water at 298 K to be 7. They can then use Kw to calculate the pH of bases.
Indicators
2 hours Know that indicators are weak acids and explain the choice of suitable indicators in acid–base titrations, in terms of the dissociation constant of the indicator.
Give students titration graphs of pH versus volume of acid added to alkali for a range of strong and weak acid combinations. From this data they will be able to determine the pH range over which a colour change is required for a certain acid–base combination. Also give them Ka values for a range of common indicators. They can use this information to determine the pH at which a given indicator changes colour and match the correct indicator to the correct acid–base titration. If there is enough time, ask them to carry out an acid–base titration using different indicators to check their calculations were correct.
Students will need titration graphs for strong and weak acid combinations and data on indicators.
Enquiry skills 12A.4.1, 12A.4.2
Ask small groups of students to make short presentations on Grade 10 work explaining the mechanism by which weak acid/salt systems function as buffering systems. Lead them through the assumptions needed to derive the expression Ka = [H+] × [salt]/[acid].
Provide data that lets students consider how different acid/salt systems allow solutions of different areas of the pH scale to be made up and how altering the ratio of salt to acid in a given buffer system can alter the pH exactly to the desired pH.
Provide suitable data on buffer systems.
Ask students to design a buffer system for a given pH, calculate its composition, make it up and measure the actual pH of the system.
Students will need a selection of weak acids and their salts.
Buffers
2 hours Understand how buffer solutions control pH (including the role of HCO3
– in controlling blood pH) and calculate the pH of buffer solutions, given appropriate data. Ask students to use the Internet or other sources to research the control of pH in the blood and
make poster presentations of their findings. ICT opportunity: Use of the Internet.
Enquiry skill 12A.3.4
Unit 12AC.3
474 | Qatar science scheme of work | Grade 12 advanced | Unit 12AC.3 | Chemistry 3 © Education Institute 2005
Objectives Possible teaching activities Notes School resources
Solubility products
1 hour Apply quantitatively the concept of dynamic equilibrium to the solubility of ionic compounds by calculating the solubility product Ksp from concentrations, and vice versa, and demonstrate an understanding of the common ion effect
Once students have considered the idea that even seemingly ‘insoluble’ salts are sparingly soluble, introduce the definition of Ksp. Allow them to practise calculations to determine the solubility product Ksp from concentrations, and vice versa. Ask them to calculate whether a precipitate will form when two solutions are mixed together by calculating whether Ksp has been exceeded. The data you provide for the latter type of problems should include examples of common ions (e.g. how the solubility of silver chloride varies with water as a solute as opposed to 1 mol dm–3 hydrochloric acid as the solute).
Provide a range of calculations and data.
475 | Qatar science scheme of work | Grade 12 advanced | Unit 12AC.3 | Chemistry 3 © Education Institute 2005
Assessment
Examples of assessment tasks and questions Notes School resources
Calculate the pH of the following solutions:
i. 0.125 mol dm–3 ethanoic acid (Ka = 1.7 x 10⁻⁵ mol dm–3);
ii. 2.0 mol dm–3 H2SO4;
iii. 0.1 mol dm–3 NaOH.
What would be the colour of cresol red in a solution of:
i. 0.1 mol dm–3 sodium hydroxide;
ii. 0.1 mol dm–3 hydrochloric acid;
pKa cresol red = 8.2 / pH range = 7.2–8.8 / colour range yellow to red.
Justify your answer in detail.
Research and write a 1000-word account of the importance of buffers in living systems. Enquiry skill 12A.1.8
Assessment Set up activities that allow students to demonstrate what they have learned in this unit. The activities can be provided informally or formally during and at the end of the unit, or for homework. They can be selected from the teaching activities or can be new experiences. Choose tasks and questions from the examples to incorporate in the activities. Ksp for silver bromate(V) AgBrO3 is 6.0 × 10⁻⁵ mol2dm–6 at 298 K. 100 cm3 of 0.01 M silver nitrate
solution is added to 200 cm3 of 0.01 M potassium bromate(V) solution.
Calculate whether a precipitate would form. Show all workings.
Unit 12AC.3

476 | Qatar science scheme of work | Grade 12 advanced | Unit 12AC.3 | Chemistry 3 © Education Institute 2005

477 | Qatar science scheme of work | Grade 12 advanced | Unit 12AC.4 | Chemistry 4 © Education Institute 2005
GRADE 12A: Chemistry 4
Energy and entropy
About this unit This unit is the fourth of eight units on chemistry for Grade 12 advanced.
The unit is designed to guide your planning and teaching of chemistry lessons. It provides a link between the standards for science and your lesson plans.
The teaching and learning activities should help you to plan the content and pace of lessons. Adapt the ideas to meet your students’ needs. For consolidation activities, look at the scheme of work for Grade 10A.
You can also supplement the activities with appropriate tasks and exercises from your school’s textbooks and other resources.
Introduce the unit to students by summarising what they will learn and how this builds on earlier work. Review the unit at the end, drawing out the main learning points, links to other work and real world applications.
Previous learning To meet the expectations of this unit, students should already know and be able to use the concepts of enthalpy of reaction and activation energy and associate endothermic and exothermic changes with bond breaking and making.
Expectations By the end of the unit, students use mathematically the concepts of enthalpy change and relate them to energy cycles. They understand the application of the second law of thermodynamics to chemical systems and can use the concepts of entropy and free energy in relation to the spontaneity of a reaction.
Students who progress further use mathematically the concepts of enthalpy change and relate them to more complex energy cycles. They understand the application of the second law of thermodynamics to more complex chemical systems and can use the concepts of entropy and free energy in relation to the spontaneity of a reaction at different temperatures.
Resources The main resources needed for this unit are: • cards with names, symbols and definitions of enthalpy changes • ammonium chloride, polystyrene cups, thermometers • assortment of liquid fuels (e.g. pentane), spirit burners, copper
calorimeters, balances • 1 mol dm–3 HCl, 1 mol dm–3 NaOH • small whiteboards (class set) • potassium hydrogen carbonate, potassium carbonate • cards with names, symbols and definitions of terms used in Born–Haber
cycles • animation of a Born–Haber cycle and suitable data • square cards (3 cm2) in two different colours six of each) and two dice, per
pair of students • selection of standard molar entropy values and enthalpy changes of
reaction values • video clips of the reaction of aluminium with iodine, and of sodium with
chlorine
Key vocabulary and technical terms Students should understand, use and spell correctly: • standard enthalpy change (∆H) of combustion, formation, solution and
neutralisation • Hess’s law, energy cycle • Born–Haber cycle, standard enthalpy change of atomisation, ionisation,
electron affinity, lattice energy • entropy, entropy change, ∆Sθ
total, ∆Sθsystem, ∆Sθ
surroundings • Gibbs free energy (∆G)
UNIT 12AC.4 16 hours
478 | Qatar science scheme of work | Grade 12 advanced | Unit 12AC.4 | Chemistry 4 © Education Institute 2005
Standards for the unit
16 hours SUPPORTING STANDARDS CORE STANDARDS
Grade 12 standards EXTENSION STANDARDS
10A.24.1 Know that chemical reactions are accompanied by energy changes, usually in the form of heat energy, and that the energy changes can be exothermic or endothermic.
10A.24.4 Explain and use the concept of standard enthalpy change (∆H), with particular reference to combustion, formation, solution and neutralisation, and calculate enthalpy changes from experimental results
12A.21.1
10A.24.5 Recognise that bond breaking is associated with endothermic changes and bond formation is associated with exothermic changes
Explain and use the concept of standard enthalpy change (∆H), with particular reference to combustion, formation, solution and neutralisation. Calculate enthalpy changes from experimental results.
12A.21.2 Use Hess’s law to construct simple energy cycles and determine enthalpy changes that cannot be found by direct experiment, such as enthalpies of formation and of ionisation.
12A.21.3 Understand the concept of the Born–Haber cycle and use it to determine unknowns such as electron affinity and ionisation energy.
12A.21.4 Understand how the natural tendencies in the Universe towards minimum potential energy and maximum disorder are reconciled in the second law of thermodynamics, and understand how these tendencies are applied to chemical systems.
12A.21.5 State and explain the factors that lead to an increase in the entropy (disorder) of a chemical system.
12A.21.6 Calculate the standard entropy change for a reaction using absolute entropy values and recognise and explain the impact of changes of state on this value.
8 hours
Enthalpy change and cycles
4 hours
Entropy
4 hours
Free energy
12A.21.7 Calculate standard free energy changes for reactions from enthalpy and entropy changes and use this to predict the spontaneity of a reaction at a particular temperature.
Unit 12AC.4
479 | Qatar science scheme of work | Grade 12 advanced | Unit 12AC.4 | Chemistry 4 © Education Institute 2005
Activities
Objectives Possible teaching activities Notes School resources
Students should be familiar with the terms ∆H θc, ∆H θ
f, ∆H θsoln, ∆H θ
neutralisation and standard conditions from Grade 10 work. In order to consolidate their knowledge, ask students to work in pairs on a card-matching activity. Each card has either a symbol (e.g. ∆H θ
c), a name of a term (e.g. standard enthalpy of combustion) or an equation representing the term (e.g. C(s) O2 → CO2(g)). Students need to make a trio of cards that link together.
Prepare suitable sets of cards. Use this column to note your own school’s resources, e.g. textbooks, worksheets.
Allocate (depending on the abilities of the students) a practical experiment to determine the enthalpy change of a given reaction. Alternatively, ask students, in groups, to plan and carry out their own practical investigation and then analyse and evaluate their results.
Possible experiments include: • Determine ∆H θ
soln for dissolving ammonium chloride in water (dissolve a known mass of ammonium chloride in a known volume of water in an insulated vessel and record any temperature changes).
• Determine ∆H θc for the combustion of different liquid fuels using a spirit burner to heat up a
known volume of water in a copper calorimeter. Record any changes in temperature. • Determine ∆H θ
neutralisation by mixing known volumes of 1 mol dm–3 HCl with known volumes of 1 mol dm–3 NaOH in an insulated vessel and record any changes in temperature.
Students can then calculate the enthalpy change for their given reaction. Tell them to prepare a short presentation for the rest of the class describing the planning, implementation, analysis and evaluations they have carried out. They should also provide a handout sheet summarising the practical work and the calculations involved.
Enquiry skills 12A.1.1–12A.1.5, 12A.3.1–12A.3.4, 12A.4.1
Lead a whole-class discussion to help students appreciate that it is not always easy to determine the enthalpy change for some reactions, so they need to be determined indirectly. After explaining Hess’s law, go through two examples of enthalpy cycles, one to show how enthalpies of formation can be calculated using given data and a second to show how ionisation enthalpies can be calculated using given data. At each stage take care to reinforce definitions of all the terms used (e.g. by asking questions and asking students to write their answers on small whiteboards which they hold up so you can check their understanding easily and quickly).
Ask students to work in pairs to determine practically the enthalpy change for the reaction of potassium hydrogen carbonate with hydrochloric acid and the reaction of potassium carbonate with hydrochloric acid. Then tell them to construct an enthalpy cycle and use their data to determine the enthalpy change for the thermal decomposition of potassium hydrogen carbonate.
8 hours
Enthalpy change and cycles Explain and use the concept of standard enthalpy change (∆H), with particular reference to combustion, formation, solution and neutralisation. Calculate enthalpy changes from experimental results.
Use Hess’s law to construct simple energy cycles and determine enthalpy changes that cannot be found by direct experiment, such as enthalpies of formation and of ionisation.
Understand the concept of the Born–Haber cycle and use it to determine unknowns such as electron affinity and ionisation energy.
Ask students, in pairs, to carry out a card-sort activity matching cards with terms on (e.g. ∆H θLE),
to cards with the appropriate definition of terms. These will cover the terms needed in order to be able to construct Born–Haber cycles.
Lead a session to help students appreciate how to use Born–Haber cycles. It would be useful to have a PowerPoint (or similar) presentation that slowly builds up each stage of the process. Then give students data so that they can construct their own cycles in order to calculate different ∆H θ
LE, ∆H θEA and ∆H θ
i values.
Prepare suitable sets of cards.
Enquiry skills 12A.3.1, 12A.3.2
Unit 12AC.4

480 | Qatar science scheme of work | Grade 12 advanced | Unit 12AC.4 | Chemistry 4 © Education Institute 2005
Objectives Possible teaching activities Notes School resources
This activity simulates the idea of molecular mixing. Ask students to work in pairs and give each pair two sets of cards of different colours (each set numbered 1 to 6) and two dice. Tell students to take one set of cards and a die each and to lay out the cards on a sheet of paper, with all the cards of the first colour close to each other and all the cards of the second colour close to each other. This represents two pure unmixed liquids. Then ask each student to roll their die. The numbers that come up tell them which of their cards to move (e.g. if one student (red cards) rolls a 6 and the other (blue cards) rolls a 2, then red card 6 swaps places with blue card 2). This represents the random movements of particles. Tell them to continue for 10 rolls of the dice and then discuss in their pairs what would happen if they rolled 100 times, 1000 times and 10 000 times. What is the chance that the arrangement would ever return to that at the start of the activity? Draw out, through class discussion, how this activity accounts for diffusion and the mixing of liquids by imagining what the situation would be with millions of particles. Draw out the idea that there are many more ways of mixing particles than of separating them. Entropy is a measure of the number of ways something can be arranged.
Give students a list of standard entropy values for a range of solids, liquids and gases and ask them to look for any patterns in the data.
Prepare suitable sets of cards.
Ask students to come up with as many examples as they can of a tendency towards disorder in their everyday lives (e.g. what happens to an uninhabited house over a number of years).
Show the whole class a video clip of the reaction of aluminium powder with iodine (an exothermic reaction in which clouds of iodine vapour are released). Ask them to consider what energy transfers are taking place. Now view the film backwards and point out that this does not happen and ask why. Use this as a model for class discussion to draw out the idea that ‘energy seems to spread out’ and there is a tendency towards disorder or chaos called entropy.
Introduce the term quanta of energy and ask students to consider how different numbers of quanta of energy can be distributed between two molecules. Ask students to consider the types of energy present in a molecule and what will happen to the number of quanta of energy if a substance is heated. Introduce the second law of thermodynamics, which states that: No process is possible in which there is an overall decrease in the entropy of the Universe.
4 hours
Entropy Understand how the natural tendencies in the Universe towards minimum potential energy and maximum disorder are reconciled in the second law of thermodynamics, and understand how these tendencies are applied to chemical systems.
State and explain the factors that lead to an increase in the entropy (disorder) of a chemical system.
Calculate the standard entropy change for a reaction using absolute entropy values and recognise and explain the impact of changes of state on this value.
Give students standard molar entropy values for the reaction of the conversion of ozone to oxygen and show the whole class how to calculate the standard entropy change for the reaction. Give them a number of examples to practise, all giving increases in entropy. Once the students are happy with these calculations, give them values that allow them to calculate the entropy change for the formation of sodium chloride from sodium and chlorine. This gives a negative value, so students should predict that the reaction will not occur. Show them a video clip of sodium reacting violently with chlorine gas and ask why this occurs spontaneously. Introduce the idea of total entropy change being the sum of the entropy change of the system added to the entropy change of the surroundings. Explain that students have so far only calculated ∆Sθ
sys. Introduce the relationship ∆Sθsurroundings = –∆H ⁄ T. Allow students to practise
calculating examples individually. Now give them data so they are able to calculate ∆Sθtotal for
the formation of sodium chloride (as above). Allow them to practise a variety of examples.
Enquiry skills 12A.3.1, 12A.3.2

481 | Qatar science scheme of work | Grade 12 advanced | Unit 12AC.4 | Chemistry 4 © Education Institute 2005
Objectives Possible teaching activities Notes School resources
Derive the equation –T∆Stotal (∆G) = ∆H – T∆Ssys. In class discussion, draw out the idea that, since ∆Stotal must be positive for a spontaneous reaction, then ∆G must be negative.
Ask students to break into four groups. Their task is to use the relationship ∆G = ∆H – T∆Ssys for one of the four scenarios below to decide whether a reaction will be spontaneous or not. Ask each group to report their findings to the whole class. The scenarios are: • exothermic reactions accompanied by an increase in entropy; • exothermic reactions accompanied by a decrease in entropy; • endothermic reactions accompanied by an increase in entropy; • endothermic reactions accompanied by a decrease in entropy.
Enquiry skills 12A.3.1, 12A.3.2 4 hours
Free energy Calculate standard free energy changes for reactions from enthalpy and entropy changes and use this to predict the spontaneity of a reaction at a particular temperature.
Give students data for the decomposition of calcium carbonate at different temperatures and ask them to calculate whether the reaction will be spontaneous or not. Ask them to calculate the lowest temperature at which the reaction will become spontaneous.
482 | Qatar science scheme of work | Grade 12 advanced | Unit 12AC.4 | Chemistry 4 © Education Institute 2005
Assessment
Examples of assessment tasks and questions Notes School resources
Draw an enthalpy cycle to show the relationship between the combustion of ethanal (CH3CHO(l)) and the formation of ethanal, carbon dioxide and water to form carbon, hydrogen and oxygen. Use this cycle to calculate the standard enthalpy change of combustion of ethanal.
∆H θf (CH3CHO) = –192 kJ mol–1; ∆H θ
f (CO2) = –393 kJ mol–1; ∆H θ
f (H2O) = –286 kJ mol–1
Adapted from G. Burton, 2000, Salters Advanced Chemistry, Chemical Ideas, 2nd edn, Heinemann, p.63
Draw a Born–Haber cycle for calcium chloride in the form of an enthalpy level diagram.
Use the following data to explain why water freezes at 0 °C at atmospheric pressure
∆Sθsys = –22.0 kJ mol–1, ∆H = –60.1 kJ mol–1
Assessment Set up activities that allow students to demonstrate what they have learned in this unit. The activities can be provided informally or formally during and at the end of the unit, or for homework. They can be selected from the teaching activities or can be new experiences. Choose tasks and questions from the examples to incorporate in the activities.
The enthalpy change of vapourisation ∆H θvap of trichloromethane is +29.7 kJ mol–1. The change
CH3Cl(l) → CH3Cl(g)
has ∆Ssys = +88.7 J mol–1 K–1. At what temperature will the trichloromethane boil?
Adapted from A. Fullick and P. Fullick, 2000, Heinemann Advanced Science: Chemistry, 2nd edn, Heinemann Educational, p.354
Unit 12AC.4

483 | Qatar science scheme of work | Grade 12 advanced | Unit 12AC.5 | Chemistry 5 © Education Institute 2005
GRADE 12A: Chemistry 5
Organic reaction mechanisms
About this unit This unit is the fifth of eight units on chemistry for Grade 12 advanced.
The unit is designed to guide your planning and teaching of chemistry lessons. It provides a link between the standards for science and your lesson plans.
The teaching and learning activities should help you to plan the content and pace of lessons. Adapt the ideas to meet the needs of your class. For consolidation activities, look at the scheme of work for Grade 11A.
You can also supplement the activities with appropriate tasks and exercises from your school’s textbooks and other resources.
Introduce the unit to students by summarising what they will learn and how this will build on earlier work. Review the unit at the end, drawing out the main learning points, links to other work and real world applications.
Previous learning To meet the expectations of this unit, students should already know the significance of s, p, d and f orbitals and hybrids in bonding and molecular shape, and distinguish between σ and π bonds. They should have an understanding of the general chemistry of alkanes, alkenes, halogenoalkanes, aldhehydes, ketones, acyl chlorides, amines and amides.
Expectations By the end of the unit, students understand the mechanisms of electrophilic addition and substitution, nucleophilic substitution and elimination reactions.
Students who progress further show an understanding of the Lewis theory of acids and bases and relate it to nucleophilic reactions in organic chemistry.
Resources The main resources needed for this unit are: • long thin balloons, Peel models, computer animations of molecular
structures • L-carvone, D-carvone, tin foil, caraway seeds, spearmint (or spearmint
chewing gum)
Key vocabulary and technical terms Students should understand, use and spell correctly: • aliphatic, orbitals, electron-pair repulsion • chiral centre, optical isomerism, enantiomer • reaction mechanism • Lewis acid • hydrolysis, acylation, acylating agent • phenylamine, butylamine, ammonia solution, dilute hydrochloric acid
UNIT 12AC.5 11 hours

484 | Qatar science scheme of work | Grade 12 advanced | Unit 12AC.5 | Chemistry 5 © Education Institute 2005
Standards for the unit
11 hours SUPPORTING STANDARDS CORE STANDARDS Grade 12 standards
EXTENSION STANDARDS
12A.22.1 Describe the shape of aliphatic organic compounds in terms of orbital overlap and electron-pair repulsion.
11A.18.10 Describe covalent bonding in terms of orbital overlap, giving σ (sigma) and π (pi) bonds; explain bond shape and angles in ethane, ethene and benzene in terms of σ and π bonds.
12A.22.2 Describe the restricted rotation and the resulting stereochemistry of multiple bonds in terms of σ (sigma) and π (pi) bonds.
11A.24.5 Illustrate structural and geometric isomerism in alkanes and alkenes.
12A.22.3 Describe structural isomerism, cis–trans isomerism in alkenes, and how chiral centres give rise to optical isomerism.
11A.24.9 Describe the chemistry of halogenoalkanes as exemplified by substitution reactions and the elimination of hydrogen halide to form an alkene.
11A.24.4 Describe the chemistry of alkenes as the chemistry of the double bond, exemplified by addition and polymerisation.
12A.22.4 Describe the mechanisms of electrophilic addition in alkenes and nucleophilic substitution in compounds such as halogenoalkanes.
12A.22.5 Show an understanding of the Lewis theory of acids and bases and relate it to nucleophilic reactions in organic chemistry.
11A.24.13 Describe the chemistry of the carbonyl group as exemplified by aldehydes and ketones.
12A.22.6 Describe the chemistry of the carbonyl group in terms of nucleophilic substitution and show how its reactivity depends on the electronegativity of the group or groups attached to it.
12A.22.7 Know that acyl chlorides (exemplified by ethanoyl chloride) are readily hydrolysed and that they are useful agents for acylating alcohols, phenols and amines.
3 hours
Bonding in organic chemistry
4 hours
Electrophilic addition and nucleophilic substitution
2 hours
Acylation
2 hours
Amines and amides
12A.22.8 Distinguish between amines and amides, recognise that they are both substituted ammonia compounds and therefore describe their basic properties.
Unit 12AC.5
485 | Qatar science scheme of work | Grade 12 advanced | Unit 12AC.5 | Chemistry 5 © Education Institute 2005
Activities
Objectives Possible teaching activities Notes School resources
Guide students through the first example given below.
Arrange students into pairs and get them to inflate long thin balloons and twist them in the middle. Each ‘lobe’ of the balloon represents a group of electrons in a molecule around a central atom. A group of electrons might be a lone pair of electrons, a single, double or triple covalent bond. Ask students to model various atoms in molecules (e.g. the carbon in methane could be represented by twisting two bilobar balloons together). The lobes automatically arrange themselves into a pyramidal conformation with a bond angle approximating to 109°.
Introduce students to the convention for representing 3D structures in 2D and ask them to draw out the structure of methane. Reinforce their appreciation of the structure using either 3D Peel models or applets downloaded from the Internet.
Give students the names of a range of organic compounds (e.g. ethanal, trimethylamine) and ask them to work in pairs, using the technique above, to work out the 3D structure of the compounds. Differentiate the complexity of the molecules to suit students’ ability. For each example, ask students to relate the balloon models to the type of bonds (e.g. of σ (sigma) and π (pi) bonds).
ICT opportunity: Use of the Internet and Java applets.
Use this column to note your own school’s resources, e.g. textbooks, worksheets.
Revise the formation of σ (sigma) and π (pi) bonds. Ask students, working individually, to make models of ethane and ethene using a model building kit. Revise the formation of σ (sigma) and π (pi) bonds and ask them to draw diagrams showing the types of bonds involved in the two different molecules. Give students the bond enthalpy values for the carbon–carbon bonds in both molecules and ask them to interpret the difference in the bond enthalpies and discuss their ideas in pairs. Ask each student to build a model of but-2-ene. Ask them to compare their model with those of the rest of the class and form two groups. Each group will consist of students producing the same form of but-2-ene. Draw the two different structures on the board or OHP and discuss with the whole class the difference between the two forms, why they do not readily interconvert at room temperature and the possible impact on reactivity (steric hindrance).
Then ask students to use their textbook, the library or the Internet to research the differences in chemical reactivity and physical properties for given cis–trans isomers.
ICT opportunity: Use of the Internet.
3 hours
Bonding in organic chemistry
Describe the shape of aliphatic organic compounds in terms of orbital overlap and electron-pair repulsion.
Describe the restricted rotation and the resulting stereochemistry of multiple bonds in terms of σ (sigma) and π (pi) bonds.
Describe structural isomerism, cis–trans isomerism in alkenes, and how chiral centres give rise to optical isomerism
Ask students to build a ‘ball and stick’ model using a central carbon with four different coloured groups attached. (All students must use the same four colours.) Ask them to compare their model first with the person to the left of them then with the person to the right of them. Ask them to identify whether the compounds are the same as or different from each other. Ask them to identify the link between the two non-superimposable models (i.e. they are mirror images of each other). Ask students to draw a 3D representation of an amino acid. Introduce the terms enantiomer and chiral centre.
Unit 12AC.5

486 | Qatar science scheme of work | Grade 12 advanced | Unit 12AC.5 | Chemistry 5 © Education Institute 2005
Objectives Possible teaching activities Notes School resources
Prepare small tubes wrapped in tin foil and plugged with cotton wool. Place a few drops of L-carvone in one-third of the tubes and label as ‘compound X’. Place a few drops of D-carvone in another one-third of the tubes and label as ‘compound Y’. Divide the remaining one-third of the tubes into two and place freshly ground caraway seeds (contains D-carvone) in half of them and fresh spearmint (contains L-carvone) in the other half. Label these ‘spearmint’ and ‘caraway’ as appropriate. Let all students smell compound X then compound Y to decide whether they smell the same or different. Then let them smell the caraway and spearmint to see whether they smell the same as X or Y. (Caraway seeds contain D-carvone and spearmint contains L-carvone). Gather data from the whole class. Show students the structures of D- and L-carvone and ask them to work in pairs to identify the chiral centre. Ask them to try to explain why not everyone could differentiate between L- and D-carvone.
Ask students to use the Internet to research the use of thalidomide and relate the resultant problems to optical isomerism. Ask them to prepare a report detailing the case, making recommendations on how this scenario could be prevented in the future.
ICT opportunity: Use of the Internet.
Enquiry skills 12A.2.2, 12A.2.3
In a teacher-led session, teach the mechanism for electrophilic addition in alkenes. Provide a generic model of the reaction. Ask students to work through a number of reactions they researched in Grade 11 and draw out the full mechanism for these reactions. Take great care to reinforce the conventions of single- and double-headed arrows to represent the movement of one and two electrons, respectively. Let students mark each other’s work.
In a teacher-led session, teach the mechanisms for nuleophilic substitution reactions. Provide a generic model of each of the mechanisms. Ask students to work through a number of reactions they researched in Grade 11 and draw out the full mechanism for these reactions. Let students mark each other’s work.
Revise the definition of a nucleophile in a whole class question and answer session.
Give students the definition of a Lewis acid and Lewis base in terms of electron transfer. Give them a list of reactions (e.g. the production of butan-1-ol by the reaction of 1-bromobutane with hydroxide ions) and ask them to identify the Lewis acids and bases in each reaction. Ask each student to identify another reaction and the Lewis acids and bases involved in the reaction.
4 hours
Electrophilic addition and nucleophilic substitution Describe the mechanisms of electrophilic addition in alkenes and nucleophilic substitution in compounds such as halogenoalkanes.
Show an understanding of the Lewis theory of acids and bases and relate it to nucleophilic reactions in organic chemistry.
Describe the chemistry of the carbonyl group in terms of nucleophilic substitution and show how its reactivity depends on the electronegativity of the group or groups attached to it.
Supply data on the reactivity of different carbonyl compounds and electronegativity data for different elements. Tell students to rank these compounds with respect to order of reactivity. Ask them to account for the differing reactivities by noting the extent to which the atom (or group) attached to the carbonyl group tends to oppose or enhance the movement of electrons away from the carbonyl carbon atom.
Enquiry skills 12A.3.2

487 | Qatar science scheme of work | Grade 12 advanced | Unit 12AC.5 | Chemistry 5 © Education Institute 2005
Objectives Possible teaching activities Notes School resources
Write an equation for the hydrolysis of ethanoyl chloride on the board or OHP. Ask students to write a similar equation for the hydrolysis of an acyl chloride of their choice.
Ask students to use their textbook, the library or the Internet to research the uses of ethanoyl chloride in acylating alcohols, phenols and amides. Let them work in small groups to produce information posters for these reactions.
ICT opportunity: Use of the Internet.
2 hours
Acylation Know that acyl chlorides (exemplified by ethanoyl chloride) are readily hydrolysed and that they are useful agents for acylating alcohols, phenols and amines.
Tell students to carry out the following procedure and record their results. Add ethanoyl chloride dropwise to 10 drops of butylamine in a dry test-tube and observe any reaction. Add a small volume (1 cm depth) of water. Add sodium hydroxide solution, warm and test any gases evolved with damp red litmus paper. Use class discussion to interpret the results
Safety: All work must be carried out in a fume cupboard. Ethanoyl chloride is corrosive and an irritant. Enquiry skills 12A.3.1, 12A.3.4, 12A.4.1
Ask students to draw the structure of a primary amine, secondary amine, tertiary amine, primary amide and secondary amide. Draw up the structure of ammonia on the board or OHP and use questioning to draw out the relationship between these compounds.
2 hours
Amines and amides Distinguish between amines and amides, recognise that they are both substituted ammonia compounds and therefore describe their basic properties.
Ask students, working individually, to test the reaction of phenylamine, butylamine and ammonia solution with water and universal indicator.
Tell them to shake two drops of phenylamine with 2 cm3 of dilute hydrochloric acid, then repeat with butylamine and record their results. Let them interpret their observations in small group discussions and ask each group to report back to the whole class for a whole group discussion.
Safety: Phenylamine is toxic. Use in small quantities in the fume cupboard. Butylamine is flammable and an irritant.
Enquiry skills 12A.3.1, 12A.3.4, 12A.4.1
488 | Qatar science scheme of work | Grade 12 advanced | Unit 12AC.5 | Chemistry 5 © Education Institute 2005
Assessment
Examples of assessment tasks and questions Notes School resources
a. Write a reaction mechanism for the reaction of ammonia with bromobutane.
b. Describe why the reaction occurs this way.
c. What reaction conditions are needed?
d. Why is this classified as a substitution reaction?
a. Draw a dot and cross diagram for the molecule CH3NNCH3. b. Draw out the structure of the compound in part a showing all the bond angles.
c. This compound can exist as cis and trans isomers. Draw diagrams to show the two structures.
a. Draw the structural formula of 3-methylhexane.
b. Identify the chiral carbon in your structure with an asterisk (∗).
c. Use three-dimensional diagrams to show the structures of the two optical isomers of this compound.
Assessment Set up activities that allow students to demonstrate what they have learned in this unit. The activities can be provided informally or formally during and at the end of the unit, or for homework. They can be selected from the teaching activities or can be new experiences. Choose tasks and questions from the examples to incorporate in the activities.
Write an account of the similarities between the chemistry of ammonia, amines and amides.
Unit 12AC.5
489 | Qatar science scheme of work | Grade 12 advanced | Unit 12AC.6 | Chemistry 6 © Education Institute 2005
GRADE 12A: Chemistry 6
Aromatic organic chemistry
About this unit This unit is the sixth of eight units on chemistry for Grade 12 advanced.
The unit is designed to guide your planning and teaching of chemistry lessons. It provides a link between the standards for science and your lesson plans.
The teaching and learning activities should help you to plan the content and pace of lessons. Adapt the ideas to meet your students’ needs. For consolidation activities, look at the scheme of work for Grade 11A.
You can also supplement the activities with appropriate tasks and exercises from your school’s textbooks and other resources.
Introduce the unit to students by summarising what they will learn and how this builds on earlier work. Review the unit at the end, drawing out the main learning points, links to other work and real world applications.
Previous learning To meet the expectations of this unit, students should already know how to distinguish between σ and π bonds and recognise the relative unreactivity of the arene ring.
Expectations By the end of the unit, students know the fundamental chemistry of arenes and substituted arenes and describe the production of the more important derivatives of benzene. They explain the stability of the benzene ring in terms of electron delocalisation.
Students who progress further understand the mechanism of electrophilic substitution reactions and are able to predict the effect of substitutions on the aromatic ring.
Resources The main resources needed for this unit are: • 0.01 mol dm–3 potassium manganate(VII), 1 mol dm–3 sulfuric acid, methyl
benzene • class set of student whiteboards • molecular model kits • methyl benzoate, concentrated sulfuric acid, concentrated nitric acid, ice • methylphenol, phenol, phenylamine, sodium nitrate(III), sodium hydroxide,
napthalen-2-ol, ice, fume cupboard • Internet access
Key vocabulary and technical terms Students should understand, use and spell correctly: • arenes, aromatic • electrophilic substitution • azo dyes, coupling, diazotisation
UNIT 12AC.6 11 hours
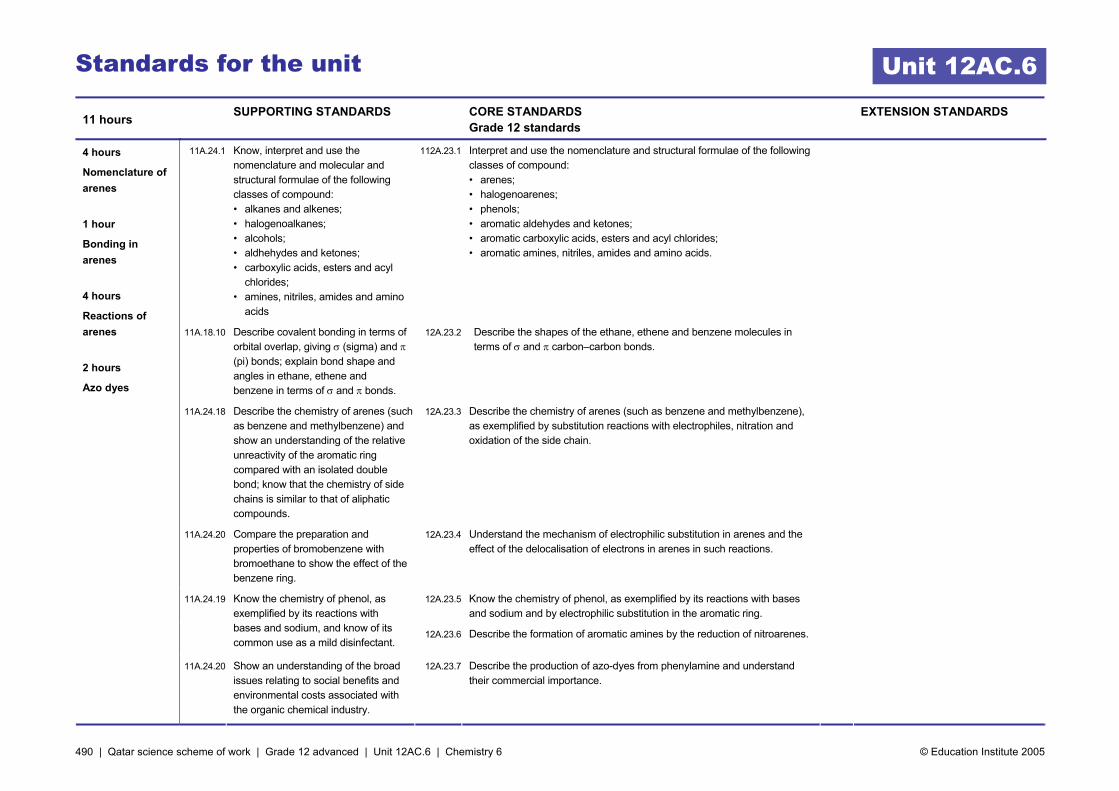
490 | Qatar science scheme of work | Grade 12 advanced | Unit 12AC.6 | Chemistry 6 © Education Institute 2005
Standards for the unit
11 hours SUPPORTING STANDARDS CORE STANDARDS Grade 12 standards
EXTENSION STANDARDS
11A.24.1 Know, interpret and use the nomenclature and molecular and structural formulae of the following classes of compound: • alkanes and alkenes; • halogenoalkanes; • alcohols; • aldhehydes and ketones; • carboxylic acids, esters and acyl
chlorides; • amines, nitriles, amides and amino
acids
112A.23.1 Interpret and use the nomenclature and structural formulae of the following classes of compound: • arenes; • halogenoarenes; • phenols; • aromatic aldehydes and ketones; • aromatic carboxylic acids, esters and acyl chlorides; • aromatic amines, nitriles, amides and amino acids.
11A.18.10 Describe covalent bonding in terms of orbital overlap, giving σ (sigma) and π (pi) bonds; explain bond shape and angles in ethane, ethene and benzene in terms of σ and π bonds.
12A.23.2 Describe the shapes of the ethane, ethene and benzene molecules in terms of σ and π carbon–carbon bonds.
11A.24.18 Describe the chemistry of arenes (such as benzene and methylbenzene) and show an understanding of the relative unreactivity of the aromatic ring compared with an isolated double bond; know that the chemistry of side chains is similar to that of aliphatic compounds.
12A.23.3 Describe the chemistry of arenes (such as benzene and methylbenzene), as exemplified by substitution reactions with electrophiles, nitration and oxidation of the side chain.
11A.24.20 Compare the preparation and properties of bromobenzene with bromoethane to show the effect of the benzene ring.
12A.23.4 Understand the mechanism of electrophilic substitution in arenes and the effect of the delocalisation of electrons in arenes in such reactions.
12A.23.5 Know the chemistry of phenol, as exemplified by its reactions with bases and sodium and by electrophilic substitution in the aromatic ring.
11A.24.19 Know the chemistry of phenol, as exemplified by its reactions with bases and sodium, and know of its common use as a mild disinfectant.
12A.23.6 Describe the formation of aromatic amines by the reduction of nitroarenes.
4 hours
Nomenclature of arenes
1 hour
Bonding in arenes
4 hours
Reactions of arenes
2 hours
Azo dyes
11A.24.20 Show an understanding of the broad issues relating to social benefits and environmental costs associated with the organic chemical industry.
12A.23.7 Describe the production of azo-dyes from phenylamine and understand their commercial importance.
Unit 12AC.6
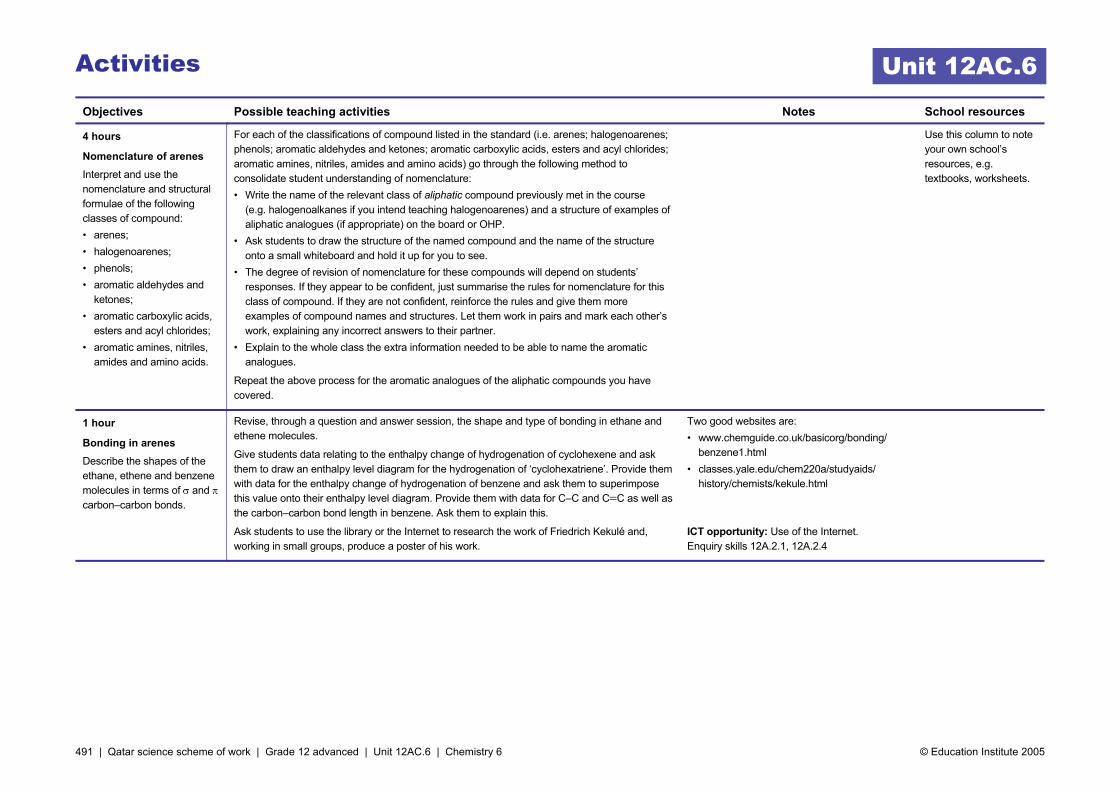
491 | Qatar science scheme of work | Grade 12 advanced | Unit 12AC.6 | Chemistry 6 © Education Institute 2005
Activities
Objectives Possible teaching activities Notes School resources
4 hours
Nomenclature of arenes Interpret and use the nomenclature and structural formulae of the following classes of compound: • arenes; • halogenoarenes; • phenols; • aromatic aldehydes and
ketones; • aromatic carboxylic acids,
esters and acyl chlorides; • aromatic amines, nitriles,
amides and amino acids.
For each of the classifications of compound listed in the standard (i.e. arenes; halogenoarenes; phenols; aromatic aldehydes and ketones; aromatic carboxylic acids, esters and acyl chlorides; aromatic amines, nitriles, amides and amino acids) go through the following method to consolidate student understanding of nomenclature: • Write the name of the relevant class of aliphatic compound previously met in the course
(e.g. halogenoalkanes if you intend teaching halogenoarenes) and a structure of examples of aliphatic analogues (if appropriate) on the board or OHP.
• Ask students to draw the structure of the named compound and the name of the structure onto a small whiteboard and hold it up for you to see.
• The degree of revision of nomenclature for these compounds will depend on students’ responses. If they appear to be confident, just summarise the rules for nomenclature for this class of compound. If they are not confident, reinforce the rules and give them more examples of compound names and structures. Let them work in pairs and mark each other’s work, explaining any incorrect answers to their partner.
• Explain to the whole class the extra information needed to be able to name the aromatic analogues.
Repeat the above process for the aromatic analogues of the aliphatic compounds you have covered.
Use this column to note your own school’s resources, e.g. textbooks, worksheets.
Revise, through a question and answer session, the shape and type of bonding in ethane and ethene molecules.
Give students data relating to the enthalpy change of hydrogenation of cyclohexene and ask them to draw an enthalpy level diagram for the hydrogenation of ‘cyclohexatriene’. Provide them with data for the enthalpy change of hydrogenation of benzene and ask them to superimpose this value onto their enthalpy level diagram. Provide them with data for C–C and C=C as well as the carbon–carbon bond length in benzene. Ask them to explain this.
Two good websites are: • www.chemguide.co.uk/basicorg/bonding/
benzene1.html • classes.yale.edu/chem220a/studyaids/
history/chemists/kekule.html
1 hour
Bonding in arenes Describe the shapes of the ethane, ethene and benzene molecules in terms of σ and π carbon–carbon bonds.
Ask students to use the library or the Internet to research the work of Friedrich Kekulé and, working in small groups, produce a poster of his work.
ICT opportunity: Use of the Internet. Enquiry skills 12A.2.1, 12A.2.4
Unit 12AC.6
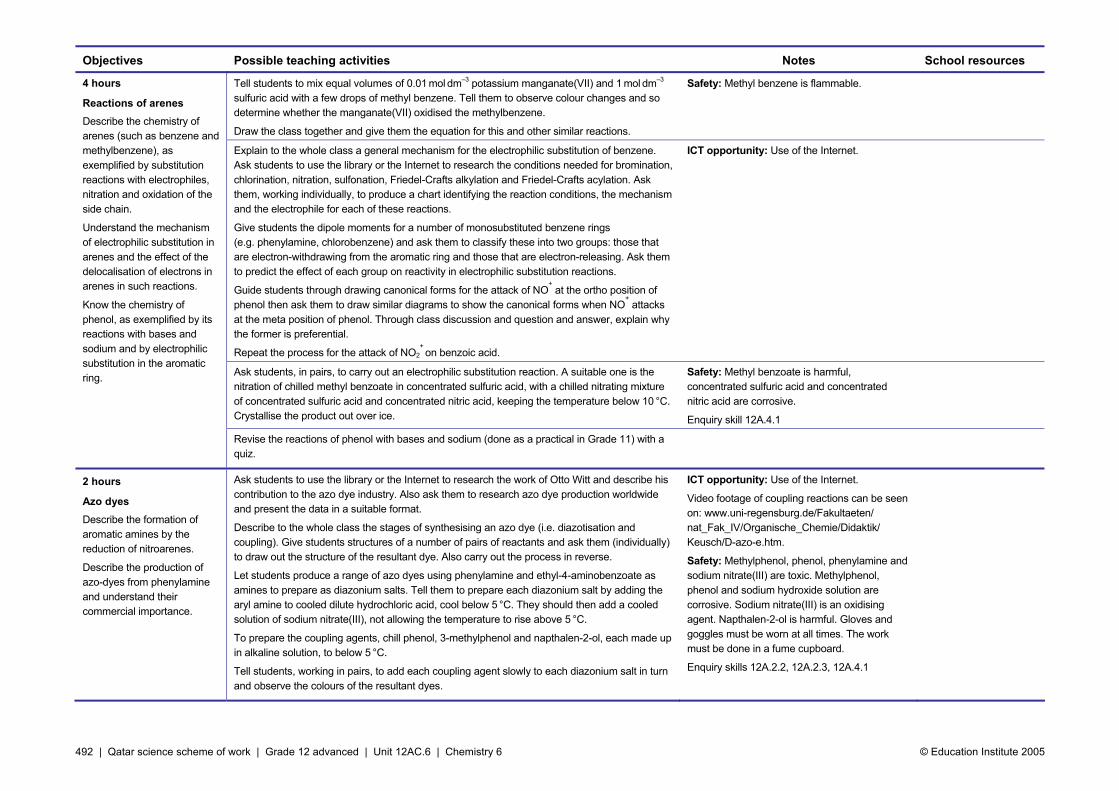
492 | Qatar science scheme of work | Grade 12 advanced | Unit 12AC.6 | Chemistry 6 © Education Institute 2005
Objectives Possible teaching activities Notes School resources
Tell students to mix equal volumes of 0.01 mol dm–3 potassium manganate(VII) and 1 mol dm–3 sulfuric acid with a few drops of methyl benzene. Tell them to observe colour changes and so determine whether the manganate(VII) oxidised the methylbenzene.
Draw the class together and give them the equation for this and other similar reactions.
Safety: Methyl benzene is flammable.
Explain to the whole class a general mechanism for the electrophilic substitution of benzene. Ask students to use the library or the Internet to research the conditions needed for bromination, chlorination, nitration, sulfonation, Friedel-Crafts alkylation and Friedel-Crafts acylation. Ask them, working individually, to produce a chart identifying the reaction conditions, the mechanism and the electrophile for each of these reactions.
Give students the dipole moments for a number of monosubstituted benzene rings (e.g. phenylamine, chlorobenzene) and ask them to classify these into two groups: those that are electron-withdrawing from the aromatic ring and those that are electron-releasing. Ask them to predict the effect of each group on reactivity in electrophilic substitution reactions.
Guide students through drawing canonical forms for the attack of NO+ at the ortho position of
phenol then ask them to draw similar diagrams to show the canonical forms when NO+ attacks
at the meta position of phenol. Through class discussion and question and answer, explain why the former is preferential.
Repeat the process for the attack of NO2+ on benzoic acid.
ICT opportunity: Use of the Internet.
Ask students, in pairs, to carry out an electrophilic substitution reaction. A suitable one is the nitration of chilled methyl benzoate in concentrated sulfuric acid, with a chilled nitrating mixture of concentrated sulfuric acid and concentrated nitric acid, keeping the temperature below 10 °C. Crystallise the product out over ice.
Safety: Methyl benzoate is harmful, concentrated sulfuric acid and concentrated nitric acid are corrosive.
Enquiry skill 12A.4.1
4 hours
Reactions of arenes Describe the chemistry of arenes (such as benzene and methylbenzene), as exemplified by substitution reactions with electrophiles, nitration and oxidation of the side chain.
Understand the mechanism of electrophilic substitution in arenes and the effect of the delocalisation of electrons in arenes in such reactions.
Know the chemistry of phenol, as exemplified by its reactions with bases and sodium and by electrophilic substitution in the aromatic ring.
Revise the reactions of phenol with bases and sodium (done as a practical in Grade 11) with a quiz.
2 hours
Azo dyes Describe the formation of aromatic amines by the reduction of nitroarenes.
Describe the production of azo-dyes from phenylamine and understand their commercial importance.
Ask students to use the library or the Internet to research the work of Otto Witt and describe his contribution to the azo dye industry. Also ask them to research azo dye production worldwide and present the data in a suitable format.
Describe to the whole class the stages of synthesising an azo dye (i.e. diazotisation and coupling). Give students structures of a number of pairs of reactants and ask them (individually) to draw out the structure of the resultant dye. Also carry out the process in reverse.
Let students produce a range of azo dyes using phenylamine and ethyl-4-aminobenzoate as amines to prepare as diazonium salts. Tell them to prepare each diazonium salt by adding the aryl amine to cooled dilute hydrochloric acid, cool below 5 °C. They should then add a cooled solution of sodium nitrate(III), not allowing the temperature to rise above 5 °C.
To prepare the coupling agents, chill phenol, 3-methylphenol and napthalen-2-ol, each made up in alkaline solution, to below 5 °C.
Tell students, working in pairs, to add each coupling agent slowly to each diazonium salt in turn and observe the colours of the resultant dyes.
ICT opportunity: Use of the Internet.
Video footage of coupling reactions can be seen on: www.uni-regensburg.de/Fakultaeten/ nat_Fak_IV/Organische_Chemie/Didaktik/ Keusch/D-azo-e.htm.
Safety: Methylphenol, phenol, phenylamine and sodium nitrate(III) are toxic. Methylphenol, phenol and sodium hydroxide solution are corrosive. Sodium nitrate(III) is an oxidising agent. Napthalen-2-ol is harmful. Gloves and goggles must be worn at all times. The work must be done in a fume cupboard.
Enquiry skills 12A.2.2, 12A.2.3, 12A.4.1

493 | Qatar science scheme of work | Grade 12 advanced | Unit 12AC.6 | Chemistry 6 © Education Institute 2005
Assessment
Examples of assessment tasks and questions Notes School resources
If bromine water is added to a solution of phenylamine, a white precipitate of 2,4,6-tribromophenylamine forms.
Explain why the reaction occurs so readily. Suggest why the benzenediazonium ion attacks the para rather than the ortho position on phenol. Draw the structure of the azo compound produced in this reaction.
Give a generic mechanism for the electrophilic substitution of benzene with an electrophile E+.
Why is this reaction classified as an electrophilic substitution?
Assessment Set up activities that allow students to demonstrate what they have learned in this unit. The activities can be provided informally or formally during and at the end of the unit, or for homework. They can be selected from the teaching activities or can be new experiences. Choose tasks and questions from the examples to incorporate in the activities.
Research and present a paper on the role of azo dyes in the organic chemical industry. Focus on the reasons for and nature of the development of the industry. Reference clearly any sources of information.
Unit 12AC.6

494 | Qatar science scheme of work | Grade 12 advanced | Unit 12AC.6 | Chemistry 6 © Education Institute 2005
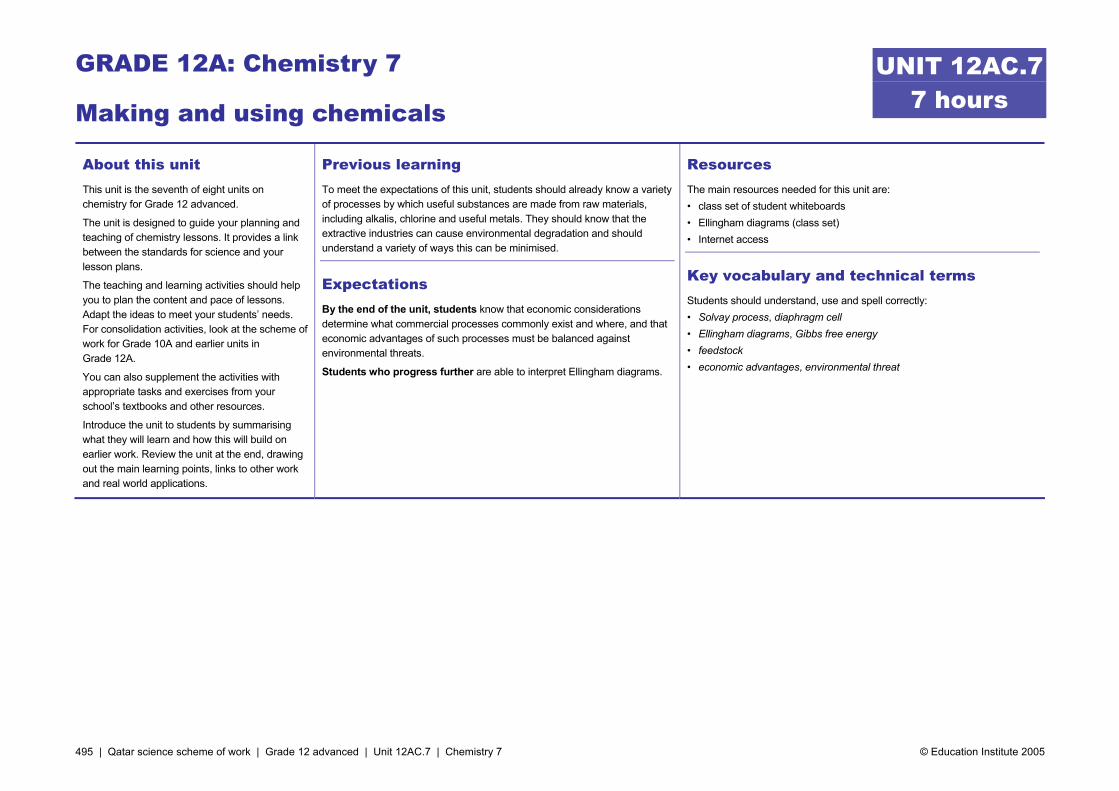
495 | Qatar science scheme of work | Grade 12 advanced | Unit 12AC.7 | Chemistry 7 © Education Institute 2005
GRADE 12A: Chemistry 7
Making and using chemicals
About this unit This unit is the seventh of eight units on chemistry for Grade 12 advanced.
The unit is designed to guide your planning and teaching of chemistry lessons. It provides a link between the standards for science and your lesson plans.
The teaching and learning activities should help you to plan the content and pace of lessons. Adapt the ideas to meet your students’ needs. For consolidation activities, look at the scheme of work for Grade 10A and earlier units in Grade 12A.
You can also supplement the activities with appropriate tasks and exercises from your school’s textbooks and other resources.
Introduce the unit to students by summarising what they will learn and how this will build on earlier work. Review the unit at the end, drawing out the main learning points, links to other work and real world applications.
Previous learning To meet the expectations of this unit, students should already know a variety of processes by which useful substances are made from raw materials, including alkalis, chlorine and useful metals. They should know that the extractive industries can cause environmental degradation and should understand a variety of ways this can be minimised.
Expectations By the end of the unit, students know that economic considerations determine what commercial processes commonly exist and where, and that economic advantages of such processes must be balanced against environmental threats.
Students who progress further are able to interpret Ellingham diagrams.
Resources The main resources needed for this unit are: • class set of student whiteboards • Ellingham diagrams (class set) • Internet access
Key vocabulary and technical terms Students should understand, use and spell correctly: • Solvay process, diaphragm cell • Ellingham diagrams, Gibbs free energy • feedstock • economic advantages, environmental threat
UNIT 12AC.7 7 hours

496 | Qatar science scheme of work | Grade 12 advanced | Unit 12AC.7 | Chemistry 7 © Education Institute 2005
Standards for the unit
7 hours SUPPORTING STANDARDS CORE STANDARDS Grade 12 standards
EXTENSION STANDARDS
10A.18.5 Explain, including the electrode reactions, industrial electrolytic processes such as: • the electrolysis of brine using a
diaphragm cell; …
12A.18.1 Know the essential chemistry of the two main processes for producing alkali: the Solvay process and the diaphragm cell. Know the products of these processes and the uses to which they are put, and understand the economic impact on the processes of the demand for chlorine.
10A.18.8 Describe, with essential chemical reactions, the extraction of pig iron from iron ore in the blast furnace and its subsequent conversion into steel in the basic oxygen furnace.
12A.18.2 Analyse Ellingham diagrams to provide information about the feasibility of the reduction of metal oxides by carbon at different temperatures.
10A.18.3 Know how a variety of fuels and other useful compounds can be obtained from petroleum and natural gas.
12A.18.3 Recognise that Qatar natural gas can act as both a fuel and a feedstock for industrial processes and that a wide variety of industrial processes are arising in the country that take advantage of the availability of both the gas and the products of other processes.
2 hours
Alkali manufacture
2 hours
Extracting metals
1 hour
The oil industry in Qatar
2 hours
Environment versus economics
10A.18.10 Be aware that large-scale extraction and refining processes are often damaging to the environment and that this has to be balanced against the benefits of the processes; list some of the steps taken to minimise environmental degradation in the processes studied.
12A.18.4 Show an understanding of the balance that often has to be made between the economic advantages that industrial processes bring to Qatar and the environmental threat that they pose.
Unit 12AC.7

497 | Qatar science scheme of work | Grade 12 advanced | Unit 12AC.7 | Chemistry 7 © Education Institute 2005
Activities
Objectives Possible teaching activities Notes School resources
2 hours
Alkali manufacture Know the essential chemistry of the two main processes for producing alkali: the Solvay process and the diaphragm cell. Know the products of these processes and the uses to which they are put, and understand the economic impact on the processes of the demand for chlorine.
Arrange students into pairs. Tell them that, using the Internet or the library, one student from each pair should research the Solvay process and the other the diaphragm cell. Ask all students to prepare a 5-minute presentation on: • the actual process they have researched; • the products of these processes; • the uses to which they are put; • the economic impact on the processes of the demand for chlorine.
Let students give their presentations to their partners and ask them to produce a short set of notes summarising their findings.
ICT opportunity: Use of the Internet.
Enquiry skill 12A.2.2
Use this column to note your own school’s resources, e.g. textbooks, worksheets.
2 hours
Extracting metals Analyse Ellingham diagrams to provide information about the feasibility of the reduction of metal oxides by carbon at different temperatures.
Revise Gibbs free energy by asking a series of quick questions and getting students to write their answers on white boards so that they can hold them up for you to see. Use their responses to determine how much detail to go into for the revision.
Give students data to determine ∆G for the same reaction at two different temperatures, where ∆G is positive for one temperature and negative for the other (e.g. the thermal decomposition of zinc carbonate at 298 K and 573 K. Discuss with the whole group why increasing the temperature has this effect.
Explain to the whole class how Ellingham diagrams work and how they are plotted. Work through one example with students (e.g. to determine the temperature at which carbon monoxide can be used to obtain zinc from zinc oxide). Provide students with their own copy of an Ellingham diagram and a number of questions to answer. Then tell students to work individually and mark each other’s work.
1 hour
The oil industry in Qatar Recognise that Qatar natural gas can act as both a fuel and a feedstock for industrial processes and that a wide variety of industrial processes are arising in the country that take advantage of the availability of both the gas and the products of other processes.
Organise students into small groups and ask them to use the Internet or the library to research the evolution of industries in Qatar that arise from the presence of the gas field. Tell students to pay particular attention to interdependence of the industries; that is, the way that each industry exploits the products and by-products of others. Tell each group to produce a poster that can be displayed as part of a poster conference for a target audience (e.g. Grade 11 students, science teachers or parents).
ICT opportunity: Use of the Internet.
Enquiry skill 12A.2.2
Unit 12AC.7

498 | Qatar science scheme of work | Grade 12 advanced | Unit 12AC.7 | Chemistry 7 © Education Institute 2005
Objectives Possible teaching activities Notes School resources
2 hours
Environment versus economics Show an understanding of the balance that often has to be made between the economic advantages that industrial processes bring to Qatar and the environmental threat that they pose.
Invite speakers from local industries and environmental agencies, such as Friends of the Environment, to discuss the balance that often has to be made between the economic advantages that industrial processes bring to Qatar and the environmental threat that they pose.
Arrange a visit to one of the industries covered in the discussion.
Visit opportunity: Visit a local industrial plant.
Enquiry skills 12A.1.6, 12A.1.8, 12A.2.2, 12A.2.3

499 | Qatar science scheme of work | Grade 12 advanced | Unit 12AC.7 | Chemistry 7 © Education Institute 2005
Assessment
Examples of assessment tasks and questions Notes School resources
Compare and contrast the Solvay process and diaphragm membrane method for the production of alkalis. Discuss the economic impact on the processes of the demand for chlorine.
Using an example of your choice, write an account demonstrating an understanding of the balance that often has to be made between the economic advantages that industrial processes bring to Qatar and the environmental threat that they pose.
Assessment Set up activities that allow students to demonstrate what they have learned in this unit. The activities can be provided informally or formally during and at the end of the unit, or for homework. They can be selected from the teaching activities or can be new experiences. Choose tasks and questions from the examples to incorporate in the activities.
If you were running a factory in which carbon was used to reduce magnesium oxide, would carbon dioxide or carbon monoxide be produced? Estimate the minimum temperature at which the reaction would take place. What would be the state of the magnesium at this temperature? Given that the whole point of your factory is to produce magnesium, what problems do you face in collecting the magnesium as a solid?
From P. Matthews, 1999, Advanced Chemistry 1, Cambridge University Press, p.297
Provide students with a copy of an Ellingham diagram.
Unit 12AC.7

500 | Qatar science scheme of work | Grade 12 advanced | Unit 12AC.7 | Chemistry 7 © Education Institute 2005

501 | Qatar science scheme of work | Grade 12 foundation | Unit 12AC.8 | Chemistry 8 © Education Institute 2005
GRADE 12A: Chemistry 8
Macromolecules
About this unit This unit is the eighth of eight units on chemistry for Grade 12 advanced.
The unit is designed to guide your planning and teaching of chemistry lessons. It provides a link between the standards for science and your lesson plans.
The teaching and learning activities should help you to plan the content and pace of lessons. Adapt the ideas to meet your students’ needs. For consolidation activities, look at the scheme of work for Grade 11A.
You can also supplement the activities with appropriate tasks and exercises from your school’s textbooks and other resources.
Introduce the unit to students by summarising what they will learn and how this builds on earlier work. Review the unit at the end, drawing out the main learning points, links to other work and real world applications.
Previous learning To meet the expectations of this unit, students should already know the characteristic structures of natural and artificial addition and condensation polymers.
Expectations By the end of the unit, students know how addition and condensation polymers are formed and how their properties can be modified by additives.
Students who progress further understand the role of DNA as a genetic repository and appreciate its crucial role in protein synthesis.
Resources The main resources needed for this unit are: • ‘ball and stick’ model kits • aspartame, reflux equipment, hydrochloric acid (4 mol dm–3), apparatus for
paper chromatography, aspartic acid solution, phenylaniline solution, ninhydrin in butan-1-ol, butan-1-ol, glacial ethanoic acid
• egg white, 2 mol dm–3 hydrochloric acid, 1 mol dm–3 sodium hydroxide solution
• 3D model of DNA • data for isotopic labelling during DNA replication • video of DNA replication • video of protein synthesis • diagrams of two different sections of DNA, listing the order in which the
base pairs exist, table of the triplet base code used in mRNA • samples of HDPE, LDPE and polypropylene • methyl benzene, 1,1,1 trichloroethane, polystyrene, urea-methanal resin,
vulcanised natural rubber • Internet access
Key vocabulary and technical terms Students should understand, use and spell correctly: • peptide bonds, amide, condensation, hydrolysis, electrophoresis, ion-
exchange chromatography • hydrogen bonding, disulfide bridges, denaturing • nucleotides, nucleic acids, DNA, RNA, base pairing • triplet code, mRNA, protein synthesis • monosaccharides, polysaccharides, starch, cellulose • additives
UNIT 12AC.8 8 hours
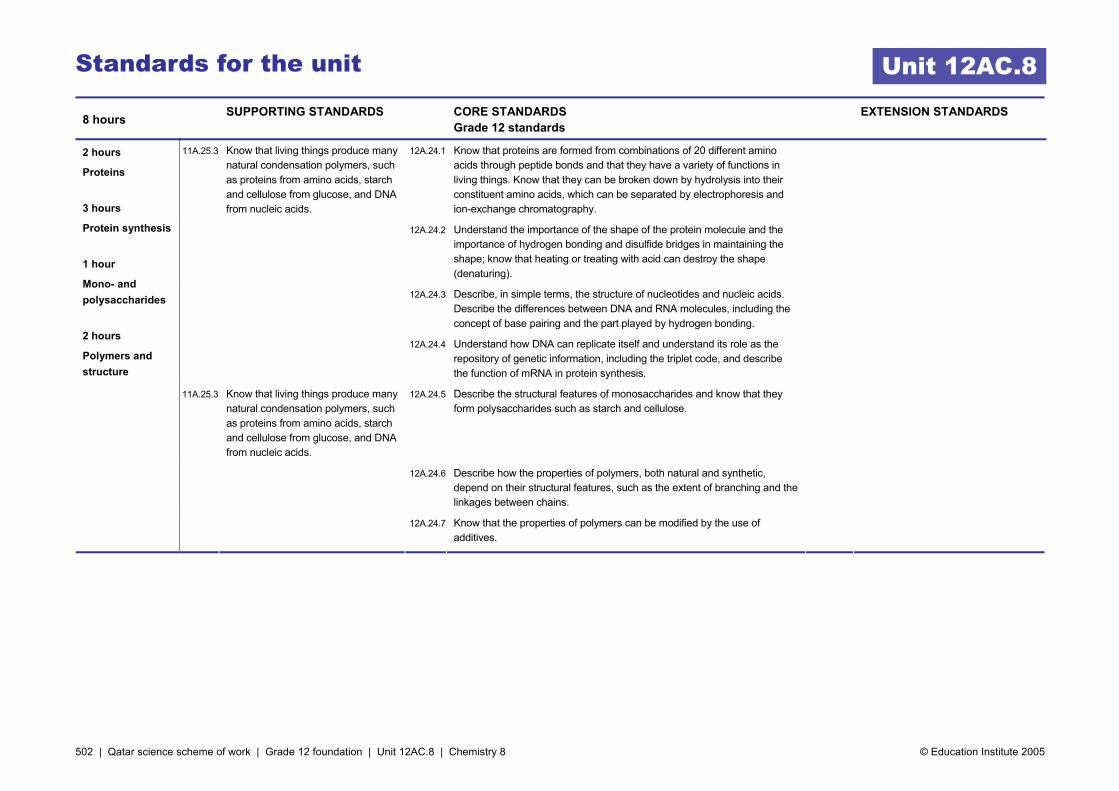
502 | Qatar science scheme of work | Grade 12 foundation | Unit 12AC.8 | Chemistry 8 © Education Institute 2005
Standards for the unit
8 hours SUPPORTING STANDARDS CORE STANDARDS
Grade 12 standards EXTENSION STANDARDS
11A.25.3 Know that living things produce many natural condensation polymers, such as proteins from amino acids, starch and cellulose from glucose, and DNA from nucleic acids.
12A.24.1 Know that proteins are formed from combinations of 20 different amino acids through peptide bonds and that they have a variety of functions in living things. Know that they can be broken down by hydrolysis into their constituent amino acids, which can be separated by electrophoresis and ion-exchange chromatography.
12A.24.2 Understand the importance of the shape of the protein molecule and the importance of hydrogen bonding and disulfide bridges in maintaining the shape; know that heating or treating with acid can destroy the shape (denaturing).
12A.24.3 Describe, in simple terms, the structure of nucleotides and nucleic acids. Describe the differences between DNA and RNA molecules, including the concept of base pairing and the part played by hydrogen bonding.
12A.24.4 Understand how DNA can replicate itself and understand its role as the repository of genetic information, including the triplet code, and describe the function of mRNA in protein synthesis.
11A.25.3 Know that living things produce many natural condensation polymers, such as proteins from amino acids, starch and cellulose from glucose, and DNA from nucleic acids.
12A.24.5 Describe the structural features of monosaccharides and know that they form polysaccharides such as starch and cellulose.
12A.24.6 Describe how the properties of polymers, both natural and synthetic, depend on their structural features, such as the extent of branching and the linkages between chains.
2 hours
Proteins
3 hours
Protein synthesis
1 hour
Mono- and polysaccharides
2 hours
Polymers and structure
12A.24.7 Know that the properties of polymers can be modified by the use of additives.
Unit 12AC.8

503 | Qatar science scheme of work | Grade 12 foundation | Unit 12AC.8 | Chemistry 8 © Education Institute 2005
Activities
Objectives Possible teaching activities Notes School resources
Give the class the general structure of an amino acid and ask them to identify the two functional groups (i.e. amine and carboxylic acid). Give them a list of the 20 amino acids used to make up proteins. Ask each student to build a ‘ball and stick’ model of two amino acids and join them together by elimination of a water molecule. Explain to the class the definition of a condensation reaction and a peptide bond, linking it to the work done in Grade 11 on nylons. Allow the whole class to join all their amino acid molecules together to form a protein. Explain how the order in which the different R groups occur in the molecule will determine which protein is formed.
Use this column to note your own school’s resources, e.g. textbooks, worksheets.
Ask students to work in pairs to reflux a sample of aspartame (e.g. Candarel) in hydrochloric acid. They can carry this work out as an investigation to determine the optimum time and conditions to carry out the hydrolysis. Tell them to follow the progress of the reaction using paper chromatography, standard solutions of aspartic acid and phenylaniline. Glacial ethanoic acid and butan-1-ol can be used as a solvent for the chromatography and ninhydrin in butan-1-ol can be used as a locating agent. Ask students to write structural formulae for the organic reactants and products.
Ask students to use the Internet or library to research and produce an account of electrophoresis and ion-exchange chromatography.
Safety: Ninhydrin is harmful and flammable, use in a fume cupboard and wear gloves. Ethanoic acid and hydrochloric acid are corrosive. Butan-1-ol is flammable and harmful.
Enquiry skills 12A.4.1, 12A.4.2 ICT opportunity: Use of the Internet.
2 hours
Proteins
Know that proteins are formed from combinations of 20 different amino acids through peptide bonds and that they have a variety of functions in living things. Know that they can be broken down by hydrolysis into their constituent amino acids, which can be separated by electrophoresis and ion-exchange chromatography.
Understand the importance of the shape of the protein molecule and the importance of hydrogen bonding and disulfide bridges in maintaining the shape; know that heating or treating with acid can destroy the shape (denaturing).
Ask students, individually, to download 3D diagrams of some key proteins (e.g. insulin) from the Internet. Ask them to print copies and mark areas where the structure is maintained by hydrogen bonding, disulfide bridges and ionic interactions. Give students the structures of the 20 amino acids used to make naturally occurring proteins. Ask them to classify these into groups responsible for the different types of bonding used to maintain protein shape (e.g. those with non-polar R groups, those with ionisable R groups, those with polar R groups and those with sulfur in the R group).
Ask students to work in pairs to investigate the effect of heat, acids and alkalis on egg white. Bring the individual results together as a whole class and, through question and answer, draw out an understanding of what is occurring when an enzyme is denatured.
ICT opportunity: Use of the Internet.
Enquiry skill 12A.1.8
Unit 12AC.8
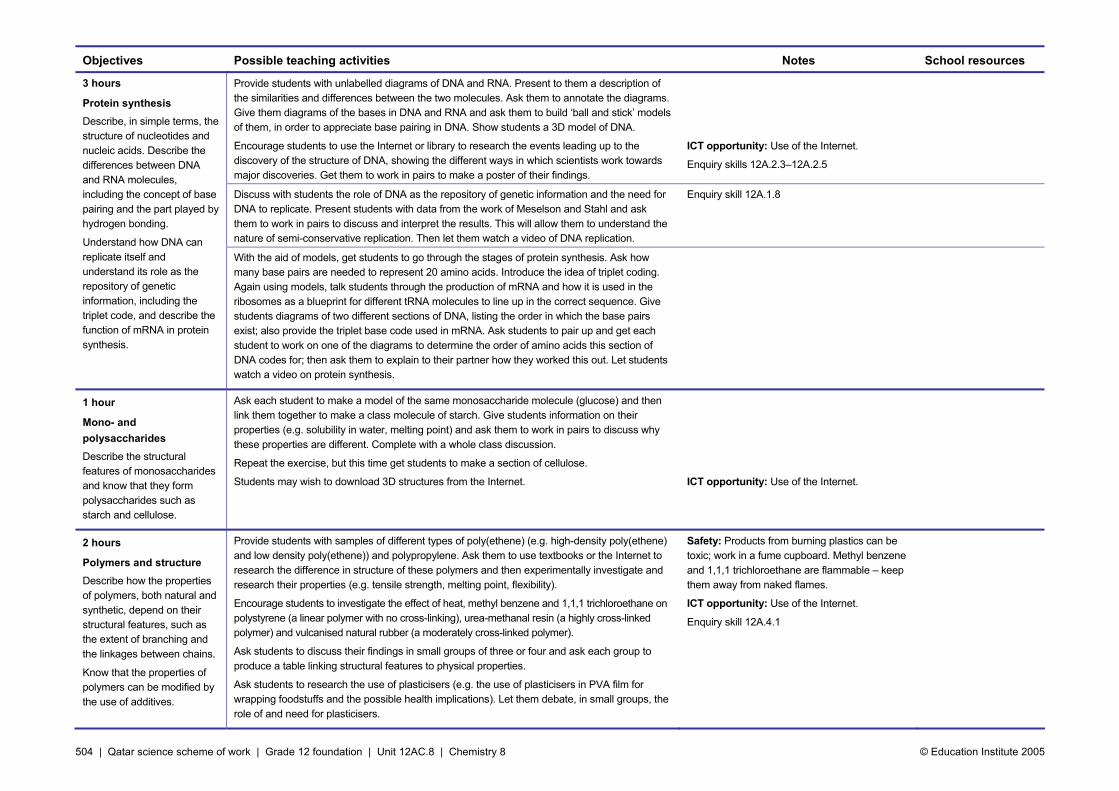
504 | Qatar science scheme of work | Grade 12 foundation | Unit 12AC.8 | Chemistry 8 © Education Institute 2005
Objectives Possible teaching activities Notes School resources
Provide students with unlabelled diagrams of DNA and RNA. Present to them a description of the similarities and differences between the two molecules. Ask them to annotate the diagrams. Give them diagrams of the bases in DNA and RNA and ask them to build ‘ball and stick’ models of them, in order to appreciate base pairing in DNA. Show students a 3D model of DNA.
Encourage students to use the Internet or library to research the events leading up to the discovery of the structure of DNA, showing the different ways in which scientists work towards major discoveries. Get them to work in pairs to make a poster of their findings.
ICT opportunity: Use of the Internet.
Enquiry skills 12A.2.3–12A.2.5
Discuss with students the role of DNA as the repository of genetic information and the need for DNA to replicate. Present students with data from the work of Meselson and Stahl and ask them to work in pairs to discuss and interpret the results. This will allow them to understand the nature of semi-conservative replication. Then let them watch a video of DNA replication.
Enquiry skill 12A.1.8
3 hours
Protein synthesis Describe, in simple terms, the structure of nucleotides and nucleic acids. Describe the differences between DNA and RNA molecules, including the concept of base pairing and the part played by hydrogen bonding.
Understand how DNA can replicate itself and understand its role as the repository of genetic information, including the triplet code, and describe the function of mRNA in protein synthesis.
With the aid of models, get students to go through the stages of protein synthesis. Ask how many base pairs are needed to represent 20 amino acids. Introduce the idea of triplet coding. Again using models, talk students through the production of mRNA and how it is used in the ribosomes as a blueprint for different tRNA molecules to line up in the correct sequence. Give students diagrams of two different sections of DNA, listing the order in which the base pairs exist; also provide the triplet base code used in mRNA. Ask students to pair up and get each student to work on one of the diagrams to determine the order of amino acids this section of DNA codes for; then ask them to explain to their partner how they worked this out. Let students watch a video on protein synthesis.
1 hour
Mono- and polysaccharides Describe the structural features of monosaccharides and know that they form polysaccharides such as starch and cellulose.
Ask each student to make a model of the same monosaccharide molecule (glucose) and then link them together to make a class molecule of starch. Give students information on their properties (e.g. solubility in water, melting point) and ask them to work in pairs to discuss why these properties are different. Complete with a whole class discussion.
Repeat the exercise, but this time get students to make a section of cellulose.
Students may wish to download 3D structures from the Internet.
ICT opportunity: Use of the Internet.
2 hours
Polymers and structure Describe how the properties of polymers, both natural and synthetic, depend on their structural features, such as the extent of branching and the linkages between chains.
Know that the properties of polymers can be modified by the use of additives.
Provide students with samples of different types of poly(ethene) (e.g. high-density poly(ethene) and low density poly(ethene)) and polypropylene. Ask them to use textbooks or the Internet to research the difference in structure of these polymers and then experimentally investigate and research their properties (e.g. tensile strength, melting point, flexibility).
Encourage students to investigate the effect of heat, methyl benzene and 1,1,1 trichloroethane on polystyrene (a linear polymer with no cross-linking), urea-methanal resin (a highly cross-linked polymer) and vulcanised natural rubber (a moderately cross-linked polymer).
Ask students to discuss their findings in small groups of three or four and ask each group to produce a table linking structural features to physical properties.
Ask students to research the use of plasticisers (e.g. the use of plasticisers in PVA film for wrapping foodstuffs and the possible health implications). Let them debate, in small groups, the role of and need for plasticisers.
Safety: Products from burning plastics can be toxic; work in a fume cupboard. Methyl benzene and 1,1,1 trichloroethane are flammable – keep them away from naked flames.
ICT opportunity: Use of the Internet.
Enquiry skill 12A.4.1

505 | Qatar science scheme of work | Grade 12 foundation | Unit 12AC.8 | Chemistry 8 © Education Institute 2005
Assessment
Examples of assessment tasks and questions Notes School resources
Write an account to describe the structural features of monosaccharides and explain how they form polysaccharides such as starch and cellulose
Read through the following account of DNA and protein synthesis, then write the most appropriate word or words in the gaps to complete the account
The DNA molecule is composed of ___________, sugar, phosphoric acid and four types of ___________ base. Within the molecule the bases are arranged in pairs held together by ___________ bonds. For example, adenine is paired with ___________. Adenine and guanine are examples of a group of bases known as ___________. The two strands of nucleotides are twisted around each other to form a double ___________ and in each turn of the spiral there are ___________ base pairs. The DNA controls the protein synthesis by the formation of a template known as ___________. Compared with DNA, the sugar component of this template is ___________, the base ___________ occurs instead of ___________ and the molecule consists of a ___________ chain of nucleotides. The template is stored temporarily in the ___________, before passing out into the cytoplasm of the cell. It becomes associated with organelles called ___________, which supply the ___________ required for protein synthesis. Transfer RNA molecules, each with an attached ___________, are lined up on the surface of the template according to their ___________ of ___________ bases. The amino acids are joined in a chain by ___________ links to form a polypeptide chain.
Biology examination question, Paper 1, No. 1, London Board, June 1985, in G, Toole and S. Toole, 1991, Understanding Biology for Advanced Level, 2nd edn, Nelson Thornes
Assessment Set up activities that allow students to demonstrate what they have learned in this unit. The activities can be provided informally or formally during and at the end of the unit, or for homework. They can be selected from the teaching activities or can be new experiences. Choose tasks and questions from the examples to incorporate in the activities.
Discuss how the extent of branching and the linkages between chains alter the properties of polymers.
Unit 12AC.8

506 | Qatar science scheme of work | Grade 12 foundation | Unit 12AC.8 | Chemistry 8 © Education Institute 2005
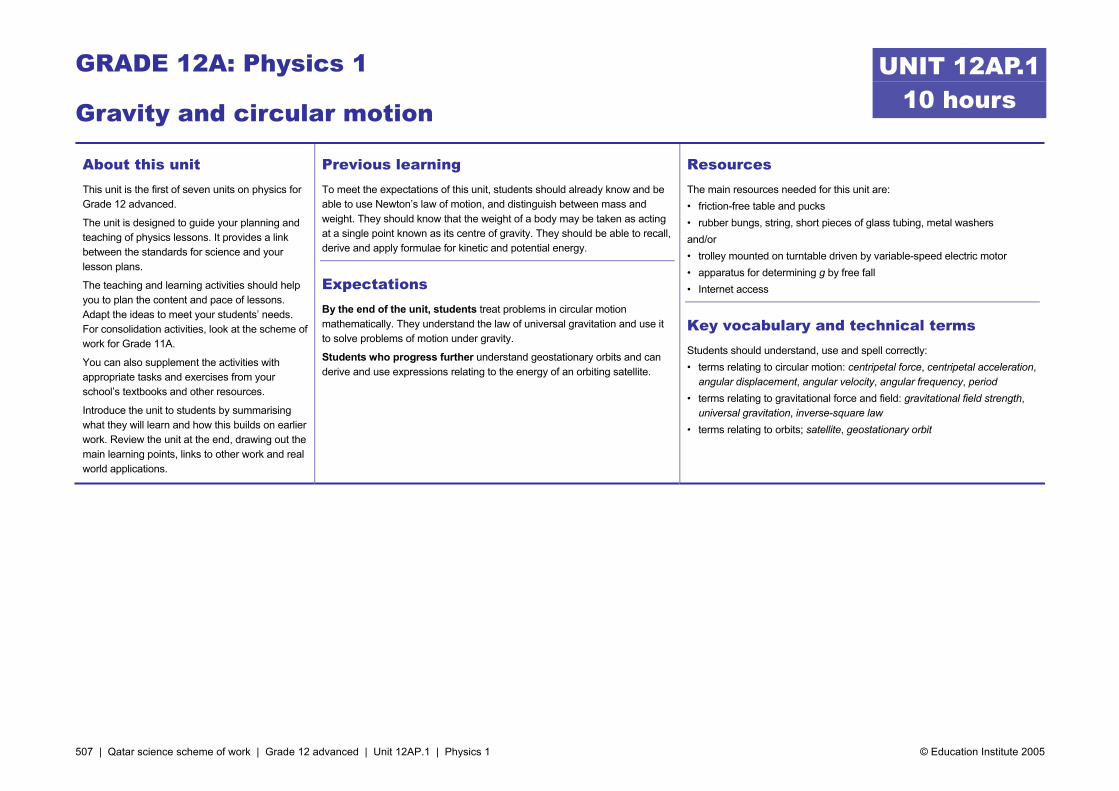
507 | Qatar science scheme of work | Grade 12 advanced | Unit 12AP.1 | Physics 1 © Education Institute 2005
GRADE 12A: Physics 1
Gravity and circular motion
About this unit This unit is the first of seven units on physics for Grade 12 advanced.
The unit is designed to guide your planning and teaching of physics lessons. It provides a link between the standards for science and your lesson plans.
The teaching and learning activities should help you to plan the content and pace of lessons. Adapt the ideas to meet your students’ needs. For consolidation activities, look at the scheme of work for Grade 11A.
You can also supplement the activities with appropriate tasks and exercises from your school’s textbooks and other resources.
Introduce the unit to students by summarising what they will learn and how this builds on earlier work. Review the unit at the end, drawing out the main learning points, links to other work and real world applications.
Previous learning To meet the expectations of this unit, students should already know and be able to use Newton’s law of motion, and distinguish between mass and weight. They should know that the weight of a body may be taken as acting at a single point known as its centre of gravity. They should be able to recall, derive and apply formulae for kinetic and potential energy.
Expectations By the end of the unit, students treat problems in circular motion mathematically. They understand the law of universal gravitation and use it to solve problems of motion under gravity.
Students who progress further understand geostationary orbits and can derive and use expressions relating to the energy of an orbiting satellite.
Resources The main resources needed for this unit are: • friction-free table and pucks • rubber bungs, string, short pieces of glass tubing, metal washers and/or • trolley mounted on turntable driven by variable-speed electric motor • apparatus for determining g by free fall • Internet access
Key vocabulary and technical terms Students should understand, use and spell correctly: • terms relating to circular motion: centripetal force, centripetal acceleration,
angular displacement, angular velocity, angular frequency, period • terms relating to gravitational force and field: gravitational field strength,
universal gravitation, inverse-square law • terms relating to orbits; satellite, geostationary orbit
UNIT 12AP.1 10 hours
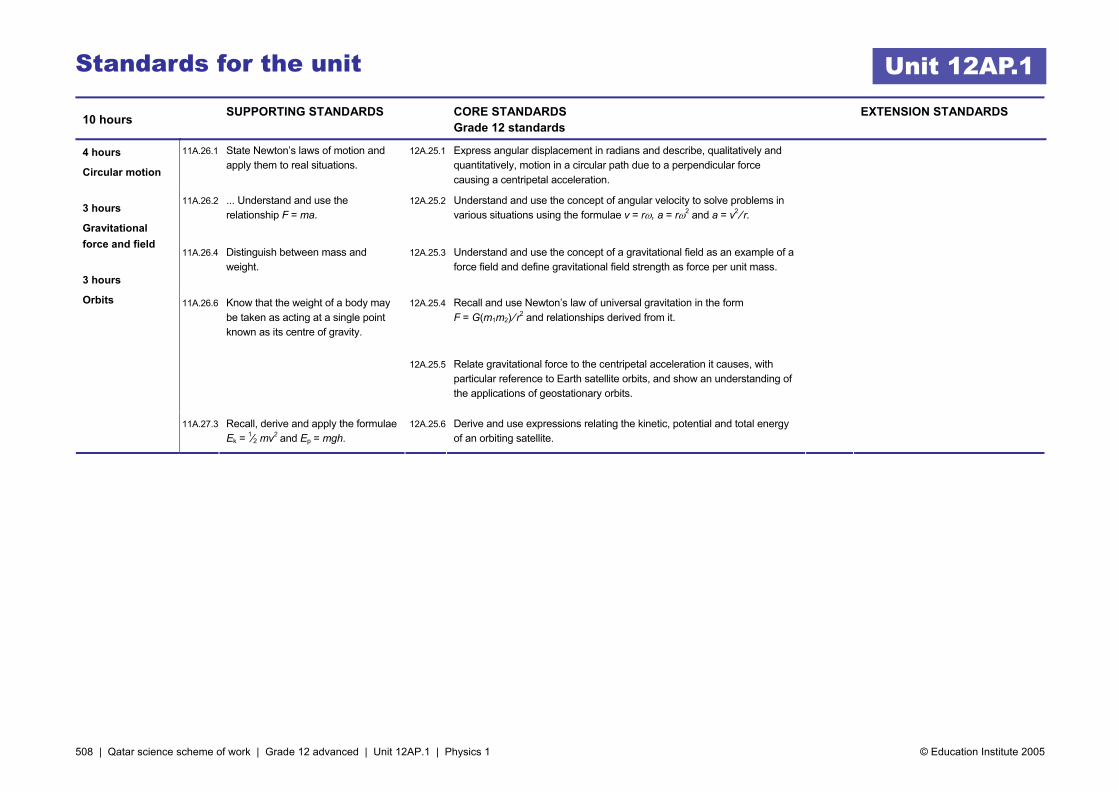
508 | Qatar science scheme of work | Grade 12 advanced | Unit 12AP.1 | Physics 1 © Education Institute 2005
Standards for the unit
10 hours SUPPORTING STANDARDS CORE STANDARDS
Grade 12 standards EXTENSION STANDARDS
11A.26.1 State Newton’s laws of motion and apply them to real situations.
12A.25.1 Express angular displacement in radians and describe, qualitatively and quantitatively, motion in a circular path due to a perpendicular force causing a centripetal acceleration.
11A.26.2 ... Understand and use the relationship F = ma.
12A.25.2 Understand and use the concept of angular velocity to solve problems in various situations using the formulae v = rω, a = rω2 and a = v2 ⁄ r.
11A.26.4 Distinguish between mass and weight.
12A.25.3 Understand and use the concept of a gravitational field as an example of a force field and define gravitational field strength as force per unit mass.
11A.26.6 Know that the weight of a body may be taken as acting at a single point known as its centre of gravity.
12A.25.4 Recall and use Newton’s law of universal gravitation in the form F = G(m1m2) ⁄ r2 and relationships derived from it.
12A.25.5 Relate gravitational force to the centripetal acceleration it causes, with particular reference to Earth satellite orbits, and show an understanding of the applications of geostationary orbits.
4 hours
Circular motion
3 hours
Gravitational force and field
3 hours
Orbits
11A.27.3 Recall, derive and apply the formulae Ek = 1⁄2 mv2 and Ep = mgh.
12A.25.6 Derive and use expressions relating the kinetic, potential and total energy of an orbiting satellite.
Unit 12AP.1
509 | Qatar science scheme of work | Grade 12 advanced | Unit 12AP.1 | Physics 1 © Education Institute 2005
Activities
Objectives Possible teaching activities Notes School resources
Changing direction Set up a friction-free table and show students the motion of a puck: given a gentle tap, it moves in a straight line at constant speed as described by Newton’s first law of motion. Ask students to suggest how the puck can be made to move in a curved path. They will probably suggest pushing it along a curve then releasing it and/or spinning the puck. Show that neither of these suggestions works. By suitable questioning, remind students that a change of direction entails a change of velocity, hence an acceleration, which requires the action of a resultant force as described by Newton’s second law of motion.
Demonstrate how a force can cause the puck to change direction without changing speed. This can be done either by a series of gentle taps at right-angles to the direction of motion or by tethering the puck to a fixed point so that the tension in the string provides a force. Show that when the force stops acting, the puck moves in a straight line along a tangent to the curve.
Introduce the term centripetal force. Establish that in any case of circular motion there must be a centripetal force acting. Present some pictures or actual examples of objects in circular motion and ask students to identity the source of the centripetal force.
Students will probably raise the question of centrifugal force (e.g. the sensation of being ‘flung outwards’ when in a vehicle going round a sharp bend at high speed). Explain that this sensation arises only because we feel the inward (centripetal) force from the side of the vehicle as we are pushed into a curved path: there is no outward force acting.
Use a spirit level to ensure that the table is horizontal.
Suitable examples for identifying centripetal force include: • an object being whirled around on the end of
a string (tension in the string); • a planet in (almost) circular orbit around the
Sun (gravitational attraction between Sun and planet);
• a hammer being swung by an athlete prior to release (tension in the athlete’s arms);
• a car driving round a bend (a combination of friction and the car–road reaction force).
Use this column to note your own school’s resources, e.g. textbooks, worksheets.
4 hours
Circular motion Express angular displacement in radians and describe, qualitatively and quantitatively, motion in a circular path due to a perpendicular force causing a centripetal acceleration.
Understand and use the concept of angular velocity to solve problems in various situations using the formulae v = rω, a = rω2 and a = v2 ⁄ r.
Angular motion On the board or OHP, introduce and define the terms needed to describe angular motion quantitatively: angular displacement, angular velocity, period, angular frequency. Establish that angular displacements are generally expressed in radians rather than degrees, as the radian is a ‘natural’ measure of angle based on the radius and arc length of a curve.
Show that the relationships between angular velocity, displacement and time have exactly the same form as those used to describe linear velocity and displacement.
Divide the class into teams. Hand out a sheet containing several short simple examples using equations of angular motion and conversions between radians and degrees. Challenge each team to complete these correctly in the shortest possible time.
Mathematics: A knowledge of angles measured in radians is required.
Prepare student worksheets.
Unit 12AP.1
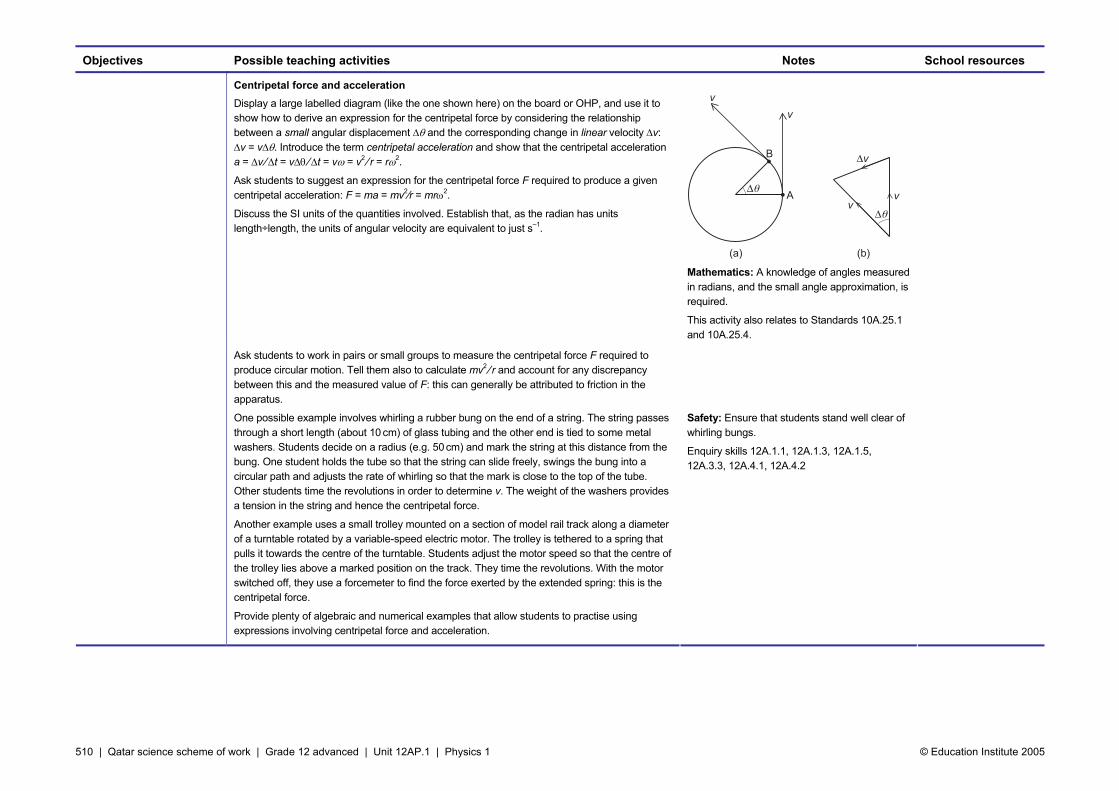
510 | Qatar science scheme of work | Grade 12 advanced | Unit 12AP.1 | Physics 1 © Education Institute 2005
Objectives Possible teaching activities Notes School resources
Centripetal force and acceleration Display a large labelled diagram (like the one shown here) on the board or OHP, and use it to show how to derive an expression for the centripetal force by considering the relationship between a small angular displacement ∆θ and the corresponding change in linear velocity ∆v: ∆v = v∆θ. Introduce the term centripetal acceleration and show that the centripetal acceleration a = ∆v ⁄ ∆t = v∆θ ⁄ ∆t = vω = v2 ⁄ r = rω2.
Ask students to suggest an expression for the centripetal force F required to produce a given centripetal acceleration: F = ma = mv2⁄r = mrω2.
Discuss the SI units of the quantities involved. Establish that, as the radian has units length÷length, the units of angular velocity are equivalent to just s–1.
Mathematics: A knowledge of angles measured in radians, and the small angle approximation, is required.
This activity also relates to Standards 10A.25.1 and 10A.25.4.
Ask students to work in pairs or small groups to measure the centripetal force F required to produce circular motion. Tell them also to calculate mv2 ⁄ r and account for any discrepancy between this and the measured value of F: this can generally be attributed to friction in the apparatus.
One possible example involves whirling a rubber bung on the end of a string. The string passes through a short length (about 10 cm) of glass tubing and the other end is tied to some metal washers. Students decide on a radius (e.g. 50 cm) and mark the string at this distance from the bung. One student holds the tube so that the string can slide freely, swings the bung into a circular path and adjusts the rate of whirling so that the mark is close to the top of the tube. Other students time the revolutions in order to determine v. The weight of the washers provides a tension in the string and hence the centripetal force.
Another example uses a small trolley mounted on a section of model rail track along a diameter of a turntable rotated by a variable-speed electric motor. The trolley is tethered to a spring that pulls it towards the centre of the turntable. Students adjust the motor speed so that the centre of the trolley lies above a marked position on the track. They time the revolutions. With the motor switched off, they use a forcemeter to find the force exerted by the extended spring: this is the centripetal force.
Provide plenty of algebraic and numerical examples that allow students to practise using expressions involving centripetal force and acceleration.
Safety: Ensure that students stand well clear of whirling bungs.
Enquiry skills 12A.1.1, 12A.1.3, 12A.1.5, 12A.3.3, 12A.4.1, 12A.4.2

511 | Qatar science scheme of work | Grade 12 advanced | Unit 12AP.1 | Physics 1 © Education Institute 2005
Objectives Possible teaching activities Notes School resources
Gravitational field Use a question and answer session or class discussion to introduce key ideas about gravitational fields. Begin by demonstrating one of the methods students encountered in Grade 10 to determine the acceleration due to gravity. Confirm that (provided air resistance is negligible) all objects in free fall close to the Earth’s surface have the same acceleration: g = 9.81 m s--2.
Introduce the term gravitational field and define gravitational field strength as force per unit mass. Establish that the field strength close to Earth’s surface is 9.81 N kg--1, and that this is necessarily the same as the gravitational acceleration so the symbol g is used. Discuss the SI units of g and ask students to show that 1 m s--2 = 1 N kg--1.
This activity also relates to Standard 10A.25.1 and 10A.25.3.
Universal gravitation Continuing the discussion from above, remind students of work in Grade 10 where they learned that an object’s weight can vary with its location (e.g. objects weigh less on the Moon than on Earth). Ask them to suggest what factors, in addition to an object’s own mass, might influence the gravitational force it experiences. It will be helpful to remind students that, as described by Newton’s third law of motion, this force arises from an interaction between two objects (e.g. the object and the Earth). With suitable prompting, students should be able to suggest that the force must depend on the masses of both interacting objects, i.e. F ∝ m1m2.
Students might also be able to suggest that the force may depend on the separation of the two objects. To illustrate that this must be the case, ask students to work in pairs through the following exercises.
What is the Moon’s centripetal acceleration in its near-circular orbit around the Earth?
What is the strength of the Earth’s gravitational field at the distance of the Moon?
How does this compare with the gravitational force per unit mass at the Earth’s surface?
Discuss how the force must depend on distance. Students might suggest that there is an inverse proportionality. Use results from the exercise above to illustrate that the force varies as the inverse-square of the distance between the centres of the two interacting objects, i.e. gravitational force and field strength obey an inverse-square law.
Establish that the force can be described mathematically by Newton’s law of universal gravitation, expressed mathematically as F = Gm1m2
⁄ r2, where G is the universal gravitational constant whose value has been determined by direct measurements of the force between two objects of known mass.
Point out that the above discussion is very similar to that used by Isaac Newton in formulating his law, and that Newton’s approach was revolutionary because it extended terrestrial physics to ‘heavenly bodies’, which were at the time believed to be governed by different laws.
Provide plenty of algebraic and numerical examples involving universal gravitation.
Data: • orbital period of moon = 27.3 days • orbital radius of moon = 3.84 × 10⁸ m • Earth’s radius = 6.38 × 10⁶ m
The orbital period will need to be expressed in seconds in order to get an acceleration in m s–2.
Enquiry skills 12A.2.1, 12A.2.2, 12A.2.5
This activity also relates to Standard 10A.25.1.
3 hours
Gravitational force and field Understand and use the concept of a gravitational field as an example of a force field and define gravitational field strength as force per unit mass.
Relate gravitational force to the centripetal acceleration it causes ...
Recall and use Newton’s law of universal gravitation in the form F = G(m1m2) ⁄ r2 and relationships derived from it.
Ask students to use library and Internet resources to research historical and modern methods of determining G (which is the least precisely known of all the fundamental constants). Each student should produce a written account of one method, including a bibliography listing the sources consulted.
ICT opportunity: Use of the Internet.
Enquiry skills 12A.1.6, 12A.1.8, 12A.2.1

512 | Qatar science scheme of work | Grade 12 advanced | Unit 12AP.1 | Physics 1 © Education Institute 2005
Objectives Possible teaching activities Notes School resources
Satellites Establish that a satellite is any object in orbit around a planet, and that satellites can be natural (moons) or artificial. Hold a short brainstorming session in which you ask students to think of uses for artificial satellites. List these on the board or OHP. They might include: • communications; • weather forecasting; • military intelligence; • astronomical telescopes; • land surveying; • satellite navigation for drivers, walkers and explorers.
Establish that, for some of these applications, a satellite should move relative to the Earth’s surface, but for others (e.g. communications) it is desirable that the orbit is geostationary.
Discuss how satellites are launched and establish that, in principle, this involves using a rocket to take the satellite to the desired height, then ejecting it horizontally at exactly the right speed to maintain an orbit. Ask students to suggest how this speed might be calculated: knowing the orbital radius r and way that gravitational field g varies with distance, for a circular orbit speed v must satisfy g = v2 ⁄ r.
Ask students to calculate the speed and orbital period of a near-Earth satellite, such as the space shuttle. They will need to know the Earth’s radius (given above) and use g = 9.81 N kg–1.
Challenge students, working in pairs, to derive an algebraic expression for the radius of a geostationary orbit and hence for the height above Earth’s surface. (Before they start, establish that the period must be 24 hours.) Then work through this derivation on the board or OHP.
3 hours
Orbits Relate gravitational force to the centripetal acceleration it causes, with particular reference to Earth satellite orbits, and show an understanding of the applications of geostationary orbits.
Derive and use expressions relating the kinetic, potential and total energy of an orbiting satellite.
Encourage students to download and use applets that illustrate how a satellite’s launch speed affects its orbit: if the launch speed is higher than that required for circular orbit, the satellite goes into elliptical orbit or might escape and never return; too low a speed also results in elliptical orbit, which in this case might intercept and crash into the Earth’s surface.
Point out that measurements of orbits provide us with the most reliable method of determining masses of planets and stars: knowing the size and period of an orbit allows the mass of the orbited object to be determined.
Provide examples that allow students to practise using relationships and data relating to orbits.
ICT opportunity: Use of the Internet and Java applets.
513 | Qatar science scheme of work | Grade 12 advanced | Unit 12AP.1 | Physics 1 © Education Institute 2005
Objectives Possible teaching activities Notes School resources
Energy Ask students to imagine that they are working on a satellite launch programme and need to calculate the amount of fuel required to raise a space vehicle to a given height and then eject a satellite at the desired speed. They might suggest calculating the increase in gravitational potential energy of the launch assembly using Ep = mgh and the satellite’s kinetic energy using Ek = ½mv2 then relating the total to the energy released when fuel is burned. Discuss the limitations of this approach: for anything other than a near-Earth orbit, the value of g changes significantly with height, so the simple expression E = mgh cannot be used.
Show how gravitational potential energy can be defined and calculated in an inverse-square law field. If students are familiar with calculus, show how the expression dE = Fdr with F = –Gm1m2
⁄ r2 can be integrated between limits r1 and r2. Explain the sign convention: if r is measured outwards from the Earth’s centre, then F acts in the opposite direction so is negative. Explain that it is convenient to define the zero of gravitational potential energy at r = ∞, which leads to the expression Ep = –Gm1m2
⁄ r for the gravitational potential energy of two masses separated by a distance r. This energy is always negative as, when two objects ‘fall’ towards each other, there is a loss of gravitational potential energy.
It is much more straightforward to find an expression for kinetic energy of an orbiting object and you could ask students to derive this for themselves. Using the expression for centripetal force (with m1 the mass of the satellite and m2 the mass of the Earth), m1v2 ⁄ r = Gm1m2
⁄ r2, hence Ek = ½ m1v2 = Gm1m2
⁄ 2r.
Ask students to combine the expressions for Ep and Ek to find the total energy of an orbiting satellite: E = –Gm1m2
⁄ r + Gm1m2 ⁄ 2r = –Gm1m2
⁄ 2r. Discuss the interpretation of this expression.
Provide some examples that allow students to consolidate their understanding of energy of orbiting satellites. Some of these can be algebraic and numerical but some should require a verbal explanation.
Mathematics: A knowledge of integral calculus is highly desirable.
If students are not familiar with integration, then it is possible to obtain a numerical expression for the change in Ep in an inverse-square law field by drawing a graph of F against r and finding the area beneath it by counting squares. Alternatively, simply present the expression Ep = –Gm1m2
⁄ r and discuss its meaning and application.
514 | Qatar science scheme of work | Grade 12 advanced | Unit 12AP.1 | Physics 1 © Education Institute 2005
Assessment
Examples of assessment tasks and questions Notes School resources
A road going round a bend is banked so that, at 50 km h–1, the centripetal force is provided only by the reaction force that acts at right-angles to the road surface.
a. Explain the advantage of driving along this section of road at exactly 50 km h–1.
b. The road surface is at 15° to the horizontal. What is the radius of the bend?
The Earth takes 1 year to move once around the Sun in a near-circular orbit of radius 1.50 × 10¹¹ m. What is the Earth’s centripetal acceleration?
Two students, each of mass 70 kg, stand 1.5 m apart. Calculate the size of the gravitational force between them.
Use the following data to calculate the mass of the Earth.
• Earth’s radius = 3.84 × 10⁸ m
• Gravitational field at Earth’s surface = 9.81 N kg--1
• G = 6.67 × 10--11 N m2 kg--2
Derive an algebraic expression for the radius of a geostationary orbit expressed in terms of the Earth’s mass and the universal gravitational constant.
Saturn’s satellite Titan has an orbital radius of 1.22 × 10⁹ m and a period of 1.38 × 10⁶. What is the mass of Saturn? (Use G = 6.67 × 10⁻¹¹ N m2 kg--2.)
Assessment Set up activities that allow students to demonstrate what they have learned in this unit. The activities can be provided informally or formally during and at the end of the unit, or for homework. They can be selected from the teaching activities or can be new experiences. Choose tasks and questions from the examples to incorporate in the activities.
A space vehicle in orbit loses energy because of viscous drag forces as it passes through the outer atmosphere. Explain carefully what happens to its total energy, its gravitational potential energy and its kinetic energy and hence say whether it gains or loses height.
Unit 12AP.1
515 | Qatar science scheme of work | Grade 12 advanced | Unit 12AP.2 | Physics 2 © Education Institute 2005
GRADE 12A: Physics 2
The nature of matter
About this unit This unit is the second of seven units on physics for Grade 12 advanced.
The unit is designed to guide your planning and teaching of physics lessons. It provides a link between the standards for science and your lesson plans
The teaching and learning activities should help you to plan the content and pace of lessons. Adapt the ideas to meet your students’ needs. For consolidation activities, look at the scheme of work for Grade 11A.
You can also supplement the activities with appropriate tasks and exercises from your school’s textbooks and other resources.
Introduce the unit to students by summarising what they will learn and how this builds on earlier work. Review the unit at the end, drawing out the main learning points, links to other work and real world applications.
Previous learning To meet the expectations of this unit, students should already know that a force can cause deformation, and know the relationship between force and a change of momentum. They should understand and use the term pressure. They should be able to describe the kinetic particle model for solids, liquids and gases, and define a mole of a substance in terms of the Avogadro constant. They should define temperature and explain how a temperature scale is constructed. They should be able to recall and use the formula for kinetic energy.
Expectations By the end of the unit, students classify solids according to stiffness, tensile strength, compressive strength and shear strength, plot and interpret stress–strain graphs for different solids and define and use Young’s modulus. They know how these properties are used by engineers and understand the usefulness of composite materials. They explain surface tension. They solve problems related to ideal gas behaviour and show mathematically the relationship between temperature and the kinetic energy of molecules.
Students who progress further explain qualitatively how fluid flow past solid bodies can give rise to pressure. They explain how the behaviour of real gases deviates from ideal behaviour at high pressures and low temperatures, and derive relationships between the molecular kinetic energy and the pressure, volume and temperature of an ideal gas.
Resources The main resources needed for this unit are: • blocks of upholstery foam • samples of materials for tensile and shear testing • large masses • apparatus for determining Young’s modulus of a wire • air blower • apparatus to show the Bernoulli effect in flowing water • simple wind tunnel (or apparatus to construct one using a fan or air-
blower) • apparatus to demonstrate Boyle’s law • apparatus to demonstrate Charles’s law • constant volume gas thermometer • Internet access
Key vocabulary and technical terms Students should understand, use and spell correctly: • terms relating to properties of solids: stiffness, stress, strain, strength,
tensile, compressive, shear, Young’s modulus, composite material • terms relating to fluids: surface tension, adhesion, cohesion, Bernoulli
effect • terms relating to gases: ideal gas, Boyle’s law, Charles’s law, absolute
temperature, absolute zero, universal gas constant, mean square speed, Boltzmann constant
UNIT 12AP.2 15 hours

516 | Qatar science scheme of work | Grade 12 advanced | Unit 12AP.2 | Physics 2 © Education Institute 2005
Standards for the unit
15 hours SUPPORTING STANDARDS CORE STANDARDS
Grade 12 standards EXTENSION STANDARDS
10A.26.3 Know that a force acting on an object can cause deformation ...
12A.26.1 Classify solids according to stiffness, tensile strength, compressive strength and shear strength. Plot and interpret stress–strain graphs for different solids. Define and use the concept of Young’s modulus.
12A.26.2 Relate the uses of materials to their characteristic behaviour under different types of stress and note the importance of composite materials, both natural and synthetic.
12A.26.3 Explain surface tension in terms of interparticle forces.
10A.27.7 Understand and use the term pressure...
12A.26.4 Explain qualitatively how fluid flow past solid bodies can generate pressure changes in the fluid; give practical examples of this.
10A.27.1 Describe the kinetic particle model for solids, liquids and gases, and relate the difference in the structures and densities of solids, liquids and gases to the spacing, ordering and motion of particles.
12A.26.5 Apply the kinetic particle model to an ideal gas and explain, in terms of molecular size and intermolecular forces, how the behaviour of real gases deviates from the ideal model at high pressures and low temperatures.
11A19.2 Define a mole of a substance in terms of the Avogadro constant ...
11A.28.1 Define temperature and explain how a temperature scale is constructed ...
12A.26.6 Derive, know and use the gas laws and the general gas equation PV = nRT and show how the general gas equation leads to a concept of absolute zero of temperature.
11A.26.2 Know that ... a momentum change on a body is equal to the force causing it.
6 hours
Properties of solids
6 hours
Ideal and real gases
3 hours
Fluids
11A.27.3 Recall, derive and apply the formulae 2
21
k mvE = …
12A.26.7 Show that a theoretical treatment of molecular movement and gas pressure leads to the relationship 2
31 cmNpV = and hence, by combining
with the gas equation, that the average kinetic energy of a particle is proportional to its absolute temperature.
Unit 12AP.2
517 | Qatar science scheme of work | Grade 12 advanced | Unit 12AP.2 | Physics 2 © Education Institute 2005
Activities
Objectives Possible teaching activities Notes School resources
Choosing materials Set up a display of objects made from a wide variety of materials. Ask students to visit each exhibit in turn and make brief notes in which they identify the types of material used (e.g. wood, metal, ceramic, polymer, textile) and suggest why each material was chosen for making that object.
After students have explored the display, hold a brainstorming session in which they suggest the types of question that a designer or engineer might consider when choosing a material for a particular purpose. Questions might include: • Is it waterproof? • Does it bend easily? • Does it stretch easily? • What does it look like? • How big a force can it withstand without breaking? • Does its production harm the environment? • How dense is it? • How much does it cost?
Explain that in this part of the unit most of the attention will be on how materials respond to forces – though many of the other questions suggested are also relevant in practice to the choice of materials. By suitable questioning, find out how much students recall of work in earlier units in which they tested material samples, and remind them of Hooke’s law.
Suitable objects include: cooking utensils, clothing, footwear, bicycle, sports equipment, packaging.
Use pictures if actual objects are unobtainable.
Use this column to note your own school’s resources, e.g. textbooks, worksheets.
6 hours
Properties of solids Classify solids according to stiffness, tensile strength, compressive strength and shear strength. Plot and interpret stress–strain graphs for different solid. Define and use the concept of Young’s modulus.
Relate the uses of materials to their characteristic behaviour under different types of stress and note the importance of composite materials, both natural and synthetic.
Stress and strain Use blocks of upholstery foam to demonstrate how the dimensions of a sample affect the deformation produced by a force.
First use two blocks of the same height but different cross-sectional area. Place a sheet of stiff card on top of each, and the same load on top of each card. Students should observe that the narrower block experiences the greater deformation: if it has half the area of cross-section it experiences twice the deformation. Increase the load on the wider block so as to produce the same deformation of each block. Establish that if both blocks have the same load ÷ area, they experience equal deformation.
Introduce the term stress defined as force ÷ area. Discuss the SI units of stress and establish that (recalling work on pressure from earlier grades) they can be expressed as N m--2 or Pa.
Next use two blocks of the same cross-sectional area but different height. As before, give each the same load. The shorter block experiences a smaller deformation. Establish that deformation ÷ original height is the same for each block.
Introduce the term strain defined as change in length ÷ original length. Discuss its units and point out that strain is length ÷ length so has no units. Establish that strain can be expressed as a ratio, a fraction, a decimal number or a percentage.
The foam blocks should all be made for the same material (ideally all cut from a single larger block).
Suitable dimensions for the blocks are: • 10 cm × 10 cm × 10 cm; • 20 cm × 10 cm × 10 cm; • 10 cm × 10 cm × 5 cm.
Arrange the blocks with their largest dimensions horizontal, otherwise they may buckle under a load.
You will need to experiment beforehand to find suitable loads to produce noticeable deformation without flattening the blocks. Sets of 100 g hanger masses are a good starting point.
This activity also relates to Standard 10A.25.1.
Unit 12AP.2
518 | Qatar science scheme of work | Grade 12 advanced | Unit 12AP.2 | Physics 2 © Education Institute 2005
Objectives Possible teaching activities Notes School resources
Ask students what results they would expect if differently shaped samples of a given material were all subject to the same stress (they would each experience the same strain). Ask what they would expect if samples of a second material were also subject to the same stress (the resulting strain would probably differ from that found for the first material).
Establish that measuring stress and strain enable the properties of different materials to be compared reliably, even though the samples might have different dimensions.
Point out that these examples with the foam blocks involve compressive stress and strain.
Provide students with some examples that allow them to practise calculations relating stress to force and area, and relating stress to deformation and original length.
Testing materials Ask students to work in pairs, each using a sample of a different material, to investigate how strain depends on the applied tensile stress. Provide basic apparatus then encourage students to design and modify their experiments so as to ensure accuracy and precision and to obtain results as efficiently as possible.
Students should obtain and tabulate data for a range of applied loads. They should explore what happens when a load is removed (does the sample return to its original length?) and should, where possible, increase the load until the sample breaks. They should plot a graph to show the relationship between stress and strain. Photocopy the graphs and distribute to the whole class.
Suitable materials include: metal wires (e.g. copper, steel), nylon, polythene.
Safety: Goggles should be worn to protect against injury when samples fail under high tension.
Enquiry skills 12A.1.1, 12A.1.3–12A.1.5, 12A.3.1–12A.3.3, 12A.4.1, 12A.4.2
This activity also relates to Standard 10A.25.2.
Young’s modulus and breaking stress Discuss the graphs obtained in the previous activity with the whole class and draw attention to key features. Close to the origin, most graphs will approximate to straight lines, and for some materials this behaviour continues until the sample nears breaking point. Establish that if stress is directly proportional to strain, the material obeys Hooke’s law, which students should recall as a direct proportion between force and extension.
Introduce Young’s modulus E = σ ⁄ ε, where σ is stress and ε is strain and establish that it is the gradient of the part of a stress–strain graph where Hooke’s law is obeyed. Discuss the SI units of Young’s modulus and establish that they are the same as the units of stress: N m–2 or Pa.
Ask students how they would describe the difference between materials with a small and a large Young’s modulus. A material with large E requires a large stress to produce even a small strain; it is very stiff. The term stiffness is sometimes used loosely in place of Young’s modulus (though it can also be used to mean k in the expression F = kx).
If available, show students apparatus specially made to measure Young’s modulus for a metal wire. Point out the features designed to increase accuracy and precision (e.g. Vernier scale). If time allows, let students use this apparatus themselves.
Return to the discussion of the graphs. Point out that some samples were tested to destruction, and define the tensile strength or ultimate tensile stress as the maximum stress that a material can withstand before breaking.
Provide plenty of algebraic and numerical examples that allow students to practise calculations involving stress, strain and Young’s modulus.
This also relates to Standard 10A.25.1
519 | Qatar science scheme of work | Grade 12 advanced | Unit 12AP.2 | Physics 2 © Education Institute 2005
Objectives Possible teaching activities Notes School resources
Shear Use foam blocks to demonstrate how a material can be sheared, and define shear stress and strain. Using a labelled diagram, show that deformation is measured at right-angles to the length of a sample and so (for small deformations) shear strain corresponds to an angle measured in radians.
Ask students to work in pairs or small groups to design and carry out a test to see how a material behaves under shear stress. Tell them to produce a written report of their work explaining how they attempted to ensure accuracy and precision in their measurements.
Mathematics: A knowledge of angles measured in radians is required.
Enquiry skills 12A.1.1–12A.1.5, 12A.3.1–12A.3.4, 12A.4.1.
This activity also relates to Standard 10A.25.2.
Composites
Assign each student, or pair of students, a natural or synthetic composite material (e.g. wood, concrete, fibreglass resin). Tell them to use the Internet and library resources to research information about the material, addressing such questions as: • What is its composition? • What does it look like on a small scale? • How do its properties differ from those of its individual components? • What is it used for?
Ask students to produce an informative poster summarising their findings.
Hold a conference-style poster session. Display the posters around the room and allow students time to visit one another’s posters and discuss their work.
ICT opportunity: Use of the Internet.
Enquiry skills 12A.1.8, 12A.3.4
Surface tension
Set up a circus of activities illustrating the effects of surface tension. For each, provide brief instructions telling students what to do and what to look for. They should visit each in turn and make notes.
Introduce and define the term surface tension. Ask students to suggest explanations for their observations in terms of the kinetic particle model. Introduce the terms adhesion and cohesion to describe the observations.
Suitable examples include: • observe the meniscus on water and on mercury;• observe water rising up a capillary tube; • sprinkle fine power on the surface of water
then add a drop of detergent; • blow bubbles using different soap and
detergent solutions.
3 hours
Fluids Explain surface tension in terms of interparticle forces.
Explain qualitatively how fluid flow past solid bodies can generate pressure changes in the fluid; give practical examples of this. Fluid flow
Carry out a series of demonstrations to show that the flow of a fluid (liquid or gas) gives rise to the Bernoulli effect (i.e. there is a drop in pressure transverse to the flow). Suitable examples include the following. • Each student holds a sheet of A4 paper by one short edge so that it forms a curved surface,
then blows gently over it. • Each student holds two sheets of A4 paper by their short edges so that they hang vertically a
few centimetres apart, then blows gently between them. • Place a table-tennis ball in a fast-moving air stream from a blower. Tilt the blower and show
that the ball remains supported even when the air-stream is almost horizontal.
520 | Qatar science scheme of work | Grade 12 advanced | Unit 12AP.2 | Physics 2 © Education Institute 2005
Objectives Possible teaching activities Notes School resources
Use specially designed apparatus to demonstrate the Bernoulli effect. Water flows through a horizontal tube with a narrow section. Vertical tubes indicate the transverse pressure, which is lowest where the water flows fastest. Relate the difference in pressure (and hence in force) to the change in the water’s velocity as it enters and leaves the narrow section.
Ask students to suggest other examples of the Bernoulli effect in operation. Explain how the shape of an aerofoil can help generate lift.
Note that the Bernoulli effect is not primarily responsible for the lift of an aircraft wing. Rather, a downward deflection of air from the lower surface produces an upward force.
If time and apparatus permit, ask students to work in teams to plan and carry out wind-tunnel tests of different aerofoil sections to investigate the lift produced. Ask them to try to predict and explain their results, and to produce a written report of the procedure adopted, apparatus used and results obtained.
Enquiry skills 12A.1.1–12A.1.5, 12A.3.1–12A.3.4, 12A.4.1, 12A.4.2
Boyle’s law Using specially designed demonstration apparatus, obtain data to show how the volume, V, of a fixed mass of gas depends on its pressure, p. Ask students to plot graphs of p against V, and p against 1 ⁄ V. Establish that, for a fixed mass of gas at constant temperature, pV is a constant (i.e. Boyle’s law is obeyed).
In practice, the data may deviate from Boyle’s law. Ask students to use the kinetic particle model to suggest explanations. In order to increase the pressure, a force is applied to the gas (i.e. work is done) and energy is supplied, so the gas temperature rises and the gas tends to expand. If the gas is allowed to return to room temperature after each change in pressure, then deviations from Boyle’s law are reduced.
Provide students with some examples that allow them to practise using Boyle’s law in calculations.
If there is enough apparatus, students should work in pairs to obtain their own data.
Absolute temperature Set up and demonstrate apparatus to how the volume of a fixed mass of gas changes with temperature measured in °C. Similarly, use a constant volume gas thermometer to demonstrate how pressure depends on temperature.
Ask students to plot graphs of volume against temperature, and pressure against temperature, and establish that the volume and pressure each vary linearly with temperature.
If there is enough apparatus, students should work in pairs to obtain their own data.
This activity also relates to Standard 10A.25.1.
Discuss and show how the graphs can be extrapolated to find the temperature at which p and V become zero. Tell students that this temperature is called absolute zero and is found to be close to –273 °C. Point out that, in practice, the volume of a gas cannot become zero (its molecules have finite size), and that real gases condense to liquids before reaching absolute zero, so the extrapolation strictly applies only ‘ideal’ gases. (However, absolute zero is still a meaningful concept and, as will be seen later in this unit, can be understood in terms of molecular kinetic energy.)
6 hours
Ideal and real gases Derive, know and use the gas laws and the general gas equation PV = nRT and show how the general gas equation leads to a concept of absolute zero of temperature.
Show that a theoretical treatment of molecular movement and gas pressure leads to the relationship
231 cmNpV = and hence, by
combining with the gas equation, that the average kinetic energy of a particle is proportional to its absolute temperature.
Apply the kinetic particle model to an ideal gas and explain, in terms of molecular size and intermolecular forces, how the behaviour of real gases deviates from the ideal model at high pressures and low temperatures.
Explain how the existence of absolute zero enables a scale of absolute temperature to be defined. Establish that the SI unit of absolute temperature, T, is the kelvin, K, and that a temperature change of 1 K is exactly equal to a change of 1 °C.
Use several quick-fire oral questions to give students practice in converting between temperatures expressed in K and in °C.

521 | Qatar science scheme of work | Grade 12 advanced | Unit 12AP.2 | Physics 2 © Education Institute 2005
Objectives Possible teaching activities Notes School resources
Gas laws Refer to the previous activity and ask students to sketch graphs showing how pressure and volume of a fixed mass of gas depend on absolute temperature, T.
Introduce Charles’s law: V ∝ T for a fixed mass of gas at constant pressure. Similarly, state the pressure law: p ∝ T for a fixed mass of gas whose volume is constant.
On the board or OHP, show how these two laws can be combined with Boyle’s law to produce pV ∝ T. Discuss the point that pV must also be proportional to the amount of gas present: doubling the amount will double the volume at a given pressure. But ‘amount’ is a loose term, so explain that, more precisely, the relationship is expressed in terms of the number, n, of moles present. This leads to the ideal gas equation pV = nRT, which defines the value of the universal gas constant, R.
Show students that the SI units of pV are 1 N m–2 × 1 m3 = 1 N m = 1 J. Ask students to deduce the SI units of R.
Point out that the behaviour of real gases can deviate markedly from that described by the ideal gas equation, particularly when they are close to condensing, but that in solving problems it is often useful to assume ideal behaviour.
Provide several examples of algebraic and numerical calculations that allow students to practise using the ideal gas equation.
This activity also relates to Standards 10A.25.1 and 10A.25.3.
Molecular behaviour
On the board or OHP, show students how the pressure of a gas can be related to the motion of its molecules and hence derive the equation 2
31 cmnpV = .
To make this derivation more engaging and interactive, pause frequently and ask students questions to check that they have understood each step, and questions that anticipate the next step.
Start by considering a single molecule mass m travelling at speed c parallel to one edge of a rectangular box of dimensions x × y × z = V and repeatedly making elastic collisions with one face.
Derive expressions for the momentum change at each collision (2mc) and for the time interval between collisions (2x ⁄ c), and hence expressions for the force exerted on one face (mc2 ⁄ x) and for the pressure exerted on that face (mc2 ⁄ xyz = mc2 ⁄ V).
Work through an argument to derive the pressure, p, exerted by N molecules, of which one-third will, on average, be travelling at speed c in each of three perpendicular directions (p = mc2 ⁄ 3V).
Explain that, in practice, there will be a range of speeds, so we must use the average value of c2 (i.e. the ‘mean square speed’), represented as 2c .
Show how to combine the final expression with the ideal gas equation to get Nm 2c ⁄ 3 = nRT.

522 | Qatar science scheme of work | Grade 12 advanced | Unit 12AP.2 | Physics 2 © Education Institute 2005
Objectives Possible teaching activities Notes School resources
Show that, as N ⁄ n is equal to the Avogadro number NA (the number of molecules per mole), we can write m 2c ⁄ 3 = RT ⁄ NA = kT, where k (= R ⁄ NA) is the Boltzmann constant. Hence show how to relate the average molecular kinetic energy Ek to absolute temperature:
23221
k kTcmE ==
Establish that this expression allows another interpretation of absolute zero: it is the temperature at which molecular motion ceases.
Ask students to derive the SI units of k (i.e. J K–1).
Work through some examples of calculations relating molecular kinetic energy to temperature, pressure and density, and give students some numerical and algebraic examples that allow them to practise using the relationships.
To avoid confusion between the number of moles (e.g. in the ideal gas equation) and the number of molecules, use N rather than n to represent the number of molecules.
Real gases Point out to students that all the relationships listed above apply to ideal gases. Establish that in such a gas the molecules: • make frequent elastic collisions with each other and the walls of their container; • exert no forces on one another except while in contact; • are in contact for a very short time compared with the time between collisions; • have a very small volume compared with the volume available for them to move in.
Ask students, in small groups, to list differences between real and ideal gas molecules, and suggest how these might affect the equations describing their behaviour.
Hold a reporting back session to collect ideas together. The main points are that molecules do exert long-range forces on one another (the van der Waals force) and they occupy a finite volume. These factors become particularly important when the pressure of a gas is high and/or the temperature is low (i.e. it is close to condensing). In practice, a real gas behaves most like an ideal gas when the pressure is low and the temperature high. Students should appreciate that, in solving problems, it is usually convenient to assume ideal gas behaviour.
With more advanced students, it might be appropriate to introduce and discuss the van der Waals gas equation.
This activity relates to Standard 10A.25.3.

523 | Qatar science scheme of work | Grade 12 advanced | Unit 12AP.2 | Physics 2 © Education Institute 2005
Objectives Possible teaching activities Notes School resources
In addition to, or in place of, the examples suggested here, include at least one example relating to Islamic science and scientists.
Enquiry skills 12A.1.6, 12A.1.8, 12A.2.1, 12A.2.2, 12A.2.4, 12A.2.5, 12A.2.6
Understanding particles Ask students, in small groups, to use the Internet and library resources to research historical developments of theories about particles. Allocate each group a different task and tell them to prepare a ten-minute PowerPoint presentation (including an aknowledgment of sources consulted). Suitable tasks include the following. • The idea that matter is made up of tiny indivisible particles originated with the ancient Greeks.
Who were the main people famous for recording this idea? How did the ancient Greek ideas compare with our modern view of atoms?
• Modern ideas about atoms can be traced back to the European scientist John Dalton. When did he live? What were his ideas about atoms?
• Even as recently as 1900, many scientists did not believe atoms existed. Albert Einstein carried out some important work that convinced most people that atoms were real. What did he do?
• Scientists today believe that all matter is made up of particles, and that some particles are ‘fundamental’ (cannot be divided further). Which particles are currently believed to be fundamental? When were they discovered?
Hold a conference in which each group presents its work to the rest of the class. The presentations should be made in chronological order. Allow time for questions after each presentation. Bring out the point that our understanding of the nature of matter has developed unevenly through history, with the postulation of major theories being followed by long periods of slow development. Some theories are abandoned permanently, whereas others (such as Greek atomic ideas) are discarded then ‘reinvented’.
As a follow-up to the conference, discuss with students the apparent contradiction between the random behaviour of the particles believed to make up the Universe, and the deterministic nature of major world religions. First establish some rules of behaviour: students should respect one another’s views, even though they may disagree strongly; in later conversations outside the classroom, views expressed during the discussion must not be attributed to individuals.
Then encourage students to express their views and to ask questions of you and one another. Do not attempt to resolve the paradox at this stage; as students will learn in later units, random behaviour can still be described by definite laws.

524 | Qatar science scheme of work | Grade 12 advanced | Unit 12AP.2 | Physics 2 © Education Institute 2005
Assessment
Examples of assessment tasks and questions Notes School resources
A student estimates that the total cross-sectional area of his leg bones is 20 cm2. His mass is 70 kg. What is the stress in his leg bones when he stands on both feet?
A metal wire of diameter 0.5 mm and length 4.0 m extends by 3.0 mm when the applied tension is 75 N. What is the Young’s modulus of this metal?
Using the terms adhesion and cohesion, and with the help of labelled diagrams, explain why water rises up a narrow tube whereas mercury does not.
A bubble of gas, diameter 2 mm, is trapped in a container of liquid at normal atmospheric pressure (1 × 10⁵ Pa) and a temperature of 25 °C. The container is opened on board an aircraft where the temperature is 22 °C and the surrounding pressure is 0.9 × 10⁵ Pa. What is the diameter of the bubble as it escapes from the liquid?
Assessment Set up activities that allow students to demonstrate what they have learned in this unit. The activities can be provided informally or formally during and at the end of the unit, or for homework. They can be selected from the teaching activities or can be new experiences. Choose tasks and questions from the examples to incorporate in the activities.
What is the average kinetic energy of molecules in the air at room temperature 25 °C? At this temperature, what is the average speed of an oxygen molecule? Use k = 1.38 × 10 J K–1. Mass of oxygen molecule (O2) m = 32 × 1.67 × 10–27 kg.
Unit 12AP.2

525 | Qatar science scheme of work | Grade 12 advanced | Unit 12AP.3 | Physics 3 © Education Institute 2005
GRADE 12A: Physics 3
Thermodynamics
About this unit This unit is the third of seven units on physics for Grade 12 advanced.
The unit is designed to guide your planning and teaching of physics lessons. It provides a link between the standards for science and your lesson plans.
The teaching and learning activities should help you to plan the content and pace of lessons. Adapt the ideas to meet your students’ needs. For consolidation activities, look at the scheme of work for Grade 11A.
You can also supplement the activities with appropriate tasks and exercises from your school’s textbooks and other resources.
Introduce the unit to students by summarising what they will learn and how this builds on earlier work. Review the unit at the end, drawing out the main learning points, links to other work and real world applications.
Previous learning To meet the expectations of this unit, students should already be able to define work and apply the concept of work as the product of a force and displacement in the direction of a force. They should be able to define kinetic and potential energy, and describe the principle of energy conservation and apply it to simple examples. They should know and be able to use the general gas equation PV = nRT, and know that this equation leads to a concept of absolute zero of temperature. They should know that the average kinetic energy of a particle is proportional to its absolute temperature.
Expectations By the end of the unit, students understand the concept of absolute zero of temperature and can relate changes in internal energy, heat changes and work done on a thermodynamic system. They relate entropy to disorder and describe the second law of thermodynamics, and its consequences in terms of entropy.
Students who progress further calculate work done by a gas expanding against constant pressure, and understand internal energy in terms of the energies of molecules. They know that the second law of thermodynamics imposes limits on the efficiency of any heat engine.
Resources The main resources needed for this unit are: • bicycle pumps • bicycle inner tubes (with valves intact) • film or video clips showing simple processes running both forwards and in
reverse
Key vocabulary and technical terms Students should understand, use and spell correctly: • terms relating to energy and temperature: absolute zero, absolute
temperature • terms relating to the first law of thermodynamics: thermodynamic system,
work, internal energy, adiabatic, isothermal • terms relating to the second law of thermodynamics: entropy, irreversible
process, reversible process, heat engine, heat source, heat sink
UNIT 12AP.3 11 hours
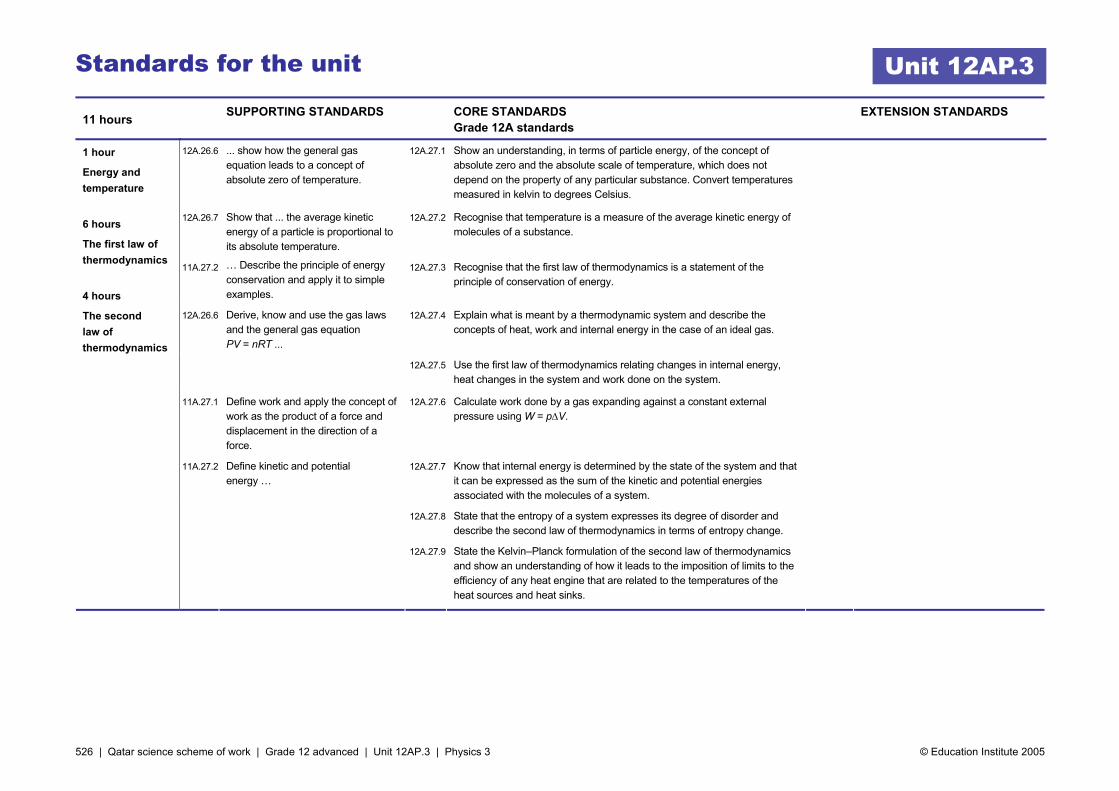
526 | Qatar science scheme of work | Grade 12 advanced | Unit 12AP.3 | Physics 3 © Education Institute 2005
Standards for the unit
11 hours SUPPORTING STANDARDS CORE STANDARDS
Grade 12A standards EXTENSION STANDARDS
12A.26.6 ... show how the general gas equation leads to a concept of absolute zero of temperature.
12A.27.1 Show an understanding, in terms of particle energy, of the concept of absolute zero and the absolute scale of temperature, which does not depend on the property of any particular substance. Convert temperatures measured in kelvin to degrees Celsius.
12A.26.7 Show that ... the average kinetic energy of a particle is proportional to its absolute temperature.
12A.27.2 Recognise that temperature is a measure of the average kinetic energy of molecules of a substance.
11A.27.2 … Describe the principle of energy conservation and apply it to simple examples.
12A.27.3 Recognise that the first law of thermodynamics is a statement of the principle of conservation of energy.
12A.26.6 Derive, know and use the gas laws and the general gas equation PV = nRT ...
12A.27.4 Explain what is meant by a thermodynamic system and describe the concepts of heat, work and internal energy in the case of an ideal gas.
12A.27.5 Use the first law of thermodynamics relating changes in internal energy, heat changes in the system and work done on the system.
11A.27.1 Define work and apply the concept of work as the product of a force and displacement in the direction of a force.
12A.27.6 Calculate work done by a gas expanding against a constant external pressure using W = p∆V.
11A.27.2 Define kinetic and potential energy …
12A.27.7 Know that internal energy is determined by the state of the system and that it can be expressed as the sum of the kinetic and potential energies associated with the molecules of a system.
12A.27.8 State that the entropy of a system expresses its degree of disorder and describe the second law of thermodynamics in terms of entropy change.
1 hour
Energy and temperature
6 hours
The first law of thermodynamics
4 hours
The second law of thermodynamics
12A.27.9 State the Kelvin–Planck formulation of the second law of thermodynamics and show an understanding of how it leads to the imposition of limits to the efficiency of any heat engine that are related to the temperatures of the heat sources and heat sinks.
Unit 12AP.3

527 | Qatar science scheme of work | Grade 12 advanced | Unit 12AP.3 | Physics 3 © Education Institute 2005
Activities
Objectives Possible teaching activities Notes School resources
1 hour
Energy and temperature Show an understanding, in terms of particle energy, of the concept of absolute zero and the absolute scale of temperature, which does not depend on the property of any particular substance. Convert temperatures measured in kelvin to degrees Celsius.
Recognise that temperature is a measure of the average kinetic energy of molecules of a substance.
Energy and temperature Give students a handout with about ten statements relating to temperature and molecular kinetic energy to remind students of their earlier work. Some statements should be true, others false. Some should involve converting between temperatures in K and °C. Ask students to work in pairs to decide which they think are true and to correct any they think are false.
Discuss students’ responses and ensure each has a record of a correct set of statements.
Prepare a handout for students. Suitable statements include: • Absolute zero is 0 K = –373 °C. (false) • Temperature is a measure of average
molecular kinetic energy. (true)
If the teaching of this unit follows immediately after Unit 12AP.2, it will not be necessary to spend much time on this activity.
Use this column to note your own school’s resources, e.g. textbooks, worksheets.
Understanding heat Ask students, in pairs or individually, to use library and Internet resources to research the development of ideas about heat, energy and work. Allocate topics so that each pair or individual researches a different person or a different theory. Tell them to prepare a 5- to10-minute presentation to the rest of the class using PowerPoint and/or other visual aids. They should also write a bibliography giving full details of the sources consulted.
Suitable topics include the following: • J. P. Joule and his experiments on heat. • The caloric theory of heat. • How did the invention and use of the steam engine influence ideas about energy and heat? • What were Kelvin’s contributions to present-day ideas about heat and temperature? • Ancient theories about the ‘elements’: fire, earth, air and water.
Organise the rest of the lessons in this topic so that each includes one or two presentations. Either schedule the presentations in chronological order or arrange that, where possible, presentations are linked with the material being covered in the rest of the lesson. Allow a few minutes for questions after each presentation. Depending on the numbers involved, it might be necessary to devote some lessons towards the end of the topic entirely to presentations.
Where relevant, draw students’ attention to the factors affecting the development of scientific work (e.g. the invention of steam-powered machinery stimulated thinking about energy, work and efficiency) and the way theories change with time (e.g. the caloric theory prevailed for a long time before being overthrown).
ICT opportunity: Use of the Internet an PowerPoint.
In addition to, or in place of, the examples suggested here include at least one example relating to Islamic science and scientists.
Enquiry skills 12A.1.6, 12A.1.8, 12A.2.1–12A.2.5, 12A.3.4
6 hours
The first law of thermodynamics Recognise that the first law of thermodynamics is a statement of the principle of conservation of energy.
Explain what is meant by a thermodynamic system and describe the concepts of heat, work and internal energy in the case of an ideal gas.
Use the first law of thermodynamics relating changes in internal energy, heat changes in the system and work done on the system.
[continued]
Unit 12AP.3

528 | Qatar science scheme of work | Grade 12 advanced | Unit 12AP.3 | Physics 3 © Education Institute 2005
Objectives Possible teaching activities Notes School resources
Energy conservation
Demonstrate some of the energy transducers that students used in Grade 11. Ask students to describe the energy conversions and to sketch Sankey diagrams. Ask them how they would calculate the efficiency of each device. By means of suitable questioning, ensure that students are familiar with the definition of work, the distinction between heat and temperature, and the principle of conservation of energy.
Explain what is meant by a thermodynamic system. Define ∆Q as the heat leaving a system, ∆U as the increase in internal energy and ∆W as the work done on the system. Ensure that students know the meaning of the ∆ symbol.
Briefly discuss each quantity in turn and, by suitable questioning, make links with students’ earlier work. Establish that internal energy can be expressed as the sum of kinetic and potential energies of the molecules in a system; for an ideal gas, the potential energy is zero, and students should appreciate that the molecular kinetic energy, and hence the internal energy, depends only on temperature.
Establish that the first law of thermodynamics, expressed as ∆W = ∆U + ∆Q, is a statement of the principle of conservation of energy. Explain that quantities must be given appropriate signs (e.g. if 100 J of heat is supplied to a system, then ∆Q = –100 J).
Provide several simple numerical calculations that allow students to practise assigning correct signs to thermodynamic quantities and combining them appropriately.
Work done on or by a gas
Explain that, while the first law of thermodynamics is universally applicable, the focus in the remainder of this topic will be on ideal gases.
Using large clear diagrams on the board or OHP, start from ∆W = F∆x to show that the work done by a gas expanding against a constant pressure is ∆W = p∆V, where ∆V is the increase in volume of the gas. Point out that, if the gas itself is the thermodynamic system under consideration, then ∆W must be a negative quantity as work is being done by (rather than on) the system.
Ask students what happens to the internal energy of a gas if it does work without receiving any input of energy: the internal energy must decrease (i.e. the temperature will fall). Use the ideal gas equation to show that in this case p∆V = nR∆T.
[continued]
Calculate work done by a gas expanding against a constant external pressure using W = p∆V.
Know that internal energy is determined by the state of the system and that it can be expressed as the sum of the kinetic and potential energies associated with the molecules of a system.
Ask students to work in pairs or small groups to explore the thermodynamic changes involved in first using a bicycle pump to inflate a bicycle inner tube then releasing the valve so that air escapes rapidly from the tube. Tell them to make their work as quantitative as possible and encourage them to use their initiative in devising means to measure quantities such as gas temperature and pressure. Make sure they have access to appropriate apparatus. Remind them to identify and discuss factors likely to affect any measurements and calculations (e.g. friction in the pump, heat losses to the surroundings, and the extent to which air might behave as an ideal gas).
Tell students to produce a written report of their observations and measurements explaining how the first law of thermodynamics applies to each stage of the process. To help with this, introduce and define the term adiabatic (and, for completeness, isothermal).
Provide plenty of algebraic and numerical examples that allow students to practise using ∆W = p∆V and ∆W = ∆U + ∆Q.
Enquiry skills 12A.1.1, 12A.1.3, 12A.1.4, 12A.1.5, 12A.3.1–12A.3.3, 12A.4.1, 12A.4.2

529 | Qatar science scheme of work | Grade 12 advanced | Unit 12AP.3 | Physics 3 © Education Institute 2005
Objectives Possible teaching activities Notes School resources
Forwards and backwards Show the class a series of film or video clips of simple processes, some running forwards and some backwards. Ask students to say which are forwards, which backwards and which are ambiguous, and then to identify the features that enable them to say which is which. Ask students to suggest other examples of processes that occur only in one direction (e.g. a cup of hot tea cools down – it does not spontaneously get hotter).
Establish that energy is conserved in all processes, so energy conservation cannot be a feature that distinguishes forwards from reverse. Given suitable questioning, students will probably be able to suggest that matter being spread out in a state of increasing disorder is a characteristic of many processes that occur spontaneously (e.g. a breaking glass), whereas processes that require a reduction in disorder (e.g. a glass reassembling) do not happen spontaneously.
Get students to produce flick books to depict a simple one-way process. To do this they need to draw a sequence of sketches or cartoons on adjacent pages of a small booklet so that, when the pages are rapidly flicked, there is an impression of movement. Flicking the pages from front to back shows a spontaneous process, whereas flicking from back to front shows a process that would not occur unaided.
Suitable examples include: • a glass falling to the floor and breaking; • ink squirted from a pipette into a beaker of
water; • a bouncing ball; • a swinging pendulum; • a book sliding along a table top and coming to
rest; • a burning match.
Entropy Introduce the term entropy as meaning (loosely) disorder, and establish that a process that involves a reduction in entropy cannot happen spontaneously.
Extend the notion of disorder to include energy as well as matter. Establish that heating involves a wider distribution of energy and an increase in molecular disorder, and hence an increase in entropy, and that processes involving the production of heat tend to be spontaneous.
It is useful to introduce the concept of an irreversible process as one that involves an increase in entropy; the reverse process cannot occur, as it involves a reduction in entropy. Point out that it might be possible to imagine a reversible process (i.e. one that involves no entropy change so could occur either way). The swing of a pendulum suspended from a frictionless support, in the absence of any air resistance, would be reversible, but in practice there is always some heating that makes the process irreversible.
Summarise these discussions by stating the second law of thermodynamics: Any process that occurs spontaneously leads to an increase in entropy.
Discuss examples of processes that appear to reduce entropy, such as a liquid solidifying into a crystal. Point out that such processes must be considered in terms of everything involved. For example, crystallisation reduces the entropy of the material itself, but heat is lost to the surroundings, whose entropy therefore increases and, overall, there is a net increase in entropy. The second law of thermodynamics is, like the first law, universal: no examples have ever been found where it is violated.
4 hours
The second law of thermodynamics
State that the entropy of a system expresses its degree of disorder and describe the second law of thermodynamics in terms of entropy change.
State the Kelvin–Planck formulation of the second law of thermodynamics and show an understanding of how it leads to the imposition of limits to the efficiency of any heat engine that are related to the temperatures of the heat sources and heat sinks.
Discuss with more advanced students how the nature of molecular motion is related to the second law of thermodynamics. Despite the random motion of individual molecules, it is possible to make very firm predictions about the way a process will occur as described by the second law.

530 | Qatar science scheme of work | Grade 12 advanced | Unit 12AP.3 | Physics 3 © Education Institute 2005
Objectives Possible teaching activities Notes School resources
Use Java applets to show the behaviour of a collection of randomly moving particles. If particles are placed in one half of a container then allowed to move randomly throughout all the available space, they will soon become evenly distributed. While it is impossible to predict the motion of an individual particle, it is easy to predict their overall distribution when large numbers are involved.
Encourage students to discuss the extent to which they think the probabilistic, random nature of molecular motion can be reconciled with the deterministic teachings of major religions.
ICT opportunity: Use of Java applets.
Enquiry skill 12A.2.6
Heat engines Begin with a brief presentation given either by students (see earlier) or yourself, outlining how the invention and use of steam engines influenced the development of ideas about energy and heat. Industrial users needed to maximise the efficiency of their machines, so it became important to develop an understanding of how the work done is related to the heat supplied (and hence to the fuel consumed).
Introduce and explain the term heat engine as meaning any device in which a supply of heat leads to work being done. Steam engines are a historic example. More modern examples include the turbine-generator systems used in power stations and the internal combustion engine used in motor vehicles.
Refer to work from earlier grades and establish that the efficiency of a heat engine is given by W ⁄ Q, where Q is the heat supplied and W the work done.
By suitable questioning, lead students through the following argument to conclude that it is impossible for a heat engine to have an efficiency of 100%. First think of examples of the opposite process (i.e. work is done that leads only to the production of heat). Examples include applying the brakes to a moving car, or a book sliding along a table and coming to rest. Establish that such processes involve an increase in entropy. The reverse process will therefore not happen spontaneously.
Introduce the Kelvin–Planck statement of the second law of thermodynamics: It is impossible to design a heat engine in which heat is entirely converted into work.
Enquiry skills 12A.2.1, 12A.2.2
Temperature and efficiency
Introduce advanced students to a quantitative expression for entropy. Explain that, if a quantity of heat Q is transferred at absolute temperature T, the entropy change, denoted ∆S, is given by ∆S ≥ Q ⁄ T. In a reversible change, ∆S = Q ⁄ T.
Explain that ∆S can also be expressed in terms of molecular behaviour, but that it is not helpful to do so when dealing with large-scale measurements. Remind students that, similarly, absolute temperature can be understood and expressed in terms of molecular kinetic energy, but when dealing with large-scale measurements it is neither necessary nor helpful to do so.
Introduce the terms heat source and heat sink and display a Sankey diagram for a heat engine on the board or OHP. Heat Q1 is supplied from a source at temperature T1, and heat Q2 is extracted to a sink at a lower temperature T2, enabling work W to be done. For example, in a power station, T1 is the temperature of the hot gases that drive the turbines and T2 is the temperature of the cooling water.
Sankey diagram for a heat engine

531 | Qatar science scheme of work | Grade 12 advanced | Unit 12AP.3 | Physics 3 © Education Institute 2005
Objectives Possible teaching activities Notes School resources
Let students spend a few minutes discussing in small groups how to derive an expression for the efficiency in terms of T1 and T2. Then, using suitable questioning depending on the progress they have made, guide them through the following argument: work done W = Q1 – Q2
efficiency = W ⁄ Q1 = Q1 – Q2 ⁄ Q1
at the heat source ∆S1 = +Q1 ⁄ T1
at the heat sink ∆S2 = – Q2 ⁄ T2
The signs of ∆S are important; the supply of heat Q1 increases the entropy of the engine, whereas the entropy decreases when Q2 is removed.
If the whole process is reversible, then the overall entropy change is zero ∆S = ∆S1 + ∆S2 = 0
So Q1
⁄ T1 – Q2 ⁄ T2 = 0 so Q2 = T2Q1
⁄ T1
Substituting in the expression for efficiency and cancelling Q1
W ⁄ Q1 = Q1 – Q2 ⁄ Q1 = (1 – T2
⁄ T1) = (T1 – T2) ⁄ T1
Ask students to show that, if ∆S is greater than zero, the efficiency is reduced and hence confirm that the expression above gives the maximum possible efficiency of a heat engine, and that is always less than 100% except in the impractical case when T2 = 0 K.
Students should calculate the maximum efficiencies of some heat engines.
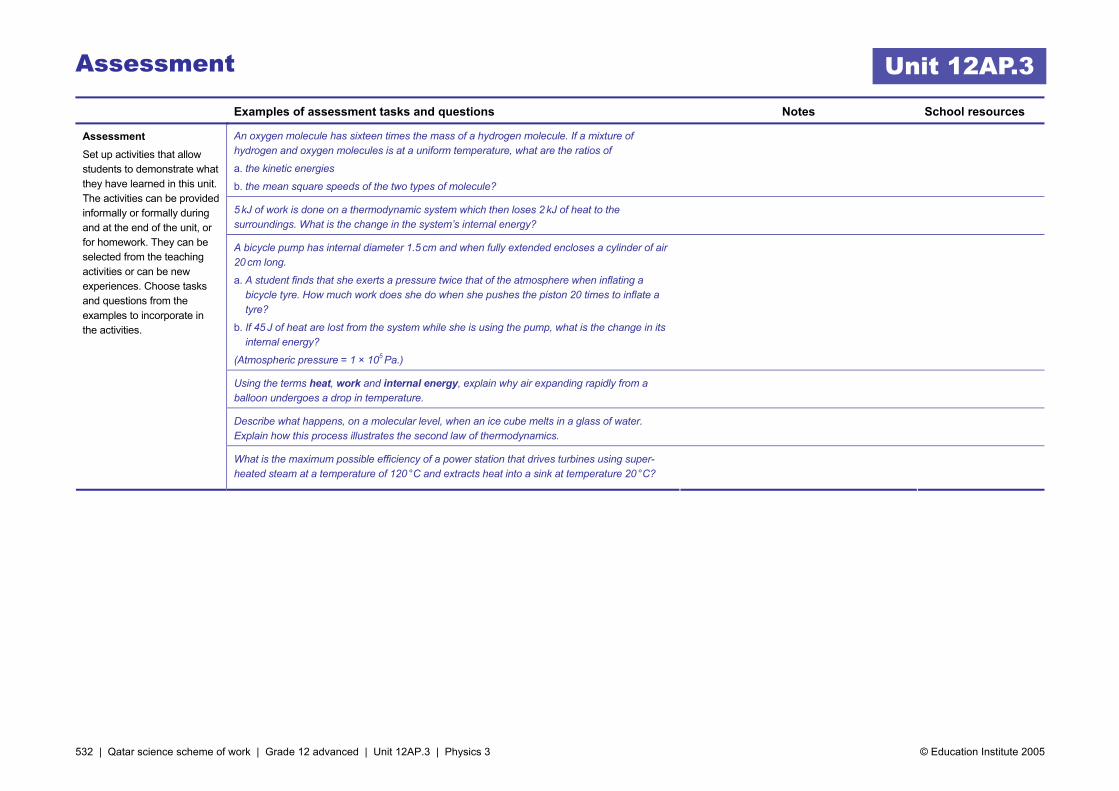
532 | Qatar science scheme of work | Grade 12 advanced | Unit 12AP.3 | Physics 3 © Education Institute 2005
Assessment
Examples of assessment tasks and questions Notes School resources
An oxygen molecule has sixteen times the mass of a hydrogen molecule. If a mixture of hydrogen and oxygen molecules is at a uniform temperature, what are the ratios of
a. the kinetic energies
b. the mean square speeds of the two types of molecule?
5 kJ of work is done on a thermodynamic system which then loses 2 kJ of heat to the surroundings. What is the change in the system’s internal energy?
A bicycle pump has internal diameter 1.5 cm and when fully extended encloses a cylinder of air 20 cm long.
a. A student finds that she exerts a pressure twice that of the atmosphere when inflating a bicycle tyre. How much work does she do when she pushes the piston 20 times to inflate a tyre?
b. If 45 J of heat are lost from the system while she is using the pump, what is the change in its internal energy?
(Atmospheric pressure = 1 × 10⁵ Pa.)
Using the terms heat, work and internal energy, explain why air expanding rapidly from a balloon undergoes a drop in temperature.
Describe what happens, on a molecular level, when an ice cube melts in a glass of water. Explain how this process illustrates the second law of thermodynamics.
Assessment Set up activities that allow students to demonstrate what they have learned in this unit. The activities can be provided informally or formally during and at the end of the unit, or for homework. They can be selected from the teaching activities or can be new experiences. Choose tasks and questions from the examples to incorporate in the activities.
What is the maximum possible efficiency of a power station that drives turbines using super-heated steam at a temperature of 120 °C and extracts heat into a sink at temperature 20 °C?
Unit 12AP.3
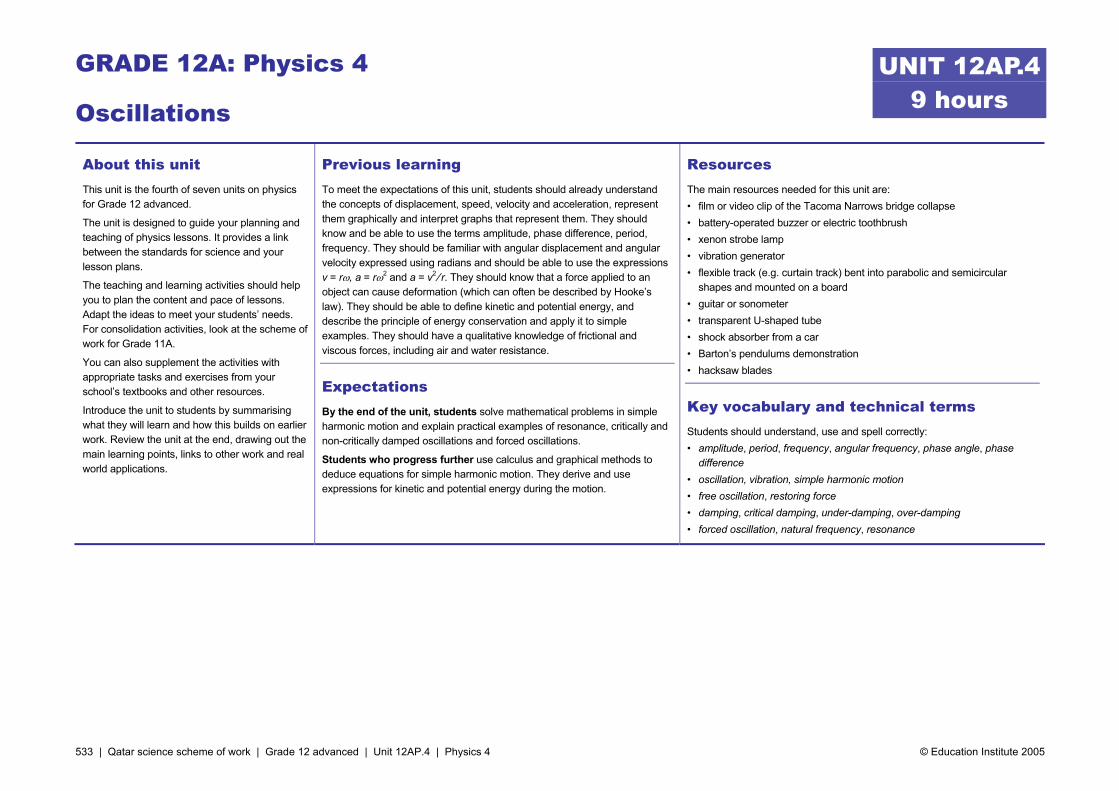
533 | Qatar science scheme of work | Grade 12 advanced | Unit 12AP.4 | Physics 4 © Education Institute 2005
GRADE 12A: Physics 4
Oscillations
About this unit This unit is the fourth of seven units on physics for Grade 12 advanced.
The unit is designed to guide your planning and teaching of physics lessons. It provides a link between the standards for science and your lesson plans.
The teaching and learning activities should help you to plan the content and pace of lessons. Adapt the ideas to meet your students’ needs. For consolidation activities, look at the scheme of work for Grade 11A.
You can also supplement the activities with appropriate tasks and exercises from your school’s textbooks and other resources.
Introduce the unit to students by summarising what they will learn and how this builds on earlier work. Review the unit at the end, drawing out the main learning points, links to other work and real world applications.
Previous learning To meet the expectations of this unit, students should already understand the concepts of displacement, speed, velocity and acceleration, represent them graphically and interpret graphs that represent them. They should know and be able to use the terms amplitude, phase difference, period, frequency. They should be familiar with angular displacement and angular velocity expressed using radians and should be able to use the expressions v = rω, a = rω2 and a = v2 ⁄ r. They should know that a force applied to an object can cause deformation (which can often be described by Hooke’s law). They should be able to define kinetic and potential energy, and describe the principle of energy conservation and apply it to simple examples. They should have a qualitative knowledge of frictional and viscous forces, including air and water resistance.
Expectations By the end of the unit, students solve mathematical problems in simple harmonic motion and explain practical examples of resonance, critically and non-critically damped oscillations and forced oscillations.
Students who progress further use calculus and graphical methods to deduce equations for simple harmonic motion. They derive and use expressions for kinetic and potential energy during the motion.
Resources The main resources needed for this unit are: • film or video clip of the Tacoma Narrows bridge collapse • battery-operated buzzer or electric toothbrush • xenon strobe lamp • vibration generator • flexible track (e.g. curtain track) bent into parabolic and semicircular
shapes and mounted on a board • guitar or sonometer • transparent U-shaped tube • shock absorber from a car • Barton’s pendulums demonstration • hacksaw blades
Key vocabulary and technical terms Students should understand, use and spell correctly: • amplitude, period, frequency, angular frequency, phase angle, phase
difference • oscillation, vibration, simple harmonic motion • free oscillation, restoring force • damping, critical damping, under-damping, over-damping • forced oscillation, natural frequency, resonance
UNIT 12AP.4 9 hours

534 | Qatar science scheme of work | Grade 12 advanced | Unit 12AP.4 | Physics 4 © Education Institute 2005
Standards for the unit
9 hours SUPPORTING STANDARDS CORE STANDARDS
Grade 12 standards EXTENSION STANDARDS
10A.28.3 Know and use the terms ... displacement, amplitude, phase difference, period, frequency ...
12A.25.1 Express angular displacement in radians ...
12A.25.2 Understand and use the concept of angular velocity to solve problems in various situations using the formulae v = rω, a = rω2 and a = v2 ⁄ r.
12A.28.1 Describe examples of free oscillations and understand and use the terms amplitude, period, frequency, angular frequency and phase difference. Express the period in terms of both frequency and angular frequency.
10A.26.1 Understand the concepts of displacement, speed, velocity and acceleration, represent them graphically and interpret graphs that represent them.
10A.26.3 Know that a force acting on an object can cause deformation ...
12A.28.2 Deduce, by calculus or graphical methods, and use the equations for expressing the displacement, period, velocity and acceleration in simple harmonic motion.
11A.27.2 Define kinetic and potential energy ... Describe the principle of energy conservation and apply it to simple examples.
12A.28.3 Describe, using graphical illustrations, the changes in displacement, velocity and acceleration during simple harmonic motion. Describe the changes between kinetic and potential energy during the motion.
10A.26.5 Show a qualitative knowledge of frictional and viscous forces including air and water resistance ...
12A.28.4 Describe and explain practical examples of critically and non-critically damped oscillations.
10A.28.8 ... illustrate the phenomenon of resonance with particular reference to vibrating stretched strings and air columns.
12A.28.5 Describe practical examples of forced oscillations and resonance and show how the amplitude of a forced oscillation changes with frequency near to the natural frequency of the system.
5 hours
Oscillations
2 hours
Energy in oscillations
2 hours
Forced oscillations and resonance
12A.28.6 Describe circumstances in which resonance is desirable and others when it should be avoided.
Unit 12AP.4

535 | Qatar science scheme of work | Grade 12 advanced | Unit 12AP.4 | Physics 4 © Education Institute 2005
Activities
Objectives Possible teaching activities Notes School resources
Oscillations Show the class several examples of oscillating objects with a wide range of sizes and frequencies. Examples should include a video or film clip of the Tacoma Narrows bridge collapse, a string attached to a vibration generator, and a small battery-driven oscillator such as a buzzer or electric toothbrush.
Use quick-fire oral questions to remind students of the terms period, amplitude and frequency from earlier grades. Introduce, or remind students of, the terms oscillation and vibration, each meaning a regular repeating to-and-fro motion. Establish that oscillation is a type of motion found in many different situations.
Ask students to suggest how the frequency of an oscillation can be measured. For long-period oscillations, such as those of the Tacoma Narrows bridge, they should be able to suggest that the period, and hence the frequency, can readily be deduced using freeze-frame video.
Demonstrate the use of a xenon stroboscope to determine the frequency of a string attached to a vibration generator. By comparing settings of the strobe and the generator, establish that there are several strobe frequencies that ‘freeze’ the motion, and that the vibration frequency must be the highest of these.
Divide the class in half, and each half into small groups. Ask students in one half of the class to use digital freeze-frame video to find the frequency of the Tacoma Narrows bridge oscillations, and ask those in the other half to use a xenon strobe to find the frequency of a buzzer, electric toothbrush or similar high-frequency vibration. The two halves should then change over so that all students experience both techniques.
Safety: Stroboscopes can be hazardous to people with epilepsy ICT opportunity: Use of digital video. Enquiry skills 12A.4.1, 12A.4.2
Use this column to note your own school’s resources, e.g. textbooks, worksheets.
5 hours
Oscillations Describe examples of free oscillations and understand and use the terms amplitude, period, frequency, angular frequency and phase difference. Express the period in terms of both frequency and angular frequency.
Deduce, by calculus or graphical methods, and use the equations for expressing the displacement, period, velocity and acceleration in simple harmonic motion.
Describe, using graphical illustrations, the changes in displacement, velocity and acceleration during simple harmonic motion...
SHM or not SHM? Set up a circus of oscillating objects. Aim for a wide variety and choose some examples where period is independent of amplitude and there is a sinusoidal variation of displacement with time (i.e. SHM) and some that behave in other ways.
Ask students to work in pairs to explore each station of the circus in turn. Tell them to experiment and note whether the period of each oscillation depends on the amplitude. Where possible, they should also obtain a record showing how displacement of the oscillator varies with time.
Discuss students’ findings with the whole class. Establish that many different types of oscillator behave in a similar way in that the period of oscillation is independent of amplitude and a graph of displacement against time is sinusoidal. Tell students that such oscillations are called simple harmonic motion (SHM) and will be the main subject of this unit.
Also establish that, while many oscillators perform SHM, not all oscillations follow this pattern and the analysis developed in this unit is not applicable to them.
Students might have reached differing conclusions concerning the oscillation of pendulums: by suitable questioning, establish that at small amplitudes these perform SHM, but at large amplitudes the period increases noticeably.
Suitable examples of oscillators include: • dynamics trolley tethered between two springs; • ball-bearing rolling on a parabolic track; • ball-bearing rolling on a semi-circular track; • vibrating guitar or sonometer string; • liquid in a U-shaped tube; • bouncing ball; • simple pendulum; • rigid pendulum suspended from potentiometer
shaft (connect the potentiometer to a DC power supply in series with a fixed resistor; connect a CRO across the potentiometer so that the displayed voltage trace indicates the angular displacement of the pendulum).
Enquiry skills 12A.1.2–12A.1.4
Unit 12AP.4

536 | Qatar science scheme of work | Grade 12 advanced | Unit 12AP.4 | Physics 4 © Education Institute 2005
Objectives Possible teaching activities Notes School resources
SHM and circular motion Set up the following demonstration to show students the relationship between circular motion and SHM. Suspend a tennis ball (or similar) from a long string to make a pendulum. Mount another tennis ball on a turntable that can spin slowly about a vertical axis. Place both behind a translucent screen and arrange a light source to cast shadows of both balls onto the screen. Adjust the length of the string and/or the rotation speed of the turntable so that both motions have the same period, and the shadows on the screen oscillate in phase and with similar amplitude. Students should observe that SHM can be treated as a projection of circular motion.
Ask each student to draw, on graph paper, a circle with a radius of a few centimetres, centred on an intersection of grid lines. Tell them to mark the circumference of the circle at regular intervals (e.g. every 30°) to represent successive positions of an object moving around the circle at constant speed and observed at regular time intervals. They should then note the x (or y) coordinate of each position and plot a graph showing how this coordinate varies with time: the graphs will be sinusoidal.
Let students explore this projected motion using an appropriate Java applet.
ICT opportunity: Use of Java applets.
Equations of SHM On the board or OHP, show students how to derive equations for SHM using a projection of circular motion.
Draw a large diagram showing an object moving anticlockwise around a circle of radius A, starting from the x-axis at time t = 0. By suitable questioning, remind students of the meaning of angular velocity, ω, and establish that, expressed in radians, angular displacement θ =ω t. Also remind them of the relationships v = rω and a = v2 ⁄ r = rω2.
Choose one point on the circumference of the circle and use trigonometry to show students that the displacement in the x direction is x = r cos (ω t ).
Draw a velocity vector at the same point and show that its x component is v = r ω sin (ω t ).
Draw a vector representing the centripetal acceleration at the same point and show that its x component is a = –rω2 cos (ω t ).
Establish that these equations describe the displacement, velocity and acceleration (respectively) of an object oscillating with SHM along the x-axis.
Students should be able to identify r with the amplitude, A, of the oscillation and rewrite the equations as x = A cos (ω t ) and so on.
Explain that, when dealing with SHM (rather than circular motion), ω is usually called the angular frequency (rather than angular velocity). Ask students to derive the relationships ω = 2πf and T = 2π ⁄ ω where f is the frequency and T the period of the oscillation.
Now draw another similar diagram, this time showing an object starting with an angular displacement φ when t = 0. Ask students to work individually or in pairs to derive expressions for the x components of displacement, velocity and acceleration (i.e. x = A cos (ω t + φ ) and so on).
Establish that the angle φ is called the phase angle, and that the phase difference between two oscillations can be denoted by the difference in their phase angles. Remind students that such angles are conventionally expressed in radians (e.g. two oscillations in antiphase have a phase difference of π).
Mathematics. Trigonometry and a knowledge of angles measured in radians are required.
537 | Qatar science scheme of work | Grade 12 advanced | Unit 12AP.4 | Physics 4 © Education Institute 2005
Objectives Possible teaching activities Notes School resources
Give students plenty of opportunities to practise drawing and interpreting graphs showing how displacement, velocity and acceleration vary with time for SHM.
Mathematical derivation of SHM equations Discuss the equations derived above and establish that, regardless of the amplitude and phase, the acceleration is always proportional to the displacement and in the opposite direction (i.e. a = –ω2x).
Show that this expression can be rewritten as d2x ⁄ dt2 = –ω2x and point out that it is a differential equation in x. By suitable questioning and discussion, show that x = A cos (ω t ), x = A sin (ω t ) and x = A cos (ω t + φ ) are all solutions to the equation.
Also show that corresponding expressions for velocity can be obtained by differentiating the expressions for displacement.
Point out that the values of phase angle and amplitude are independent of the angular frequency and can, in principle, take any value, depending on the particular oscillator being described. Emphasise that this is a characteristic of SHM as noted earlier: the period is independent of amplitude.
Give students plenty of algebraic and numerical examples that allow them to practise using equations of SHM.
Mathematics: A knowledge of calculus is required.
Measuring SHM Ask students, in pairs or small groups, to explore in detail one example of an oscillator performing SHM. As far as apparatus permits, each pair or small group should explore a different oscillator. Tell students to devise and use methods for obtaining an accurate record of its motion, showing how the displacement, velocity and acceleration vary with time. The oscillators themselves should be fairly simple, and students should be encouraged to use a range of methods and instruments for recording their motion, such as sensors, dataloggers and digital video cameras.
Review work on linear motion from earlier grades with students and make sure they recall that velocity can be deduced from the gradient of a displacement–time graph, and acceleration from the gradient of a velocity–time graph. Depending on how the initial records have been produced and stored, gradients can be found either from hand-drawn tangents or by using suitable software.
Ask students to summarise their results in the form of labelled graphs. These can be photocopied and distributed to the whole class.
Suitable examples include: • a dynamics trolley tethered between two springs;• a magnet on a spring oscillating in and out of
a coil (the induced emf will indicate velocity); • a rigid pendulum suspended from a
potentiometer shaft; • a simple pendulum.
(The amplitude of the pendulum oscillations must be small.)
Enquiry skills 12A.1.1, 12A.1.3, 12A.1.4, 12A.1.5, 12A.3.1, 12A.3.2, 12A.3.4, 12A.4.1
ICT opportunity: Use of dataloggers and digital video.
Force and SHM Write the SHM equation a = –ω2x on the board or OHP.
Establish that this relationship implies that the oscillating object must be experiencing a restoring force F that is proportional to its displacement and in the opposite direction: F = – kx.
By means of suitable questioning, remind students of Hooke’s law and the behaviour of springs. Establish that, if a mass is suspended from a spring and displaced from equilibrium by a distance x, it will experience a restoring force F = –kx and must therefore perform SHM when released.
538 | Qatar science scheme of work | Grade 12 advanced | Unit 12AP.4 | Physics 4 © Education Institute 2005
Objectives Possible teaching activities Notes School resources
Point out that, if this restoring force is the only force acting on an oscillator, it will perform so-called free oscillations. (Later in this unit there are examples of oscillations where other forces act.)
Ask students to deduce an expression for the acceleration of a mass m suspended from a spring of stiffness k (i.e. a = –kx ⁄ m).
Then compare the two acceleration equations and identify ω2 = k ⁄ m. Establish that the angular frequency is ω = √(k ⁄ m) and hence the period and frequency of the SHM can be deduced.
Emphasise that any system in which there is a restoring force proportional to displacement will oscillate with SHM, and that the angular frequency can always be deduced from the relationship between displacement and acceleration.
Provide several examples that allow students to practise relating frequency and period of SHM to physical parameters of an oscillator.
Ask students to work in pairs to measure k for a spring and hence predict the frequency of oscillations performed by a known mass m attached to the spring. Then ask them to determine the frequency of the SHM performed by the mass suspended from the spring and to compare their result with their prediction.
Enquiry skills 12A.1.1, 12A.1.2, 12A.4.1, 12A.4.2
On the board or OHP, show a large diagram of a simple pendulum, length l, displaced through a small angle θ. By resolving forces into components show that, provided θ is small and sin θ ≈ θ, the restoring force is proportional to displacement and hence the pendulum will perform SHM with angular frequency ω = √(g ⁄ l) where g is the gravitational field strength.
Then ask students to work in pairs to determine a value of g by timing oscillations of a pendulum. They should consider how best to design their experiment and process their results in order to ensure precision and accuracy and should quantify the uncertainty in their final result. Tell them to produce a brief written report of their work.
Mathematics: A knowledge of the small angle approximation is required.
This activity also relates to Standard 10A.25.2
Enquiry skills 12A.1.1, 12A.1.3, 12A.1.5
2 hours
Energy in oscillations ... Describe the changes between kinetic and potential energy during the [simple harmonic] motion.
Describe and explain practical examples of critically and non-critically damped oscillations.
Energy and SHM Set up a demonstration of a dynamics trolley oscillating horizontally between two springs. Ask the class to describe, qualitatively, the energy of the system. By suitable questioning, establish that, when displacement is maximum, kinetic energy is zero and potential energy is maximum, while at the mid-point of the oscillation kinetic energy is maximum and potential energy is zero. Students should be able to draw on their previous experience of energy transformation and conservation, and appreciate that, provided there is minimal dissipation to the surroundings, the total energy of the oscillator remains constant.
Ask students to speculate about the likely shapes of graphs showing how the kinetic (or potential) energy of the oscillator varies with time and with position. Ask a few students to draw rough sketches on the board showing their ideas, and to explain their thinking to the rest of the class. Some students might use equations of SHM to deduce the shapes of the graphs, while others might reason qualitatively.

539 | Qatar science scheme of work | Grade 12 advanced | Unit 12AP.4 | Physics 4 © Education Institute 2005
Objectives Possible teaching activities Notes School resources
Show, on the board or OHP, how to manipulate the equations of SHM to derive expressions for the kinetic energy of the oscillating trolley, i.e. Ek = ½ mv2 = ½ mA2ω2 sin2(ω t ) = ½ kA2 sin2(ω t )
Then get students to work in pairs to deduce similar expressions for potential energy, starting from the expression for the potential energy in a stretched spring: Ep = ½ kx2.
Check that students have a correct record of the equations for Ek and Ep, then use them to establish that the total energy of the oscillator is ½ kA2.
Provide plenty of numerical and algebraic examples that allow students to practise using the energy equations for SHM.
Damped oscillations
Ask each pair of students to suspend a mass from a spring and observe its oscillations, first in air and then with the mass immersed in a beaker of water. Tell them to describe their observations as fully as possible. Prompt them with questions such as ‘What is the period of oscillation in each case?’ and ‘How many cycles take place before the oscillations cease?’.
Discuss students’ observations with the whole class. Establish that drag forces between the mass and the surrounding air or water always act to reduce the speed of the moving mass and dissipate energy.
Introduce the term damping. Establish that damping reduces the energy and hence the amplitude of the oscillations but has little effect on the frequency.
Divide students into small groups and ask them to hold a brief brainstorming session. They should first try to think of examples of everyday examples of oscillations and then, for each example, say whether damping of the oscillations is desirable or not. Ask a representative of each group to write their examples in two lists on the board or OHP.
Discuss some of the examples in which damping is desirable with the whole class, and ask them to suggest how it is achieved in practice.
Show students the construction of a shock absorber from a car – a piston immersed in oil ensures that oscillations are damped and that the car’s occupants have a comfortable ride.
Choose a suitable example to illustrate the meaning of critical damping. This is best defined by comparison with under-damping and over-damping.
A useful working definition of critical damping is that it occurs when the oscillator returns to its equilibrium position in a time approximately equal to the period of the undamped oscillation.
If the time to return to equilibrium is considerably longer than the period, the oscillator is over-damped, and if the oscillator overshoots the equilibrium position and oscillations persist for several cycles, it is under-damped.
Point out that, in most situations where damping is desirable, it is usually critical damping that is required.
It is important to ensure that students appreciate that the damping being considered here is not damping due to water.
Examples where damping is undesirable include: • producing a note on a guitar string; • using a pendulum to regulate a clock.
Examples where damping is desirable include: • oscillation of a car as it drives along a rough
road surface; • earthquake-induced oscillation of a building.
Critical damping can be explained with reference to a swing door. If under-damped, the door swings to and fro many times when released, but if over-damped it is difficult to open and takes a long time slowly to swing shut. If the door is well designed, so that its oscillations are critically damped, it will easily swing shut but without over-shooting.
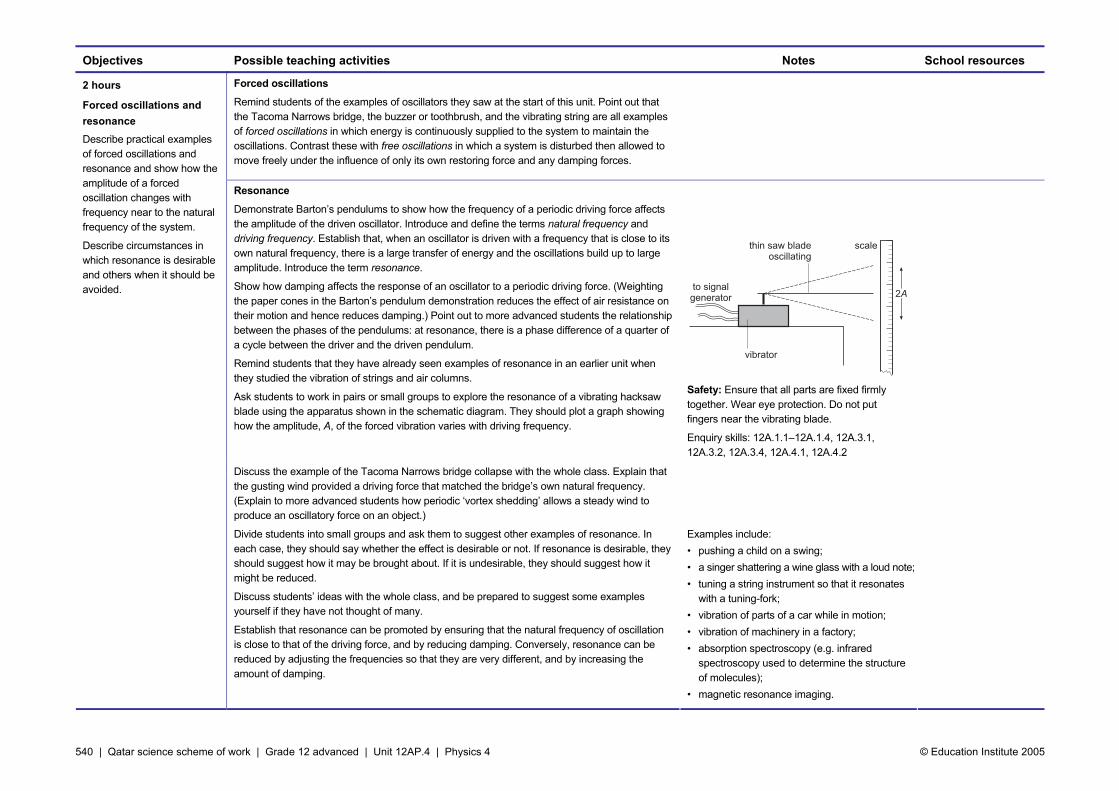
540 | Qatar science scheme of work | Grade 12 advanced | Unit 12AP.4 | Physics 4 © Education Institute 2005
Objectives Possible teaching activities Notes School resources
Forced oscillations
Remind students of the examples of oscillators they saw at the start of this unit. Point out that the Tacoma Narrows bridge, the buzzer or toothbrush, and the vibrating string are all examples of forced oscillations in which energy is continuously supplied to the system to maintain the oscillations. Contrast these with free oscillations in which a system is disturbed then allowed to move freely under the influence of only its own restoring force and any damping forces.
Resonance
Demonstrate Barton’s pendulums to show how the frequency of a periodic driving force affects the amplitude of the driven oscillator. Introduce and define the terms natural frequency and driving frequency. Establish that, when an oscillator is driven with a frequency that is close to its own natural frequency, there is a large transfer of energy and the oscillations build up to large amplitude. Introduce the term resonance.
Show how damping affects the response of an oscillator to a periodic driving force. (Weighting the paper cones in the Barton’s pendulum demonstration reduces the effect of air resistance on their motion and hence reduces damping.) Point out to more advanced students the relationship between the phases of the pendulums: at resonance, there is a phase difference of a quarter of a cycle between the driver and the driven pendulum.
Remind students that they have already seen examples of resonance in an earlier unit when they studied the vibration of strings and air columns.
Ask students to work in pairs or small groups to explore the resonance of a vibrating hacksaw blade using the apparatus shown in the schematic diagram. They should plot a graph showing how the amplitude, A, of the forced vibration varies with driving frequency.
Safety: Ensure that all parts are fixed firmly together. Wear eye protection. Do not put fingers near the vibrating blade.
Enquiry skills: 12A.1.1–12A.1.4, 12A.3.1, 12A.3.2, 12A.3.4, 12A.4.1, 12A.4.2
2 hours
Forced oscillations and resonance Describe practical examples of forced oscillations and resonance and show how the amplitude of a forced oscillation changes with frequency near to the natural frequency of the system.
Describe circumstances in which resonance is desirable and others when it should be avoided.
Discuss the example of the Tacoma Narrows bridge collapse with the whole class. Explain that the gusting wind provided a driving force that matched the bridge’s own natural frequency. (Explain to more advanced students how periodic ‘vortex shedding’ allows a steady wind to produce an oscillatory force on an object.)
Divide students into small groups and ask them to suggest other examples of resonance. In each case, they should say whether the effect is desirable or not. If resonance is desirable, they should suggest how it may be brought about. If it is undesirable, they should suggest how it might be reduced.
Discuss students’ ideas with the whole class, and be prepared to suggest some examples yourself if they have not thought of many.
Establish that resonance can be promoted by ensuring that the natural frequency of oscillation is close to that of the driving force, and by reducing damping. Conversely, resonance can be reduced by adjusting the frequencies so that they are very different, and by increasing the amount of damping.
Examples include: • pushing a child on a swing; • a singer shattering a wine glass with a loud note;• tuning a string instrument so that it resonates
with a tuning-fork; • vibration of parts of a car while in motion; • vibration of machinery in a factory; • absorption spectroscopy (e.g. infrared
spectroscopy used to determine the structure of molecules);
• magnetic resonance imaging.
541 | Qatar science scheme of work | Grade 12 advanced | Unit 12AP.4 | Physics 4 © Education Institute 2005
Assessment
Examples of assessment tasks and questions Notes School resources
A mass on a spring performs SHM with amplitude 4 cm and period 1.5 s, starting with a displacement of 4 cm when t = 0.
a. Calculate the angular frequency of the motion.
b. Draw graphs showing how the displacement, velocity and acceleration of the mass vary with time.
A trolley of mass 0.75 kg is tethered between two springs, and a force of 6.2 N produces a displacement of 5.0 cm. The trolley is then released and it performs SHM.
a. Calculate the energy transferred to the trolley as it is displaced.
b. Calculate the trolley’s kinetic energy as it passes through the mid-point of the oscillation.
c. Calculate the maximum speed of the trolley.
On a single set of axes, sketch graphs showing how the kinetic, potential and total energy of an oscillator vary with time as it performs one complete cycle of oscillation.
Write a short article about damping and resonance. Use at least one everyday example to explain the difference between critically damped and non-critically damped oscillations. Include one example of a situation in which resonance is desirable, and one example of a situation in which it is not.
Assessment Set up activities that allow students to demonstrate what they have learned in this unit. The activities can be provided informally or formally during and at the end of the unit, or for homework. They can be selected from the teaching activities or can be new experiences. Choose tasks and questions from the examples to incorporate in the activities.
Molecules of hydrogen chloride (HCl) are found to absorb electromagnetic radiation with a wavelength 3.47 × 10⁻⁶ m. The radiation makes the molecules oscillate at their own natural frequency. By assuming that the chlorine remains at rest while the hydrogen oscillates as if held by a spring, calculate the stiffness, k, of the interatomic bond.
Data: speed of light c = 3.00 × 10⁸ m s–1; mass of hydrogen atom m = 1.67 × 10⁻²⁷ kg.
Unit 12AP.4

542 | Qatar science scheme of work | Grade 12 advanced | Unit 12AP.4 | Physics 4 © Education Institute 2005

543 | Qatar science scheme of work | Grade 12 advanced | Unit 12AP.5 | Physics 5 © Education Institute 2005
GRADE 12A: Physics 5
Electrostatic charge and force
About this unit This unit is the fifth of seven units on physics for Grade 12 advanced.
The unit is designed to guide your planning and teaching of physics lessons. It provides a link between the standards for science and your lesson plans.
The teaching and learning activities should help you to plan the content and pace of lessons. Adapt the ideas to meet your students’ needs. For consolidation activities, look at the scheme of work for Grades 10A and 11A.
You can also supplement the activities with appropriate tasks and exercises from your school’s textbooks and other resources.
Introduce the unit to students by summarising what they will learn and how this builds on earlier work. Review the unit at the end, drawing out the main learning points, links to other work and real world applications.
Previous learning To meet the expectations of this unit, students should already know that opposite charges attract but like charges repel each other. They should know that electric current is the rate of flow of charged particles, define charge and the coulomb, and solve problems using the relationship Q = It. They should understand the construction of capacitors and their use in electrical circuits. They should be able to describe an electric field as an example of a field of force, know that electric field strength can be defined as force per unit positive charge, and define potential difference and the volt. They should understand and be able to use the concept of a gravitational field as an example of a force field and define gravitational field strength as force per unit mass, and should recall and be able to use Newton’s law of universal gravitation in the form F = G(m1m2) ⁄ r2.
Expectations By the end of the unit, students apply Coulomb’s law to charged particles in air, solve problems related to potential difference and potential energy and recognise the similarities between electric and gravitational fields. They understand capacitors and solve problems relating capacitance to voltage and current.
Students who progress further understand and use the concept of electric field. They can define electrical potential, relate field strength to potential gradient and solve problems involving potential energy and potential difference. They derive and use formulae for capacitors in series and in parallel, and relationships involving energy stored in a capacitor.
Resources The main resources needed for this unit are: • overhead projector (OHP) • double flame probe • ball, 10–20 cm diameter, coated with conductive paint • conductive paper (sometimes known as resistive paper) • electrolytic capacitor cut open to reveal its construction • gas discharge tube connected to vacuum pump • Van der Graaff generator, signal generator, cathode-ray oscilloscope • selection of circuit components and power supplies
Key vocabulary and technical terms Students should understand, use and spell correctly: • electric field, Coulomb’s law • electrical potential, potential gradient, potential difference, electron-volt • equipotential line, equipotential surface • capacitor, capacitance
UNIT 12AP.5 13 hours
544 | Qatar science scheme of work | Grade 12 advanced | Unit 12AP.5 | Physics 5 © Education Institute 2005
Standards for the unit
13 hours SUPPORTING STANDARDS CORE STANDARDS Grade 12 standards
EXTENSION STANDARDS
10A.30.3 Describe an electric field as an example of a field of force and know that electric field strength can be defined as force per unit positive charge and that an electric field can be represented by means of field lines.
12A.29.1 Recall and use E = V ⁄ d to calculate the field strength of a uniform field between charged parallel plates, calculate the forces on charges in uniform electric fields and describe the effect of a uniform electric field on the motion of charged particles.
10A.30.2 Know that … opposite charges attract but like charges repel each other.
12A.29.2 State and apply Coulomb’s law relating to the force between two or more charged particles in air and on the field strength due to a charged particle.
10A.31.2 Define potential difference and the volt ...
12A.29.3 Define electrical potential at a point in an electric field, relate field strength to potential gradient, solve problems involving potential energy and potential difference and know and use the term electron-volt.
12A.25.3 Understand and use the concept of a gravitational field as an example of a force field and define gravitational field strength as force per unit mass.
12A.25.4 Recall and use Newton’s law of universal gravitation in the form F = G(m1m2) ⁄ r2 and relationships derived from it.
12A.29.4 Recognise the similarities between electrical and gravitational fields.
11A.30.1 Demonstrate an understanding of the construction of capacitors and their use in electrical circuits.
12A.29.5 Demonstrate an understanding of the construction and use of capacitors in electrical circuits, and of how the charge is stored.
12A.29.6 Define capacitance and solve problems using C = Q ⁄ V; derive and use formulae for capacitors in series and in parallel.
3 hours
Uniform electric field
3 hours
Field and potential
3 hours
Coulomb’s law and non-uniform fields
4 hours
Capacitors
10A.31.1 Know that electric current is the rate of flow of charged particles, define charge and the coulomb, and solve problems using the relationship Q = It.
12A.29.7 Define and use the relationship between the energy stored in a capacitor, its charge and the potential difference between its plates.
Unit 12AP.5
545 | Qatar science scheme of work | Grade 12 advanced | Unit 12AP.5 | Physics 5 © Education Institute 2005
Activities
Objectives Possible teaching activities Notes School resources
Using electric fields To set the scene for this unit and to help review work from earlier grades, divide students into small groups and set each the task of using the Internet and other resources to research one application of electric fields. Where possible, they should collect (for later discussion) data on the strengths of the fields used and the potential differences used to produce them. Suitable examples include: • ink-jet printing; • LCD displays; • photocopying; • particle accelerators (e.g. LINACs and/or cyclotrons); • electrostatic dust precipitators; • electrostatic spraying (e.g. crop spraying, paint spraying).
If necessary, remind students that an electric field is a region where a charged object experiences a force. Ask each group to prepare a poster summarising their findings, giving particular emphasis to the role played by electric fields and including an acknowledgment of the sources consulted. Display the posters and allow time for students to view and talk about them.
ICT opportunity: Use of the Internet.
Enquiry skills 12A.1.6, 12A.1.8
Use this column to note your own school’s resources, e.g. textbooks, worksheets.
3 hours
Uniform electric field Recall and use E = V ⁄ d to calculate the field strength of a uniform field between charged parallel plates, calculate the forces on charges in uniform electric fields and describe the effect of a uniform electric field on the motion of charged particles.
Uniform electric field By means of some quick-fire questions, ascertain how much students recall from work on electric fields in earlier grades. By suitable questioning, remind them how electric field strength is defined, and how this can be expressed in SI units of N C–1.
Demonstrate these two examples of a uniform electric field. • Support two metal plates vertically on insulating stands so that they are parallel and a few
centimetres apart. Connect them to the terminals of an EHT supply and set the voltage to a few kilovolts. Fix a small piece of thin flexible metal foil to the end of an insulating rod. Charge the foil by touching it on one of the plates. Using the rod, move the foil around within the space between the plates; note the size and direction of its deflection.
• Pour some glycerol into a transparent, flat-bottomed container, float grass seeds or rice grains on its surface and place it on an OHP. Using flexible leads, connect two metal strips to either side of the spark gap of a piezo-electric gas lighter. Place the strips in the glycerol so that they are parallel, and use the lighter to produce an electric field within the glycerol. Observe the electric field lines revealed by the grains.
Use suitable questioning to remind students that the field direction is defined to be that of the force on a positive charge. Also remind them how a field can be represented by electric field lines, and how field strength is related to the spacing of the lines: the closer the lines, the stronger the field.
Ask students to suggest how the strength of an electric field between two parallel metal plates might be controlled. Drawing on their own researches in the previous activity, and by discussing the two examples demonstrated, they will probably be able to suggest that increasing the voltage and/or moving the plates closer together would produce a stronger field.
Safety: When using an EHT supply, ensure that the safety resistor is connected and that no one can come into electrical contact with the terminals.
Unit 12AP.5
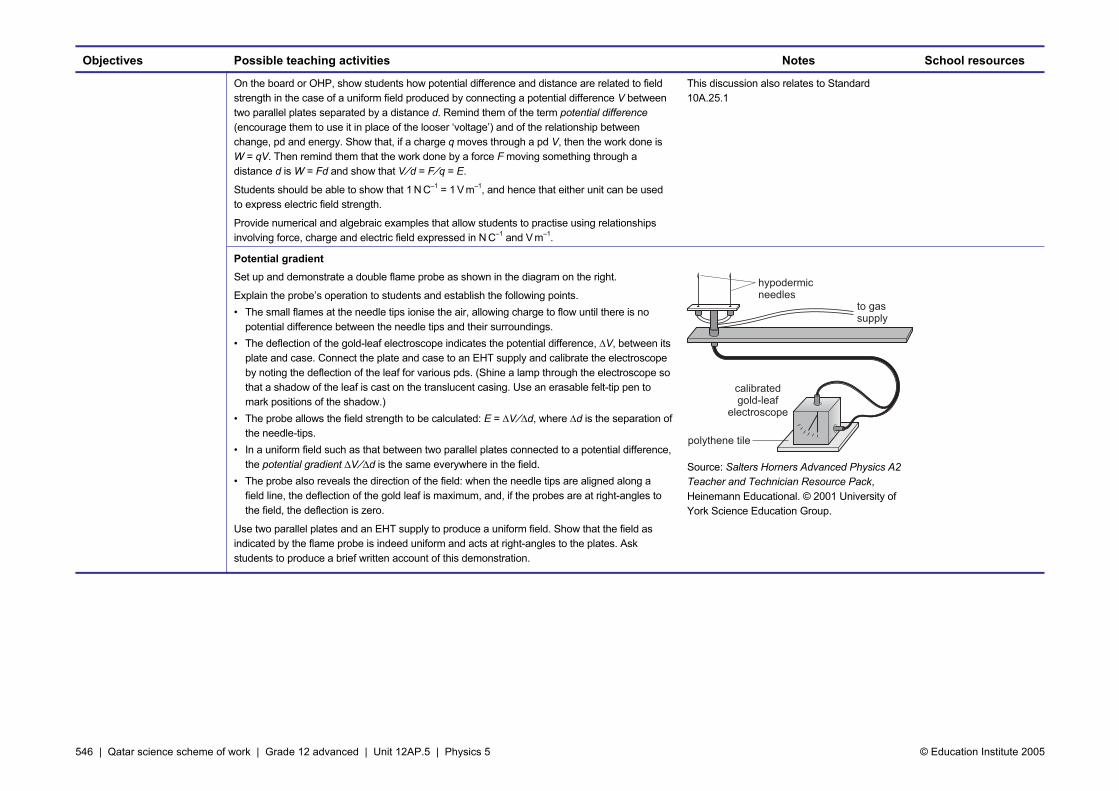
546 | Qatar science scheme of work | Grade 12 advanced | Unit 12AP.5 | Physics 5 © Education Institute 2005
Objectives Possible teaching activities Notes School resources
On the board or OHP, show students how potential difference and distance are related to field strength in the case of a uniform field produced by connecting a potential difference V between two parallel plates separated by a distance d. Remind them of the term potential difference (encourage them to use it in place of the looser ‘voltage’) and of the relationship between change, pd and energy. Show that, if a charge q moves through a pd V, then the work done is W = qV. Then remind them that the work done by a force F moving something through a distance d is W = Fd and show that V ⁄ d = F ⁄ q = E.
Students should be able to show that 1 N C–1 = 1 V m–1, and hence that either unit can be used to express electric field strength.
Provide numerical and algebraic examples that allow students to practise using relationships involving force, charge and electric field expressed in N C–1 and V m–1.
This discussion also relates to Standard 10A.25.1
Potential gradient Set up and demonstrate a double flame probe as shown in the diagram on the right.
Explain the probe’s operation to students and establish the following points. • The small flames at the needle tips ionise the air, allowing charge to flow until there is no
potential difference between the needle tips and their surroundings. • The deflection of the gold-leaf electroscope indicates the potential difference, ∆V, between its
plate and case. Connect the plate and case to an EHT supply and calibrate the electroscope by noting the deflection of the leaf for various pds. (Shine a lamp through the electroscope so that a shadow of the leaf is cast on the translucent casing. Use an erasable felt-tip pen to mark positions of the shadow.)
• The probe allows the field strength to be calculated: E = ∆V ⁄ ∆d, where ∆d is the separation of the needle-tips.
• In a uniform field such as that between two parallel plates connected to a potential difference, the potential gradient ∆V ⁄ ∆d is the same everywhere in the field.
• The probe also reveals the direction of the field: when the needle tips are aligned along a field line, the deflection of the gold leaf is maximum, and, if the probes are at right-angles to the field, the deflection is zero.
Use two parallel plates and an EHT supply to produce a uniform field. Show that the field as indicated by the flame probe is indeed uniform and acts at right-angles to the plates. Ask students to produce a brief written account of this demonstration.
Source: Salters Horners Advanced Physics A2 Teacher and Technician Resource Pack, Heinemann Educational. © 2001 University of York Science Education Group.
547 | Qatar science scheme of work | Grade 12 advanced | Unit 12AP.5 | Physics 5 © Education Institute 2005
Objectives Possible teaching activities Notes School resources
Acceleration and ionisation
Carry out some demonstrations that show gas ‘discharge’ (i.e. ionisation by an electric field) and discuss them with the class. Establish the following points. • Within any gas, there are always a few charged particles (i.e. electrons and positive ions). • In an electric field, the charged particles accelerate. • The accelerated particles collide with other particles in the gas. • If the collisions are sufficiently energetic, energy is transferred to electrons within atoms and
molecules, which are then said to be excited. • If the collisions are still more energetic, electrons can be dislodged from neutral atoms and
molecules, causing ionisation. • Excited electrons lose their excess energy by emitting visible light. • Electrons liberated during ionisation undergo acceleration in the electric field, giving rise to
further excitation and ionisation (i.e. a discharge or spark is produced).
Discuss why a discharge or spark occurs more readily in low-pressure gas. Establish that reducing the pressure reduces the gas density, and hence increases the average distance between particles. In a high-pressure gas, accelerated particles can only move a short distance before being involved in a collision and transferring some of their energy. If the pressure is reduced, the accelerated particles can move further and hence acquire more energy between collisions.
Suitable demonstrations include the following. • An air-filled tube that can be connected to an
EHT supply and a vacuum pump. Begin with the tube containing air at normal atmospheric pressure: the EHT fails to produce a discharge. With the EHT still connected, evacuate air from the tube until a discharge is produced (the gas will glow pink).
• A Van der Graaff generator producing a spark between the main dome and a nearby small sphere.
• A fluorescent lighting tube connected in a domestic light fitting.
3 hours
Field and potential Define electrical potential at a point in an electric field, relate field strength to potential gradient, solve problems involving potential energy and potential difference and know and use the term electron-volt.
On the board or OHP, remind students how the energy acquired by a charged particle accelerating in an electric field can be related to the field strength E and to the distance travelled d. Establish that when a particle of charge q moves through a distance d along the direction of the field, it moves through a potential difference V = Ed so that it acquires kinetic energy Ek = qV = qEd.
Explain that, when dealing with the acceleration of individual ions and electrons, it is convenient to express charge in units of the electron charge, e, and energy in electron-volts (eV). Students should be able to show that 1 eV = 1.60 × 10⁻¹⁹ J. Explain that the eV is a non-SI unit of energy, but that it is very widely used to express small energies and is not restricted to energies of electrically accelerated charged particles.
Provide students with plenty of examples that allow them to practise using the electron-volt as an energy unit.

548 | Qatar science scheme of work | Grade 12 advanced | Unit 12AP.5 | Physics 5 © Education Institute 2005
Objectives Possible teaching activities Notes School resources
Potential at a point In a whole-class discussion and demonstration, introduce the concept of potential at a point, first within an electric circuit and then within an electric field.
Connect a long potentiometer wire to a battery. Use a voltmeter to measure the pd between several pairs of points. Point out that the term potential difference implies a difference between two values of a quantity called potential. Explain that, in a DC electric circuit, it is conventional to define the zero of potential as being at the negative battery terminal, so that all other points in the circuit are at a positive potential. Go on to explain that this choice is arbitrary, and that any point in the circuit could in principle be defined as the zero without altering the potential differences measured anywhere in the circuit.
Remind students of the relationship between pd and energy, and establish that a pd of 1 V corresponds to an energy difference of 1 J for 1 C (1 coulomb) of charge. Establish that electrical potential at a point is thus the potential energy of 1 C of charge at that point. Remind students that, like the zero level of electrical potential, the choice of zero level of gravitational potential energy is also arbitrary: in both cases, we only ever measure differences rather than absolute values.
Provide plenty of examples that allow students to practise using the relationships between pd and energy and describing them using appropriate terminology.
Place a sheet of conductive paper on a pin-board. Attach a straight metal strip close to each end of the paper so that there is good electrical contact between paper and metal. Connect the metal strips to a low-voltage battery to produce an electric field within the paper. Connect one terminal of a voltmeter to the negative strip, and show students how to use a flying lead connected to the other terminal to identify points within the paper that are at a potential of, say, 1 V relative to the negative strip. Introduce the terms equipotential line and equipotential surface and establish that these must always be at right-angles to electric field lines.
Ask students to work in pairs using conductive paper to explore the equipotential lines in various two-dimensional electric field configurations. Explain how to record the equipotentials by placing a sheet of carbon paper face down under the conductive paper and on top of a sheet of plain white paper, and pressing down onto the paper with the flying lead. Then tell them to remove the record of the equipotentials and draw in the field lines by inspection.
Display and discuss students’ records of field and equipotential lines and establish that field lines and equipotential each provide a graphic means of representing electric field strength. Establish that in a uniform field the equipotentials are equally spaced, whereas in a non-uniform field they are closest together in regions where the field is strongest. Point out that the field lines converge towards ‘point charges’ and that in such regions the equipotentials are close together.
Suitable field configurations include the following: • two non-parallel straight metal strips; • two ‘point charges’ (i.e. metal pins) inserted
into the board; • combinations of straight and curved metal
strips; • combinations of one metal strip and one point.
Enquiry skills 12A.3.1, 12A.3.2, 12A.4.1

549 | Qatar science scheme of work | Grade 12 advanced | Unit 12AP.5 | Physics 5 © Education Institute 2005
Objectives Possible teaching activities Notes School resources
3 hours
Coulomb’s law and non-uniform fields State and apply Coulomb’s law relating to the force between two or more charged particles in air and on the field strength due to a charged particle.
Recognise the similarities between electrical and gravitational fields.
Field of a point charge Ask students each to make a rough sketch showing the electric field lines that they would expect to be associated with a point, or a uniform sphere, of charge. (If necessary, remind them that the field lines indicate the direction of the force acting on a positive charge placed in the field.) Discuss students’ ideas and establish that the field lines must radiate equally in all directions from the charge.
Display a clear diagram on the board or OHP showing some of the field lines from a point charge passing through a square window of side x placed a distance r from the centre of the charge (x should be smaller than r ). Add a second square, side 2x, at a distance 2r. Establish that the number of lines per unit area is an indicator of field strength. Ask students to predict the relative strength of the field at the two distances shown, then ask them to predict the strength at distance 3r.
Establish that the field is predicted to vary inversely with the square of the distance. Remind students that they have met a very similar pattern when studying gravitational fields.
Demonstrate the use of a double flame probe to explore the strength and direction of the field of a uniform sphere of charge. Coat a large ball (10–20 cm diameter) with conducting paint and hang it from an insulating suspension at least 1 m from the bench top and other surfaces. Connect the ball to the positive terminal of an EHT supply (use metal foil and a crocodile clip to ensure a good electrical contact).
Use the flame probe to show that the field direction is radial and the field strength diminishes with distance. (Measurements of leaf deflection will probably not be precise enough to show conclusively that the field obeys an inverse-square law.)
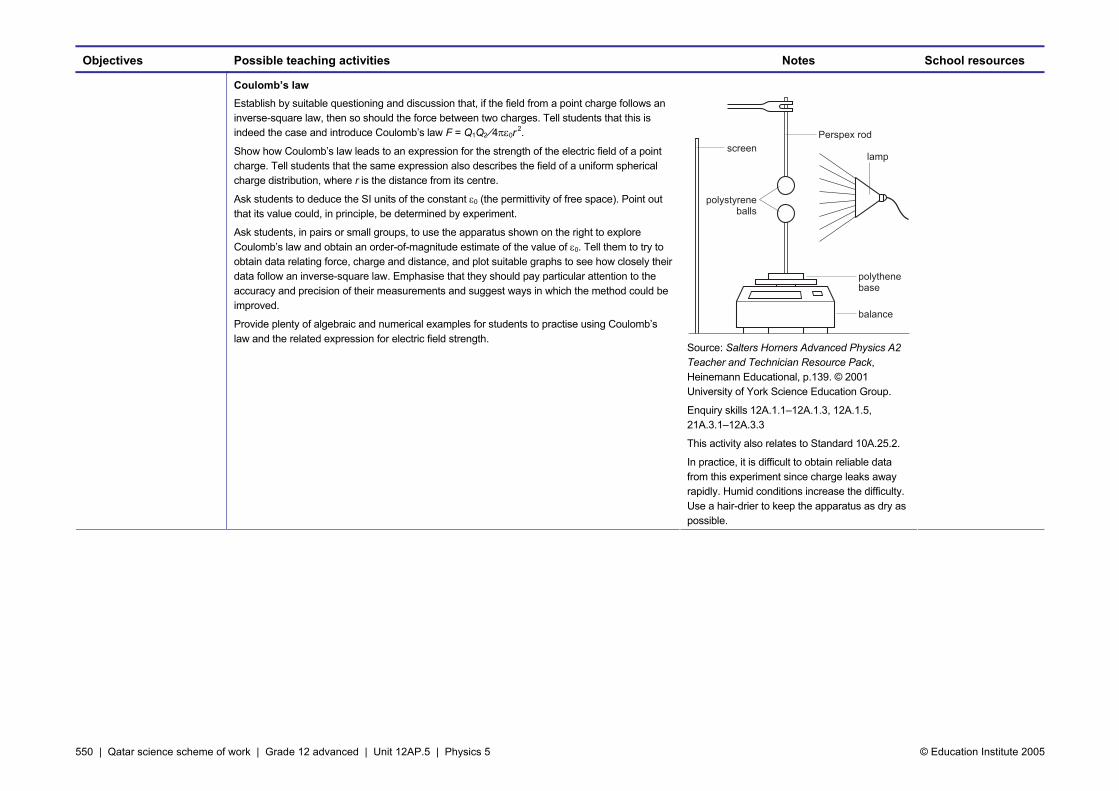
550 | Qatar science scheme of work | Grade 12 advanced | Unit 12AP.5 | Physics 5 © Education Institute 2005
Objectives Possible teaching activities Notes School resources
Coulomb’s law Establish by suitable questioning and discussion that, if the field from a point charge follows an inverse-square law, then so should the force between two charges. Tell students that this is indeed the case and introduce Coulomb’s law F = Q1Q2
⁄ 4πε0r 2.
Show how Coulomb’s law leads to an expression for the strength of the electric field of a point charge. Tell students that the same expression also describes the field of a uniform spherical charge distribution, where r is the distance from its centre.
Ask students to deduce the SI units of the constant ε0 (the permittivity of free space). Point out that its value could, in principle, be determined by experiment.
Ask students, in pairs or small groups, to use the apparatus shown on the right to explore Coulomb’s law and obtain an order-of-magnitude estimate of the value of ε0. Tell them to try to obtain data relating force, charge and distance, and plot suitable graphs to see how closely their data follow an inverse-square law. Emphasise that they should pay particular attention to the accuracy and precision of their measurements and suggest ways in which the method could be improved.
Provide plenty of algebraic and numerical examples for students to practise using Coulomb’s law and the related expression for electric field strength.
Source: Salters Horners Advanced Physics A2 Teacher and Technician Resource Pack, Heinemann Educational, p.139. © 2001 University of York Science Education Group.
Enquiry skills 12A.1.1–12A.1.3, 12A.1.5, 21A.3.1–12A.3.3
This activity also relates to Standard 10A.25.2.
In practice, it is difficult to obtain reliable data from this experiment since charge leaks away rapidly. Humid conditions increase the difficulty. Use a hair-drier to keep the apparatus as dry as possible.
551 | Qatar science scheme of work | Grade 12 advanced | Unit 12AP.5 | Physics 5 © Education Institute 2005
Objectives Possible teaching activities Notes School resources
Electric and gravitational fields Draw students’ attention to the fact that both electrical and gravitational fields and forces due to point charges or masses are described by inverse-square laws.
Divide students into small groups and ask them to brainstorm for a few minutes and list all the similarities and differences that they can think of between the two types of field and force.
Discuss students’ suggestions with the whole class and summarise them on the board or OHP. If necessary, prompt students by suitable questioning if there are important comparisons that they have not thought of, including the following: • for point objects, both obey an inverse-square law; • both can be represented by field lines; • gravitational force is always attractive whereas electrostatic forces can be attractive or
repulsive; • the forces due to several objects combine vectorially ...; • ... so electrostatic forces can cancel one another.
Tell students to make a chart or table comparing the two types of field.
Understanding electricity Ask students to describe any models (mental pictures) that they have used to aid their understanding of electricity, such as the carrier and driver models (outlined in Unit 10AP.7). Tell them that such models have played – and continue to play – an important role in our understanding of electricity.
Ask students to work in pairs to use books and the Internet to trace the historical development of ideas about electricity. Assign each pair to a different topic, or scientist, and ask them to produce a short summary (1–2 pages) of their findings, preferably in word-processed electronic form. Suitable topics include the following: • early two-fluid models (Du Fay); • single-fluid model (Franklin); • the modern atomic model of matter; • the development of ideas about field to describe ‘action at a distance’; • particle exchange models to describe ‘action at a distance’.
Collect all the students’ contributions together and copy and distribute them to the whole class.
ICT opportunities: Use of the Internet; use of word processing.
Enquiry skills 12A.1.6, 12A.1.8, 12A.2.1
552 | Qatar science scheme of work | Grade 12 advanced | Unit 12AP.5 | Physics 5 © Education Institute 2005
Objectives Possible teaching activities Notes School resources
4 hours
Capacitors
Demonstrate an understanding of the construction and use of capacitors in electrical circuits, and of how the charge is stored.
Define capacitance and solve problems using C = Q ⁄ V; derive and use formulae for capacitors in series and in parallel.
Define and use the relationship between the energy stored in a capacitor, its charge and the potential difference between its plates.
Safety: When using an EHT supply, ensure that the safety resistor is connected and that no one can come into electrical contact with the terminals.
Capacitors in circuits Remind students of their work in earlier grades by setting up several circuits demonstrating the behaviour of capacitors. Either arrange these in a circus so that pairs of students visit each in turn, or perform a sequence of demonstrations to the whole class. Students should make brief notes on each. Suitable examples include the following. • Charge a large capacitor by connecting it to a battery, then discharge it through a lamp.
Repeat, replacing the lamp by (in turn) a small motor, an LED and a microammeter. • Connect a capacitor in series with a resistor and a signal generator set to give a square-wave
input. Either connect a cathode-ray oscilloscope (CRO) in parallel first with the capacitor then with the resistor or use a dual-beam CRO to show both outputs simultaneously. Select the resistance R and capacitance C capacitor so that RC is about 0.1 s. Start with the signal frequency set to about 50 Hz then observe the effect of gradually increasing and reducing the frequency: at low frequencies there is time for complete charge and discharge, while at high frequencies the pd across the resistor is indistinguishable from the square-wave input.
• Connect a single diode in series with a resistor and a low-voltage AC power supply. Connect a CRO across the diode to show half-wave rectification. Show the smoothing effect of connecting a capacitor into the circuit. Repeat, replacing the single diode with a full-wave rectifier made from four diodes.
• Set up a delayed-action switching circuit. Show how changing the resistance and/or the capacitance affects the time delay.
• Establish that a capacitor stores electric charge and, when connected into a circuit, can act as a short-lived battery whose terminal pd falls to zero during discharge.
• Set up two metal plates (e.g. 20 cm × 20 cm) so that their planes are vertical and parallel to each other a few centimetres apart. Connect the plates to the terminals of an EHT supply. Previously, students have focused on the electric field between the plates, but now they should describe what they think is happening within the wires and plates when the EHT is switched on and the plates become charged. Explain that the pair of plates is acting as a capacitor: charge can flow to and from the plates but cannot cross the gap.
Show students the construction of an electrolytic capacitor and establish that the foils are behaving like the metal plates: there is no conducting path between them.
Charging and discharging Provide each pair of students with a large capacitor and resistor, two analogue ammeters and a battery that can be tapped to provide 1.5, 3, 4.5 and 6 V. Provide a briefing sheet that guides students through the following sequence of experiments illustrating capacitor charge and discharge. 1 Connect one meter to each side of the capacitor in series with the resistor and to a pd of
1.5 V. Observe the meter readings as the capacitor is charged. 2 Replace the battery by a conducting wire to discharge the capacitor. 3 Repeat, using 3 V instead of 1.5 V. 4 Charge the capacitor first by connecting to 1.5 V, then, without discharging, to 3 V, then 4.5 V,
then 6 V.
Enquiry skills 12A.4.1, 12A.4.2
553 | Qatar science scheme of work | Grade 12 advanced | Unit 12AP.5 | Physics 5 © Education Institute 2005
Objectives Possible teaching activities Notes School resources
As an extension, ask students to explore the effect of using different capacitors and resistors.
Discuss students’ observations and establish the following points. • During charge and discharge, charge flows throughout the circuit. There is no net transfer of
charge from battery to capacitor: rather, charge is redistributed so that one terminal of the capacitor becomes negative (gains electrons) and the other becomes positive (loses electrons).
• The amount of charge flowing can be estimated by observing the ammeter readings. Increasing the battery pd in equal steps gives rise to the same amount of charge flowing each time.
• When a capacitor is charged from zero, the total amount of charge flowing is directly proportional to the battery pd.
Introduce and define capacitance, C, as the proportionality constant relating charge Q to pd V: Q = CV. Introduce the SI unit of capacitance, the farad, F: 1 F = 1 C V–1. Explain that most practical capacitors have capacitances much less than 1 F, so values are usually expressed in µF or pF.
On the board or OHP, explain to students how the current, pd and charge vary while a capacitor is discharging though a resistor. Use graphs to show how each of these quantities varies with time. Start with a graph of pd against time: students will have already seen this displayed as a trace on a CRO. Establish that, as the stored charge, Q, is proportional to V, a graph of Q against t will have the same shape as the V–t graph. Ask students to sketch their suggested shape for a graph of discharge current, I, against time. Then establish that, as I = V ⁄ R, where R is the resistance in the circuit, this graph, too, will have the same shape.
Extend this discussion to include the shapes of graphs associated with a charging capacitor.
Ask students to suggest how changing the capacitance and/or the resistance would affect the discharge graphs. Establish that increasing either or both will increase the time taken for the pd and other quantities to fall by a given fraction, and that a suitable choice of R and C underlies the successful design of capacitor timing circuits,
Provide plenty of algebraic and numerical examples that allow students to practise using the relationship between charge, pd, current and capacitance.
Measuring capacitance Show students how to use a vibrating reed switch, driven by a signal generator, to produce repeated charging and discharging of a capacitor made from two large metal plates. Discuss how the discharge current I is related to the charge Q stored and discharged during each cycle, and the switch frequency f: I = Qf = CVf. Discuss how measurements of this current can be used in conjunction with a knowledge of the supply pd, V, to determine the value of C.
Ask students to consider the strengths and weaknesses of this method. A strength is that current can be measured at several different frequencies and C determined from the gradient of a graph of I against f, thus averaging over several sets of measurements. A weakness is that, at high frequencies, there might not be time for the capacitor to discharge fully.
If resources permit, let students work in small groups to carry out this experiment themselves.
Enquiry skills 12A.1.1–12A.1.3, 12A.1.5, 12A.3.1–12A.3.3, 12A.4.1, 12A.4.2
554 | Qatar science scheme of work | Grade 12 advanced | Unit 12AP.5 | Physics 5 © Education Institute 2005
Objectives Possible teaching activities Notes School resources
Combining capacitors If there is enough apparatus, ask students to work in pairs or small groups to study the charging and discharging of various combinations of capacitors using a CRO and a signal generator. Alternatively demonstrate this to the whole class.
Connect a single capacitor in series with a resistor and a signal generator giving a square-wave output, and connect a CRO across the capacitor. Choose values of R and C and/or adjust the signal frequency so that there is almost complete discharge during each cycle. Without making any further alterations to the resistance or the frequency or the CRO settings, connect a second and then a third identical capacitor in parallel with the first: the discharge takes longer, indicating that the capacitance has increased. Return to the single capacitor, then connect a second and then a third identical capacitor in series with it: now the capacitance has decreased so the discharge takes a shorter time.
On the board or OHP, show students how to derive expressions for combining capacitors in series and in parallel. Explain that when they are joined in parallel the capacitors all have the same pd across them, and the charge stored by the combination is equal to the sum of the individual charges: Q = Q1 + Q2 + Q3 + ..., hence C = Q ⁄ V = C1 + C2 + C3 + ...
Then explain that, when capacitors are joined in series, charge must be distributed in such a way that each stores the same charge Q, which is the same as the charge stored by the combination. Therefore Q ⁄ C = V = V + V + V = Q ⁄ C1 + Q ⁄ C2 + Q ⁄ C3 + ..., and hence 1 ⁄ C = 1 ⁄ C1 + 1 ⁄ C2 + 1 ⁄ C3 + ...
Point out that, while these expressions resemble those for combining resistors, here the simple additive relationship applies to capacitors in parallel, whereas a similar relationship applies to resistors in series.
Provide plenty of algebraic and numerical examples that allow students to practise using the relationships for capacitors in series and parallel.
Energy in capacitors Perform some short demonstrations to show that capacitors store energy. Suitable examples include: • a camera flash-gun; • discharge a large capacitor through a motor set to lift a small weight; • discharge a large capacitor through a coil of wire wrapped around a temperature sensor.
On the board or OHP, show students how to derive an expression for the energy stored in a charged capacitor. Depending on the mathematical fluency of the students, use a graphical method and/or integral calculus to show that energy = ½ QV.
Ask students to deduce expressions for stored energy in terms of (a) C and V, and (b) C and Q.
Point out the analogy between charging a capacitor and stretching a spring.
Mathematics: A knowledge of integral calculus is helpful but not required.
Enquiry skills 12A.1.2, 12A.4.1, 12A.4.2
555 | Qatar science scheme of work | Grade 12 advanced | Unit 12AP.5 | Physics 5 © Education Institute 2005
Objectives Possible teaching activities Notes School resources
Ask students to work in pairs to explore the energy stored in a capacitor. Provide each pair with apparatus and a briefing sheet to guide them though the following sequence of experiments. 1 Charge a large capacitor by connecting it to a 1.5 V cell, then discharge it through a single
torch bulb. Repeat a few times and note the visual appearance of the bulb during discharge. 2 Charge the same capacitor using a 3 V battery. Discharge it through two bulbs connected in
series (so as to ensure the same initial pd across each). Note the brightness of the flash (it is brighter than in step 1).
3 Connect a second pair of bulbs in parallel with the first and repeat step 2. Note the brightness of the flash from each bulb (the flash from each bulb is now similar to that produced in step 1).
4 Predict the effect of charging the same capacitor with a 6 V battery. Decide how many bulbs, and in what arrangement, would allow each one to give the same flash as the single bulb in step 1. (Nine bulbs are required, connected in a 3 × 3 array.)
Discuss the outcome of this activity and establish that the results are as expected (i.e. energy is directly proportional to V 2).
Provide plenty of algebraic and numerical examples that allow students to practise using relationships involving energy storage in a capacitor.

556 | Qatar science scheme of work | Grade 12 advanced | Unit 12AP.5 | Physics 5 © Education Institute 2005
Assessment
Examples of assessment tasks and questions Notes School resources
A potential difference of 2.5 kV is applied to a pair of parallel metal plates separated by 8 cm. What is the force experienced by a charge of 6.0 mC within the space between the plates?
Use Coulomb’s law to derive an expression for the magnitude of the electric field strength E at a distance r from a point charge Q.
In a hydrogen atom, the average distance between the proton and the electron is about 0.037 nm. Calculate the magnitude of the force between them. (Electron charge e = 1.60 x10⁻¹⁹ C.)
List at least two ways in which electrical and gravitational fields are similar, and at least two ways in which they differ.
At particle physics laboratories such as CERN, the kinetic energies of accelerated particles are often expressed in MeV.
a. What is 1 MeV expressed in joules?
b. If a proton has kinetic energy 1.5 MeV, what is its speed?
(Electron charge e = 1.60 x 10⁻¹⁹ C. Proton mass mp = 1.67 x 10⁻²⁷ kg.)
Draw a diagram showing the electric field lines and the lines of equipotential around two positive point charges placed a few centimetres apart.
Draw a labelled set of sketch graphs to show how the pd across a capacitor, the charge stored and the current in the circuit change with time as the capacitor discharges through a resistor. On the same axes, draw another set of graphs showing how the pd, charge and current would change with time if the original resistor were replaced by one with greater resistance.
A 100 µF capacitor is connected to a 3 V battery then discharged through a 500 Ω resistor. Calculate:
a. the initial charge stored;
b. the initial discharge current;
c. the discharge current when the capacitor has lost half its initial charge.
Three capacitors, of capacitance 1, 2 and 4 pF, are connected (a) in series, (b) in parallel. Calculate the resulting capacitance in each case.
Assessment Set up activities that allow students to demonstrate what they have learned in this unit. The activities can be provided informally or formally during and at the end of the unit, or for homework. They can be selected from the teaching activities or can be new experiences. Choose tasks and questions from the examples to incorporate in the activities.
A 10 000 µF capacitor is connected to a 12 V battery then discharged through a lamp. How much energy is emitted?
Unit 12AP.5
557 | Qatar science scheme of work | Grade 12 advanced | Unit 12AP.6 | Physics 6 © Education Institute 2005
GRADE 12A: Physics 6
Quantum and nuclear physics
About this unit This unit is the sixth of seven units on physics for Grade 12 advanced.
The unit is designed to guide your planning and teaching of physics lessons. It provides a link between the standards for science and your lesson plans.
The teaching and learning activities should help you to plan the content and pace of lessons. Adapt the ideas to meet your students’ needs. For consolidation activities, look at the scheme of work for Grade 11A.
You can also supplement the activities with appropriate tasks and exercises from your school’s textbooks and other resources.
Introduce the unit to students by summarising what they will learn and how this builds on earlier work. Review the unit at the end, drawing out the main learning points, links to other work and real world applications.
Previous learning To meet the expectations of this unit, students should already know that light can be dispersed to form a spectrum and should be able to describe electromagnetic radiation in terms of waves. They should be able to describe a simple model of the atom in terms of protons, neutrons and electrons, and show an understanding of the properties of the electron. They should be able to describe the processes of nuclear fission, fusion and decay, and know that such processes release energy.
Expectations By the end of the unit, students distinguish between emission and absorption spectra. They recall and use the relationships E = hf and E = mc2 and explain the quantisation of charge and electromagnetic radiation and know some applications and consequences of this. They know the source of nuclear energy.
Students who progress further explain electron orbitals in terms of quantisation of angular momentum and know how quantum theory leads to the idea of electron ‘probability clouds’.
Resources The main resources needed for this unit are: • gold-leaf electroscope with very clean zinc plate • ultraviolet lamp and infrared heater • photocell and circuit components to measure the stopping potential • discharge lamps (e.g. neon, helium, sodium, mercury) • hand-held spectroscopes • grating spectrometer • iodine or mercury vapour lamp for demonstrating absorption spectra • electron diffraction tube • deflection tube and Helmholtz coils • apparatus for Millikan’s oil-drop experiment • chain or thick cord approximately 1 m long • vibration generator
Key vocabulary and technical terms Students should understand, use and spell correctly: • photoelectric effect, photoelectron, quantum, quantisation, photon, work
function, threshold frequency, Planck constant • line spectrum, continuum, emission spectrum, absorption spectrum • energy level, ground state • de Broglie wavelength, wave–particle duality • angular momentum, orbital • quantum mechanics, Schrödinger equation • binding energy, mass defect
UNIT 12AP.6 14 hours

558 | Qatar science scheme of work | Grade 12 advanced | Unit 12AP.6 | Physics 6 © Education Institute 2005
Standards for the unit
14 hours SUPPORTING STANDARDS CORE STANDARDS Grade 12 standards
EXTENSION STANDARDS
11A.29.3 Use a diffraction grating to show diffraction and the production of visible spectra …
12A.30.1 (part)
Distinguish between emission and absorption spectra; know how these can provide information on the elements present ...
12A.30.1 Distinguish between emission and absorption spectra; know how these can provide information on the elements present in stellar objects and how far away the objects are.
11A.29.6 Explain electromagnetic radiation in terms of oscillating electric and magnetic fields and know that all electromagnetic waves travel with the same velocity in free space. Describe the main characteristics and applications of the different parts of the electromagnetic spectrum ...
12A.30.2 Know about the particulate nature of electromagnetic radiation; recall and use the formula E = hf.
11A.32.2 Describe a simple model for the nuclear atom in terms of protons, neutrons and electrons ...
12A.25.6 Derive, and use expressions relating the kinetic, potential and total energy of an orbiting satellite.
12A.30.3 Explain atomic spectra and permitted electron orbitals in terms of the quantisation of angular momentum.
12A.30.4 Show an understanding of the quantisation of electronic charge as demonstrated, for example, by Millikan’s experiment.
11A.32.9 Show an understanding of the properties of the electron and the operation of the cathode-ray tube and the television tube.
12A.30.5 Show an understanding of wave–particle duality in the properties of the electron.
11A.32.7 Distinguish between nuclear fission and nuclear fusion ...
11A.32.8 Understand that ... nuclear fission can be used ... as a source of energy ...
12A.30.6 Show an understanding of the interconversion of matter and energy and use the equation E = mc2 and recognise that this explains the phenomenon of nuclear energy.
12A.31.5 Explain the process of element formation in stars and know how this leads to the generation of energy.
12A.25.2 Understand and use the concept of angular velocity to solve problems in various situations using the formulae v = rω, a = rω2 and a = v2/r.
5 hours
Radiation and spectra
5 hours
The electron
2 hours
Electrons in atoms
2 hours
Light, energy and matter
10A.28.8 ... know the meaning of the terms node and antinode, and illustrate the phenomenon of resonance with particular reference to vibrating stretched strings and air columns.
12A.30.7 Know how the Schrödinger model for the hydrogen atom leads to the concept of discrete energy states for electrons and to the idea of the probability of finding an electron at any point (related to the square of the amplitude of the wave function) and hence to the concept of ‘electron clouds’.
Unit 12AP.6
559 | Qatar science scheme of work | Grade 12 advanced | Unit 12AP.6 | Physics 6 © Education Institute 2005
Activities
Objectives Possible teaching activities Notes School resources
5 hours
Radiation and spectra Distinguish between emission and absorption spectra; know how these can provide information on the elements present ...
Know about the particulate nature of electromagnetic radiation; recall and use the formula E = hf.
The photoelectric effect Perform the following demonstration to the whole class. Use a gold-leaf electroscope with a very clean zinc plate. First give the plate a negative charge (e.g. by connecting it temporarily to the negative terminal of a DC power supply). Show that shining ultraviolet (UV) radiation onto the plate discharges it, while intense visible or infrared radiation (IR) from a radiant heater has no effect. Repeat using a positively charged plate: no radiation has any effect.
Divide the class into small groups and ask them to brainstorm and suggest explanations for what they have observed. Note all their suggestions on the board or OHP.
Discuss students’ suggestions with the whole class and use suitable questioning to establish the following points. • Radiation can cause the electroscope to lose negative charge. • The electroscope discharges because electrons escape from it. • The UV radiation causes electrons to be emitted from the zinc. • Even very intense visible or IR radiation is unable to cause the emission of electrons,
whereas weak UV can do so. • The radiation must be transferring energy to the electrons in the plate in order to cause their
emission. • The way in which the energy is delivered (i.e. the type of radiation) is important, whereas the
total amount of energy (or power, or intensity) is not.
Introduce and define the terms photoelectric effect and photoelectron. Tell students that the effect was the subject of great interest in the late nineteenth and early twentieth centuries. Divide the class into small groups and ask them to use what they know about the wave nature of electromagnetic radiation to explain the photoelectric effect. Discuss their ideas with the whole class and establish that a wave model cannot explain the observations. Point out that a wave model predicts that intense radiation of any wavelength would transfer energy to the metal so that eventually many electrons would escape when the metal became hot enough (i.e. there would be thermionic emission). Contrast this prediction with observation: even weak UV radiation causes the instant emission of electrons from a cold metal, whereas intense visible or IR has no effect.
Explain to students how the photoelectric effect can be understood. Introduce and define the terms quantum, quantisation and photon. Point out that the explanation requires that photons of UV radiation are more energetic than those of IR or visible radiation. Introduce the formulae E = hf = hc ⁄ λ and point out that they describe the relationship between the wave model of light (which deals with frequency and wavelength) and the photon model (which deals with energy of individual quanta). Introduce the Planck constant h and establish its SI units.
Use this column to note your own school’s resources, e.g. textbooks, worksheets.
Unit 12AP.6

560 | Qatar science scheme of work | Grade 12 advanced | Unit 12AP.6 | Physics 6 © Education Institute 2005
Objectives Possible teaching activities Notes School resources
Energy of photoelectrons Explain to students how the initial kinetic energy of photoelectrons, Ek, can be measured by applying an adverse potential difference across a photocell: Ek = eV, where V is the pd that just prevents electrons crossing the cell. If sufficient apparatus is available, ask students to work in pairs to take measurements using a photocell illuminated by radiation of various frequencies (produced by shining light through various filters) Alternatively, demonstrate this to the whole class and generate a set of measurements for all students to use. Tell students to plot a graph of V against f.
Discuss the graphs with students. Introduce and explain the terms threshold frequency and work function. Establish how values of these for a given metal, and for the Planck constant, can be determined from the graphs.
Provide plenty of numerical and algebraic examples that allow students to practise using formulae relating to the photoelectric effect.
Enquiry skills 12A.1.1, 12A.1.3, 12A.3.1–12A.3.4, 12A.4.1
The nature of light Divide the class into pairs and give each pair the task of using library or Internet resources to research one topic relating to the historical development of our understanding of the nature of electromagnetic radiation. Suitable topics include the following. • Isaac Newton’s theory of corpuscles. • Islamic scientists’ theories of light. • Thomas Young’s experiments with waves. • The discovery of infrared radiation. • Hertz and radio waves. • Maxwell’s theory of electromagnetic waves. • Planck, Einstein and the photoelectric effect.
Each pair should produce an A3 poster summarising what they find. Display these around the lab in chronological order and then discuss them with the whole class. Establish that, in the eighteenth and nineteenth centuries, scientists were addressing the question of whether light behaved either as a wave or as a particle, but study of the photoelectric effect revealed that neither model was exclusively applicable. Nowadays, we use both models and choose whichever is appropriate for a particular situation.
ICT opportunity: Use of the Internet.
Enquiry skills 12A.1.6, 12A.1.8, 12A.2.1, 12A.2.4, 12A.2.5, 12A.3.4

561 | Qatar science scheme of work | Grade 12 advanced | Unit 12AP.6 | Physics 6 © Education Institute 2005
Objectives Possible teaching activities Notes School resources
Line spectra Set up a circus of activities relating to line spectra. Tell students to work in pairs to visit each in turn and record their observations and measurements. Suitable activities include the following. • Look through a fine diffraction grating at the spectra produced by various discharge lamps
(e.g. neon, helium, sodium, mercury). • Use a grating spectrometer to measure the first-order diffraction angles of visible light from a
hydrogen and/or a mercury lamp. (More advanced students could, if time permits, use their measurements to determine the wavelengths present.)
• Use a hand-held spectroscope to observe the spectrum of sunlight scattered from a pale matt surface (e.g. a whitewashed wall, clouds, white paper).
• Use a hand-held spectroscope to study the absorption spectrum of iodine or mercury in a vapour lamp.
Discuss students’ observations, introduce the terms line spectrum, continuum, emission spectrum and absorption spectrum, and establish the following points. • A heated vapour (e.g. in a gas discharge tube) can produce an emission line spectrum
containing just a few discrete colours/wavelengths/frequencies. • The wavelengths can be measured using a diffraction grating. • Each element has its own distinct line spectrum. • If continuum radiation shines through a vapour, an absorption line spectrum is produced. • The wavelengths present in an emission line spectrum are the same as those absent in the
absorption line spectrum of the same element.
Safety: Students must not look directly at the Sun either with their naked eyes or through an instrument.
Enquiry skills 12A.4.1. 12A.4.2
Using line spectra Prepare a PowerPoint presentation to explain to students how line spectra can be used to deduce the elements present in a substance that can only be observed from a distance. Include the following examples along with any others that you are able to find. • During steel processing, the spectrum of light emitted by the hot molten metal provides
information about the relative proportions of elements present. Further ingredients can then be added to produce a steel with a precisely determined composition.
• Continuum emission from the hot surfaces of stars passes through the overlying cooler gases, giving rise to absorption spectra that indicate the elements present in the star’s atmosphere. (Point out that helium was first identified in the Sun’s spectrum, hence its name derived from the Greek helios = Sun.)
Explaining line spectra With the whole class, discuss how line spectra can be explained. Use suitable questioning to establish that the atoms of a given element can only emit or absorb certain wavelengths, which implies that only photons of certain energies can be emitted or absorbed. Hence the energy of each atom must be quantised. Tell students that these energy changes are associated with changes in the way electrons orbit the nucleus. Point out the similarities between orbiting electrons and orbiting planets: a change of orbit is associated with changes in kinetic and potential energy.
562 | Qatar science scheme of work | Grade 12 advanced | Unit 12AP.6 | Physics 6 © Education Institute 2005
Objectives Possible teaching activities Notes School resources
Introduce the concept of energy levels and show how they can be represented diagrammatically.
Remind students that the electronvolt is a convenient unit for expressing small energies.
Display a large clear diagram of the energy levels of a hydrogen atom on the board or OHP. Show how the levels can be labelled in J and/or eV, and point out that the highest level indicates ionisation of the atom. Point out that photon emission and absorption gives information only about the differences between energy levels, not their absolute values, so energy-level diagrams are sometimes labelled with zero at the ground state (giving all other levels positive values) and sometimes with zero at the top, corresponding to a free electron and a positive ion, so that all levels corresponding to a bound electron have negative energies.
Allocate each student two different pairs of energy levels and get them to calculate the energy differences between the two and hence deduce the frequencies and wavelengths of the hydrogen line spectrum. Tell students to write their results in a large grid on the board or OHP, with rows and columns headed 1, 2, 3, etc., to indicate the initial and final energy levels. Students should appreciate that in addition to the visible lines (which involve transitions between the second and higher energy levels) hydrogen has spectral lines in the UV and IR parts of the electromagnetic spectrum.
Finally point out that the analysis of line spectra involves using both wave and photon models of light: the wave model is needed when measuring the wavelengths, whereas the photon model is needed when relating the spectral lines to energy changes within an atom.
5 hours
The electron Show an understanding of the quantisation of electronic charge as demonstrated, for example, by Millikan’s experiment.
Show an understanding of wave–particle duality in the properties of the electron.
Properties of the electron Divide the class into three groups and allocate one group to each of the following topics: • measuring e/m for electrons; • Millikan’s experiments to determine electron charge; • electron diffraction.
Ask each group to research and prepare a presentation for the rest of the class. Each presentation should include at least one demonstration, one example of a historical document relating to the original research, and a handout summarising key points for distribution to the rest of the class. Depending on class size, the groups could be subdivided so that, for example, some students rehearse demonstrations while others produce the handouts.
Provide a briefing sheet for each group to indicate useful sources of information, including textbooks and Internet sites.
Allow plenty of time for preparation and rehearsal. Spend time with each group showing them how to use the apparatus for demonstration and ensuring that they know the relevant physics. Discuss the following points with the relevant group while they prepare their presentations.
Measuring e/m
Explain how the expression for electromagnetic force on a current (F = BIl sinθ ) can be used to show that the electromagnetic force on a single particle is F = Bqv sinθ.
Discuss how deflection plates and Helmholtz coils can be used to provide opposing electrostatic and electromagnetic forces on an electron beam in a cathode-ray tube.
Enquiry skills 12A.1.4, 12A.1.5, 12A.1.8, 12A.2.1, 12A.2.2, 12A.2.4, 12A.2.5, 12A.3.1, 12A.3.4, 12A.4.1, 12A.4.2
ICT opportunity: Use of the internet.
Safety: When using EHT supplies ensure that internal safety resistors are connected and that no-one can come into electrical contact with the terminals.
Prepare suitable briefing sheets.

563 | Qatar science scheme of work | Grade 12 advanced | Unit 12AP.6 | Physics 6 © Education Institute 2005
Objectives Possible teaching activities Notes School resources
Show how the magnetic field on the axis of Helmholtz coils can be measured or calculated.
Discuss how experimental measurements can be combined to yield a value for e/m.
Establish that, historically, interpretation of the experiment implied a particle model for cathode rays.
Millikan’s experiments
Establish that a fine spray of oil drops can become charged by friction.
Show how opposing electrostatic and gravitational forces can suspend a charged oil-drop at rest.
Discuss how the weight of an oil drop can be determined from measurements of its terminal velocity as it falls in air.
Discuss how Millikan’s measurements provided evidence for the quantisation of charge and led to a value for the size of the charge quantum, e.
Point out that Millikan has been criticised for selective interpretation of his results.
Electron diffraction
Show how an electron beam produces a diffraction pattern when passing through a thin layer of graphite.
Discuss how the structure of graphite enables it to act as a diffraction grating.
Establish that the results can be interpreted only if the electron beam is assumed to have wave-like properties. Introduce the term de Broglie wavelength.
Discuss how varying the accelerating pd affects the wavelength of the electron beam.
Establish that the wavelength varies inversely with the square root of the accelerating pd.
Discuss how the pd is related to the electrons’ kinetic energy and hence to their momentum. Show that the wavelength λ is inversely proportional to momentum p and introduce the expression λ = h ⁄ p.
Wave–particle duality When all three groups have made their presentations, discuss them with the class and establish that, just as there are two ways of modelling the behaviour of light, so there are two ways of modelling the behaviour of electrons. Introduce the term wave–particle duality and point out that all particles have a de Broglie wavelength, not just electrons.
Explain the operation of an electron microscope and establish that, while a particle model is needed to explain the initial acceleration, a wave model is required in order to explain the production of an image.
Extend the discussion of wave–particle duality to include electromagnetic radiation. By suitable questioning, guide students to the conclusion that photons have momentum p = h ⁄ λ. Explain how this gives rise to a measurable radiation pressure, which might one day be exploited in interplanetary solar sails.
Provide plenty of examples that allow students to practise using concepts and equations relating to wave–particle duality.
564 | Qatar science scheme of work | Grade 12 advanced | Unit 12AP.6 | Physics 6 © Education Institute 2005
Objectives Possible teaching activities Notes School resources
2 hours
Electrons in atoms Explain atomic spectra and permitted electron orbitals in terms of the quantisation of angular momentum.
Know how the Schrödinger model for the hydrogen atom leads to the concept of discrete energy states for electrons and to the idea of the probability of finding an electron at any point (related to the square of the amplitude of the wave function) and hence to the concept of ‘electron clouds’.
Quantisation of energy levels Refer to previous work on line spectra and the properties of the electron in a discussion with the whole class.
Establish that the existence of line spectra provides important evidence of quantisation of energy and discuss how an understanding of wave-like electron properties can be related to the quantisation of energy levels.
Demonstrate standing waves on a stretched string and ask suitable questions to remind students of their work on standing waves and resonance from earlier grades. Extend the discussion to include electrons, and hence establish that an electron in a confined space can only have certain sizes of de Broglie wavelength. Discuss the simple example of an electron in a one-dimensional box with infinitely high sides: there must be a node at each end and hence there must be a whole number of half-wavelengths within the box.
Point out that, while not in a simple box, an electron within an atom is in a confined space, and hence its de Broglie wavelength can only take certain values. Students should appreciate that the electron’s momentum and hence its energy must also be restricted to certain values (i.e. there must be quantisation).
Bend a piece of springy wire about 50 cm long into a circle and attach it to a vibration generator so that the circle is vertical. Demonstrate standing waves on the ring. Students should be able to appreciate that these occur only at frequencies that allow a whole number of wavelengths to fit around the circumference of the circle. Tell students that the de Broglie waves of electrons within atoms must also fit around the circumference of a circle and hence there are only certain allowed orbitals.
Using suitable diagrams on the board or OHP, explain how the wavelength of a circular electron standing wave in an atom is related to the electron’s momentum. Introduce the term angular momentum, L, for a particle in circular orbit radius r and show that L = mvr = mr2ω, where ω is the angular velocity. Hence establish that the permitted electron orbitals can be explained in terms of the quantisation of angular momentum.
Quantum mechanics Introduce the term quantum mechanics and tell students that, loosely, it is the branch of physics that deals with wave models of matter and radiation and the quantisation associated with such models. Discuss with students some of the conceptual and philosophical difficulties associated with the interpretation of quantum mechanics. For example, discuss double-slit interference and the problem of reconciling wave and photon models of radiation: any experiment to determine the path of individual photons destroys the interference pattern.
Remind students that the intensity of a light or sound wave is proportional to the square of its amplitude. In the photon model, the intensity is proportional to the number of photons arriving in a given time. This leads to a useful way of bringing together the wave and photon models: the probability of a photon arriving at a point is proportional to the square of the wave amplitude at that point.
Enquiry skills 12A.1.8, 12A.2.1, 12A.2.6

565 | Qatar science scheme of work | Grade 12 advanced | Unit 12AP.6 | Physics 6 © Education Institute 2005
Objectives Possible teaching activities Notes School resources
Tell students that waves associated with electrons and other particles can also be interpreted in terms of probability. Introduce the ideas underlying the Schrödinger equation: if it is known how a particle’s potential energy varies with position, it must also be possible to deduce how its kinetic energy and hence its momentum vary with position. This in turn shows how its wavelength must vary with position.
Demonstrate a wave of variable wavelength by holding a chain or thick cord so that it hangs vertically, then oscillate the top sideways so as so set up a standing wave with at least two nodes: as the tension decreases going down the chain, the wave velocity and wavelength also decrease.
Refer to the previous demonstrations of standing waves and point out that the one-dimensional model of an electron wave around a circle is a simplification, as an electron in an atom occupies a three-dimensional space. Tell students that the Schrödinger equation describes a three-dimensional wave. Tell them that, in a hydrogen atom, the equation has solutions only for certain values of the electron energy, and these correspond to the permitted energy levels deduced from measurements on line spectra. In each of these solutions, there is one radius at which the wave amplitude reaches a maximum: this corresponds to the radius at which the electron is most likely to be found. Explain that it is not possible to say precisely where the electron is at any one time, and hence explain the concept of electron clouds, which relate to the probability of finding an electron.
To consolidate their work in this section, ask all students to read at least one passage from a book or website describing wave–particle duality as it relates to electrons or photons, and to make notes on the following points. • Does the author say that wave–particle duality comes from theory, experiment or both? • Does the author discuss randomness and probability? If so, how do they relate these to the
observed behaviour of photons or electrons? • How does the author relate events on a very small scale (individual photons or electrons) to
what we observe on a large scale? • What does the author say about the way we describe electrons or photons? Do they use
words such as ‘model’ or ‘analogy’?

566 | Qatar science scheme of work | Grade 12 advanced | Unit 12AP.6 | Physics 6 © Education Institute 2005
Objectives Possible teaching activities Notes School resources
E = mc2
Display the equation E = mc2 on the board or OHP and ask students what they already know about it: they will almost certainly recognise it and might be able attribute it to Einstein.
Tell students that Einstein derived the equation while he was trying to understand aspects of light and electromagnetism, and that it forms part of his special theory of relativity published in 1905.
Explain that the equation describes the interconversion between mass m and energy E. Draw attention to the revolutionary nature of this relationship: in everyday life, and so far in their study of physics, students treat matter and energy as completely different entities. Point out that, for many years after its publication, the equation was thought to be a meaningless by-product of the theory of relativity which sets out the equations of motion for objects travelling close to the speed of light, c.
Prepare and present to the class a series of PowerPoint slides giving examples of the interconversion of matter and energy, illustrated with appropriate photographs and diagrams. Suitable examples include the following. • The creation of subatomic particles in high-energy collisions (e.g. in cosmic rays, in particle
physics experiments). • The annihilation of particles and antiparticles (e.g. electron annihilating a positron) to produce
electromagnetic radiation. • Nuclear processes: the slight loss of mass and its relationship to the increase in kinetic
energy.
Enquiry skills 12A.2.1, 12A.2.4, 12A.2.5
2 hours
Light, energy and matter Show an understanding of the interconversion of matter and energy and use the equation E = mc2 and recognise that this explains the phenomenon of nuclear energy.
Nuclear energy Introduce and explain the terms mass defect and binding energy. Display a chart showing how binding energy per nucleon varies with atomic number and discuss how its shape relates to nuclear fission and fusion reactions. Using suitable questioning, guide students through a ‘thought experiment’ in which a heavy nucleus is first separated into its individual nucleons (requiring an energy input) then reassembled into two smaller nuclei (releasing more energy than was initially supplied).
Establish that, in order for energy to be released, the total mass of products must be less than the total mass of reactants, and hence that energy is released in the fusion of light nuclei and in the fission of heavy nuclei.
Provide several examples that allow students to practise using E = mc2 in the context of nuclear energy.
567 | Qatar science scheme of work | Grade 12 advanced | Unit 12AP.6 | Physics 6 © Education Institute 2005
Objectives Possible teaching activities Notes School resources
Understanding light To consolidate and extend students’ work in this unit on the nature of light, ask them to produce a timeline chart showing how ideas about light and other parts of the electromagnetic spectrum have developed since the eighteenth century. They should include the following developments and should use the Internet and library resources to find the approximate date and the names of key people involved in each case. • Studies of the photoelectric effect indicate that light is quantised. • Particle–antiparticle annihilation is observed to produce gamma radiation. • Experiments establish that light can exert a pressure. • Einstein’s theory of special relativity proposes that light always travels at the same speed
relative to any observer. • Double-slit interference is explained in terms of probability waves. • Interference experiments demonstrate the wave nature of light. • Measurements of radioisotopes establish that mass and energy are interrelated through the
speed of light. • It is proposed that photons have momentum.
ICT opportunity: Use of the Internet.
Enquiry skills 12A.1.8, 12A.2.1, 12A.2.4–12A.2.6

568 | Qatar science scheme of work | Grade 12 advanced | Unit 12AP.6 | Physics 6 © Education Institute 2005
Assessment
Examples of assessment tasks and questions Notes School resources
Radiation of wavelength 410 nm shines onto a metal with work function 1.2 × 10⁻¹⁹ J. What is the maximum possible kinetic energy of the photoelectrons?
Electron charge e = 1.60 × 10⁻¹⁹ C, Planck constant h = 6.63 × 10⁻³⁴ J s.
In part of an electron energy level diagram for mercury, the ground state is labelled –10.4 eV, and there are higher states labelled –5.5 eV and –5.0 eV.
a. Draw a diagram to represent these energy levels.
b. Write down the energies of the photons that could be emitted or absorbed in transitions between these levels.
c. Calculate the shortest wavelength of radiation that could be emitted in these transitions.
d. Explain why the levels are all labelled with negative energies.
In each of the following situations, say whether you would use a wave model or a photon model of electromagnetic radiation to explain what happens. Give reasons for your decisions.
a. Light shines onto a wall through two closely spaced narrow slits and produces a series of bright spots.
b. Light stimulates the cells in the retina of your eye so that you see different colours.
c. Gamma radiation produces a series of ‘clicks’ in a Geiger counter.
d. A radio receiver picks up signals direct from the transmitter and reflected from a nearby building; the two interfere to give a resultant that is weaker than either signal on its own.
Explain how Millikan’s experiments enabled the electron charge to be determined.
Electrons are accelerated from rest through a pd of 5000 V. What is their resulting de Broglie wavelength?
Write a short article for an encyclopaedia explaining the term wave–particle duality.
Assessment Set up activities that allow students to demonstrate what they have learned in this unit. The activities can be provided informally or formally during and at the end of the unit, or for homework. They can be selected from the teaching activities or can be new experiences. Choose tasks and questions from the examples to incorporate in the activities.
An isotope of plutonium absorbs a neutron and undergoes nuclear fission:
239 1 145 9394 0 56 36Pu n Ba Kr+ → +
Using the data listed below, calculate the energy released.
23994Pu : m = 239.052 17 u
10n : m = 1.008 665 u
14556Ba : m = 144.926 94 u
9336Kr : m = 92.931 12 u
1 u = 1.661 × 10⁻²⁷ kg
speed of light c = 3.00 × 10⁸ m s–1
Unit 12AP.6

569 | Qatar science scheme of work | Grade 12 advanced | Unit 12AP.7 | Physics 7 © Education Institute 2005
GRADE 12A: Physics 7
Astrophysics and cosmology
About this unit This unit is the seventh of seven units on physics for Grade 12 advanced.
The unit is designed to guide your planning and teaching of physics lessons. It provides a link between the standards for science and your lesson plans.
The teaching and learning activities should help you to plan the content and pace of lessons. Adapt the ideas to meet your students’ needs. For consolidation activities, look at the scheme of work for Grade 11A.
You can also supplement the activities with appropriate tasks and exercises from your school’s textbooks and other resources.
Introduce the unit to students by summarising what they will learn and how this will build on earlier work. Review the unit at the end, drawing out the main learning points, links to other work and real world applications.
Previous learning To meet the expectations of this unit, students should already know that each element give rise to its own characteristic line spectra, that electromagnetic radiation travels through space at finite speed, and that relative motion between an observer and wave source gives rise to the Doppler effect. They should know that all matter is affected by gravitational force. They should also know that stars are powered by nuclear fusion reactions that lead to the production of heavier elements.
Expectations By the end of the unit, students know how emission and absorption spectra yield information about distant stars and galaxies. They explain the structure of the visible Universe in terms of the gravitational attraction between objects. They define and use the parsec and the light-year. They explain the creation and evolution of stars and know how their ultimate fate depends on their mass. They know how elements are formed in stars and how planetary systems arise. They know the ‘big bang’ theory of the origin of the Universe and can adduce evidence for it.
Students who progress further know how a Hertzsprung–Russell diagram can be used to summarise properties of stars and to represent changes as they evolve. They are aware of the evidence on which current theories of star formation and the big bang are based. They understand the importance of gravity in determining the ultimate fate of the Universe and know how the Universe can be, at the same time, finite but without boundaries.
Resources The main resources needed for this unit are: • binoculars • planisphere or star map • materials for making scale models (e.g. fruit, marbles, sand) • tennis ball and table-tennis ball
Key vocabulary and technical terms Students should understand, use and spell correctly: • constellation, nebula, star, planet • luminosity, intensity, flux • Hertzsprung–Russell (HR) diagram • light-year, astronomical unit, parsec • galaxy, Milky Way • red giant, white dwarf, black hole, neutron star, pulsar • dense cloud, supernova remnant, planetary nebula • protostar, main sequence, supernova • accretion disc, stellar wind, exoplanet, evolutionary track • redshift, Hubble’s law, Hubble constant, big bang • open universe, closed universe, critical density
UNIT 12AP.7 15 hours

570 | Qatar science scheme of work | Grade 12 advanced | Unit 12AP.7 | Physics 7 © Education Institute 2005
Standards for the unit
15 hours SUPPORTING STANDARDS CORE STANDARDS
Grade 12 standards EXTENSION STANDARDS
11A.29.3 Use a diffraction grating to show ... visible spectra …
11A.29.4 Explain the Doppler effect in terms of wave motion and give examples from sound and light.
12A.30.1 Distinguish between emission and absorption spectra; know how these can provide information on the elements present in stellar objects and how far away the objects are.
12A.25.4 Recall and use Newton’s law of universal gravitation in the form F = G(m1m2)/r2 and relationships derived from it.
12A.31.1 Describe, and explain in terms of gravitational attraction, the structure of the visible Universe today and know that our Sun is a star in the Milky Way galaxy.
11A.29.6 ... know that all electromagnetic waves travel with the same velocity in free space …
12A.31.2 Know why powerful telescopes allow us to look back in time to when the Universe was much younger than it is now.
12A.31.3 Show an understanding of the size and number of stars and galaxies, the distances between them, and the size of the Universe. Know and define the size of the light-year and the parsec.
11A.32.6 Know the source of energy in stars, including the Sun.
11A.32.7 ... know how heavier elements are formed in older stars by nuclear fusion.
12A.31.4 Know how stars are created, that they are made mainly from the element hydrogen and that their ultimate fate depends on their size and can lead to supernovae, white dwarfs, neutron stars (pulsars) or black holes.
12A.31.5 Explain the process of element formation in stars and know how this leads to the generation of energy.
11A.32.2 ... use the common notation for representing nuclides and write equations representing nuclear transformations.
12A.31.6 Describe the process of planet formation by gravitational attraction from the remains of an older exploded star.
3 hours
Measuring the stars
4 hours
Galaxies
4 hours
Stars and planets
4 hours
Modelling the Universe
12A.31.7 Know that current thinking favours the ‘big bang’ model of the Universe, which postulates that all matter, time and space were created in a ‘big bang’ around 14 billion years ago, and that since then the Universe has been expanding.
12A.31.8 Understand how the Universe can at the same time be finite but have no boundaries.
Unit 12AP.7
571 | Qatar science scheme of work | Grade 12 advanced | Unit 12AP.7 | Physics 7 © Education Institute 2005
Activities
Objectives Possible teaching activities Notes School resources
Observing the sky Either arrange an evening for the whole class to meet and observe the night sky, or brief students so that they can make observations in their own time.
Using a planisphere, or a star-map downloaded from the Internet, identify some easily recognisable constellations (e.g. Orion, the Plough) that will be visible in the night sky at the time and location of students’ observations. Students should use binoculars to study the stars in these constellations, noting their different colours and brightnesses. Introduce the term nebula, meaning, loosely, an object that appears extended and fuzzy; if possible students should also observe the Orion and Andromeda nebulae and note how they differ from stars. Students should also observe any planets that are visible at the time of their observations.
Safety: Ensure that students observe only from safe locations.
Enquiry skill 12A.1.8
Use this column to note your own school’s resources, e.g. textbooks, worksheets.
4 hours
Measuring the stars
... know how [line spectra] can provide information on the elements present in stellar objects and how far away the objects are.
Show an understanding of the size and number of stars and galaxies, the distances between them, and the size of the Universe. Know and define the size of the light-year and the parsec.
Colour and brightness Discuss students’ observations from the previous activity and ask them to suggest reasons for the different colours and brightnesses of stars.
Show students a radiant heater warming up: as it gets hotter, its colour changes from a dull red glow to bright orange. Show a filament lamp connected to a variable power supply: when the filament is cool it glows faintly red, but when it is hotter it becomes yellow-white and brighter. Display black-body radiation graphs on the board or OHP and establish that temperature can be deduced from observations of the relative amounts of radiation in two or three parts of the electromagnetic spectrum.
Refer to students’ observations of stars and ask them to say which of the stars they observed are the coolest and which the hottest.
Ask students to suggest reasons for the different observed brightnesses of stars. Introduce the term luminosity, meaning the total power radiated by a star, and by suitable questioning establish the following points. • If two stars are the same size, the hotter one will emit more radiation in all parts of the
spectrum (i.e. it is more luminous). • If two stars are the same temperature, the larger one will emit more radiation as it has a
larger surface (i.e. it is more luminous). • If two stars are the same size and temperature, they have the same luminosity, but the closer
one will appear brighter.
Introduce the terms intensity and flux F to mean the received radiant power per unit area. Demonstrate that the intensity of light from a torch bulb shining onto a screen diminishes with distance, and use suitable diagrams to show that the intensity of radiation from a point source obeys an inverse-square law. Provided there is no absorption or scattering of radiation en route, F = L ⁄ 4πd2, where d is distance.
Ask students to say which of the stars they observed are likely to be the closest and which the most distant.
Unit 12AP.7
572 | Qatar science scheme of work | Grade 12 advanced | Unit 12AP.7 | Physics 7 © Education Institute 2005
Objectives Possible teaching activities Notes School resources
Let students use the Internet to find information about the sizes, distances and temperatures of the stars they have observed. Tell them to rank the stars in order of temperature and of distance, and to compare these rankings with their predictions of relative temperature and distance. They should note the units used to express distances; even if these are unfamiliar, they should still be able to produce a rank order for their observed stars.
ICT opportunity: Use of the Internet.
In their search for information, students may come across the term magnitude. Explain that apparent magnitude is related to observed brightness, while absolute magnitude is related to luminosity. Tell students that the magnitude scale relates to visual perception, so stars that appear brightest are ranked as ‘first magnitude’ while those that appear fainter are ranked second, third and so on.
Enquiry skill 12A.1.8
Luminosity of the Sun Ask students, working in pairs, to use a simple oil-spot photometer to estimate the Sun’s luminosity as follows. • Use a compass needle or similar to place a small drop of cooking oil on a sheet of white
paper (the spot produced should be as small as possible). • Arrange the paper so that light from an unshaded filament lamp of known luminosity (e.g.
100 W) shines onto one side, and sunlight onto the other. • Adjust the position of the paper so that the oil spot appears to merge into the surrounding
paper: the intensities of illumination from the two sources are then equal. • Measure the distance from lamp to paper and use the known Earth–Sun distance to calculate
the Sun’s luminosity using the inverse-square law.
Encourage students to discuss sources of inaccuracy in this method and to suggest improvements. They should also consider how results might be affected by atmospheric absorption of sunlight, and by the difference in temperature of the two light sources.
Safety: Students should not look directly at the Sun.
Enquiry skills 12A.1.1, 12A.1.3, 12A.1.5
The HR diagram Display a large Hertzsprung–Russell (HR) diagram. Ideally this should have luminosity plotted on the y-axis and temperature on the x-axis. If you use a version with axes showing magnitude and colour index, explain to students that these quantities are closely related to luminosity and temperature. Point out the use of logarithmic scales and the convention for labelling the x-axis so that temperature increases from right to left. Also point out that temperature is expressed in kelvins, while luminosity can be expressed either in its SI units (watts) or in terms of the Sun’s luminosity LSun.
Draw attention to the diagonal band known as the main sequence, on which most stars lie. Ask students what they can deduce about stars lying in the upper right-hand and lower left-hand regions of the diagram. By suitable questioning, establish that stars in the upper right are cool luminous stars: tell students these are called red giants. Similarly, establish that stars in the lower left are hot stars with low luminosity known as white dwarfs.

573 | Qatar science scheme of work | Grade 12 advanced | Unit 12AP.7 | Physics 7 © Education Institute 2005
Objectives Possible teaching activities Notes School resources
Distance units Refer to the previous activities and ask students if they found any unfamiliar non-SI units being used to express distances: they will probably have come across the light-year and parsec.
Establish that the light-year (ly) is the distance light (and other electromagnetic radiation) travels through space in 1 year. Ask students to calculate the number of seconds in a year and then use the speed of light to calculate the size of one light-year.
Use suitable diagrams on the board or OHP to introduce and define the astronomical unit (AU). Show how the size of the parsec (pc) is related to the AU and explain that a star at 1 pc from Earth has an annual parallax of 1 arcsec: as the Earth moves once around its orbit, the star appears to move through an angle of 1 arcsec either side of its central position relative to the background of more distant ‘fixed stars’. Tell students that the size of the AU is well established through radar measurements within the Solar System, hence the size of the pc is also well known. Students should use trigonometry and the small-angle approximation to calculate the size of the pc using 1 AU = 1.50 × 10¹¹ m.
Provide plenty of examples that allow students to practise calculations involving conventional non-SI units for astronomical distances.
Mathematics: This activity requires a knowledge of the trigonometry of right-angled triangles, angles expressed in arcsec and radians, and the small-angle approximation.
Point out that parallax measurements can only be used for relatively nearby stars (closer than about 100 pc). For more distant stars, less direct methods must be used. Explain how the HR diagram can be used in the following ways to estimate distances of stars. • Single star. Deduce the star’s temperature from its colour. Assume the star lies on the main
sequence and use the HR diagram to deduce its luminosity. Measure the flux received at Earth and calculate its distance using the inverse-square law. This method can be refined: stars of the same temperature but different luminosity can be distinguished by subtle differences in their line spectra, removing the need for the initial assumption.
• Cluster of many stars. Determine the temperature and flux of each star. Plot an HR diagram for the cluster of stars using flux instead of luminosity. Superimpose this plot on a standard HR diagram, aligning the temperature scales, and hence deduce the relationship between luminosity and flux for the cluster.
Ask students to write a short account of methods for measuring stellar distances.
574 | Qatar science scheme of work | Grade 12 advanced | Unit 12AP.7 | Physics 7 © Education Institute 2005
Objectives Possible teaching activities Notes School resources
Observing galaxies Prepare and present a series of PowerPoint slides showing images of galaxies downloaded from the Internet and illustrating the following points. • A galaxy is a large collection of stars (typically 108–1012 stars) bound together by mutual
gravitational attraction. • Many galaxies have the shape of thin discs with bright stars concentrated into spiral arms, but
the majority are featureless ellipsoidal collections of stars and some are irregular in shape. • The faint band of light across our sky, known as the Milky Way, is the light of many distant
stars lying in a thin disc. • The Milky Way is a spiral galaxy, and the Sun lies about two-thirds of the way out from the
centre. • The nearest major galaxy to the Milky Way is the Andromeda galaxy (Andromeda nebula),
which is also a spiral. • Even the nearest galaxy lies at a distance of a few million light-years. Light reaching us has
been in transit for this time, so it carries information about the galaxy as it was a few million years in the past.
• Galaxies are found to be grouped into clusters, bound by gravity. A large cluster might contain thousands of galaxies.
• Powerful telescopes observing at great distances reveal that there are some regions of the Universe with many clusters of galaxies and others, known as voids, with very few clusters.
• Even the nearest galaxies lie far beyond the reach of the stellar distance measurement techniques discussed in the previous section.
Prepare a PowerPoint presentation.
4 hours
Galaxies Describe, and explain in terms of gravitational attraction, the structure of the visible Universe today and know that our Sun is a star in the Milky Way galaxy.
Know why powerful telescopes allow us to look back in time to when the Universe was much younger than it is now.
Show an understanding of the size and number of stars and galaxies, the distances between them, and the size of the Universe. Know and define the size of the light-year and the parsec.
Measuring distances of galaxies Divide the class into three groups and set each group the task of using the Internet and library resources to research one of the following methods for determining distances to galaxies: • Cepheid variable stars; • planetary nebulae (planetary nebula luminosity function, PNLF); • Type Ia supernovae.
If the groups are large, subdivide them so that several small groups research the same method. Ask each small group to prepare an A3 poster containing the following information: • details about the type of object used and how such objects can be identified from observations; • a note of the measurements that must be made and how they can be used to deduce
distance; • some information about the first use of the method (e.g. who was responsible, when and
where they worked); • the largest distances that can currently be deduced using this method; • an image of a galaxy whose distance has been determined using this method; • a note of the information sources consulted.
Display the posters around the lab and allow time for students to read one another’s work. Students should then each produce their own written summary of all three methods.
ICT opportunity: Use of the Internet.
Enquiry skills 12A.1.4, 12A.1.6, 12A.1.8, 12A.3.4
575 | Qatar science scheme of work | Grade 12 advanced | Unit 12AP.7 | Physics 7 © Education Institute 2005
Objectives Possible teaching activities Notes School resources
ICT opportunity: Use of the Internet.
Enquiry skill 12A.3.4
Scale mapping and modelling Divide students into small groups and challenge them to design and produce a map or a scale model that can be used to help younger students (e.g. Grade 9) appreciate the sizes and distances involved in astronomy. They should consult the Internet and other resources to obtain any information about size and distance that they need. Suitable tasks include the following. • Solar System. Make a model that shows the relative sizes of planets using everyday objects
(e.g. fruit, marbles, footballs). • Stars. Make a map or a model that shows typical sizes and separations of stars in our region
of the Milky Way (e.g. if the Sun and the nearest star are represented by marbles, how far apart should they be?).
• Milky Way. Devise a way to show the size and shape of the Milky Way and the number of stars it contains (e.g. if each star is represented by a grain of sand, how much sand would you need to represent the whole galaxy?).
• Galaxies. Make a model to show the so-called local group of galaxies, which includes the Milky Way (e.g. if the Milky Way and the Andromeda galaxy are represented by paper discs 10 cm in diameter, how far apart should they be?).
If possible, arrange for students to display and talk about their models to younger students. In any case, display them where they can be seen by other members of the school (e.g. in a corridor, hall or playground).
4 hours
Stars and planets ... know how [line spectra] can provide information on the elements present in stellar objects ...
Know how stars are created, that they are made mainly from the element hydrogen and that their ultimate fate depends on their size and can lead to supernovae, white dwarfs, neutron stars (pulsars) or black holes.
Explain the process of element formation in stars and know how this leads to the generation of energy.
Describe the process of planet formation by gravitational attraction from the remains of an older exploded star.
Star formation Display a star map and an HR diagram and point out that they are static records of stars as we currently observe them. Tell students that the main sequence was initially thought to represent an evolutionary sequence (hence the name) showing a gradual change in stellar temperature with time. When it became possible to deduce the masses of stars (by observing their gravitational effects on one another) it became clear that hot main-sequence stars had much greater masses than cool main-sequence stars, and there was no evidence of any processes that could account for significant changes in stellar masses with age. Discuss with students the difficulties facing astrophysicists trying to deduce how stars function, how they are formed and how they change over time: the only information available comes from observations of distant objects which, with a few exceptions, remain unchanged over human timescales. Discuss the analogous problem of trying to deduce, from a snapshot of people in a city street, how human beings develop and change with age.
Students should be able to appreciate that the HR diagram indicates the existence of certain stable combinations of stellar luminosity and temperature: many stars are observed to lie on the main sequence, or in the red giant or white dwarf regions of the diagram, which suggests that these represent long-lasting phases in a star’s life (just as a photograph in a city street shows more people of adult size than children). Point out that our current picture of star formation has been developing since the early twentieth century, and is based on results of stellar observation and Earth-based laboratory research, which have been brought together to build a picture that is consistent with the available evidence.
576 | Qatar science scheme of work | Grade 12 advanced | Unit 12AP.7 | Physics 7 © Education Institute 2005
Objectives Possible teaching activities Notes School resources
Prepare and present a sequence of PowerPoint slides to establish the following points. • Stars are powered by nuclear fusion in their cores. This requires high density and temperature. • Within a galaxy, there is gas and dust (small solid particles) lying between the stars. This
interstellar material (ISM) includes warm glowing clouds of gas and cool denser clouds. Even the so-called dense clouds are extremely tenuous: on Earth they would be classed as vacuum.
• The temperature, density and composition of interstellar clouds can be deduced from the radiation they emit and from the absorption they produce in starlight shining through them.
• The surface composition of stars can be deduced from their line spectra. • Stars and ISM are predominantly made from hydrogen and helium, with traces of other
elements. • A challenge of astrophysics is to explain how cold tenuous ISM can become hot and dense
enough to sustain nuclear fusion and form a star. • Another challenge is to account for the predominance of heavier elements making up the
Earth and other planets. • Theory and observation indicate that star formation takes place in clouds that gradually
collapse under their own gravity. For this to happen, the cloud must be dense and massive (many times the Sun’s mass) so that internal gravitational forces are strong, and cold so that random thermal motion does not disperse the cloud.
• During collapse, material falling towards the centre of the cloud gains kinetic energy. The random thermal motion of particles is increased (i.e. the material gets hotter).
• As a cloud collapses, it fragments into locally collapsing regions, which become main-sequence stars.
• Around each newly formed star there remains a disc of gas and dust, from which planets form by gravitational attraction.
• Close to the star, where temperatures are high, volatile materials made up of hydrogen and other light elements are unable to condense and are driven outwards. Planets close to the star contain a large proportion of heavy elements, while those further out are composed largely of hydrogen and helium.
Prepare a PowerPoint presentation.
Evidence for star and planet formation Ask students to work in pairs or individually to collect evidence relating to the formation of stars and planets. As part of this task they should look for the following items in books or on the Internet and use scientific dictionaries or websites to find the meanings of the key terms in italic. • Images showing infrared emission from warm protostars within the Orion nebula. • Images of accretion discs around stars. • Observations of stellar winds. • Data relating to the composition of Solar System planets. • Data showing the motion of gas and dust around newly formed stars. • Graphics or animations showing the evolutionary track of a protostar on an HR diagram. • Data indicating the existence of exoplanets.
Students should download, or photocopy, relevant images and information in order to compile their own accounts of star and planet formation.
ICT opportunity: Use of the Internet.
Enquiry skills 12A.1.4, 12A.1.6, 12A.1.8, 12A.3.4
577 | Qatar science scheme of work | Grade 12 advanced | Unit 12AP.7 | Physics 7 © Education Institute 2005
Objectives Possible teaching activities Notes School resources
End points of stellar evolution Use a combination of presentation, images, demonstration and questioning to establish the following points about the end points of stellar evolution. • A star with mass up to about 8 MSun will reach a point when collapse under its own gravity
does not produce a high enough temperature to initiate the next stage of fusion. The abrupt halt of fusion causes ejection of the star’s outer layers, which expand to produce a tenuous shell of glowing gas known as a planetary nebula. The core is less than about 1.4 MSun and becomes a white dwarf.
• Stars with mass greater than about 8 MSun can produce elements up to iron in their cores. Further stages of nuclear fusion are endothermic, so there is no release of energy or build-up of pressure to prevent further gravitational collapse.
• The runaway collapse of a massive star core gives rise to a stellar explosion known as a supernova as the outer regions go into free fall then bounce outwards. (Place a table-tennis ball on top of a tennis ball. Drop them both together, taking care to release them vertically so that they remain in contact as they fall; like the outer layers of a collapsing star, the table tennis ball rebounds to many times its original height.)
• During a supernova explosion, heavier elements are synthesised, and most of the star is ejected into space along with a vast output of electromagnetic radiation.
• The ejected material forms a supernova remnant: a cloud of expanding, glowing gas. It gradually cools and might eventually be able to collapse and form new stars and planets.
• The remaining central part of the star continues to collapse under its own gravity. Electrons and nuclei are forced very close together and the protons and electrons combine to produce neutrons.
• If the central remnant is less than about 2.25 MSun, the formation of neutrons prevents further collapse and it becomes a neutron star. Some neutron stars are observed as pulsars; they spin rapidly and emit narrow beams of radiation that we detect as short pulses each time they point towards Earth. (Mount a torch on a rotating turntable so that it points horizontally. In a darkened room, rotate the turntable so that students see the torch appear to flash as it points towards them.)
• If the central remnant is more massive than 2.25 MSun, it continues to collapse under its own gravity to become a black hole. Close to a black hole, the gravitational field is so strong that not even light can escape.
Ask students to work individually or in pairs to draw a flow chart summarising the stages in a star’s evolution, starting from the main sequence, showing how its mass influences the outcome of each stage.
Enquiry skill 12A.3.4
578 | Qatar science scheme of work | Grade 12 advanced | Unit 12AP.7 | Physics 7 © Education Institute 2005
Objectives Possible teaching activities Notes School resources
Stellar end points Students should work in pairs or small groups to find more information about the ways stars come to an end. They should download relevant images and produce about ten PowerPoint slides on their topic for presentation to the rest of the class. Suitable topics include the following. • Historical observations of Milky Way supernovae such as those observed in 1006, 1054,
1181, 1572 or 1604: where in the sky each was observed, and from where the observations were made. Students should suggest why these spectacular events were only noticed in a few locations.
• Remnants of historical supernovae: modern images and data relating to events such as those listed above.
• Supernovae observed in other galaxies, including the one observed in the nearby Large Magellanic Cloud galaxy in 1987.
• The object known as Eta Carinae. • The discovery of pulsars: when and how they were discovered, and how the observations
were initially interpreted. • Hubble Space Telescope observations of planetary nebulae. • Evidence for black holes: if no matter or light can escape, how can such objects be detected?
ICT opportunity: Use of PowerPoint; use of the Internet.
Enquiry skills 12A.1.6, 12A.1.8, 12A.2.2, 12A.2.4
Compact objects Produce sets of cards, each of which contains one statement, image or piece of information relating to a white dwarf, neutron star or black hole. Make at least six cards for each type of object. Suitable examples include the following: • can be observed as a pulsar; • the end-point of a Sun-like star; • the fate of the most massive stars.
Divide students into groups of three to play the following game. Each group should allocate one type of object to each student, place the cards face down and turn over the top card. In turn, each student takes either the upturned card or one from the pack. If the card they pick up does not relate to their object, they should discard it face up. Continue until one person has a full set of cards for their object.
Prepare suitable sets of cards.

579 | Qatar science scheme of work | Grade 12 advanced | Unit 12AP.7 | Physics 7 © Education Institute 2005
Objectives Possible teaching activities Notes School resources
Universal expansion Display a graph that plots the redshifts of several galaxies against their distance (either Hubble’s original results or some more recent data). Introduce and define the term redshift z = ∆λ ⁄ λ. Remind students about line spectra and tell them that, like starlight, light received from nearby galaxies includes lines (mainly due to hydrogen) whose wavelengths are precisely known. Light from distant galaxies is redshifted (i.e. it contains patterns of lines similar to those of nearby galaxies but at longer wavelengths).
Divide students into pairs or small groups and ask them to brainstorm and suggest how the redshift–distance data might be interpreted.
In discussion with the whole class, note students’ ideas on the board or OHP, then by suitable questioning establish the following points. • A galaxy’s redshift indicates its velocity relative to us. A redshift implies a recession. • Only a few very nearby galaxies have spectral lines that are blue-shifted. Apart from these
nearby galaxies, all other galaxies are receding from us. • Redshift is proportional to distance: the more distant a galaxy, the more rapidly it is receding. • The observations suggest that the entire Universe is expanding. • Although we see all other galaxies receding, this does not imply that we are at the centre of
the Universe.
Use animations and models to demonstrate that, in a uniform expansion, an observer on any galaxy sees all other galaxies receding with a speed that is proportional to its distance. Suitable models include the following. • Stick paper dots representing galaxies onto a wide rubber band. Choose one arbitrarily to be
the Milky Way. Stretching the band causes all other galaxies to recede from our galaxy. • Stick paper dots representing galaxies onto the surface of a balloon. Inflating the balloon
causes all other galaxies to recede from our galaxy. • Draw several dots on an acetate sheet. Make an enlarged photocopy onto another acetate
sheet. Choose one dot arbitrarily to be the Milky way and overlay the two sheets so that the two Milky Way dots coincide. Show that the other dots have receded from the Milky Way at speeds proportional to their distances.
Introduce Hubble’s law v = H0d and define the Hubble constant H0.
Tell students how Hubble’s law can be used to deduce distances to galaxies: the relationship first needs to be established by measuring the distances to some galaxies using methods such as Type Ia supernovae or Cepheid variables. Then the distances to other galaxies can be deduced from their redshifts: find v, then calculate d using Hubble’s law. Tell students that, in practice, astronomers often quote values of redshift as direct indicators of distance.
4 hours
Modelling the Universe ... know how [line spectra] can provide information on the elements present in stellar objects and how far away the objects are.
Describe, and explain in terms of gravitational attraction, the structure of the visible Universe today ...
Know why powerful telescopes allow us to look back in time to when the Universe was much younger than it is now.
Know that current thinking favours the ‘big bang’ model of the Universe, which postulates that all matter, time and space were created in a ‘big bang’ around 14 billion years ago, and that since then the Universe has been expanding.
Understand how the Universe can at the same time be finite but have no boundaries.
The big bang Refer to the previous discussion and establish that the observation of galactic recession implies that there was a time in the past when all galaxies had zero separation. Tell students that this can be interpreted in terms of a big bang: an explosion from a state of extremely high density that marks the beginning of our Universe.

580 | Qatar science scheme of work | Grade 12 advanced | Unit 12AP.7 | Physics 7 © Education Institute 2005
Objectives Possible teaching activities Notes School resources
Point out the units of the Hubble constant. Students should appreciate that with speed and distance expressed in SI units, H0 would have units s–1. Establish that, assuming the expansion has been proceeding at the same rate since the big bang, the age of the Universe can be deduced from Hubble’s law: t = d ⁄ v = 1 ⁄ H0.
Tell students that astronomers usually express galaxies’ recession velocities in km s–1 and their distances in Mpc, giving H0 in non-SI units km s–1 Mpc–1.
Students should be able to use current measurements of H0 (close to 75 km s–1 Mpc–1) to estimate the age of the Universe.
Discuss the assumptions underlying this simple calculation. Students should be able to appreciate that gravitational forces between galaxies will decelerate their recession so the expansion is less rapid now than in the past. They should be able to explain how this will affect our estimates of the age of the Universe based on Hubble’s law: the time taken for galaxies to reach their present separations must be less than the simple estimate.
Explain to more advanced students how the finite age of the Universe places a limit on its observable size: we cannot observe objects whose distance exceeds the distance that light has travelled since the big bang. Point out that when astronomers talk of ‘the size of the Universe’, they often mean the size of the observable Universe, which is finite, rather than size of the entire Universe, which is thought to be infinite.
Evidence for the big bang Prepare and present a sequence of PowerPoint slides summarising current evidence relating to the big bang. In addition to the observations of galactic recession, include the two other major items of evidence. • Abundance of elements. The big bang theory predicts that initially the Universe consisted of
fundamental particles and radiation. As the Universe expanded, the particles combined. Detailed models based on our knowledge of particle reactions predict the proportions of hydrogen, helium and other elements produced in the first few minutes of the expansion, after which the density would become too low to allow further reactions. The observed abundances in interstellar space and the outer regions of stars match the predictions very closely.
• Microwave background radiation. Theory predicts that radiation produced in the first few minutes after the big bang would still be travelling through space, and that as space expands so does the wavelength of the radiation. Initially, the wavelength would be very short as the matter producing it was very hot, but it has now expanded to a few centimetres. Radiation close to the predicted wavelength has been detected coming from all directions in space.
Prepare a PowerPoint presentation.
• Very distant objects. Observations at high redshift involve light that has been in transit for a time that is comparable to the age of the Universe. Objects known as quasars (extremely luminous galaxies) are observed only at high redshift, indicating that they were far more common in the early Universe than now (i.e. there is evidence that the Universe has evolved over time rather than existing in a steady state).
Let students discuss how current thinking about the big bang relates to their religious beliefs.
Enquiry skill 12A.2.2

581 | Qatar science scheme of work | Grade 12 advanced | Unit 12AP.7 | Physics 7 © Education Institute 2005
Objectives Possible teaching activities Notes School resources
The future of the Universe Ask students to speculate on the future of the Universe: will the expansion continue indefinitely, or will gravitational attraction eventually halt and reverse it? Display graphs showing how the separation between two galaxies will change with time in either of these scenarios. Introduce the terms open universe and closed universe. Ask students to suggest what might determine the way in which expansion proceeds. By suitable questioning, establish that the expansion will cease (i.e. the Universe will be closed) only if the average density of matter in the Universe exceeds a certain critical density.
Collect magazine articles (e.g. from Scientific American) and download webpages relating to current estimates of the density of matter in the Universe and the ultimate fate of the Universe. Distribute them to students to read and discuss in small groups. Suitable topics include the following. • Estimates of the density of visible matter in the Universe (which fall far short of the critical
density). • Evidence for dark matter adduced from observations of galactic rotation and the motion of
galaxies in clusters. • The search for dark matter particles. • Evidence suggesting that the expansion is in fact accelerating because of a hitherto unknown
force.
Light and matter Using suitable visual aids, introduce more advanced students to some of the basic ideas of general relativity and how these relate to our current understanding of the Universe. Include the following points. • Einstein’s general theory introduced the notion that forces can be understood as distortions in
space-time. In particular, gravity is the distortion of space-time caused by matter and it causes light to deviate from travelling in a straight line.
• Observational evidence supporting Einstein’s theory was first obtained in 1919 during a solar eclipse, when stars viewed close to the Sun appeared to shift in position.
• If the density of the Universe exceeds the critical density, then the space-time distortion is such that it causes light to travel around a closed path.
• The geometry of a closed universe can be represented by analogy with the surface of a sphere, which is a two-dimensional surface in three-dimensional space and which is finite but without boundaries (light or anything else travelling in a ‘straight line’ actually follows a closed path). In a closed universe, our three-dimensional space is finite but without boundaries.
• Similarly, the geometry of an open universe can be represented by analogy with a hyperboloidal surface, and if the Universe has critical density its geometry is analogous to that of a flat plane.

582 | Qatar science scheme of work | Grade 12 advanced | Unit 12AP.7 | Physics 7 © Education Institute 2005
Objectives Possible teaching activities Notes School resources
Theories of the Universe Point out to students that current thinking about the Universe differs from earlier ideas. Current thinking is that we inhabit a planet that orbits an unexceptional star, one of many stars (which might also have planets) in the outskirts of an unexceptional galaxy that does not occupy any particularly privileged place in the Universe, whereas in historical times people believed that the Universe was centred on human civilisation. Divide students into small groups and set each the task of researching one of the historical developments that preceded our current understanding. Suitable topics include: • Ancient Greek geocentric models; • the heliocentric models of early Islamic philosophers; • conflicts in Europe involving geocentric and heliocentric models; • the discovery of ‘island universes’.
Tell students to use the Internet and library resources to research information and to pay particular attention to the way scientific work is influenced by the social, cultural, moral and spiritual contexts in which it is undertaken. They should also note the importance of technological developments, such as the telescope, and the way in which prevailing paradigms can be overthrown by observational evidence.
Ask each group to prepare a PowerPoint presentation and a handout summarising their findings for photocopying and distribution to the rest of the class. After students have given their presentations to the class, allow time for them to continue and extend their discussions from the previous activities.
ICT opportunity: Use of the Internet; use of PowerPoint.
Enquiry skills 12A.1.6, 12A.1.8, 12A.2.1, 12A.2.2, 12A.2.4, 12A.2.5, 12A.3.4
583 | Qatar science scheme of work | Grade 12 advanced | Unit 12AP.7 | Physics 7 © Education Institute 2005
Assessment
Examples of assessment tasks and questions Notes School resources
A student who is not studying science says ‘No one has ever travelled to a star. It must be impossible to know how far away they are or anything else about them.’ Write an explanation for this student describing how it is possible to deduce the temperatures and distances of stars using Earth-based observations.
In a scale model, the Milky Way and the Andromeda galaxy are both to be represented by discs 10 cm in diameter. Given that the diameter of the Milky Way is about 30 kpc, and the Andromeda galaxy lies at a distance of about 2.4 million light-years, how far apart should the discs be placed in the model?
Draw a sequence of labelled diagrams to show how the collapse of a cold interstellar cloud can produce a main-sequence star.
Write a short account of how elements heavier than hydrogen are produced in stars and become the raw material for making planets. Include the following terms: nuclear fusion, star, supernova, gravity.
Use a simple model (e.g. paper dots stuck onto the surface of a balloon) to explain Hubble’s observation that the redshifts of galaxies are proportional to their distances.
Assessment Set up activities that allow students to demonstrate what they have learned in this unit. The activities can be provided informally or formally during and at the end of the unit, or for homework. They can be selected from the teaching activities or can be new experiences. Choose tasks and questions from the examples to incorporate in the activities.
Using H0 = 75 km s–1 Mpc–1 and assuming a constant rate of expansion since the big bang, calculate the age of the Universe. Give your answer in seconds and in years.
Unit 12AP.7

584 | Qatar science scheme of work | Grade 12 advanced | Unit 12AP.7 | Physics 7 © Education Institute 2005