CSC 660: Advanced Operating SystemsSlide #1 CSC 660: Advanced OS System Calls.
Upload
annabelle-cookCategory
view
213download
0
Science, Technology, Innovation and IP in India
– new directions and prospects
Department of Economics Discussion Paper
Series Number 660 June 2013 Christine Greenhalgh
Presentation 31 October 2013Seminar for OIPRC Oxford
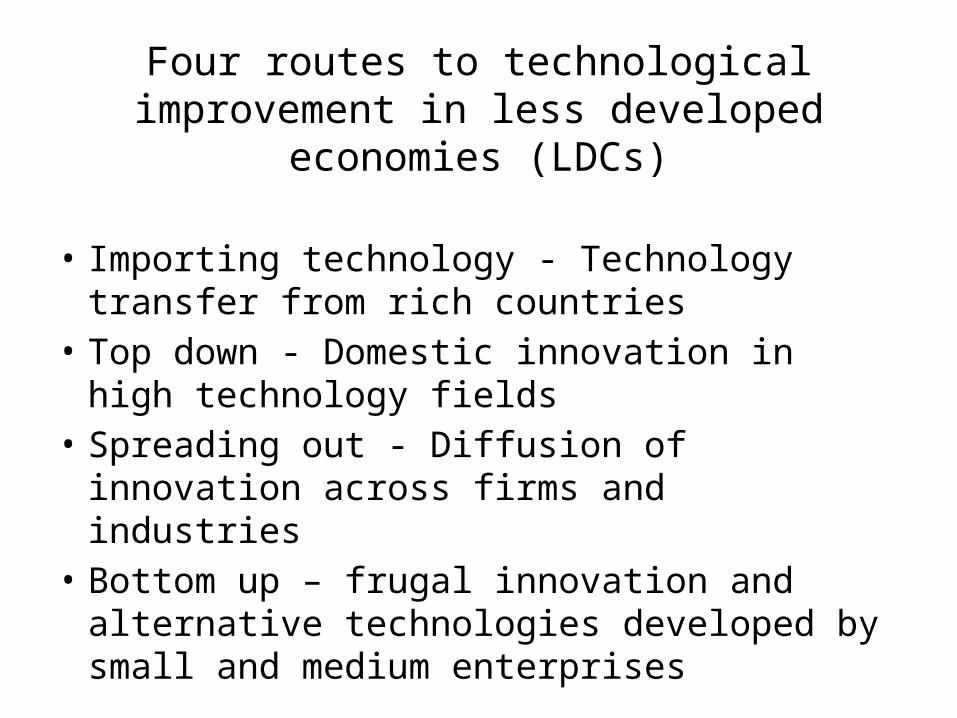
Four routes to technological improvement in less developed economies (LDCs)
• Importing technology - Technology transfer from rich countries
• Top down - Domestic innovation in high technology fields
• Spreading out - Diffusion of innovation across firms and industries
• Bottom up – frugal innovation and alternative technologies developed by small and medium enterprises

Technology transfer and intellectual property rights
Two channels for importing technology: • Foreign direct investment (FDI) by MNEs• Licensing by domestic firms in LDCsTrade Related IPRs – impact of TRIPS agreement:• Did TRIPS enhance rate of FDI into LDCs? - Hassan et al. (2009)
give cautious ‘Yes’.• Does a rise in FDI lead to more technology spillovers and faster
economic growth? - Clark et al. (2011) find evidence mixed – more positive if host LDC has some high tech sectors (such as India)
• Did TRIPS make licensing more or less attractive to domestic firms? - Kanwar (2012) finds stronger IPRs are associated with higher royalty and licence fees from LDCs – are rich countries now more willing to licence?

Intellectual property rights and domestic imitation and innovation
• TRIPs agreement – would firms in LDCs suffer loss of ability to imitate as country strengthened IPRs
• This might outweigh rise in domestic incentive to innovate
• Chen and Puttitanum (2005) contrast benefits of low IPRs in poorest LDCs (imitation dominates) and benefits of stronger IPRs in richer LDCs (innovation dominates)
• C. and P. find empirically that the income per capita turning point is US$854 p.c. in 1995 prices
• If uprate this value to 2012 prices then India is above this turning point in average income per capita
• Hence optimal for India to have strengthened IPRs following TRIPS

Intellectual property rights and diffusion
• Inherent contradiction - IPRs encourage invention of new technologies and products, but slow diffusion
• Green technology – speed is critical - global warming will get worse with rapid growth in LDCs
• Policy needs to work within existing legal framework to speed up adoption
• Support dual pricing? Rich pay higher prices - requires effective separation of markets
• Allow compulsory licensing by LDCs for some forms of technology?

Frugal/Jugaad innovation and alternative technology
• Frugal innovation - Design products and processes delivering key characteristics of modern products using less expensive materials and technology, e.g. plastic shell Nano car
• Jugaad – Hindi word for improvisation• Alternative/appropriate technology – from 1970s - LDCs
need technology and design to fit resource base that uses less capital and energy, more small scale and labour intensive
• IPR policies that may help – introduce petty patents, educate about design rights, trademarks
• Create equivalent of an open source register for manufactured items with General Public Licences

India’s economic imbalances Shares of GDP – like a rich country– Agriculture 19%– Industry 26% (within which Manuf. 14%)– Services 55%
Shares of employment – like a poor country – Agriculture 51% (Population 1.2 billion of which– Industry 22% 61.7% are aged 15-60 = 750m– Services 27% so Agriculture = 380m workers)
Balance of payments – Current account deficit is 3% of GDP– Visible trade is in deficit, especially in petroleum – Invisibles approx. balanceSource: The Economist Pocket World in Figures 2013

Good news on cost competitiveness:- Wage rates in India are lower than in other emerging economies - Real wages are not rising as in China and Russia Source: Ashenfelter (2012) Nominal Wage is in $ at dated current exch. rates; Real Wage is Nominal Wage/Price of Big Mac within that country
Nominal Wage 2007
Real Wage 2007
Real Wage ratio2011/2007
India 0.46 0.35 0.86
China 0.81 0.57 1.24
Russia 2.34 1.19 1.43
South Africa
1.69 0.81 0.69
USA 7.33 2.41 0.91

Technology and Industrial Policy• 1970-90: – technology and industrial policy of ‘self-reliance’ – high tariffs on imports – restrictions on FDI via limits on foreign equity shares – Patent Act 1970 favoured basic necessities:limited protection to process only - not products - in food, chemicals and pharmaceuticals with duration 7 years (14 for other products) • Since 1991: – recognised protectionist policy harboured inefficiency – also slow adoption of new technology in majority of manufacturing– bal. of payments crisis precipitated huge structural reforms– industrial policy relaxed to permit more competition • After 1994: – WTO and TRIPS Agreement forced changes in IP regime – India signed TRIPS in 1994 with obligation to comply fully by 2005 – Patent law to give all products protection by this deadline

Changing strength of patent rights in emerging economies
Index numbers of protection and enforcement (max. value = 5), source Hassan et al. (2009)
Average ’60-‘90
1995 2000 2005
India 1.03 1.23 2.27 3.76
Brazil 1.22 1.48 3.59 3.59
China 1.33 2.12 3.09 4.08
Russia .. 3.48 3.68 3.68
South Africa
2.94 3.39 4.25 4.25
USA 4.14 4.88 4.88 4.88

IP rights post TRIPSIndia’s IP rights system:
Source: UK Trade and Investment (2008)
IP right Initial term
Cost Time to register
Extension Maximum
Copyright 60 years+ author’s lifetime
£5-8 None 60 + life
Patent 20 years £50 4-5 years None 20 years
Design 10 years £13 9 months 1 x 5 years 15 years
Trade Mark
10 years £30 2-3 years 10 years, for ever
Infinite

Did R&D and patenting by high tech larger firms respond to TRIPS?
• Dutta and Sharma (2008) investigate innovation activity post TRIPs (signed in 1994)
• PROWESS database of publicly traded medium to large Indian firms (sample is 3k firms 1989-94 and 5k firms 1995-2005, unbalanced panel)
• Compare firms according to innovation intensity of their industry to control for trends
• Find rise in R&D is 20% higher in firms that were +1 S.D. above industry mean in innovation intensity
• Also find US patenting by Indian inventors rose faster post-TRIPs cp. to US and EU firms
• So it appears that incentives rose with TRIPs

Success stories in manufacturingPharmaceuticals:• Early success developing capability for bulk drugs and
formulations for delivery to patients• 70s to 90s patent regime -> process innovations, finding non-
infringing methods of producing patented formulae, and producing generics for expired foreign patents
• By 2010 India’s volume was 10% of global production• In value terms India ranked 14th in the worldBut Ray and Bhaduri (2012) warn world competition increasing Tata manufacturing: • Has grown to become an Indian MNE • Has taken over Jaguar and Land Rover in UK• Developed and produced Tata’s Nano car • Uses ‘frugal engineering’; ‘the cheapest car in the world’ • In 2012 selling at $3,000 for 624cc two-cylinder engine

Chasing technology of the future• India’s capability in Wind Power1995 - former Indian textile manuf. founded Suzlon2000 - in world top 10 wind turbine manuf.2005 – initial public offering of shares was oversubscribed X 5 2006 - ranked 5th in world and supplying 52% of domestic market• India’s efforts closely followed by China1998 – Goldwind estab. by Xinjiang Wind Energy Co.2006 – ranked 10th in world, supplying 39% of its home market• Lewis (2007) attributed greater initial Indian company success to
its network of global subsidiaries • But China is overtaking:2009 – Goldwind and Sinovel ranked above Suzlon in top 10producers and 3rd Chinese firm Dong Fang was just behind

Too much science, not enoughtechnology and innovation?
• GERD/GDP has risen but still only 0.8% (compare South Korea at 2.8%)
• R&D public-private spending imbalance :80% of GERD spending is publicly funded 70% is conducted in government research institutes
• Only 25% of GERD is industrial R&D financed more by industry (5% public and 20% private)
• Science in govt. research institutes and universities is not transferring to industry
• Scientific publications record is extensive• Patenting record is weaker especially in citationsSource: Dutz (2007)
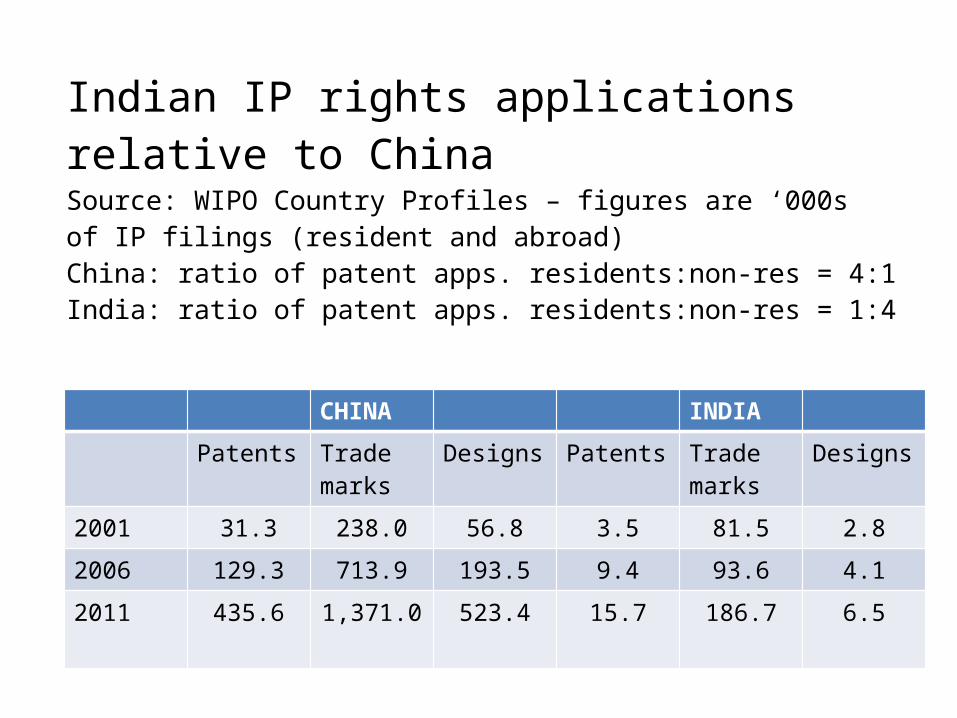
Indian IP rights applications relative to ChinaSource: WIPO Country Profiles – figures are ‘000s of IP filings (resident and abroad) China: ratio of patent apps. residents:non-res = 4:1India: ratio of patent apps. residents:non-res = 1:4
CHINA INDIA
Patents Trade marks
Designs Patents Trade marks
Designs
2001 31.3 238.0 56.8 3.5 81.5 2.8
2006 129.3 713.9 193.5 9.4 93.6 4.1
2011 435.6 1,371.0 523.4 15.7 186.7 6.5
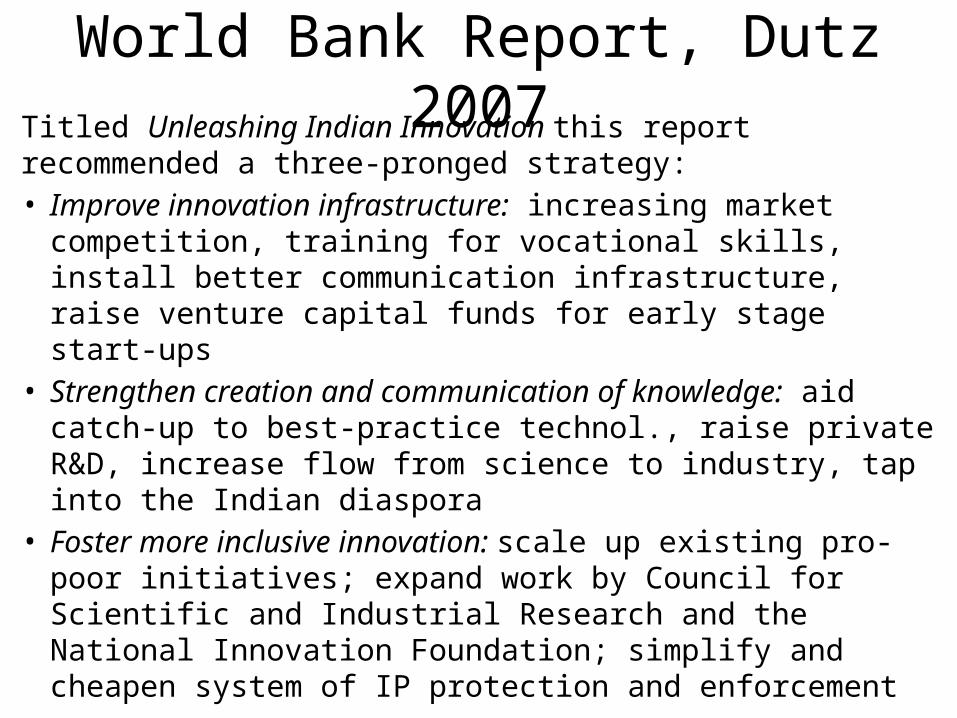
World Bank Report, Dutz 2007Titled Unleashing Indian Innovation this report recommended a three-pronged strategy:• Improve innovation infrastructure: increasing market
competition, training for vocational skills, install better communication infrastructure, raise venture capital funds for early stage start-ups
• Strengthen creation and communication of knowledge: aid catch-up to best-practice technol., raise private R&D, increase flow from science to industry, tap into the Indian diaspora
• Foster more inclusive innovation: scale up existing pro-poor initiatives; expand work by Council for Scientific and Industrial Research and the National Innovation Foundation; simplify and cheapen system of IP protection and enforcement
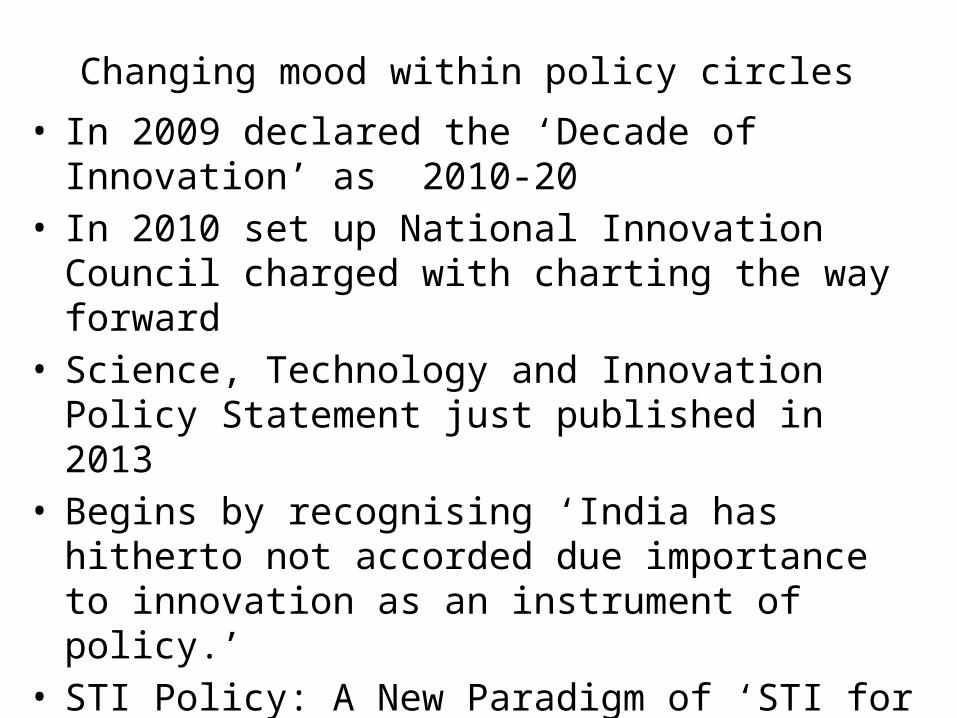
Changing mood within policy circles • In 2009 declared the ‘Decade of Innovation’ as 2010-20• In 2010 set up National Innovation Council charged with
charting the way forward• Science, Technology and Innovation Policy Statement just
published in 2013• Begins by recognising ‘India has hitherto not accorded
due importance to innovation as an instrument of policy.’ • STI Policy: A New Paradigm of ‘STI for the people’
– focus on integration of each of S, T, and I to create social good and economic wealth
– recognises Indian society as its major stakeholder• Good intentions but how to make them work?

Route A - High technology sector strategies:
• Improving technology transfer from domestic science base
• Picking potential winners in high tech sector for public science funding
• Continuing general subsidies to R&D and improving markets for technology
• Raising R&D incentives for private firms• Improving technology transfer from overseas

Improving technology transfer from home science base
India’s Bayh Dole draft act – ‘The Protection and Utilisation of Publicly Funded Intellectual Property Bill 2008’ – not yet passed - controversy• Goes beyond US act as includes patents, trademarks and copyrights• Researchers will have IP rights except in cases of national security• Places obligations on researchers to set up IP management system• Also must not disclose any research findings before IP is in place• Sets large penalties if grantee does not comply with rules/objectivesMotivation for legal changes:• Licensing revenues for universities• Technology transfer to industry• Promoting IP awareness Sampat (2009) critical of this legislation as risks inducing unnecessary IP Saha & Ray (2013) motivation of researchers not matched by act• Find that interest and productivity in research rise over career • Driven by a consumption motivation not investment in career
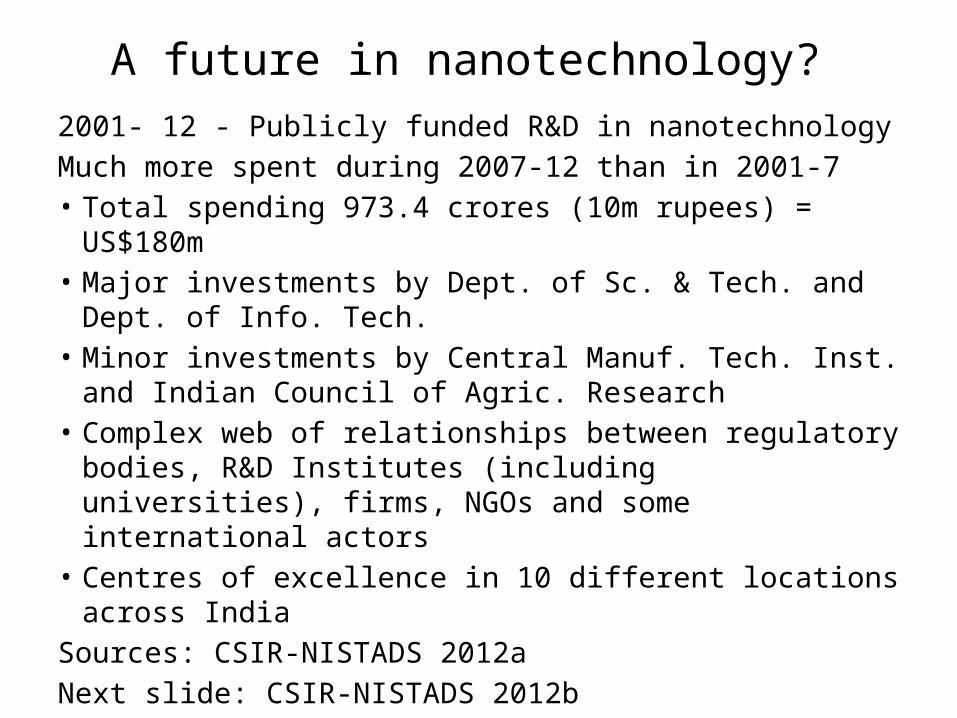
A future in nanotechnology? 2001- 12 - Publicly funded R&D in nanotechnology Much more spent during 2007-12 than in 2001-7• Total spending 973.4 crores (10m rupees) = US$180m • Major investments by Dept. of Sc. & Tech. and Dept. of
Info. Tech.• Minor investments by Central Manuf. Tech. Inst. and
Indian Council of Agric. Research• Complex web of relationships between regulatory
bodies, R&D Institutes (including universities), firms, NGOs and some international actors
• Centres of excellence in 10 different locations across India
Sources: CSIR-NISTADS 2012aNext slide: CSIR-NISTADS 2012b

Nanotechnology R&D outputsOutput of science publications, patents, products• Scientific papers - country ranks by 2011 were:China, US, Japan, Germany, South Korea, India 6th and had fastest growth from 2001-11 but from low base• Paper citations - India ranks lower – for top 1% papers
ranks 14th and for top 10% of cited papers ranks 9th• USPTO Patents – country ranks in apps. and grants by
2011 were as follows (Indian presence negligible): US, Japan, South Korea, Taiwan, China, Germany• Products – country ranks in the Woodrow Wilson
database of globally available products to 2011 are: US, Germany, South Korea, China, Japan (India 2 prods.)

Innovation incentive systems for domestic R&D
Fiscal incentives include:• 100% write off for current and capital expre. on R&D• 200% weighted tax deduction on expre. in approved in-house
R&D facility in selected manufacturing sectors • Also 200% for sponsored research in national labs. and
universities and IITs • 10 year tax holiday for commercial R&D companies• 40% accel. depr. allowance on plant + mach. based on
indigenous technology• Customs duty exemptions for imports for R&D and excise duty
waivers for indigenous goods used for R&D• 3 year excise duty waiver for specific goods developed by
Indian company or laboratory and patented in two countries among India, US, Japan, or the EU

Increasing technology transfer• Expand links with non-resident Indians (NRIs): c.20 million
Indians live abroad - Silicon Valley’s engineering and scientific workers, 40% US, 28% Indian, 32% all other
• Software sector hugely successful due to links from San Francisco Bay Area to Bangalore - Can this be replicated for any other sectors such as green technology?
• Total FDI entering India over the period from April 2000 to October 2012 was US$275bn
• Annual inflows for 2012-13 were US$36.8bn of which 1/3 was related to NRIs and 2/3 to foreign equity
• Compared with FDI of US$2-3bn in the late 1990s it appears India has begun to shake off its reputation for shunning FDI
• Recent policy changes on foreign ownership will help: in 2012 Indian government relaxed ownership restrictions in retailing, commodity exchanges, power exchanges, broadcasting, and non-banking financial institutions
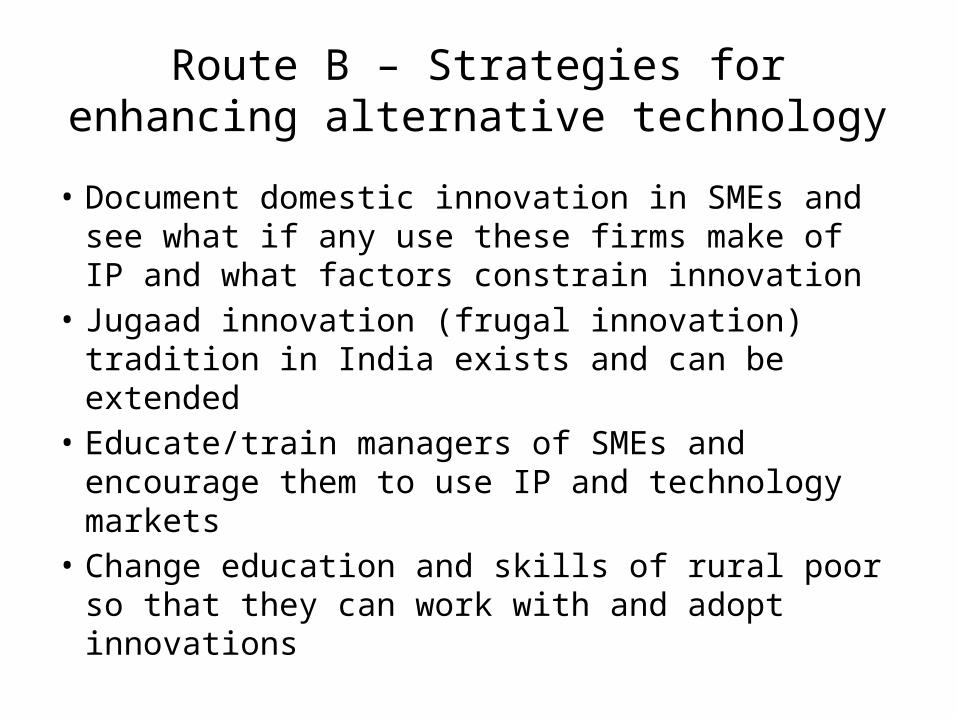
Route B – Strategies for enhancing alternative technology
• Document domestic innovation in SMEs and see what if any use these firms make of IP and what factors constrain innovation
• Jugaad innovation (frugal innovation) tradition in India exists and can be extended
• Educate/train managers of SMEs and encourage them to use IP and technology markets
• Change education and skills of rural poor so that they can work with and adopt innovations

New information on innovation• New database of innovation for MSMEs (micro and
small or medium enterprises)• Covers production units in Agric, Industry, and Services,
i.e. factory or production site so enterprise data• Sample uses as basis the Annual Survey of Enterprises
(running since 1960) covering all factories/production units employing >10 workers with power or >20 without power
• Rolled out nationally in 2011 to 31 states and union territories (such as Delhi)
• Refer to ‘firms’ in preliminary reports – confusingSources: CSIR-NISTADS (2011-12)

Evidence from Innovation Survey(full sample report still awaited)
• Sample is skewed towards industry, esp. manufacturing• Surveyed 9002 reporting units in 2012; wide questionnaire• In all three sectors vast majority of reporting units employ under 100
workers: Agric. 93%, Industry 89%, Services 97%• ‘Innovation’ can be: new product, new process, change in product
qual. or standards, more efficient input use, use of alternative materials, new machines, or other
• Survey does distinguish ‘new to firm’ from ‘new to market’ but so far this is not tabulated frequently
• Share of ‘innovative firms’ in the sample is approx. 35% • Varies by state from highs of 56% Andhra Pradesh, 54% Delhi,
to lows of 13% Gujarat, 8% Bihar• Varies by sector from 50% motor vehicles to 20% crop prodn. • So far have not see any data about IP use promised in pilot• As yet all single factor tables/charts not multi-factor analysis

Using Internet for Knowledge Transfer• Honey Bee network set up 1986-7 by Prof. Anil Gupta at Indian
Institute Management, Ahmedabad as a creative commons for ‘Jugaad innovations’
• Aimed to seek out inexpensive new designs that are pro-poor and use green technology and help to spread knowledge and use across India
• National Innovation Foundation established 2000 in Ahmedabad using gov. funds with Honey Bee as a partner
• Has a repository of more than 50,000 grassroots innovations and traditional knowledge practices
• Aims to assess commercial potential and develop IP rights for inventors
• Offers prospects for matching ideas to venture capital• NIF has been criticised for being too slow and adding costs to
inventions so that they fail in the market place

Empowering SMEs and rural poor to understand and use IPRs
• Since 2009 India has started an on-going identity registration system aiming to register all 1.2bn
• Uses biometric data (photo, finger prints and eye scans) to provide unique ID number for each citizen
• This will assist rural poor to obtain rights to benefits, but also to own IP assets and participate in IPR markets
• As IT spreads in rural areas can use web for education and training both in general and for IP rights
• For MSMEs focus on encouraging use of trade marks and design registration (and also copyright) as more likely to use these than to obtain patents
• Consider speeding up award of IP rights – saw above very long times for granting rights
• Consider cheapening routes to enforcement of IP – UK has initiated ‘fast track’ courts for low value cases

Continuing weaknesses
The most obvious difficulties are in the following areas:• insufficient spillovers from publicly funded
science to private industry• low volume of private sector investment in R&D• low levels of international patenting relative to
other emerging countries• difficulty of scaling up Jugaad innovation to share
its benefits across small enterprises
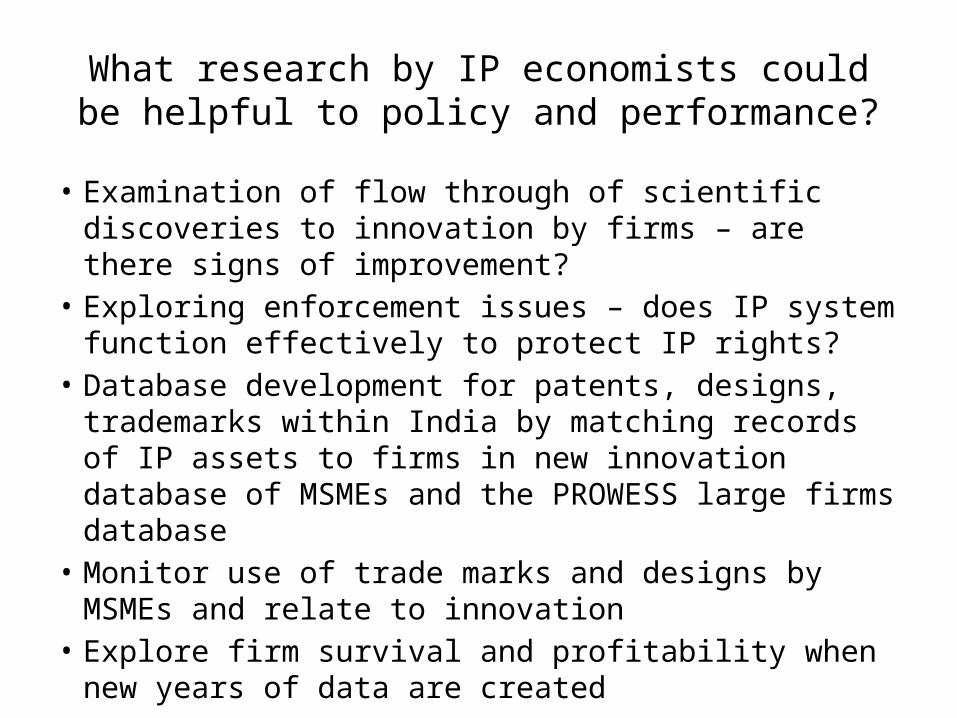
What research by IP economists could be helpful to policy and performance?
• Examination of flow through of scientific discoveries to innovation by firms – are there signs of improvement?
• Exploring enforcement issues – does IP system function effectively to protect IP rights?
• Database development for patents, designs, trademarks within India by matching records of IP assets to firms in new innovation database of MSMEs and the PROWESS large firms database
• Monitor use of trade marks and designs by MSMEs and relate to innovation
• Explore firm survival and profitability when new years of data are created

References - Articles• Arora, P. (2011) ‘Innovation in Indian firms: evidence from the
pilot National Innovation Survey’, ASCI Journal of Management 41(1): 75-90.
• Ashenfelter, O. (2012) ‘Comparing real wage rates’, Working Paper 570, Industrial Relations Section, Princeton University.
• Chen, Y. and T. Puttitanun (2005) ‘Intellectual Property Rights and Innovation in Developing Countries’. Journal of Development Economics 78(2): 474–93.
• Clark, D. P., J. Highfill, J.de Oliveira Campino, and S. S. Rehman (2011) ‘FDI, Technology Spillovers, Growth, and Income Inequality: A Selective Survey’, Global Economy Journal Volume 11, Issue 2.
• Dutta, A. and S. Sharma (2008) ‘Intellectual Property Rights in Developing Countries: Evidence from India’, World Bank Working Paper 47524.
• Dutz, M. (ed.) (2007) Unleashing India’s Innovation: Towards Sustainable and Inclusive Growth, Wash. D.C.: The World Bank.

References – Articles (continued)• Hassan, E., O. Yakub and S. Diepeveen (2009) Intellectual Property and
Developing Countries – A Review of the Literature, a Rand Europe report for UK Intellectual Property Office and UK Department for International Development.
• Kanwar, S. (2012) ‘Intellectual Property Protection and Technology Licensing: The Case of Developing Countries’, Journal of Law and Economics, Vol. 55, No. 3 (August), pp. 539-564.
• Lewis, J. I., (2007) ‘Technology Acquisition and Innovation in the Developing World: Wind Turbine Development in China and India’, Studies in Comparative International Development, Vol. 42 Nos. 3-4.
• Ray, A.S. and S. Bhaduri (2012), ‘Competing Through Technological Capability: The Indian Pharmaceutical Industry in a Changing Global Landscape’, JNU CSSP Electronic Working Paper Series, Paper No. 3, September.
• Saha, S. and A.S. Ray (2013) ‘Research and knowledge creation in Indian Universities’, mimeo March.
• Sampat, B.N. (2009) ’The Bayh-Dole model in developing countries: reflections on the Indian bill on publicly funded intellectual property’, UNCTAD-ICTSD Policy Brief No.5 October.

References – Documents• Government of India, Ministry of Science and Technology (2013)
Science, Technology and Innovation Policy 2013, New Delhi.• CSIR-NISTADS (2012a) Nanotechnology Development in India:
Investigating Ten Years of India’s Efforts in Capacity Building, Strategy Paper I July.
• CSIR-NISTADS (2012b) Nanotechnology Research and Innovation in India: Drawing Insights from Bibliometric and Innovation Indicators, Strategy Paper II, July.
• CSIR-NISTADS (2011-12) Understanding Innovation: The Indian Context, Bulletins relating to the Innovation Survey, Nov. 2011, and Feb., June, Aug., Oct. 2012.
• Dutz, M. (ed.) (2007) Unleashing India’s Innovation: Towards Sustainable and Inclusive Growth, Washington D.C.: The World Bank.
• UK Trade and Investment (2008) Intellectual Property Rights Primer for India: A Guide for UK Companies, London: HMSO June.